Article

A Quantitative Method for Evaluation of Visual Privacy in Residential Environments

1
School of Geography and Environment, Jiangxi Normal University, Nanchang 330022, China
2
School of Geomatics and Geoinformation, Jiangxi College of Applied Technology, Ganzhou 341000, China
3
Geodesign Research Centre, Jiangxi Normal University, Nanchang 330022, China
*
Authors to whom correspondence should be addressed.
Buildings 2021, 11(7), 272; https://doi.org/10.3390/buildings11070272
Submission received: 7 June 2021 / Revised: 23 June 2021 / Accepted: 24 June 2021 / Published: 26 June 2021
(This article belongs to the Section Architectural Design, Urban Science, and Real Estate)

Abstract

:
With the rapid expansion of high-rise and high-density buildings in urban areas, visual privacy has become one of the major concerns affecting human environmental quality. Evaluation of residents’ visual exposure to outsiders has attracted more attention in the past decades. This paper presents a quantitative indicator; namely, the Potential Visual Exposure Index (PVEI), to assess visual privacy by introducing the damage of potential visual incursion from public spaces and neighborhoods in high-density residences. The method for computing the PVEI mainly consists of three steps: extracting targets and potential observers in a built environment, conducting intervisibility analysis and identifying visible sightlines, and integrating sightlines from building level and ground level to compute the PVEI value of each building opening. To validate the proposed PVEI, a case study with a sample building located at the center of Kowloon, Hong Kong, was evaluated. The results were in accordance with the common-sense notion that lower floors are subjected to poor visual privacy, and privacy is relatively well-preserved in upper floors in a building. However, residents of middle floors may suffer the worst circumstances with respect to visual privacy. The PVEI can be a useful indicator to assess visual privacy and can provide valuable information in architectural design, hotel room selection, and building management.

1. Introduction

In the visual perception of residents, environmental quality is not only determined by what one can see, but also by the level that is visually exposed to others. Numerous studies focus on the evaluation of residents’ visual accessibility to landscapes [1,2], or a specified landscape such as a green area [3,4,5,6,7], a water body [8,9,10,11], or a park [12,13]. Compared to the research on “looking out”, the issues caused by “strangers’ views in”, which refers to residents’ visual exposure, have not been adequately addressed yet in the past decades, especially regarding the aspect of privacy.
As one of the primary human requirements [14], privacy is a basic right of every person, and should be protected in every society by laws that guarantee this right, especially at one’s residence [15]. When people choose an environment for living, they choose not only the construction quality or interior-design style, but also the particular environmental quality of the building [16]. However, as far as visual perception is concerned, visual exposure, which refers to privacy, has become one of the main issues that affect the satisfaction of residents and the attractiveness of a built environment [17]. Visual privacy is related to visual penetration between public and private domains, and deals with the visibility of outsiders to residents in the built environment [14]. It is defined as the ability to carry out daily activities at home without being observed by outsiders, including neighbors and passers-by [18,19].
Previous studies have explored related elements of visual privacy from different perspectives, including architectural design of interior [20,21,22,23,24] and exterior [25,26,27] domains, and residential satisfaction [28,29,30]. However, the main purpose of these studies was to investigate how and to what extent specific elements affect visual privacy with qualitative methods, which failed to give a numerical result to show how much visual privacy that a particular dwelling represented exactly. Moreover, the qualitative method produced subjective preferences that resulted in the uncertainty of the level of privacy due to the limited number of participants.
Therefore, understanding and evaluating visual privacy has become a crucial and urgent task in resolving conflicts and improving environmental quality in urban life [31]. The widely used method of isovist [32,33] has been adopted to quantitatively evaluate residential visual privacy in previous works [31,34,35]. For instance, Lonergan et al. [35] has proposed a quantitative approach to analyze the visibility between two sample buildings to examine residential visual privacy. He first created a set of isovists from lines along window facades of each floor, and then used a classification scheme to represent cumulative visibility and privacy from floor to floor. The application of 3D isovists provided a possibility to quantitatively study urban privacy, but this work was limited to giving a detailed solution for the understanding of urban privacy. In addition, Hwang and Lee [31] proposed an interesting method to simulate the rays from the ground level that penetrated through the opening into a building for the quantification of indoor exposure spaces. This work introduced the refuge area ratio (RAR) for the representation of visual privacy along with a method of visual simulation and numerical measurement. The refuge area was calculated as a space that was invisible to the observers inside the building. It introduced an algorithm to achieve a cumulative result by calculating the exposure area from sightline incursion of surroundings, regardless of the view distance or direction.
Based on of the definition of visual exposure; that is, the opportunity to measure the focus of investigation and visual frequency [36], Shach-Pinsly et al. and Shach-Pinsly [17,37] reported that there was a high similarity between an understanding of visual exposure and the visual perception of privacy. This research attempted to quantify visual exposure of a building opening related to privacy aspects in the built environment, and presented an analysis model using the consideration of building level and street level, while the individual analysis was conducted separately, meaning that the method failed to provide an integrated, uniform, and full-scale result for each façade opening. Furthermore, the visual exposure level was considered to be affected only by the number and length of the dominant sightline. We argue that view distance, direction, and the area of observer and target openings both contribute to the evaluation of residential visual privacy.
Inspired by the work in [17], we proposed a quantitative method toward visual exposure as an indicator to assess visual privacy in a residential environment. The proposed method provides a mathematical and systematic solution for subjective assessment of visual privacy in the residential environment, and allows us to have a deep understanding of visual privacy in our daily life. An indicator we call the Potential Visual Exposure Index (PVEI) is proposed in this study to evaluate the quality of a building opening’s visual privacy by quantifying the amount of visual penetration to the opening. The PVEI can be described as the damage of potential visual incursion from public spaces and neighborhoods. This indicator can support planners, architects and decision-makers in evaluating and implementing urban privacy issues in the development of an urban design.

2. Materials and Methods

The model presented in this paper builds on the concept of visual exposure related to the private domain, establishing a visual indicator able to describe the visibility of features of interest (FOI), which refers to openings of building façades and pedestrian spaces on the ground. This differs from the 3D isovist or viewshed approach, which quantifies the space or volume around the observer, as here the attention is on how many observers can potentially view the target in the built environment. It involves a function of visibility analysis from area to area, meaning the visual privacy of an opening can be represented to measure the opening’s visual exposure only from observers of the building level and ground level, instead of the whole surrounding spaces.

2.1. Definition

A target-centered sphere HH’VV’ was used to describe all potential observers around the target, as shown in Figure 1. From Target O on the façade of a building, the radius of the sphere refers to the maximum visual distance. Theoretically, all potential observers who can see the target O have an impact on the privacy of the target. It is noted that observers within one hemispheroid cannot visually pass because of the obstruction by façade O, while nonvisible observers can be identified with the intervisibility analysis. Point M travels from H’ to H in horizon, and N’ travels from V’ to V in vertical, meaning the horizontal α and vertical β ranges from 0 to π and −π/2 to π/2, respectively. This figure presents the three-dimensional space in which all potential observers can be located.
For an opening of a building, its PVEI is defined as the visual incursion by observers from public spaces and building openings. The value of PVEI depends on the distribution of potential observers, which involves the view distance, view direction, and open spaces in which both observers and targets are located. Figure 2 illustrates the concept of the PVEI in detail. Suppose a resident O (target) is standing on the 12th floor of Building I, and observers A, B, C, and D are located at Building J with the same building façade. Resident O has the potential to be viewed by observers A, B, C, and D. The sightlines are formed by the resident O and the observers as OA, OB, OC, and OD. α and β are the horizontal and vertical angles of OD, respectively.
In this study, we assumed that if an observer is able to see the targets, the observer simultaneously will be seen by the targets (it is noted that the assumption is not perfectly true in a particular situation). As such, view distance from an observer to the target plays a great role in the determination of the PVEI value, as previous studies have realized. In addition, sightlines with different directions can obviously contribute to PVEI value, as shown in Figure 2; sightline OA and OD with the same length (view distance; and different directions either in the horizontal or vertical domains.
Similarly, the area of openings also affects the PVEI. The larger area of a target means a higher possibility to be visually incursive and results in higher PVEI, while the larger area of an observer signifies a higher possibility of visual penetration into the target and contributes to a higher PVEI, and vice versa.
So far, we have concluded that the variables including the area where the observer and target are located, and visual distance and view direction between a target and observers, have a contribution in the determination of the PVEI. Therefore, the function of the PVEI can be expressed as follows:
P V E I   =   F ( d ) f ( a r e a ) ( α ) φ ( β )
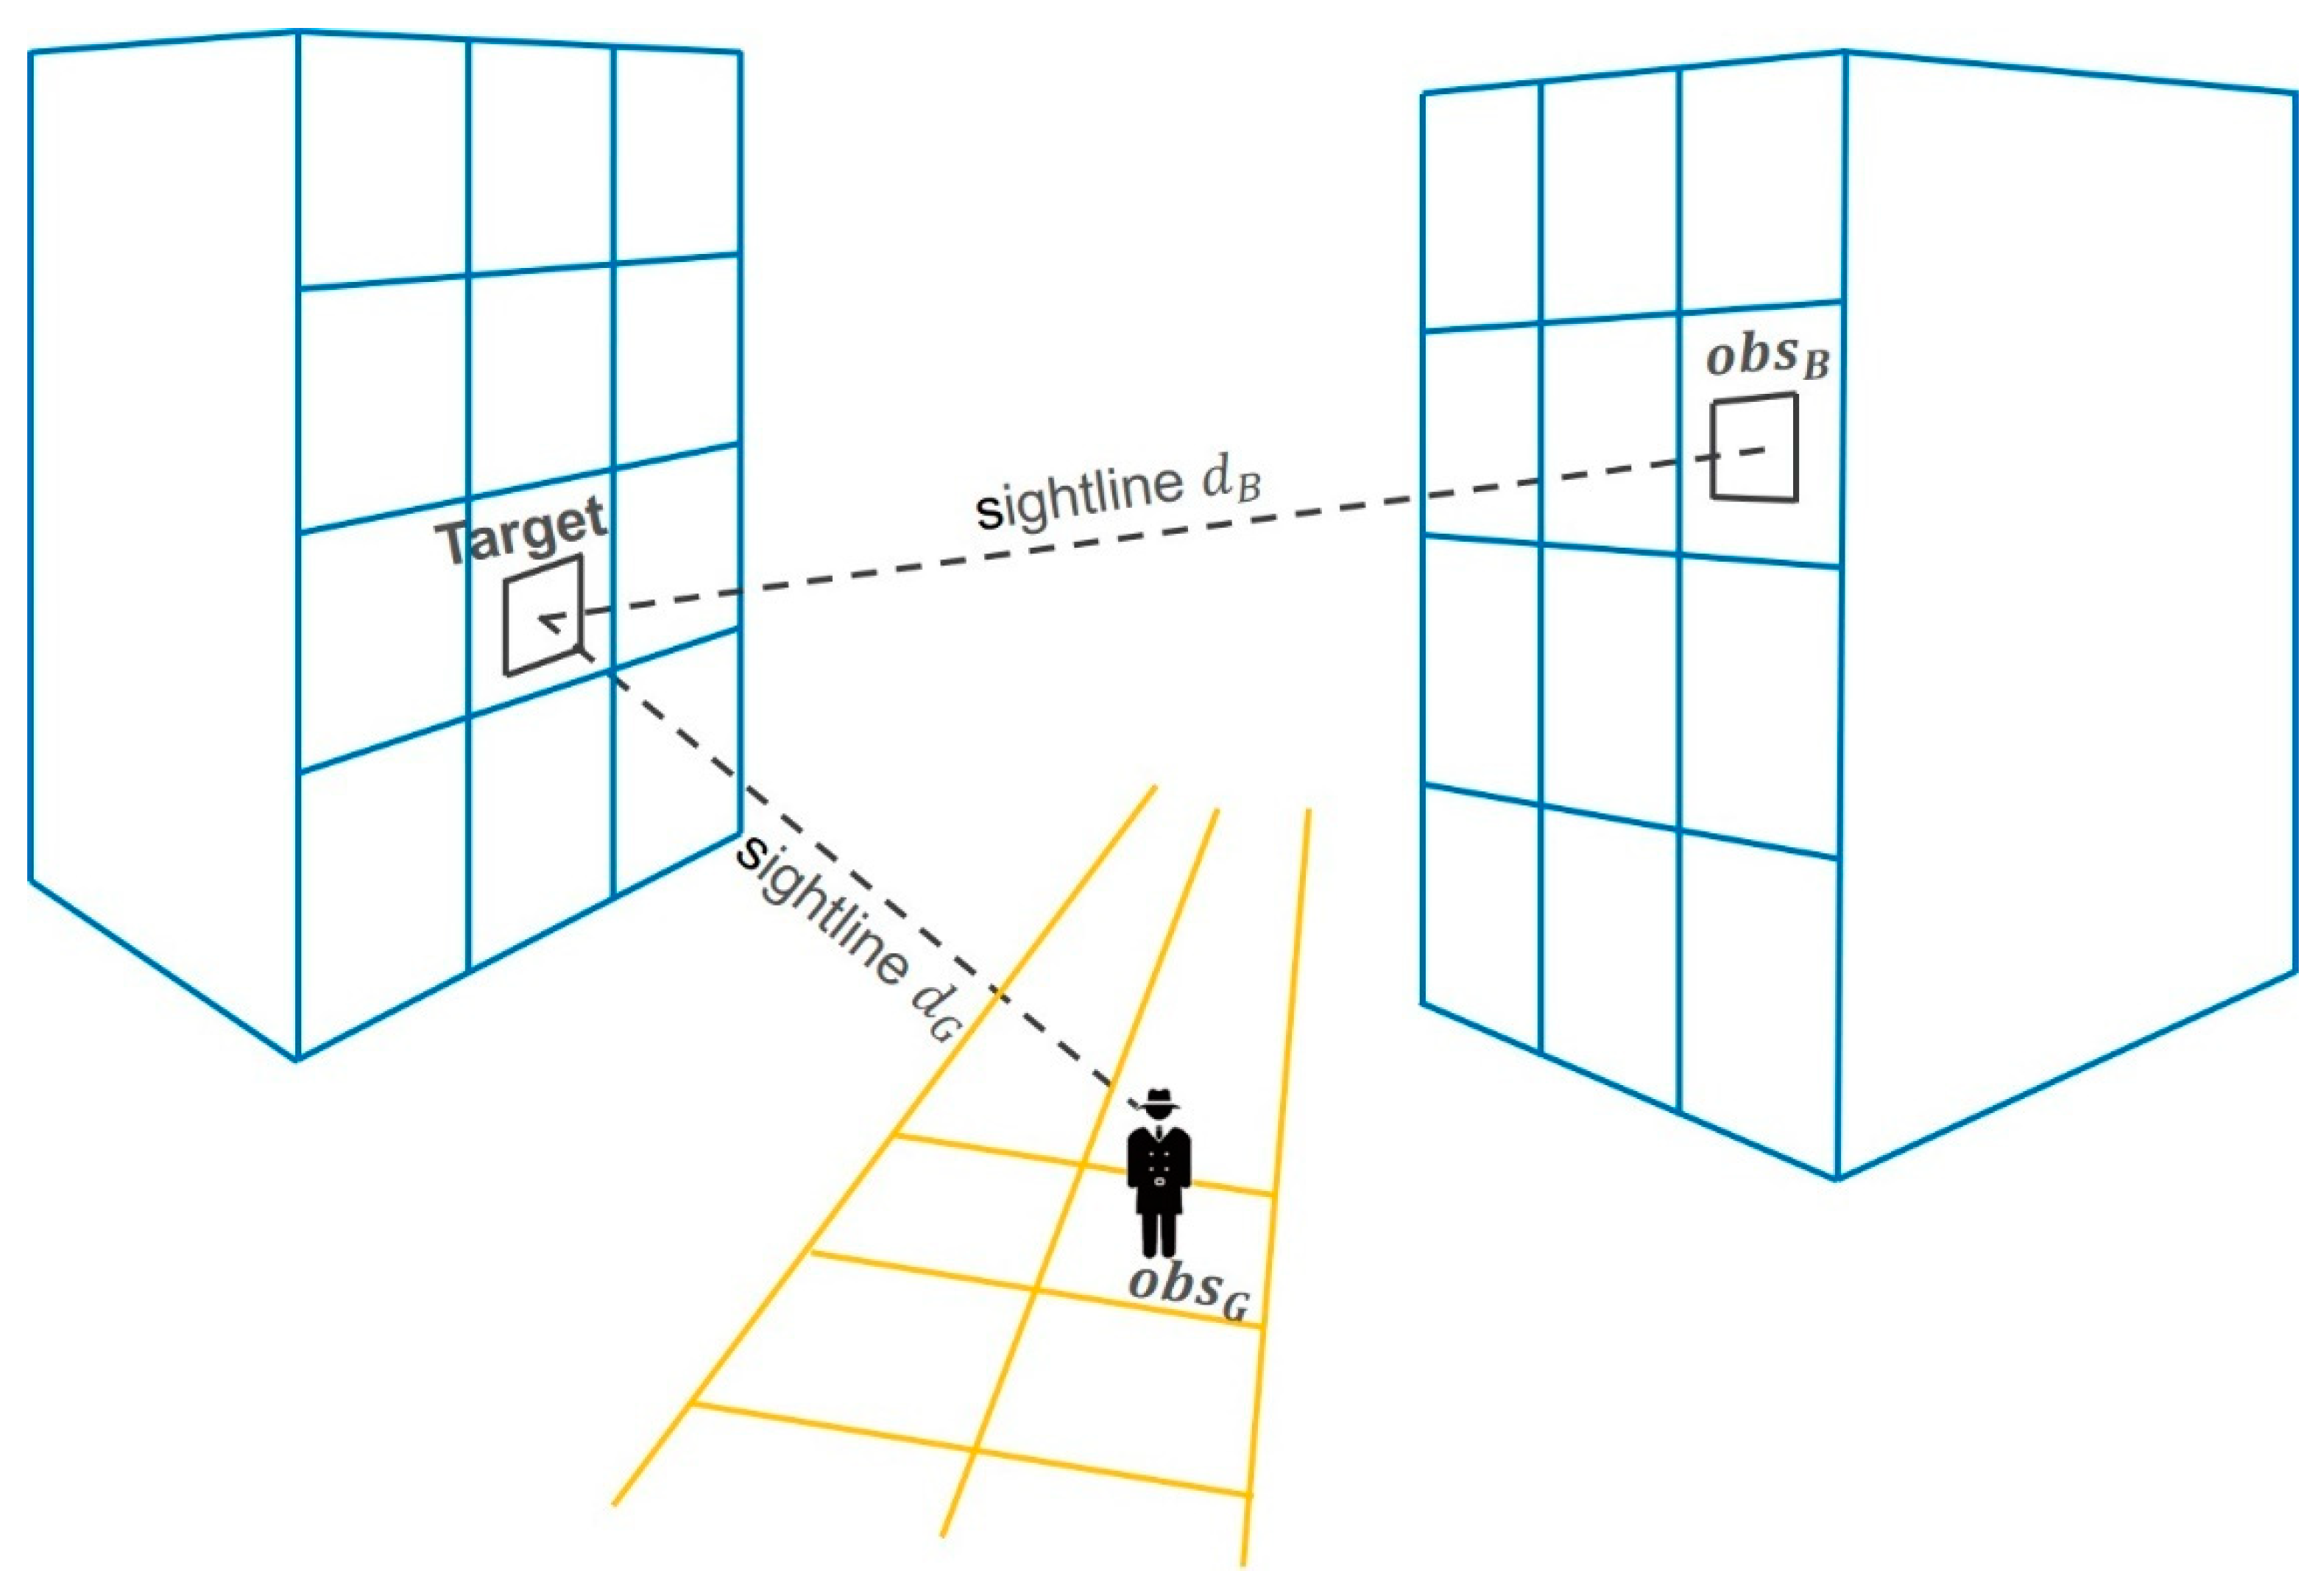
It is noted that the equation can be applied to the observers from both the ground level and building level, as shown in Figure 3. In order to determine the PVEI of each opening, it is essential to investigate all the elements in the mathematical function. The subfunctions of the area, visual distance, horizontal angle, and vertical angle are discussed separately in the following sections.

2.2. Variables in Mathematical Description

2.2.1. Visual Distance and Opening Area

Since the visual perception of an object in space reduces with the increase of distance from the observer [38,39,40], the concept of distance decay has been widely applied in visibility analysis. Kyung [41] proposed the index of area-weighted visual exposure, which takes distance into account to achieve an accurate assessment of visual perception. Based on the concept that visible objects are inversely proportional to the squared distance, the index can be mathematically expressed as V = 1/d2. Similarly, the function to describe the phenomenon of visibility decay [42] has been proven to be a simple and effective way to realize visual-related matters.
Therefore, we adopted this concept to describe the PVEI in this study. The variable-view distance that contributes to the PVEI can be expressed as 1/d2 for F(d). While the observer is located at an opening that is an element of area in the reality, the sub-function thus can be updated as Aobs/d2. Similarly, the target can be considered as a façade of opening as well. Therefore, it was further updated, and is expressed as Equation (2) for F(d, area).
F ( d ) f ( a r e a )   =   A o b s A t a r d 2

2.2.2. Visual Direction

Previous studies took visual distance into account for the visibility analysis, enabling us to obtain much more detailed results for visual privacy. However, few studies considered the visual direction as a variable in the quantifying expression of the visibility phenomenon. Since the same visual distance from the target to observers at different locations could contribute a huge difference in the risk of visual incursions, we argue that it is necessary to take the visual direction into account to deal with the matter of visual exposure.
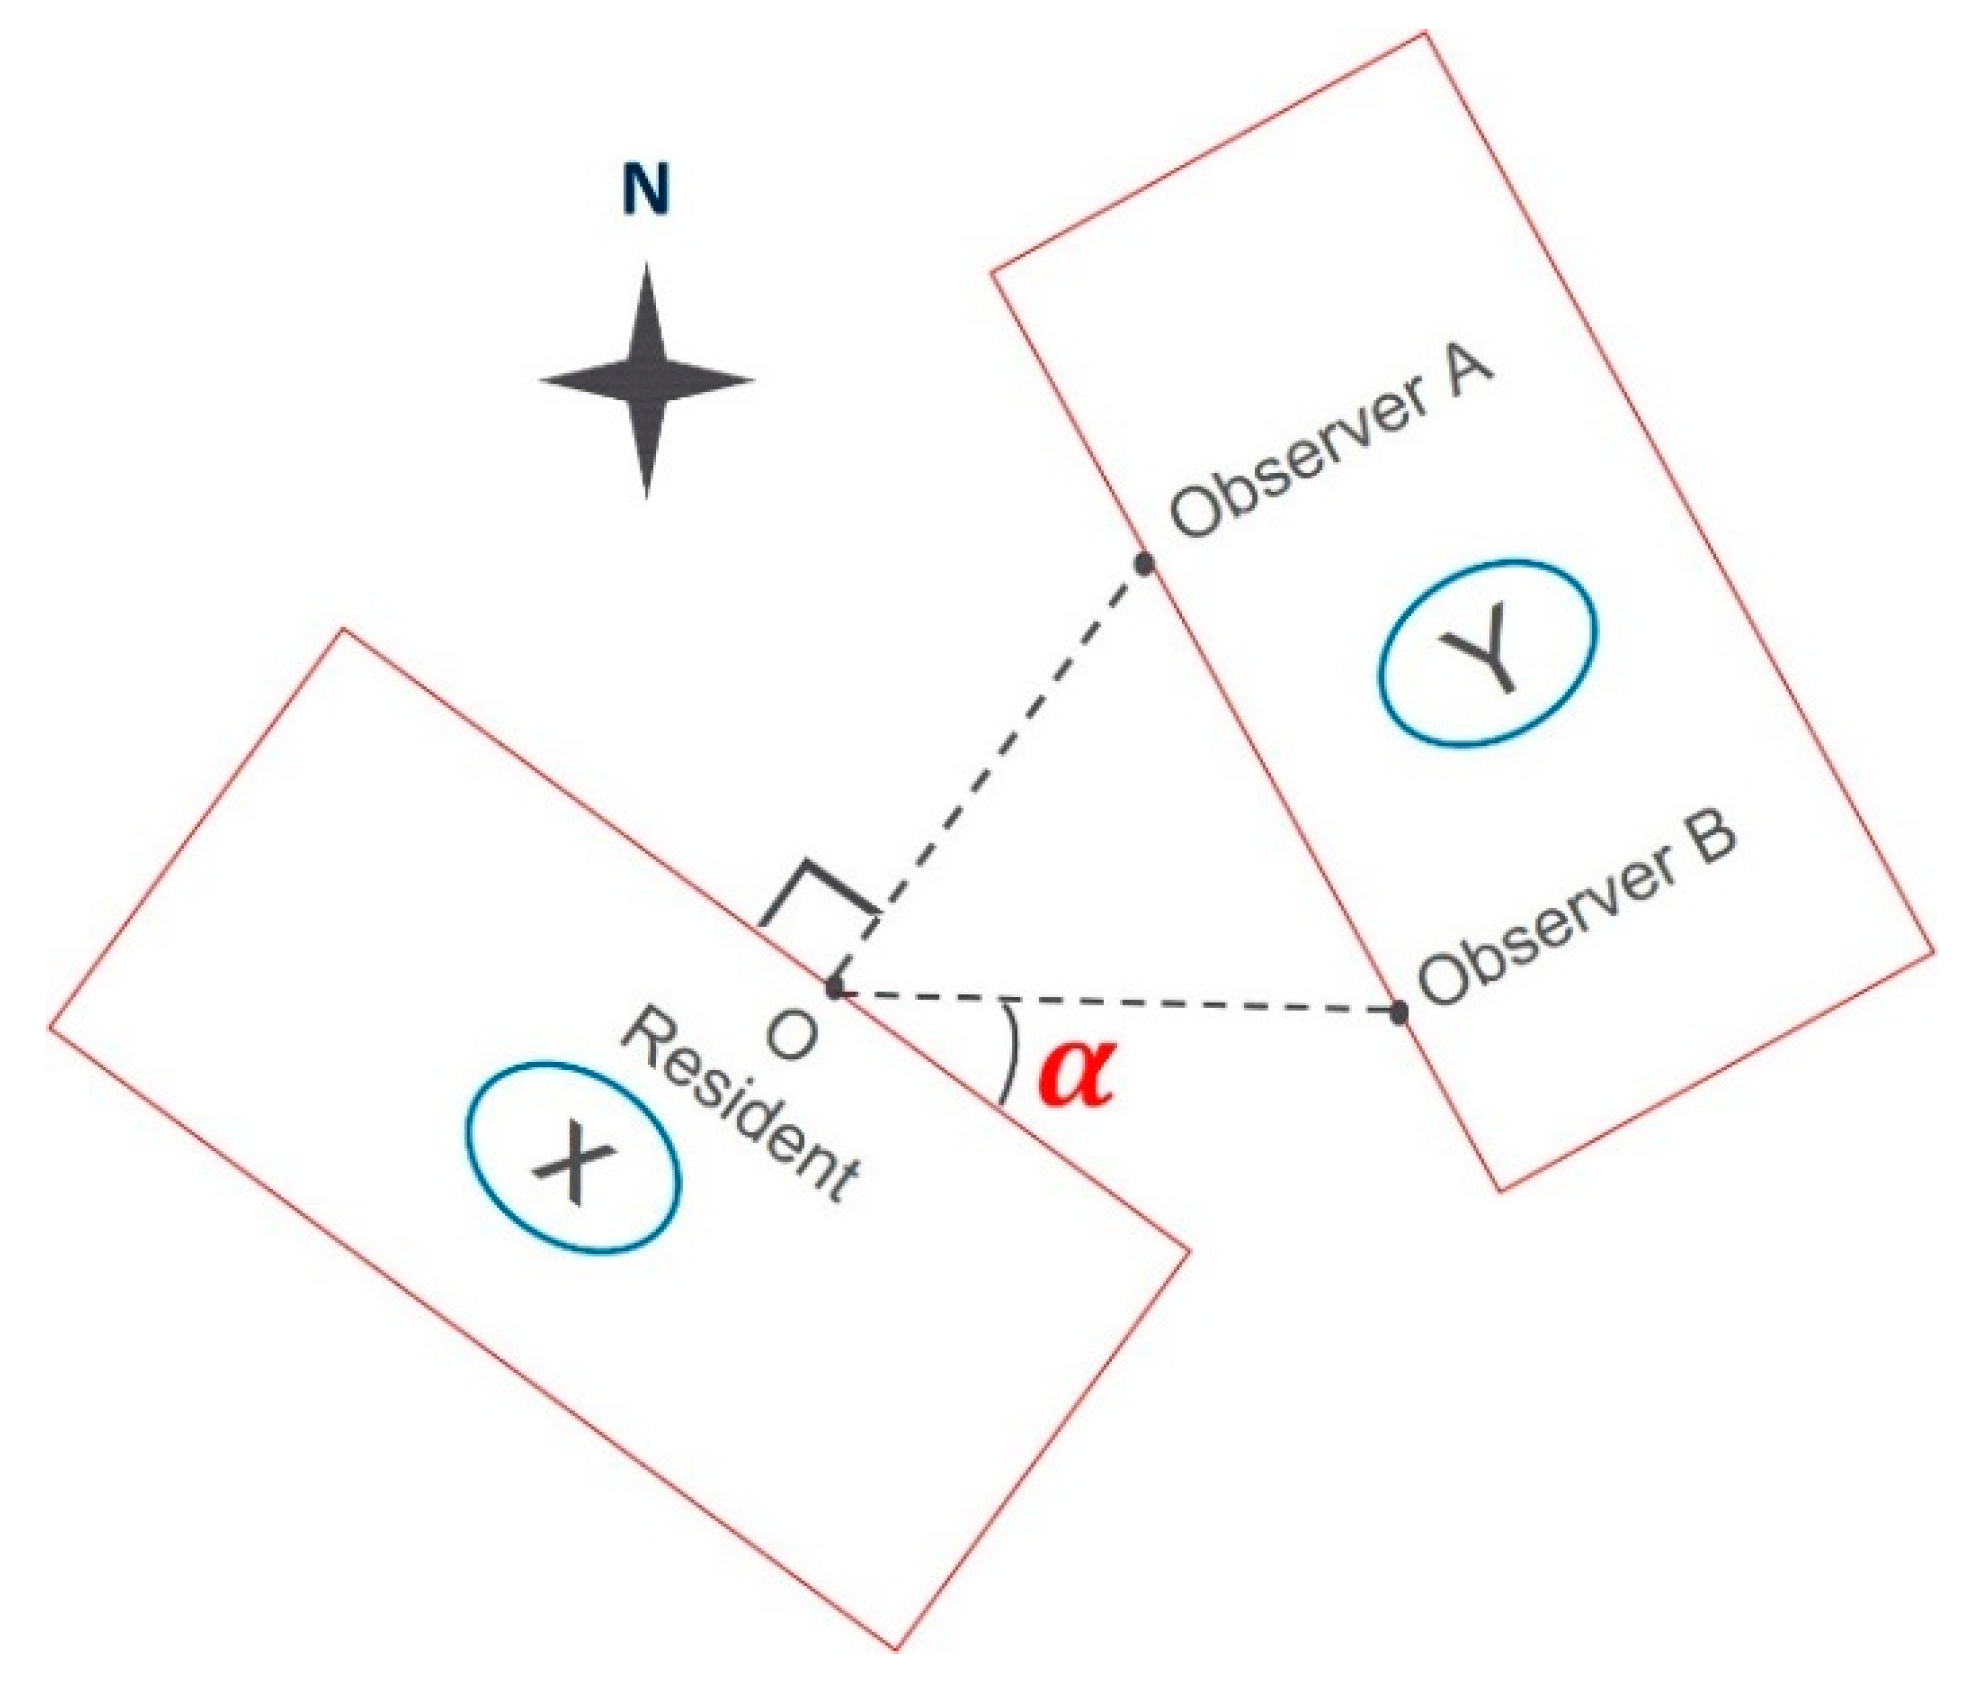
Figure 4 shows the layout of two buildings X and Y viewed from the top. Target O is in building X, and observers A and B are in building Y. Target O and observers A and B are standing at the same level of elevation. Suppose the length of sightline AO is the same as BO: AO is perpendicular to the façade of building X to which resident O belongs, and BO appears to be an acute angle α with the façade. It is obvious that the resident is faced with a greater threat of visual incursion from observer A compared to B due to the higher level of visual penetration from location A. In this case, the angle α formed by visible sightline and the resident’s façade travels from 0 to π, the most risk with respect to visual exposure occurs when the sightline travels to AO, and the level of visual exposure gradually decreases on both sides of AO.
Therefore, a function of sine with the variable of horizontal angle α can be used to describe the phenomenon (Function 3) reasonably. Specifically, α represents the angle formed by the sightline and the residential façade, and it can be calculated simply by a subtraction from the azimuth of residential façade to the sightline, with the absolute value granted to α if the calculation results appear to be negative. Apparently, the value of α ranges from 0 to π due to the insignificant form of the invisible sightline when α is situated from π to 2π. Thus, the effect of visual exposure from the horizontal domain of the visual direction can be quantified with the use of Function 3:
( α )   =   sin   α
Assume there is an observation point E on the upper floor (as shown in Figure 5). Every opening of the observer is regarded as a single point to be analyzed in comparison. The red line represents the line of sight from each observer penetrating into the resident’s room. Figure 5a–c shows three types of “visible corridors” (green area) with different areas. Point C has the visible corridor with the largest volume, which means C is the most penetrating.
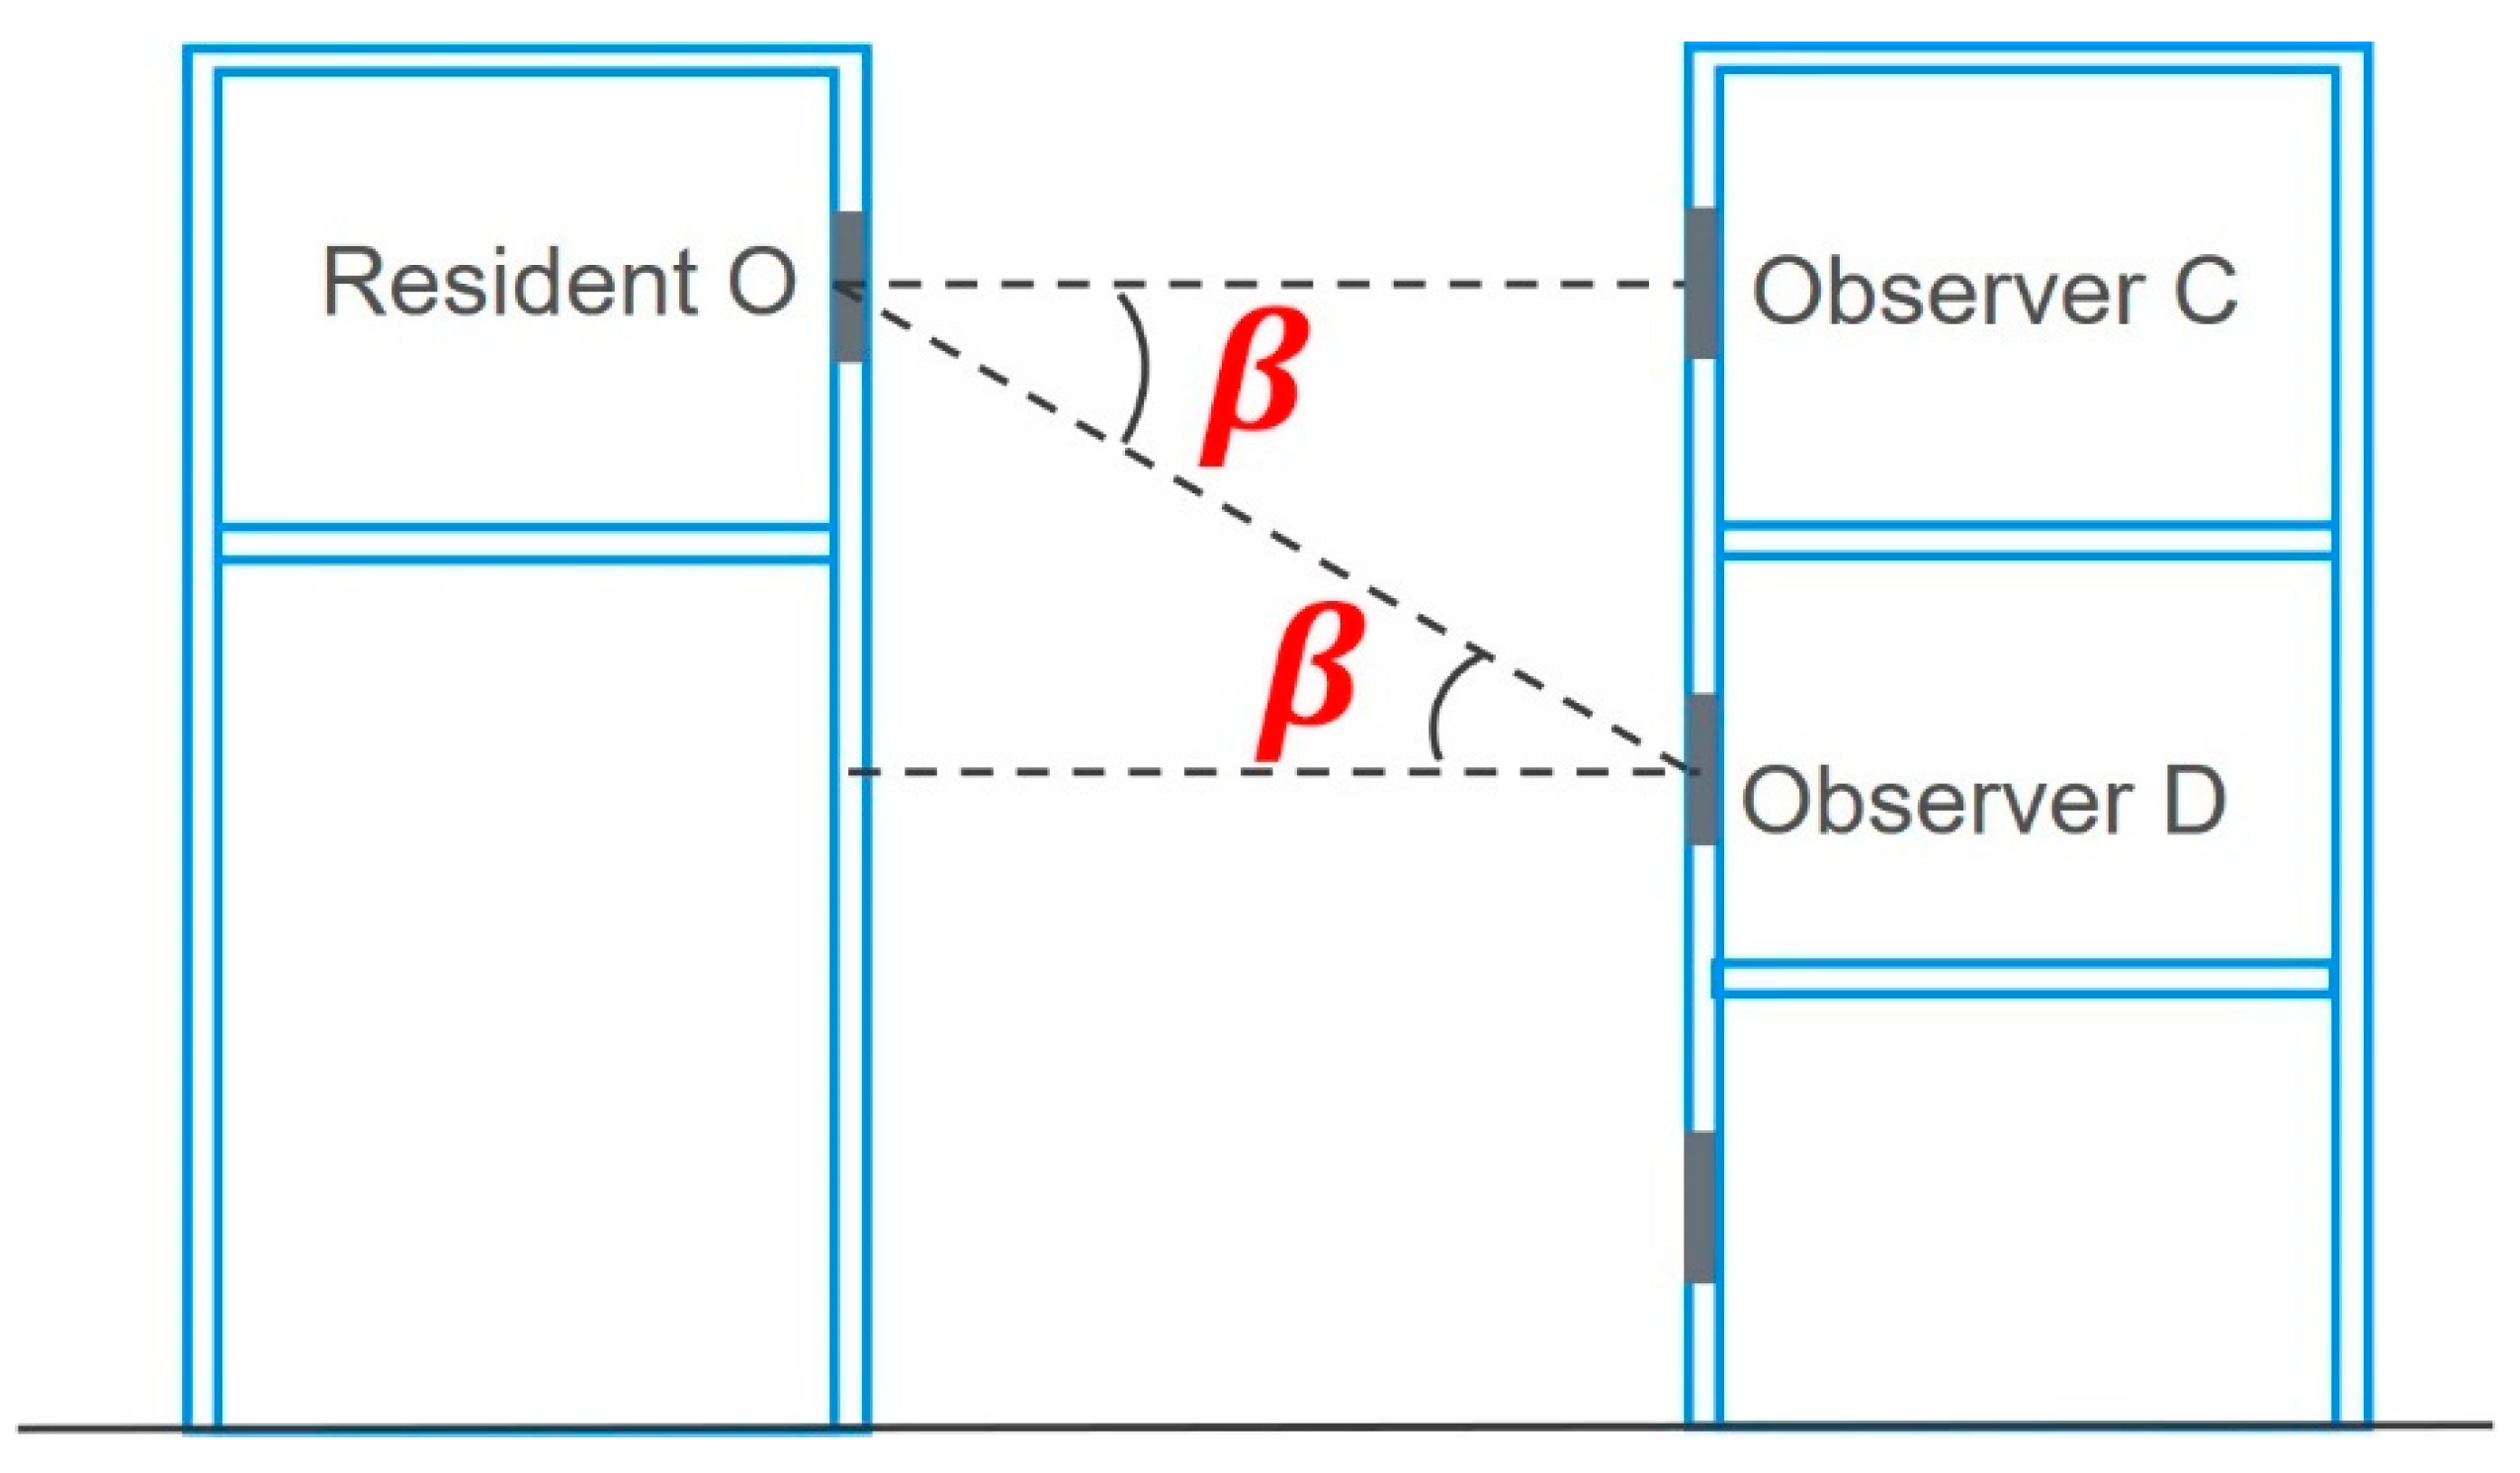
Similarly, in the vertical domain (Figure 6), with the same visual distance, observer C brings a much higher threat of visual penetration to target O compared to observer D. This is caused by the change of visual direction in vertical domain.
As shown in Figure 6, when the sightline from OD travels to OC, β approaches 0, the PVEI reaches the maximum value, and location C is considered as the highest risk with respect to visual exposure of target O. As the sightline keeps traveling, the visual exposure gradually decreases. Therefore, a function of cosine with the variable of vertical angle β was used to describe the visual impact from vertical domain (Function (4)), and the value of β ranges from −π/2 to π/2:
φ ( β )   =   cos   β

2.3. Model Equation

As shown in Section 2.2, it is possible to provide a quantitative solution to derive the PVEI and contribute to the estimation of visual privacy in residential environments. By integrating Equations (2)–(4), the PVEI of a certain opening can be quantified as:
P V E I   =   A i A j d i j 2   ×   sin   α   ×   cos   β
In addition, considering the sum of observers from both the ground level and building level in the residential environment, the PVEI of each opening can thus be defined as:
P V E I i   =   j n A i A j d i j 2   ×   sin   α i j   ×   cos   β i j
where PVEIi: visual exposure of the ith openness; Ai: area of the ith target surface; Ai: area of the jth surface; and dij: distance from the center of ith target to the center of jth observer.

3. Case Study

3.1. Description

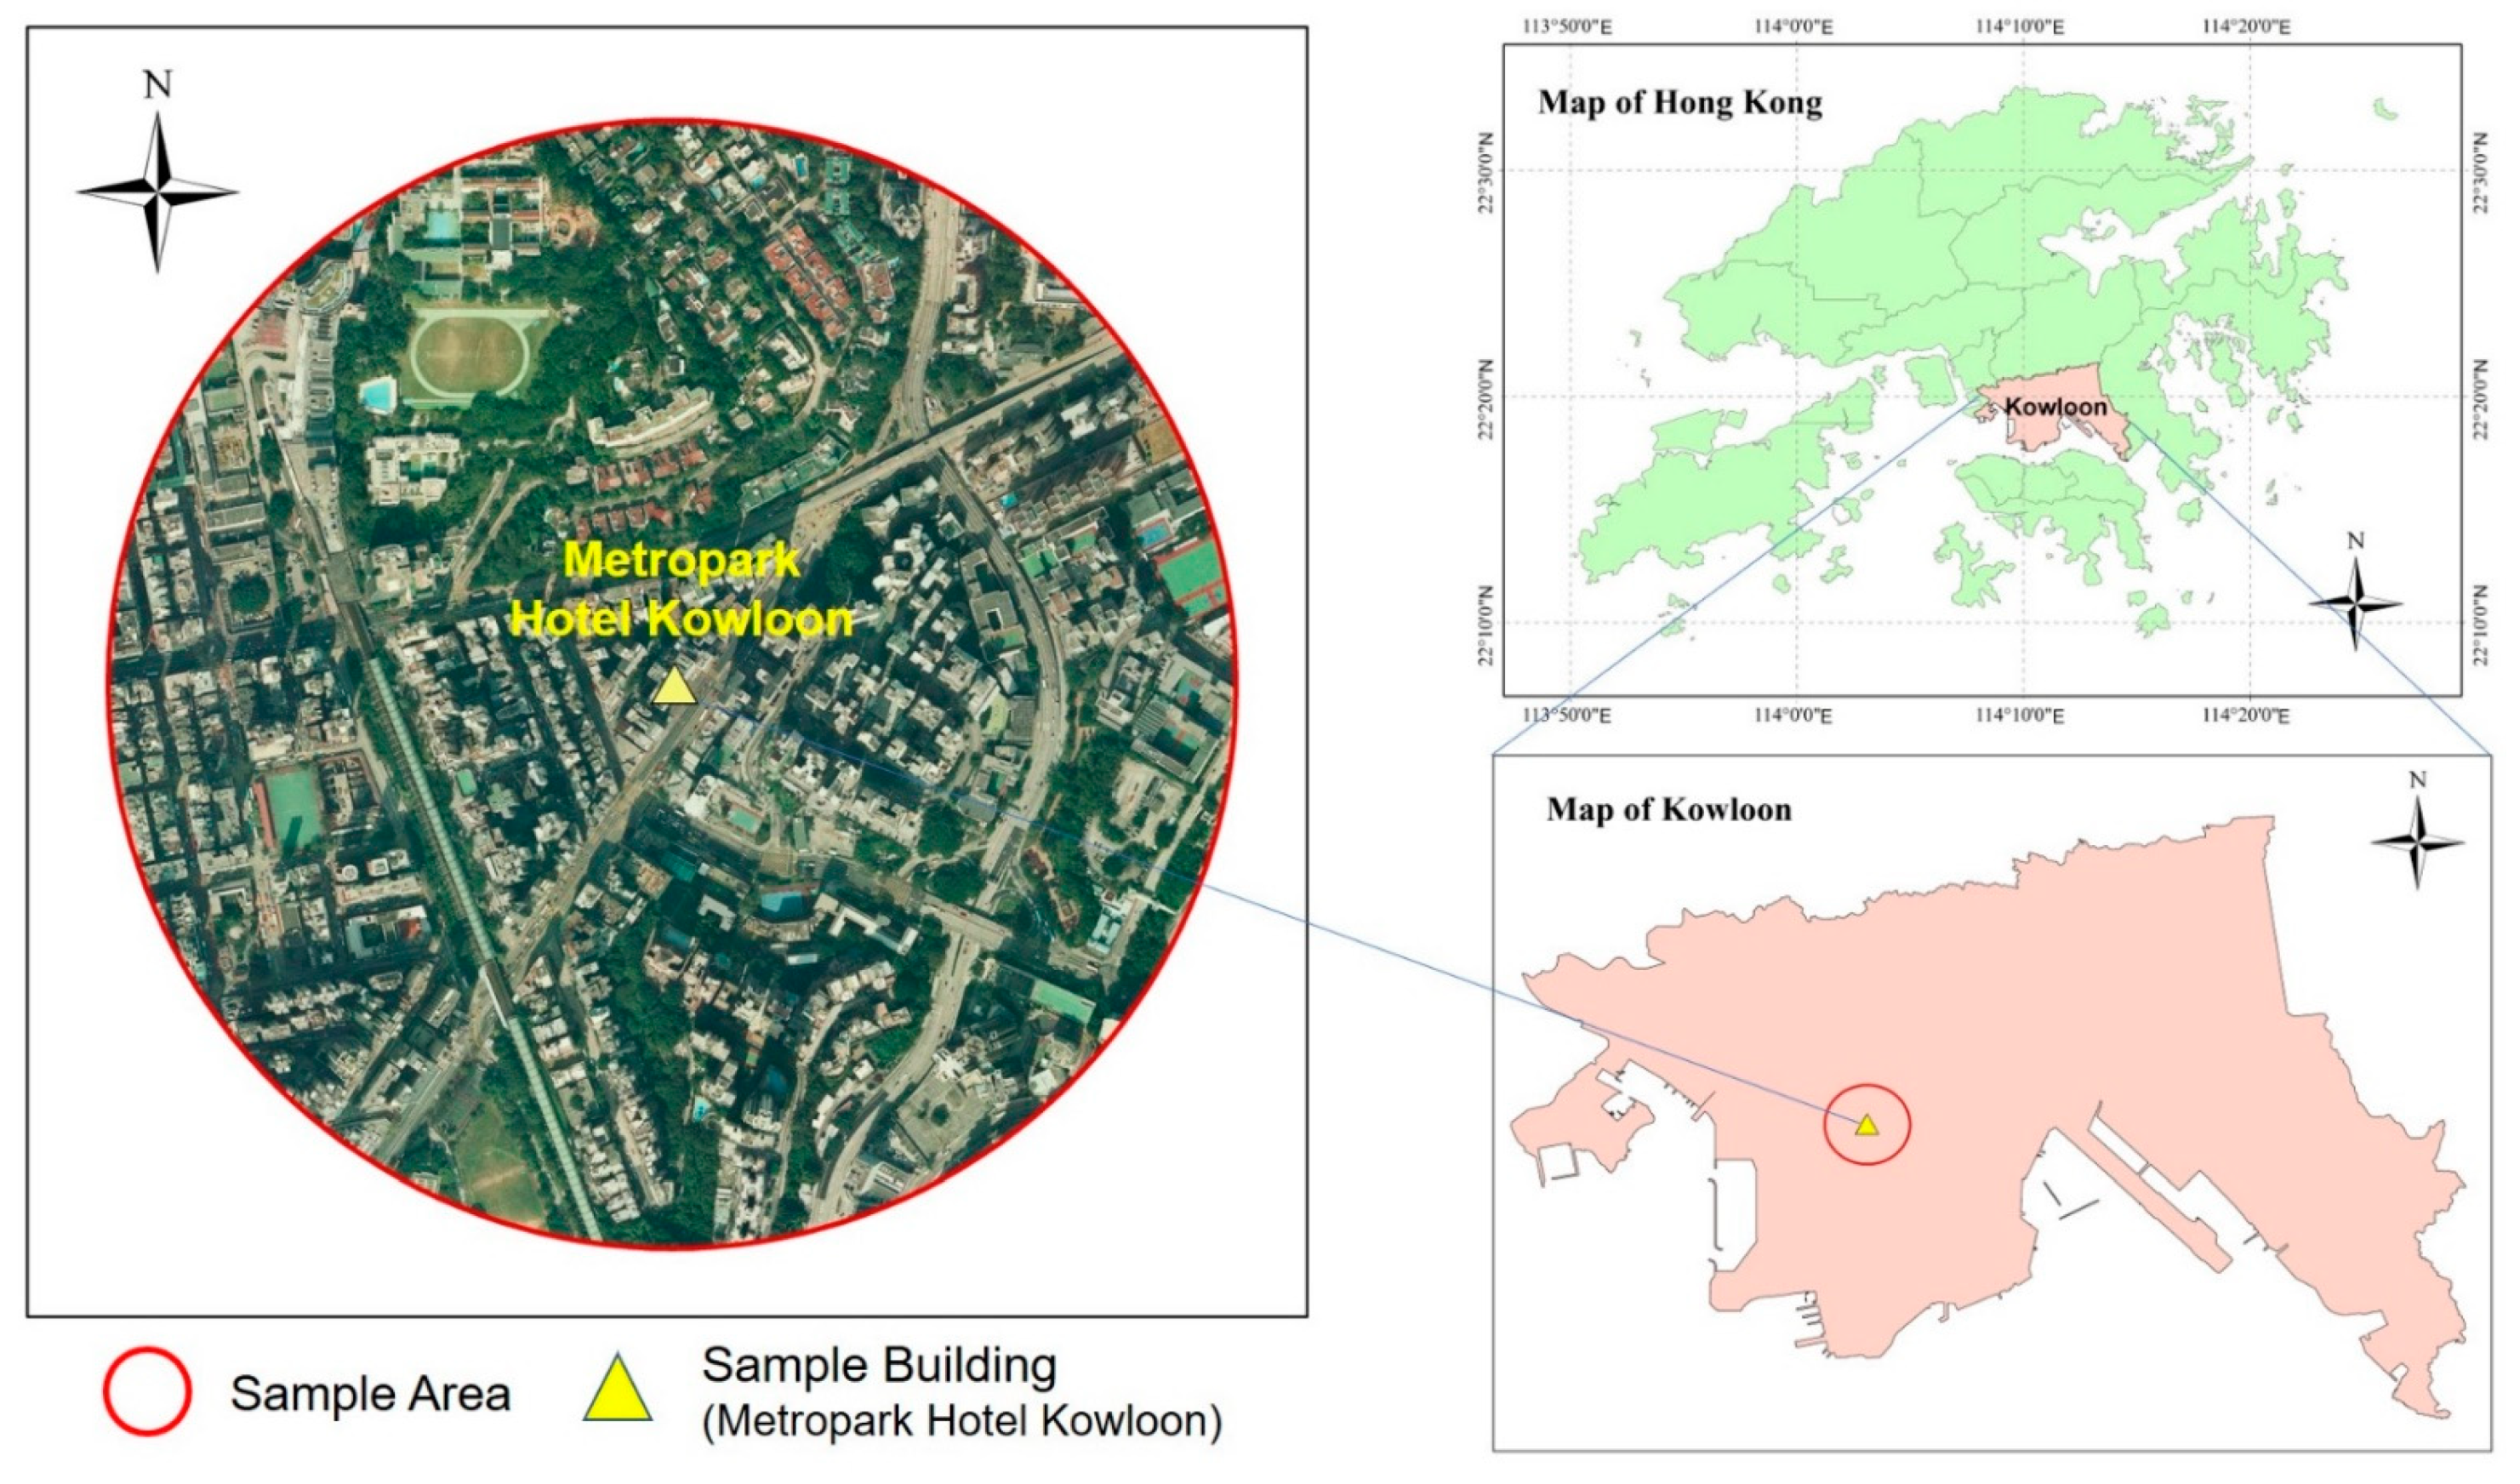
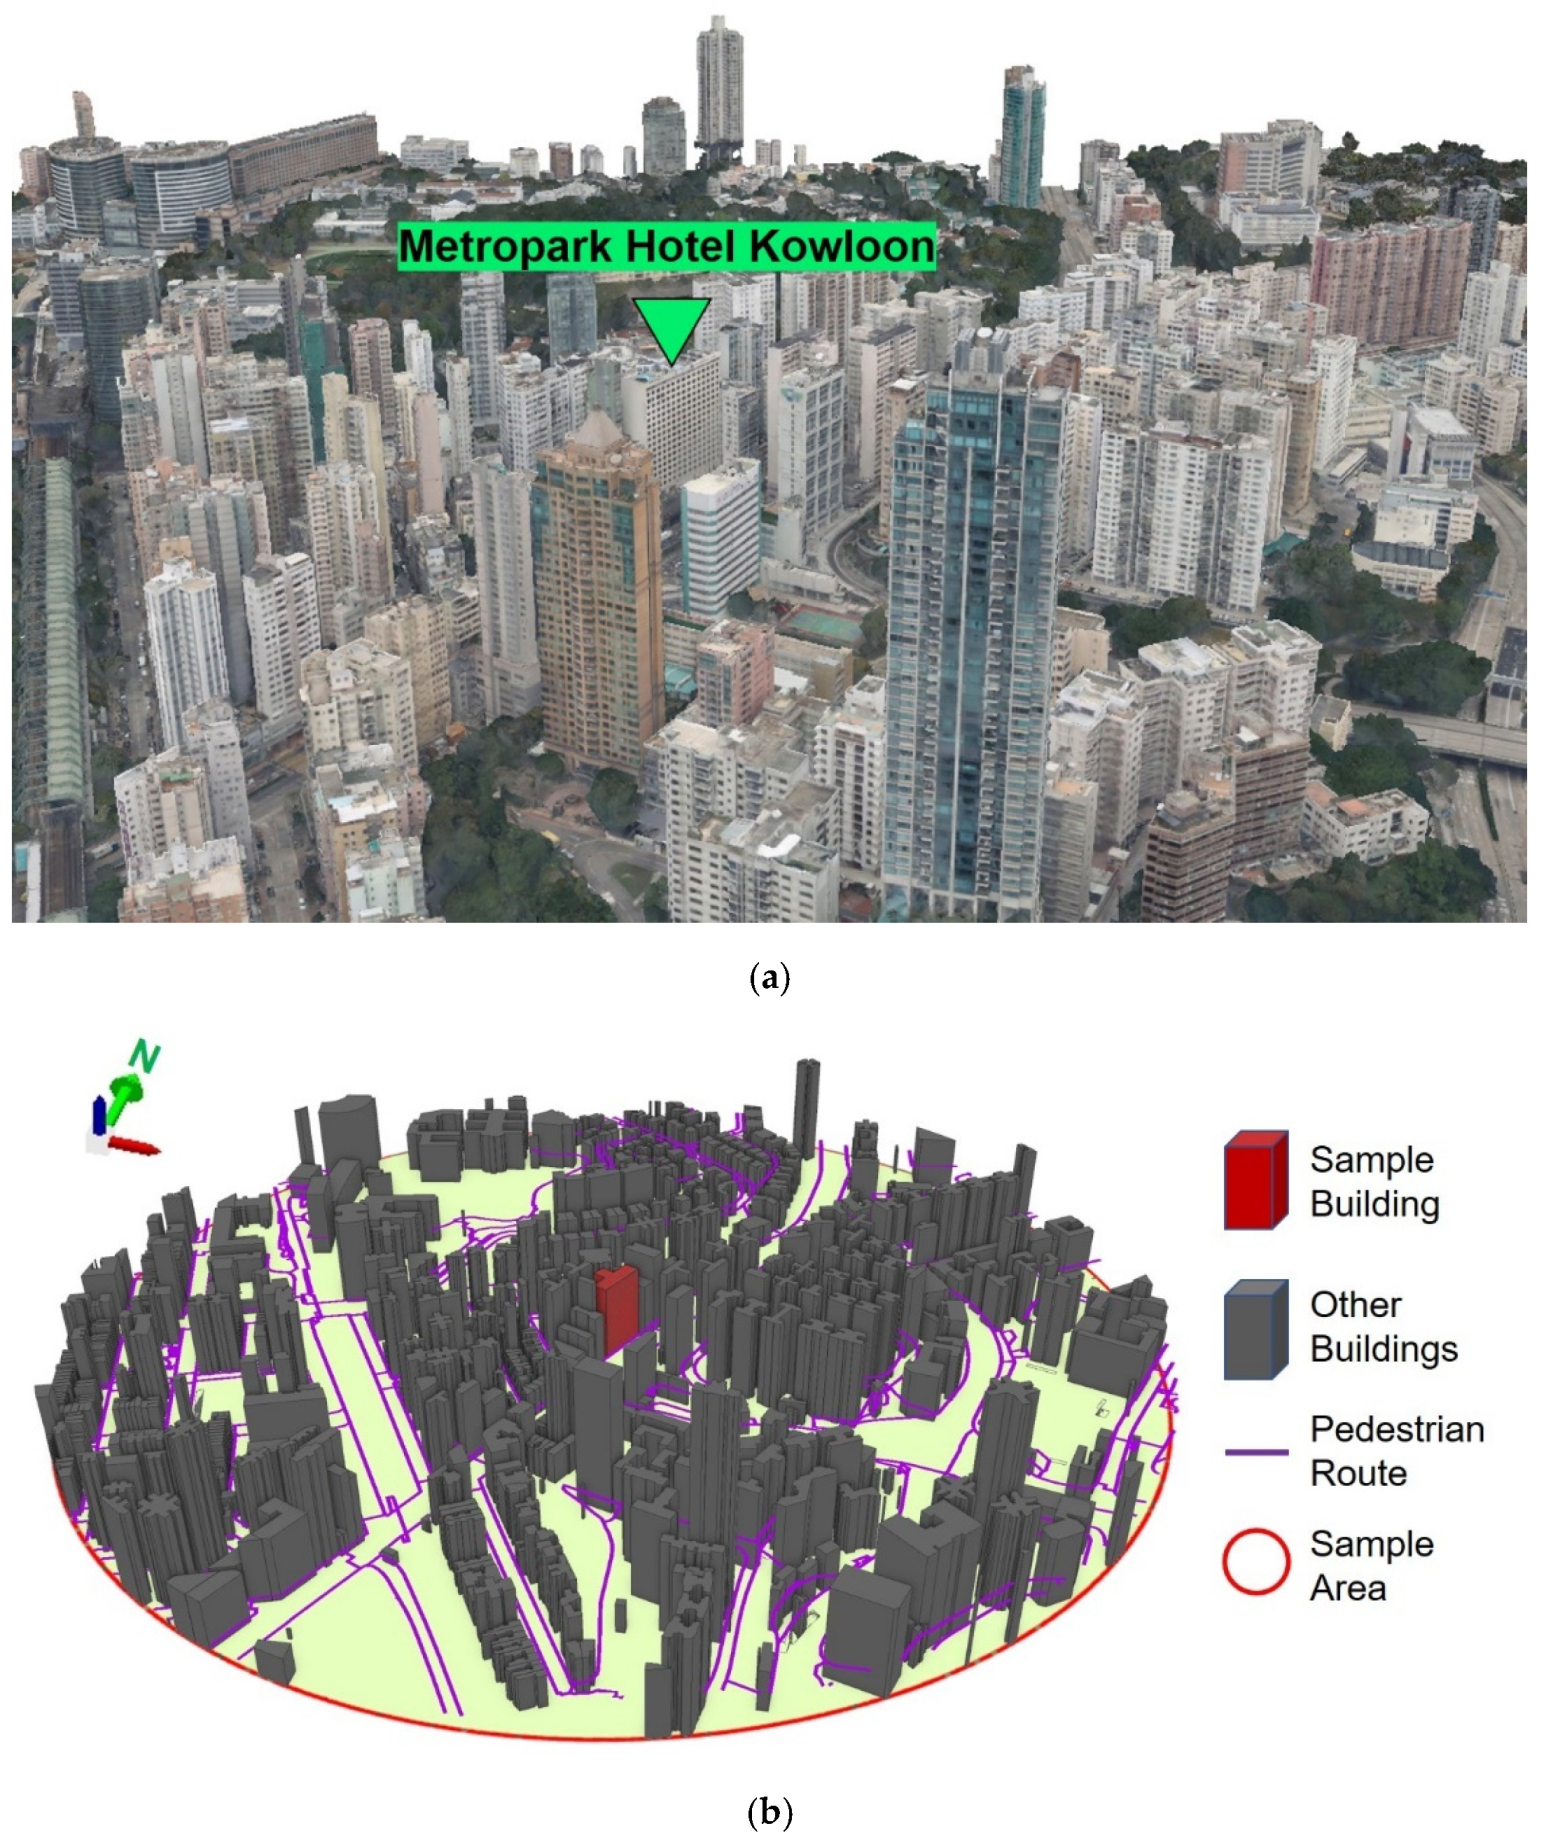
Hong Kong is regarded as one of the most densely populated cities in the world. It has more than seven million people inhabiting 1068 km2 of land, and the population density increased from 6352 persons per km2 in 2006 to 6777 in 2016 [43]. As a result, the physical density of Hong Kong, as a universal geographic and spatial concern, has long been a hotspot in research [44]. Kowloon is the peninsula to the northern part of Hong Kong Island, with over 2.2 million people living in an area of less than 47 km2 [43]. Metropark Hotel Kowloon (Figure 7), located at the central heart of Kowloon, with 75.9 m of absolute elevation and 16 typical floors, is represented as a typical building to reflect the local environment, and was thus selected as the sample building in this study.

3.2. Preconditions

In this research, three core sets of data, including the 3D Photo-Realistic Model (Planning Department of Hong Kong) in OSGB format, the 3D Pedestrian Network (Hong Kong Geodata Store) in GDB format, and the iB1000 product of the Topographic Map (Hong Kong Geodata Store) in DWG format, could all be downloaded freely online, and were collected for preprocessing.
A few preconditions have to be set up for the purpose of computational simplification. First, viewpoints from the pedestrian were assumed to be 1.5 m off toward the ground. Second, both building façade and ground surface were divided with 2 m × 2 m regular grids to extract potential viewpoints. Thus, every grid can be represented as a viewpoint with the property of unified area (4 m2) in order to perform the visibility analysis. Lastly, terrain, infrastructure, and vegetation can be potential obstacles in the visibility analysis, but they were not included in this study for the sake of simplifying the computation.

3.3. Preprocessing

The 3D Photo-Realistic Model was formulated based on aerial photos captured from different points of view; it is a high-quality texture surface model in three dimensions that shows external features of buildings, trees, infrastructure, and terrain. The data set was used to extract all the façade openings of the study area, including the sample building (Figure 8a). Every opening was divided into regular grids as mentioned previously, and each grid was represented as a viewpoint located at the center of the grid. The 3D Pedestrian Network aims at improving the walkability and connectivity of outdoor civil activities. In this study, it was used to identify the potential observers of the passers-by. The 2D building footprint of the study area was extracted from the iB1000 product, and further converted to 2.5D models as the visibility obstacles in multipatch format based on the elevation attribute. The integration of two types of the data set was preprocessed, and this is shown in Figure 8b.

3.4. Procedure for Deriving the Potential Visual Exposure Index

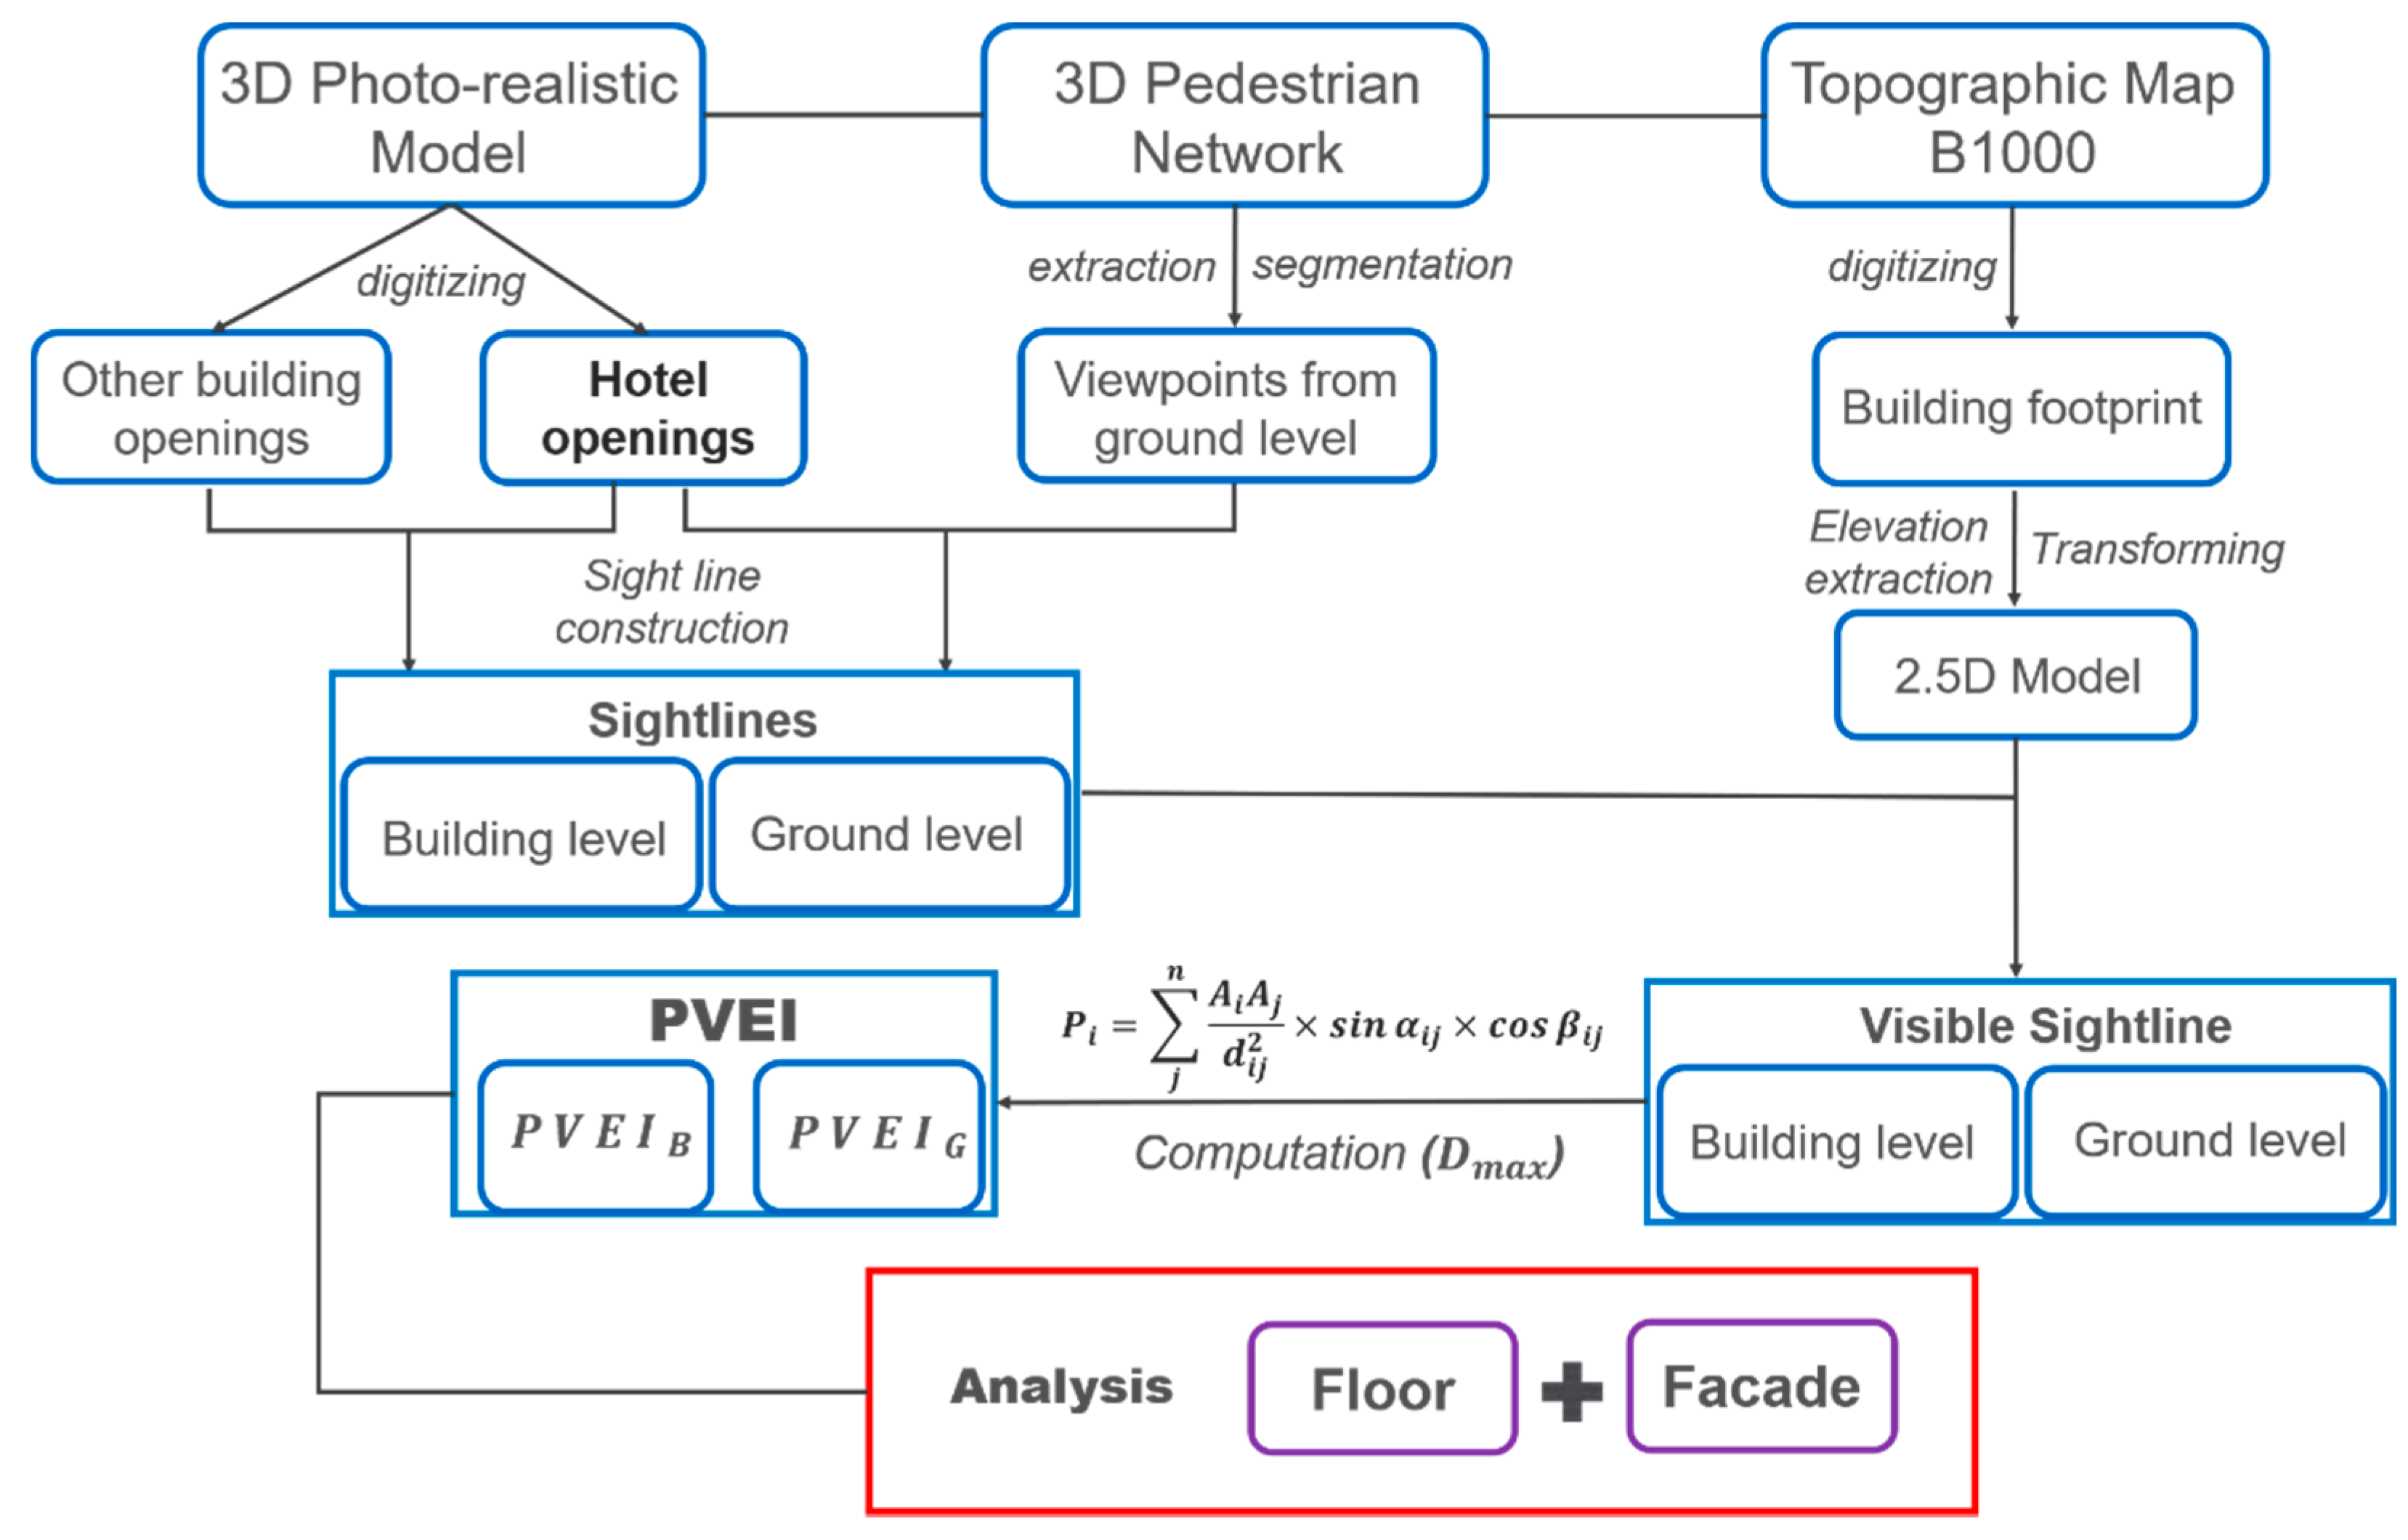
A quantitative assessment of visual privacy was interpreted on the basis of a sample building. The following section details the procedures outlined in Figure 9. The operation was conducted with off-the-shelf functionalities in ArcGIS Pro 2.5, Esri, Redlands, CA, USA.
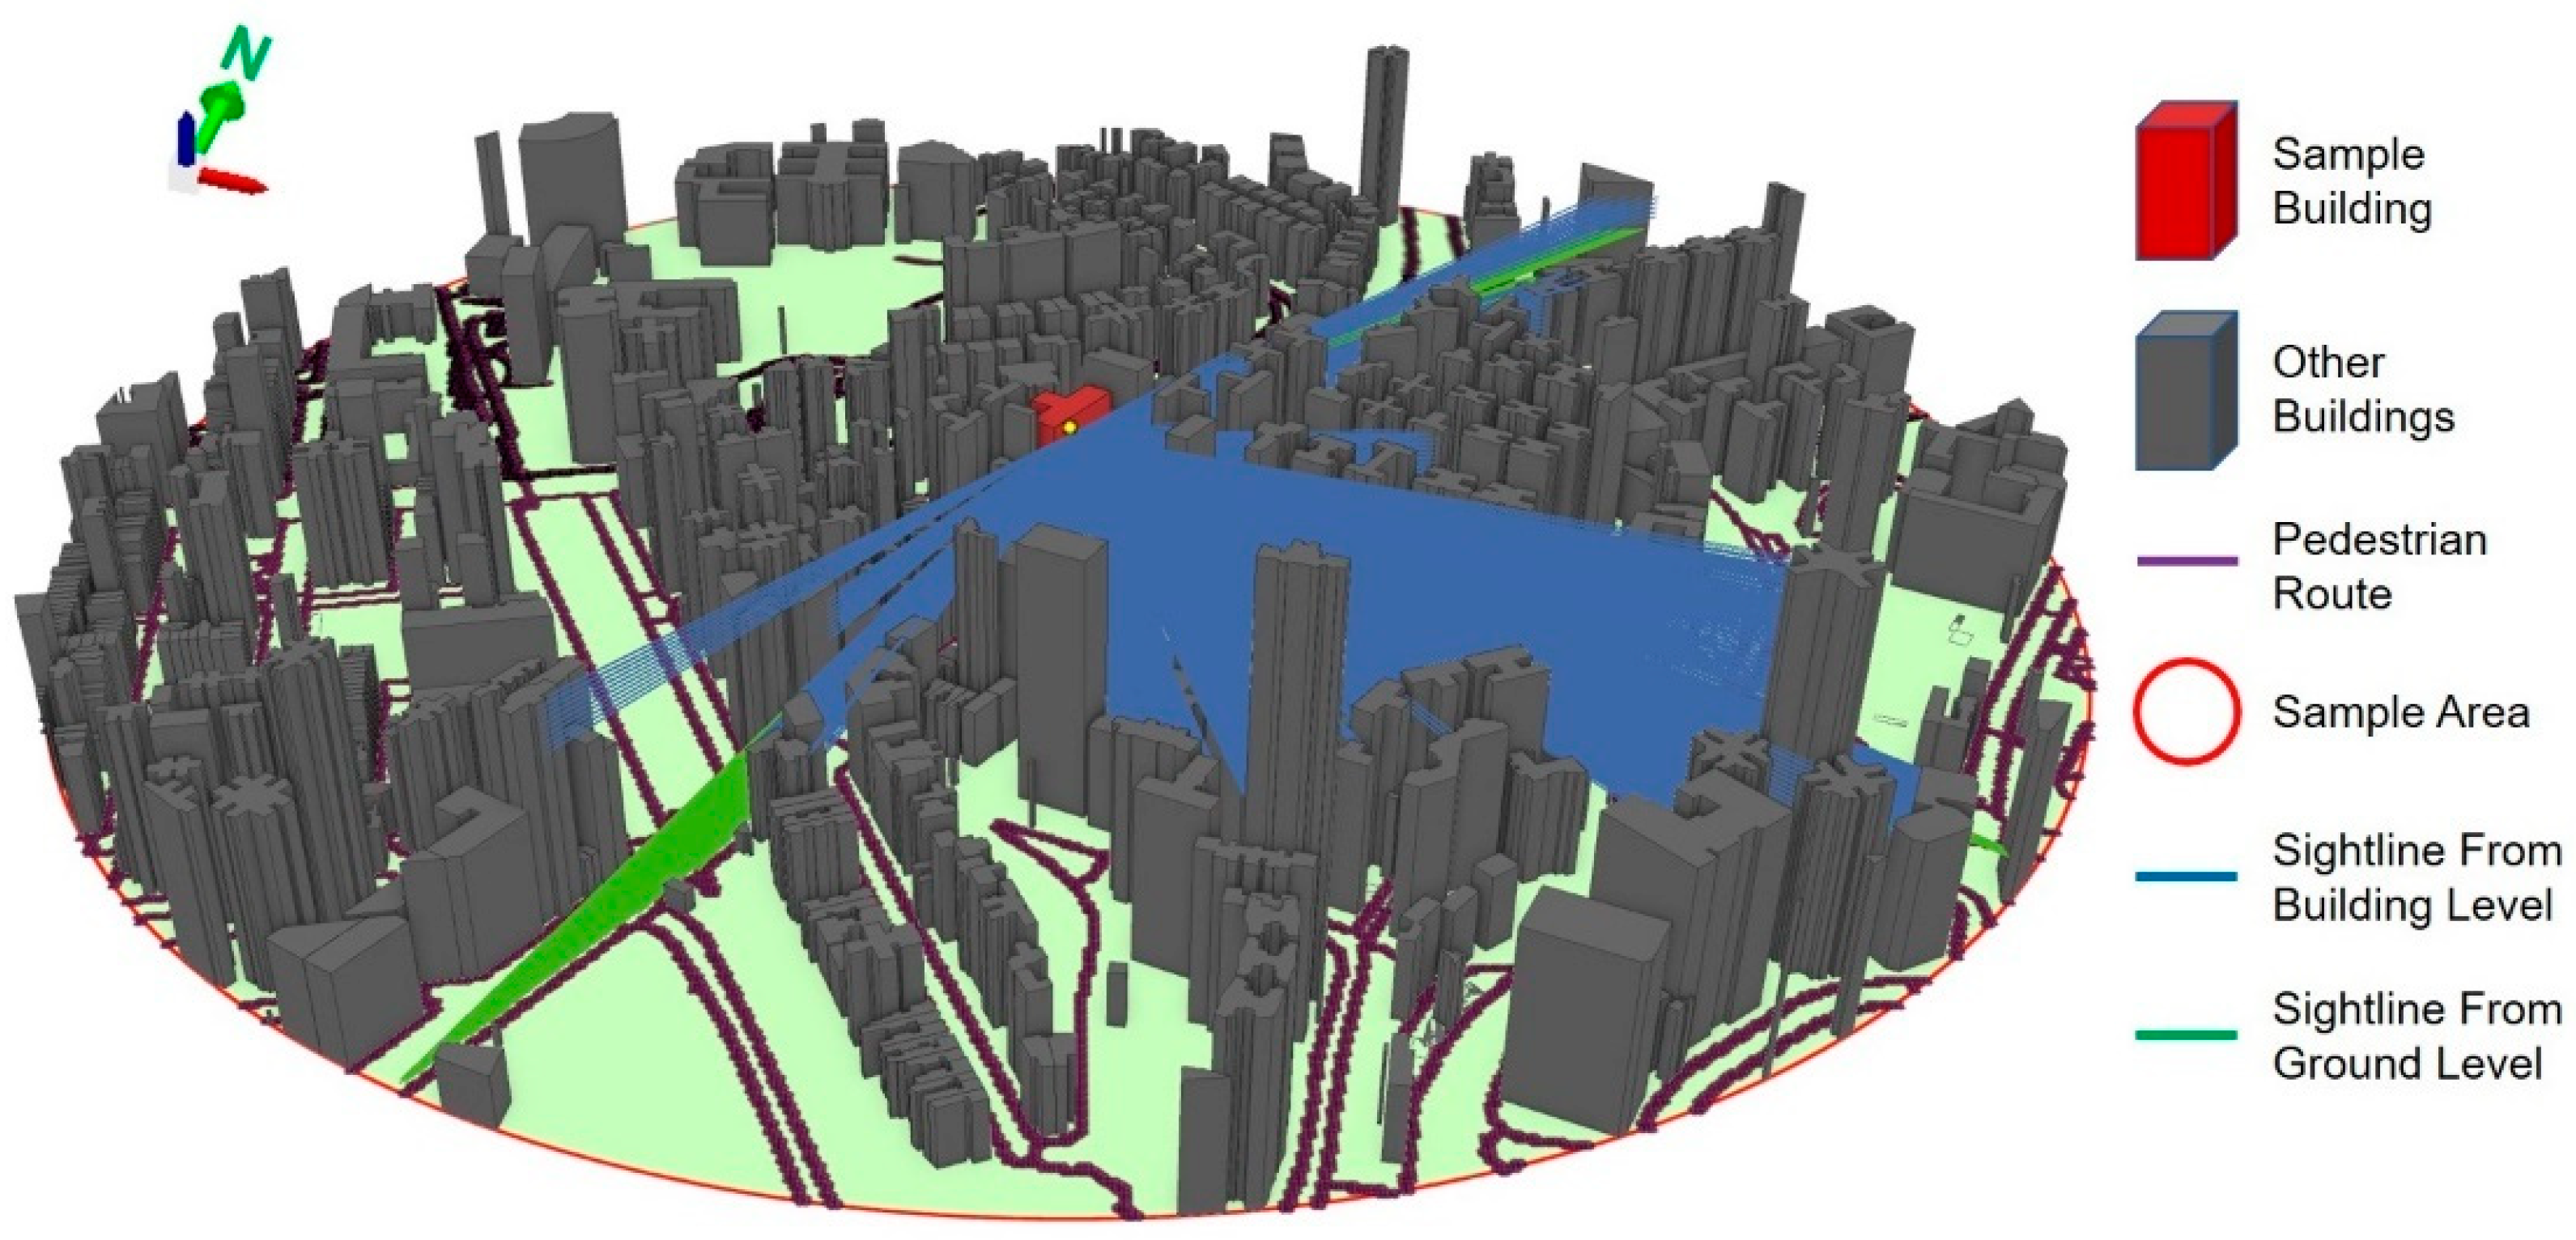
Two functionalities were used for the derivation of PVEI, including Construct sight lines and Intervisibility. The Construct sight lines function generates line elements that represent the light of sight from observer points to target features, the visibility of sightlines is determined by the function of Intervisibility based on potential obstacles defined by the combination of 3D elements and surfaces. First, we created sightlines using observer points and target points identified through 3D model. Target points were extracted from the sample building, resulting in 528 point-features in total. Observer points were extracted from other buildings and pedestrian routes. Thus, the potential visual penetrations could be created with the combination of observer points from other buildings (building level) and pedestrian routes (ground level). Next, the sightline intervisibility was realized according to the constructed sightlines with the visibility obstacles (i.e., 2.5D models). With the help of the Intervisibility function in ArcGIS Pro, all the visible sightlines were then extracted with attributes of azimuth, vertical angle, and length at both the building and pedestrian levels, as shown in Figure 10.
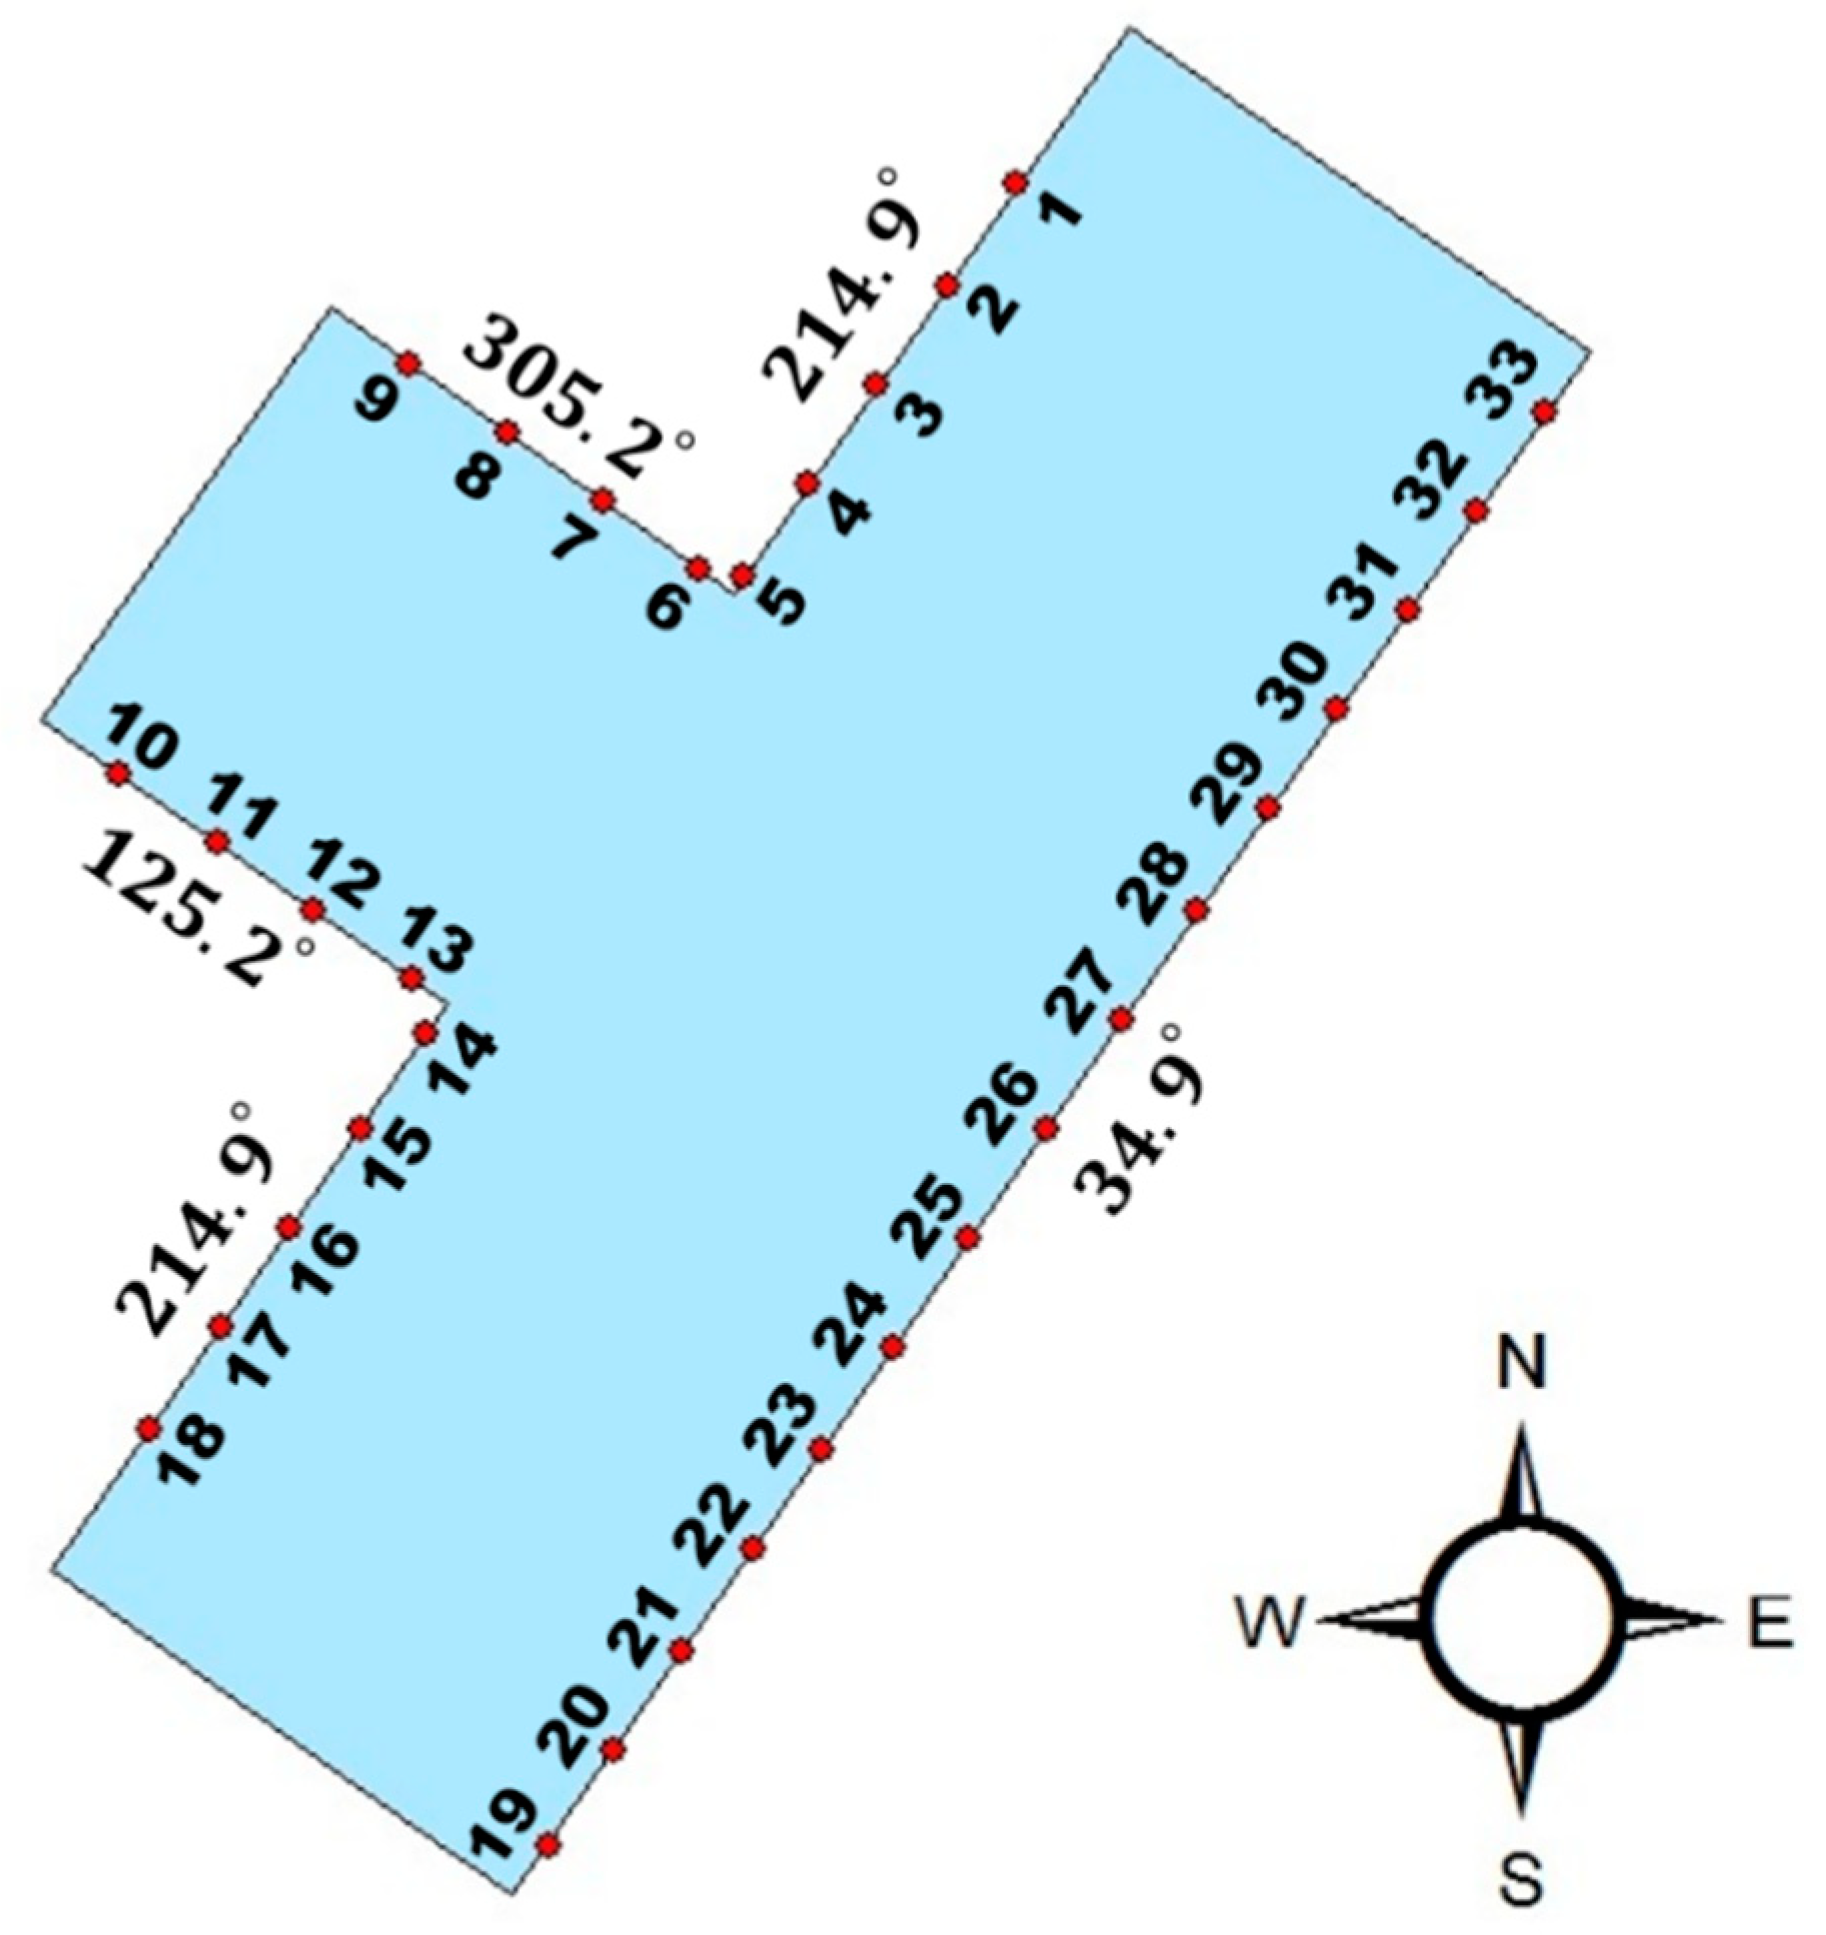
It was noted that the generating azimuth of the sightline was aligned with global coordinates. Since the parameter α in the proposed function represents a relative value, it can be calculated with a further computation. Each orientation of the sample building façade is presented in Figure 11; the red dots along the building’s edge indicate the locations of façade openings, and there are a total of 33 openings in columns and 16 openings in the floor dimension aligned in all the building façades. Therefore, the value of α can be calculated and then given to the corresponding visible sightline.
Other elements, including vertical angle and visual distance (3D length of the sightline), can be created and directly imported together with α into the mathematical model for the final computation. Finally, the PVEIs of the sample building were calculated using the proposed model.

4. Results

We applied our quantitative approach to deal with various spatial datasets to compute the Potential Visual Exposure Index over a sample building. In total, 528 openings of the sample building were detected, and their indicators were calculated.
A 3D-perspective result was realized with an example of Dmax = 500 m in Figure 12a. The PVEI varied along with the change of building orientation and floor. In addition, a two-dimensional diagram of the sample building layout is presented in Figure 12b. It can be seen that the sample building consisted of eight façades in the vertical dimension. Façades 3, 6, and 8 with no opening existed, while every point extracted from the rest of the façades represented the center of an opening, and was given a computational value of PVEI. On the same floor, openings on façades 2 and 4 were detected with relatively better privacy preservation than others, while residents located along façades 1, 5, and 7 may have to take additional actions to prevent visual penetrations from outsiders. On the façade dimension, PVEI varied along with the floor and changes among different façades. As expected, upper floors tended to have lower PVEI values, and the lowest PVEI value appeared to be on the top floor. In addition, the edge of a façade that orientated to public spaces generally appeared to have a higher PVEI value due to the wide range of visual exposure to potential outsiders.
Since the visual exposure of each opening was threatened by observers from two parts, the building level and ground level, Figure 13 reveals the PVEI of all floors with respect to the building level, ground level, and a combination of the two parts in the sample building. On the ground level, as expected, the PVEI value decreased exactly with the increase of floor. This can be well understood with our natural perception, as it is always easier for ground observers to see the openings on the lower floors. Unlike the results for the ground level, Figure 13 shows an interesting result; that is, the PVEI had the highest values in the middle of the floors, which was caused by the larger amount of visual incursion compared to lower floors, and a stronger impact from visible sightlines compared to upper floors. Figure 13 presents the overall result of a combination of the two levels, showing that the PVEI tended to decline with an increase in floor level. Although the impact from the building level contributed the most to the PVEI value, the combination result appeared to follow a similar trend as the results from the ground level.
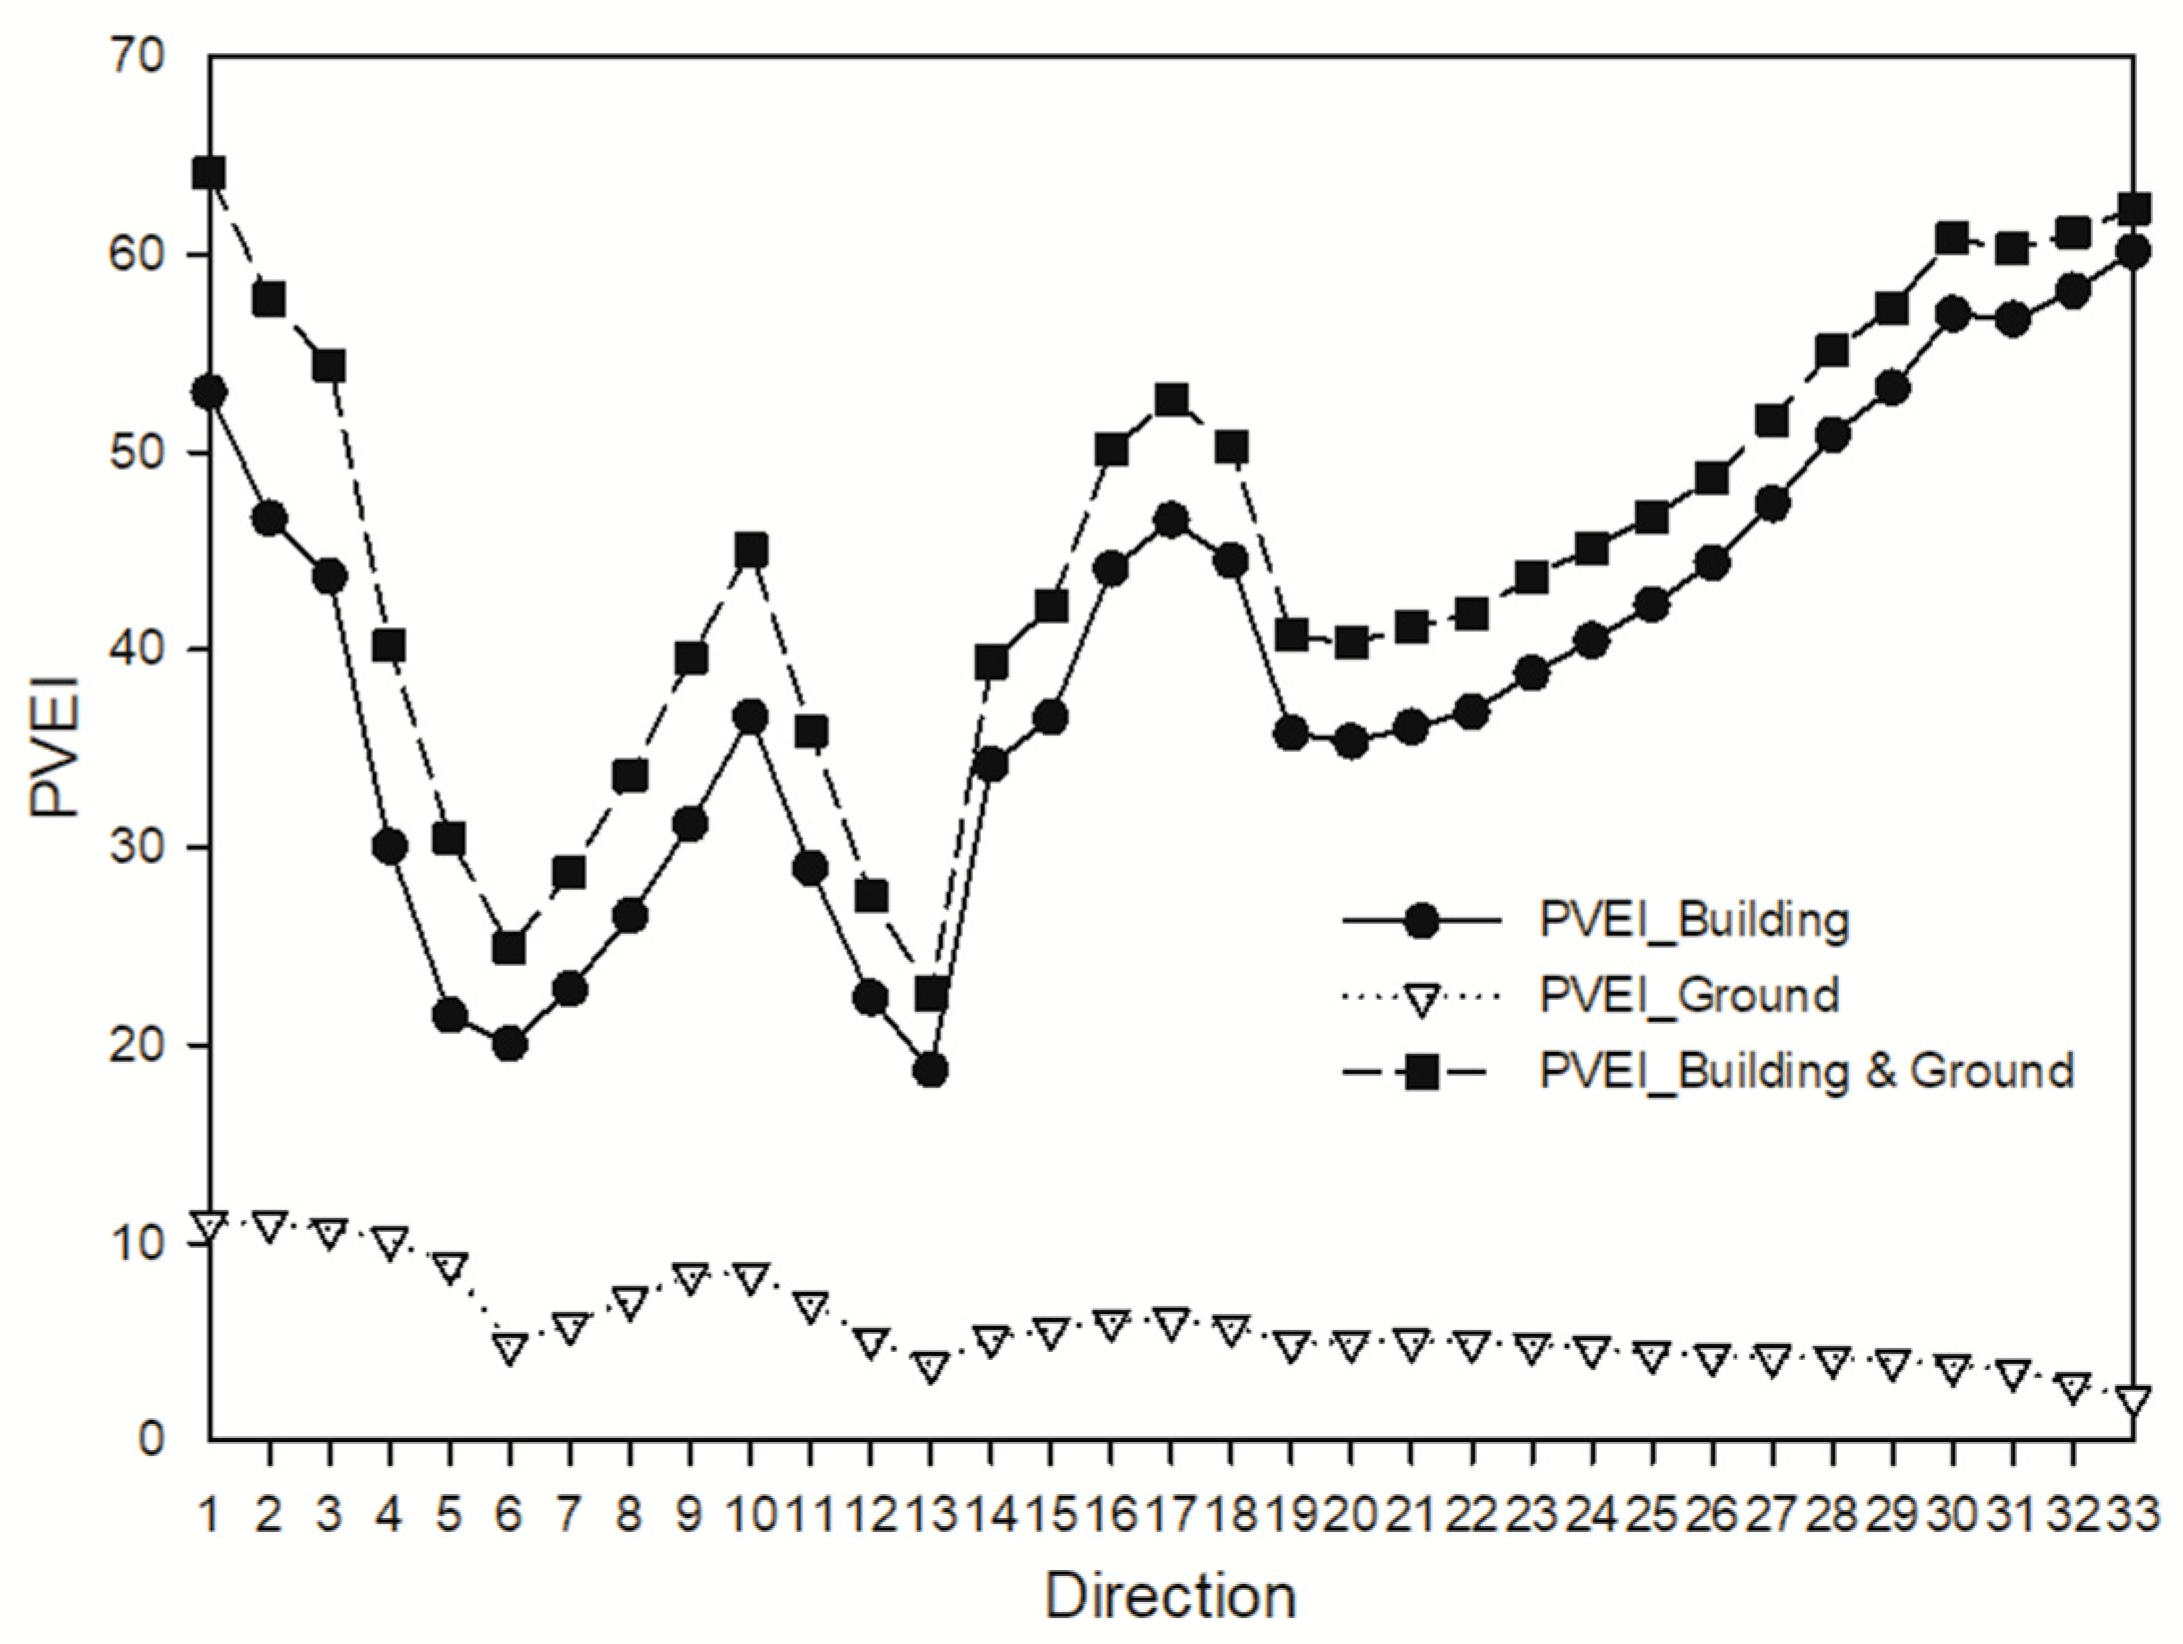
Similarly, we applied our method to the sample building to investigate the tendency of the PVEI with respect to building facades. A total of 35 columns of the openings were aligned in five facades (excluding three facades with no opening) of the sample building. Figure 14 indicates the PVEI of all the openings along the columns on the facades with respect to the ground level, building level, and a combination of the two levels in the sample building. PVEI results from both the ground and building levels presented unified upward or downward trends on the same façade. However, several target points with different PVEI values located near the edge of facades were exceptions that did not follow the overall trend. For example, on the ground level, column 1 showed a great difference in PVEI values from the rest of the columns on the façade 1. Façade 1 was in close proximity to another building, which created a visual barrier and produced low PVEI values for column 1. Similarly, columns 19 and 20 revealed relatively lower values of PVEI on both the building and ground levels because targets on these two columns were the closest to the adjacent building.
In sum, the overall tendency of the combination was similar to the building level, which indicated that the visual exposure by the observers from the building level played a significant role in the study building.
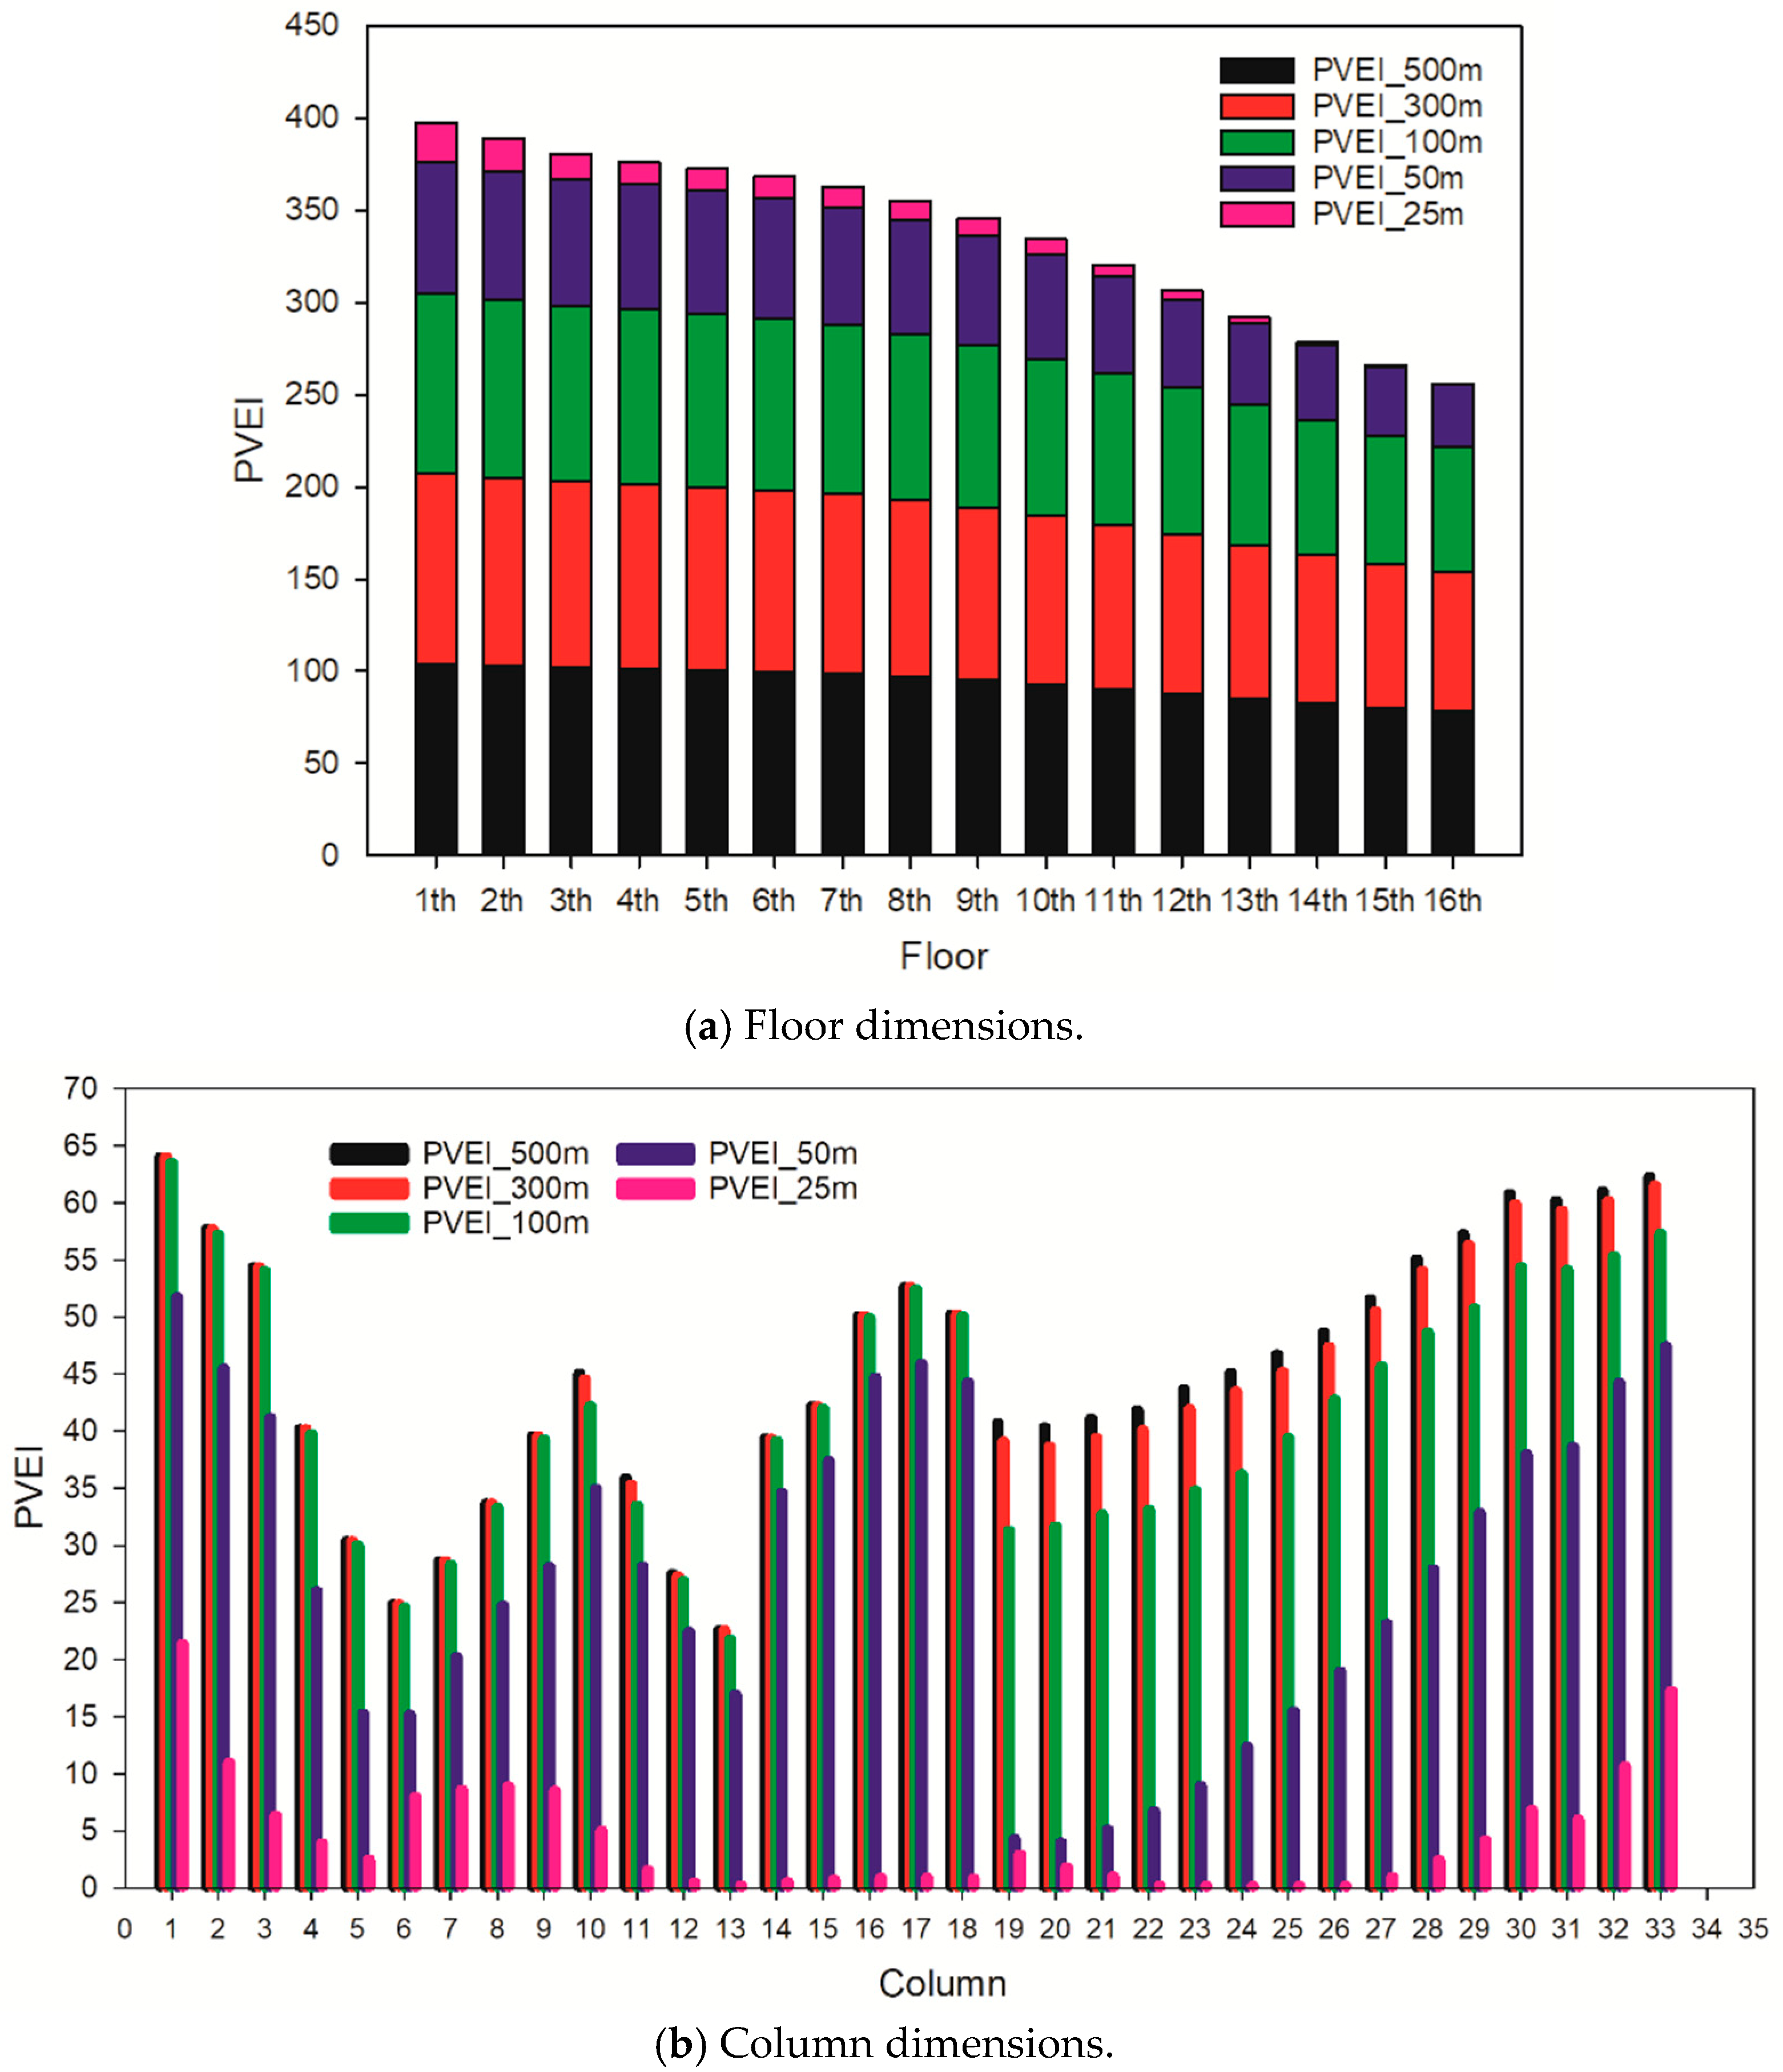
Furthermore, we tested the model and applied it to the cases in which the maximum visual distance (Dmax) was given as 25, 50, 100, and 300 m. The various D m a x was employed for the visual privacy assessment and numerical comparison.
Figure 15 compares PVEI values in the floor dimension (Figure 15a) and column dimension (Figure 15b) under various Dmax For both the floor and column dimensions, the overall trends of PVEI in different Dmax remained consistent. It was noted that the PVEI value almost reached 0 as Dmax approached 25 m on the 16th floor, which indicated there was almost no light of sight penetrating into some of the openings on the 16th floor under the condition.
In addition, the values of PVEI changed remarkably between the cases Dmax = 25 m and Dmax = 100 m, which revealed that a large number of visible sightlines existed with lengths between 25 and 100 m. This may have been caused by the specific building layout and the density in the neighborhood of the sample building. In addition, as shown in Figure 15, PVEI values did not differ greatly when the maximum visual distance was given as 100 m, 300 m, and 500 m.
In conclusion, the visual exposure of an opening may be varied dramatically among different floors and facades. On the ground level, the higher the floor, the lower the PVEI value and the better the privacy. On the building level, although there were no distinct patterns as there were for the ground level, upper floors can be a better choice to preserve residential visual privacy in the same building. In this study case, PVEI values of the sample building were mainly determined by potential observers on the building level, which can be explained by the high-rise and dense building packing in the surrounding area of the sample building. Moreover, as the Dmax changed from 25 to 500 m, the number of visible sightlines increased tremendously, resulting in an increase in the PVEI value and a decrease in the quality of visual privacy of each opening. We determined that it was suitable to describe the visual privacy of the sample building in the case of Dmax = 100 m. Overall, with the change of Dmax, the overall trend of PVEI remained stable.

5. Discussion

5.1. Determination of the Maximum View Distance in the Model

Scholars have studied visual privacy and concluded that privacy can only be invaded when the visual distance situates within a relatively small range. This is because the effect of sight incursion on visual privacy is not just about “what observers can see”, it is about the capacity of visual damage for observers to distinguish among the various forms of objects or different characteristics of people. There are a few references that discuss how the distance between buildings affects visual exposure at façade openings, and the minimum distance between buildings needed to provide sufficient visual privacy for the residents [18,45]. Mitrany [46] found that a distance of 35 m between buildings was enough to obtain the desired level of visual privacy for residents, while a distance of 10 m failed to meet the needs. Day [47] examined the street distance of low-rise neighborhoods and found that 24.4 m in distance was sufficient for the preservation of privacy. In addition, visible sightlines were categorized by visual distances with four ranges to rank the level of visual exposure of building openings, and a length of sightline greater than 50 m was considered a well-preserved level of privacy [17].
Nevertheless, in this study, we examined the visual exposure of building openings based on various ranges of the maximum view distance, including 25, 50, 100, 300 and 500 m. The results showed that when Dmax approached 100 m, PVEI values of openings reached a steady state. The case of a Dmax greater than 100 m could obtain an outcome with a better precision, and while it may be time-consuming with low effectiveness in computation, it was not sufficient to realize the potential visual exposure of the opening when the Dmax was lower than 100 m. Consequently, the investigation with various Dmax provided a possibility to identify and realize the potential sight penetrators and their spatial distributions in the built environment. Moreover, the light of sight created with the use of a telescope or other devices in a residential environment can be “shortened in length”, contributing to a much clearer scenery in the observer’s view, and eventually changing the amount of visual exposure and the level of visual privacy. While this phenomenon was not taken into account in this, since we were mainly focused on establishing the method of the quantitative model. A forward investigation of the phenomenon in future work could be significant in a better understanding of visual privacy in residential environments.

5.2. Impact Factors on PVEI

The function of the PVEI was established on a basis of visibility, and revealed a relationship among PVEI and view distance, opening area, and view direction. First, the area of target opening had a positive influence on the PVEI, and a high PVEI value increased the possibility of visual intrusion, resulting in poor visual privacy. Nowadays, the urban landscape usually has a wide-ranging and complex morphology, in which large-area openings passively accept the sight views from all directions, while visual penetrations from most of the directions are constantly blocked in the small-area openings. Second, since the PVEI is an indicator measuring each opening’s capacity of visual exposure in urban space, characteristics of buildings and the distribution of potential observers have a substantial impact on the value of PVEI. For instance, the expansion of city buildings toward density and verticality has led to a dramatic increase in the number of potential observers within a compact neighborhood at the building level, especially for large cities in which the population is concentrated in a small community. Conversely, with the increase of building spacing, the level of visual privacy that residents can preserve is more likely to have extended horizontal and vertical dimensions. Thus, buildings with more open space and lower density contribute to lower PVEI values for neighborhoods. Finally, the location and width of pedestrian routes around the residential environment have a potential effect on the PVEI, especially for occupants on low floors. Although observers from the building level had the largest impact on the sample building’s visual privacy in this study, it is important to pay attention to the damage of visual exposure from the ground level, which can be a main issue in a low-rise and spaced-out building neighborhood.

5.3. A Further Development Required for Deriving a Standard PVEI

Based on the mathematical function, the value of the PVEI is proportional to the area of openings and the inverse square distance between observers and the target. However, because the compact and vertical complexes built in modern society must deal with a risk of visual privacy in terms of the high value of the PVEI, it is not common to find a residence with the best protection of visual privacy (i.e., PVEI = 0). The PVEI value of an opening approaching 0 exists in many cases; for example, an opening toward a region (e.g., sea or lake) without those buildings or pedestrian routes, or an opening that is totally blocked by urban elements or trees. Visual privacy can be well preserved in these two cases, but rarely occurs in reality. In addition, these openings with a low PVEI value may also be accompanied by environmental damage such as sunlight and ventilation. In a built environment, people choose a residence with relatively better visual privacy that can meet their expectations, rather than a residence with a PVEI value of 0.
Therefore, it is of the highest importance to ensure all the openings of buildings (especially for residences and hotels) achieve an acceptable level of visual privacy, which refers to the Standard Potential Visual Exposure Index (SPVEI), which should be designed by architects and urban planners. As shown in Figure 16, the value of the PVEI between 0 and the SPVEI refers to a low preservation of the visual privacy of an opening, while the value of the PVEI that is higher than the SPVEI represents an acceptable level of visual privacy. It is worth noting that the same SPVEI value for different openings can correspond to the different selections of D m a x . Moreover, SPVEI may be varied, since the desired visual privacy differs according to the culture, region, and functionality of buildings. Consequently, the proposed mathematical function can be used as a basic tool to quantify visual privacy, and is helpful to identify various SPVEI under certain circumstances.
.

6. Conclusions

With the continuous improvement of income levels, urban residents are altering their priorities from basic necessities of living to the quality of their lives. Visual privacy, as a key factor in the quality of urban life, is greatly needed at every scale. Quantitative measurement and analysis of urban residents’ visual privacy or the visual penetration by strangers is an integral part of assessing the overall quality of residential life in an urban environment. In this paper, an indicator was developed to provide an objective and people-centered evaluation and quantitative analysis of the visual exposure of urban space on different openings of building façades. This indicator was calculated on the basis of a mathematical model using the data of the building footprint and the pedestrian network in a 3D perspective.
In the sample building in the center of Kowloon, people who live on lower floors tended to have a high level of visual exposure or low level of visual privacy, but this did not indicate that the higher the floor, the better preservation of the visual privacy. First, at the ground level, the PVEI value of an opening consistently decreased with an increase in the building floor because of the increase of visual distance. Second, at the building level, targets on the middle floor had the highest probability to be visually exposed to the observers from all directions, and a large number of sight incursions led to the worst preservation of visual privacy. Consequently, with the integration of both levels, residents of upper floors had a relatively better preservation of their visual privacy in the building.
Several possible errors that existed in the assumptions may have affected the results of the Potential Visual Exposure Index computation. For instance, the observer area and target area were independent variables in the proposed model, and the size of an opening had an impact on the calculation results for the PVEI. In the study case, although two openings could be able to form numerous sightlines in theory, only one sightline was created by extracting the center of the two openings and further introduced into the computation. However, it was not guaranteed that all sightlines between observers and targets were visible, since some parts of a target opening may have been blocked from the view of the observer. Specifically, the smaller the opening area was divided, the higher the precision of the result. The larger the opening area was divided, the lower the precision of the result. However, when increasing the size of the grids into which an opening was divided, the efficiency of the computation decreased. Therefore, it was crucial to find a trade-off between computational efficiency and precision.
As an indicator capturing an important quality of residential environment, the Potential Visual Exposure Index in this paper can not only remind residents of the potential damage to visual privacy, but also help urban planners and architects improve the quality of urban environment by quantitatively assessing the sensory “visual exposure” value of city buildings.

Author Contributions

Conceptualization, B.W.; methodology, H.Z. and H.W.; investigation, H.Z. and J.Y.; software, J.Z.; resources, B.W. and H.Z.; writing original draft preparation, H.Z.; writing review and editing, B.W., H.W. and H.Z.; visualization, J.Y. and J.Z.; supervision, B.W. and H.W.; funding acquisition, B.W. and H.W. All authors have read and agreed to the published version of the manuscript.

Funding

This research was funded by Natural Science Foundation of China, grant number 41961055 and 31860233, and The National Key Research and Development Program of China, grant number 2018YFE0207800.

Institutional Review Board Statement

Not applicable.

Informed Consent Statement

Not applicable.

Data Availability Statement

Publicly available data sets were analyzed in this study. The 3D Photo-Realistic Model data set can be found here: https://www.pland.gov.hk/pland_en/info_serv/3D_models/download.htm (accessed on 10 October 2020). The 3D Pedestrian Network data set can be found here: https://geodata.gov.hk/gs/view-dataset?uuid=201eaaee-47d6-42d0-ac81-19a430f63952&sidx=0# (accessed on 15 October 2020). The iB1000 data sets can be found here: https://www.hkmapservice.gov.hk/OneStopSystem/map-search?product=OSSCatB&series=iB1000&locale=en (accessed on 8 September 2020).

Acknowledgments

The authors would like to thank the anonymous reviewers and editors for their valuable comments. The authors are also thankful to the Hong Kong Government (Planning Department and Lands Department) for providing the data sets.

Conflicts of Interest

The authors declare that they have no known competing financial interests or personal relationships that could have appeared to influence the work reported in this paper.

References

  1. Arriaza, M.; Cañas-Ortega, J.F.; Cañas-Madueño, J.A.; Ruiz-Aviles, P. Assessing the visual quality of rural landscapes. Landsc. Urban Plan. 2004, 69, 115–125. [Google Scholar] [CrossRef]
  2. Abd-Alhamid, F.; Kent, M.; Calautit, J.; Wu, Y. Evaluating the impact of viewing location on view perception using a virtual environment. Build. Environ. 2020, 180, 106932. [Google Scholar] [CrossRef]
  3. Yang, J.; Zhao, L.; McBride, J.; Gong, P. Can you see green? Assessing the visibility of urban forests in cities. Landsc. Urban Plan. 2009, 91, 97–104. [Google Scholar] [CrossRef]
  4. Yu, S.; Yu, B.; Song, W.; Wu, B.; Zhou, J.; Huang, Y.; Wu, J.; Zhao, F.; Mao, W. View-based greenery: A three-dimensional assessment of city buildings’ green visibility using Floor Green View Index. Landsc. Urban Plan. 2016, 152, 13–26. [Google Scholar] [CrossRef]
  5. Falfán, I.; Muñoz-Robles, C.A.; Bonilla-Moheno, M.; MacGregor-Fors, I. Can you really see ‘green’? Assessing physical and self-reported measurements of urban greenery. Urban For. Urban Green. 2018, 36, 13–21. [Google Scholar] [CrossRef]
  6. Chen, J.; Zhou, C.; Li, F. Quantifying the green view indicator for assessing urban greening quality: An analysis based on Internet-crawling street view data. Ecol. Indic. 2020, 113, 106192. [Google Scholar] [CrossRef]
  7. Zhang, J.; Cheng, Y.; Li, H.; Wan, Y.; Zhao, B. Deciphering the changes in residential exposure to green spaces: The case of a rapidly urbanizing metropolitan region. Build. Environ. 2021, 188, 107508. [Google Scholar] [CrossRef]
  8. Bulut, Z.; Yilmaz, H. Determination of waterscape beauties through visual quality assessment method. Environ. Monit. Assess. 2009, 154, 459–468. [Google Scholar] [CrossRef] [PubMed]
  9. Alphan, H.; Sonmez, F. Mapping availability of sea view for potential building development areas. Environ. Monit. Assess. 2015, 187, 413. [Google Scholar] [CrossRef] [PubMed]
  10. Lin, L.; Homma, R.; Iki, K. Preferences for a lake landscape: Effects of building height and lake width. Environ. Impact Assess. Rev. 2018, 70, 22–33. [Google Scholar] [CrossRef]
  11. Alphan, H.; Aşur, F. Geospatial analysis of lake scenery as an indicator for the environment: The City of Van (Turkey) and its surroundings. Environ. Sustain. Indic. 2021, 9, 100091. [Google Scholar] [CrossRef]
  12. Qi, T.; Zhang, G.; Wang, Y.; Liu, C.; Li, X. Research on landscape quality of country parks in Beijing as based on visual and audible senses. Urban For. Urban Green. 2017, 26, 124–138. [Google Scholar] [CrossRef]
  13. Gungor, S.; Polat, A.T. Relationship between visual quality and landscape characteristics in urban parks. J. Environ. Prot. Ecol. 2018, 19, 939–948. [Google Scholar] [CrossRef]
  14. Heydaripour, O.; Behmaneshnia, F.; Talebian, E.; Shahi, P.H. A survey on privacy of residential life in contemporary apartments in Iran. Int. J. Sci. Study 2017, 5, 254–263. [Google Scholar] [CrossRef]
  15. Al-Birawi, S.; Adawi, A.A.D. Privacy criterions and elements in Islamic residential architecture. Jordan J. Islamic Stud. 2019, 15, 402–421. [Google Scholar] [CrossRef]
  16. Rapoport, A. Culture, Architecture, and Design; Locke Science Publishing Company, Inc.: Chicago, IL, USA, 2005. [Google Scholar]
  17. Shach-Pinsly, D.; Fisher-Gewirtzman, D.; Burt, M. ‘Visual exposure’ analysis model: A comparative evaluation of three case studies. Urban Design Int. 2007, 12, 155–168. [Google Scholar] [CrossRef]
  18. Al-Kodmany, K. Residential visual privacy: Traditional and modern architecture and urban design. J. Urban Des. 1999, 4, 283–311. [Google Scholar] [CrossRef]
  19. Tomah, A.N. Visual privacy in residential areas: Amendment of building regulations. Proc. Inst. Civ. Eng. Urban Des. Plan. 2012, 165, 43–53. [Google Scholar] [CrossRef]
  20. Hashim, A.H.; Rahim, Z.A.; Rashid, S.N.S.A.; Yahaya, N. Visual privacy and family intimacy: A case study of malay inhabitants living in two-storey low-cost terrace housing. Environ. Plan. B Plan. Des. 2016, 33, 301–318. [Google Scholar] [CrossRef]
  21. Georgiou, M. Architectural Privacy: A Topological Approach to Relational Design Problems. Master’s Thesis, Bartlett School of Graduate Studies, University College London, London, UK, 2006. [Google Scholar]
  22. Indraprastha, A.; Shinozaki, M. Computational models for measuring spatial quality of interior design in virtual environment. Build. Environ. 2012, 49, 67–85. [Google Scholar] [CrossRef]
  23. Othman, Z.; Buys, L.; Aird, R. Observing privacy, modesty and hospitality in the home domain: Three case studies of Muslim homes in Brisbane, Australia. Int. J. Archit. Res. 2014, 8, 266–283. [Google Scholar] [CrossRef] [Green Version]
  24. Shepperson, M. Visibility, privacy, and missing windows: Lighting domestic space in ancient Mesopotamia. In The Oxford Handbook of Light in Archaeology; Papadopoulos, C., Moyes, H., Eds.; Oxford University Press: Oxford, UK, 2017. [Google Scholar]
  25. Sipahi, A. Window-conflicts in the Ottoman Empire and Turkey: Visual privacy, materiality and right to the city. Middle East. Stud. 2016, 52, 588–604. [Google Scholar] [CrossRef]
  26. Hwang, J.H.; Lee, H. Parametric model for window design based on prospect-refuge measurement in residential environment. Sustainability 2018, 10, 3888. [Google Scholar] [CrossRef] [Green Version]
  27. Alelwani, R.; Ahmad, M.W.; Rezgui, Y. Public perception of vernacular architecture in the Arabian Peninsula: The case of rawshan. Buildings 2020, 10, 151. [Google Scholar] [CrossRef]
  28. Liu, A.M.M. Residential satisfaction in housing estates: A Hong Kong perspective. Autom. Constr. 1999, 8, 511–524. [Google Scholar] [CrossRef]
  29. Kim, J.; De Dear, R. Workspace satisfaction: The privacy-communication trade-off in open-plan offices. J. Environ. Psychol. 2013, 36, 18–26. [Google Scholar] [CrossRef] [Green Version]
  30. Ibem, E.O.; Opoko, A.P.; Adeboye, A.B.; Amole, D. Performance evaluation of residential buildings in public housing estates in Ogun State, Nigeria: Users’ satisfaction perspective. Front. Archit. Res. 2013, 2, 178–190. [Google Scholar] [CrossRef] [Green Version]
  31. Hwang, J.Y.; Lee, H. 3D visual simulation and numerical measurement of privacy in traditional Korean palace. In Proceedings of the 22nd International Conference of the Association for Computer-Aided Architectural Design Research in Asia (CAADRIA), Hong Kong, China, 5–8 April 2017. [Google Scholar]
  32. Benedikt, M.L. To take hold of space: Isovists and isovist fields. Environ. Plan. B Plan. Des. 1979, 6, 47–65. [Google Scholar] [CrossRef]
  33. Morello, E.; Ratti, C. A digital image of the city: 3D isovists in Lynch’s urban analysis. Environ. Plan. B Plan. Des. 2009, 36, 837–853. [Google Scholar] [CrossRef] [Green Version]
  34. Alkhazmi, H.M.; Esin, N. Investigating the visual privacy on houses layouts in traditional desert settlement of Ghadames city-Libya-by using space syntax analysis. Int. J. Appl. Eng. Res. 2017, 12, 8941–8951. [Google Scholar]
  35. Lonergan, C.; Hedley, N. Unpacking isovists: A framework for 3D spatial visibility analysis. Cartogr. Geogr. Inf. Sci. 2015, 43, 87–102. [Google Scholar] [CrossRef]
  36. Llobera, M. Extending GIS-based visual analysis: The concept of visualscapes. Int. J. Geogr. Inf. Sci. 2003, 17, 25–48. [Google Scholar] [CrossRef]
  37. Shach-Pinsly, D. Visual openness and visual exposure analysis models used as evaluation tools during the urban design development process. J. Urban. 2010, 3, 161–184. [Google Scholar] [CrossRef]
  38. Kumsap, C.; Borne, F.; Moss, D. The technique of distance decayed visibility for forest landscape visualization. Int. J. Geogr. Inf. Sci. 2005, 19, 723–744. [Google Scholar] [CrossRef]
  39. Taylor, P.J. Distance decay in spatial interactions. Concepts Tech. Mod. Geogr. 1975, 2, 35. [Google Scholar]
  40. Chen, Y. The distance-decay function of geographical gravity model: Power law or exponential law? Chaos Solitons Fractals 2015, 77, 174–189. [Google Scholar] [CrossRef] [Green Version]
  41. An, K.; Ko, H.; Kim, C. Development and implementation of visual exposure indicator for residential development. Int. J. Smart Home 2015, 9, 1–10. [Google Scholar] [CrossRef]
  42. Tara, A.; Lawson, G.; Renata, A. Measuring magnitude of change by high-rise buildings in visual amenity conflicts in Brisbane. Landsc. Urban Plan. 2021, 205, 103930. [Google Scholar] [CrossRef]
  43. Census and Statistics Department. Demographic Trends in Hong Kong 1986–2016. Statistical Reports; 2017. Available online: https://www.censtatd.gov.hk/en/EIndexbySubject.html?pcode=B1120017&scode=150 (accessed on 7 May 2021).
  44. Tang, W.S.; Lee, J.W.Y.; Hui, T.W.; Yip, M.K.C. The “Urban density” question in Hong Kong: From absolute space to social processes. City Cult. Soc. 2019, 17, 46–53. [Google Scholar] [CrossRef]
  45. Merry, S.E. Crowding, conflict, and neighborhood regulation. In Human Behavior and Environment; Springer: Boston, MA, USA, 1987; Volume 9, pp. 35–68. [Google Scholar]
  46. Mitrany, M. Subjective Housing Density and the Housing Context. Ph.D. Thesis, Department of Architecture and Town Planning, The Technion-IIT, Haifa, Israel, 2001. [Google Scholar]
  47. Day, L.L. Choosing a house: The relationship between dwelling type, perception of privacy and residential satisfaction. J. Plan. Educ. Res. 2016, 19, 265–275. [Google Scholar] [CrossRef]
Figure 1. Illustration of potential observers within a target-centered sphere.
Buildings 11 00272 g001
Figure 2. The target and observers between two buildings.
Buildings 11 00272 g002
Figure 3. Sightlines from building level and ground level.
Buildings 11 00272 g003
Figure 4. Horizontal domain (top view).
Buildings 11 00272 g004
Figure 5. Visual penetration into rooms in different cases: (a) upper floor; (b) lower floor; (c) same floor level.
Buildings 11 00272 g005
Figure 6. Vertical domain (side view).
Buildings 11 00272 g006
Figure 7. Location of Metropark Hotel Kowloon, Kowloon, Hong Kong, China.
Buildings 11 00272 g007
Figure 8. Data sets of the 3D Photo-Realistic Model, 3D Pedestrian Network, and 2D building footprint in the study area. (a) 3D Photo-Realistic Model. (b) 3D Pedestrian Network and 2.5D Model.
Buildings 11 00272 g008
Figure 9. The implementation procedure of the PVEI estimation.
Buildings 11 00272 g009
Figure 10. An example of visible sightlines between a target and observers.
Buildings 11 00272 g010
Figure 11. Building outlines with openings on the façades and façade orientations.
Buildings 11 00272 g011
Figure 12. A classification scheme of the visual exposure model applied to the sample building based on the PVEI of each opening: (a) 3D perspective; (b) 2D diagram from the projection of the 3D model.
Buildings 11 00272 g012
Figure 13. PVEI of all the floors with respect to the ground level, building level, and a combination of the two levels.
Buildings 11 00272 g013
Figure 14. PVEI of the building direction in columns with respect to the ground level, building level, and a combination of the two levels.
Buildings 11 00272 g014
Figure 15. PVEI values according to the floors (a) and the columns (b) under various ranges of the maximum visual distance.
Buildings 11 00272 g015
Figure 16. The relationship between PVEI and the selection of D m a x .
Buildings 11 00272 g016
Publisher’s Note: MDPI stays neutral with regard to jurisdictional claims in published maps and institutional affiliations.