
A Quantitative Method for Evaluation of Visual Privacy in Residential Environments


Abstract
:1. Introduction
2. Materials and Methods
2.1. Definition
2.2. Variables in Mathematical Description
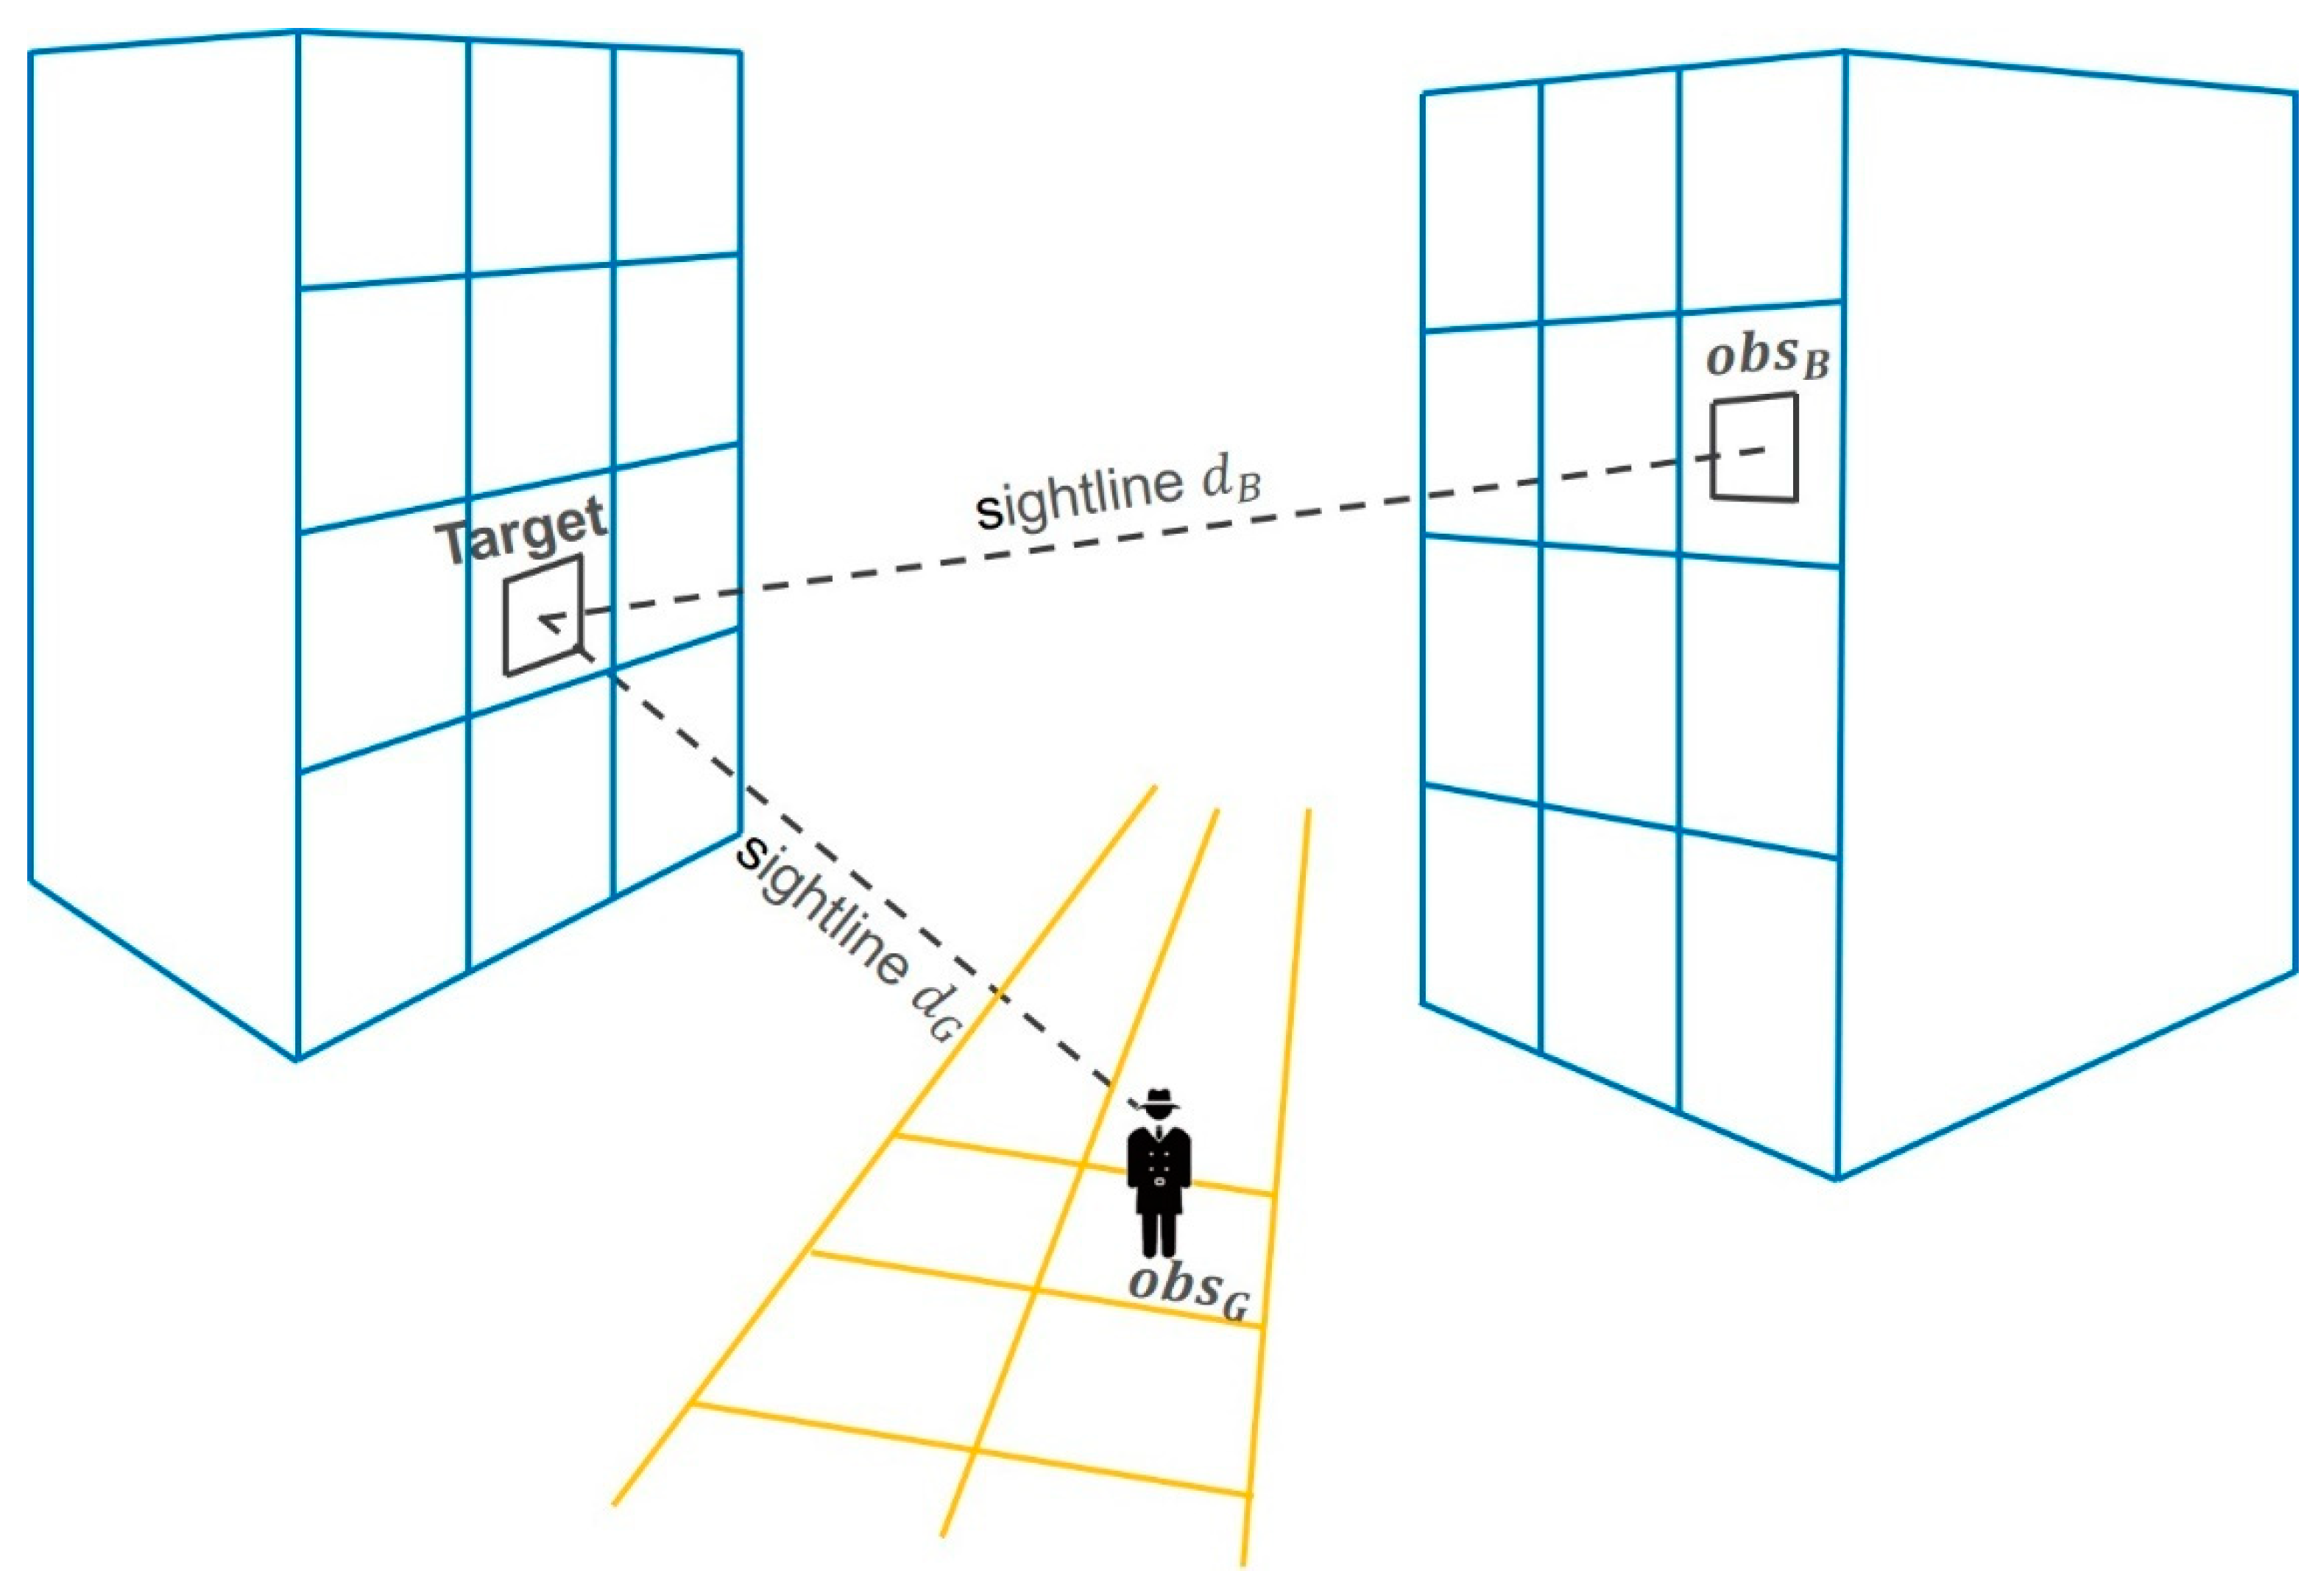
2.2.1. Visual Distance and Opening Area
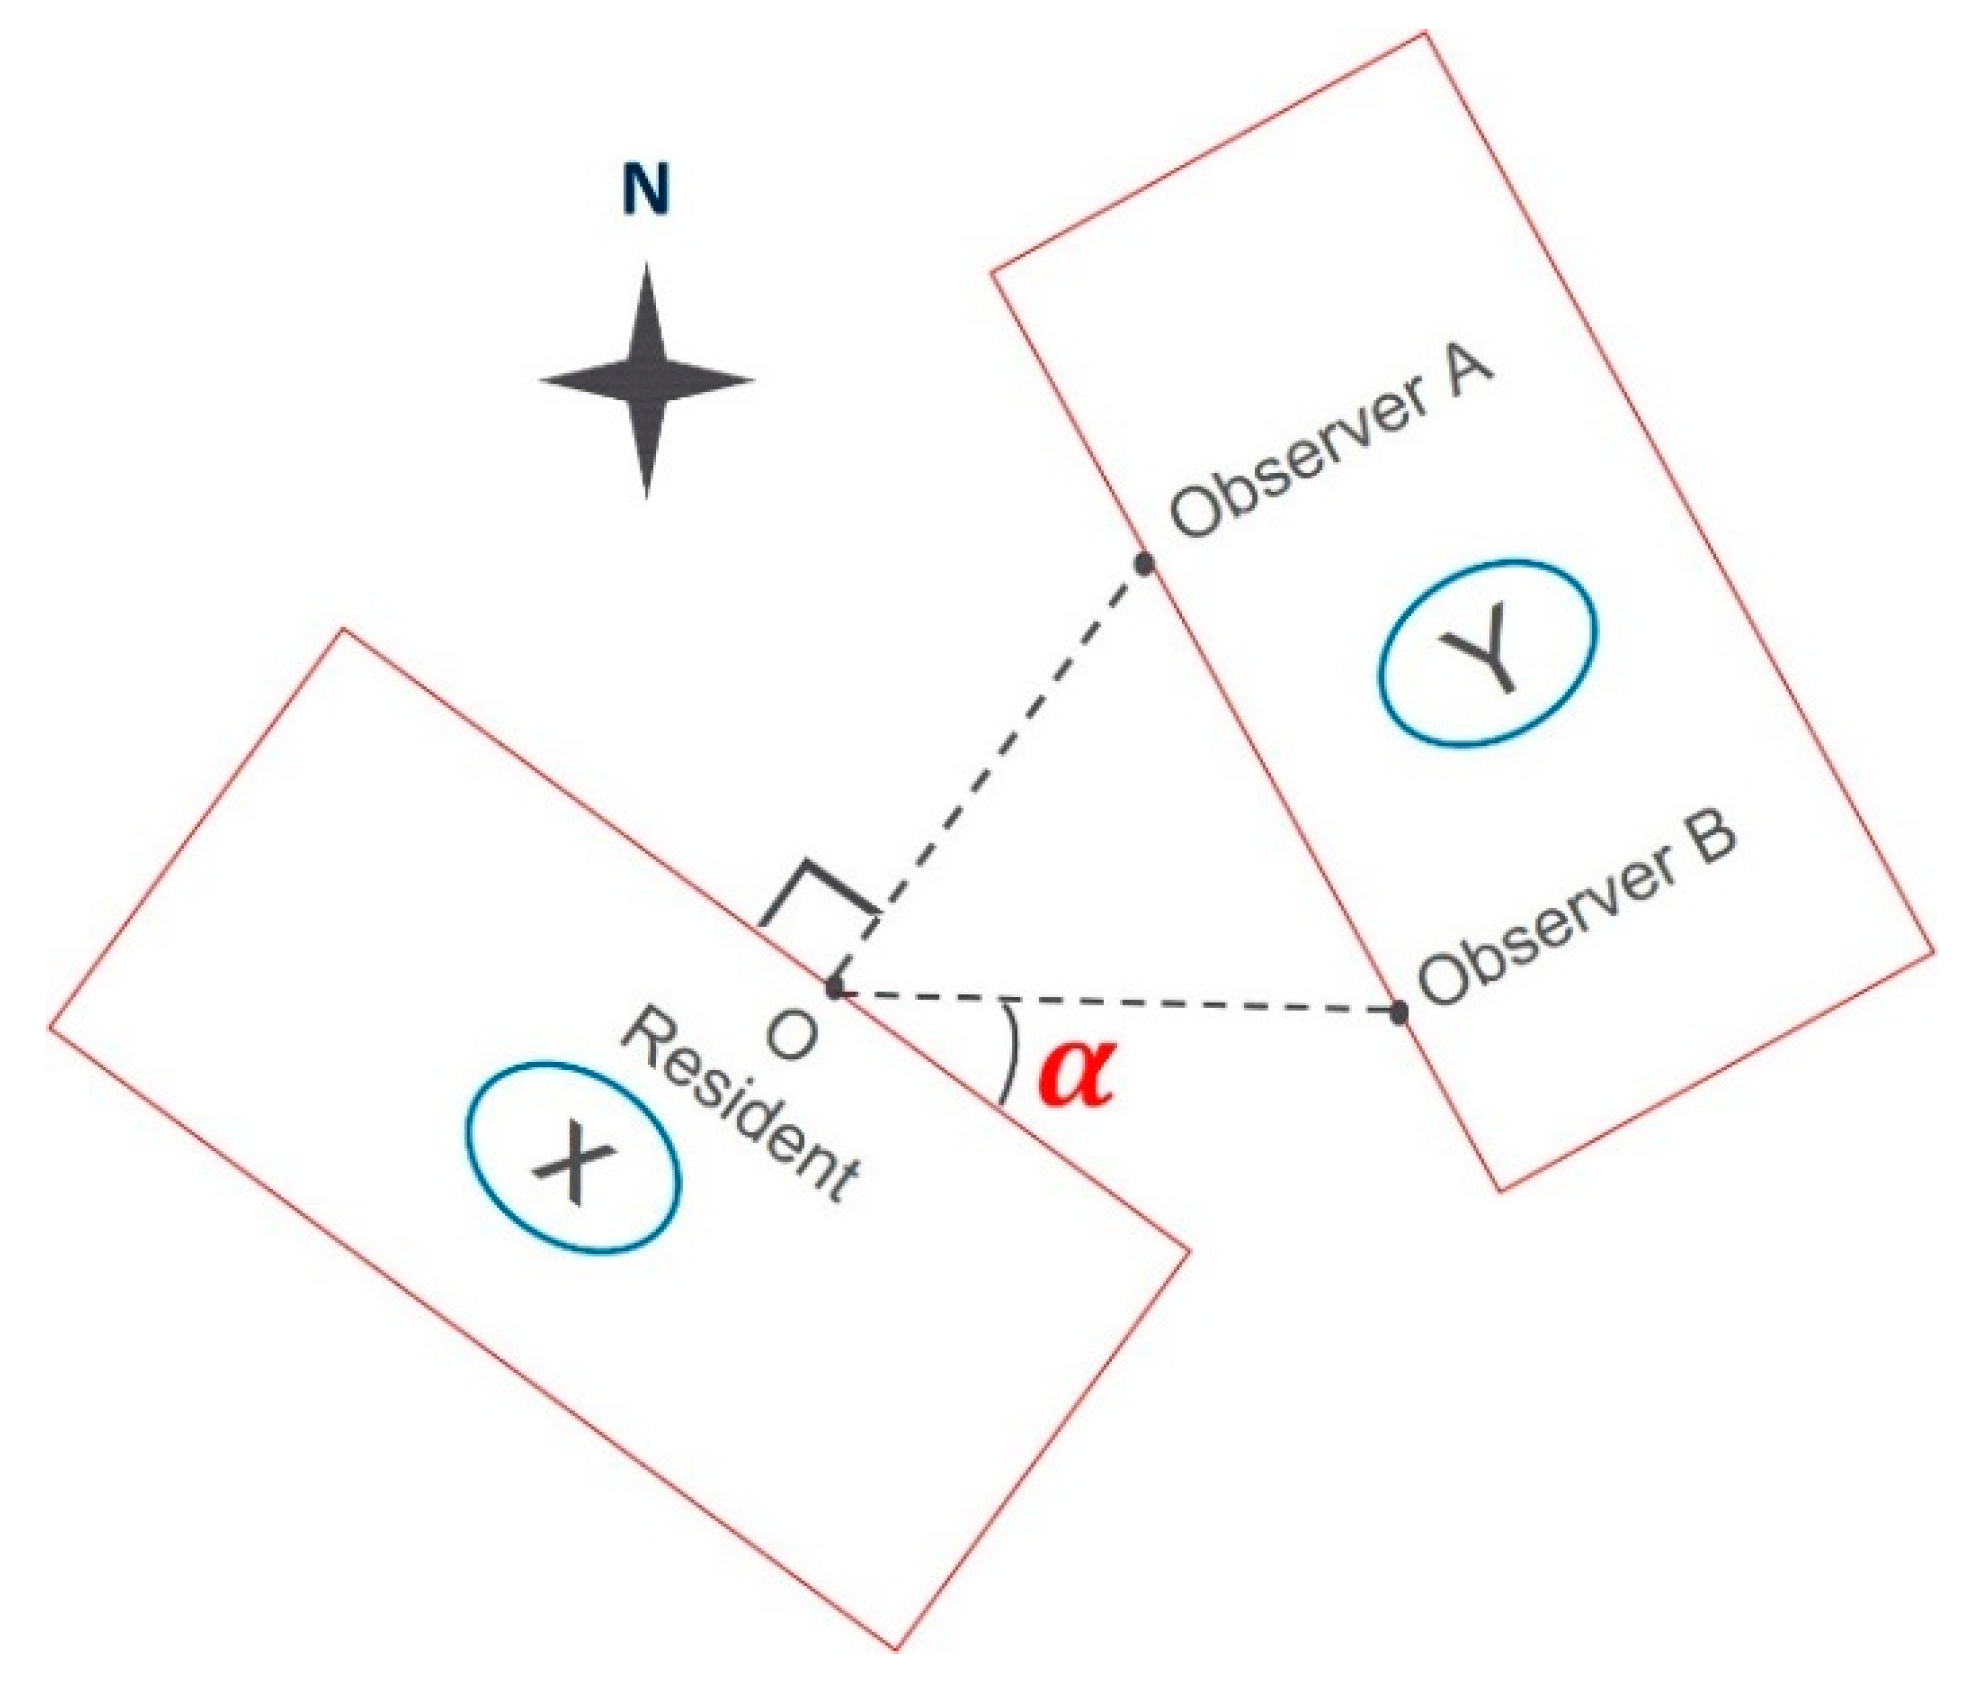
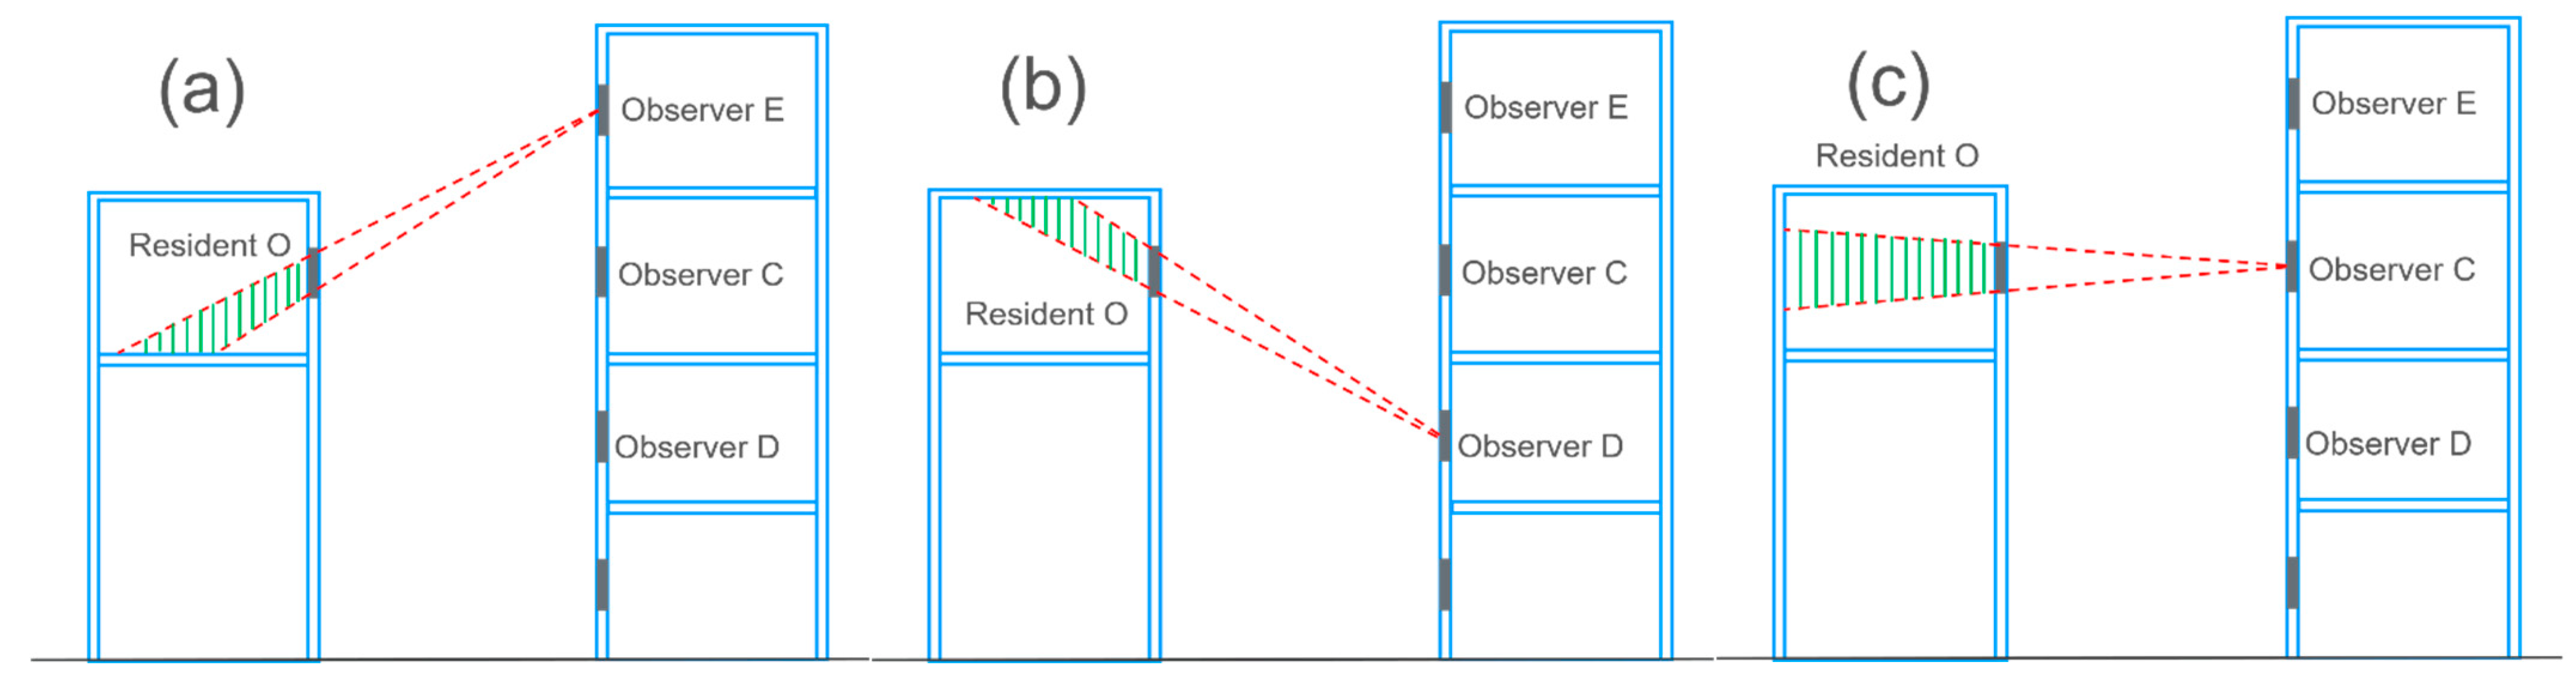
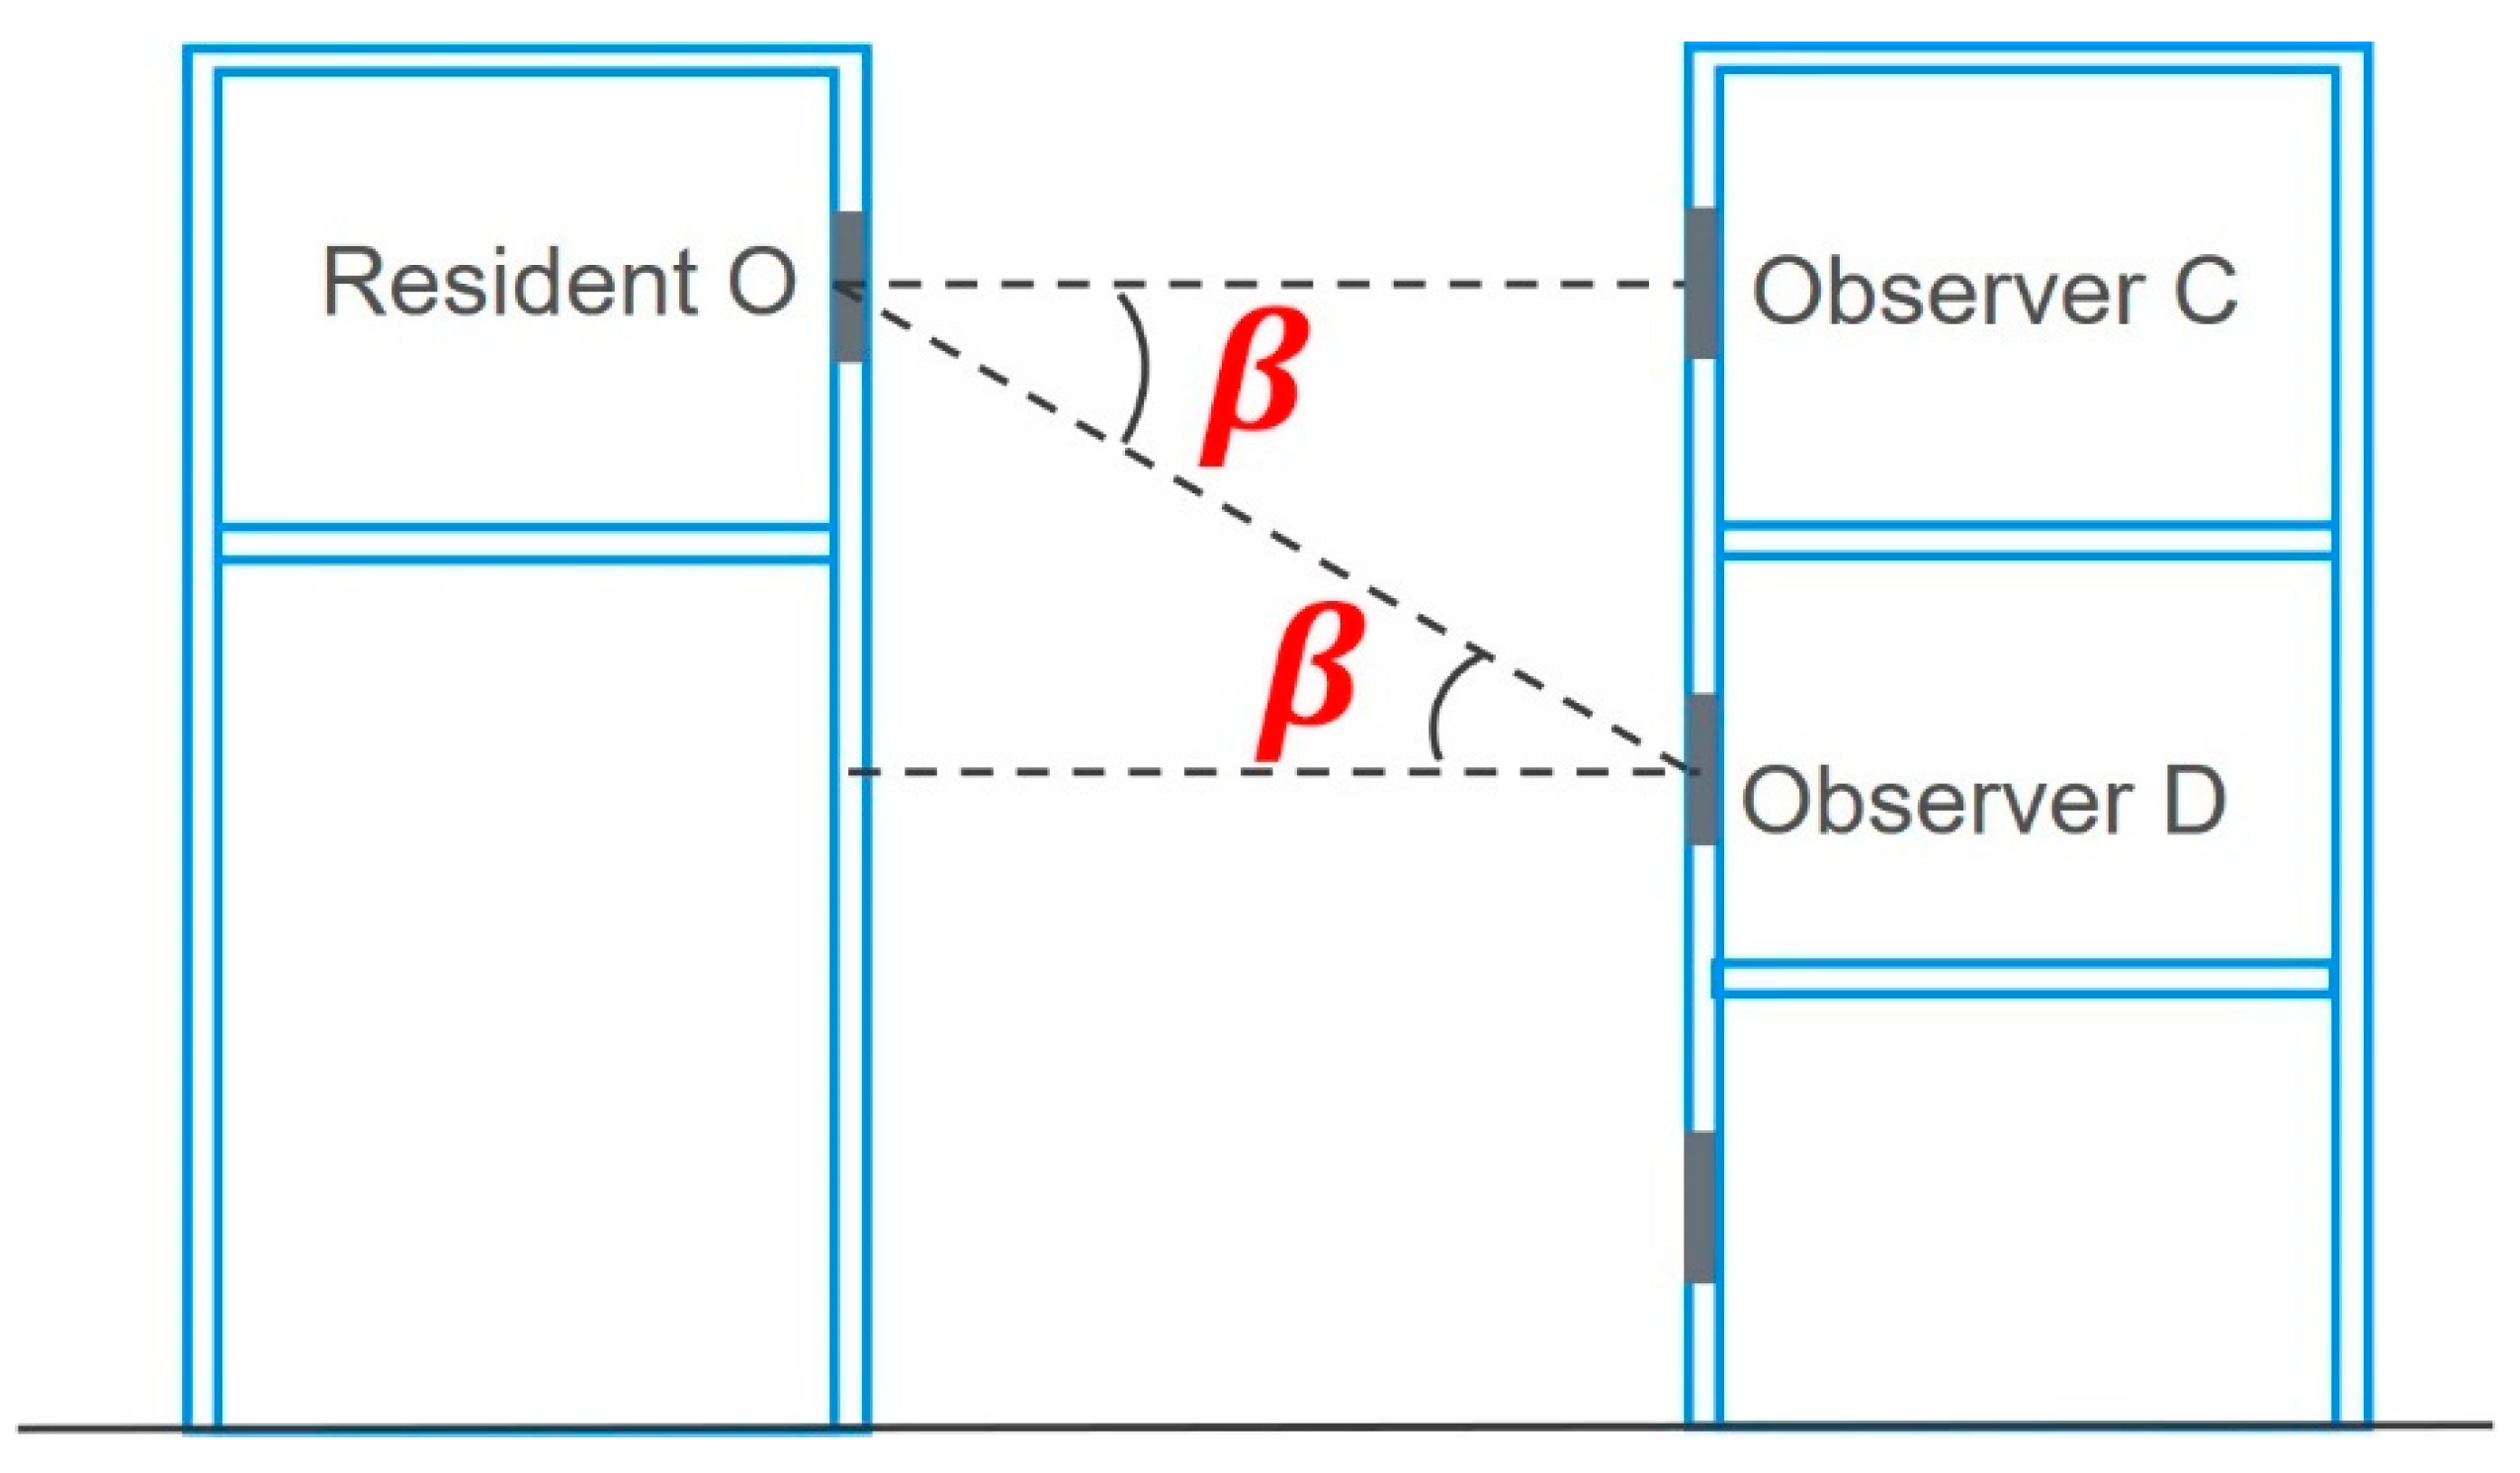
2.2.2. Visual Direction
2.3. Model Equation
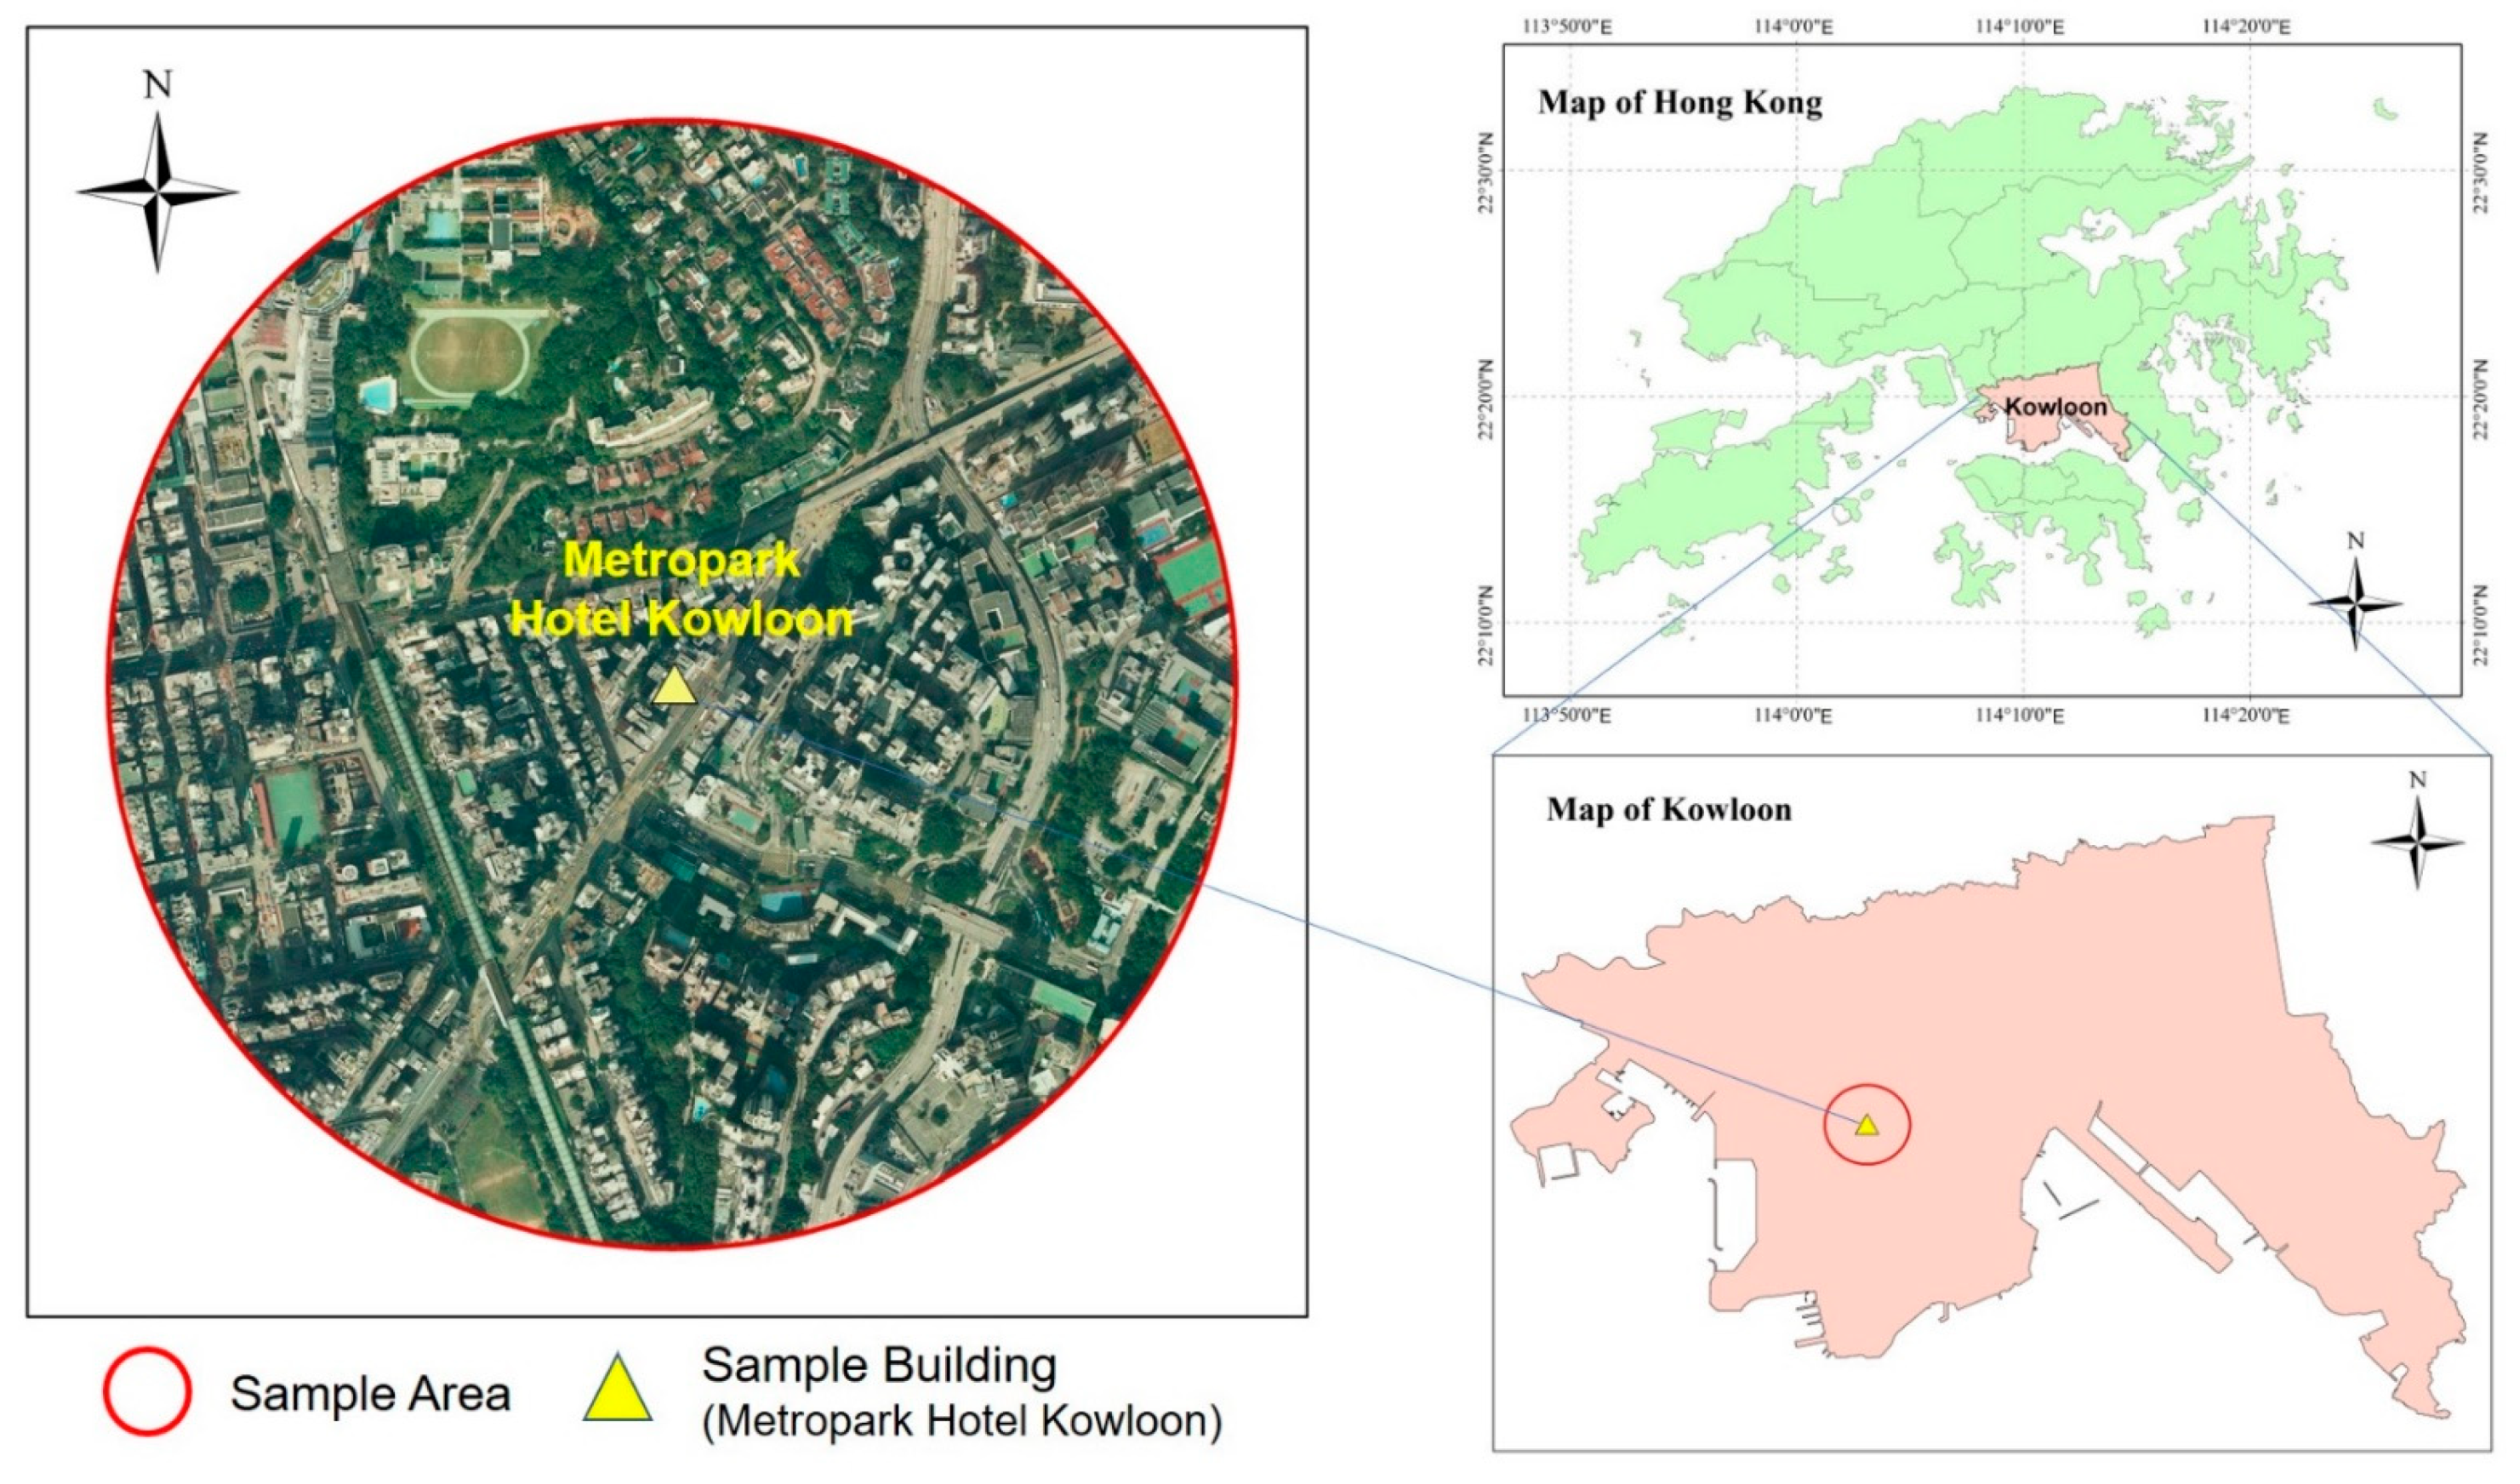
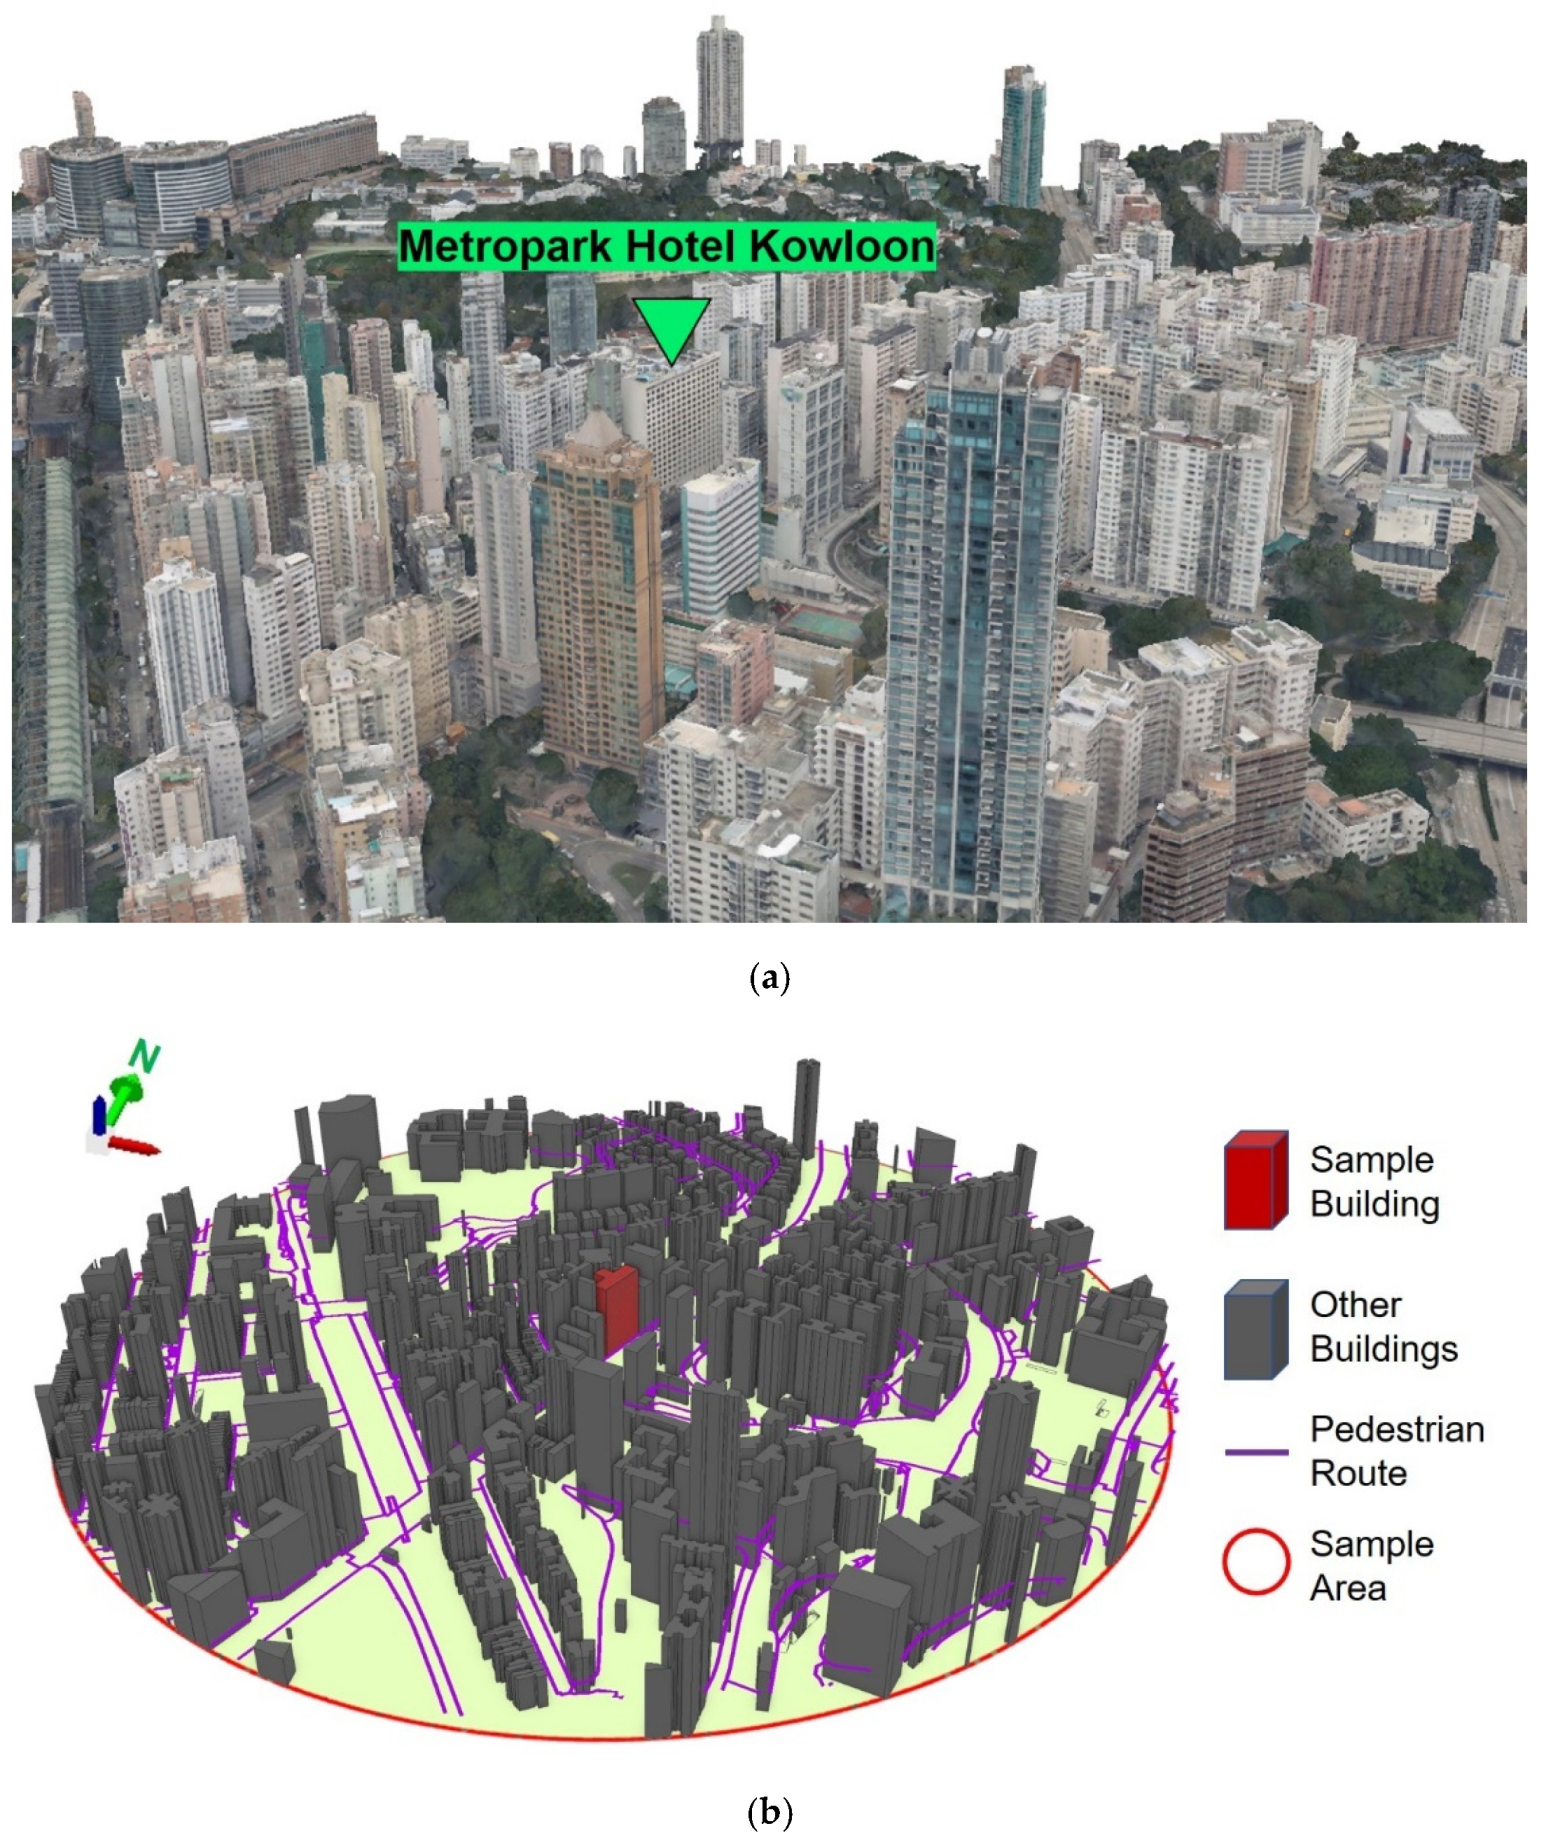
3. Case Study
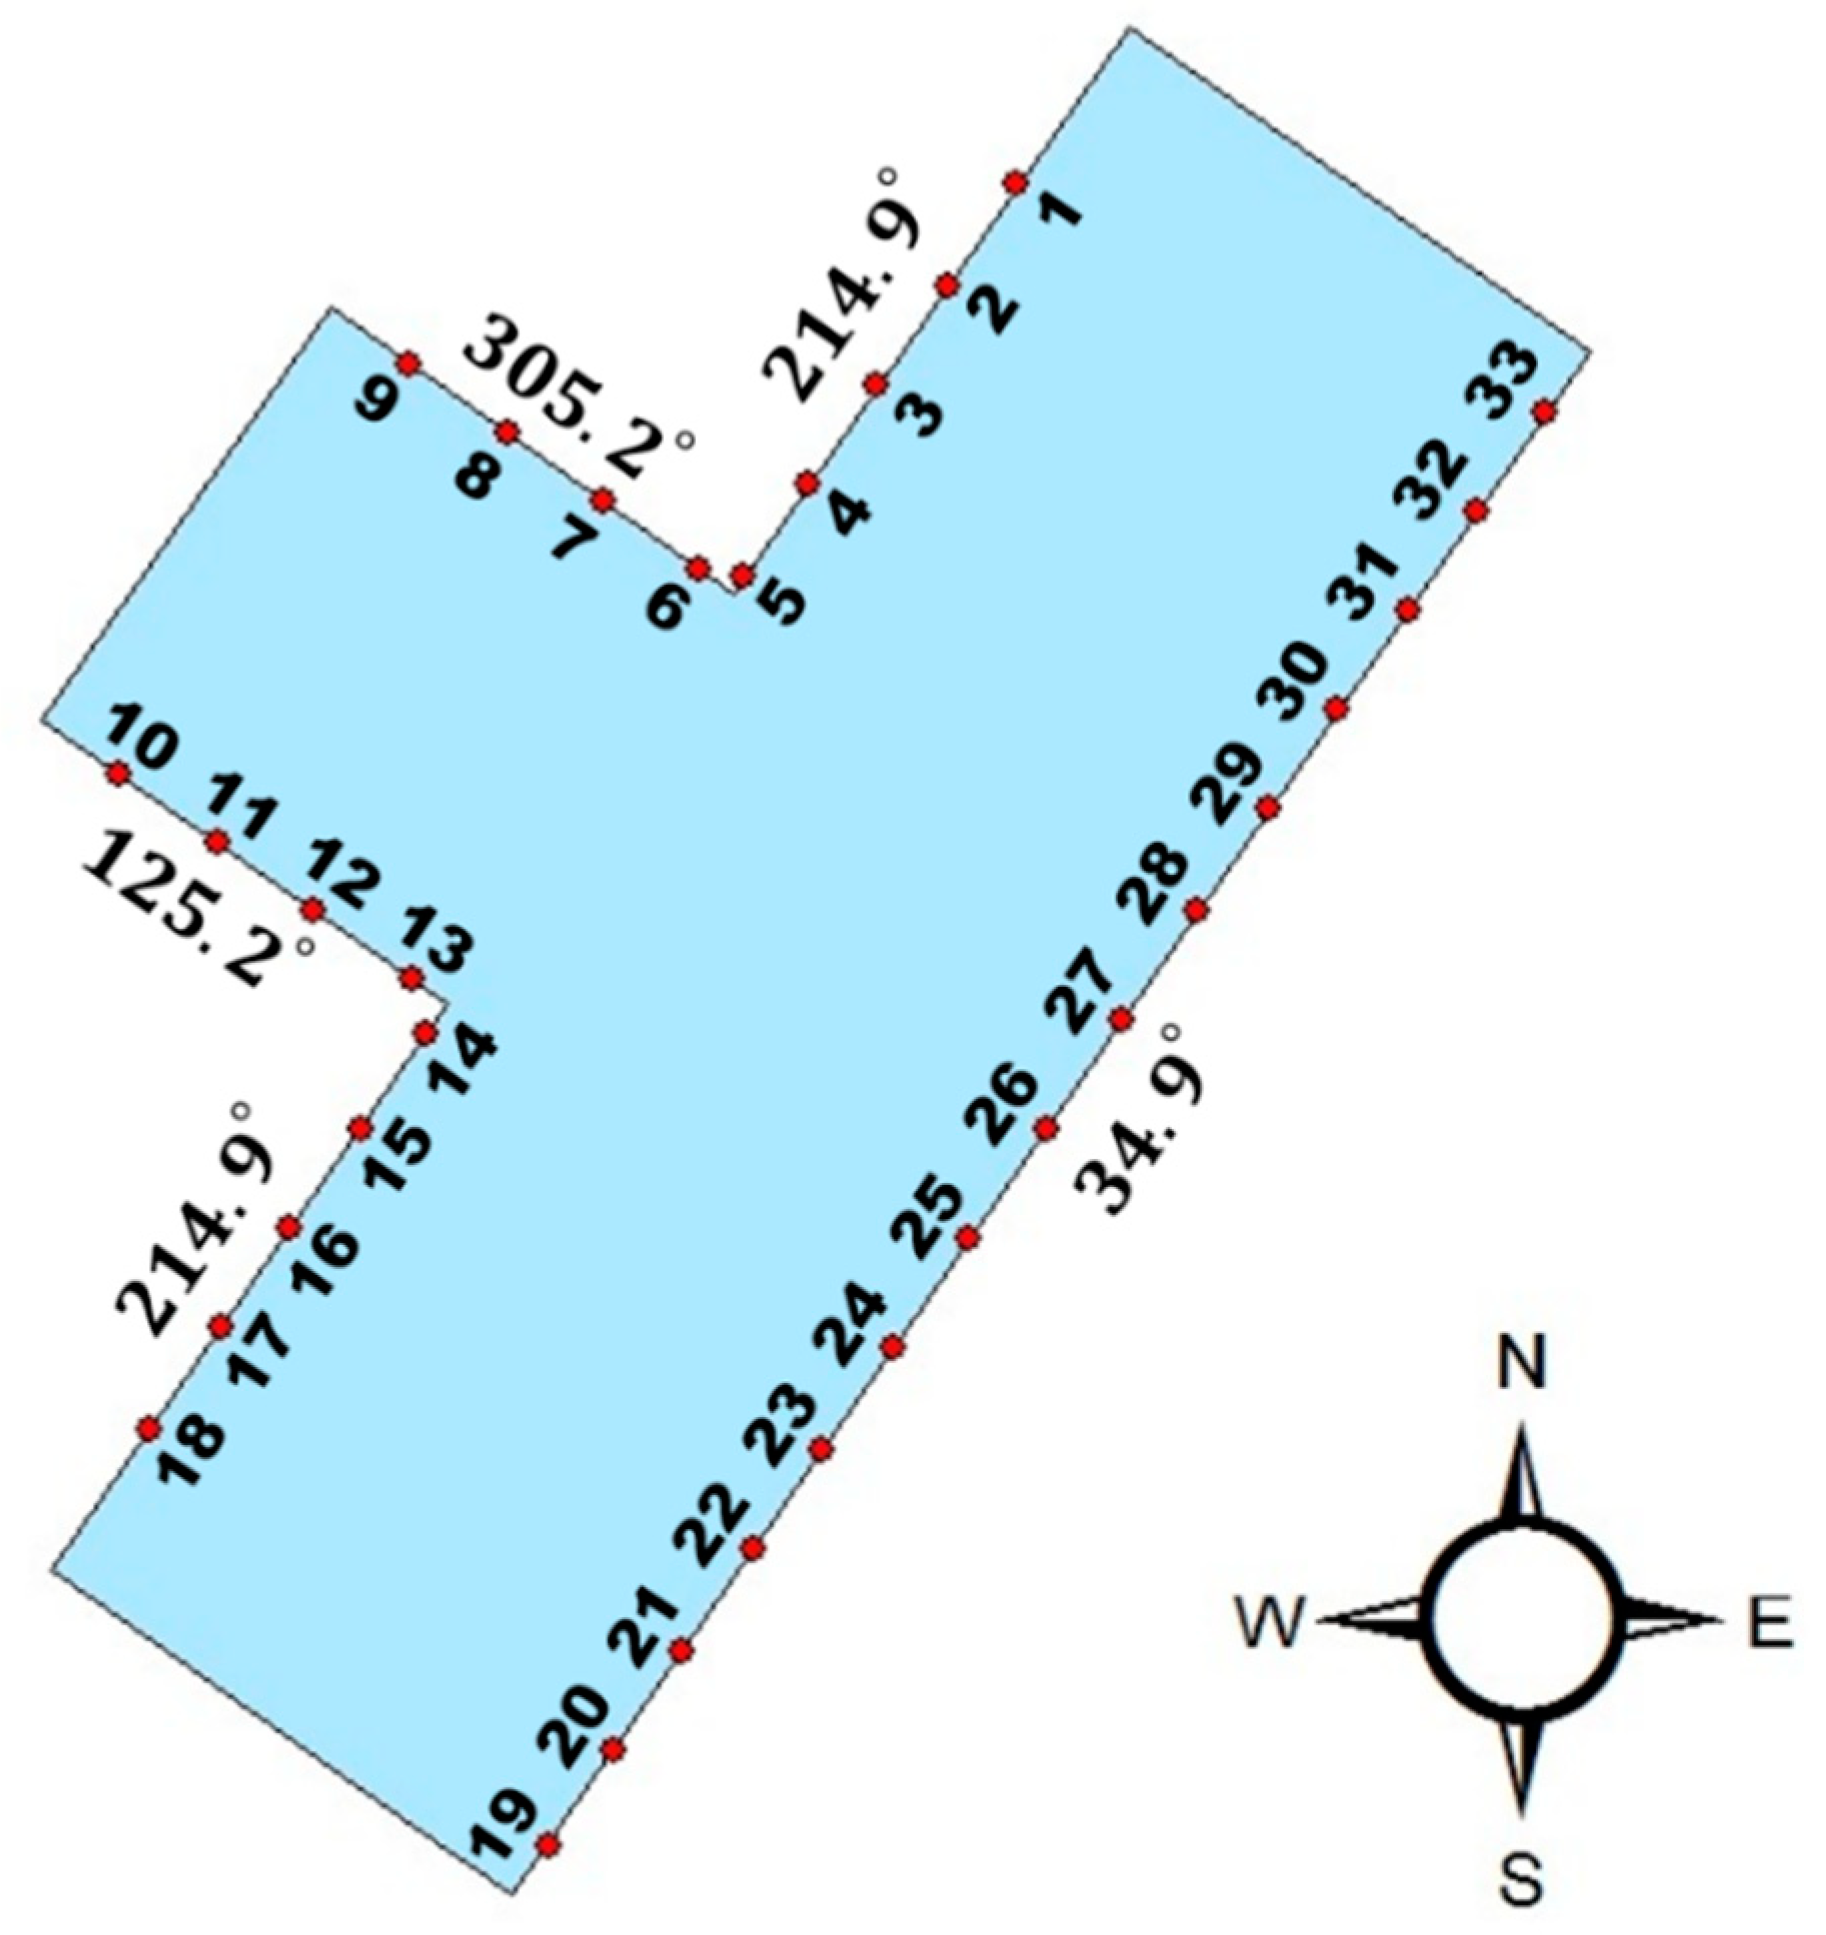
3.1. Description
3.2. Preconditions
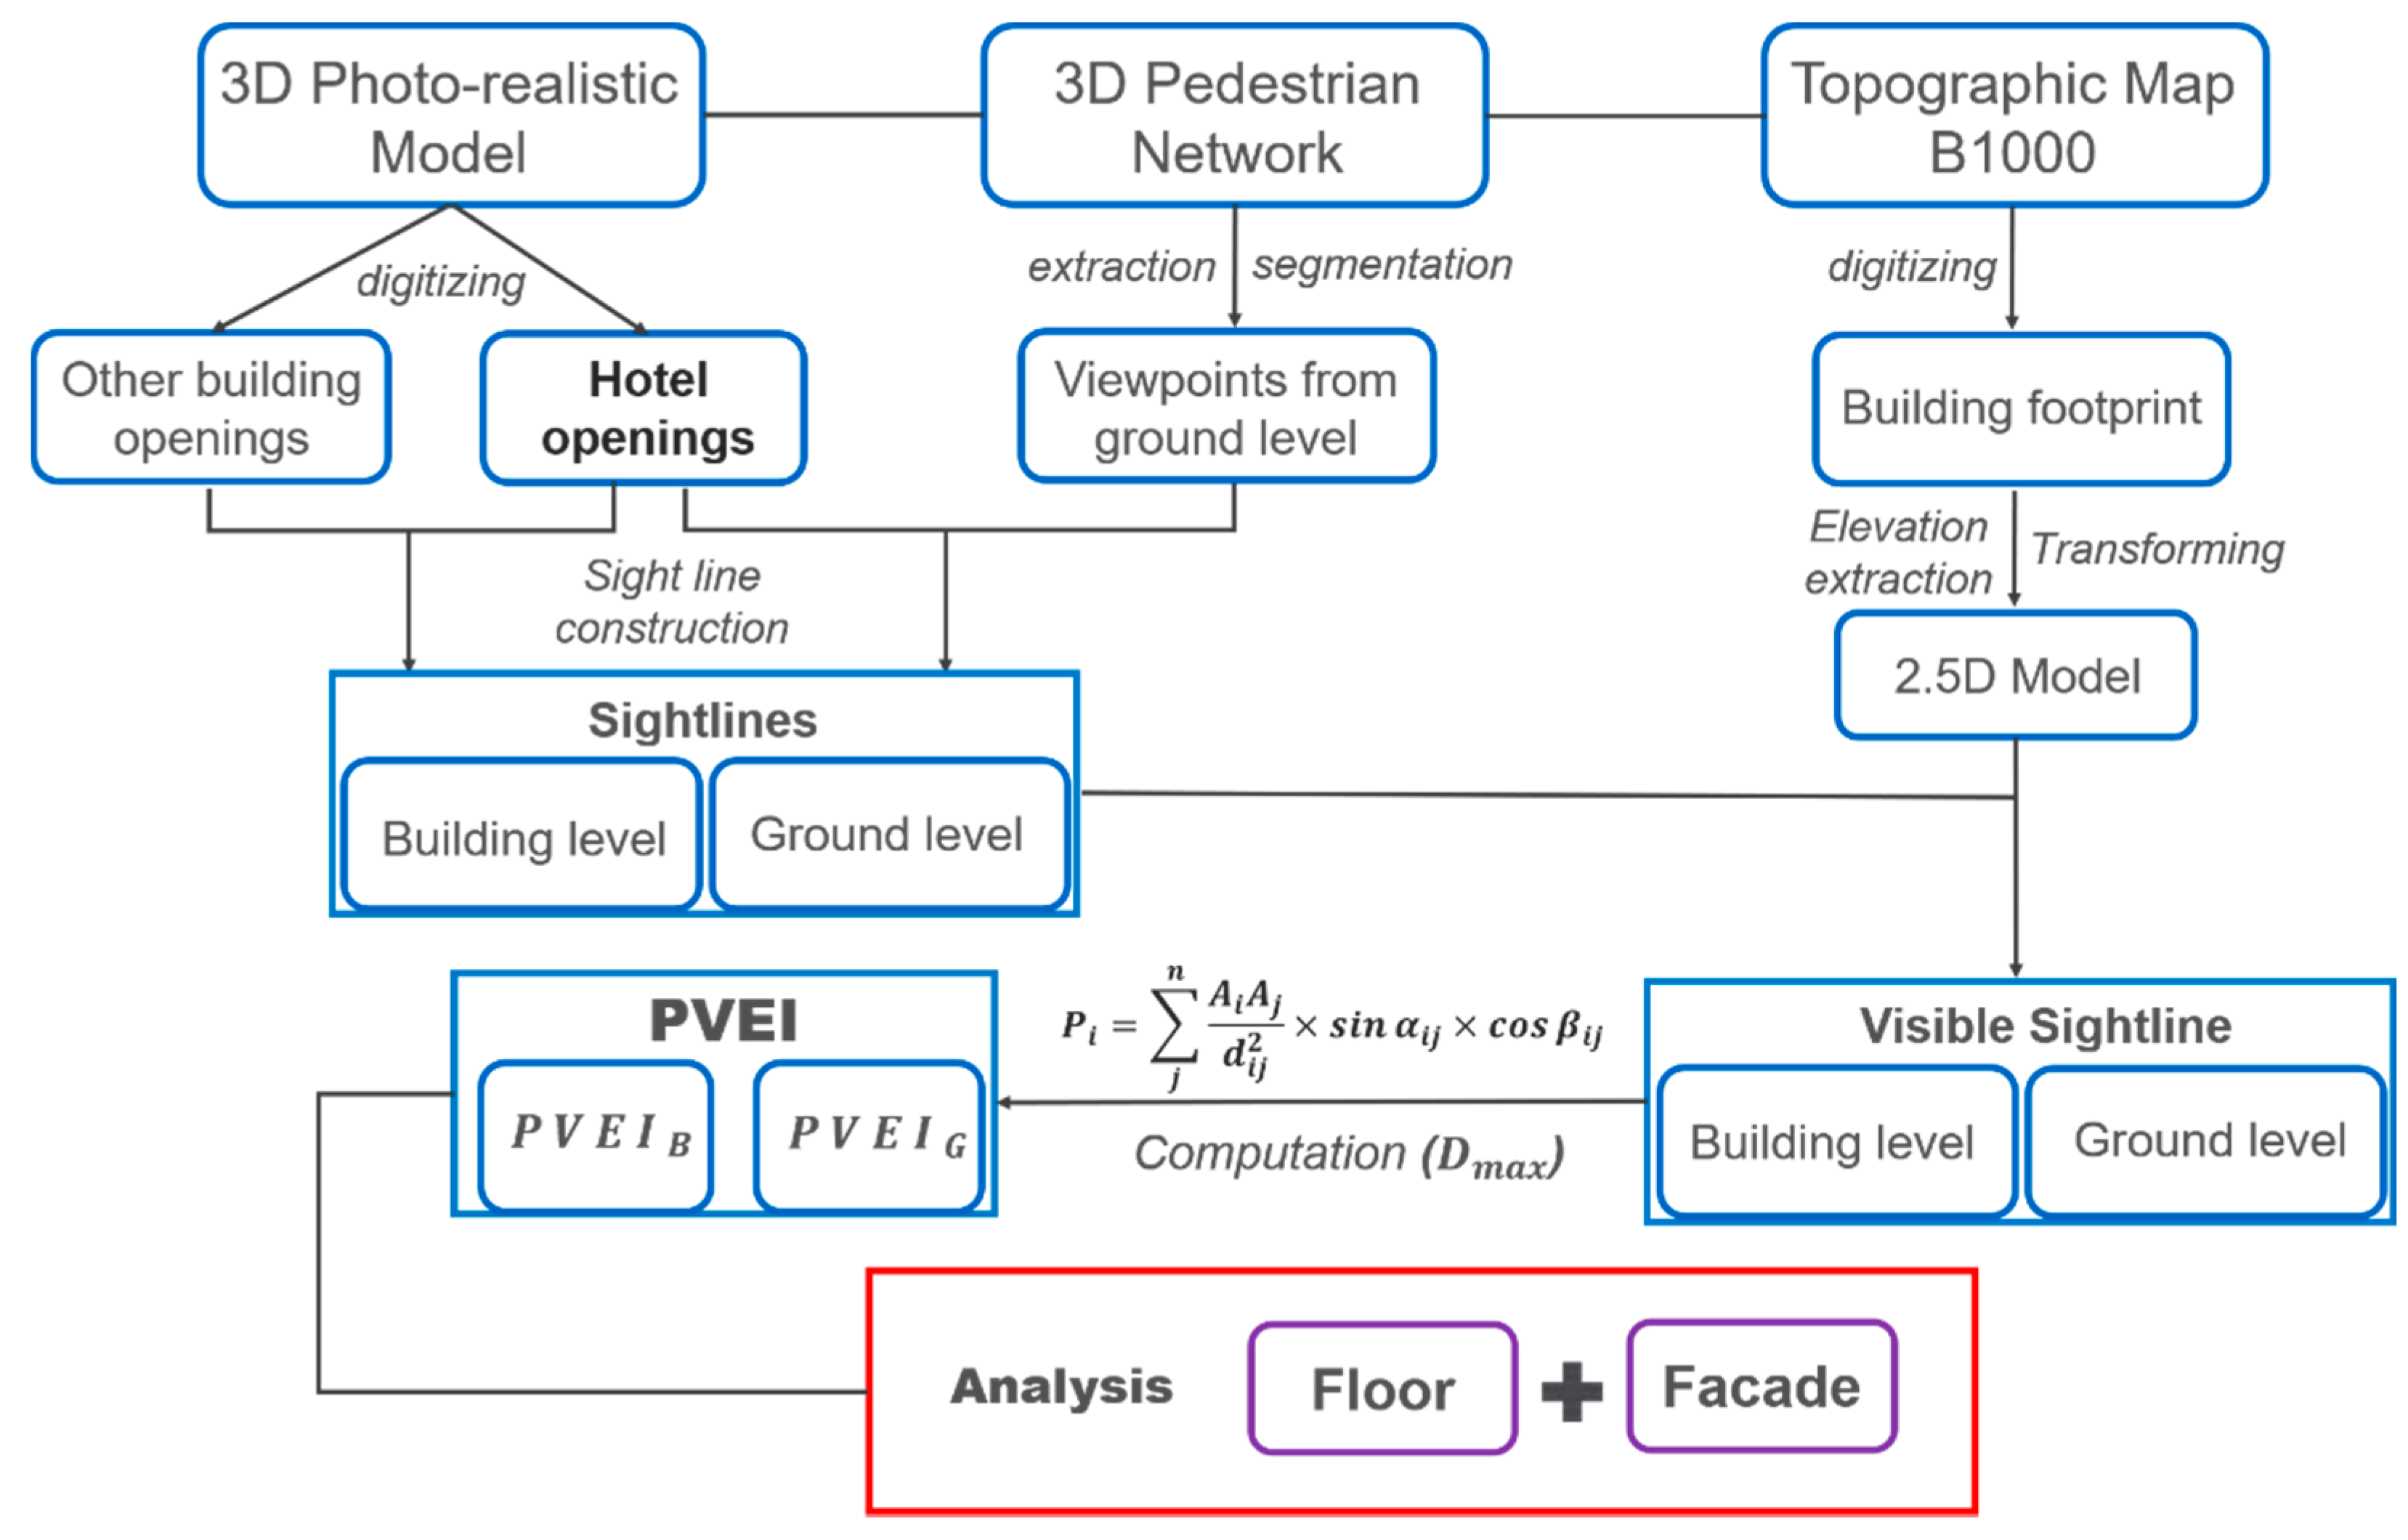
3.3. Preprocessing
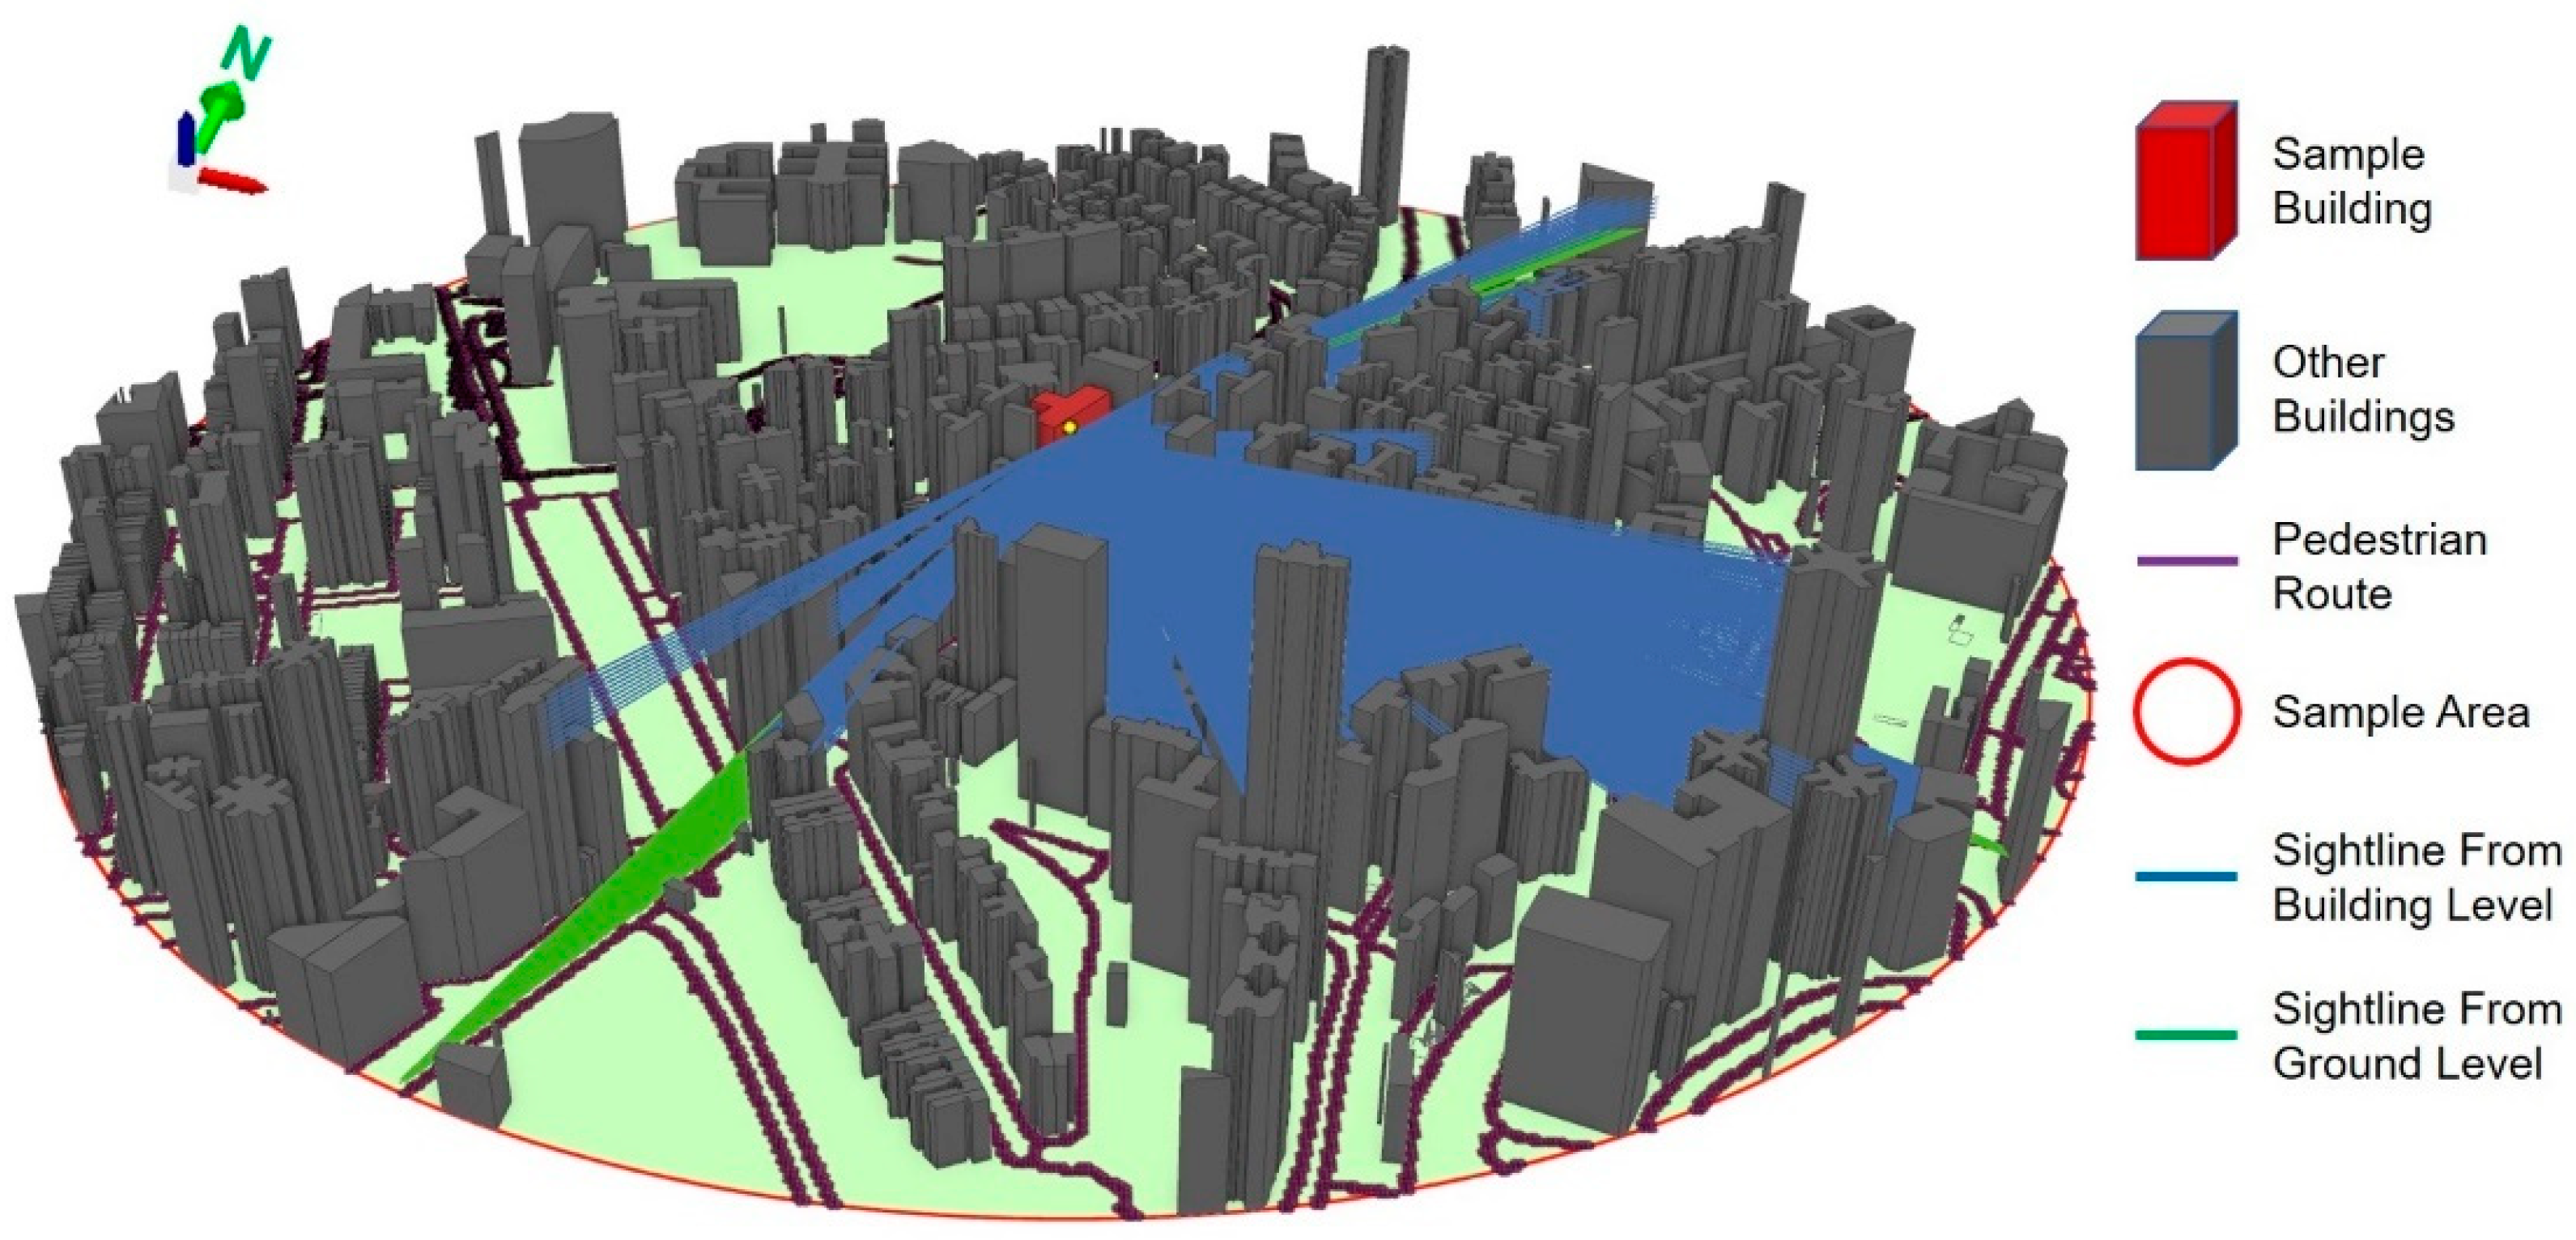
3.4. Procedure for Deriving the Potential Visual Exposure Index
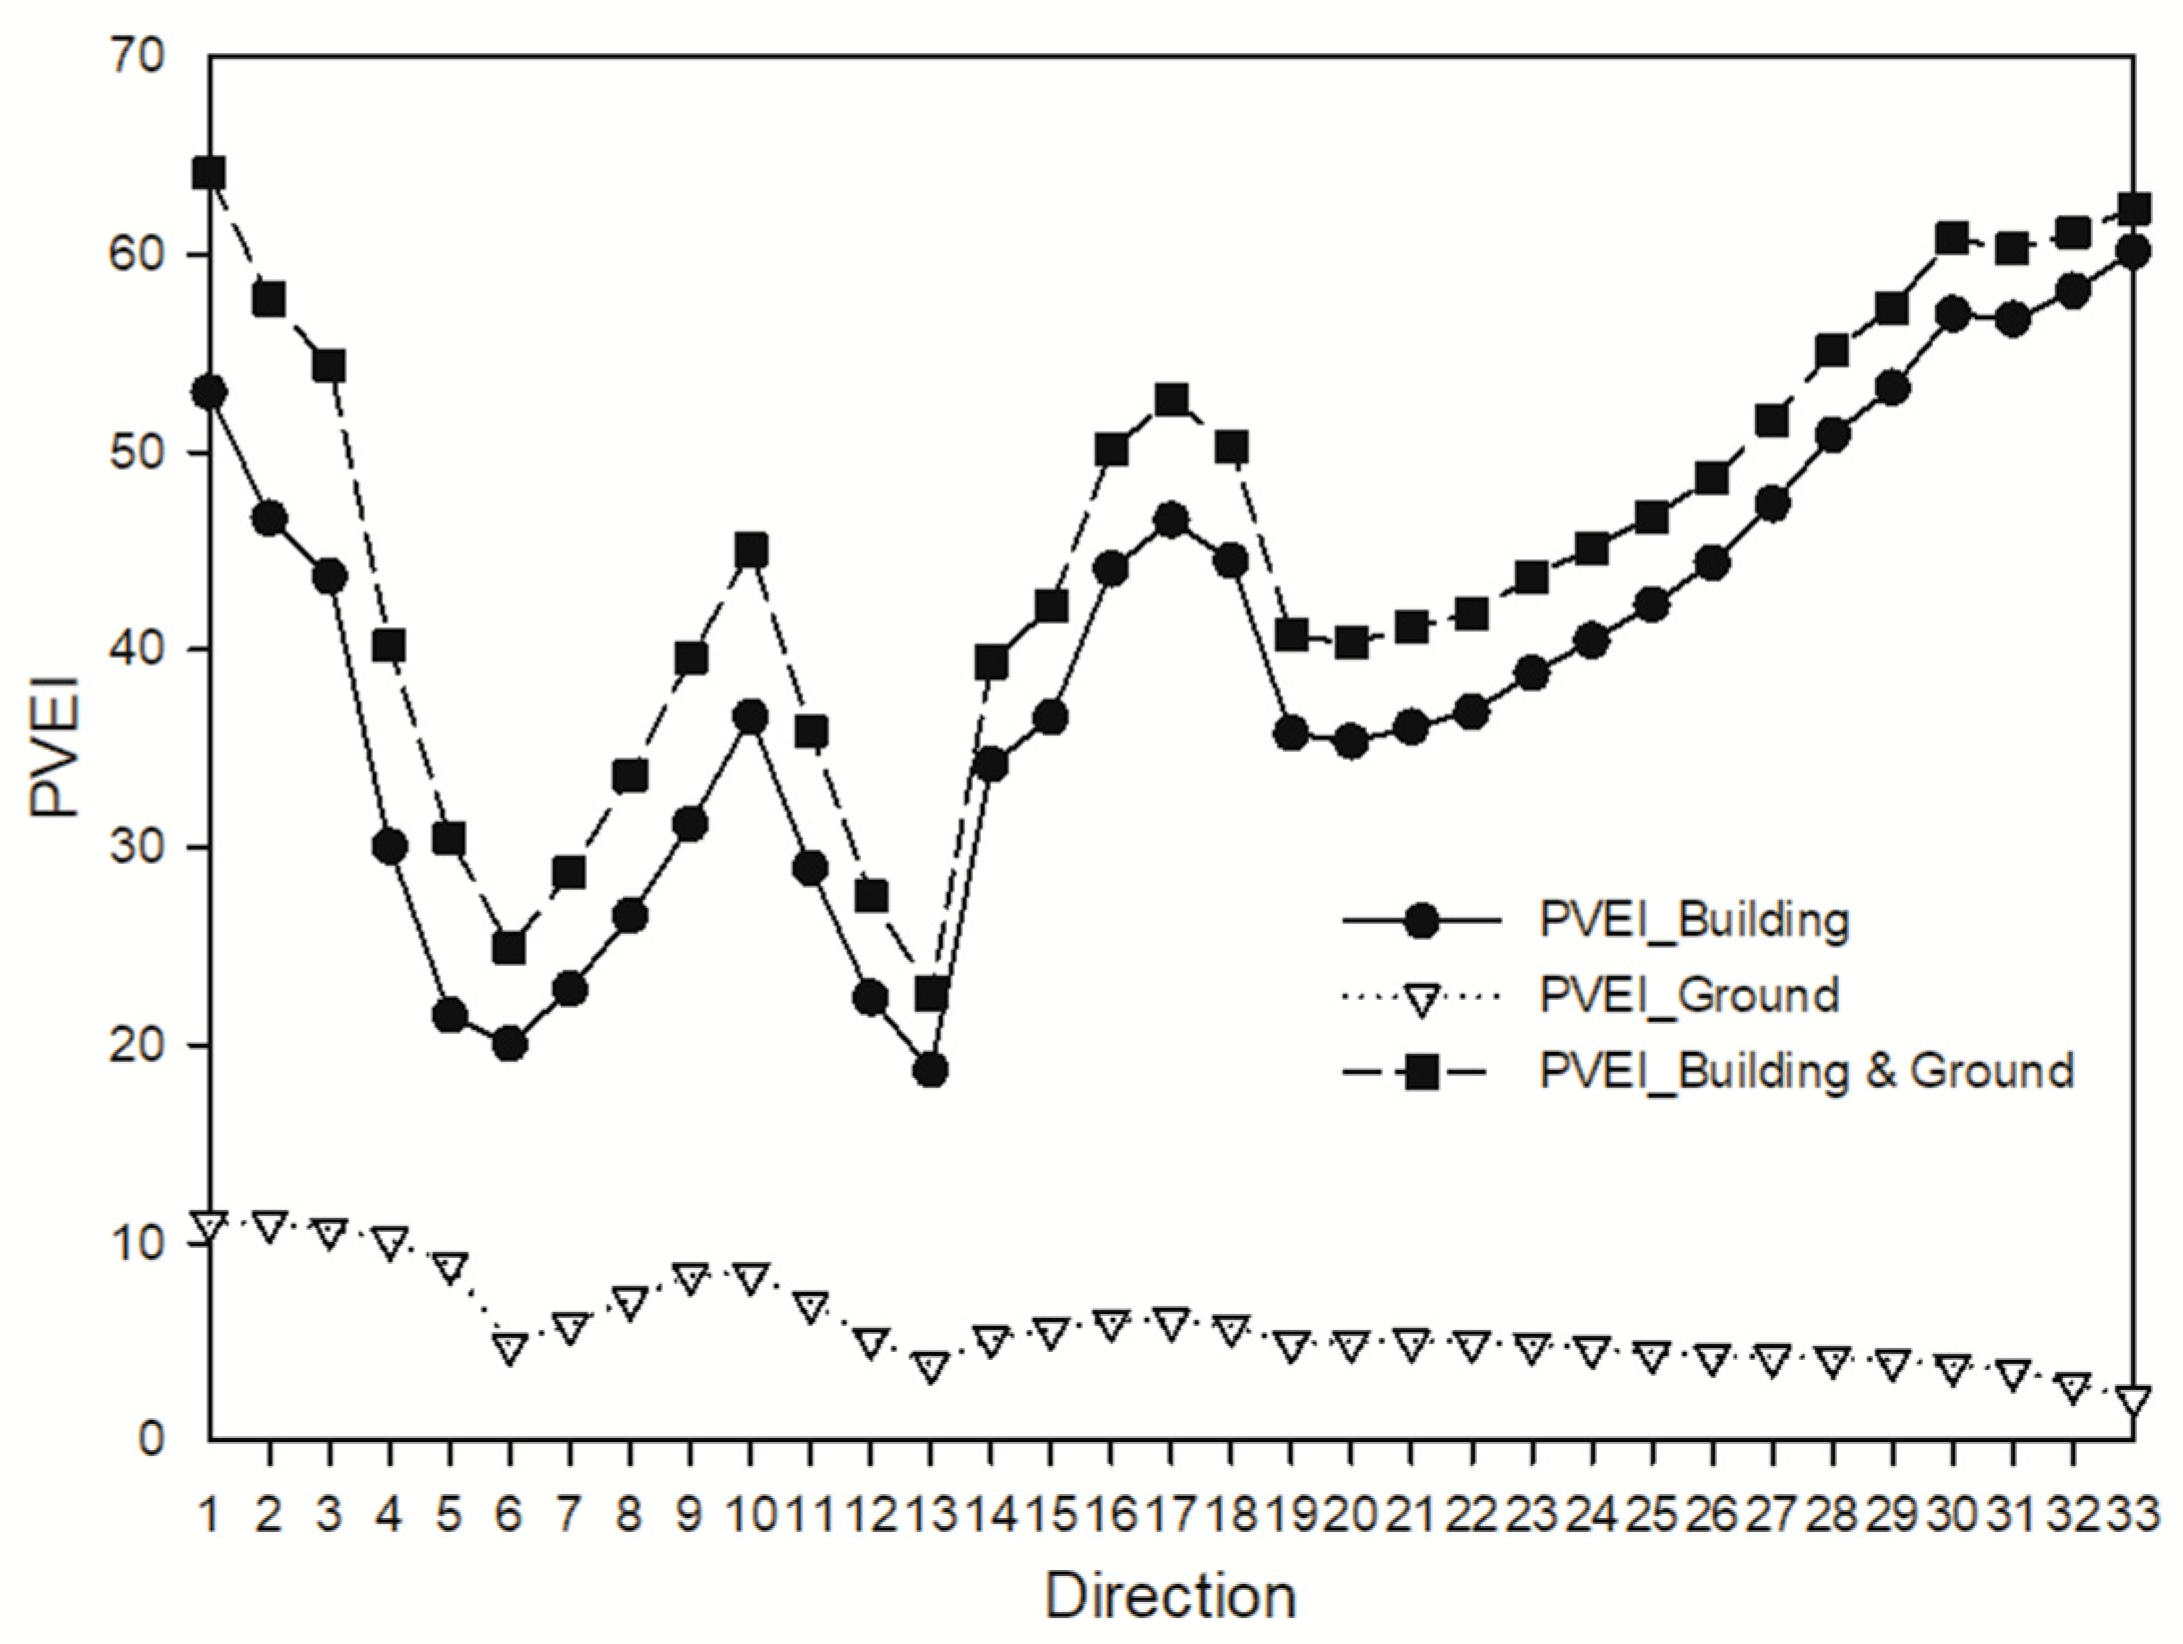
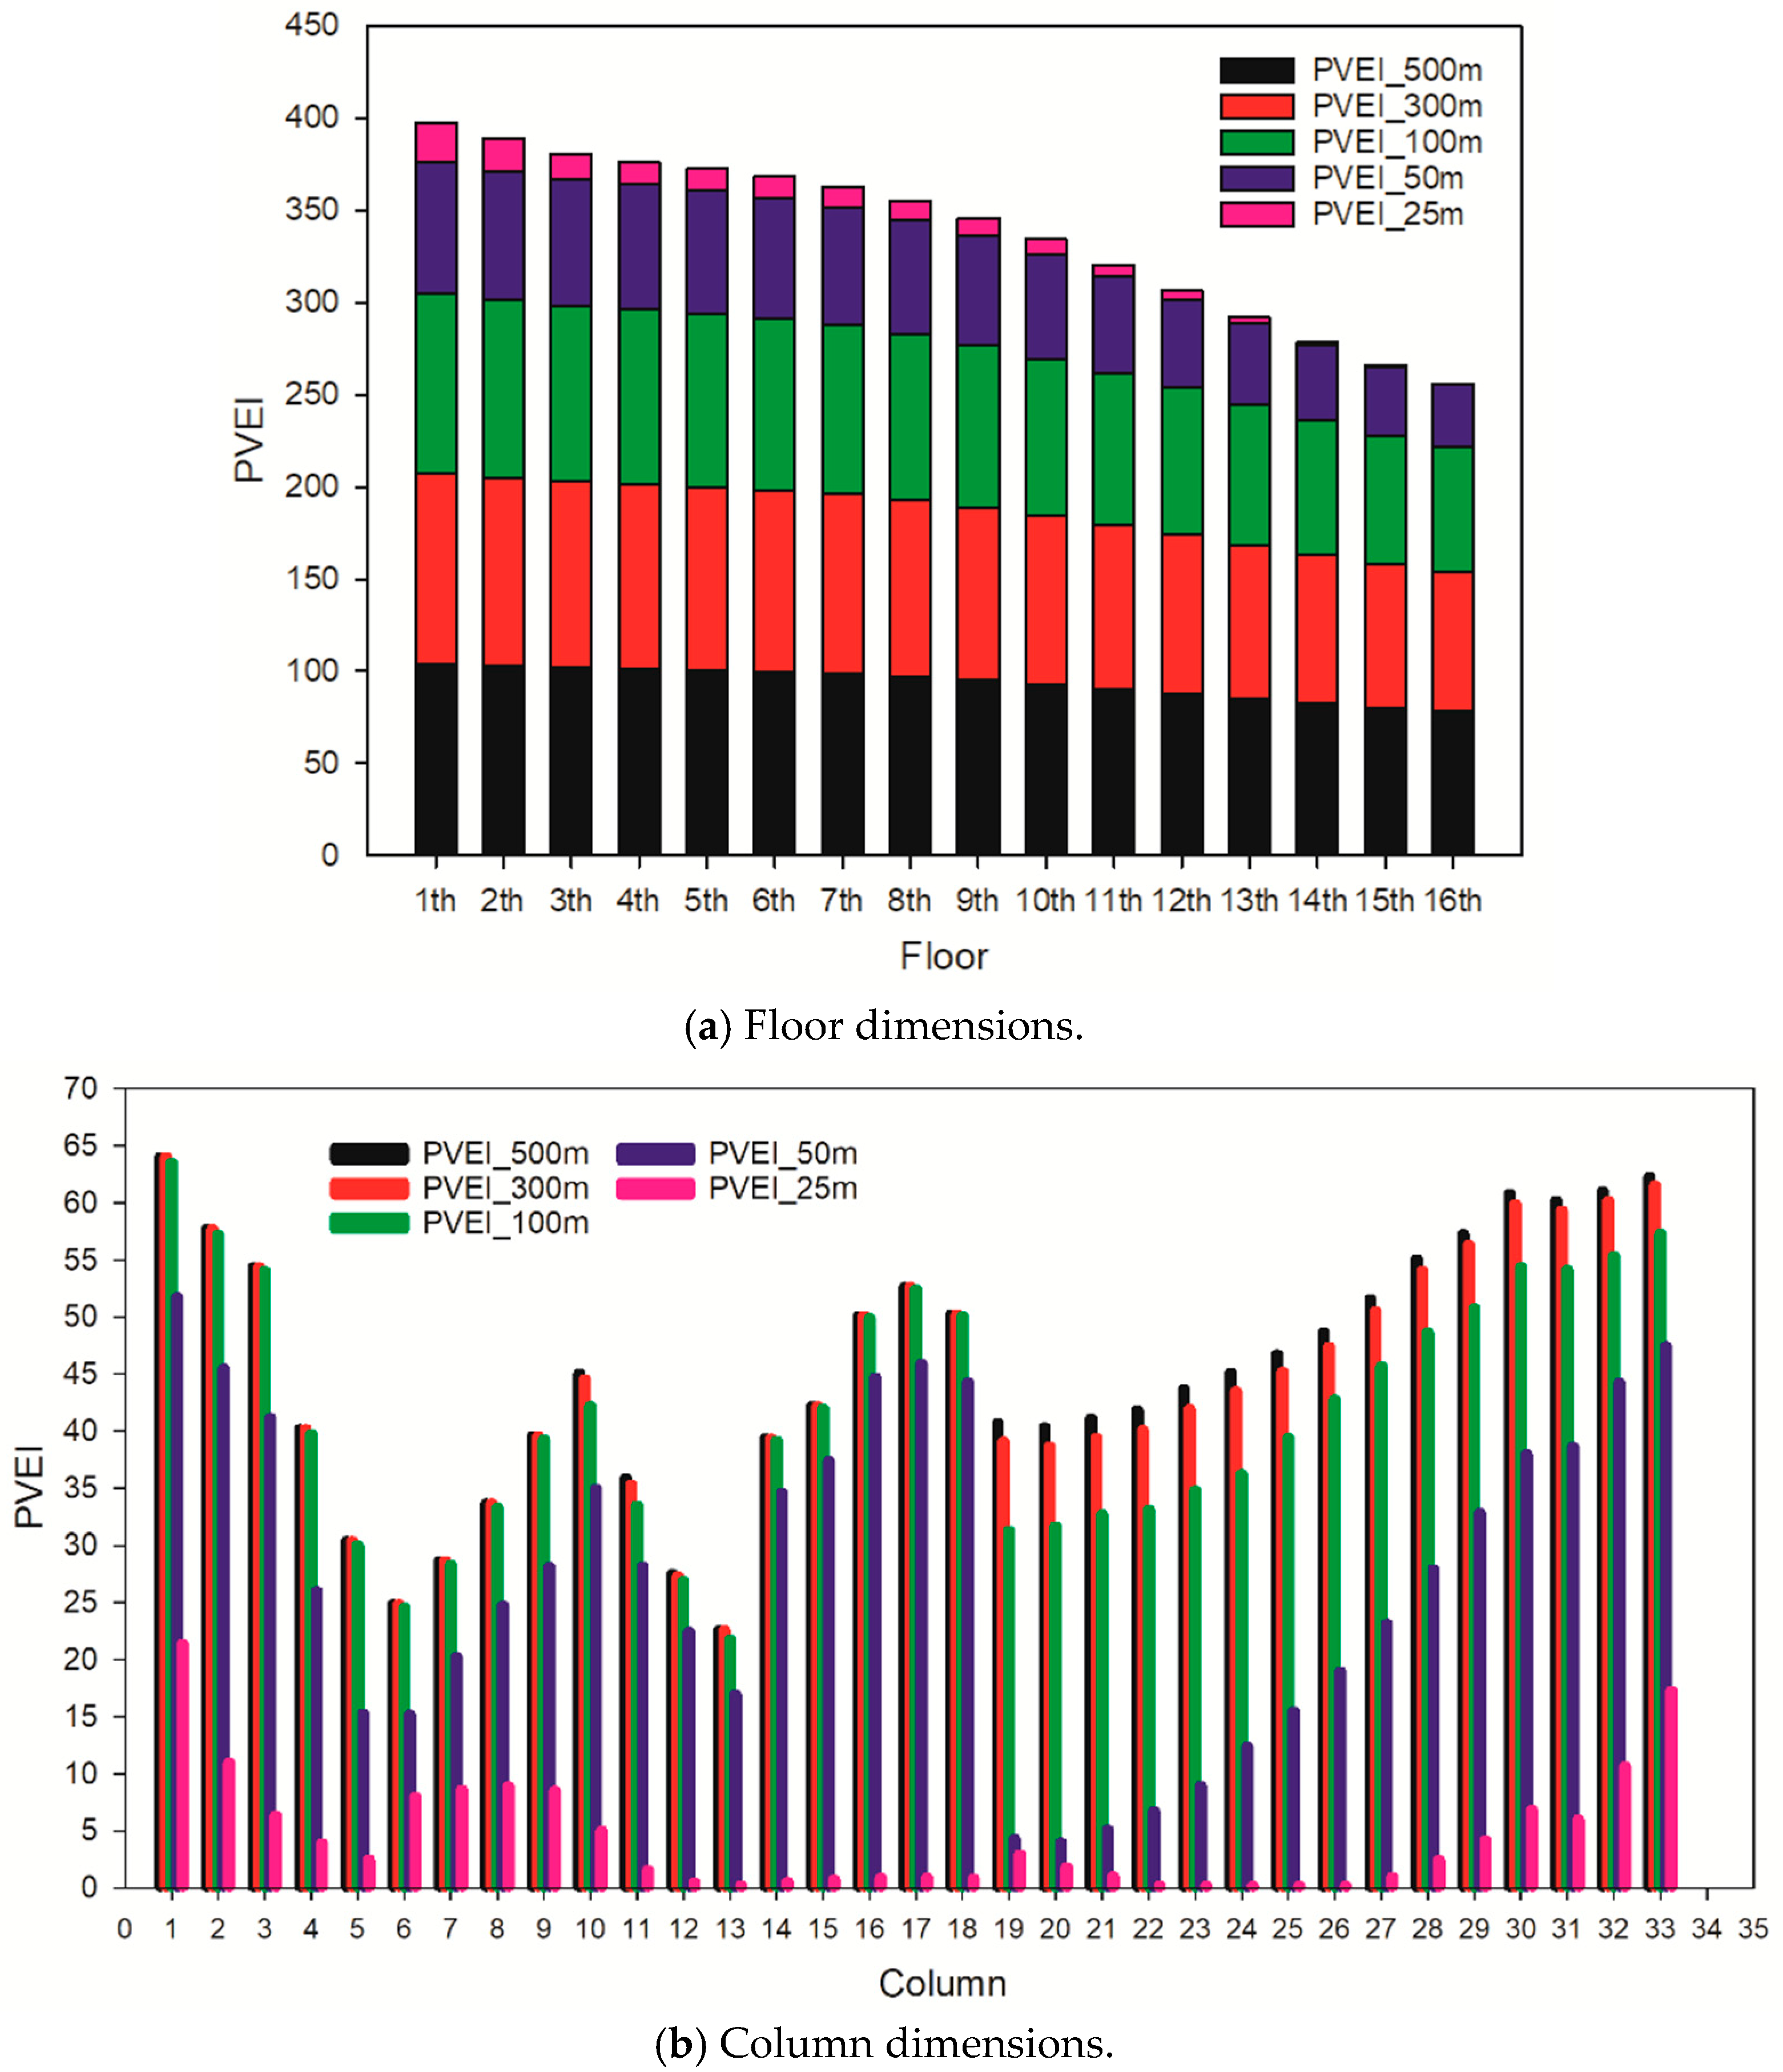
4. Results
5. Discussion
5.1. Determination of the Maximum View Distance in the Model
5.2. Impact Factors on PVEI
5.3. A Further Development Required for Deriving a Standard PVEI
6. Conclusions
Author Contributions
Funding
Institutional Review Board Statement
Informed Consent Statement
Data Availability Statement
Acknowledgments
Conflicts of Interest
References
- Arriaza, M.; Cañas-Ortega, J.F.; Cañas-Madueño, J.A.; Ruiz-Aviles, P. Assessing the visual quality of rural landscapes. Landsc. Urban Plan. 2004, 69, 115–125. [Google Scholar] [CrossRef]
- Abd-Alhamid, F.; Kent, M.; Calautit, J.; Wu, Y. Evaluating the impact of viewing location on view perception using a virtual environment. Build. Environ. 2020, 180, 106932. [Google Scholar] [CrossRef]
- Yang, J.; Zhao, L.; McBride, J.; Gong, P. Can you see green? Assessing the visibility of urban forests in cities. Landsc. Urban Plan. 2009, 91, 97–104. [Google Scholar] [CrossRef]
- Yu, S.; Yu, B.; Song, W.; Wu, B.; Zhou, J.; Huang, Y.; Wu, J.; Zhao, F.; Mao, W. View-based greenery: A three-dimensional assessment of city buildings’ green visibility using Floor Green View Index. Landsc. Urban Plan. 2016, 152, 13–26. [Google Scholar] [CrossRef]
- Falfán, I.; Muñoz-Robles, C.A.; Bonilla-Moheno, M.; MacGregor-Fors, I. Can you really see ‘green’? Assessing physical and self-reported measurements of urban greenery. Urban For. Urban Green. 2018, 36, 13–21. [Google Scholar] [CrossRef]
- Chen, J.; Zhou, C.; Li, F. Quantifying the green view indicator for assessing urban greening quality: An analysis based on Internet-crawling street view data. Ecol. Indic. 2020, 113, 106192. [Google Scholar] [CrossRef]
- Zhang, J.; Cheng, Y.; Li, H.; Wan, Y.; Zhao, B. Deciphering the changes in residential exposure to green spaces: The case of a rapidly urbanizing metropolitan region. Build. Environ. 2021, 188, 107508. [Google Scholar] [CrossRef]
- Bulut, Z.; Yilmaz, H. Determination of waterscape beauties through visual quality assessment method. Environ. Monit. Assess. 2009, 154, 459–468. [Google Scholar] [CrossRef] [PubMed]
- Alphan, H.; Sonmez, F. Mapping availability of sea view for potential building development areas. Environ. Monit. Assess. 2015, 187, 413. [Google Scholar] [CrossRef] [PubMed]
- Lin, L.; Homma, R.; Iki, K. Preferences for a lake landscape: Effects of building height and lake width. Environ. Impact Assess. Rev. 2018, 70, 22–33. [Google Scholar] [CrossRef]
- Alphan, H.; Aşur, F. Geospatial analysis of lake scenery as an indicator for the environment: The City of Van (Turkey) and its surroundings. Environ. Sustain. Indic. 2021, 9, 100091. [Google Scholar] [CrossRef]
- Qi, T.; Zhang, G.; Wang, Y.; Liu, C.; Li, X. Research on landscape quality of country parks in Beijing as based on visual and audible senses. Urban For. Urban Green. 2017, 26, 124–138. [Google Scholar] [CrossRef]
- Gungor, S.; Polat, A.T. Relationship between visual quality and landscape characteristics in urban parks. J. Environ. Prot. Ecol. 2018, 19, 939–948. [Google Scholar] [CrossRef]
- Heydaripour, O.; Behmaneshnia, F.; Talebian, E.; Shahi, P.H. A survey on privacy of residential life in contemporary apartments in Iran. Int. J. Sci. Study 2017, 5, 254–263. [Google Scholar] [CrossRef]
- Al-Birawi, S.; Adawi, A.A.D. Privacy criterions and elements in Islamic residential architecture. Jordan J. Islamic Stud. 2019, 15, 402–421. [Google Scholar] [CrossRef]
- Rapoport, A. Culture, Architecture, and Design; Locke Science Publishing Company, Inc.: Chicago, IL, USA, 2005. [Google Scholar]
- Shach-Pinsly, D.; Fisher-Gewirtzman, D.; Burt, M. ‘Visual exposure’ analysis model: A comparative evaluation of three case studies. Urban Design Int. 2007, 12, 155–168. [Google Scholar] [CrossRef]
- Al-Kodmany, K. Residential visual privacy: Traditional and modern architecture and urban design. J. Urban Des. 1999, 4, 283–311. [Google Scholar] [CrossRef]
- Tomah, A.N. Visual privacy in residential areas: Amendment of building regulations. Proc. Inst. Civ. Eng. Urban Des. Plan. 2012, 165, 43–53. [Google Scholar] [CrossRef]
- Hashim, A.H.; Rahim, Z.A.; Rashid, S.N.S.A.; Yahaya, N. Visual privacy and family intimacy: A case study of malay inhabitants living in two-storey low-cost terrace housing. Environ. Plan. B Plan. Des. 2016, 33, 301–318. [Google Scholar] [CrossRef]
- Georgiou, M. Architectural Privacy: A Topological Approach to Relational Design Problems. Master’s Thesis, Bartlett School of Graduate Studies, University College London, London, UK, 2006. [Google Scholar]
- Indraprastha, A.; Shinozaki, M. Computational models for measuring spatial quality of interior design in virtual environment. Build. Environ. 2012, 49, 67–85. [Google Scholar] [CrossRef]
- Othman, Z.; Buys, L.; Aird, R. Observing privacy, modesty and hospitality in the home domain: Three case studies of Muslim homes in Brisbane, Australia. Int. J. Archit. Res. 2014, 8, 266–283. [Google Scholar] [CrossRef] [Green Version]
- Shepperson, M. Visibility, privacy, and missing windows: Lighting domestic space in ancient Mesopotamia. In The Oxford Handbook of Light in Archaeology; Papadopoulos, C., Moyes, H., Eds.; Oxford University Press: Oxford, UK, 2017. [Google Scholar]
- Sipahi, A. Window-conflicts in the Ottoman Empire and Turkey: Visual privacy, materiality and right to the city. Middle East. Stud. 2016, 52, 588–604. [Google Scholar] [CrossRef]
- Hwang, J.H.; Lee, H. Parametric model for window design based on prospect-refuge measurement in residential environment. Sustainability 2018, 10, 3888. [Google Scholar] [CrossRef] [Green Version]
- Alelwani, R.; Ahmad, M.W.; Rezgui, Y. Public perception of vernacular architecture in the Arabian Peninsula: The case of rawshan. Buildings 2020, 10, 151. [Google Scholar] [CrossRef]
- Liu, A.M.M. Residential satisfaction in housing estates: A Hong Kong perspective. Autom. Constr. 1999, 8, 511–524. [Google Scholar] [CrossRef]
- Kim, J.; De Dear, R. Workspace satisfaction: The privacy-communication trade-off in open-plan offices. J. Environ. Psychol. 2013, 36, 18–26. [Google Scholar] [CrossRef] [Green Version]
- Ibem, E.O.; Opoko, A.P.; Adeboye, A.B.; Amole, D. Performance evaluation of residential buildings in public housing estates in Ogun State, Nigeria: Users’ satisfaction perspective. Front. Archit. Res. 2013, 2, 178–190. [Google Scholar] [CrossRef] [Green Version]
- Hwang, J.Y.; Lee, H. 3D visual simulation and numerical measurement of privacy in traditional Korean palace. In Proceedings of the 22nd International Conference of the Association for Computer-Aided Architectural Design Research in Asia (CAADRIA), Hong Kong, China, 5–8 April 2017. [Google Scholar]
- Benedikt, M.L. To take hold of space: Isovists and isovist fields. Environ. Plan. B Plan. Des. 1979, 6, 47–65. [Google Scholar] [CrossRef]
- Morello, E.; Ratti, C. A digital image of the city: 3D isovists in Lynch’s urban analysis. Environ. Plan. B Plan. Des. 2009, 36, 837–853. [Google Scholar] [CrossRef] [Green Version]
- Alkhazmi, H.M.; Esin, N. Investigating the visual privacy on houses layouts in traditional desert settlement of Ghadames city-Libya-by using space syntax analysis. Int. J. Appl. Eng. Res. 2017, 12, 8941–8951. [Google Scholar]
- Lonergan, C.; Hedley, N. Unpacking isovists: A framework for 3D spatial visibility analysis. Cartogr. Geogr. Inf. Sci. 2015, 43, 87–102. [Google Scholar] [CrossRef]
- Llobera, M. Extending GIS-based visual analysis: The concept of visualscapes. Int. J. Geogr. Inf. Sci. 2003, 17, 25–48. [Google Scholar] [CrossRef]
- Shach-Pinsly, D. Visual openness and visual exposure analysis models used as evaluation tools during the urban design development process. J. Urban. 2010, 3, 161–184. [Google Scholar] [CrossRef]
- Kumsap, C.; Borne, F.; Moss, D. The technique of distance decayed visibility for forest landscape visualization. Int. J. Geogr. Inf. Sci. 2005, 19, 723–744. [Google Scholar] [CrossRef]
- Taylor, P.J. Distance decay in spatial interactions. Concepts Tech. Mod. Geogr. 1975, 2, 35. [Google Scholar]
- Chen, Y. The distance-decay function of geographical gravity model: Power law or exponential law? Chaos Solitons Fractals 2015, 77, 174–189. [Google Scholar] [CrossRef] [Green Version]
- An, K.; Ko, H.; Kim, C. Development and implementation of visual exposure indicator for residential development. Int. J. Smart Home 2015, 9, 1–10. [Google Scholar] [CrossRef]
- Tara, A.; Lawson, G.; Renata, A. Measuring magnitude of change by high-rise buildings in visual amenity conflicts in Brisbane. Landsc. Urban Plan. 2021, 205, 103930. [Google Scholar] [CrossRef]
- Census and Statistics Department. Demographic Trends in Hong Kong 1986–2016. Statistical Reports; 2017. Available online: https://www.censtatd.gov.hk/en/EIndexbySubject.html?pcode=B1120017&scode=150 (accessed on 7 May 2021).
- Tang, W.S.; Lee, J.W.Y.; Hui, T.W.; Yip, M.K.C. The “Urban density” question in Hong Kong: From absolute space to social processes. City Cult. Soc. 2019, 17, 46–53. [Google Scholar] [CrossRef]
- Merry, S.E. Crowding, conflict, and neighborhood regulation. In Human Behavior and Environment; Springer: Boston, MA, USA, 1987; Volume 9, pp. 35–68. [Google Scholar]
- Mitrany, M. Subjective Housing Density and the Housing Context. Ph.D. Thesis, Department of Architecture and Town Planning, The Technion-IIT, Haifa, Israel, 2001. [Google Scholar]
- Day, L.L. Choosing a house: The relationship between dwelling type, perception of privacy and residential satisfaction. J. Plan. Educ. Res. 2016, 19, 265–275. [Google Scholar] [CrossRef]


Publisher’s Note: MDPI stays neutral with regard to jurisdictional claims in published maps and institutional affiliations. |
© 2021 by the authors. Licensee MDPI, Basel, Switzerland. This article is an open access article distributed under the terms and conditions of the Creative Commons Attribution (CC BY) license (https://creativecommons.org/licenses/by/4.0/).
Share and Cite
Zheng, H.; Wu, B.; Wei, H.; Yan, J.; Zhu, J. A Quantitative Method for Evaluation of Visual Privacy in Residential Environments. Buildings 2021, 11, 272. https://doi.org/10.3390/buildings11070272
Zheng H, Wu B, Wei H, Yan J, Zhu J. A Quantitative Method for Evaluation of Visual Privacy in Residential Environments. Buildings. 2021; 11(7):272. https://doi.org/10.3390/buildings11070272
Chicago/Turabian StyleZheng, He, Bo Wu, Heyi Wei, Jinbiao Yan, and Jianfeng Zhu. 2021. "A Quantitative Method for Evaluation of Visual Privacy in Residential Environments" Buildings 11, no. 7: 272. https://doi.org/10.3390/buildings11070272