1. Introduction
In less than two years since the coronavirus disease 2019 (COVID-19) emerged, the pandemic has changed how we live, work, study, and interact as social distancing guidelines have led to a more virtual world, both personally and professionally. This became a more severe concern when scientific data supported the possibility that the COVID-19 virus may be transmitted by aerosols (so-called airborne transmission) [
1]. It was highlighted that aerosol transmission may more likely occur in particular environments, such as indoor, crowded, and inadequately ventilated spaces, where the infected person(s) spend a relatively long period of time with others (e.g., over 30 min), such as classrooms, restaurants, choir practices, fitness classes, nightclubs, offices, and places of worship. Therefore, how to reduce the infection risks of airborne respiratory diseases in a public place becomes an urgent task for epidemiologists and public health experts.
The results in the survey study of Fabisiak et al. [
2] indicated that 55% of respondents will be afraid to use public spaces after the COVID-19 lockdown. Restrictions on the use of public spaces and physical distancing have been key policy measures to reduce the transmission of COVID-19 and protect public health [
3]. Despite the concerns and the difficulties faced throughout the pandemic, those who were committed to investigating the new approaches to infection prevention demonstrated that they have managed to find promising solutions in their studies. Air purifiers, as traditional air pollution purification equipment, exhibit an excellent potential to reduce the infection risk of airborne transmission [
4,
5,
6,
7]. The Centers for Disease Control and Prevention (CDC) of the U.S. has continued to update guidance on airborne transmission, with the most recent update occurring on December 8th, 2020, which stated “Portable HEPA (high-efficiency particulate absorbing) filtration units that combine a HEPA filter with a powered fan system are a great option for auxiliary air cleaning.” In one example, the CDC concluded that “Adding the portable HEPA unit increased the effective ventilation rate and improved room air mixing. This resulted in over a 75% reduction in time for the room to be cleared of potentially-infectious airborne particles.” [
4]. The American Society of Heating, Refrigerating and Air-Conditioning Engineers (ASHRAE) also provides some guidance on using portable air purifiers in confined spaces where ventilation is poor or where it is hard to keep social distancing, such as fitness centers, small public spaces, employee break rooms, or employee locker rooms [
5]. Meanwhile, the U.S. Environmental Protection Agency (EPA) says “Consider using portable air cleaners to supplement increased Heating, ventilation, and air conditioning (HVAC) system ventilation and filtration, especially in areas where adequate ventilation is difficult to achieve. Directing the airflow so that it does not blow directly from one person to another reduces the potential spread of droplets that may contain infectious viruses” [
6]. Furthermore, a few researchers have explored the use of air purifiers in specific rooms to reduce infection risks. For instance, Zhao et al. [
7] studied and suggested the application of an air purifier as a supplementary protective measure in dental clinics during the COVID-19 pandemic. To improve indoor domestic environments in future pandemics, urgent action should be taken around indoor air quality (IAQ) to protect residents from respiratory ailments [
8].
Air purifiers remove small particles/droplets that may carry viruses, whose efficiency is rated by the infiltration material. HEPA filters can theoretically remove at least 99.97% of dust, pollen, mold, bacteria, and any airborne particles with a size of 0.3 microns (µm). The diameter of 0.3 microns represents the worst case; particles of larger or smaller sizes are trapped with even higher efficiency. A pilot experiment showed that the flow of water mist into an air purifier inlet depended on the height of the source [
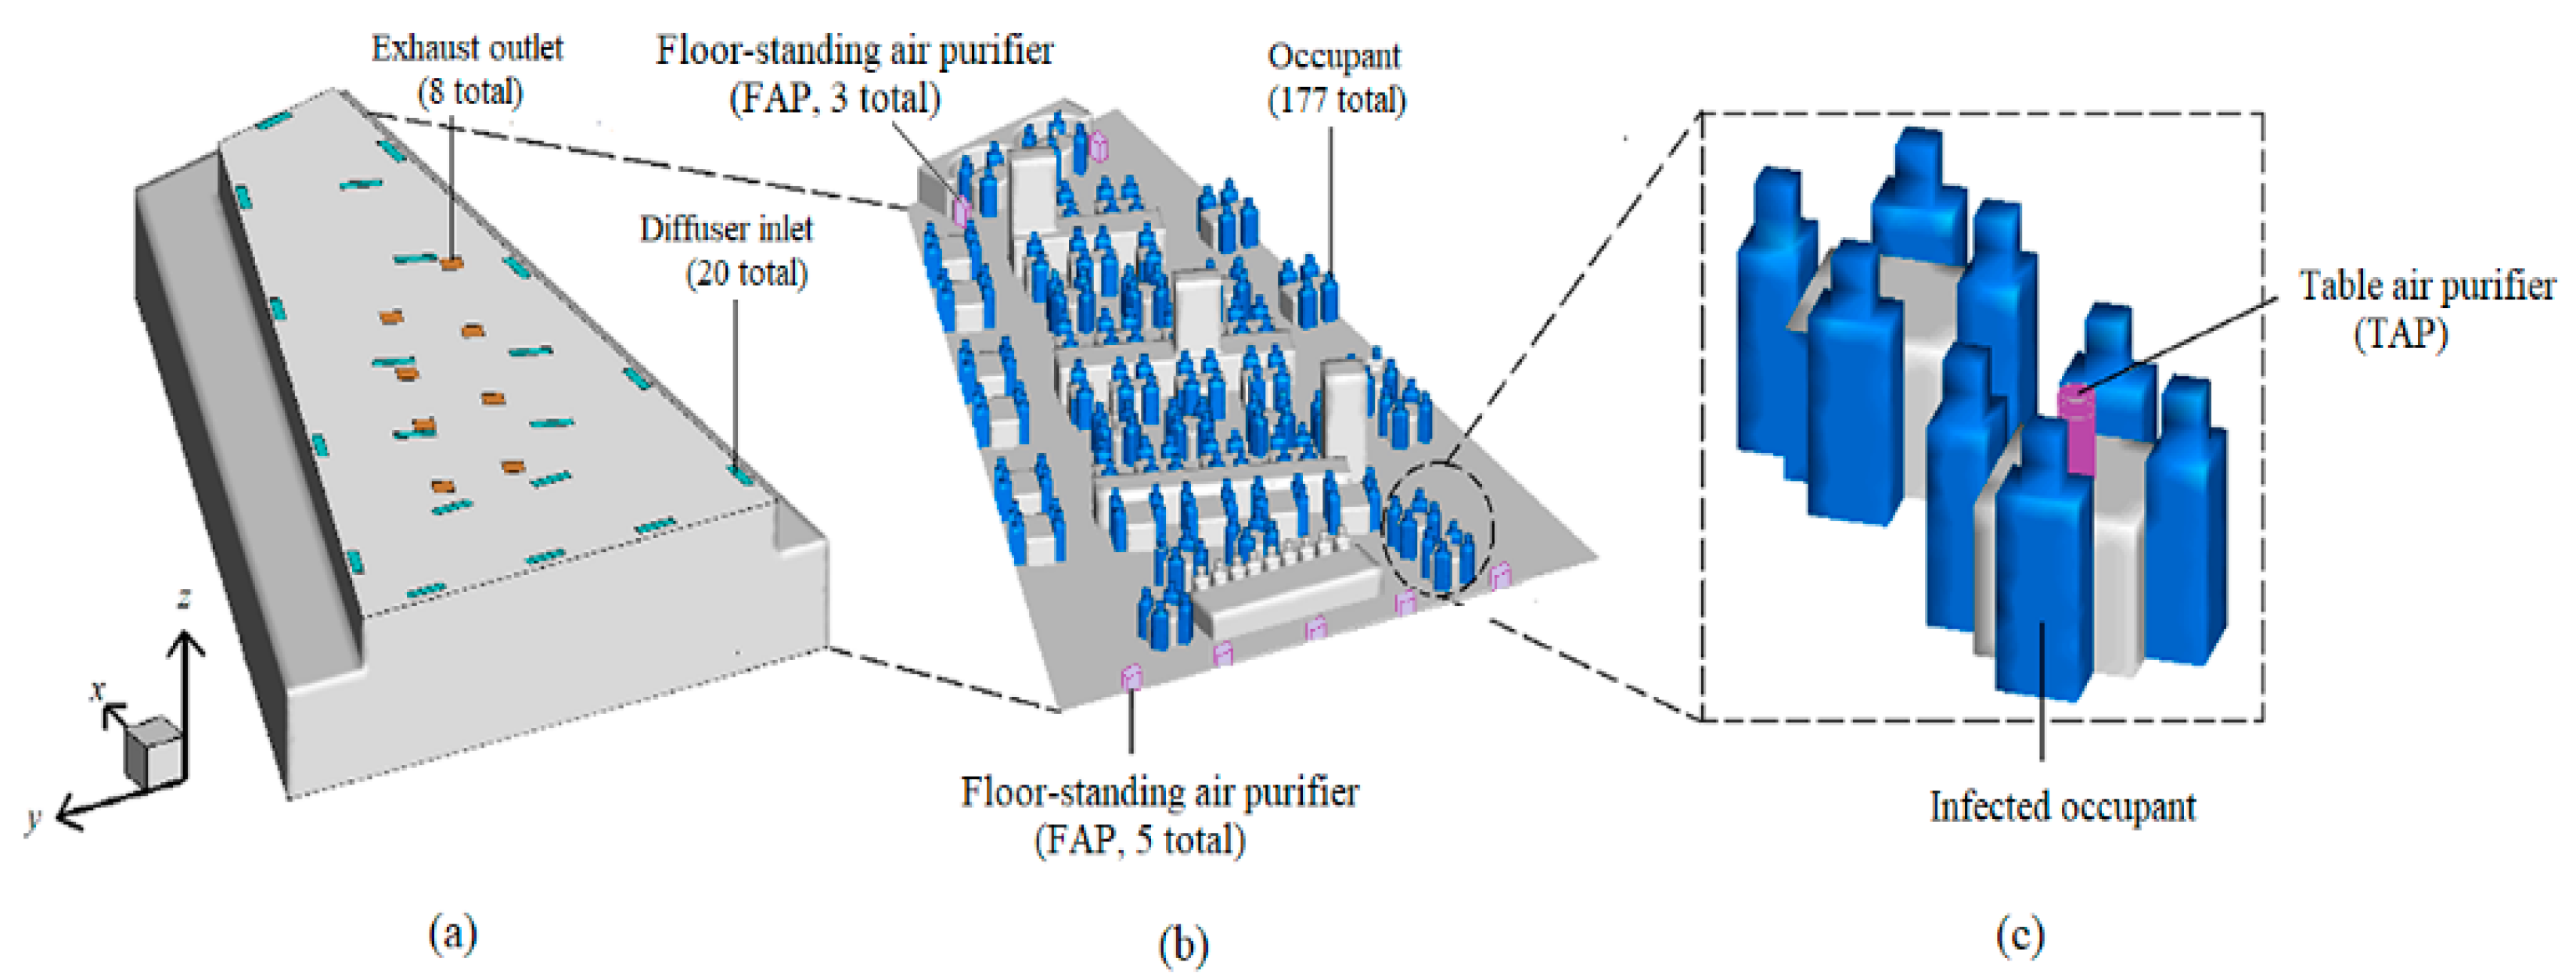
9]. Proper design of air purifier installation (i.e., number, capacity, and location of units) is crucial to effectively remove airborne particles in spaces, particularly challenging in large public spaces. The actual performance of air purifiers can be affected by many factors, including indoor furniture and occupant layouts, existing mechanical system arrangements, and space openings such as doors, windows, connections, and leakages. This study explores the placement of two types of air purifiers (i.e., floor-standing air purifier (FAP) and table air purifier (TAP)) in two typical large public places (i.e., restaurant and ballroom) via both computational simulation and a field experiment to evaluate the performance of purifiers in mitigating the dispersion of particles/droplets released from the human mouth while breathing, talking or coughing.
2. Methodologies
The actual performance of air purifiers can be determined through either a physical test or a validated numerical experiment. While providing first-hand data, a physical test in a real space is often challenging, due to many uncontrollable variables, especially for pollutant/virus-related studies. A validated numerical experiment using computational flow dynamics (CFD) techniques provides a great alternative and is applied widely in the field. This study simulated the airflow pattern and contaminant transport in the spaces using a steady-state RANS (the Reynolds-Averaged Navier–Stokes equations) method. The RNG k-ε turbulence model in the commercial CFD code ANSYS Fluent 19.2 [
10,
11] was used to represent turbulence characteristics. The particle simulation assumed monodispersed non-interacting spherical particles. The momentum transfer from the particles to the air turbulence has a negligible impact on the flow [
12,
13,
14].
Equations (1) and (2) describe the governing equations of the fluid phase [
12]. The buoyancy effect of air is modeled with the Boussinesq approximation.
where
vj is the velocity component in three perpendicular coordinate directions (
xj,
j = 1, 2, 3), m/s;
ρ is the air density, kg/m
3;
p is the air pressure, Pa;
μ is the kinematic viscosity coefficient of air;
vi′vj′ is the Reynolds stress tensor.
When tracking the virus-carrying particles (in solid phase), the effect of the air drag force, gravity, and buoyancy were taken into account. The discrete particle model in Fluent (CFD-DPM) was used to track the individual particles [
13]. The flow-governing equations of the solid phase single particle are described by Equations (3)–(6) [
14]:
where
is the air drag force acting on the particle, N, the second term on the right side of Equation (3), represents gravity and buoyancy;
mp is the mass of the particle, kg;
is the velocity vector of the particle, m/s;
ρp is the particle density, kg/m
3;
v is the air velocity, m/s;
vp is the particle velocity, m/s;
Dp is the particle diameter, m;
μ is dynamic viscosity, N s/m
2;
a1,
a2, and
a3 are coefficients determined by
Rep.
3. Validation of the CFD Model
Exhaled air of an infected person is the primary source of contagious viruses. Exhaled air comes from various respiratory-related activities, such as breathing, coughing, singing, and talking. Accurate information on the release and diffusion process of exhaled airflow and particles is, thus, critical for the precise prediction of infectious disease transmission. This study focused on the talking scenario—the main concern during the dining and ballroom events when facial masks cannot be used. Studies showed that talking may release 2600 droplets per second at a speed of 1–5 m/s [
15]. The range of the total airflow rate from a mouth when speaking is about 284–759 cm
3/s [
16]. Using an average of 500 cm
3/s and assuming a mouth opening area at 1.8 cm
2 [
16] leads to an average talking airflow speed of 2.77 m/s, which meets the particle image velocimetry (PIV) test result at the order of 3.1 m/s [
17].
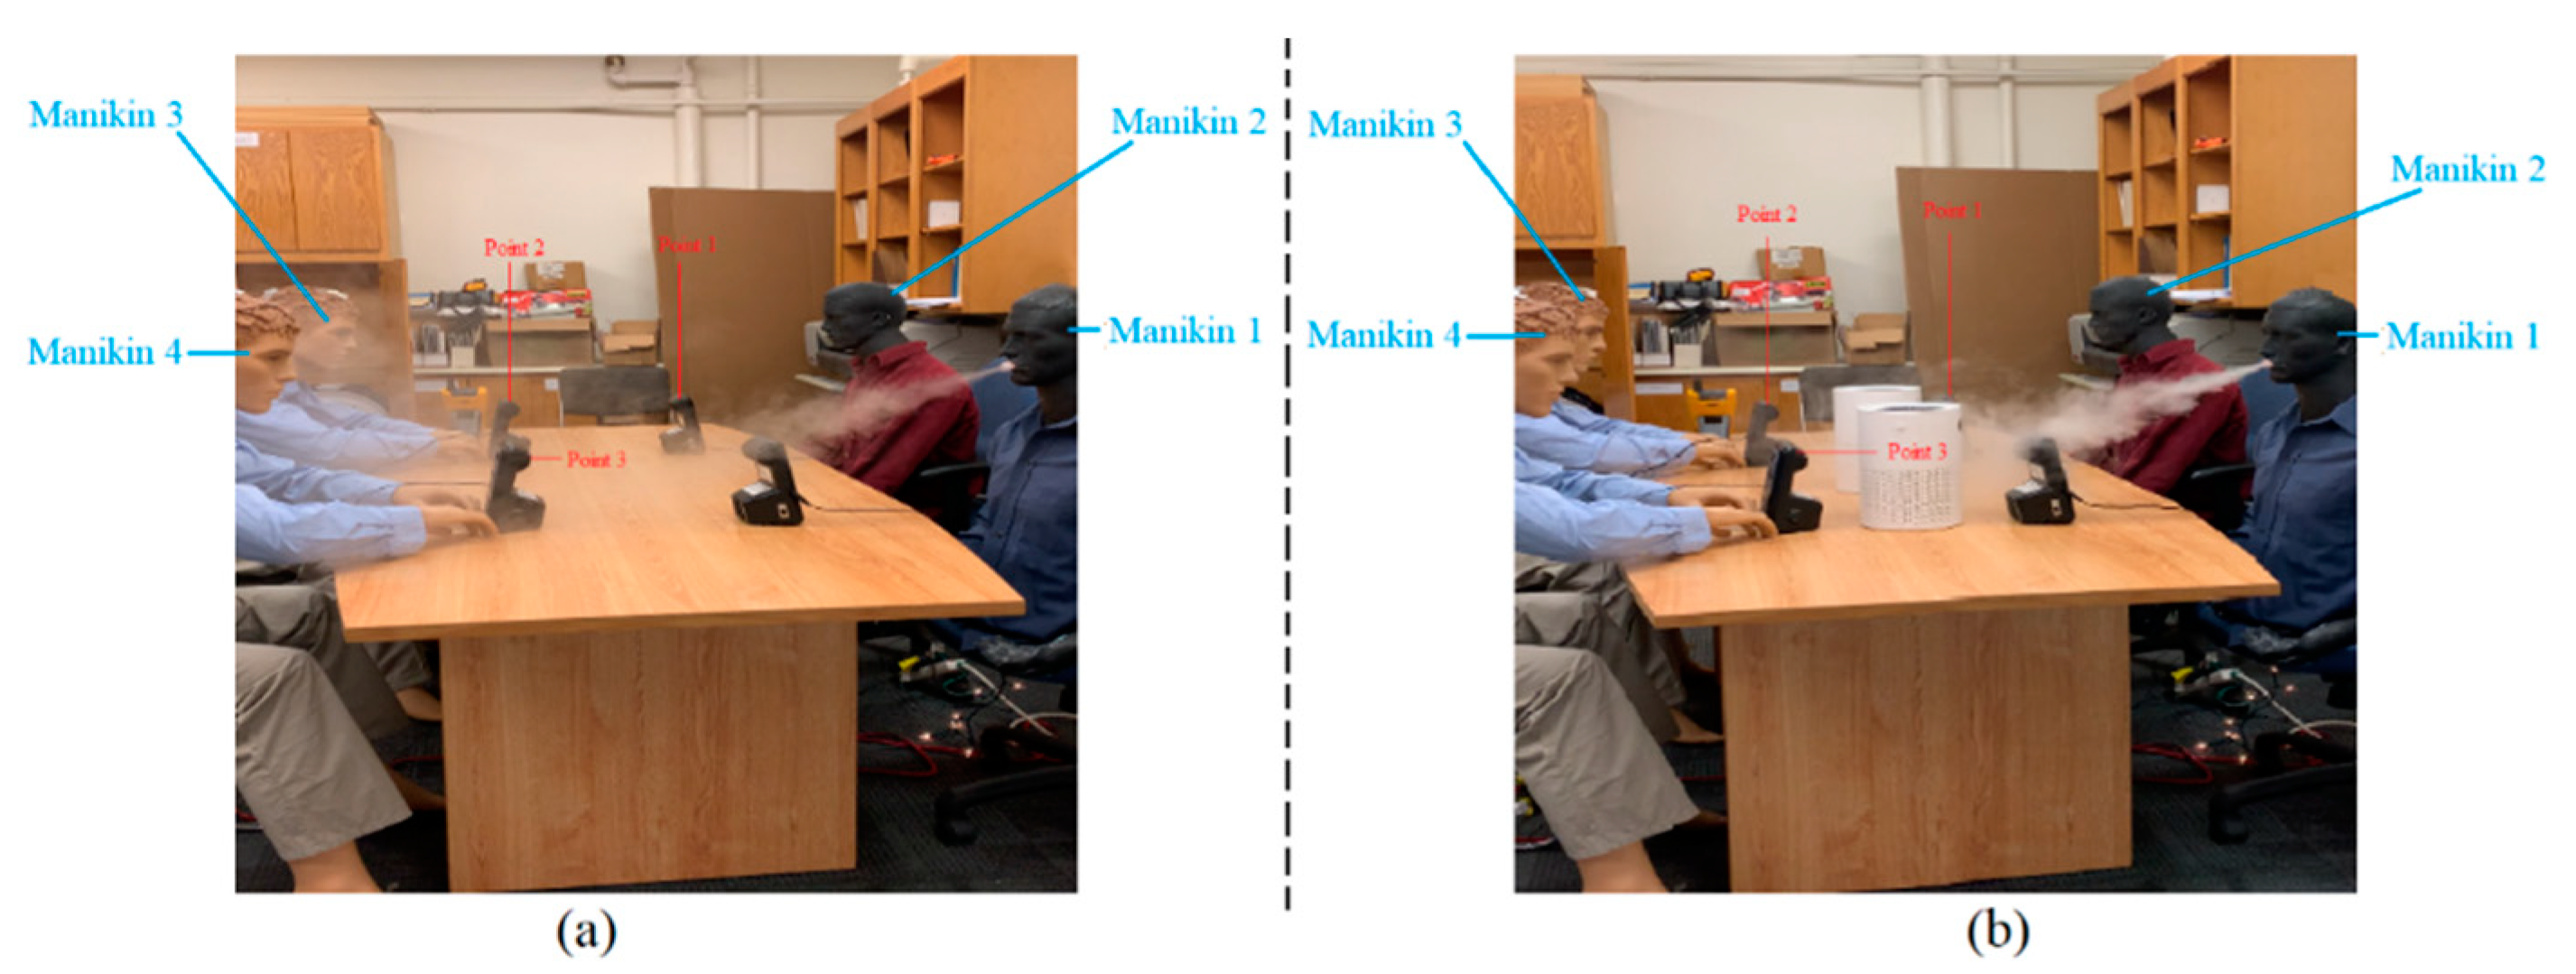
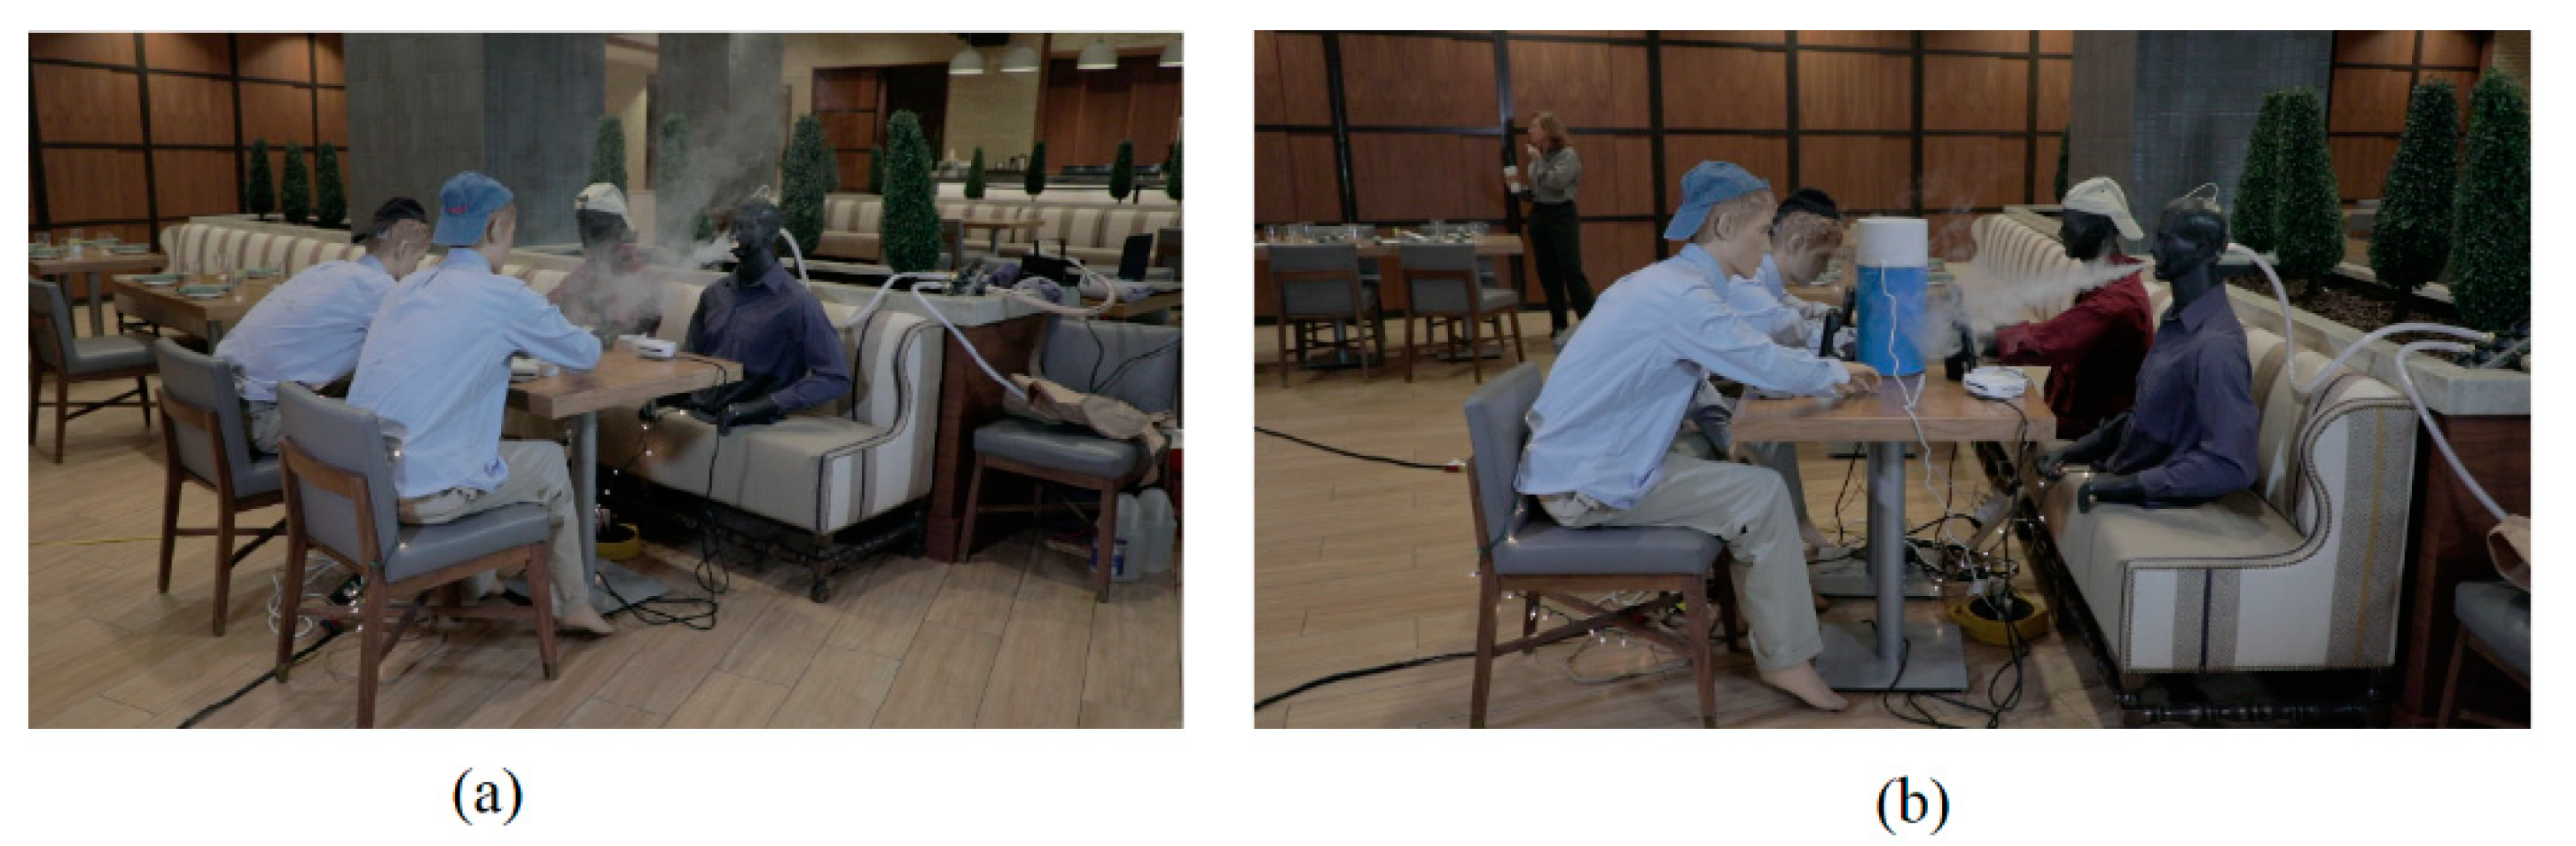
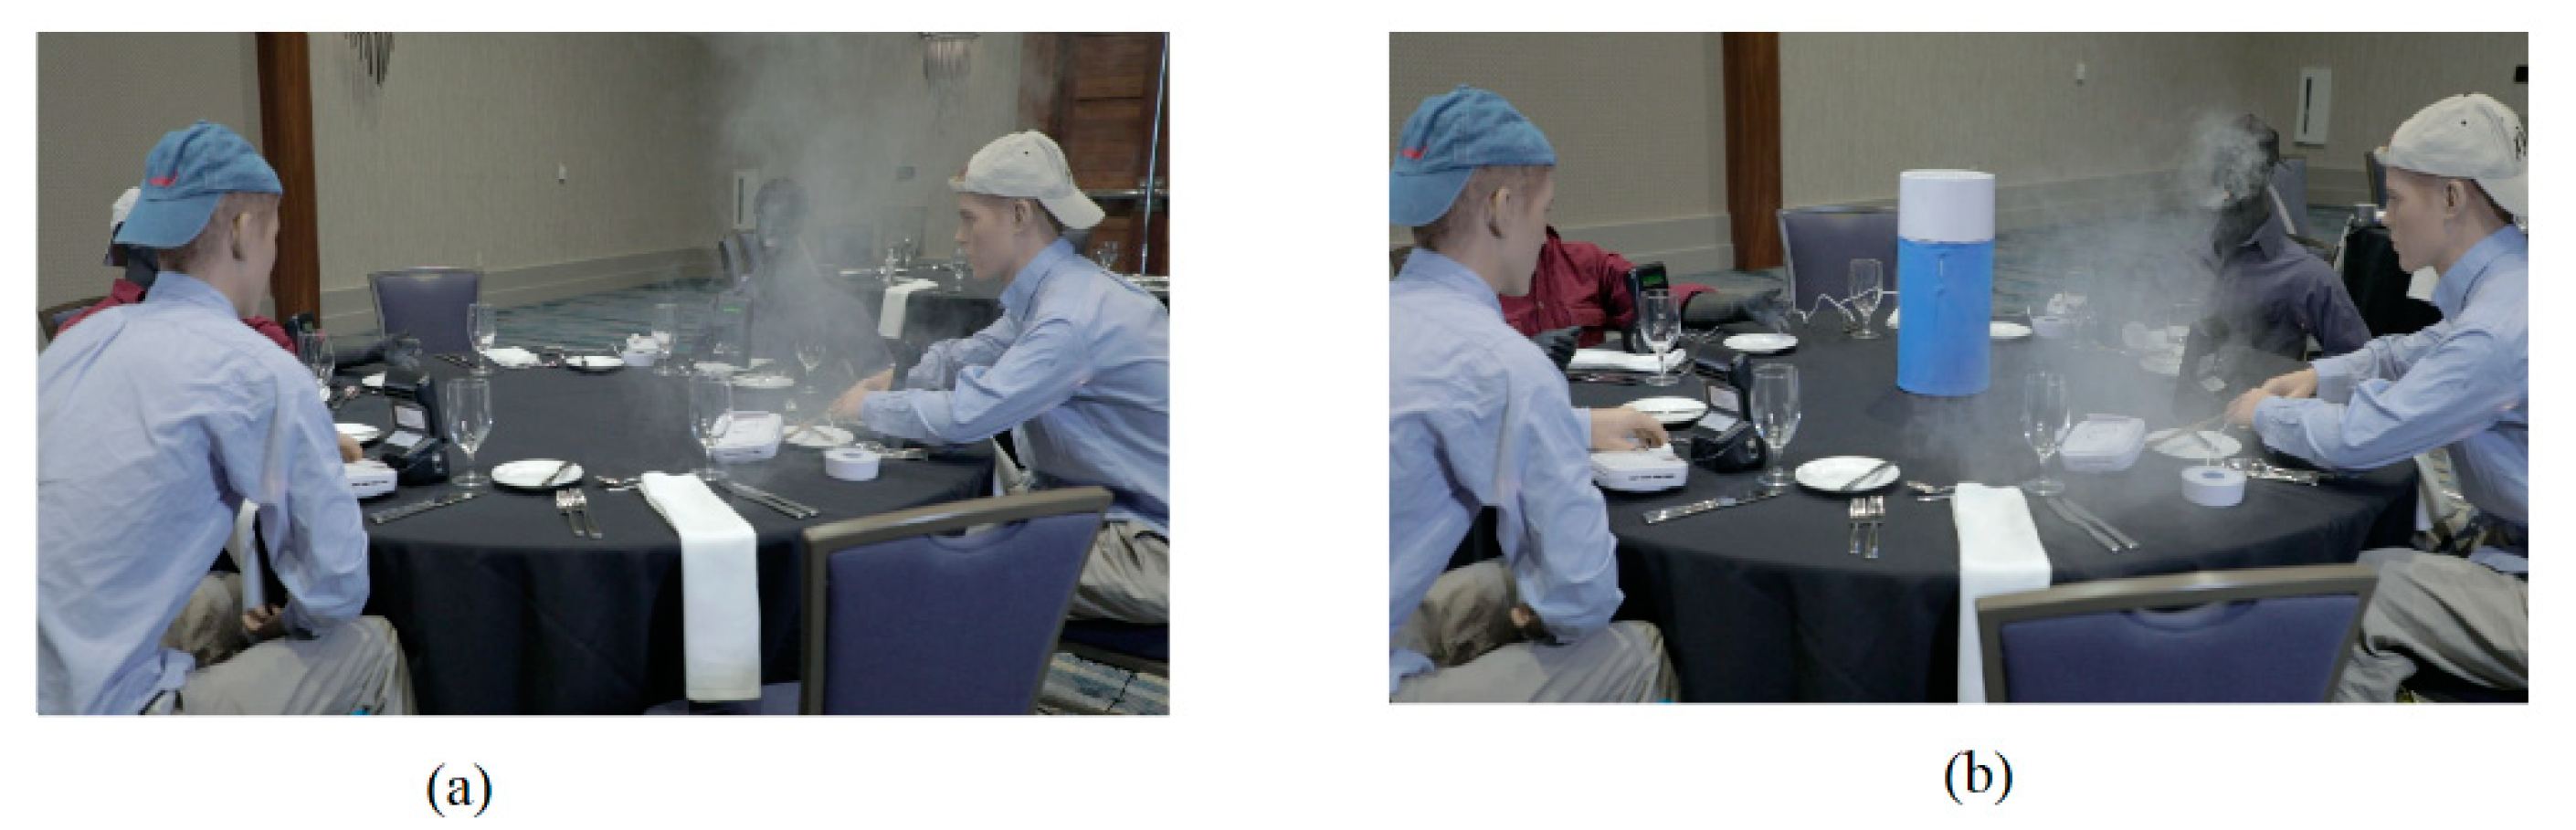
This study first conducted a test, via both physical experiment and CFD simulation, in the calm lab environment using a single table case with four occupants, including one infected person (Manikin 1) who intermittently talks, as shown in
Figure 1 and
Figure 2.
Table 1 lists the test case geometries. The thermal manikins of 70 Watt each have an average head/face temperature of 27 °C and an average body (with clothes) temperature of 22 °C. The space has no active air conditioning system, and the ambient room air, wall, ceiling, floor, and table surface temperatures are kept at 19 °C.
The mock-up physical experiment simulated the virus pollutant emitted from the mouth (with an inner size of 1.37 cm) of Manikin 1 by using stage fog (water-glycerin-mixture) as the tracer gas. The exit velocity of the fog from the mouth was controlled at around 2.77 m/s, representing a scenario where people are talking loudly. The supply time of the fog from the mouth is 20–25 s in the experiment and each test runs 2–5 min. A commercially available portable air purifier with a clean air delivery rate (CADR) of 166 m
3/h was tested for the performance, with the most effective placement location as shown in
Figure 1 and
Figure 2. The sizes of the portable air purifier are listed in
Table 1.
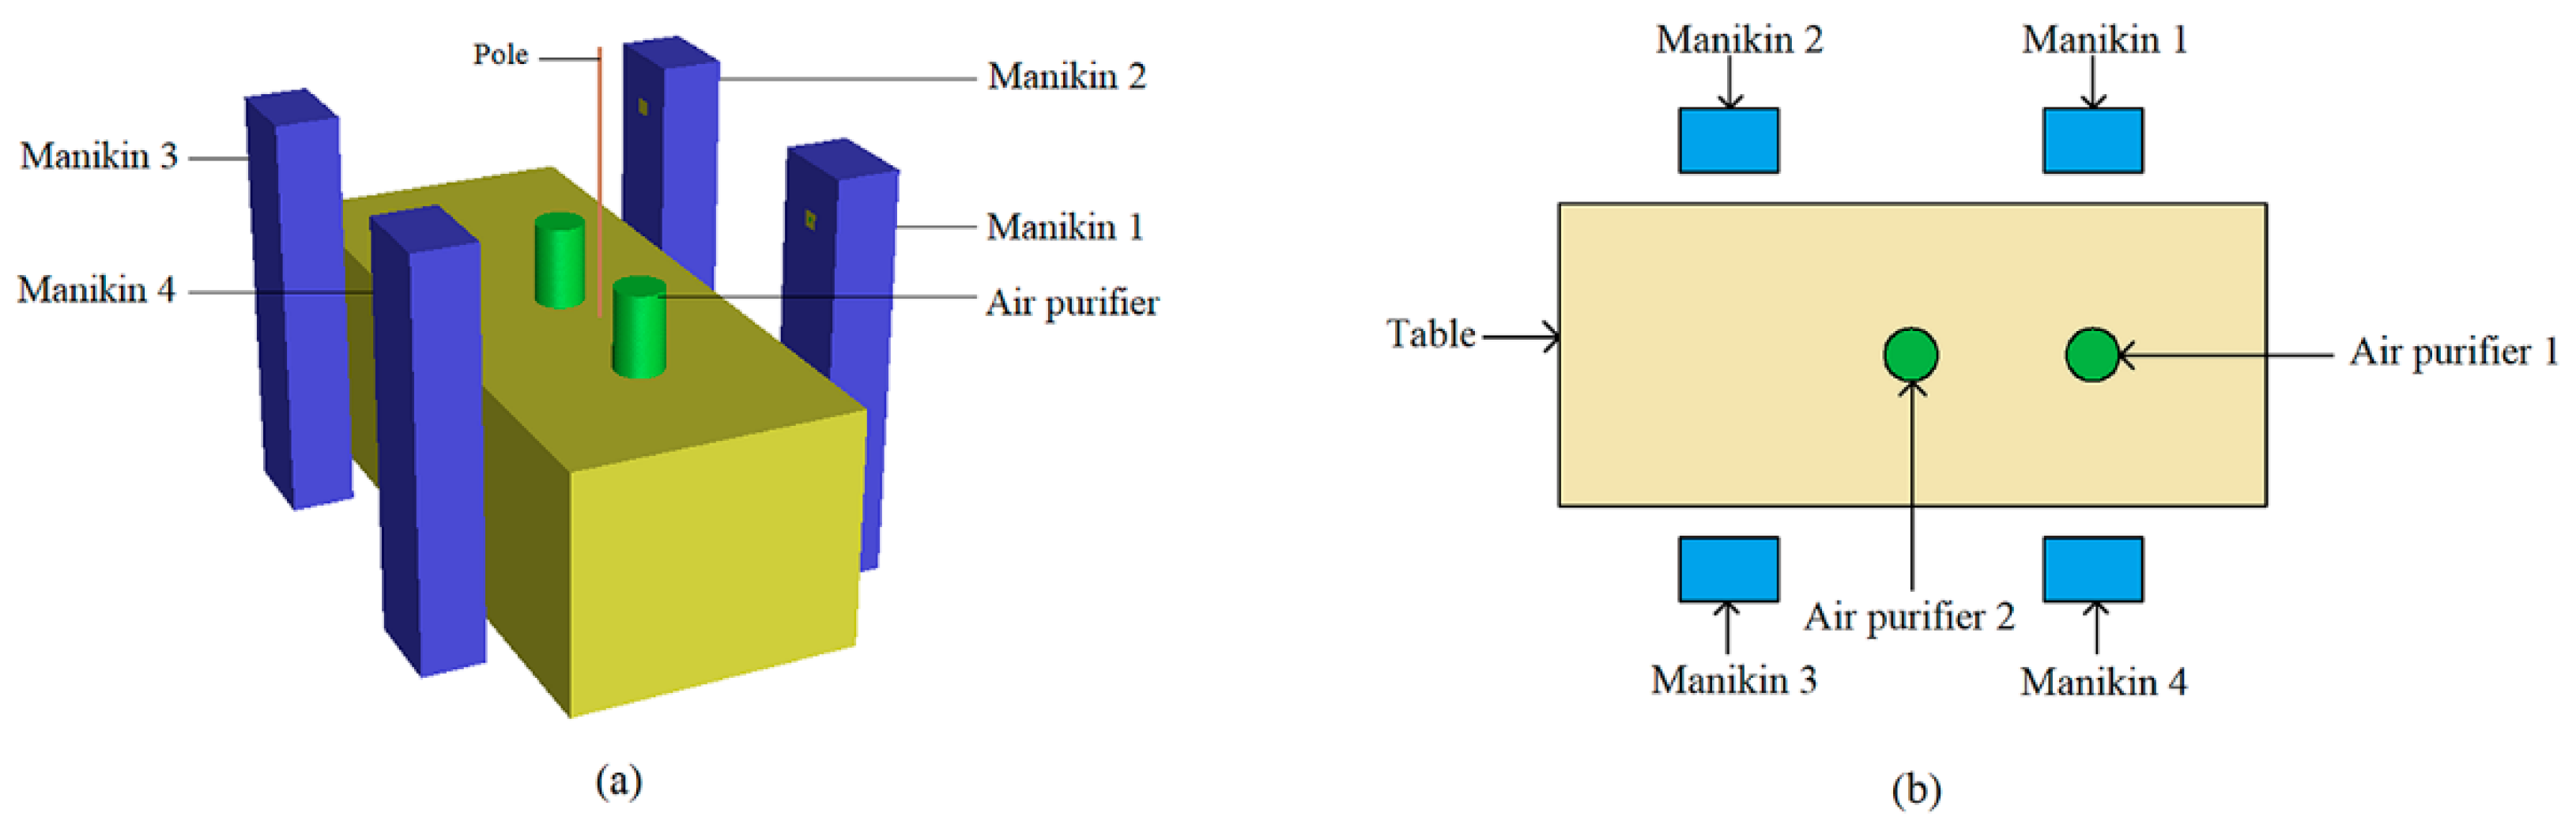
Figure 2 illustrates the created CFD model for the single table case. The virus particle details simulated in CFD are presented in
Table 2. The number of the particles released from the mouth was assumed as 5000 to ensure that the deviation of the particle statistical results is less than 1% [
18]. Particles larger than 10 micron tend to drop quickly, while smaller particles tend to flow with air. The mean particle size during talking was 3 micron, which was thus used in the CFD model [
19].
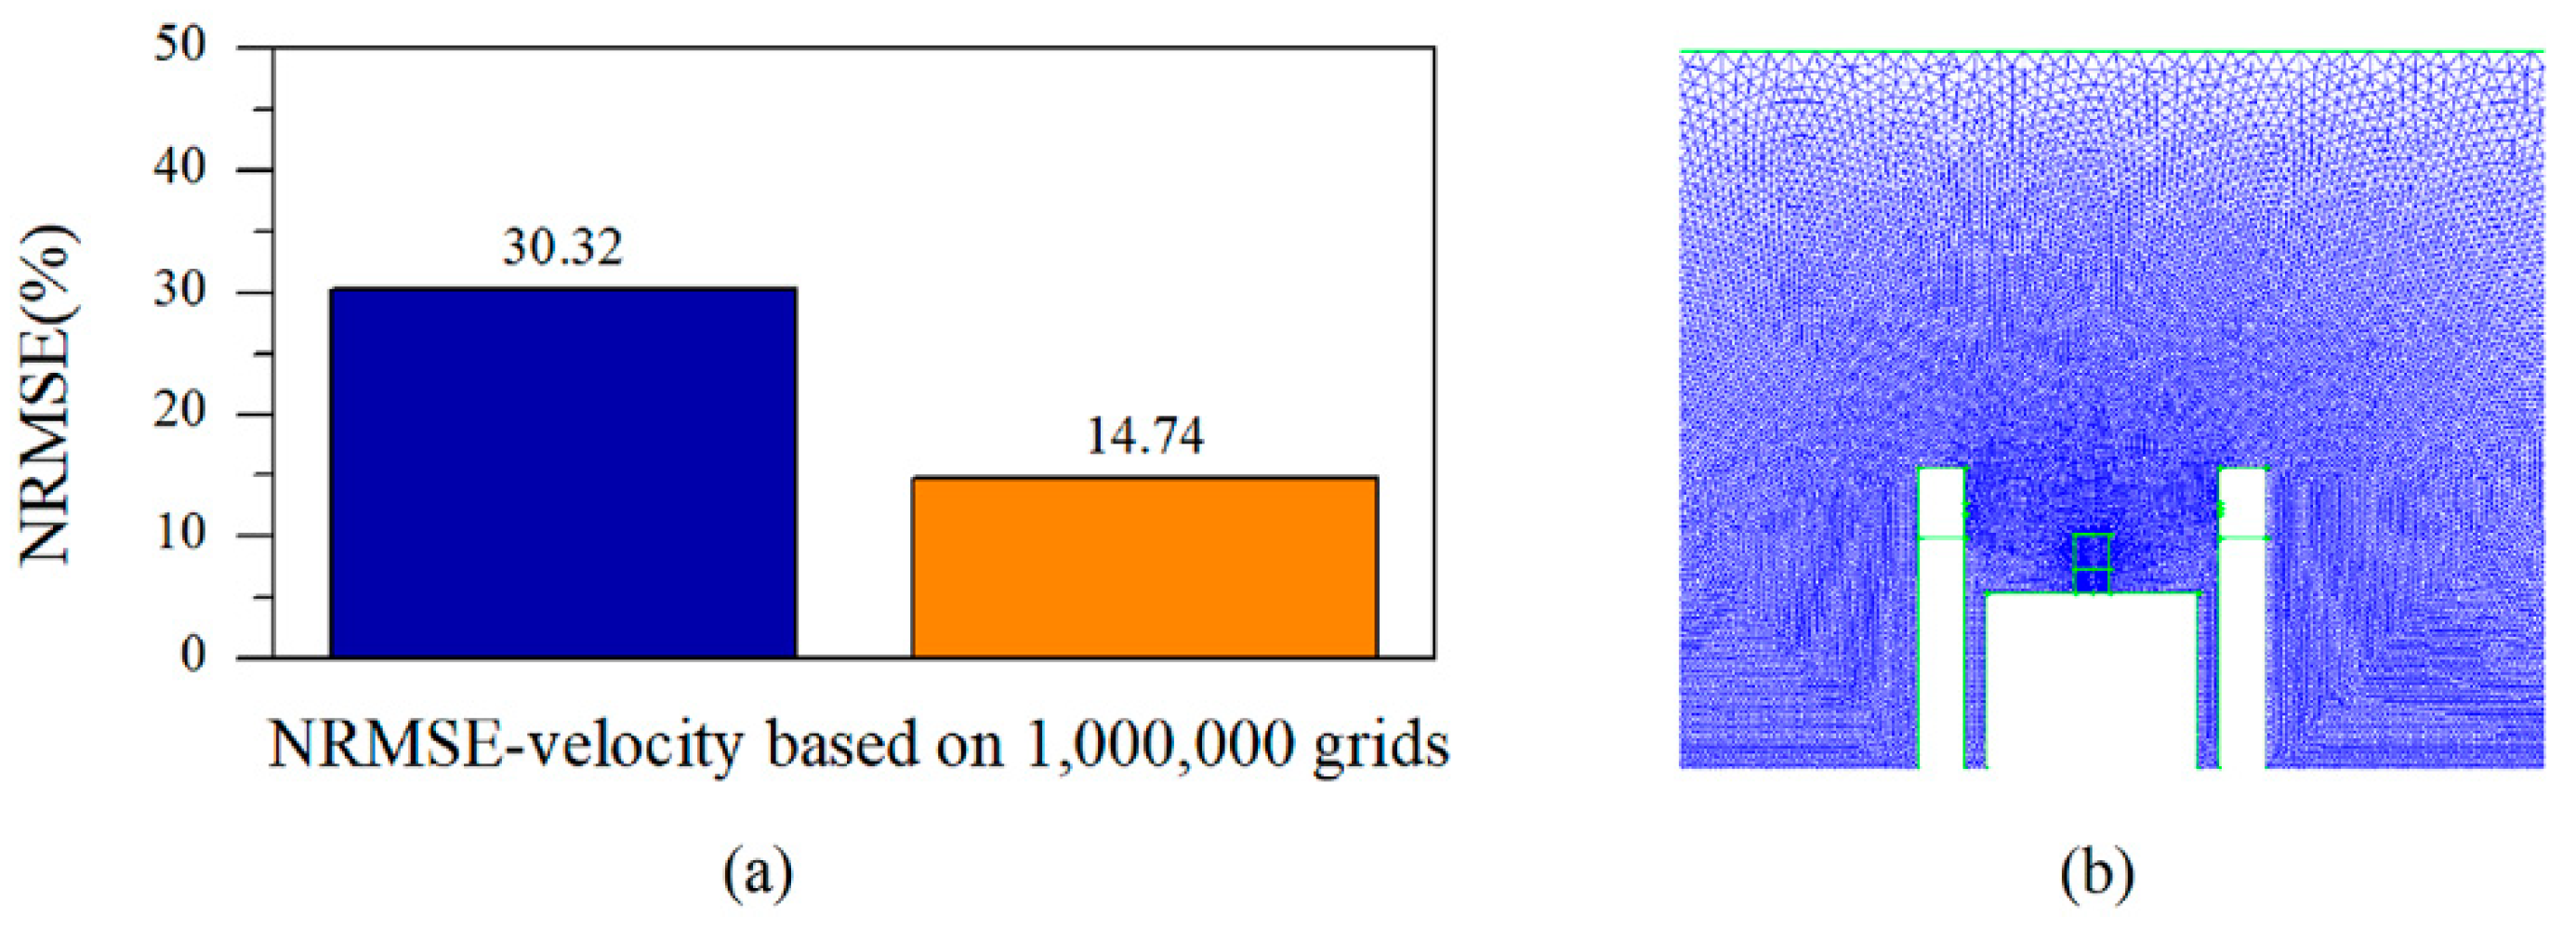
The CFD simulation first performed the grid sensitivity analysis to ensure the independence of the numerical results. Three numerical grids, 410,000, 770,000, and 1,000,000, were tested and compared using the normalized root mean square error (NRMSE) of the velocity at the pole shown in
Figure 2 (30 points). The NRMSE of the velocity at the pole, respectively, between 410K and 1000K grids and between 770K and 1000K grids, are calculated as shown in
Figure 3a. There is generally a great improvement in the error with the 770K grid, and the computational uncertainty is overall below 15%. By balancing the computational accuracy and cost, the 770,000 grid was, thus, chosen for the simulation. Among the 770,000 cells, fine grids were allocated around the mouths of the occupants, as shown in
Figure 3b.
The mock-up experiment exhibits clearly, in
Figure 1, that the fog exhaled from Manikin 1 can easily arrive at the face of Manikin 4, who is right across the table, and Manikin 3, who is diagonally across the table, when no air purifiers are used. When air purifiers were used, most of the fog exhaled from Manikin 1 was attracted towards the air purifiers, effectively containing the turbulent spread of the contaminant.
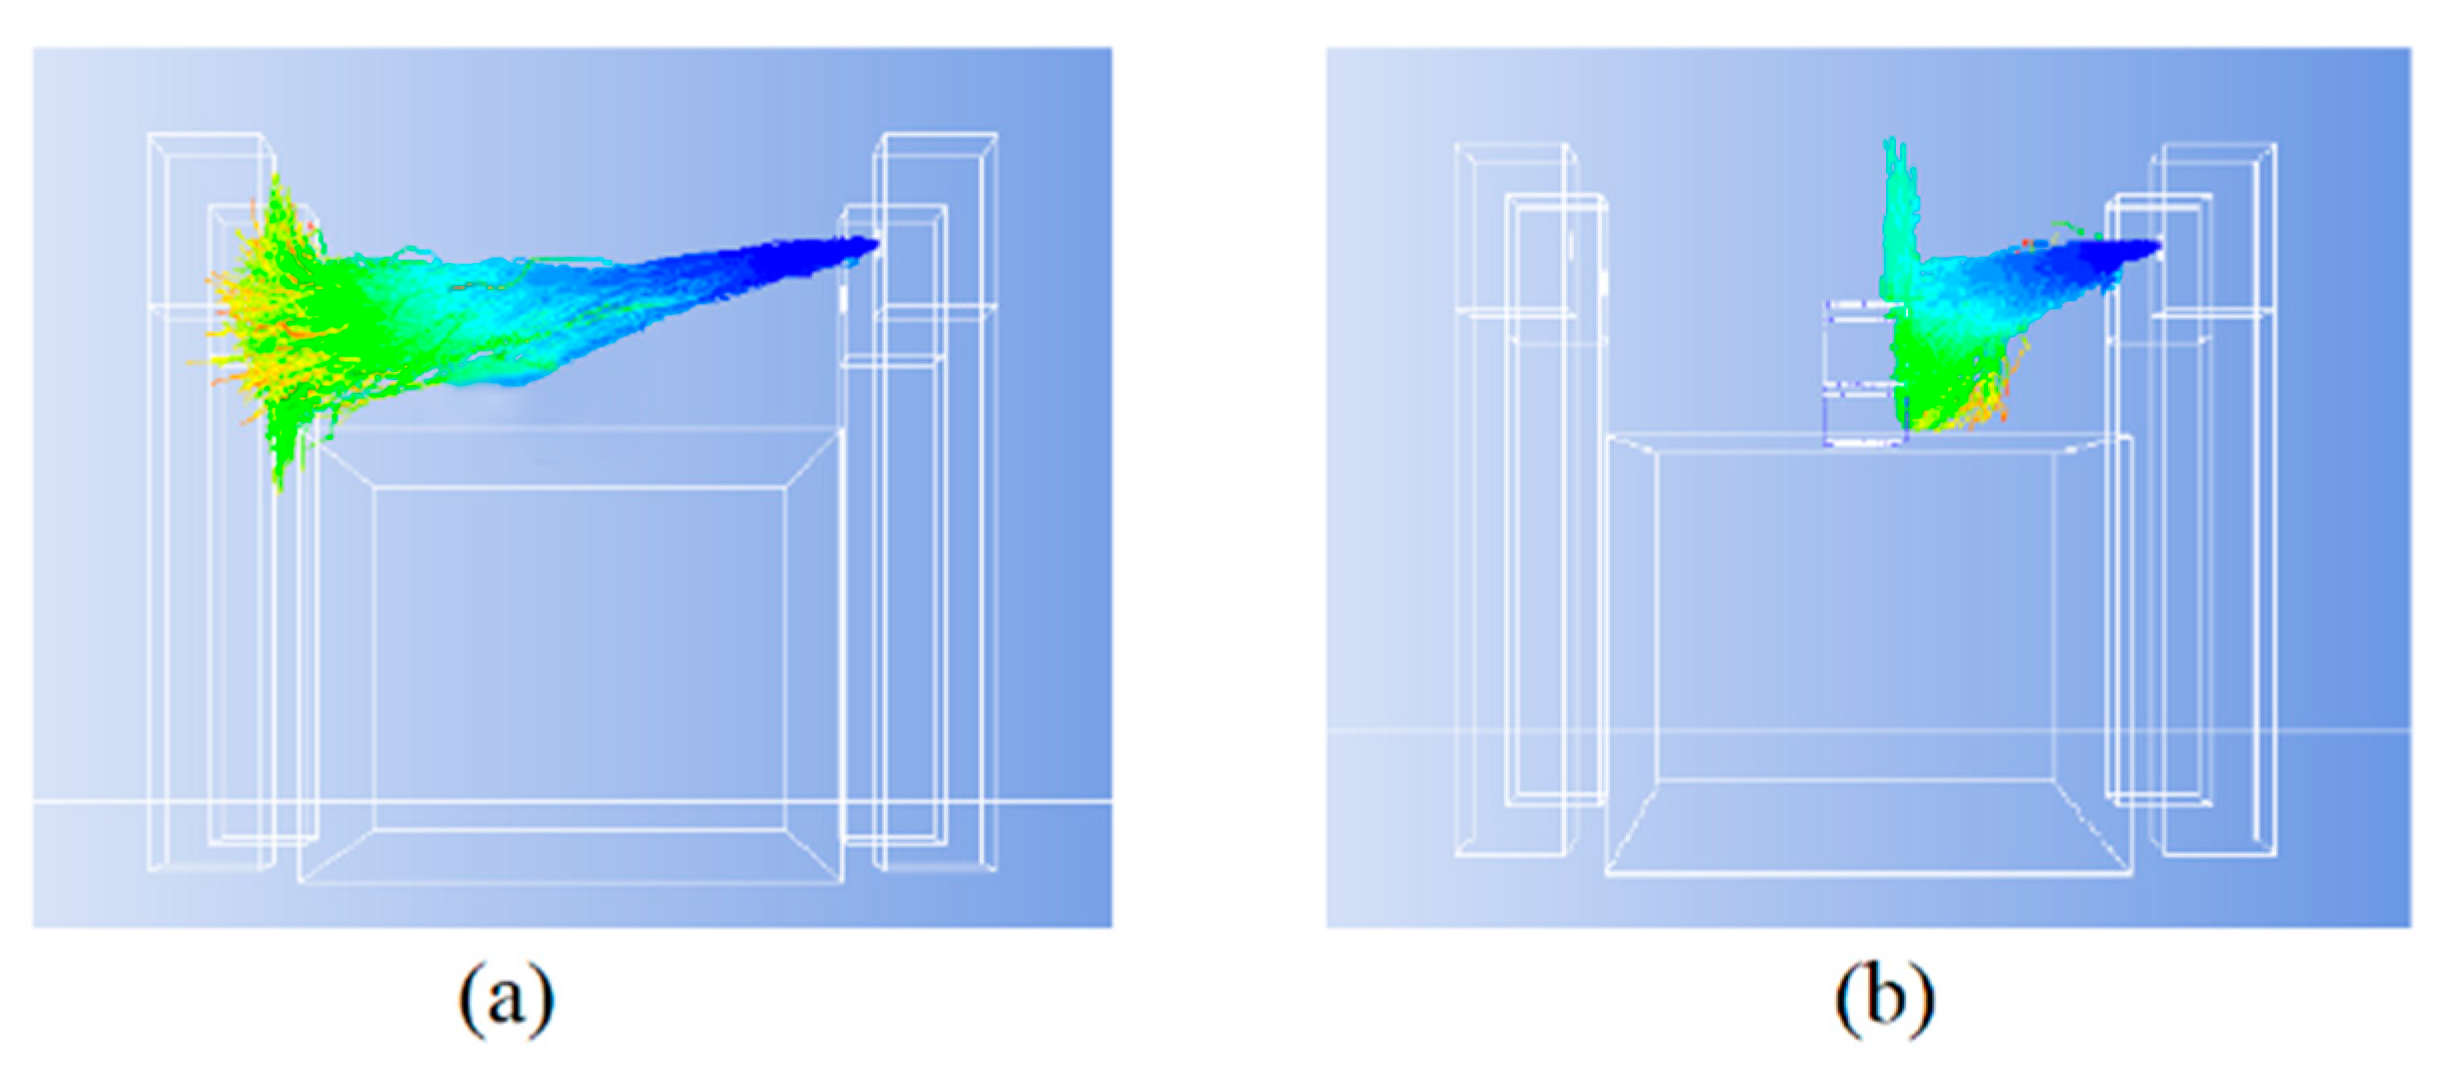
The similar dispersion processes of the particles were observed in the CFD simulation with and without air purifiers, as shown in
Figure 4. Both mock-up test and CFD modeling indicate that the particle concentration at Manikin 4 (across the table from the source person) is less than those near Manikins 2 and 3, confirming the effectiveness of the air purifier placed between Manikin 1 and 4. Most of the particles can be directly removed by the purifier or blown away by the upward air from the top exit of the purifier.
The comparison between simulation and experiment is quantitatively analyzed by calculating the reduction rate of the particle numbers (
Mreduction) detected at the three locations of the sensors (
Figure 1).
Mreduction can be defined as follows:
where
Mwithout air purifier, i is the number of particles sensed at the ith point (
i = 1, 2, 3) for the case without air purifiers and
Mwith air purifier, i is the number of particles sensed at the
ith points (
i = 1, 2, 3) for the case with air purifiers.
Figure 5 compares the results obtained from the simulation and test.
Both the qualitative and quantitative comparisons between the mock-up experiment and the CFD simulation verify that the simulation model can project reasonable results to track the virus-carrying particles’ trajectories. Therefore, a sophisticated CFD model that is made of many similar tables and occupants should be able to predict the transportation of the virus-carrying particles in a complex large built environment.
6. Conclusions
COVID-19 is a test like no others. Never before have the lives of so many people around the world been affected at this scale or speed. In this study, the air purifier, as a facility recommended by organizations such as the US CDC and ASHRAE, was investigated for its actual performance in reducing the infection risks of the virus. The installation of air purifiers in two typical public places (i.e., restaurant and the ballroom) was studied, as compared to the use of the existing central air-conditioning systems. Validated CFD models were created and applied to explore the qualitative and quantitative performance of the portable air purifiers, which was further verified by a qualitative field experiment in the actual restaurant and ballroom.
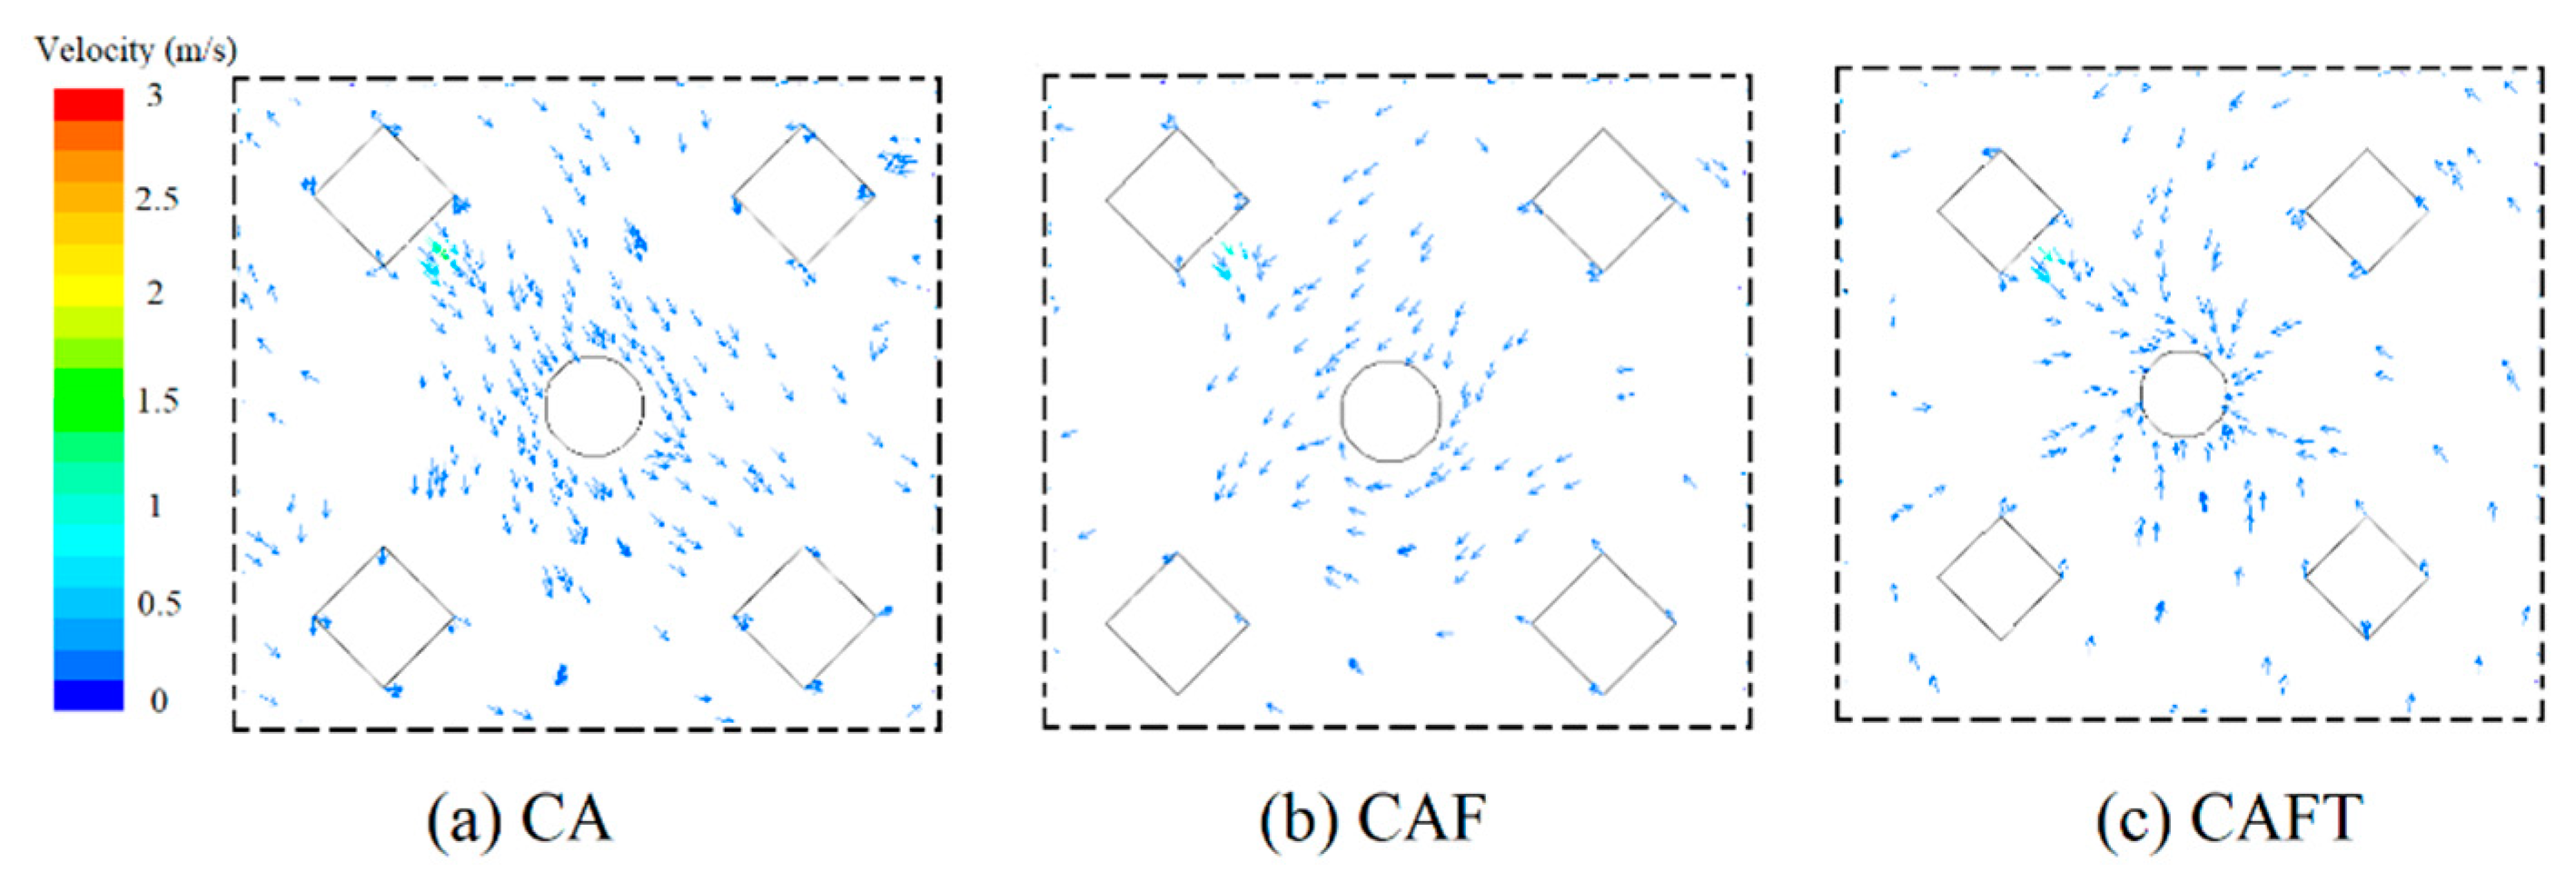
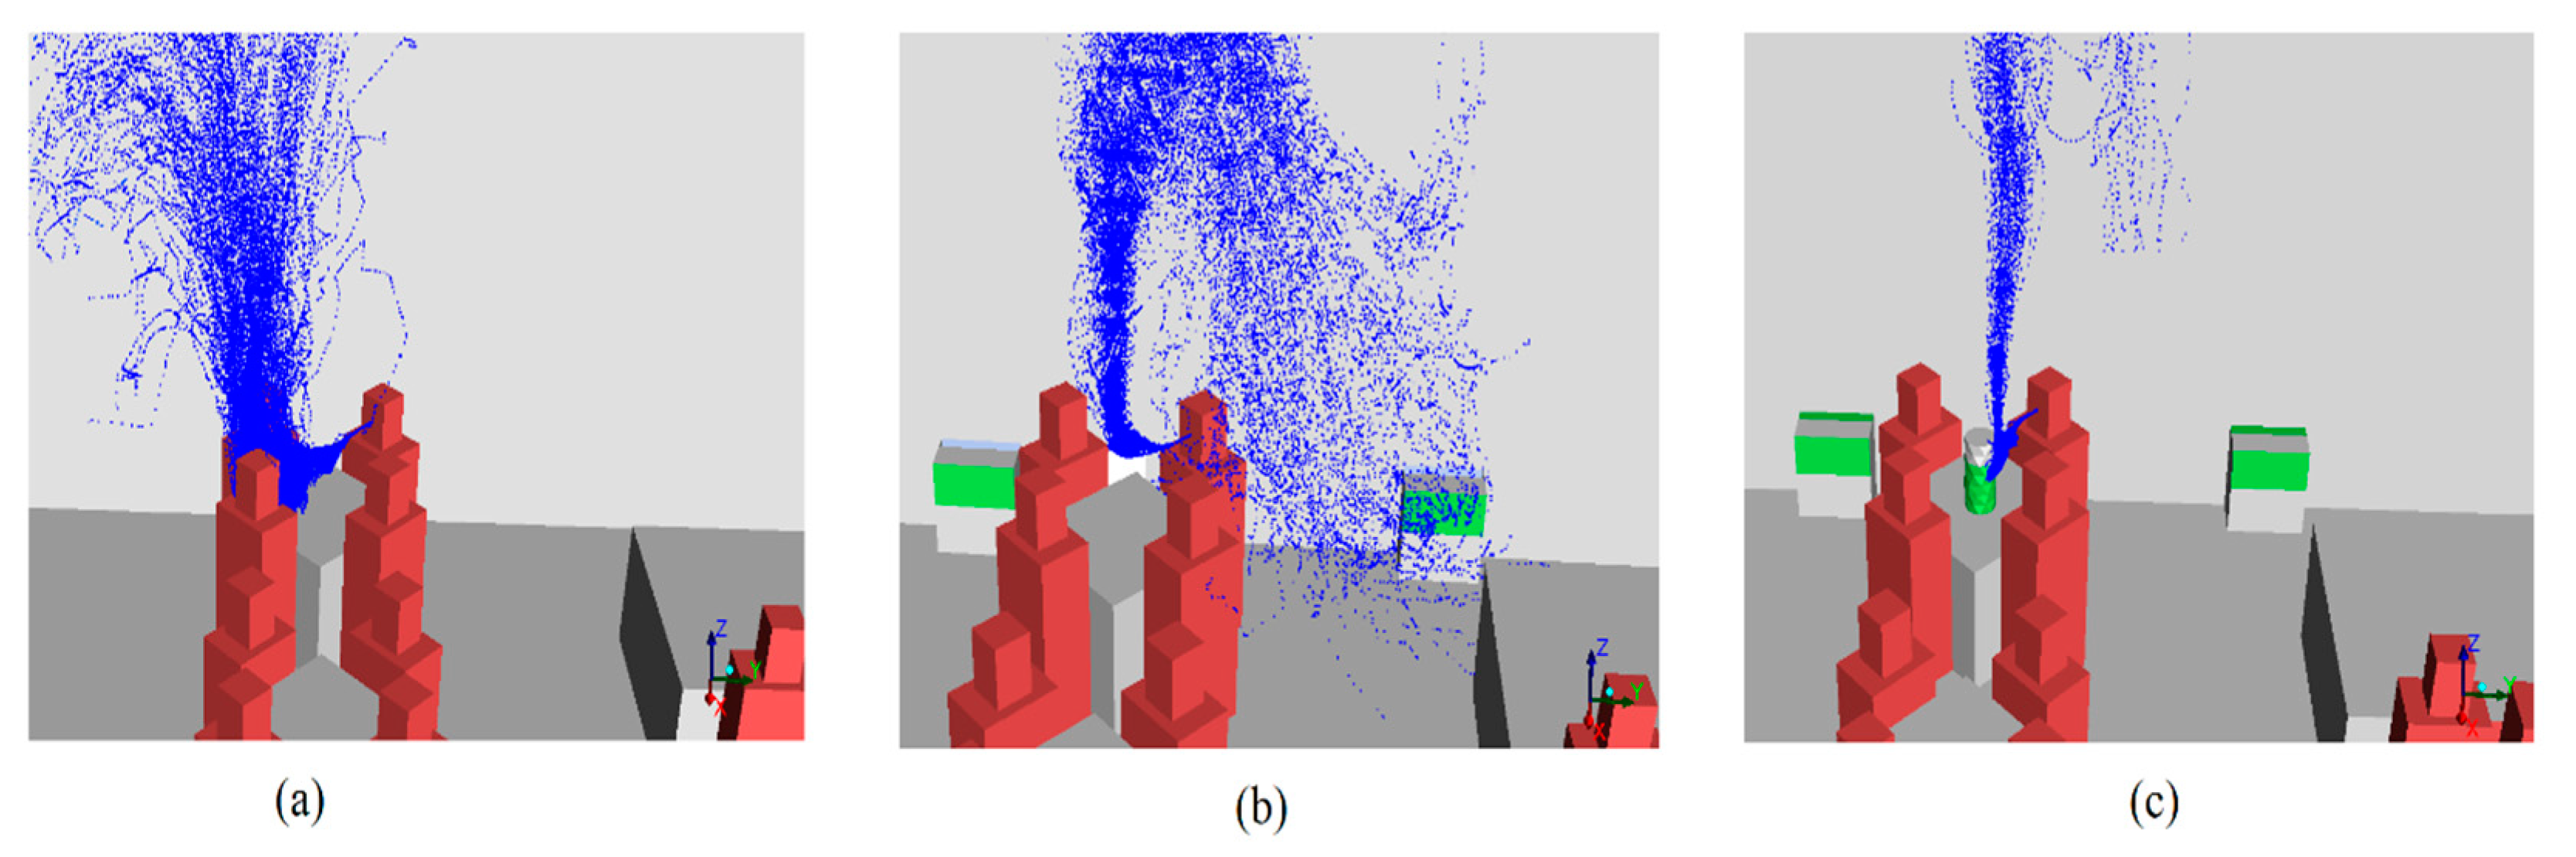
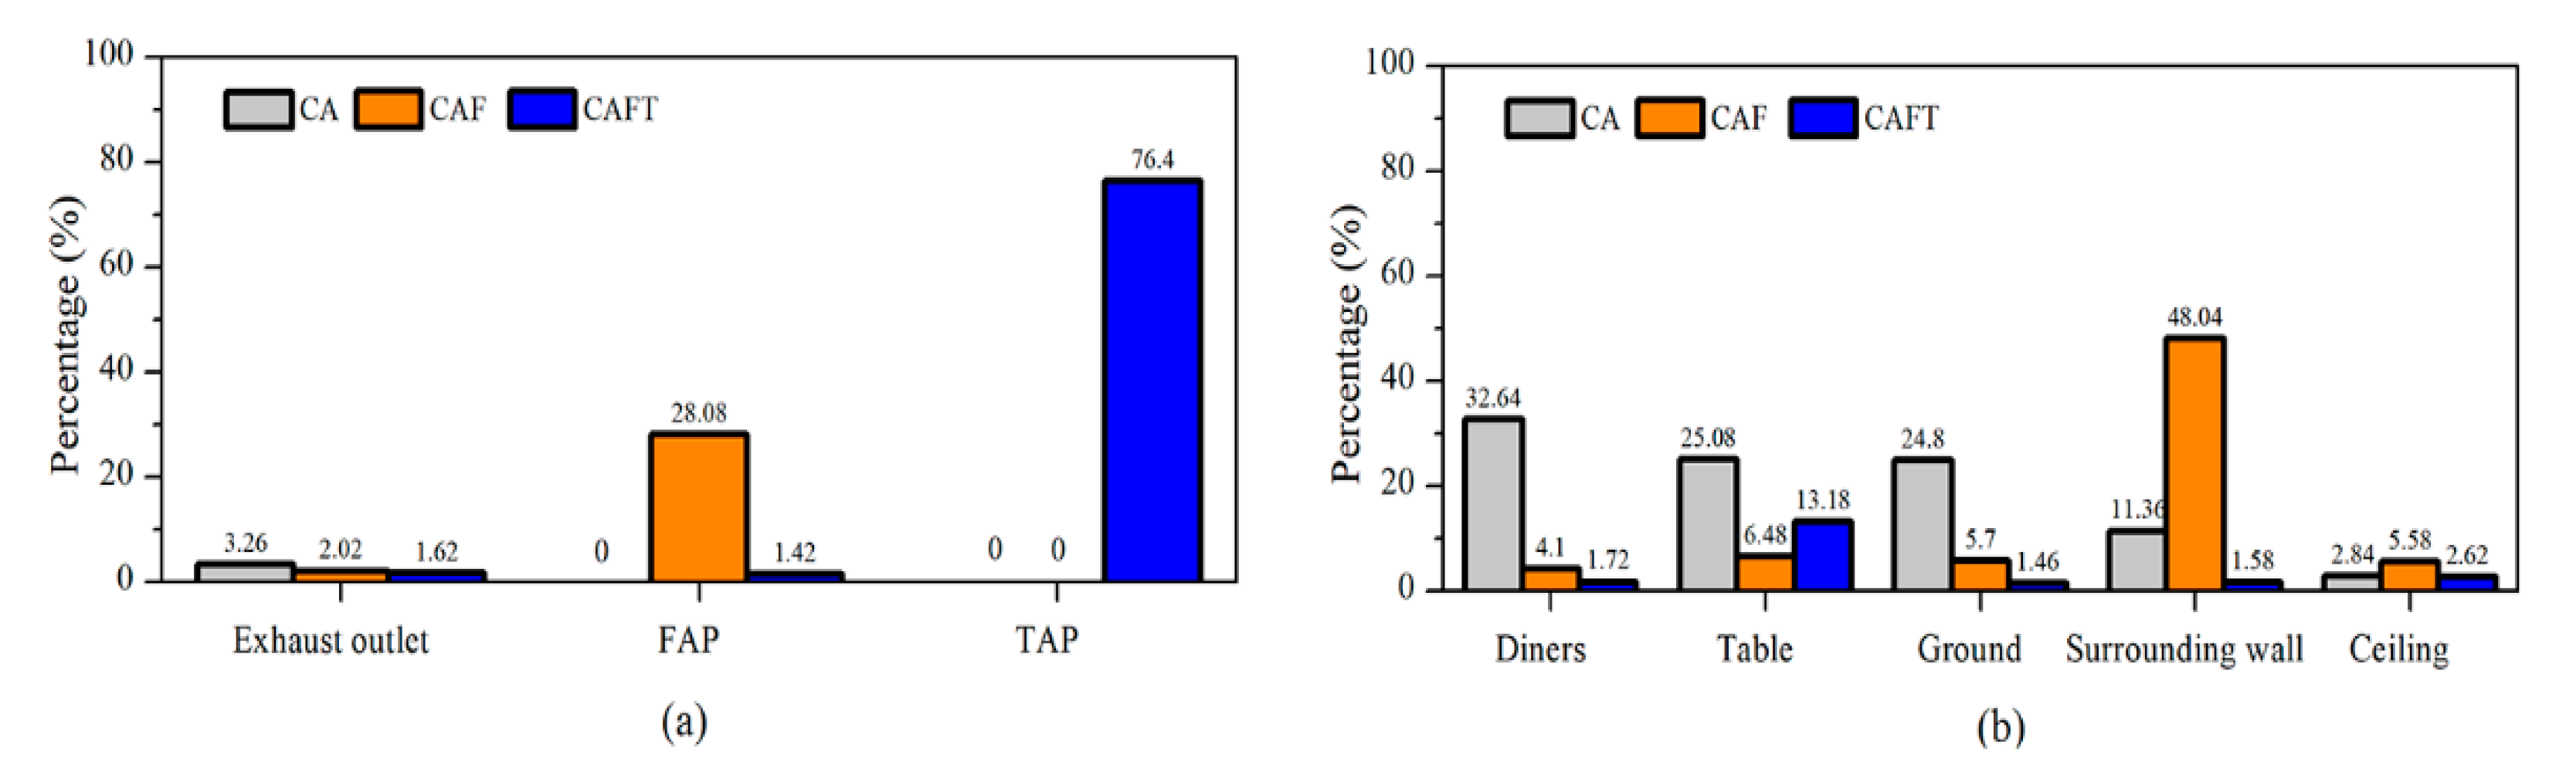
The research outcomes reveal that the central air condition system only exhausts a small fraction of the particles released from the mouth of the infector, and most of the particles are spread out indoors and ultimately deposited on occupants, tables, equipment, ground, and walls. Both floor-standing and table air purifiers, with proper locations and capacities, can effectively attract room air to flow towards the purifiers and, therefore, clean the “contaminated” air. Similar behavior and performance were observed in the actual restaurant and the ballroom, while the results indicate that each space is unique in geometry, layout, and system and, thus, needs to be addressed individually. Flexible solution allows the redeployments of the cleaning devices throughout the property as needed. Portable air purifiers with HEPA filtration provide an effective means to help mitigate the airborne transmission of pathogens, which can be as effective as more elaborate solutions installed in the HVAC systems at a lower cost.


