
Assessment of Summer Overheating in Concrete Block and Cross Laminated Timber Office Buildings in the Severe Cold and Cold Regions of China


Abstract
:1. Introduction
1.1. Overheating Phenomenon
1.1.1. Global Climate Change and the Urban Heat Island Effect
1.1.2. Public Buildings
1.1.3. Disadvantages of Overheated Buildings
1.2. Global Overheating Standards
1.3. Building Materials
1.4. Study Objective
2. Methods and Data
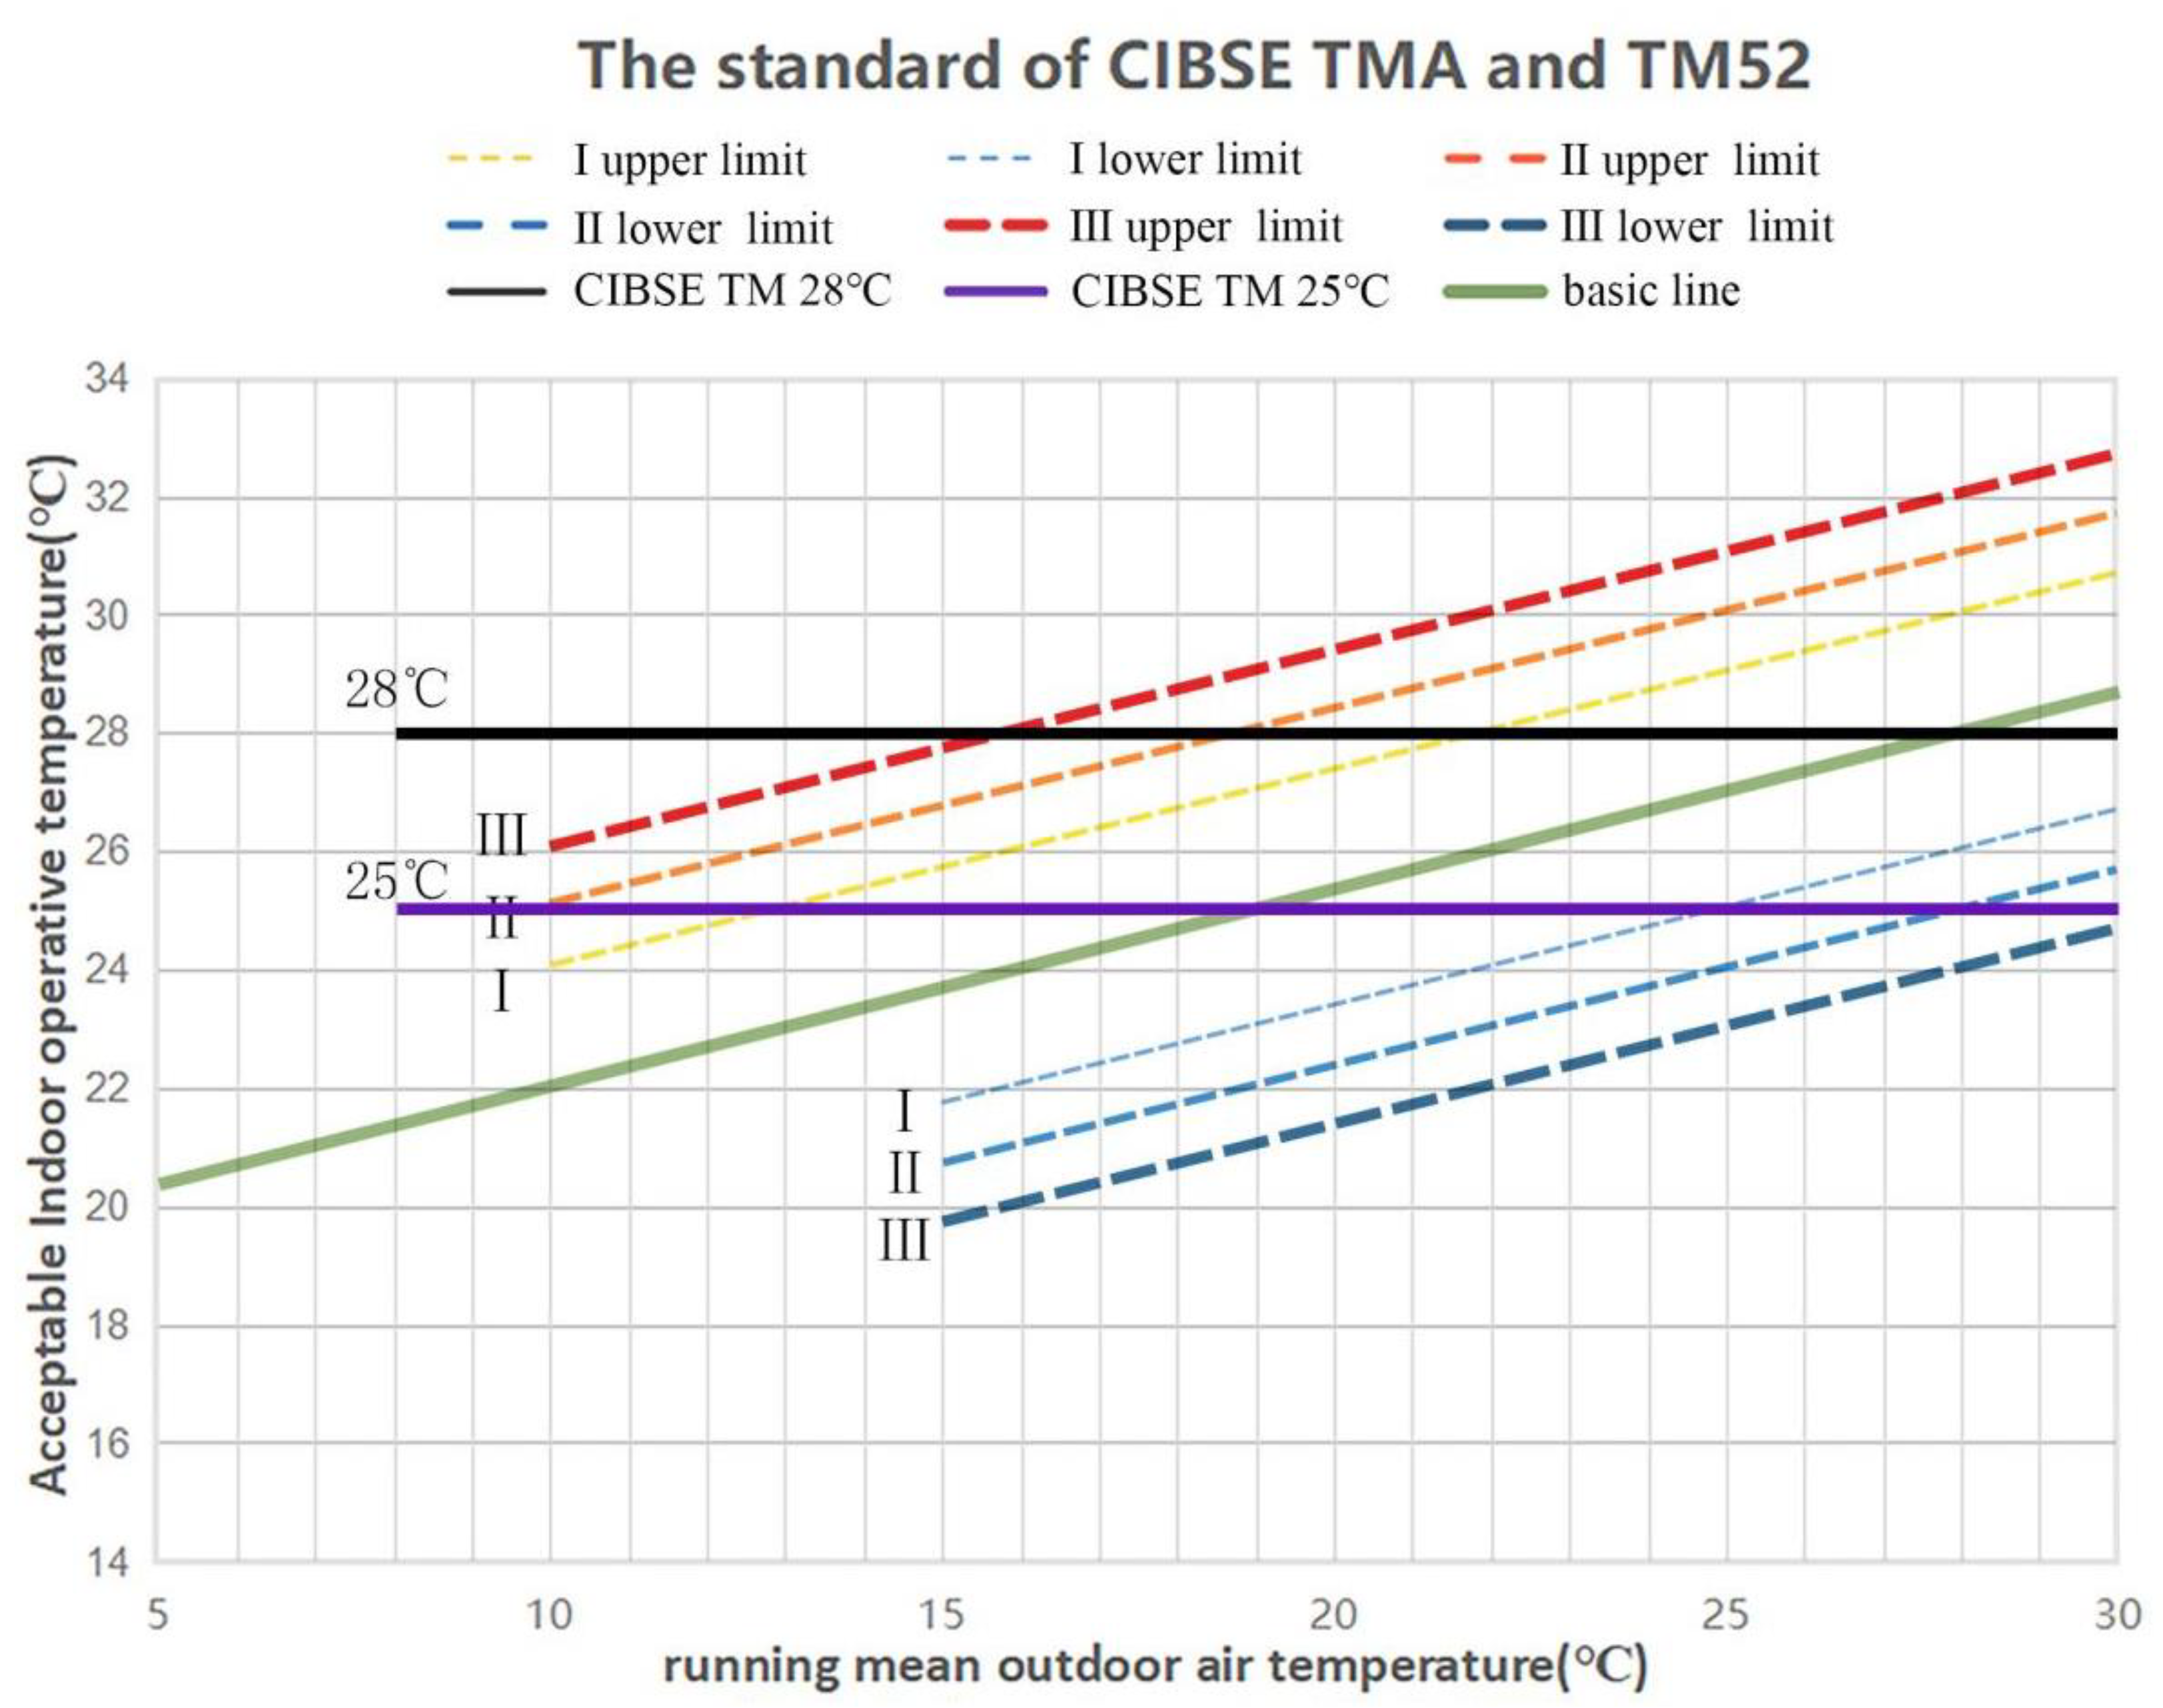
2.1. Thermal Comfort
2.2. Definition of Overheating
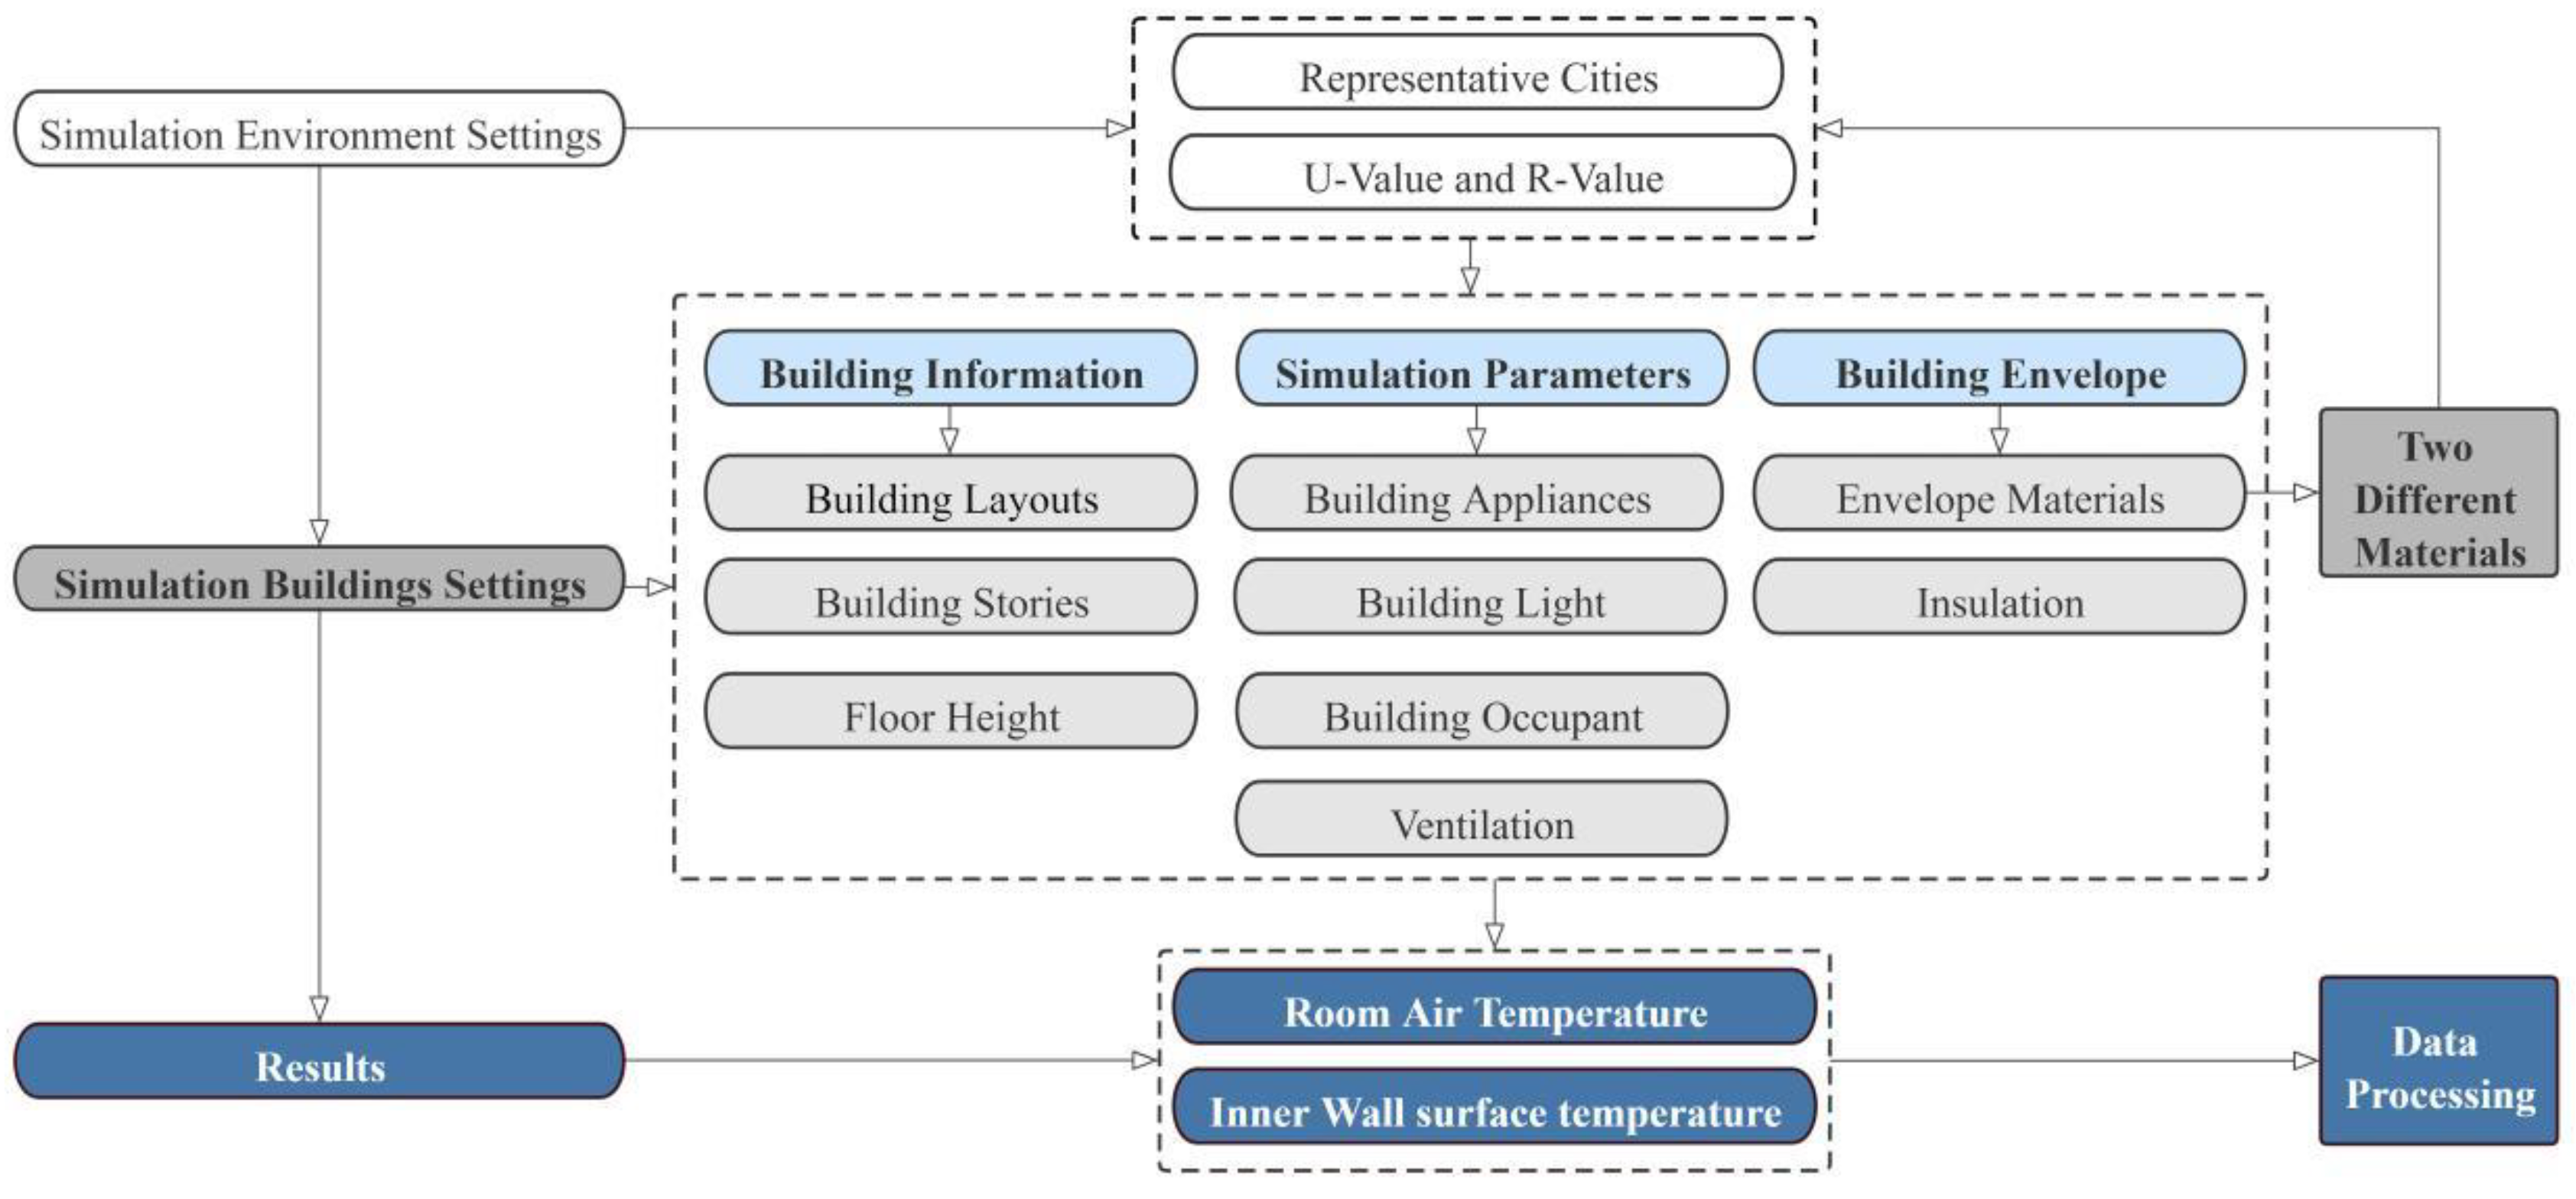
2.3. Framework of the Study
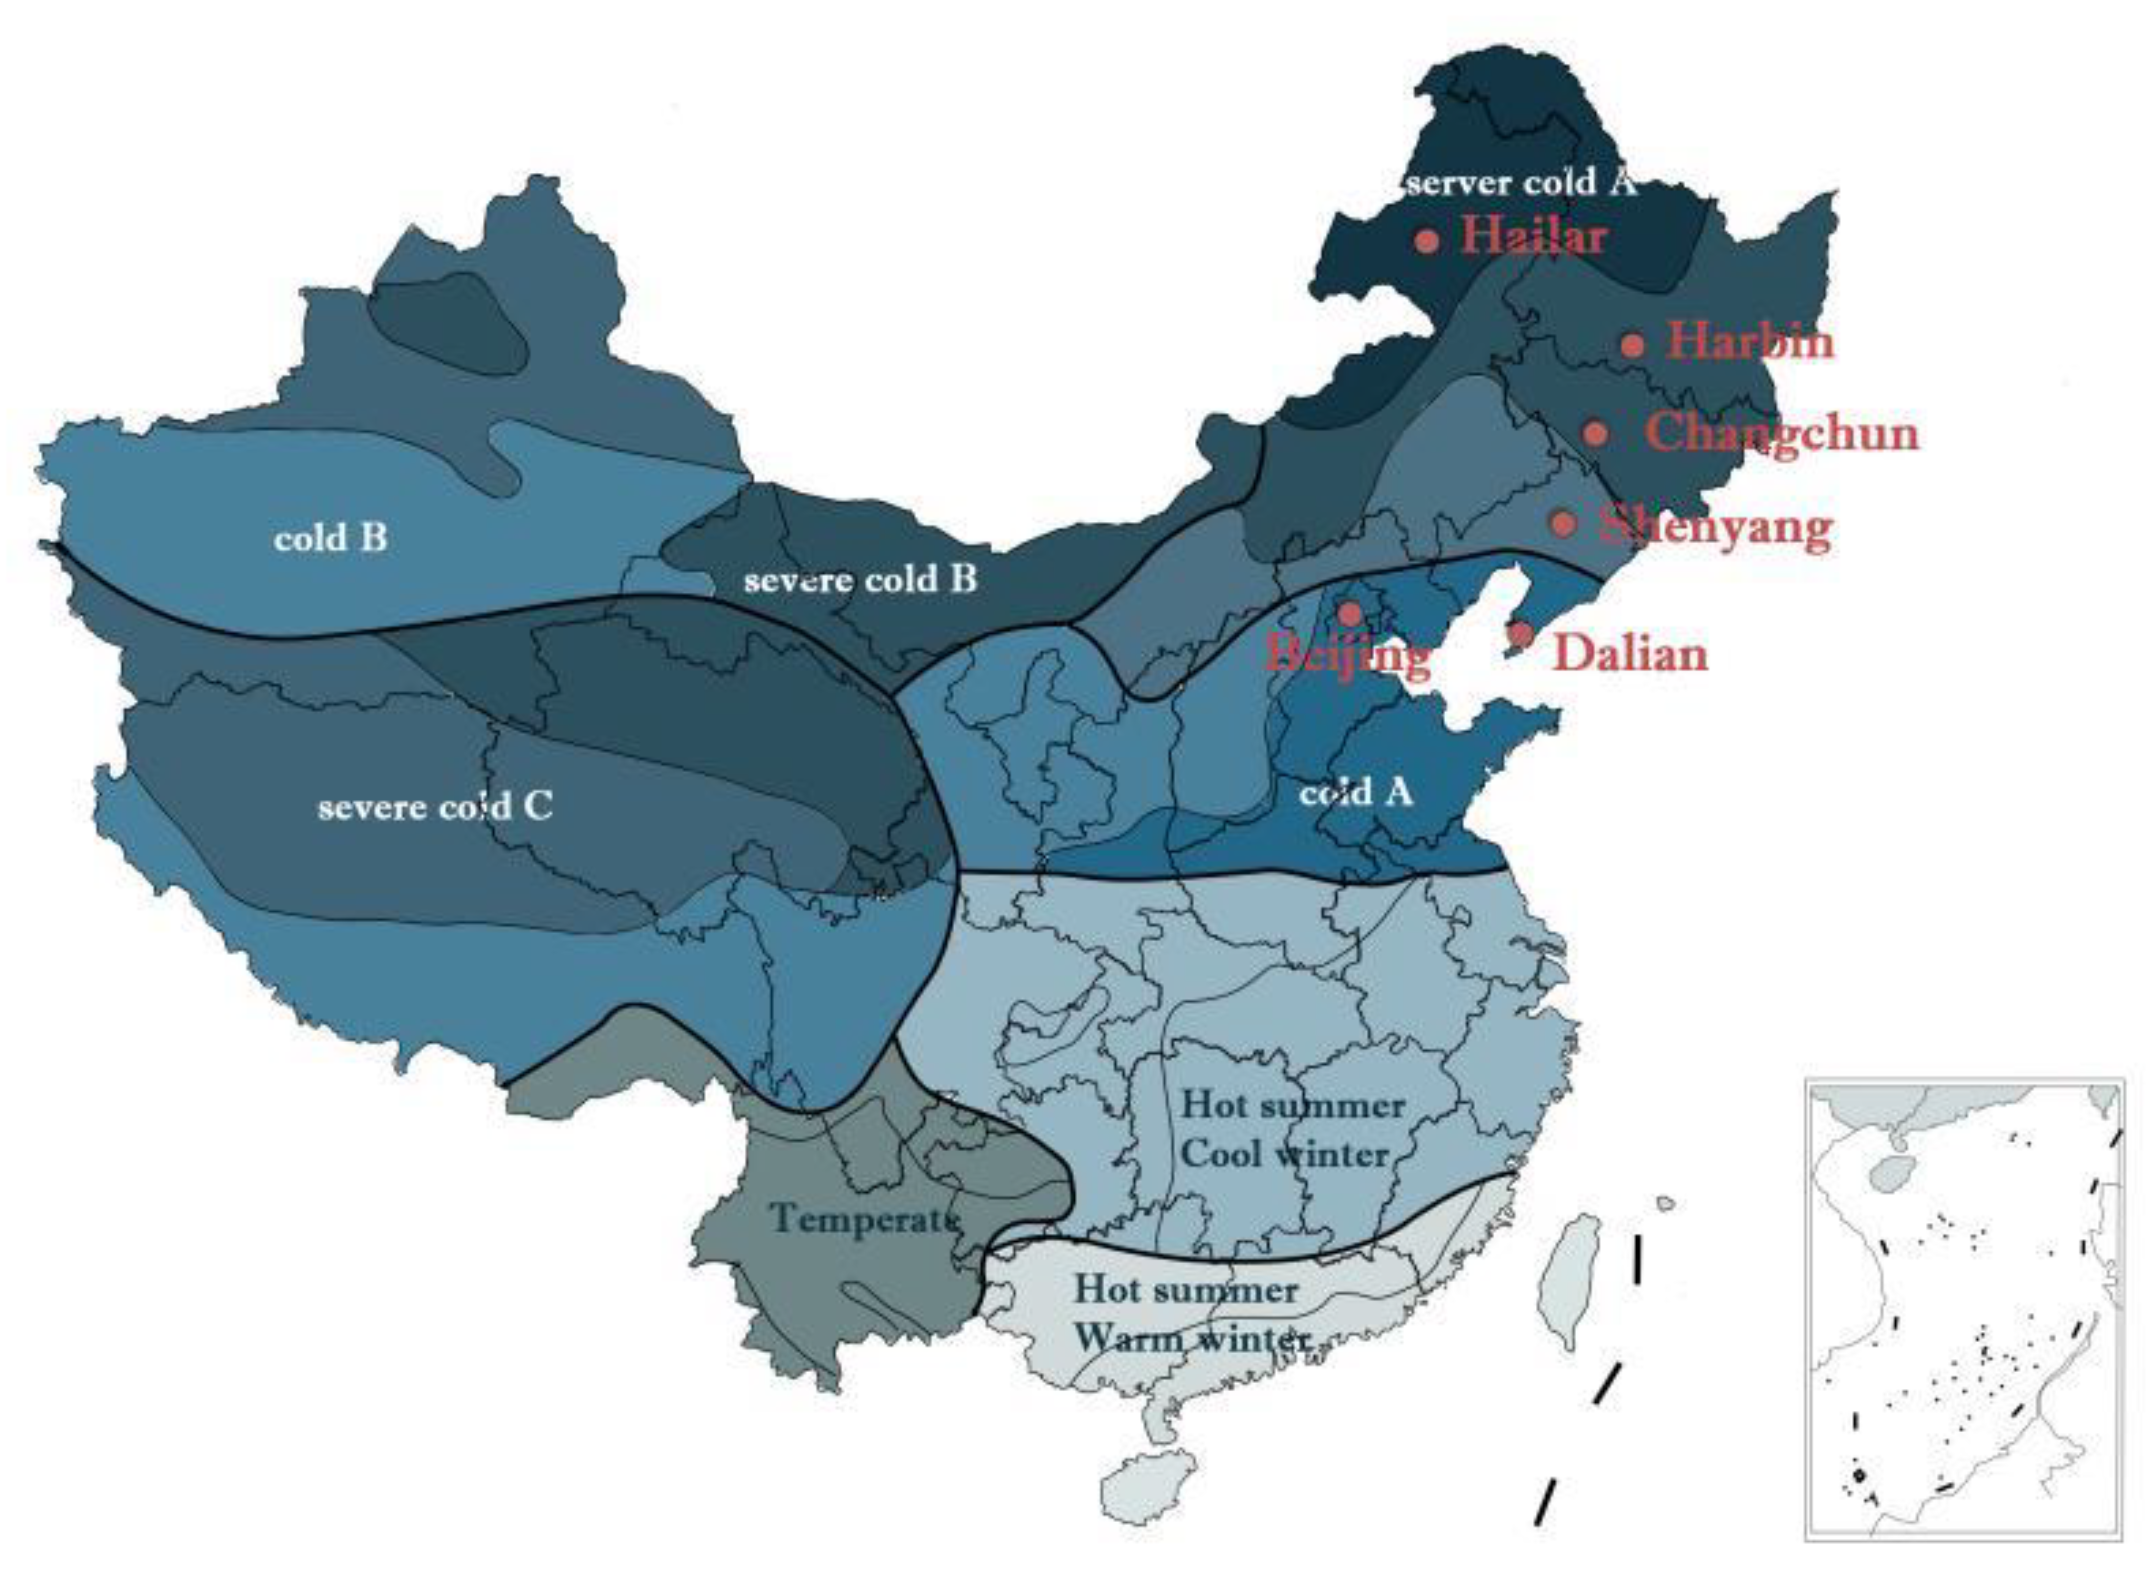
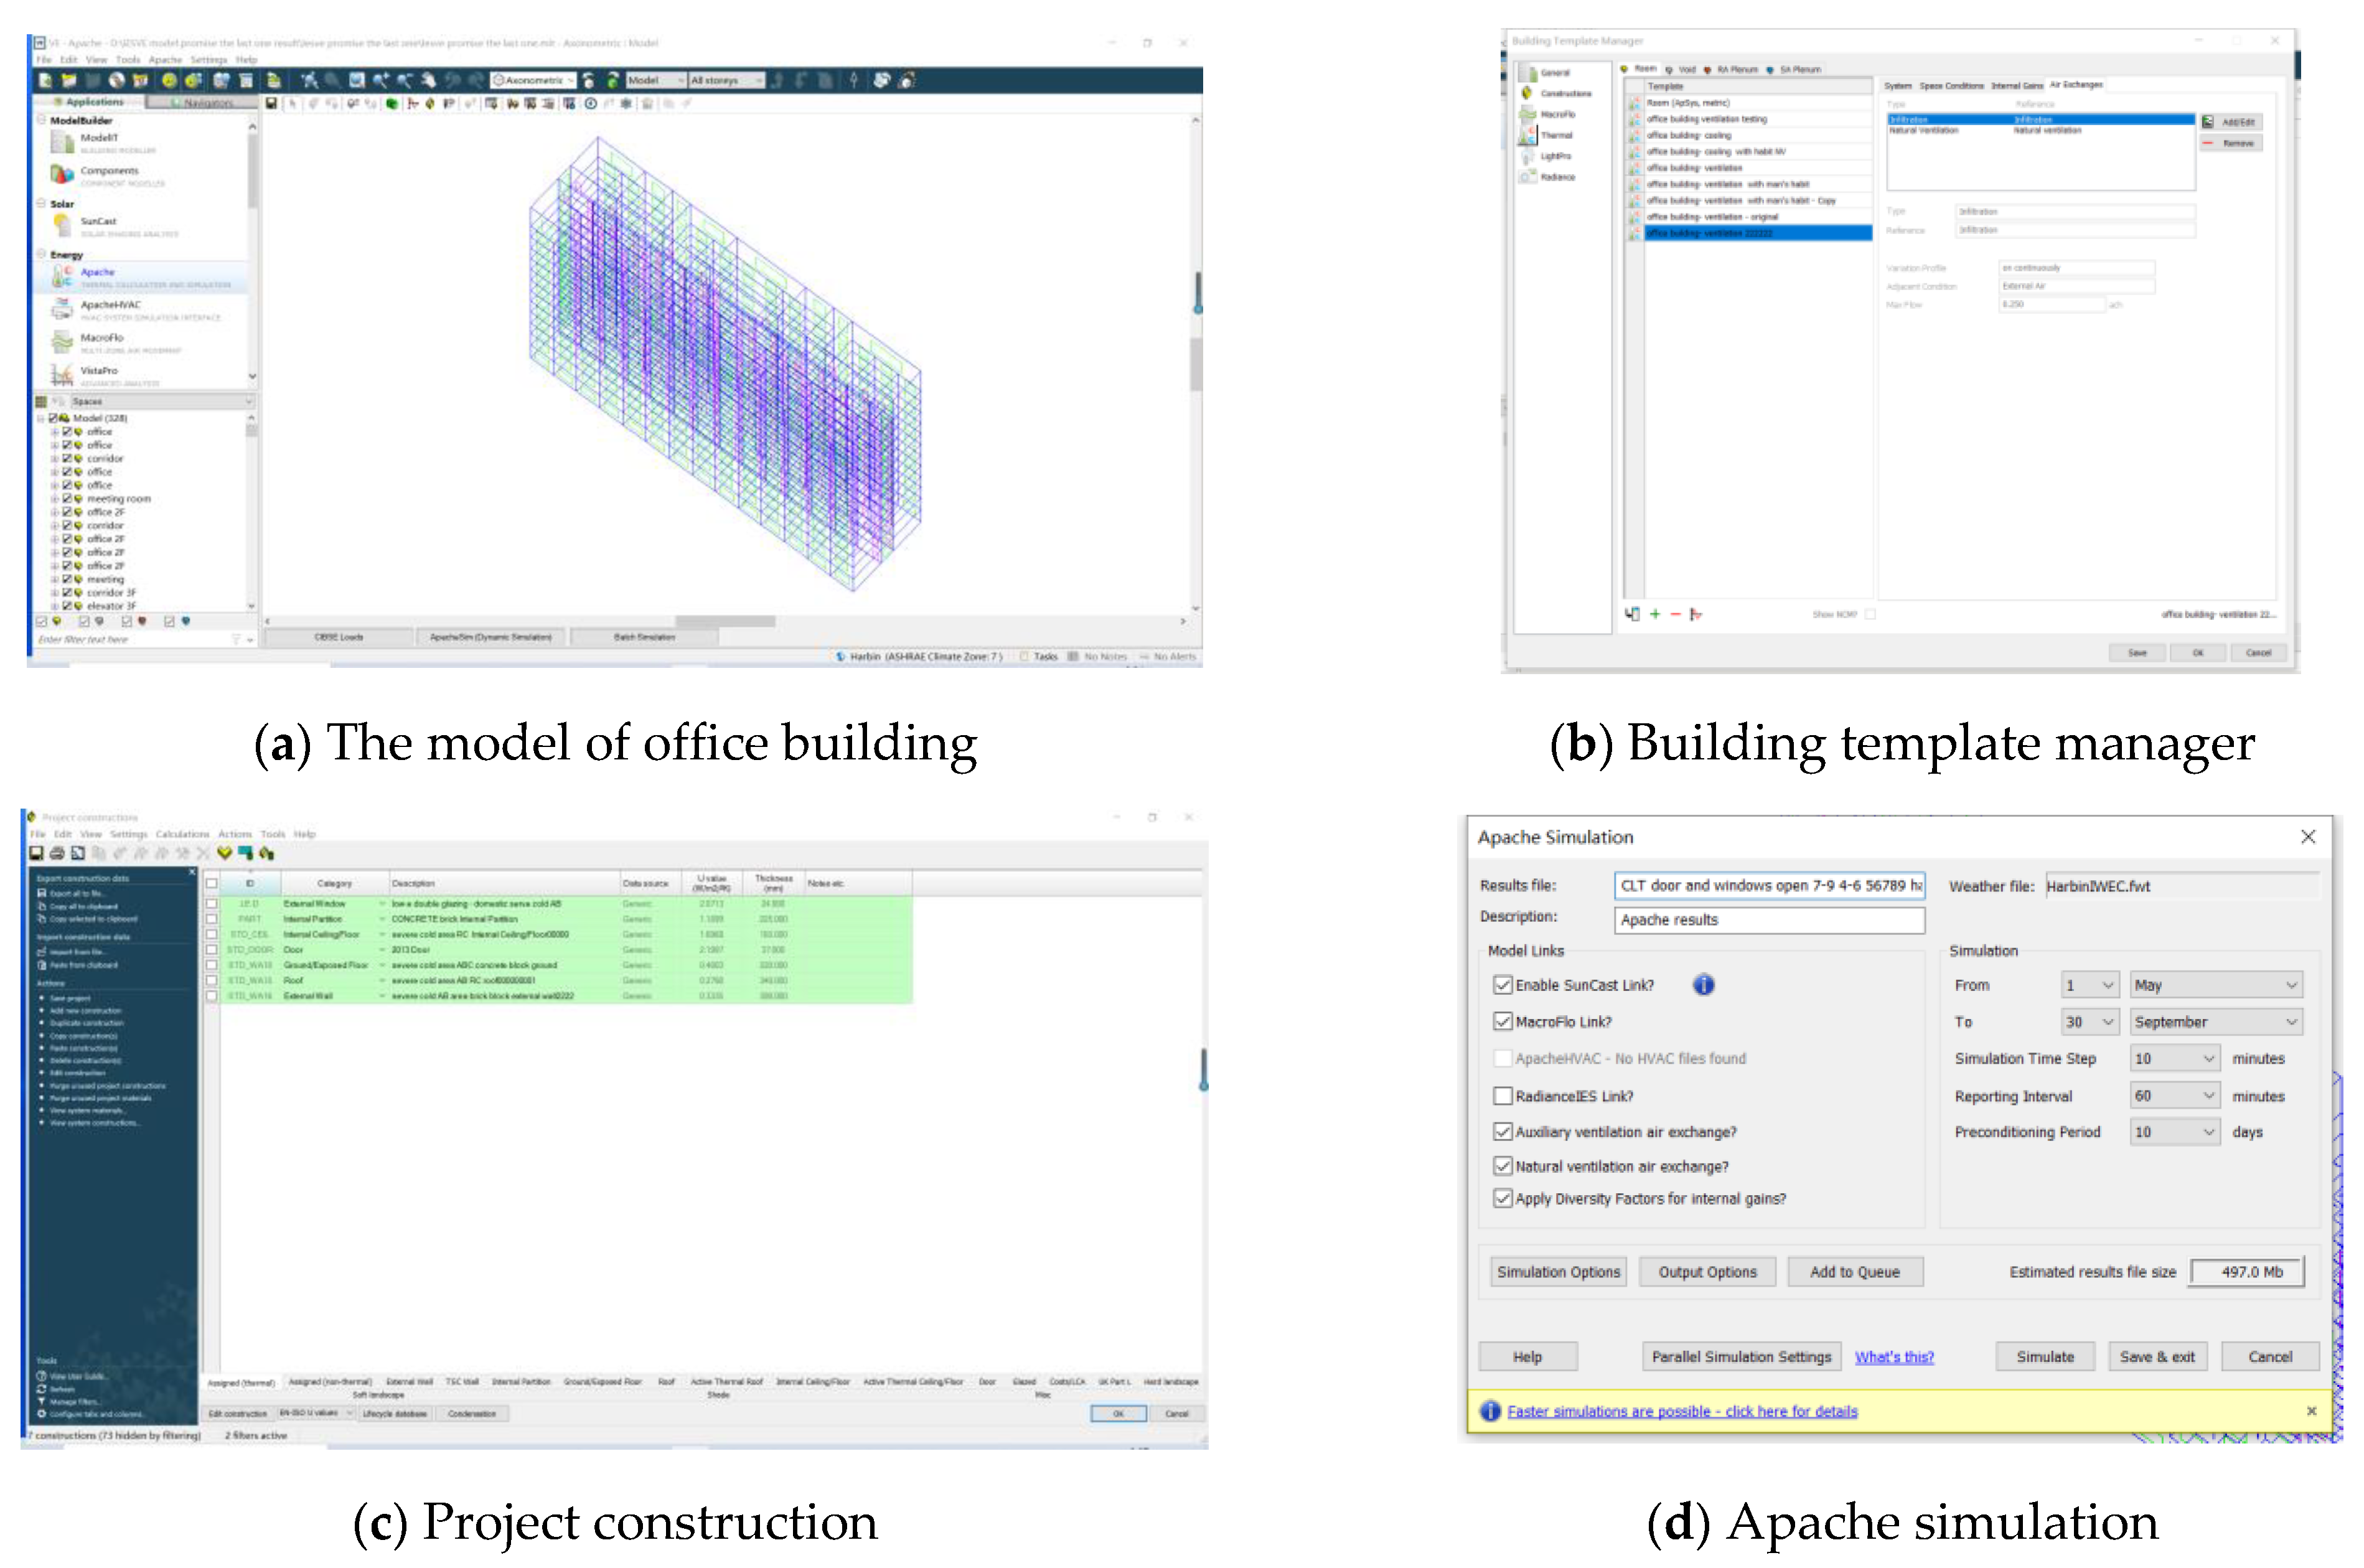
2.4. Simulation Environment
- U is thermal transmittance.
- Rt is the total thermal resistance of all materials.
- Rsi means interior surface thermal resistance (according to the norm by climatic zone).
- Rse means exterior surface thermal resistance (according to the norm by climatic zone).
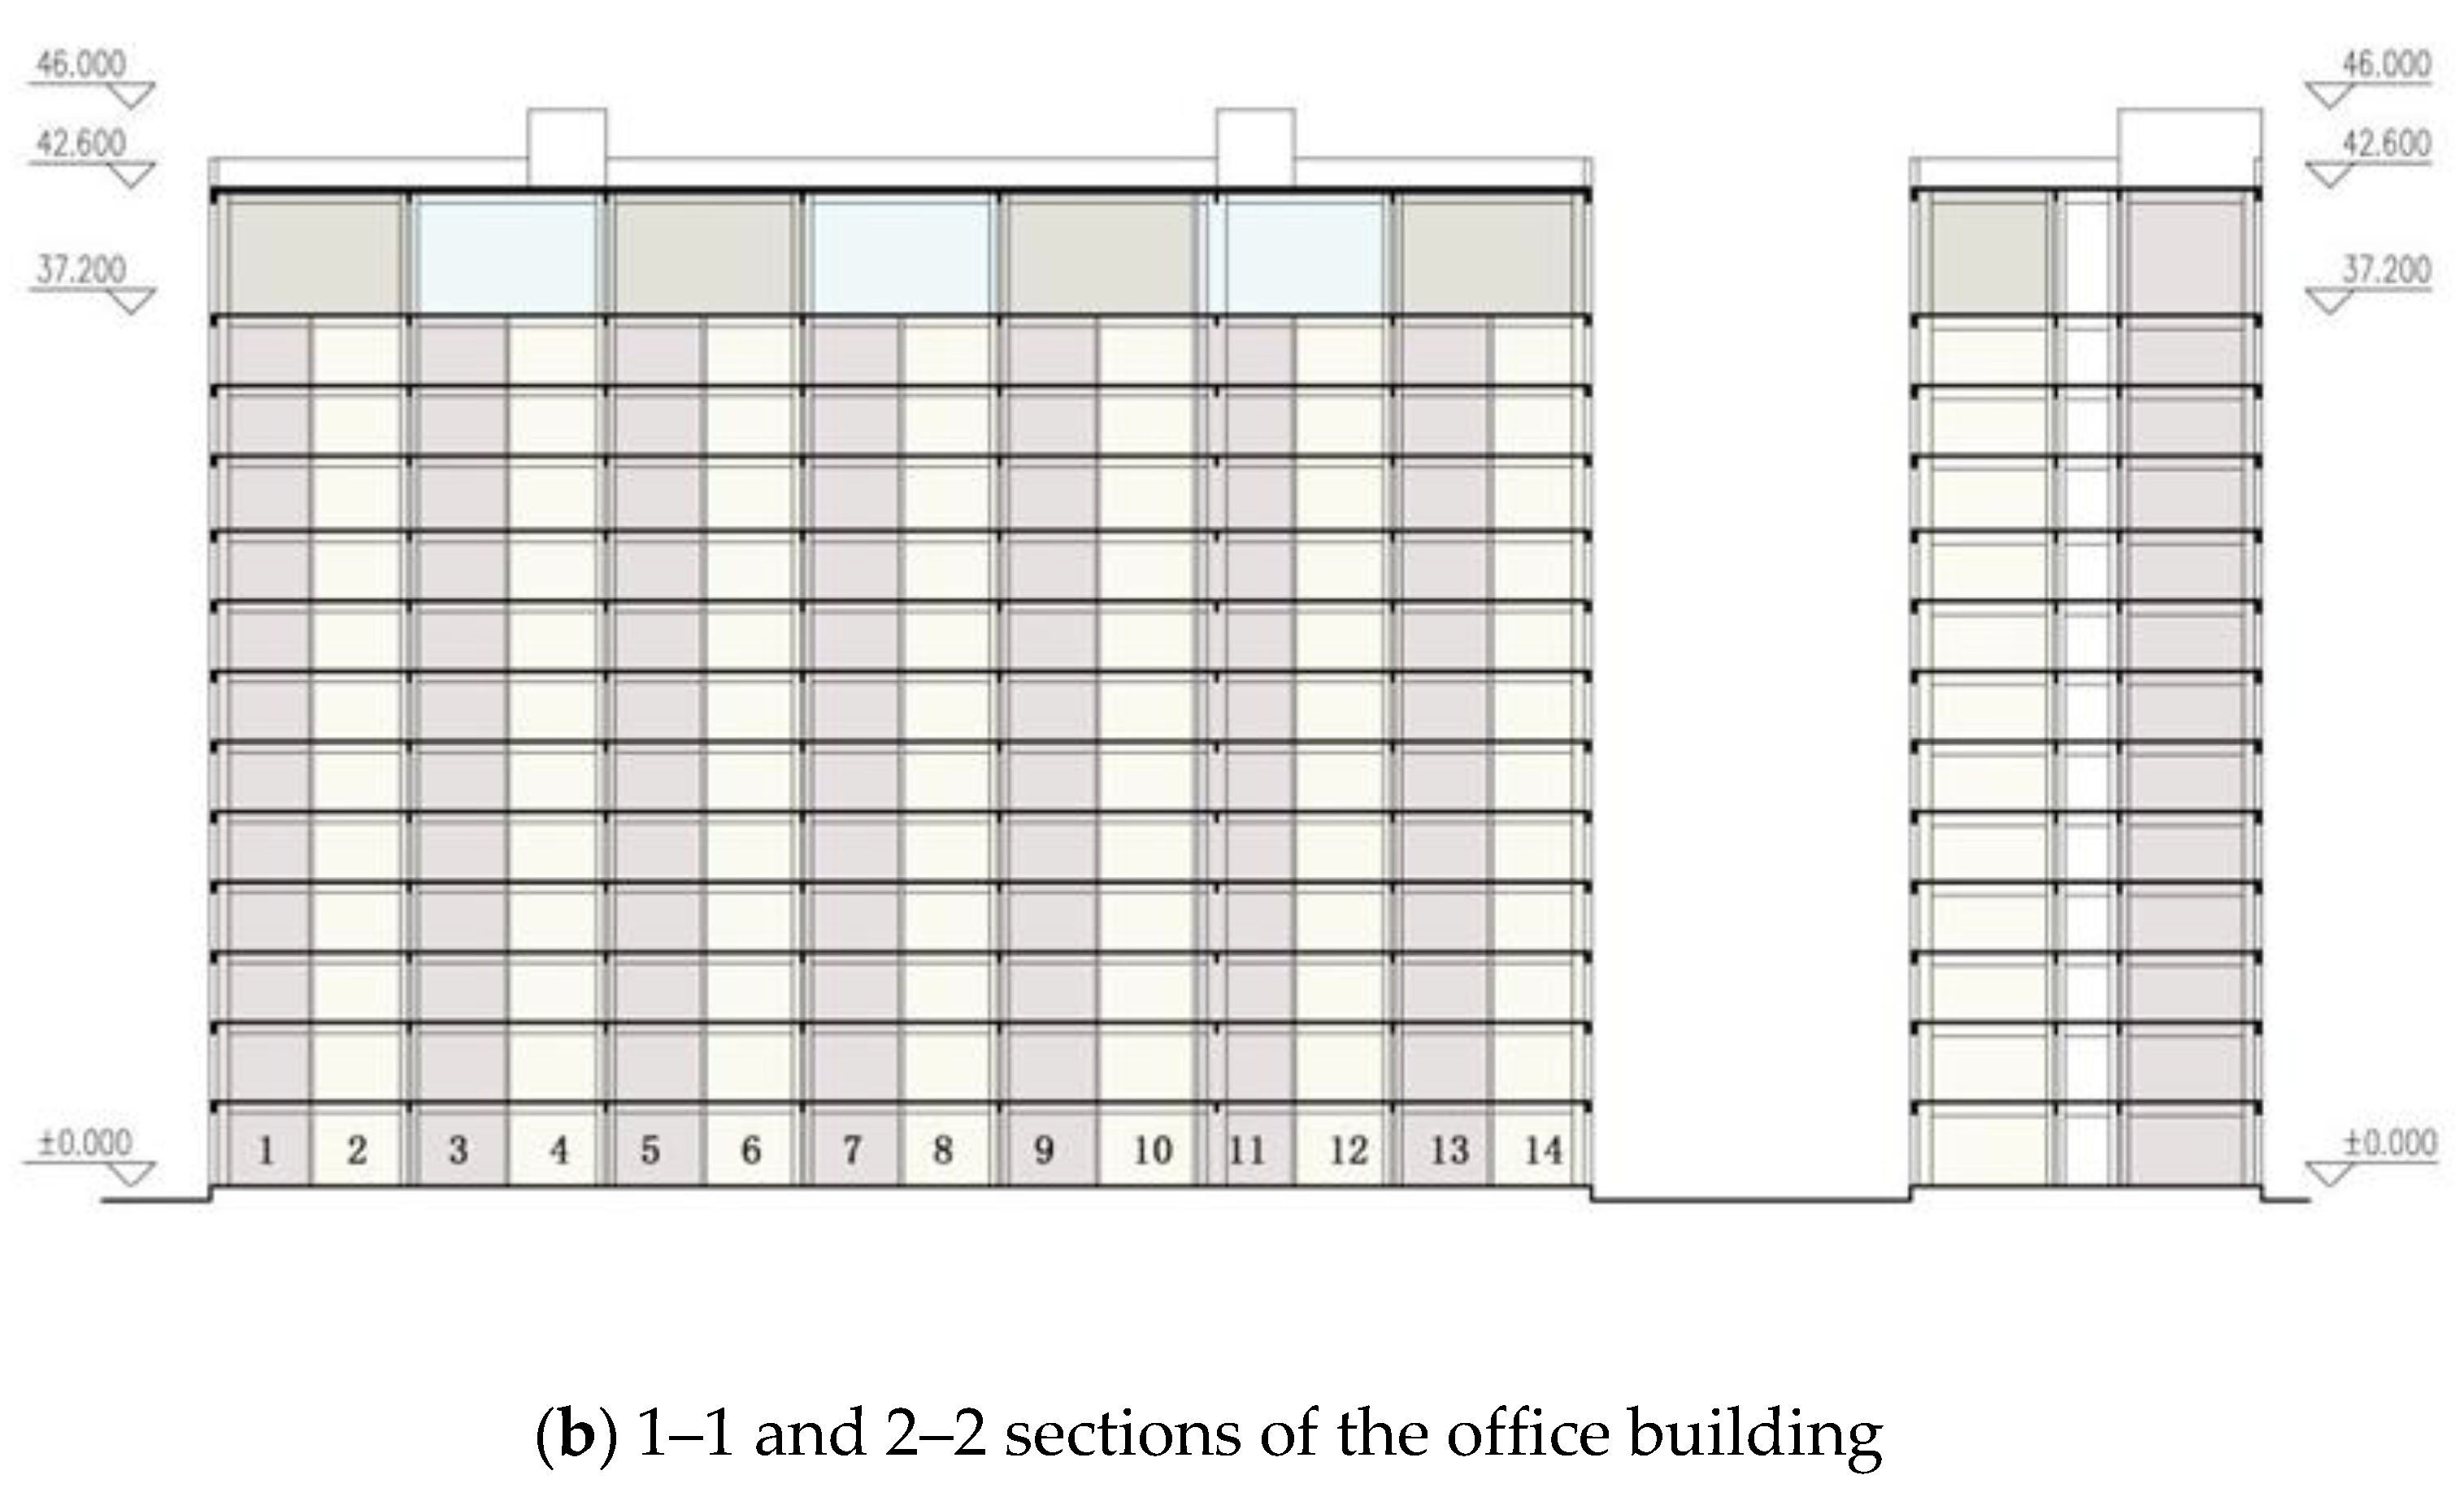
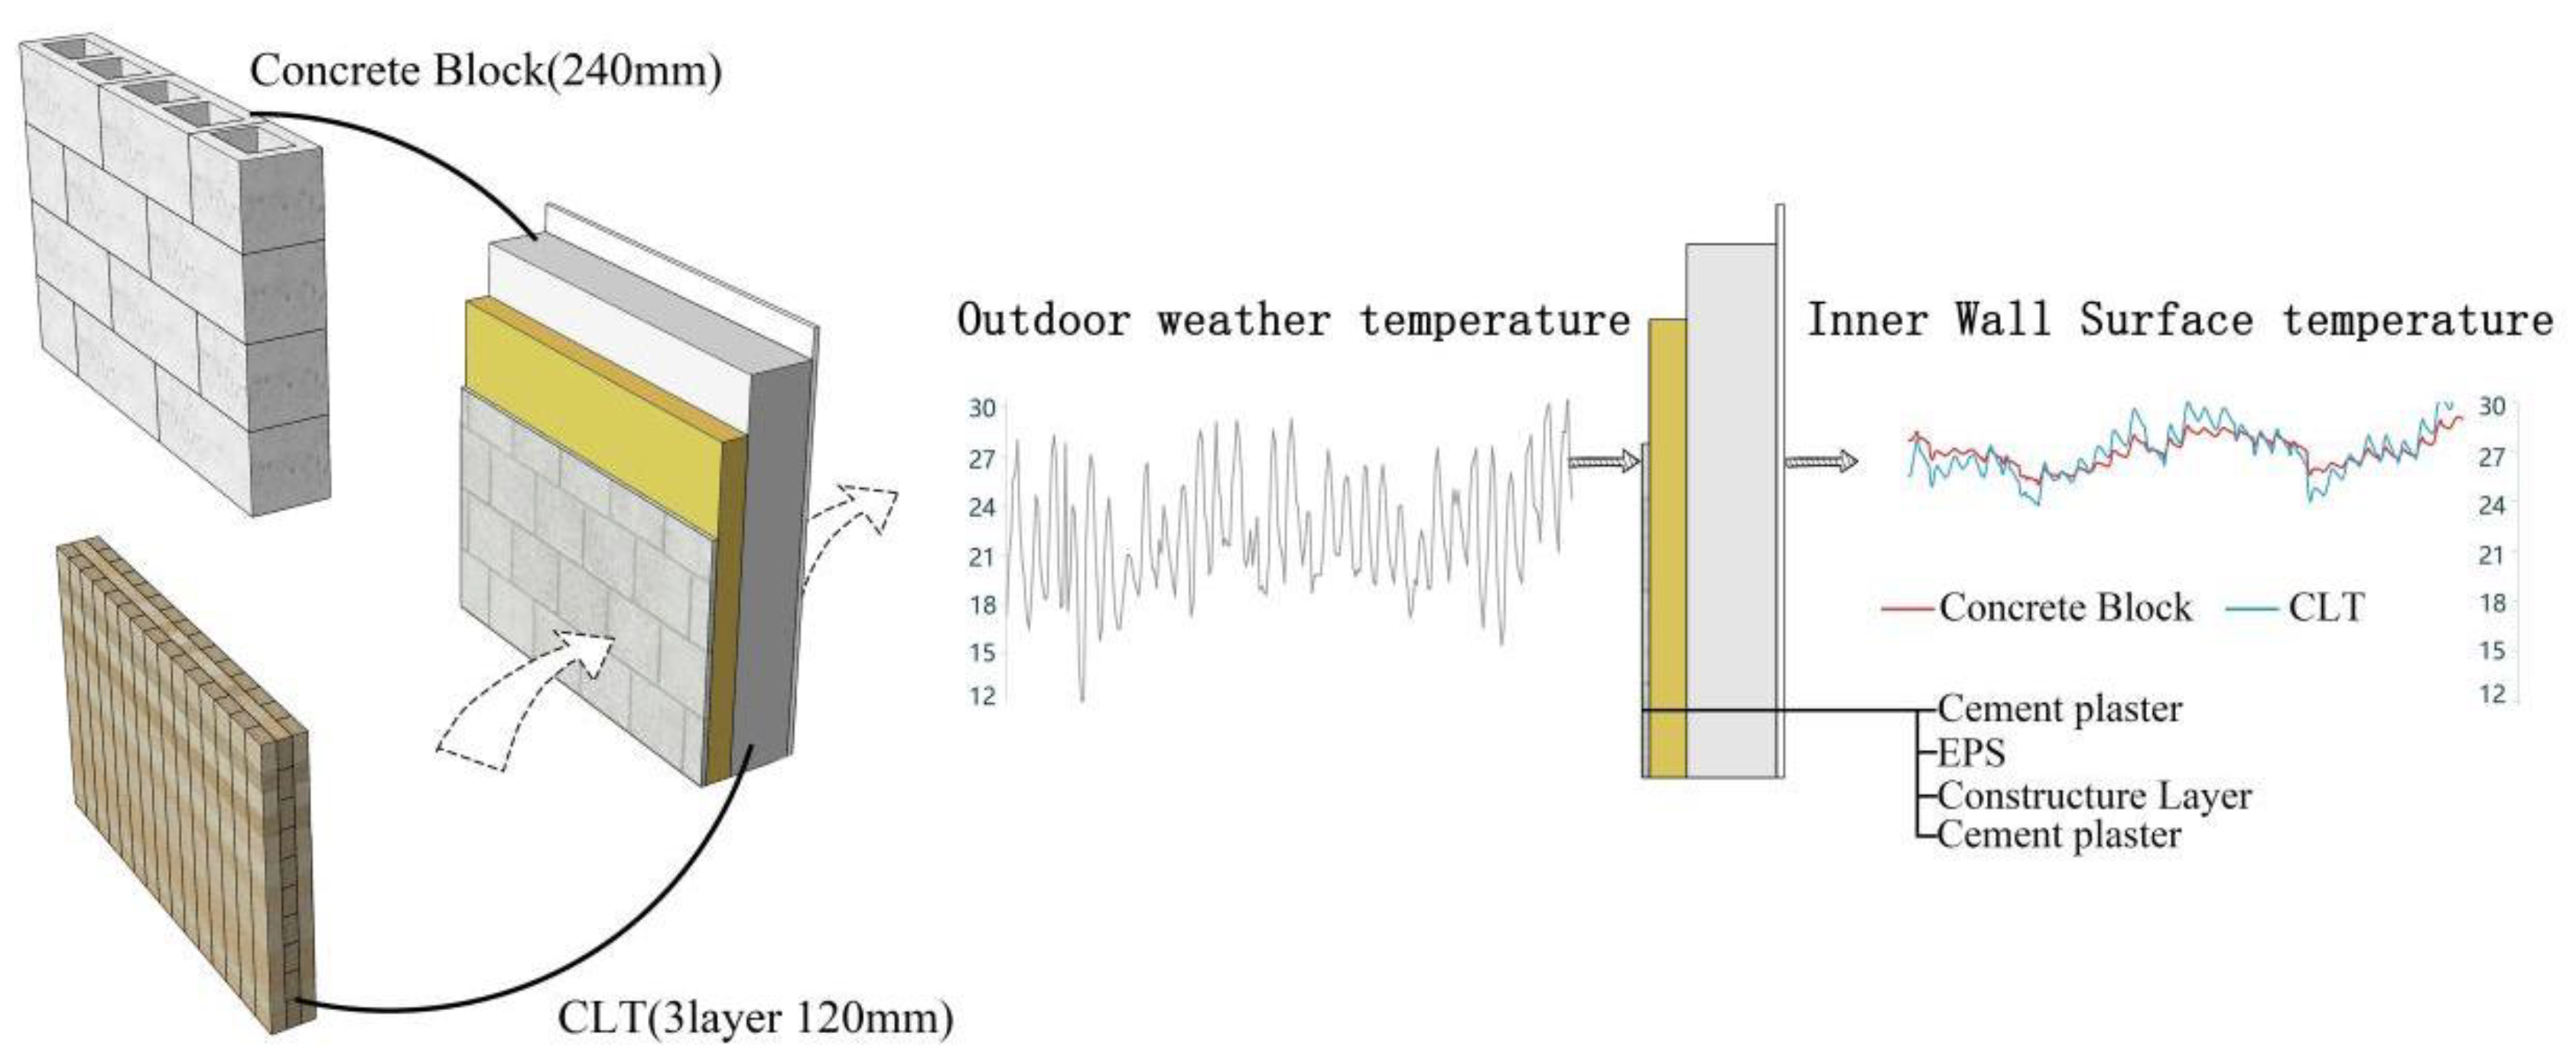
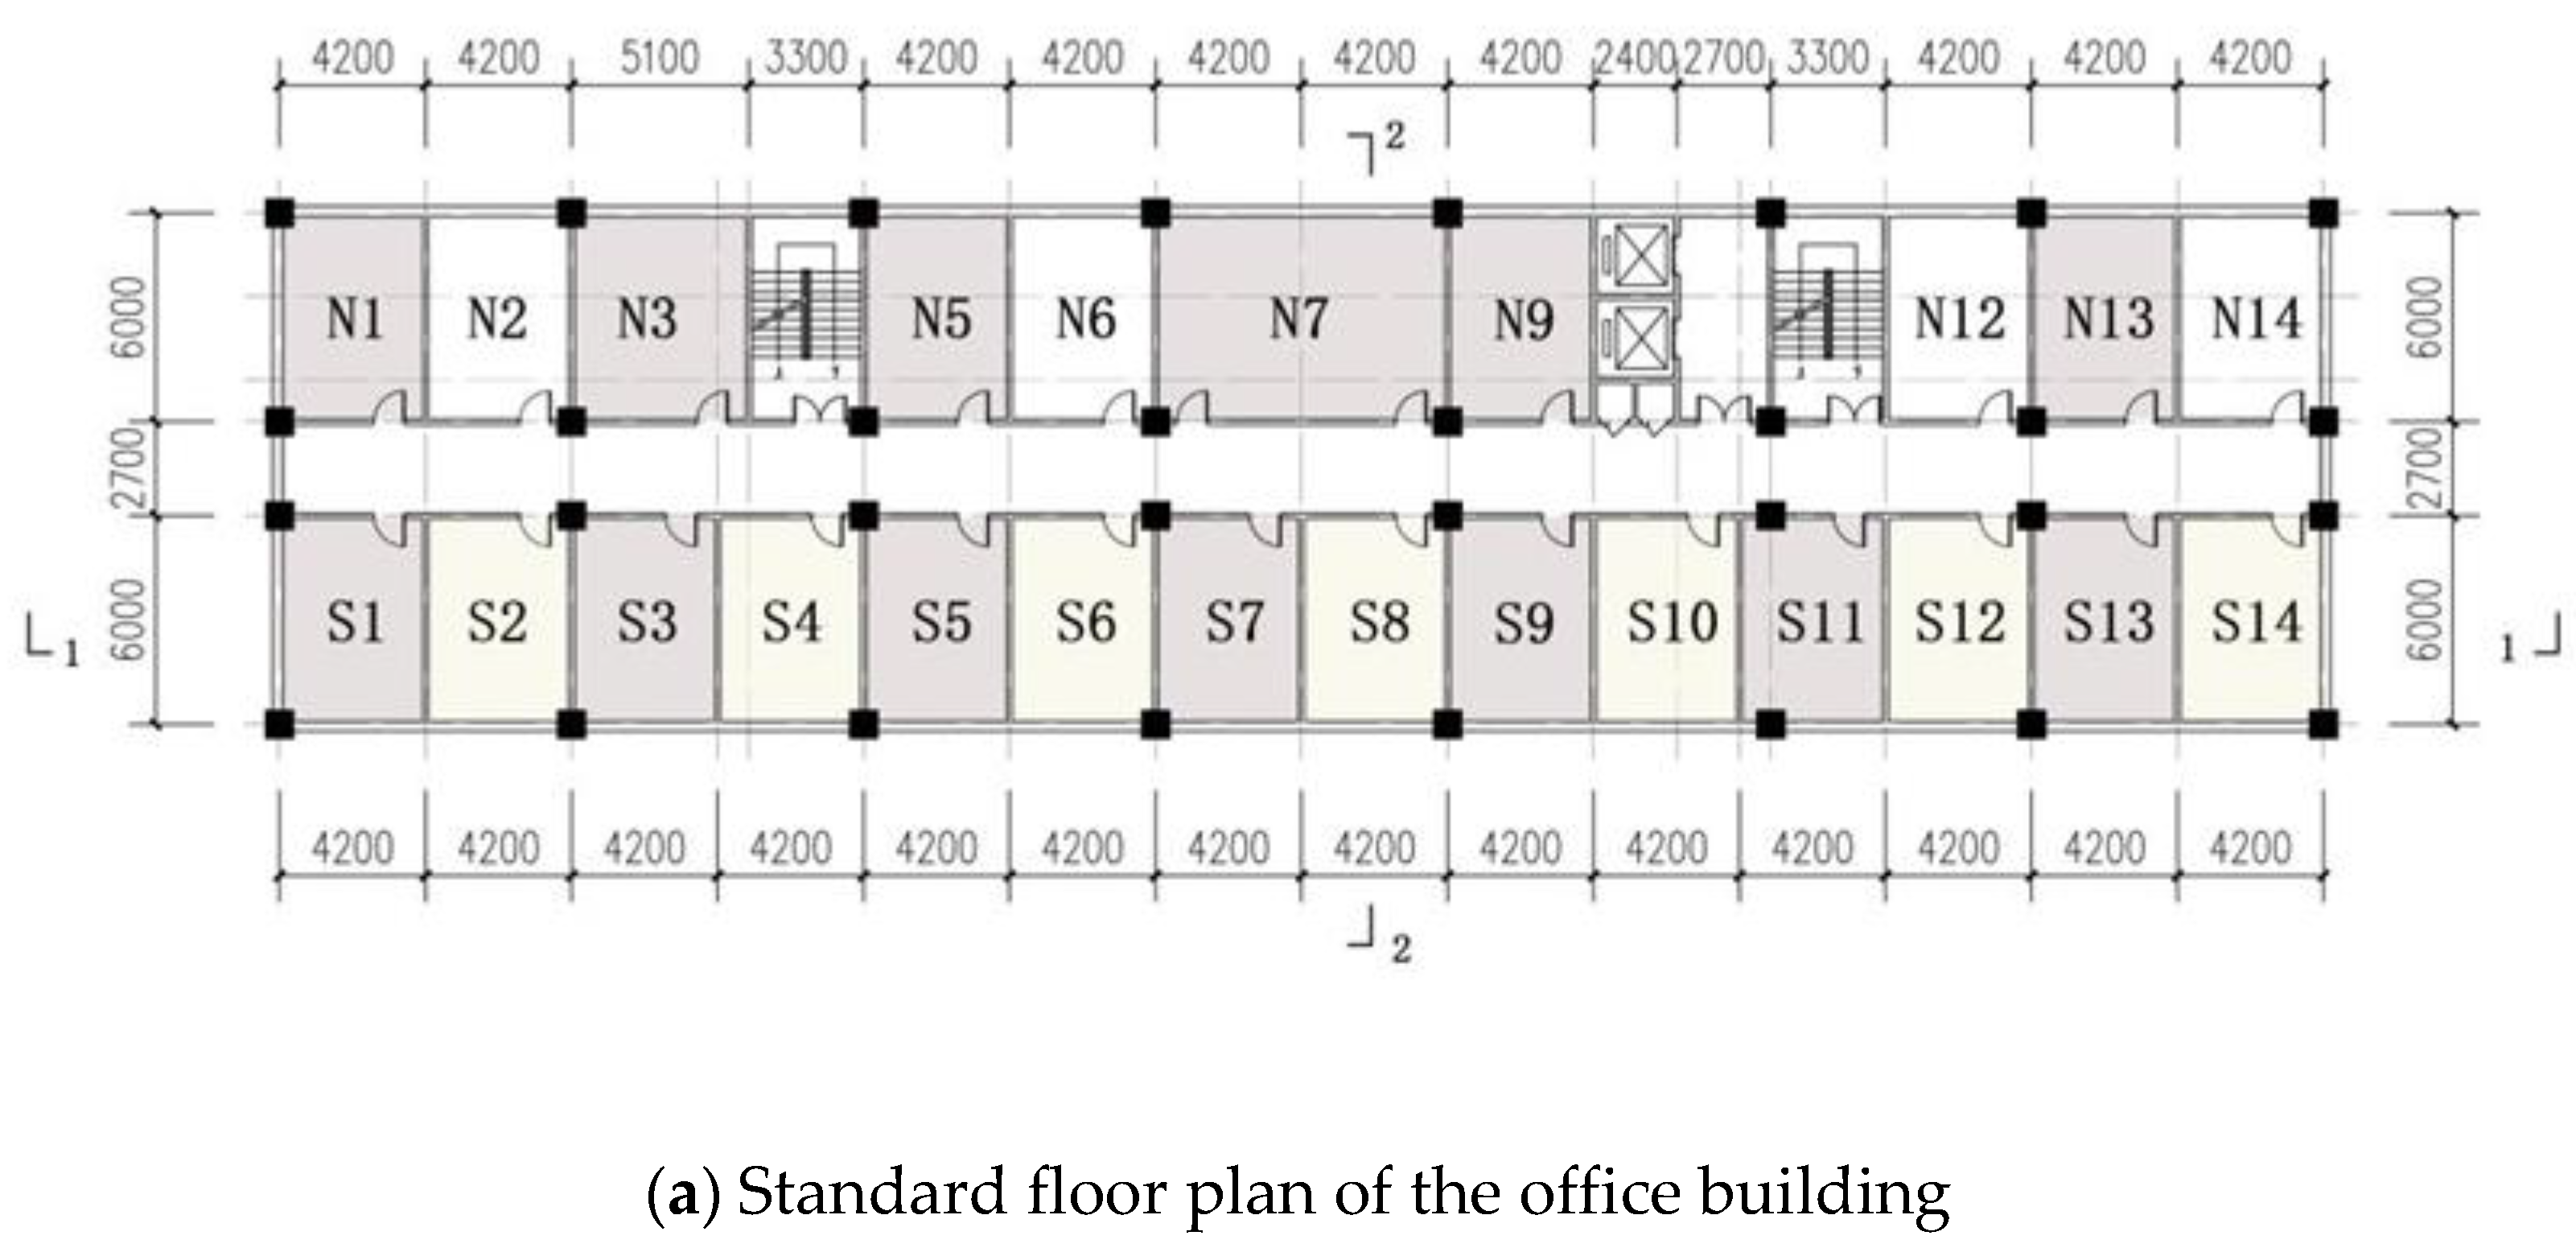
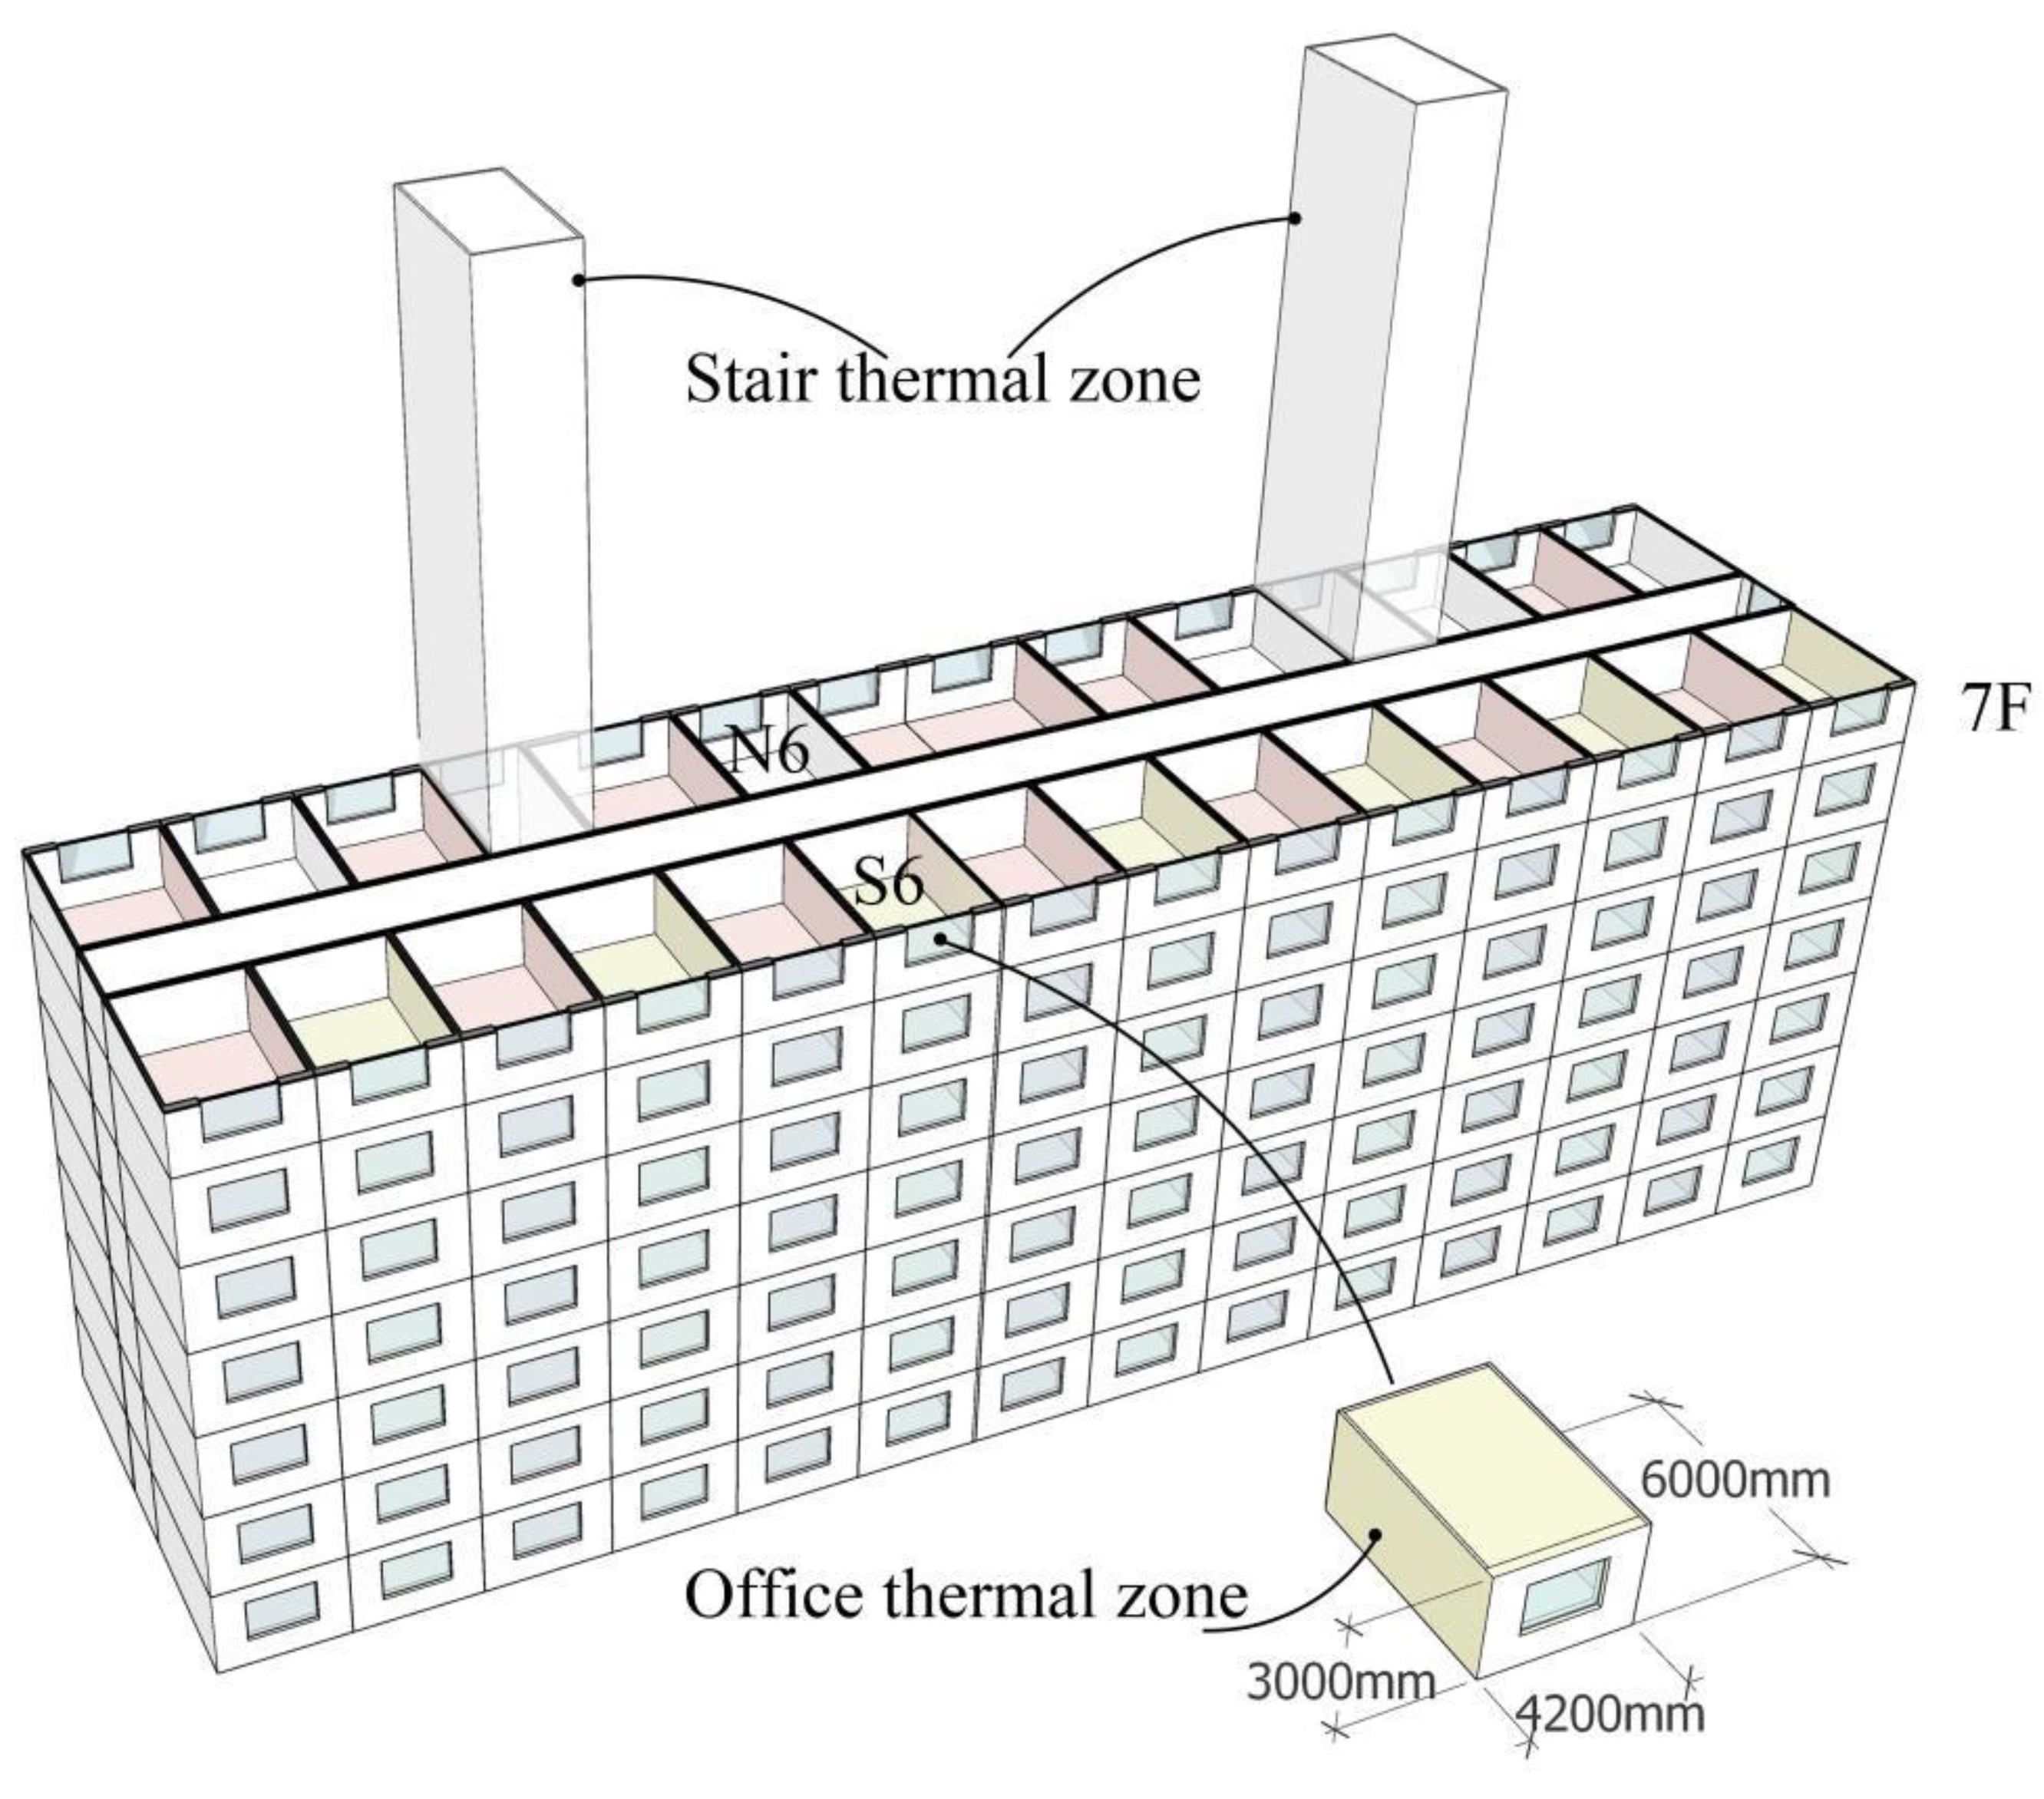
2.5. Details of the Simulation Building
2.6. Simulation Parameters
2.6.1. Simulation Rooms
2.6.2. Ventilation
2.6.3. Appliances and Lighting
3. Results and Analysis
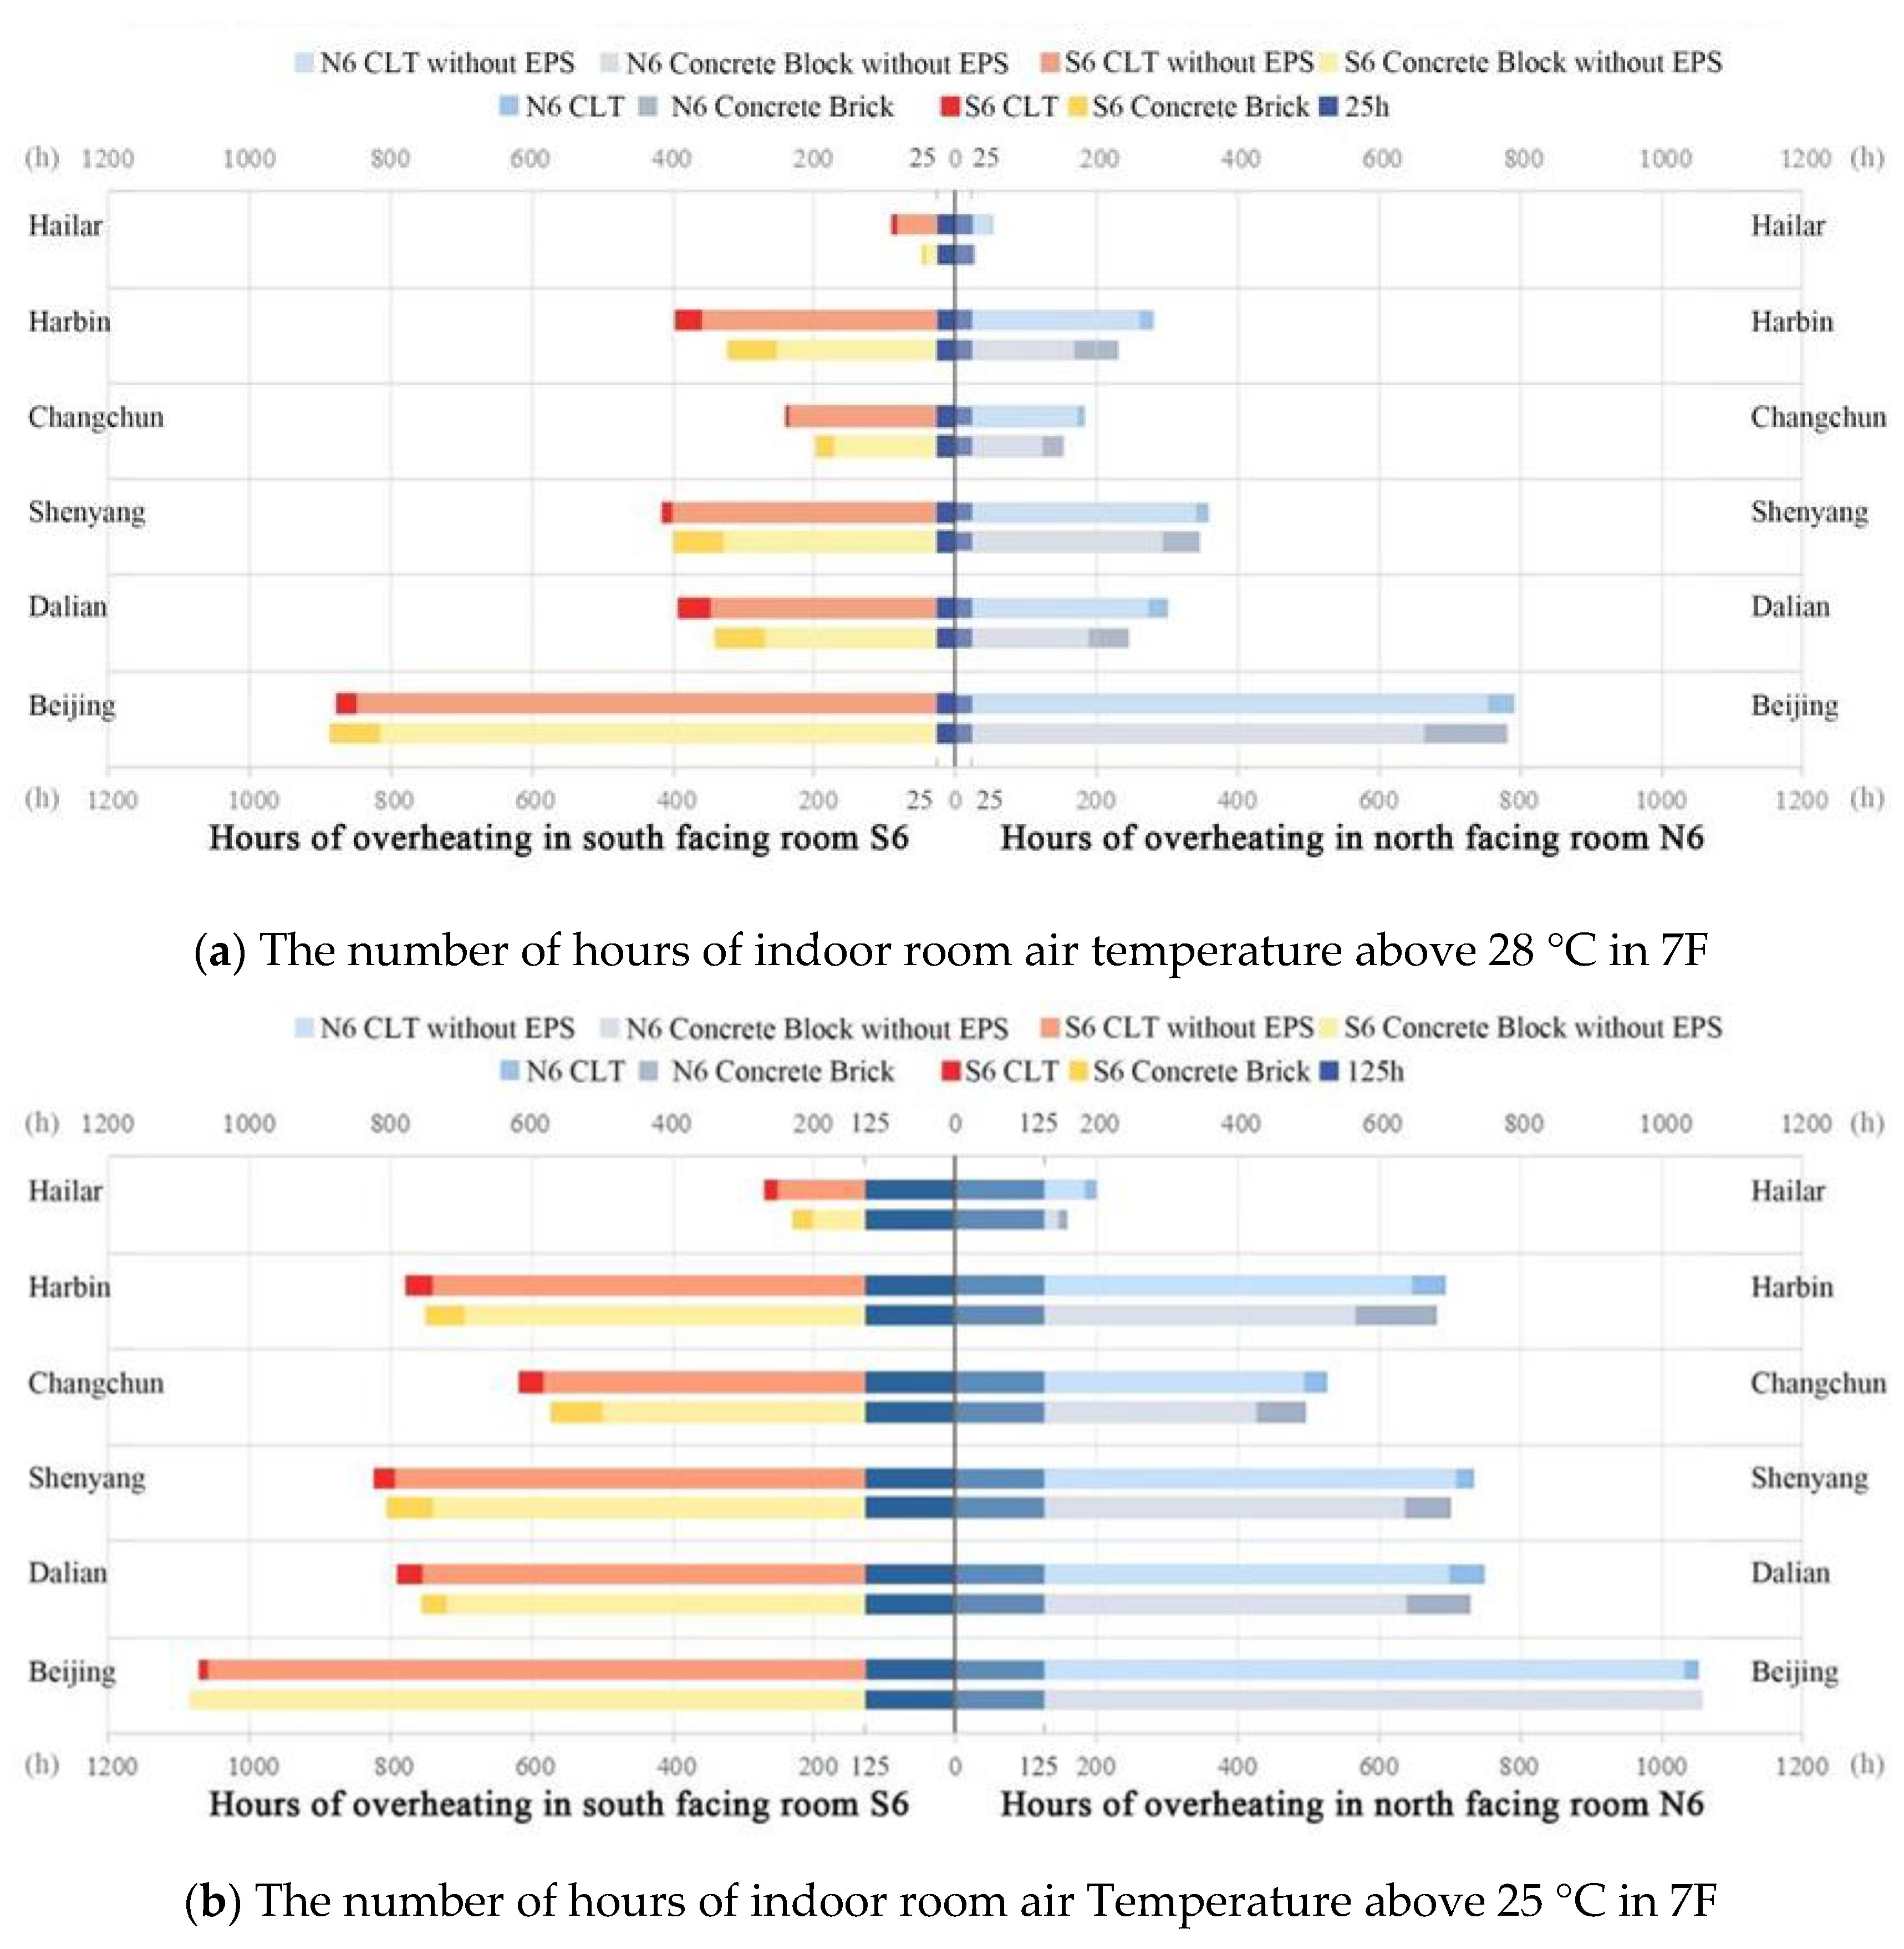
3.1. The Degree of Overheating
3.1.1. CIBSE TMA
3.1.2. CIBSE TM52
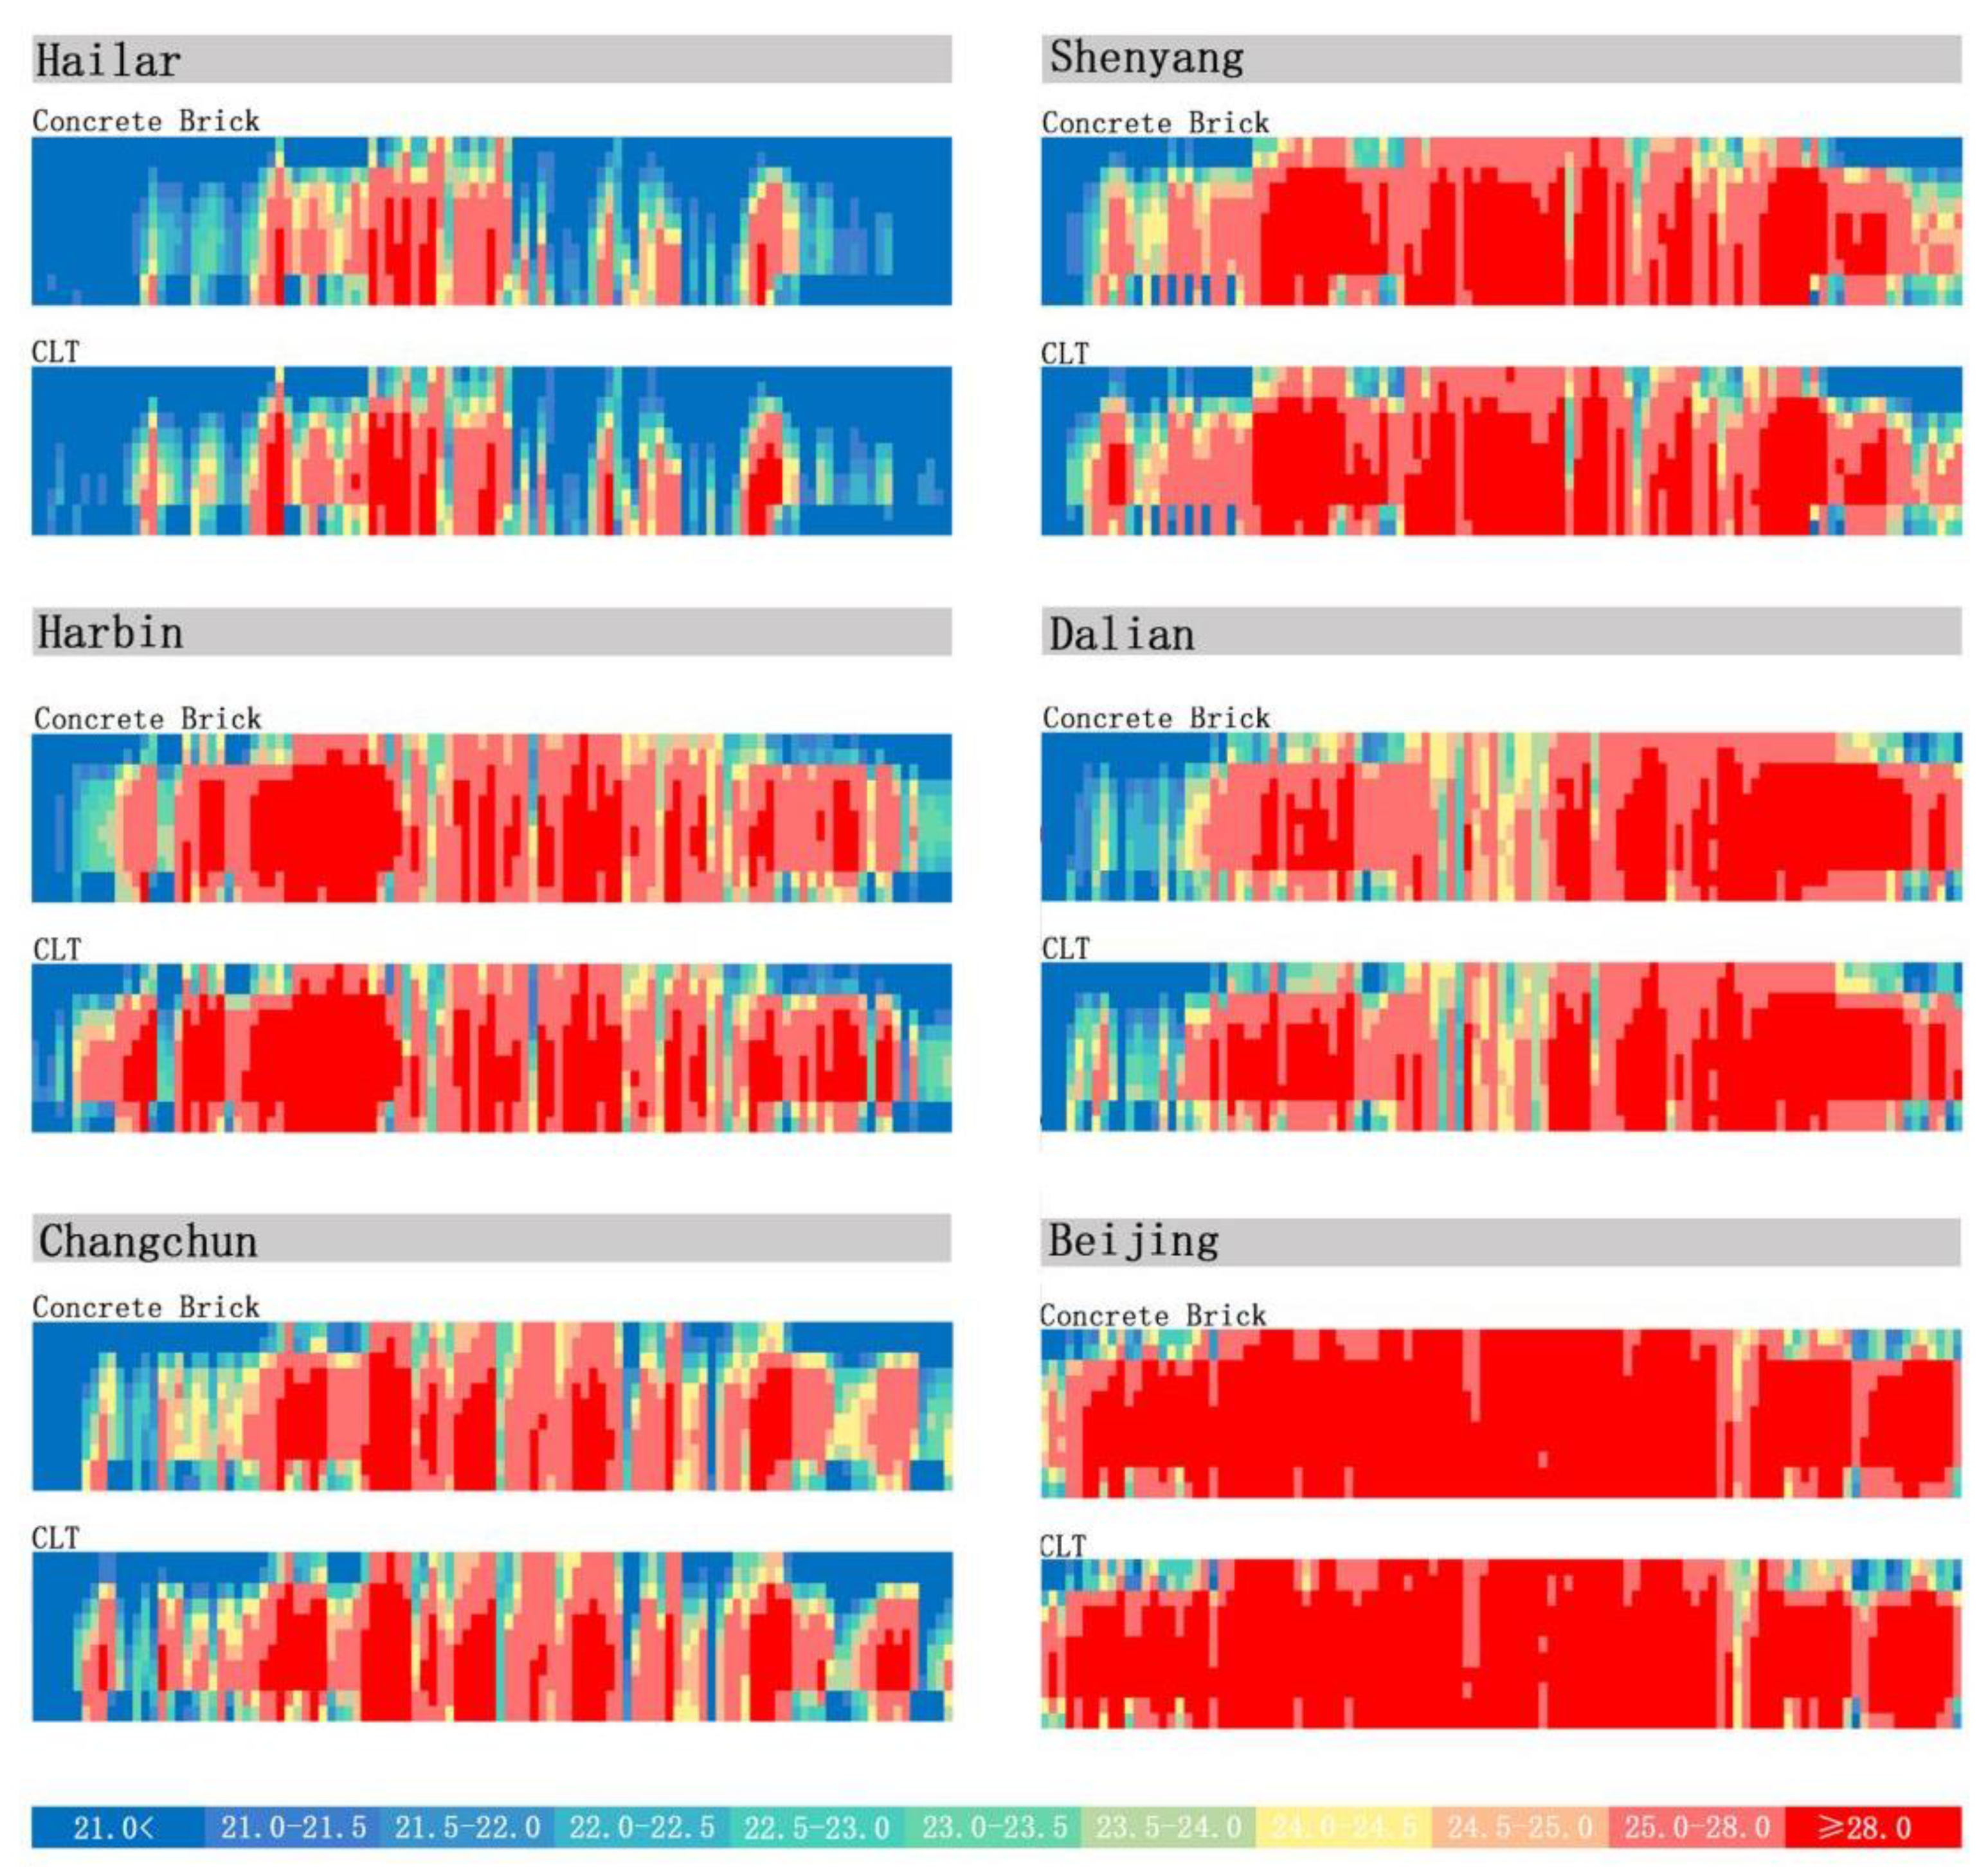
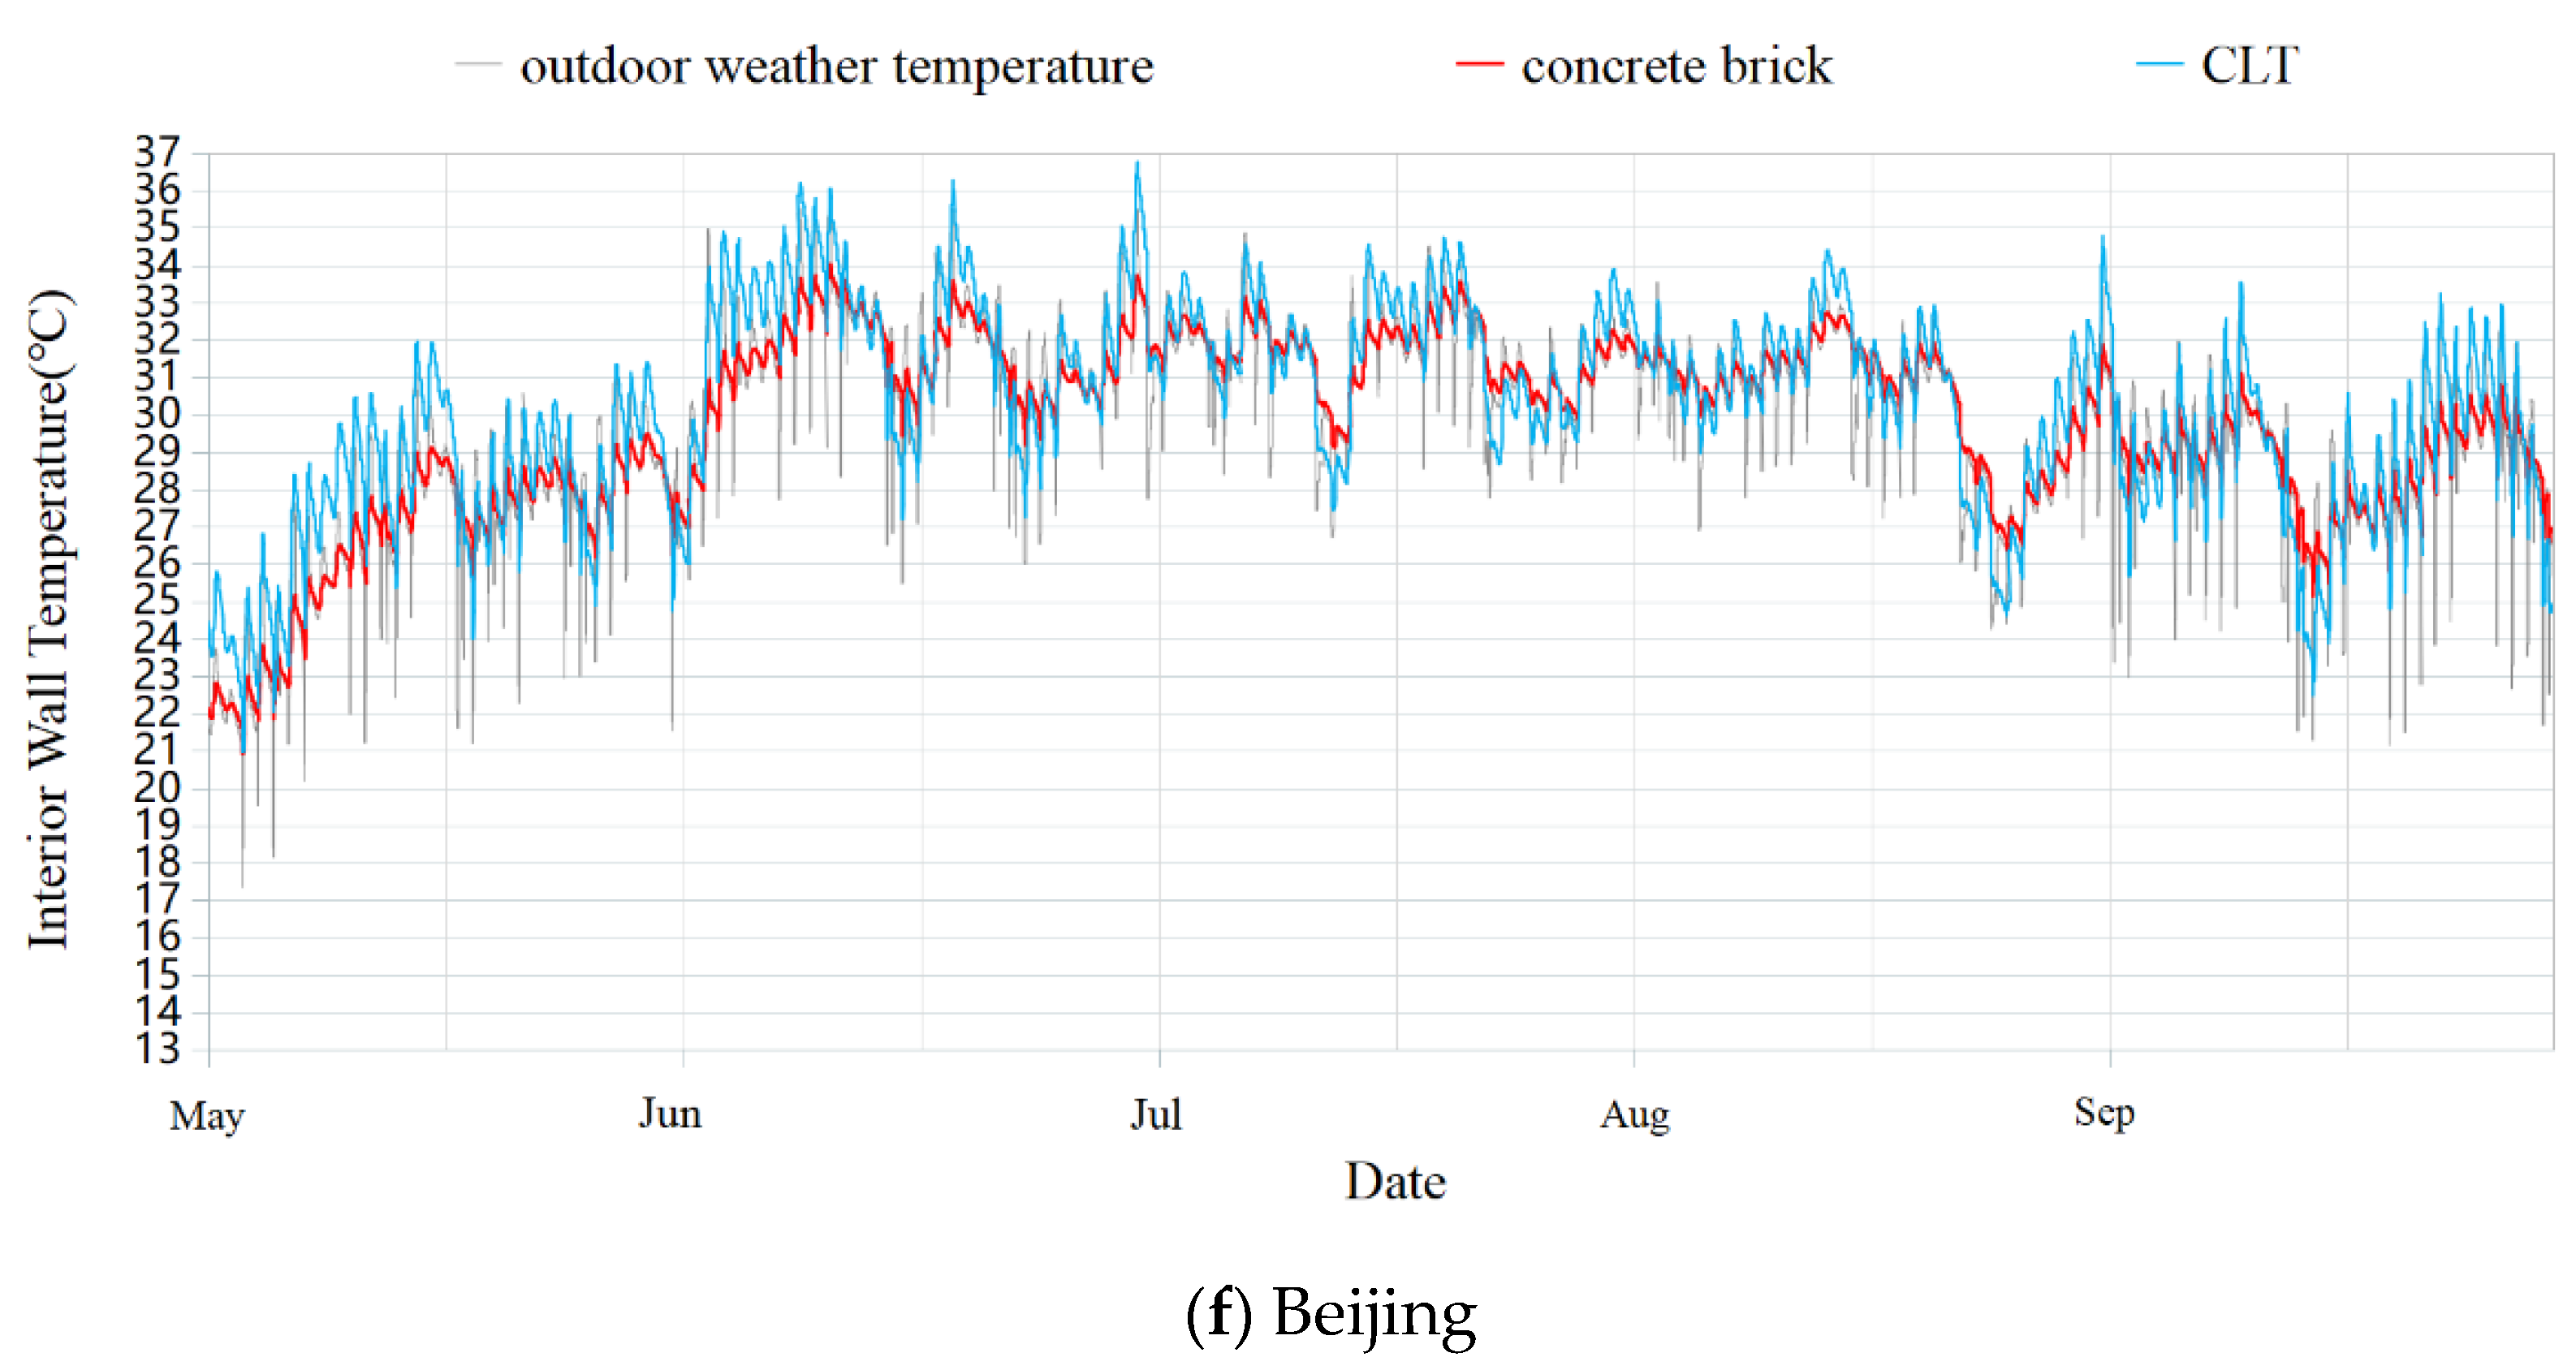
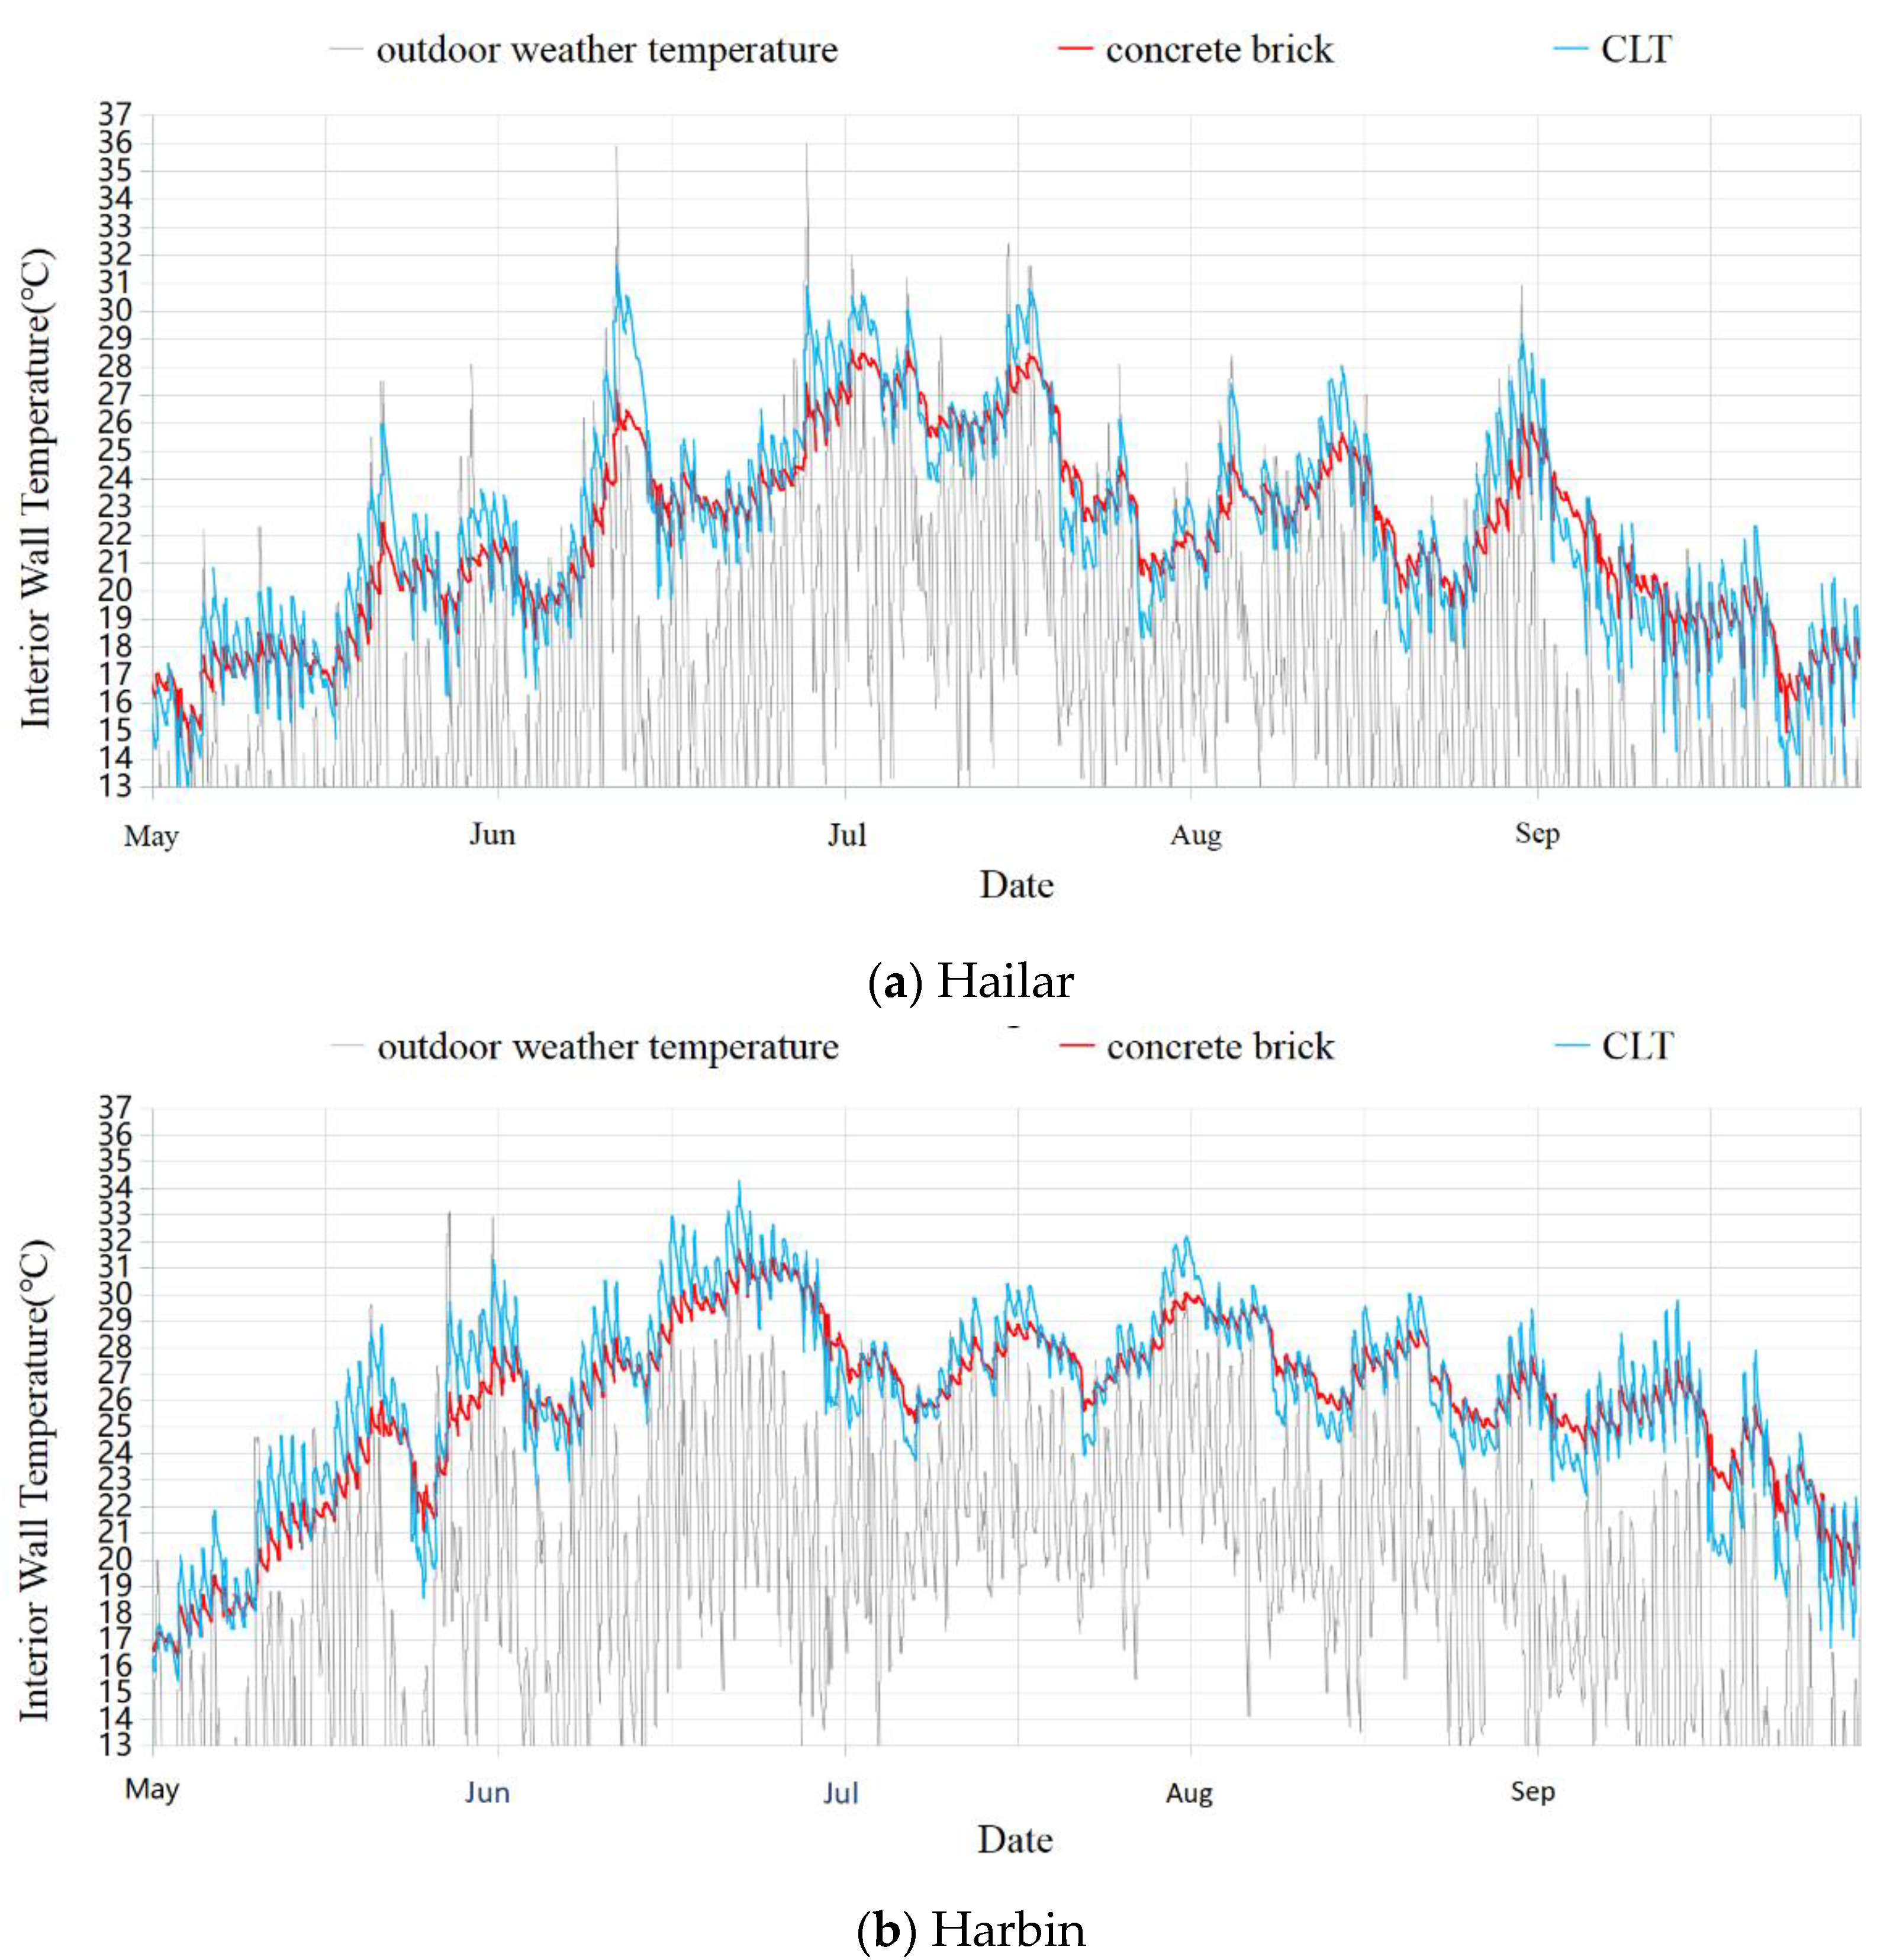
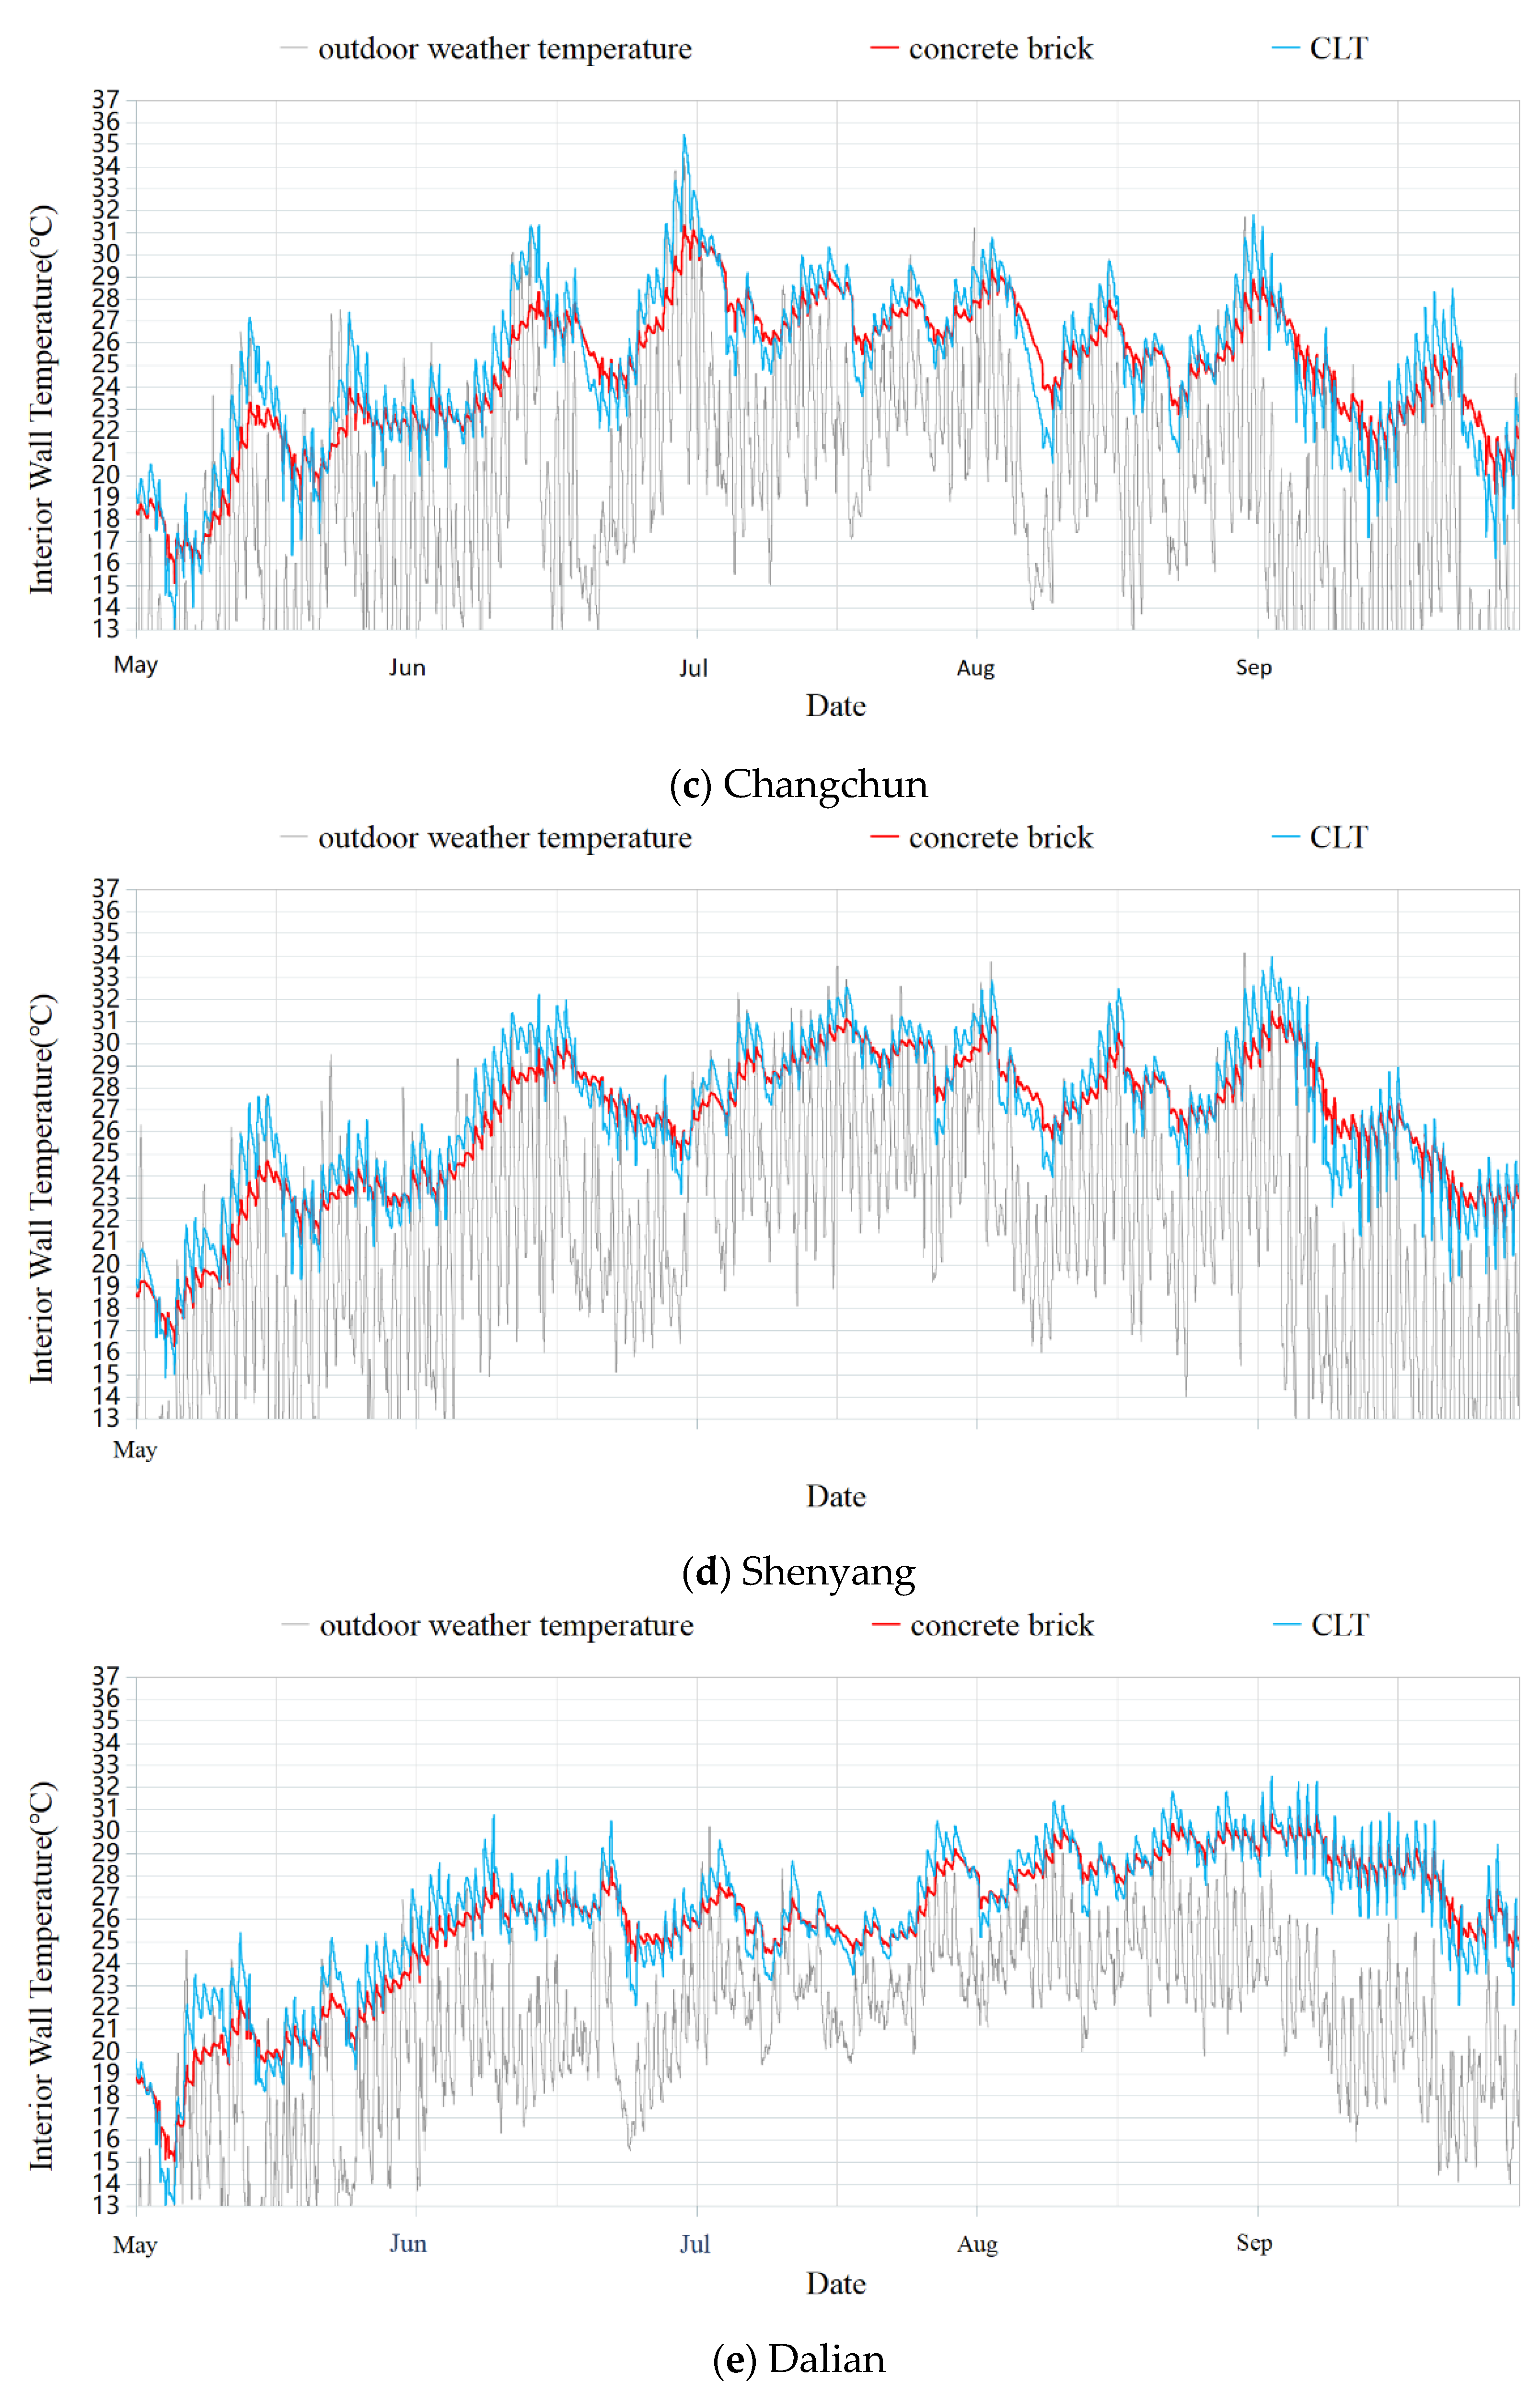
3.2. The Wall Inner Surface Temperature
4. Discussion
- (1)
- Suggestions for the revision of building design code
- (2)
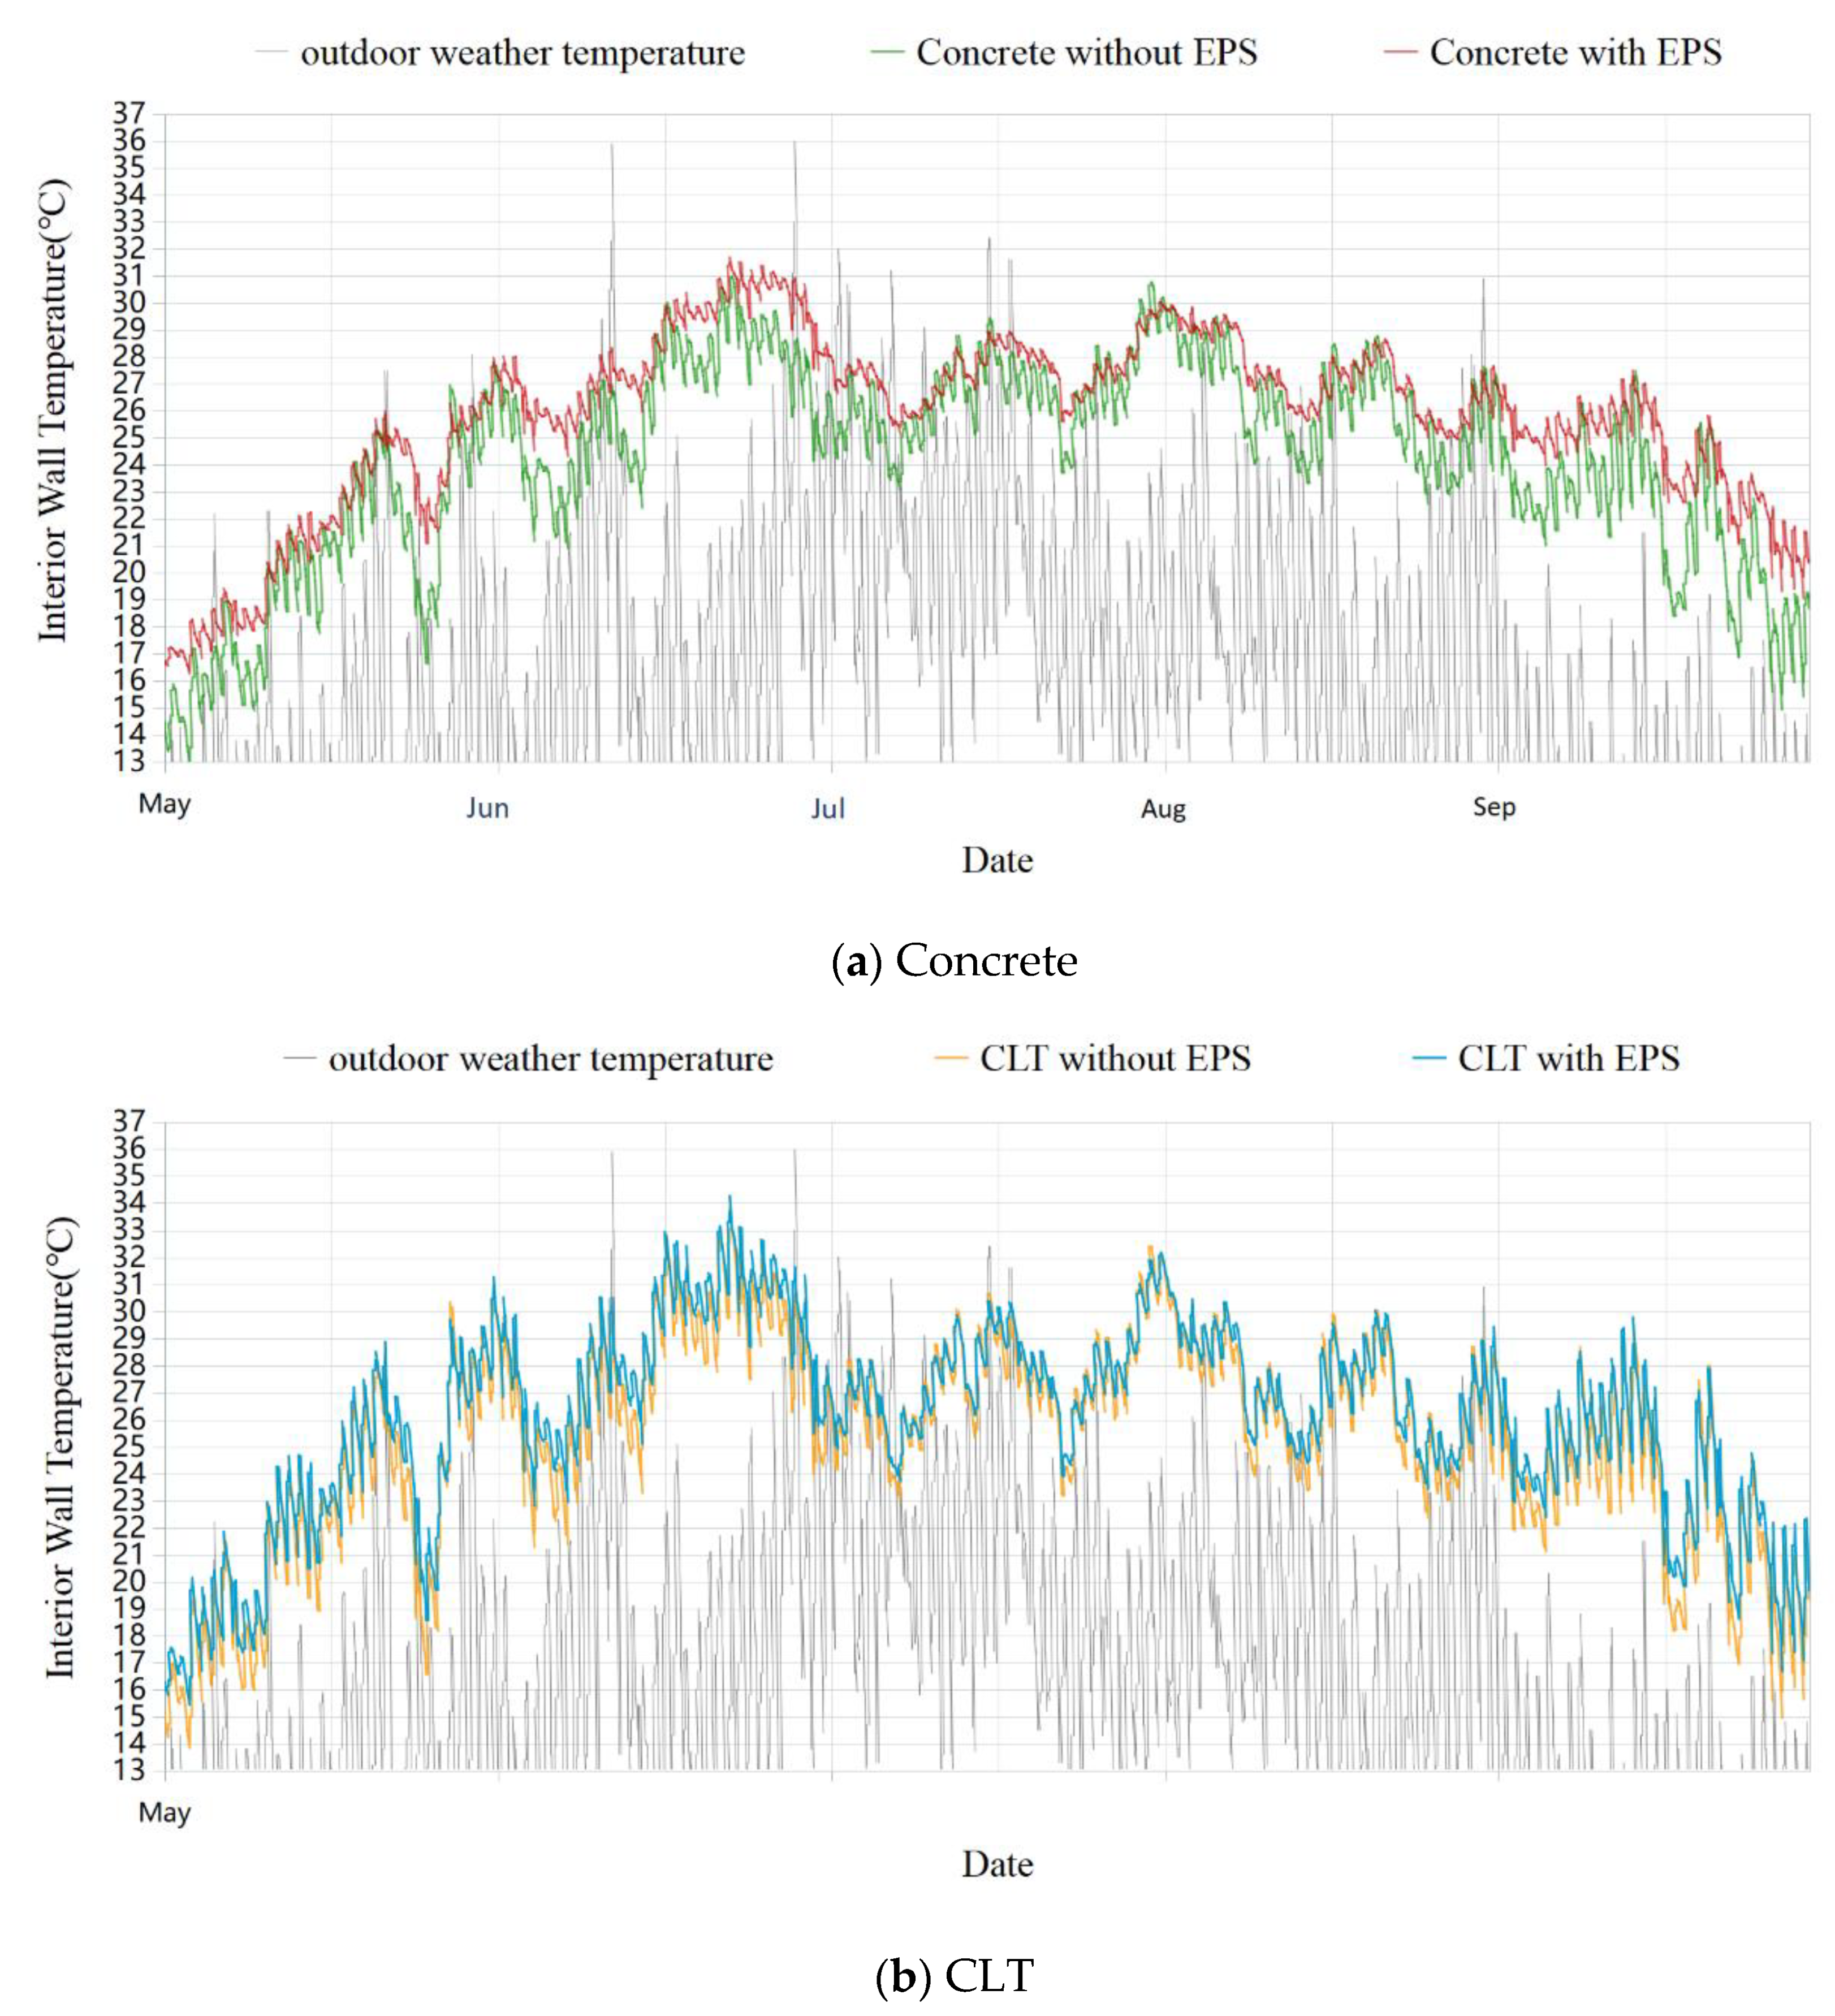
- The effect of heat insulation materials on overheating
- (3)
- Potential methods to alleviate overheating
5. Conclusions
Author Contributions
Funding
Informed Consent Statement
Conflicts of Interest
References
- Lee, W.V.; Steemers, K. Exposure duration in overheating assessments: A retrofit modelling study. Build. Res. Inf. 2017, 45, 60–82. [Google Scholar] [CrossRef] [Green Version]
- Liu, C.; Kershaw, T.; Eames, E.M.; Coley, A.D. Future probabilistic hot summer years for overheating risk assessments. Build. Environ. 2016, 105, 56–68. [Google Scholar] [CrossRef]
- Lacasse, M.A.; Gaur, A.; Moore, T.V. Durability and climate change—Implications for service life prediction and the maintainability of buildings. Buildings 2020, 10, 53. [Google Scholar] [CrossRef] [Green Version]
- Perkins-Kirkpatrick, S.E.; Lewis, S.C. Increasing trends in regional heatwaves. Nat. Commun. 2020, 11, 33–57. [Google Scholar] [CrossRef] [PubMed]
- GISS. Tied for Warmest Year on Record. In NASA Analysis Shows; GISS: Washington, DC, USA, 2020. [Google Scholar]
- Ministry of Housing and Urban-Rural Development. Uniform Standard for Design of Civil Buildings; GB 50352-2019; China Building Industry Press: Beijing, China, 2019.
- Li, H.; Wang, S.; Hou, L.; Xu, X.; Yang, L. Research on influence of climate change on future building energy consumption in China’s typical climate regions. Taiyangneng Xuebao/Acta Energiae Solaris Sinica 2020, 4, 1.4.7–1.5.4. [Google Scholar]
- Kalvelage, K.; Passe, U.; Rabideau, S.; Takle, E.S. Changing climate: The effects on energy demand and human comfort. Energy Build. 2014, 76, 373–380. [Google Scholar] [CrossRef]
- Crawley, D.B. Estimating the impacts of climate change and urbanization on building performance. J. Build. Perform. Simul. 2008, 1, 91–115. [Google Scholar] [CrossRef]
- Asimakopoulos, D.A.; Santamouris, M.; Farrou, I.; Laskari, M.; Saliari, M.; Zanis, G.; Giannakidis, G.; Tigas, T.; Kapsomenakis, J.; Douvis, C.; et al. Modelling the energy demand projection of the building sector in Greece in the 21st century. Energy Build. 2012, 49, 488–498. [Google Scholar] [CrossRef]
- Fabbri, K.; Gaspari, J.; Felicioni, L. Climate change effect on building performance: A case study in New York. Energies 2020, 13, 3160. [Google Scholar] [CrossRef]
- Berger, T.; Amann, C.; Formayer, H.; Korjenic, A.; Pospischal, B.; Neururer, C.; Smutny, R. Impact of climate change on building energy use in different climate zones and mitigation and adaptation implications. Appl. Energy 2012, 97, 274–282. [Google Scholar]
- Berardi, U.; Jafarpur, P. Assessing the impact of climate change on building heating and cooling energy demand in Canada. Renew. Sustain. Energy Rev. 2020, 121, 109681. [Google Scholar] [CrossRef]
- Davies, M.; Steadman, P.; Oreszczyn, T. Strategies for the modification of the urban climate and the consequent impact on building energy use. Energy Policy 2008, 36, 4548–4551. [Google Scholar] [CrossRef]
- Berger, T.; Amann, C.; Formayer, H.; Korjenic, A.; Pospischal, B.; Neururer, C.; Smutny, R. Impacts of climate change upon cooling and heating energy demand of office buildings in Vienna, Austria. Energy Build. 2014, 80, 517–530. [Google Scholar] [CrossRef]
- Wang, R.; Lu, S.; Feng, W.; Xu, B. Tradeoff between heating energy demand in winter and indoor overheating risk in summer constrained by building standards. Build. Simul. 2020, 14, 987–1003. [Google Scholar] [CrossRef]
- Heracleous, C.; Michael, A. Assessment of overheating risk and the impact of natural ventilation in educational buildings of Southern Europe under current and future climatic conditions. Energy 2018, 165, 1228–1239. [Google Scholar] [CrossRef]
- Jentsch, M.F.; Bahaj, A.S.; James, P.A.B. Climate change future proofing of buildings—Generation and assessment of building simulation weather files. Energy Build. 2008, 40, 2148–2168. [Google Scholar] [CrossRef]
- CIBSE. A Tenth of UK Electricity Used for Air Conditioning Indepth BRE Study Reveals Aircon Energy Use. 2016. Available online: https://www.cibsejournal.com/news/a-tenth-of-uk-electricity-used-for-air-conditioning/ (accessed on 27 July 2021).
- Carbon Trust. Technical Guide CTG005—Air Conditioning: Maximising Comfort, Minimising Energy Consumption; Carbon Trust: London, UK, 2007. [Google Scholar]
- Charles Ffoulkes, L.W.; McMahon, C.; Ecclestone, E.; Wheeler, K. Research to Provide Updated Indicators of Climate Change Risk and Adaptation Action in England; RSK ADAS Ltd.: London, UK, 2017; p. P41. [Google Scholar]
- Plokker, W.; Evers, J.E.J.; Struck, C.; Wijsman, A.J.T.M.; Hensen, J.L.M. First Experiences Using Climate Scenarios for The Netherlands in Building Performance Simulation; International Building Performance Simulation Association (IBPSA): Glasgow, UK, 2009. [Google Scholar]
- Laouadi, A.; Bartko, M.; Lacasse, M.A. A new methodology of evaluation of overheating in buildings. Energy Build. 2020, 226, 110360. [Google Scholar] [CrossRef]
- Vardoulakis, S.; Dimitroulopoulou, C.; Thornes, J.; Lai, M.K.; Taylor, J.; Myers, I.; Heaviside, C.; Mavrogianni, A.; Shrubsole, C.; Chalabi, Z.; et al. Impact of climate change on the domestic indoor environment and associated health risks in the UK. Environ. Int. 2015, 85, 299–313. [Google Scholar] [CrossRef] [Green Version]
- Zhang, Z.; Xie, G.; Cao, T. Dynamic heat transfer analysis of the wall implanted with heat pipes in summer. Adv. Build Energy Res. 2020, 14, 403–423. [Google Scholar] [CrossRef]
- Hooyberghs, H.; Verbeke, S.; Lauwaet, D.; Costa, H.; Floater, G.; De Ridder, K. Influence of climate change on summer cooling costs and heat stress in urban office buildings. Clim. Chang. 2017, 144, 721–735. [Google Scholar] [CrossRef]
- Vimalanathan, K.; Ramesh Babu, T. The effect of indoor office environment on the work performance, health and well-being of office workers. J. Environ. Health Sci. Eng. 2014, 12, 113. [Google Scholar] [CrossRef] [Green Version]
- Akimoto, T.; Tanabe, S.I.; Yanai, T.; Sasaki, M. Thermal comfort and productivity—Evaluation of workplace environment in a task conditioned office. Build. Environ. 2010, 45, 45–50. [Google Scholar]
- Lundgren, K.; Kuklane, K.; Gao, C.; Holmer, I. Effects of Heat Stress on Working Populations when Facing Climate Change. Ind. Health 2013, 51, 3–15. [Google Scholar] [CrossRef] [Green Version]
- Seppanen, O.; Fisk, W.J.; Faulkner, D. Cost Benefit Analysis of the Night-Time Ventilative Cooling in Office Building; Lawrence Berkeley National Laboratory: Berkeley, CA, USA, 2003. [Google Scholar]
- Harlan, S.L.; Chowell, G.; Yang, S.; Petitti, D.B.; Morales Butler, E.J.; Ruddell, B.L.; Ruddell, D.M. Heat-related deaths in hot cities: Estimates of human tolerance to high temperature thresholds. Int. J. Environ. Res. Public Health 2014, 11, 3304–3326. [Google Scholar] [CrossRef] [PubMed] [Green Version]
- WHO. Improving Public Health Responses to Extreme Weather/Heat-Waves: EuroHEAT: Technical Summar; World Health Organization: Geneva, Switzerland, 2007. [Google Scholar]
- Public Health England. Heatwave plan for England Making the Case: The Impact of Heat on Health—Now and in the Future; PHE: London, UK, 2015.
- CIBSE. Guide A: Environmental Design. Chartered Institution of Building; Services Engineers: London, UK, 2015. [Google Scholar]
- CIBSE TM52. The Limits of Thermal Comfort: Avoiding Overheating in European Buildings 2013; Chartered Institution of Building Services Engineers: London, UK, 2013. [Google Scholar]
- CIBSE TM52. Comfort Analysis IES Virtual Environment. Integrated Environmental Solutions Limited; Chartered Institution of Building Services Engineers: London, UK, 2014; p. P5. [Google Scholar]
- Overbey, D. Standard Effective Temperature (SET) and Thermal Comfort; Department of Health:Great Britain: London, UK, 2016. [Google Scholar]
- Ministry of Housing and Urban-Rural Development. Standard for Design of Office Building; JGJ/T 67-2019; China Architecture Publishing Media: Beijing, China, 2019.
- Ministry of Housing and Urban-Rural Development. Design Code for Heating Ventilation and Air Conditioning of Civil Buildings; China Building Industry Press: Beijing, China, 2012.
- Gregory, K.; Moghtaderi, B.; Sugo, H.; Page, A. Effect of thermal mass on the thermal performance of various Australian residential constructions systems. Energy Build. 2008, 4, 459–465. [Google Scholar] [CrossRef]
- Al-Sanea, S.A.; Zedan, M.F.; Al-Hussain, S.N. Effect of thermal mass on performance of insulated building walls and the concept of energy savings potential. Appl. Energy 2012, 89, 430–442. [Google Scholar] [CrossRef]
- Saleh, P.H.; Schiano-Phan, R.; Gleeson, C. The Rasmaska project: Temperature behaviour of three, full scale test cells in hot mediterranean summer: Non-insulated double masonry wall and different insulation locations. Energy Build. 2018, 178, 304–317. [Google Scholar] [CrossRef]
- Verbeke, S.; Audenaert, A. Thermal inertia in buildings: A review of impacts across climate and building use. Renew. Sustain. Energy Rev. 2018, 82, 2300–2318. [Google Scholar] [CrossRef]
- Pajek, L.; Hudobivnik, B.; Kunič, R.; Košir, M. Improving thermal response of lightweight timber building envelopes during cooling season in three European locations. J. Clean. Prod. 2017, 156, 939–952. [Google Scholar] [CrossRef]
- Hudobivnik, B.; Pajek, L.; Kunič, R.; Košir, M. FEM thermal performance analysis of multi-layer external walls during typical summer conditions considering high intensity passive cooling. Appl. Energy 2016, 178, 363–375. [Google Scholar] [CrossRef]
- Adekunle, T.O.; Nikolopoulou, M. Thermal comfort, summertime temperatures and overheating in prefabricated timber housing. Build. Environ. 2016, 103, 21–35. [Google Scholar] [CrossRef]
- Morton, T.A.; Bretschneider, P.; Coley, D.; Kershaw, T. Building a better future: An exploration of beliefs about climate change and perceived need for adaptation within the building industry. Build. Environ 2011, 46, 1151–1158. [Google Scholar] [CrossRef] [Green Version]
- Committee, A.S. Thermal Environmental Conditions for Human Occupancy ANSI/ASHRAE Standard 55-2017. 2017, pp. 2–3. Available online: http://www.ditar.cl/archivos/Normas_ASHRAE/T0080ASHRAE-55-2004-ThermalEnviromCondiHO.pdf (accessed on 27 July 2021).
- Senin, M.; Othuman Mydin, M.A. Significance of Thermal Comfort in Buildings and Its Relation to the Building Occupants. Eur. J. Technol. Des. 2013, 1, 54–63. [Google Scholar]
- Pohl, J. Building Science: Concepts and Applications; Wiley: Hoboken, NJ, USA, 2020. [Google Scholar]
- Wikipedia, D.B. Overheating in Buildings. 2020. Available online: https://www.designingbuildings.co.uk/wiki/Overheating_in_buildings (accessed on 27 July 2021).
- IES. Available online: https://www.iesve.com (accessed on 27 July 2021).
- Lymath, A. What Is a U-Value? Heat Loss, Thermal Mass and Online Calculators Explained. 2015. Available online: https://www.thenbs.com/knowledge/what-is-a-u-value-heat-loss-thermal-mass-and-online-calculators-explained (accessed on 27 July 2021).
- Wikipedia. R-Value (Insulation). Available online: https://en.wikipedia.org/wiki/Thermal_transmittance (accessed on 27 July 2021).
- Franco, J.T. How to Calculate the Thermal Transmittance (U-Value) in the Envelope of a Building. ArchDaily. 2018. Available online: https://www.archdaily.com/898843/how-to-calculate-the-thermal-transmittance-u-value-in-the-envelope-of-a-building (accessed on 27 July 2021).
- CEN. EN 1995-1-1 (2004) (English): Eurocode 5: Design of Timber Structures-Part 1-1: General-Common Rules and Rules for Buildings; European Committee for Standard: Brussels, Belgium, 2004. [Google Scholar]
- Institute CBSD. Energy-Saving Engineering Practice and Data of Building Envelope; China Planning Press: Beijing, China, 2019; pp. 7–8. [Google Scholar]
- De Wilde, P.; Tian, W. Predicting the performance of an office under climate change: A study of metrics, sensitivity and zonal resolution. Energy Build. 2010, 42, 1674–1684. [Google Scholar] [CrossRef]
- Solgi, E.; Hamedani, Z.; Fernando, R.; Skates, H.; Orji, N.E. A literature review of night ventilation strategies in buildings. Energy Build. 2018, 173, 337–352. [Google Scholar] [CrossRef]
- Guo, R.; Heiselberg, P.; Hu, Y.; Zhang, C.; Vasilevskis, S. Optimization of night ventilation performance in office buildings in a cold climate. Energy Build. 2020, 225, 110319. [Google Scholar] [CrossRef]
- Zhang, Y.; Wang, X.; Hu, E. Optimization of night mechanical ventilation strategy in summer for cooling energy saving based on inverse problem method. Proc. Inst. Mech. Eng. Part A-J. Power Energy 2018, 232, 1093–1102. [Google Scholar] [CrossRef]


| Criteria | Content |
|---|---|
| Criteria 1 | This displays the percentage hours when the difference in operative temperature minus the maximum acceptable temperature is greater than or equal to 1 K. |
| Criteria 2 | This displays the maximum daily degree hours found for the space. This fails if it is greater than 6 K/h per day. |
| Criteria 3 | This displays the maximum ΔT for the space. This space fails if it is greater than or equal to 4 K. |
| Category | Explanation | Suggested Acceptable Range (K) |
|---|---|---|
| I | High level of expectation only used for the spaces occupied by very sensitive and fragile persons. | 2 |
| II | Normal expectation (for new buildings and renovations). | 3 |
| III | A moderate expectation (used for existing buildings). | 4 |
| Climate Region | Sub-Region | Main Indicators | Representative City | U-Value (W/m2·K) | R-Value (m2·K/W) | |
|---|---|---|---|---|---|---|
| Temperature (°C) | HDD/CDD | |||||
| Severe cold | Severe cold 1A | Tmin·m ≤ −10 °C 145 ≤ d≤5 | 6000 ≤ HDD18 | Hailar | Roof: ≤0.28 Wall: ≤0.38 Window: ≤2.2 | Ground Floor: ≥1.10 |
| Severe cold 1B | 5000 ≤ HDD18 < 6000 | Harbin | Roof: ≤0.28 Wall: ≤0.38 Window: ≤2.2 | Ground Floor: ≥1.10 | ||
| Severe cold 1C | 3800 ≤ HDD18 < 5000 | Shenyang; Changchun | Roof: ≤0.35 Wall: ≤0.43 Window: ≤2.3 | Ground Floor: ≥1.10 | ||
| Cold | Cold 2A | −10 °C < Tmin·m ≤ 0 °C 90 ≤ d≤5 < 145 | 2000 ≤ HDD18 < 3800 CDD26 ≤ 90 | Dalian | Roof: ≤0.45 Wall: ≤0.50 Window: ≤2.4 | Ground Floor: ≥0.6 |
| Cold 2B | 2000 ≤ HDD18 < 3800 CDD26 > 90 | Beijing | Roof: ≤0.45 Wall: ≤0.50 Window: ≤2.4 | Ground Floor: ≥0.6 | ||
| Items | Values |
|---|---|
| Building function | Office, meeting |
| Total floor area | 13 F |
| Number of rooms | 300 (office, meeting) 28 (circulation) |
| Standard layer height | 3.0 m |
| Window to wall ratio | 0.34 (south) 0.28 (north) |
| Standard floor area | 894 m2 |
| Openable windows rate | 39% |
| Windowsill height | 0.9 |
| Window size | 1.8 × 2.1 m (south) 1.8 × 1.8 m (north, east and west) |
| Concrete | CLT | |
|---|---|---|
| Roof |  |  |
| Wall | 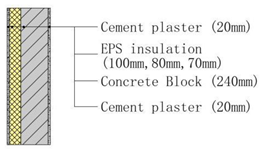 | 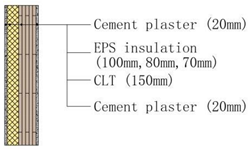 |
| Ground | 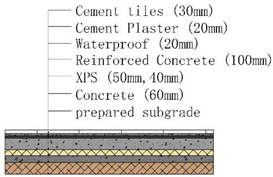 | 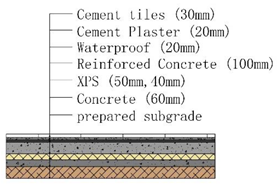 |
| Roof | EPS 130 mm for severe cold AB area (Hailar, Harbin) EPS 100 mm for severe cold C area (Changchun, Shenyang) EPS 80 mm for cold area (Dalian, Beijing) | |
| External wall | EPS 100 mm for severe cold AB area (Hailar, Harbin) EPS 80 mm for severe cold C area (Changchun, Shenyang) EPS 70 mm for cold area (Dalian, Beijing) | |
| Ground | EPS 50 mm for severe cold ABC area (Hailar, Harbin, Changchun, Shenyang) EPS 40 mm for cold area (Beijing, Dalian) | |
| Case Study | U-Values for Different Components (W/m2K) | |||
|---|---|---|---|---|
| Walls | Windows | Roof | Ground | |
| Severe cold AB | ||||
| Concrete block | 0.33 | 2.17 | 0.48 | |
| CLT | 0.26 | 2.17 | 0.21 | 0.48 |
| RC | 0.28 | |||
| Severe cold C | ||||
| Concrete block | 0.40 | 2.22 | 0.48 | |
| CLT | 0.30 | 2.22 | 0.25 | 0.48 |
| RC | 0.35 | |||
| Cold area | ||||
| Concrete block | 0.44 | 2.34 | 0.57 | |
| CLT | 0.32 | 2.34 | 0.29 | 0.57 |
| RC | 0.40 | |||
| Material | Conductivity (W/(m·K)) | Density (kg/m3) | Specific Heat Capacity (J/kg·K) |
|---|---|---|---|
| Concrete block | 0.53 | 800 | 1000 |
| CLT | 0.165 | 700 | 2100 |
| RC | 1.74 | 2500 | 900 |
| Input Parameters | Value (for the Building) |
|---|---|
| Heating | No heating required (free-running during summer) |
| Heating setpoint/setback temperatures | No setpoint/setback |
| Ventilation | Natural ventilation—no heating/cooling |
| Cooling setpoint/setback temperatures | No setpoint/setback temperatures |
| Related Parameter | Input Parameter | Values | Period |
|---|---|---|---|
| Windows | Openable area | 39% open | May, June, September (7:00–9:00,16:00–18:00) July, August (7:00–18:00) |
| Door | Openable area | 100% | Off continuously |
| Air Exchanges | Infiltration | 0.25 ac/h | May–September (00:00–24:00) |
| Natural ventilation | 8.3 l/s/per | May–September (7:00–18:00) |
| Related Parameter | Input Parameter | Values | Opening Time |
|---|---|---|---|
| Internal Gains | Lighting | 9 W/m2 | May–September weekdays (7:00–18:00) |
| People | 10 m2/person | May–September weekdays (7:00–18:00) | |
| Computers | 30 W/m2 | May–September weekdays (7:00–18:00) |
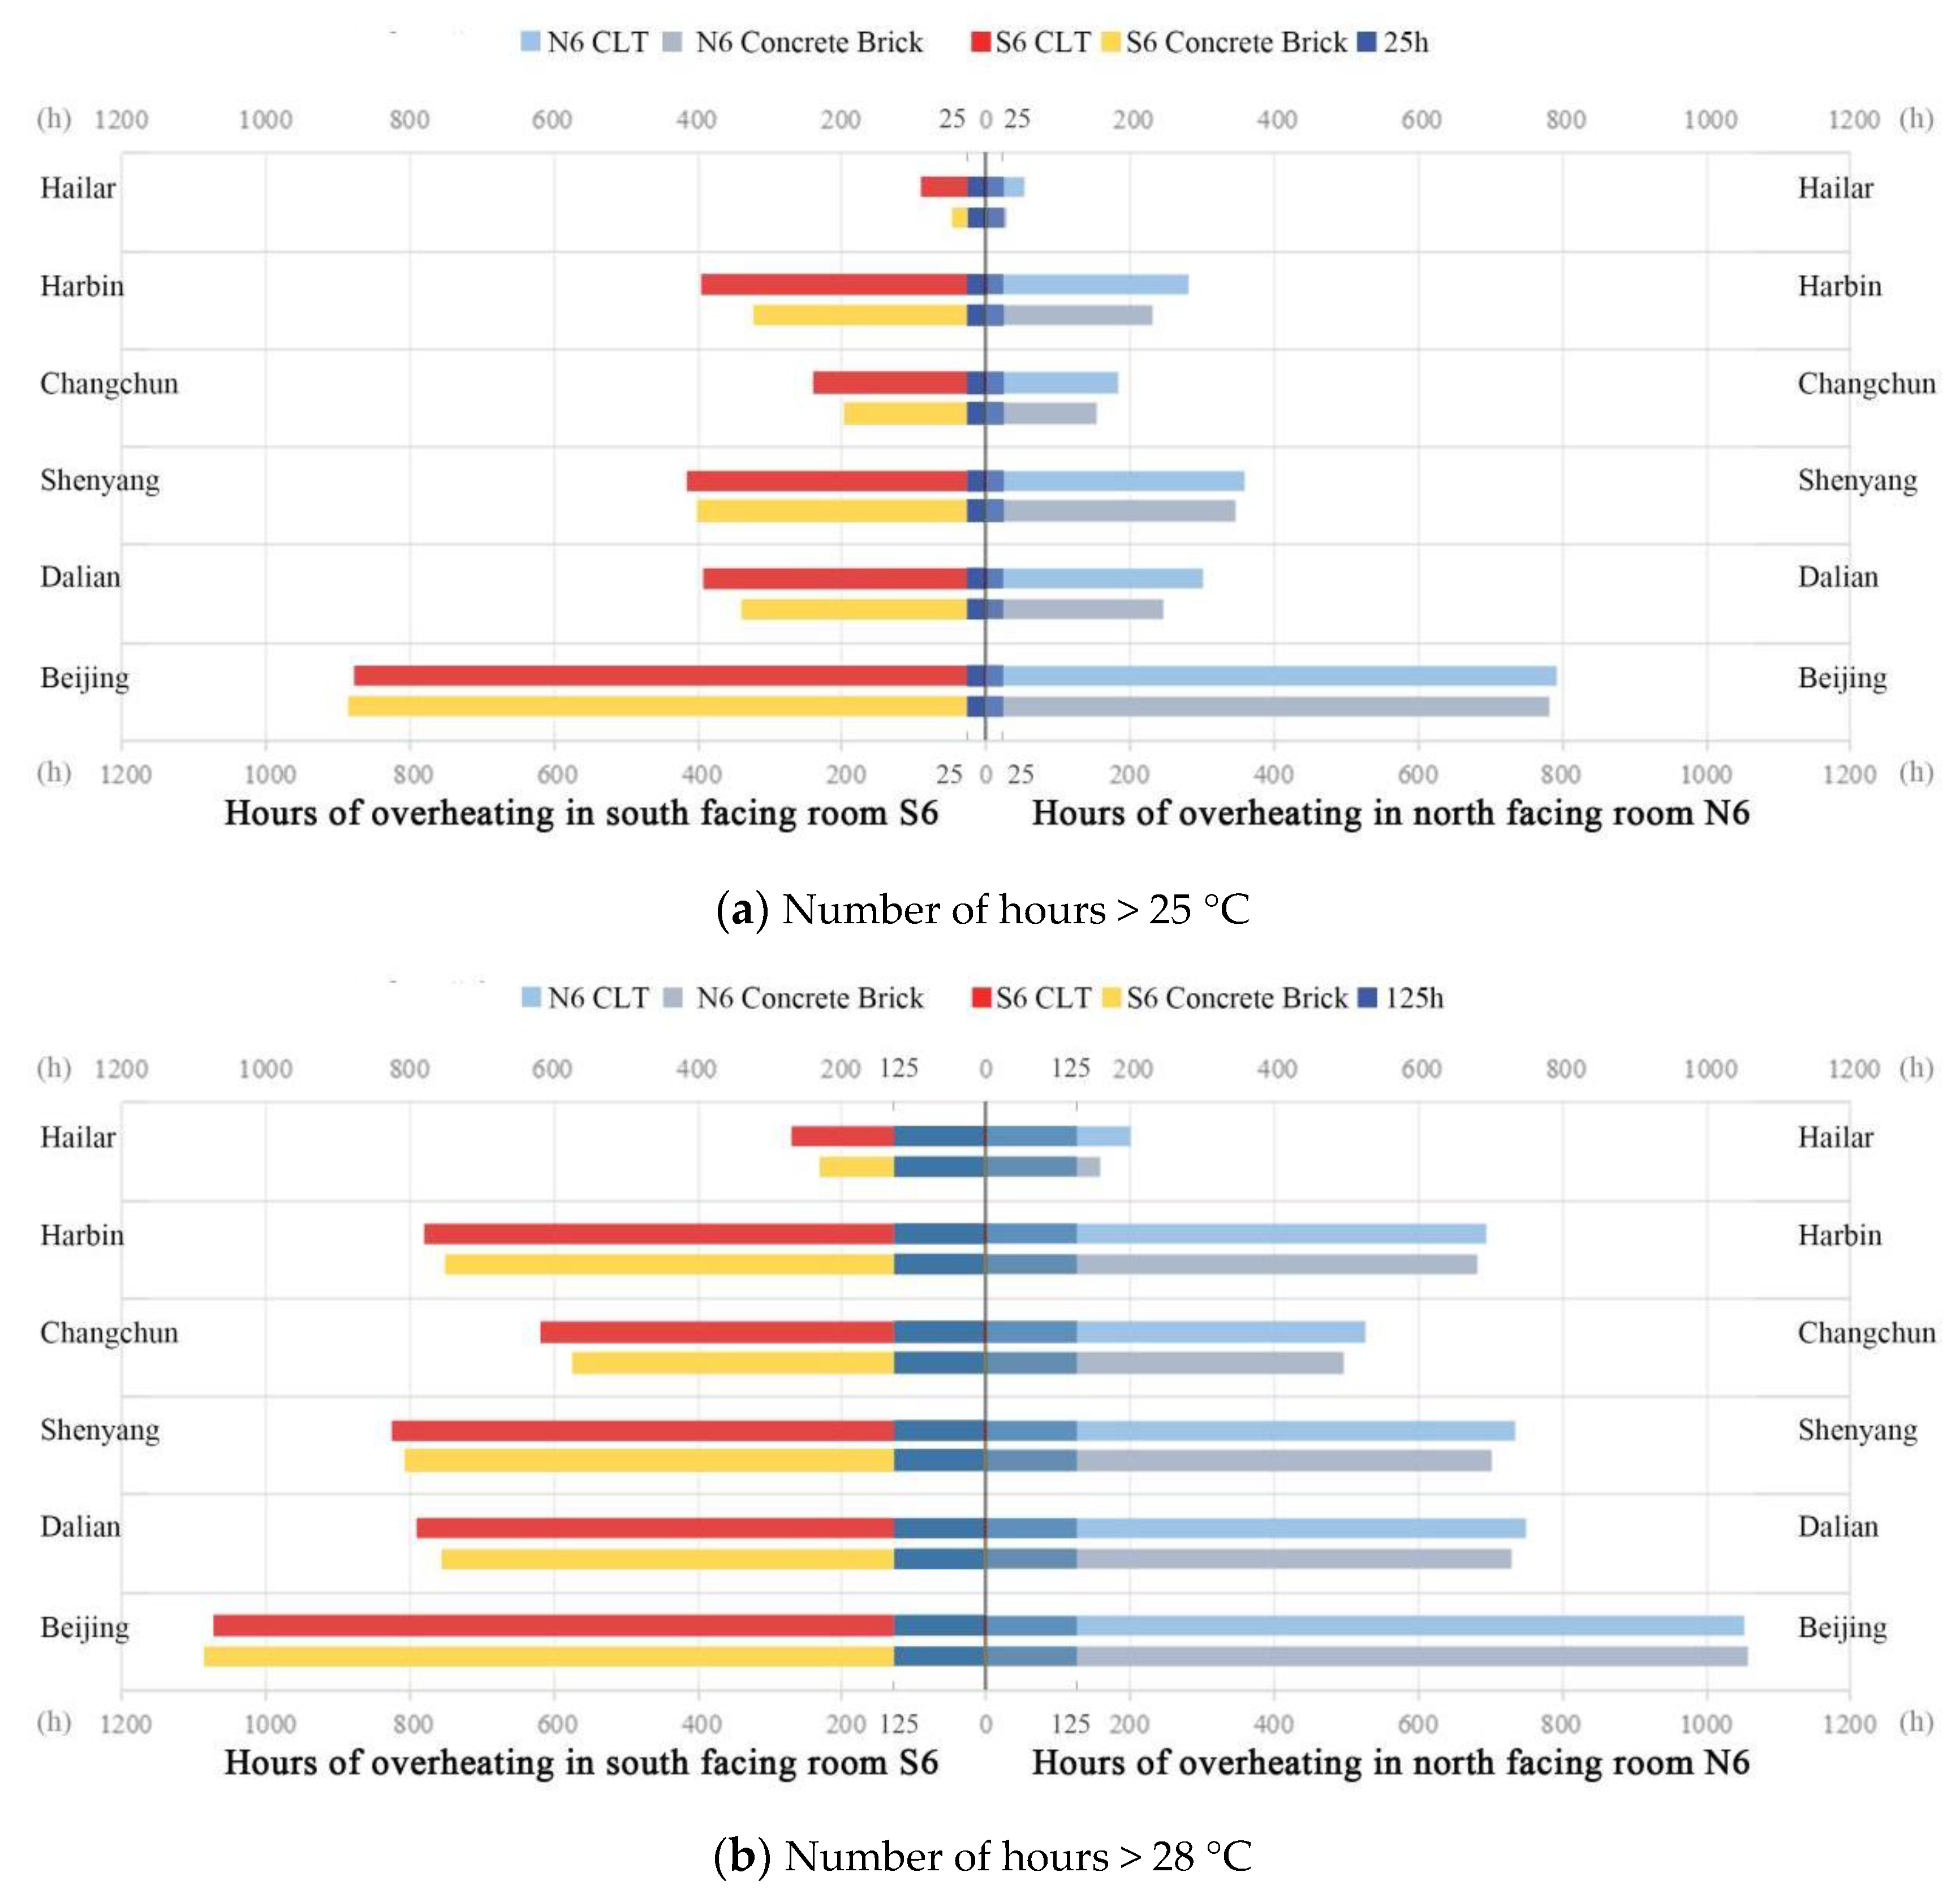
| Buildings | Cities | Orientation | Operative Temperature (>25 °C) | % Time Operative T > 25 °C | Operative Temperature (>28 °C) | % Time Operative T > 28 °C |
|---|---|---|---|---|---|---|
| Office (Hours) | Office (Hours) | |||||
| Concrete Block Office Buildings | Hailar | South | 231 | 9.24% | 46 | 1.84% |
| North | 159 | 6.36% | 27 | 1.08% | ||
| Harbin | South | 751 | 30.04% | 323 | 12.92% | |
| North | 682 | 27.28% | 231 | 9.24% | ||
| Changchun | South | 572 | 22.88% | 198 | 7.92% | |
| North | 496 | 19.84% | 152 | 6.08% | ||
| Shenyang | South | 807 | 32.28% | 401 | 16.04% | |
| North | 702 | 28.08% | 347 | 13.88% | ||
| Dalian | South | 755 | 30.20% | 341 | 13.64% | |
| North | 728 | 29.12% | 245 | 9.80% | ||
| Beijing | South | 1084 | 43.36% | 887 | 35.48% | |
| North | 1057 | 42.28% | 781 | 31.24% | ||
| CLT Office Building | Hailar | South | 271 | 10.84% | 89 | 3.56% |
| North | 200 | 8.00% | 53 | 2.12% | ||
| Harbin | South | 779 | 31.16% | 395 | 15.80% | |
| North | 693 | 27.72% | 282 | 11.28% | ||
| Changchun | South | 619 | 24.76% | 239 | 9.56% | |
| North | 526 | 21.04% | 183 | 7.32% | ||
| Shenyang | South | 824 | 32.96% | 416 | 16.64% | |
| North | 733 | 29.32% | 358 | 14.32% | ||
| Dalian | South | 791 | 31.64% | 392 | 15.68% | |
| North | 749 | 29.96% | 302 | 12.08% | ||
| Beijing | South | 1071 | 42.84% | 877 | 35.08% | |
| North | 1052 | 42.08% | 792 | 31.68% |
| Building Material | Cities | Orientation | Criteria 1 (% Hrs Top-Tmax > = 1 K) | Criteria 2 (Max. Daily Deg. Hrs) | Criteria 3 (Max. DeltaT) | Criteria Failing | Overheating |
|---|---|---|---|---|---|---|---|
| Concrete Block Office Buildings | Hailar | South | 2 | 9 | 4 | 2 | No |
| North | 0.7 | 4 | 2 | No | |||
| Harbin | South | 15 | 29 | 4 | 1 & 2 | Yes | |
| North | 8.3 | 21 | 3 | 1 & 2 | Yes | ||
| Changchun | South | 4.8 | 26 | 4 | 1 & 2 | Yes | |
| North | 2.1 | 18 | 3 | 2 | No | ||
| Shenyang | South | 14.2 | 20 | 3 | 1 & 2 | Yes | |
| North | 7 | 12 | 2 | 1 & 2 | Yes | ||
| Dalian | South | 9.4 | 11 | 2 | 1 & 2 | Yes | |
| North | 0.3 | 3 | 1 | No | |||
| Beijing | South | 51.3 | 44 | 5 | 1 & 2 & 3 | Yes | |
| North | 34.9 | 38 | 5 | 1 & 2 & 3 | Yes | ||
| CLT Office Buildings | Hailar | South | 6.8 | 34 | 6 | 1 & 2 & 3 | Yes |
| North | 2.5 | 19 | 5 | 2 & 3 | Yes | ||
| Harbin | South | 23.3 | 44 | 6 | 1 & 2 & 3 | Yes | |
| North | 14.2 | 34 | 5 | 1 & 2 & 3 | Yes | ||
| Changchun | South | 13 | 53 | 7 | 1 & 2 & 3 | Yes | |
| North | 6.6 | 41 | 6 | 1 & 2 & 3 | Yes | ||
| Shenyang | South | 20 | 35 | 6 | 1 & 2 & 3 | Yes | |
| North | 13.2 | 27 | 4 | 1 & 2 | Yes | ||
| Dalian | South | 14.5 | 19 | 4 | 1 & 2 | Yes | |
| North | 3.8 | 11 | 3 | 1 & 2 | Yes | ||
| Beijing | South | 52.7 | 63 | 8 | 1 & 2 & 3 | Yes | |
| North | 40.5 | 56 | 7 | 1 & 2 & 3 | Yes |
Publisher’s Note: MDPI stays neutral with regard to jurisdictional claims in published maps and institutional affiliations. |
© 2021 by the authors. Licensee MDPI, Basel, Switzerland. This article is an open access article distributed under the terms and conditions of the Creative Commons Attribution (CC BY) license (https://creativecommons.org/licenses/by/4.0/).
Share and Cite
Dong, Y.; Wang, R.; Xue, J.; Shao, J.; Guo, H. Assessment of Summer Overheating in Concrete Block and Cross Laminated Timber Office Buildings in the Severe Cold and Cold Regions of China. Buildings 2021, 11, 330. https://doi.org/10.3390/buildings11080330
Dong Y, Wang R, Xue J, Shao J, Guo H. Assessment of Summer Overheating in Concrete Block and Cross Laminated Timber Office Buildings in the Severe Cold and Cold Regions of China. Buildings. 2021; 11(8):330. https://doi.org/10.3390/buildings11080330
Chicago/Turabian StyleDong, Yu, Rong Wang, Jing Xue, Jingran Shao, and Haibo Guo. 2021. "Assessment of Summer Overheating in Concrete Block and Cross Laminated Timber Office Buildings in the Severe Cold and Cold Regions of China" Buildings 11, no. 8: 330. https://doi.org/10.3390/buildings11080330