Abstract
The COVID-19 pandemic forced higher education institutions to switch to online learning for most of 2020 and 2021 for the safety of their students and staff, which significantly impacted campus resource consumption. This study aims to analyze the changes in electricity consumption in higher education buildings based on comparisons of three academic years to understand more about the energy implications of the post-COVID-19 era. The electricity data were collected from 181 samples of the electricity meter records at Chulalongkorn University, Thailand. When compared to the typical academic year in 2018, the results indicate that electricity consumption in 2019 and 2020 decreased by 20.92% and 35.50%, respectively. The academic and the library-type buildings marked the biggest change in electricity reduction. The smallest change was found in the research type as its essential work remained on campus. Only electricity consumption in the residence type increased due to the long periods of online learning policies. Finally, the findings suggest that teaching and learning activities have a strong influence on electricity consumption in higher education buildings. The facilities and learning methods related to these activities should be carefully discussed as elements of an effective strategy to manage electricity demands at the university level.
1. Introduction
The novel Coronavirus disease 2019 (COVID-19) was declared to be a public health emergency of international concern by the World Health Organization (WHO) in 2020 [1]. In response to the outbreaks, countries around the world adopted lockdown and social distancing measures which significantly reduced electricity demand. During the lockdown, global electricity consumption decreased by 2% in 2020 compared with 2019 [2], while many countries also marked their regional drops in total [3,4,5,6,7,8,9,10,11,12,13].
For energy consumption in the building sector, the research topic of the impact of COVID-19 on building energy performance has received more attention in recent years. The lockdown period presents a rare opportunity to examine energy usage patterns in vacant public buildings with restricted activities, as well as usage patterns from residential buildings in which homes were used as temporary offices, classrooms, and entertainment hubs. Thus far, the energy consumption of various building types during the COVID-19 period has been examined. For example, Deiss et al. [14] found a 10.3% reduction in commercial buildings in the US when compared to prior to the COVID-19 period. Geraldi et al. [15] assessed the impact of the lockdown on electric uses of municipal buildings such as health centers, administrative buildings, elementary schools, and nursery schools in Brazil as reductions of 11.1%, 38.6%, 50.3%, and 50.4%, respectively. An energy simulation study in US office buildings from Cortiços & Duarte [16] showed 21.72% higher than the post-COVID-19 scenarios for those in climate zones above mixed-humid type, but 11.92% lower for those below the zones. Abdeen et al. [17] found a 12% increase in household electricity consumption from 500 homes in Canada when comparing 2020 to 2019. Kawka and Cetin [18] surveyed 225 housing units from 2018 to 2020 based on the resident’s income groups in the US. They found the largest increase of 66.9% in the lowest household income group, while the middle-income group experienced the lowest. Krarti and Aldubyan [19] provided a systematic review analysis of energy demand data and indicated that electricity consumption has shifted from commercial buildings and manufacturing facilities to the residential building sector. Li et al. [20] predicted residential electricity use from 9 a.m.–5 p.m. on weekdays to be 15–24% higher than the pre-pandemic conditions, and 35–53% higher for peak demands. Rouleau and Gosselin [21] found a 46% increase in electricity use in social housing in Canada during the lockdown period. Duarte and Cortiços [22] performed energy simulations in office buildings in China under the post-COVID-19 scenarios, resulting in an upward and downward trend based on the climate zones. Su et al. [23] compared the energy consumption pattern and indoor air quality of a large green commercial building in China and reported that the building energy consumption decreased by an average of 55.4% and the indoor air quality compliance rate increased. Lastly, Wang et al. [24] developed a building energy model to simulate the energy demand under the work-from-home situation by adjusting the occupancy and building operation schedules and reported a 9% increase in energy demand.
Higher education is another sector that the global COVID-19 pandemic caused a huge disruption as the rapid outbreak created uncertainty regarding restrictions on on-campus activities. To ensure that the operations proceeded smoothly and efficiently while maintaining the safety and well-being of students and staff, universities announced the temporary closure of offices with guidelines for teaching, learning, and working during the pandemic, with consideration given to the options of shifting or overlapping days or times of operation to avoid having people assemble in large groups in one place. Universities around the world were temporarily shut down, and the education of more than 220 million tertiary students was disrupted [25]. As the public health guidelines advised against social gatherings and encouraged limitations on in-person interactions, students switched from traditional classrooms to online platforms [26] which directly impact on-campus occupancy and energy use of higher educational institutions.
Higher education institution buildings have been discussed by tightly-packed repetitive schedules, energy-intensive, various forms of electrical appliances, and high electricity consumption per gross floor area [27]. Electricity planning in these building complexes has been widely studied in term of benchmarking models as a method of comparing a building’s performance to similar buildings of that type or function [28,29] to find ways to reduce consumption [30,31]. Recently, past studies have been carried out to explore the consequences of on-campus restrictions in terms of the comparison between the COVID-19-related periods and the building functions, as summarized in Table 1.
Chihib et al. [32] measured the impact of the temporary closure of different facilities categories on energy consumption at a university in Spain. During the pandemic-related lockdown in 2020, it was found that, compared to electricity consumption in 2019, the largest reduction was found in support facilities like libraries, while the smallest was found in the research category. Gui et al. [33] investigated changes in energy use during the COVID-19 lockdown at a university in Australia. It was found that energy use was 16% lower compared to a typical academic year. The rate of electricity uses per week in the academic buildings, administration buildings, retail buildings, and teaching buildings during the COVID-19 lockdown was reduced by 51.5%, 44.3%, 48.3%, and 57.1%, respectively. Kang et al. [34] analyzed changes in building energy consumption under the COVID-19 pandemic restrictions in South Korea. The average rate of change in electricity usage in educational and research facilities was found to be 16.3% lower than it had been during the same period in the previous year. López-Sosa et al. [35] evaluated electricity consumption of 13 public state universities in the state of Michoacan in Mexico and reported savings in consumption between 10–90% as well as carbon footprint reduction potentials. Nasir et al. [36] measured the electricity consumption in the research complex building at a university in Malaysia during the lockdown in 2020. The results were 11% lower than the normal year in 2019. Lastly, Gaspar et al. [37] assessed the impact of the lockdown on energy consumption in 83 academic buildings at a university in Spain. Results revealed a 19.3% decrease, compared to the post-COVID period.
Other studies have been carried out, relying on various methods. Mokhtari and Ja-hangir [38] performed a simulation study on university buildings in Iran under the practice of COVID-19 controlling approaches by practicing social distancing. They concluded that energy consumption was 32% lower than the typical condition. Filimonau et al. [39] compared the carbon footprint produced by a mid-sized university in the United Kingdom during the lockdown in 2019 and 2020, comparing them to 2018. The overall carbon footprint decreased by almost 30%, and the electricity consumption decreased by 39%. Baharom et al. [40] compared the carbon footprint produced by a university in Malaysia during the lockdown in 2020. The electricity consumption was 7% lower than the pre-period in 2019.

Table 1.
Studies on electricity consumption during the COVID-19 pandemic.
Table 1.
Studies on electricity consumption during the COVID-19 pandemic.
| Chihib et al. (2021) | Filimonau et al. (2021) | Gui et al. (2021) | Kang et al. (2021) | |
|---|---|---|---|---|
| Reference | [32] | [39] | [33] | [34] |
| University | University of Almeria | Bournemouth University | Griffith University | Education/Research |
| City | Almeria | Bournemouth | Brisbane | Daegu-Gyeongbuk |
| Country | Spain | United Kingdom | Australia | South Korea |
| Climate | Cold semi-arid | Temperate oceanic | Humid subtropical | Humid subtropical |
| Number of samples | 33 buildings | N/A | 122 buildings | N/A |
| Floor area (m2) | 170,000 | N/A | ~253,346 | N/A |
| Data source | University’s records | University’s records | University’s database | KAB’s database |
| Period of study (with a typical period) | JAN 20-DEC 20 (JAN 19-DEC 19) | APR 20-JUN 20 (APR 19-JUN 19) | MAR 20-FEB 21 (MAR 19-FEB 20) | JAN 20-MAY 20 (JAN 19-MAY 19) |
| Comparative analysis method | Descriptive statistics (percentage) | Descriptive statistics (percentage) | Descriptive statistics (percentage), t-test, Multiple Linear Regression | Descriptive statistics (percentage) |
| Unit | kWh | kWh | kWh/week | kWh |
| Reduction (%) | 15 | 39 | 16 | 16 |
| Lopez-Sosa et al. (2021) | Baharom et al. (2022) | Nasir et al. (2022) | Gasper et al. (2022) | |
| Reference | [35] | [40] | [36] | [37] |
| University | 13 State Universities in Michoacán | Universiti Malaysia Perlis | National University of Malaysia | Universitat Politècnica de Catalunya |
| City | State of Michoacán | Perlis | Selangor | Catalunya |
| Country | Mexico | Malaysia | Malaysia | Spain |
| Climate | Varies | Tropical monsoon | Tropical rainforest | Maritime Mediterranean |
| Number of samples | N/A | N/A | 1 building | 83 buildings |
| Floor area (m2) | N/A | N/A | N/A | ~280,046 |
| Data source | University’s records | University’s database | Walk-through field data | University’s records |
| Period of study (with a typical period) | JAN 20-DEC 20 (JAN 19-DEC 19) | MAR 20-SEP 20 (JAN 18-FEB 20) | JAN 20-DEC 20 (JAN 19-DEC 19) | FEB 20-MAR 21 (FEB 19-MAR 20) |
| Comparative analysis method | Descriptive statistics (percentage) | Descriptive statistics (percentage) | Descriptive statistics (percentage) | Descriptive statistics (percentage), Variation rates |
| Unit | MWh/month | kWh | MWh | kWh |
| Reduction (%) | 10–90% | 7 | 11 | 19 |
The empirical findings in previous studies provide an increased understanding of how the COVID-19 pandemic led to a large impact on the energy sector throughout the world, in which the electricity demands of educational institutions significantly decreased since the online learning method inevitably led to changes in occupancy conditions related to electricity demands [33,41]. It is suggested that the different occupancy conditions related to the building functions could have an influence on energy use in higher education institutions, depending on various activities associated with those buildings, such as research, teaching, or administration [42].
A university campus comprises many building types and their energy consumption patterns depend on many factors such as physical characteristics, occupancy rate, air-conditioning system, lighting system, equipment, and plug loads. Energy consumption in university buildings is different from other building types [35]. As for Thailand, a review of literature showed that studies on building energy consumption and conservation only investigate commercial and residential building types [43,44,45,46,47,48,49,50]. Energy consumption data were generally shown as a part of a university’s sustainability report [51,52].
While past research studies have reported changes in electricity consumption in higher education institutions under temporary closure conditions due to COVID-19, due to the novelty of the outbreak, there exists no data from a large-sized university in a hot-humid climate. Evaluation of energy performance during the lockdown should yield a better understanding of the dynamics of campus energy consumption and provide future strategies for campus energy conservation. During the COVID-19 pandemic, most, if not all, face-to-face classes were replaced with virtual classes or on-site classes with certain restrictions. Although the advantages and disadvantages of virtual class integration have been discussed, limited evidence exists on energy consumption during the pandemic period. Continued efforts in this field are needed to provide additional evidence that allows for further discussion of the growing body of research in energy-related fields, especially for those across different geographical contexts. Therefore, the objectives of this study are:
- To analyze the changes in electricity consumption of higher education buildings in Thailand under the temporary closure through comparison between a typical academic year and two COVID-19-related academic years,
- To compare the electricity consumption of the online learning mode with the typical learning mode,
- To suggest potential strategies for electricity management in the post-COVID-19 period.
The main contributor to this study is the assessment of the COVID-19 pandemic on energy consumption in a large-sized university in hot-humid climates. Energy consumption data of the COVID-19-related academic years in which all classes were migrated to online learning and blended learning methods, were compared with the immediately preceding year. This study also reports on the monthly and yearly comparative analysis which demonstrates a change in energy consumption due to the COVID-19 lockdown according to the university building types. In addition, the study of energy consumption and energy efficiency in Thai buildings, especially in the higher education sector, is rare. This type of research is necessary, and the results may serve as a base for managing electricity demands and practices in the operation of Thai higher education institutions in the future.
Lastly, the campus lockdown due to COVID-19 represents a rare opportunity for energy performance evaluation of the campus under activity restrictions. Changes observed during the COVID-19 periods may provide important insights or lessons for improving overall energy efficiency. Comments on potential energy management strategies are offered which university administration teams can adopt the lessons learned and apply for operation improvement.
2. Materials and Methods
This study designed a framework for quantitative analysis built around the measurement of changes between the typical period before the full impact of COVID-19, from August 2018 until February 2020, and the COVID-19-related period from March 2020 until July 2021. To reflect the comprehensive state of the energy field, the electricity data were collected from university monthly records to perform a comparative analysis of those academic years. Figure 1 displays the overall analysis process of this study. Details of the case study, the COVID-19 timeline, data collection, and data analysis are provided below.
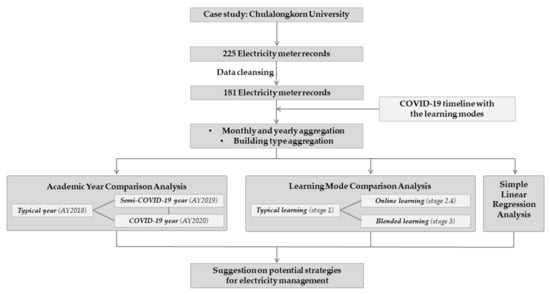
Figure 1.
The overall analysis process.
2.1. Case Study: Chulalongkorn University
Chulalongkorn University (CU), established in 1917, is the first institution for higher learning in Thailand. Chulalongkorn University was selected as a case study due to its wide variety of on-campus building types and contextual characteristics that best represent a large-sized higher education institute. The university occupies an area of 101.9 ha (252 acres) in the Pathumwan District, Bangkok, Thailand. The campus locates in a tropical region where buildings always experience hot and humid environments, with the average temperature at 28.10 °C and average relative humidity at 72.90% [53]. The university has 42 faculties, colleges, schools, and research institutes. There were over 37,000 students during the study period, including more than 27,000 undergraduates and over 10,000 postgraduates [54]. Taken together, the university has a high demand for electricity, especially from the air-conditioning system for cooling with no demand for heating throughout the year. Currently, the university is revising its sustainability policy and carbon footprint reduction action plan. The understanding of potential approaches to enhance energy efficiency will be beneficial for university administration and the methodology could also be extended to other universities in the region.
2.2. Data Collection: Sample Electricity Meter Records
The Metropolitan Electricity Authority (MEA) provides electricity energy by generating, transmitting, and selling for the university. High-voltage meters directly connect to facilitate electrical networks through a secondary power distributor as ring main units (RMU); an epitome of modularity and portability to multiple downstream loads as 380–400 volt to the low-voltage meters in various locations across campus. By these sub-meters, the electricity is monitored with the kilowatt meter, where it accumulates a totalized reading and recording accounting for the consumption flows. For Chulalongkorn University, electricity meter records were gathered by the meter readers who work in the Office of Physical Resources Management. The data were collected and tabulated in spreadsheet forms. In this study, the electricity record data set comprised monthly electricity usage in kilowatt-hours (kWh). The data were organized by monthly and yearly aggregate according to building function types to facilitate a comparative analysis between academic years with the customary annual period of school instruction, and those that included varying levels of online instruction stage.
Initially, a total of 225 electricity meter records were available from the Energy Management Subdivision of the university’s Office of Physical Resources Management. Each record represents the electricity consumption of a building or a specific floor area, depending on the individual metering systems. To control the quality of data, this study performed data cleansing process in which duplicate and incomplete data sets were removed. Data sets from buildings which were temporarily turned into COVID-19 facilities, such as vaccination centers or community isolation centers, with typical operating hours and electricity patterns were also excluded. In this study, a total of 181 complete metering record samples were validated and included in the analysis.
2.3. Data Collection: Sample Building Categories
As previous research examined energy consumption in higher education buildings based on building types and occupancy schedules [32,33,37], therefore, this study identified available electricity meter records into different categories based on main functional usage. The general characteristics of sample buildings such as floor area, construction information, functional usage, building system, and typical operating hours were provided by the Planning, Design, and Information System Subdivision of the Office of Physical Resources Management.
As part of a prior attempt at the energy benchmarking of Chulalongkorn University, the records were initially categorized by building function types, according to the main uses or activities, which were defined as office type, academic type, research type, or others in line with the study of Kangvan [55]. However, to better reflect the complexity of space use in university buildings, this study categorized each electricity meter record according to Gui et al. [33], which identified building function types as office (administration), academic, research, infrastructure, and residential (student dormitories). Furthermore, since the support facilities in this study comprise various functions and operating hours, the metering record was further categorized as auditorium, museum, cafeteria, library, student facilities, and sports facilities. For the meter record that covers more than one functional use, its category was determined by the main uses or activities of over 50% of their occupied floor area.
The office type was defined as university offices used for administrative tasks to support and maintain an operation setting, usually occupied from Monday to Friday, 8.00–17.00. The on-campus support facilities type included auditoriums, museums, and cafeterias, as well as student facilities like student unions and clubs, which were intentionally designed to create a welcoming environment to suit all the educational needs, and usually operated from Monday to Saturday, 8.00–17.00, while the library and the sports facilities were operated with extended hours, 8.00–21.00. The infrastructure type was defined as support service functions for the university buildings, with less human utilization; such spaces comprised storage and car parking, and the operation hours depended on the supported functions.
Flexible demand based on teaching schedules and other factors was regularly planned for the other building types. The academic-type buildings, used for teaching and learning activities, were usually occupied from Monday to Saturday, depending on class schedules to determine classroom booking and reservation period. It is important to note that data set of the academic type in this study comprised entire buildings since individual metering systems were unavailable for the specific occupied areas, where multiple functions such as classrooms, learning spaces, and offices with facilities were included. The research type, including research units and laboratories, usually operated based on research schedules, with overtime utilization due to the ongoing activities and heavy equipment operations. The residence type was defined as on-campus student dormitories with 24-h operations. Most of the dormitory buildings are naturally ventilated.
Table 2 summarizes basic information of sample buildings including the number of samples and descriptive statistics of floor areas for each building’s functional type. The variation of building sizes and sample sizes were acknowledged for comparative analysis purposes. The data showed a wide range of building sizes in the office type, the academic type, the research type, and the sports facilities type. In terms of the total number of buildings, the academic type marks the highest frequency, while there were only a small number of samples in the support facilities category.
Table 2.
Basic information of energy meter record samples based on building function types.
In this study, the sample records occupied a total of 777,429 m2, representing approximately 66% of the university buildings’ area. The majority of buildings were identified as low-rise buildings, capped at a maximum height of 23 m. Elevators were installed in most, if not all buildings. The buildings were constructed as reinforced concrete structures, using cladding elements such as precast wall panels or masonry walls, with framed single-pane glass windows. The occupied function rooms were air-conditioned, while the corridors were opened to the outdoors. The air-conditioning system was turned on during normal operating hours of each building type. The temperature set point was usually determined at 25 °C by the recommendation of energy conservation targets from the Ministry of Energy, and the university’s policy. To allow the air conditioning system to be operated independently on an as-needed basis, the split-type air conditioning systems were installed in most building types, except for the main library building, with individual controls in each workspace. The air-cooled condensing units were mounted outside. Due to the hot-humid climate all year round, no heating function nor fresh-air intake system was installed. Nevertheless, small exhaust fans were installed to increase indoor air circulation.
2.4. COVID-19 Timeline with the Learning Modes
In Thailand, the first COVID-19 patient was identified in January 2020. The number of COVID patients remained relatively low until there was a rise in domestic infections in March 2020. Thailand’s responses to the pandemic were then guided by the “Integrated Plan for Multilateral Cooperation for Safety and Mitigation of COVID-19”, which was drafted by the Ministry of Public Health. To comply with government regulations, Chulalongkorn University announced its guidelines regarding the opening of offices, class management, and general operations in line with the pandemic situation. For the safety and well-being of students and personnel, and to ensure uninterrupted and efficient operation of the university, the university issued temporary closures announcements. Students and staff were asked to carry out studies, research, or other work tasks outside the campus, making use of home-based work, learning, and social activities via online platforms. In this study, the opening/closing schedule is carefully reviewed as part of the effort to examine electricity usage patterns under the lockdown.
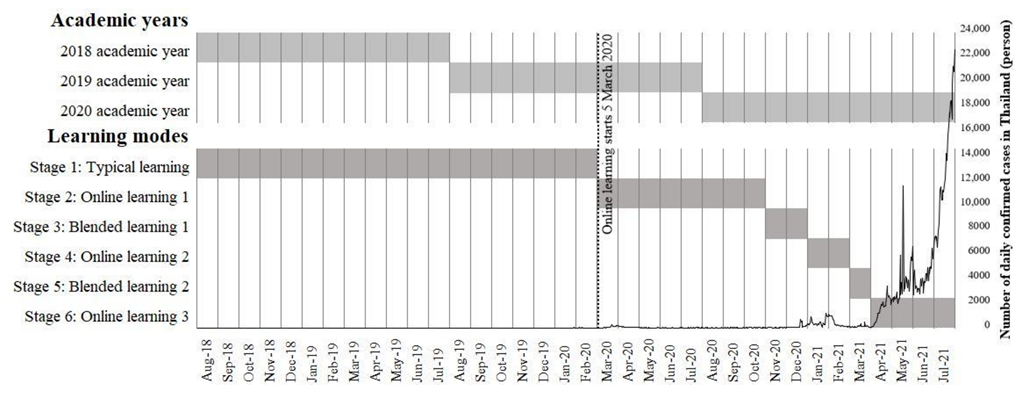
In general, the university academic year officially runs from August of one year to July of the next. The first semester starts from August to December. The second semester runs from January to May, while the summer semester runs from June to July. In this study, the university’s opening/closing schedule was collected from the Chula COVID-19 website [56] which publicly published all university announcements related to the COVID-19 outbreaks in Thailand. Figure 2 displays the relevant key time points from August 2018 to July 2021, all of which were within the academic year 2018, 2019, and 2020. Three key points were highlighted in March 2020 (the first COVID-19 wave), January 2021 (the second wave), and April 2021 (the third wave) which corresponded to the increased number of daily confirmed COVID-19 cases in Thailand.
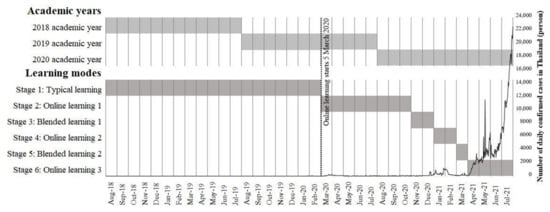
Figure 2.
Outbreak trend of the COVID-19 pandemic with periods of the temporary closure of the university during academic year 2018 to 2020, alongside the online and blended learning mode implications from stage 1 to 6.
Due to concerns about the outbreak of COVID-19, the university took active countermeasures to deal with the adverse impacts on students and staff by announcing temporary closures, and the university first implemented the “online learning” mode, either on a real-time basis or with pre-recorded files, on 5 March 2020. When the number of new COVID-19 cases increased at a slower pace, the university began to implement the “blended learning” mode, keeping a ratio of 40:60 for on-campus to off-campus activities, which combines asynchronous learning and synchronous learning [57], on 19 October 2020. In the case of asynchronous learning, students were able to learn online on their own by achieving self-directed learning objectives, while synchronous learning allowed students to discuss and learn together, focusing on both on-campus participatory learning and online classes, examinations, training sessions, and other activities carried out in real-time. The dean of the faculty was assigned to determine the learning mode of each course. During AY2018-AY2020, the learning modes consisted of 6 stages as illustrated in Figure 2 including: (1) Stage 1: Typical learning—on-campus learning from August 2018 to February 2020, (2) Stage 2: Online learning 1—from March 2020 to October 2020. Near the beginning of the pandemic in early 2020, the university announced that all courses would be carried out entirely online, and staff needed to perform their tasks without travelling to their usual places of work, and (3) Stage 3: Blended learning 1—from November 2020 to December 2020. As the pandemic continued to slowly spread, students were requested to study via online platforms; only those with approval could perform on-campus activities. Some staff were permitted to work during designated times depending on the decisions of section heads, with primary concern given to safety and welfare. When the outbreak presented unprecedented uncertainty in early 2021, the learning modes were adjusted to suit the rapidly evolving situations as follows: (4) Stage 4: Online learning 2—from January 2021 to February 2021, (5) Stage 5: Blended learning 2 in March 2021, and (6) Stage 6: Online learning 3—from April 2021 to July 2021.
2.5. Data Analysis
Figure 1 displays the overall analysis flow chart. To understand the impact of COVID-19 on building energy consumption, numeric data of electricity consumption were analyzed quantitatively using the descriptive statistics methods to present the constructs of interest or associations across data sets at various time points. The analysis in this study consists of: (1) Academic year comparison, (2) Learning mode comparison, and (3) Simple Linear Regression analysis.
2.5.1. Academic Year Comparison
Similar to previous studies [32,33,34,35,36,37,38,39,40], to analyze changes under the temporary closure, a comparative analysis was done by the process of comparing data from three academic years, and distinguishing the similarities and differences in electricity usage patterns. In this study, data from three academic years were displayed and analyzed including: (1) The Typical academic year—the academic year 2018 (AY2018: August 2018 to July 2019), (2) The Semi-COVID-19 academic year—the academic year 2019 (AY2019: August 2019 to July 2020), and (3) The COVID-19 academic year—the academic year 2020 (AY2020: August 2020 to July 2021). The yearly consumption in this study refers to the academic years of the university, i.e., from August to July, and not calendar years. In addition, the graphic display that summarizes the change in the monthly electricity consumption data from the AY2018 to AY2020 is provided.
For benchmarking comparison, the Energy Use Index (EUI) was applied with the academic year analysis in all building function types to calculate units of electricity use per occupied floor area as units of kilowatt-hours per square meter per year (kWh/m2-y) [42,58]. Changes in academic year electricity consumption were expressed in terms of the EUI percentage change in which data from AY2018, AY2019, and AY2020 were tabulated and compared against each other.
2.5.2. Learning Mode Comparison
Previous studies suggested that the occupant distribution greatly affects the energy consumption of buildings [15,32,33,38,39]. During the period of temporary closure, switching to online or blended learning modes was basically determined on a month-by-month basis, and these periods of implementation had the potential to affect electricity consumption. For this reason, additional analysis was performed with respect to the learning modes in which the total monthly data sets during the COVID-19 period were compared with the total monthly data of the same period in the base year (stage 1) to differentiate percentage changes during the online learning and blended learning modes implementation of various building types.
In this study, the energy consumption of three COVID-19 learning modes was examined in term of the percentage differences including: (1) stage 2 (online learning mode 1: March 2020 to October 2020) versus stage 1 (March 2019 to October 2019), (2) stage 3 (blended learning mode 1: November 2020 to December 2020) versus stage 1 (November 2019 to December 2019, and (3) Stage 4 (online learning mode 2: January 2021 to February 2021) versus stage 1 (January 2020 to February 2020). Since energy consumption in stages 5 and 6 overlap with the COVID-19-related period in stage 2, only data from stages 2, 3, and 4 were used in the learning mode comparison analysis.
2.5.3. Simple Linear Regression
Previous studies had reported that the weather might lead to changes in electricity use during the lockdown [18,37,59]. For tropical climates, the outdoor temperature greatly affects the air-conditioning system load. To identify the impact of weather conditions on building energy consumption, this study applied the simple linear regression technique for analysis. The regression model could be written according to Equation (1).
In this study, x was the average outdoor temperature from the Thai Meteorological Department [53] and y was the total monthly energy use for three academic years. The regression coefficient (β1) represents the direction and magnitude of energy consumption change as the temperature change. ε is the error of the estimate. The significance of the model is represented by the p-value in which the model is considered statistically significant if the p-value is below 0.05. Lastly, the validity of the model is determined by the coefficient of determination (r2) in which a high r2 value indicates that the model is a good fit for the data.
3. Results and Discussions
3.1. Data Overview
The data sets consisted of monthly electricity consumption from August 2018 to July 2021 and the aggregate yearly electricity consumption. In terms of yearly consumption, Table 3 presents the consumption for the AY2018 to AY2020 based on building function types. The monthly consumption data were plotted in Figure 3 and Figure 4 to show changes in the slope at various points in time throughout the three academic years. These resulting patterns suggest that electricity usage decreased over the studied time frame. The greatest electricity consumption is found prior to the emergence of COVID-19, in the AY2018, while the lowest is found during the AY2020, the COVID-19 year. In comparison to the typical academic year, electricity consumption in the AY2019 and AY2020 decreased by 9,929,555 kWh (20.92%) and 16,855,912 kWh (35.50%), respectively, while the AY2020 was 6,926,357 kWh (18.44%) lower than AY2019. Thus, there was a clear and dramatic drop in electricity consumption during the COVID-19-affected periods.
Table 3.
The yearly electricity consumptions (kWh) from AY2018 to AY2020 based on the building function types.

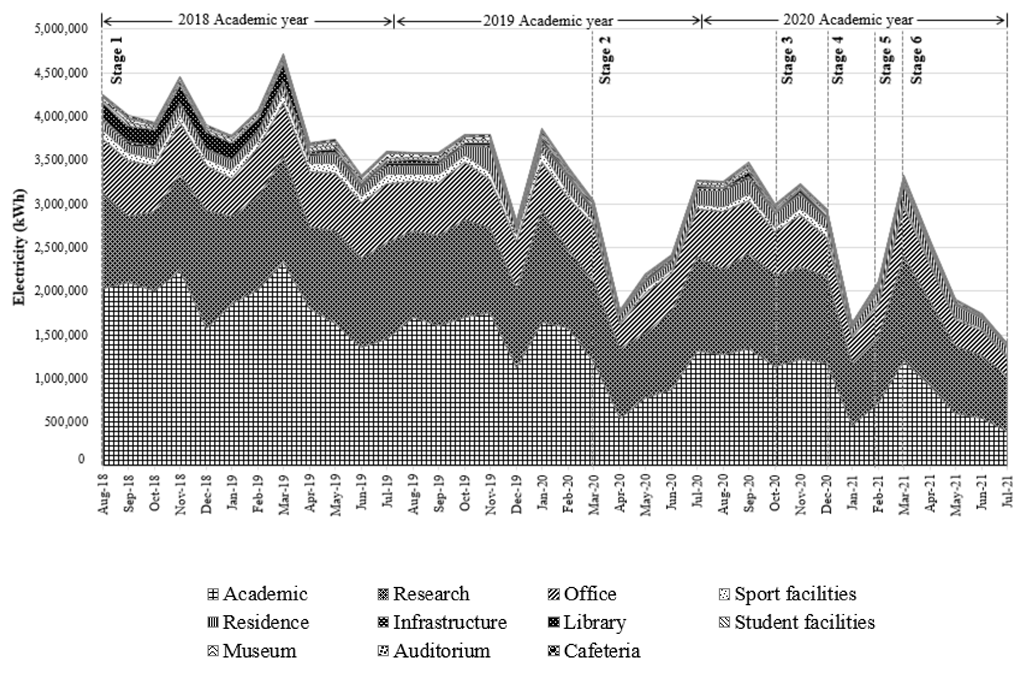
Figure 3.
Pattern of electricity consumption (kWh) during AY2018 to AY2020 and the learning modes implications, plotting based on building function types.
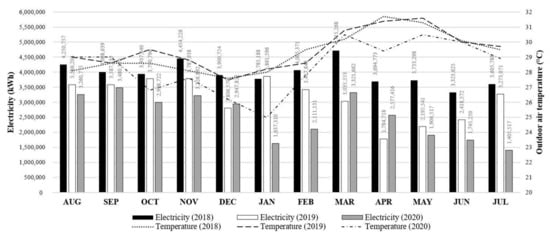
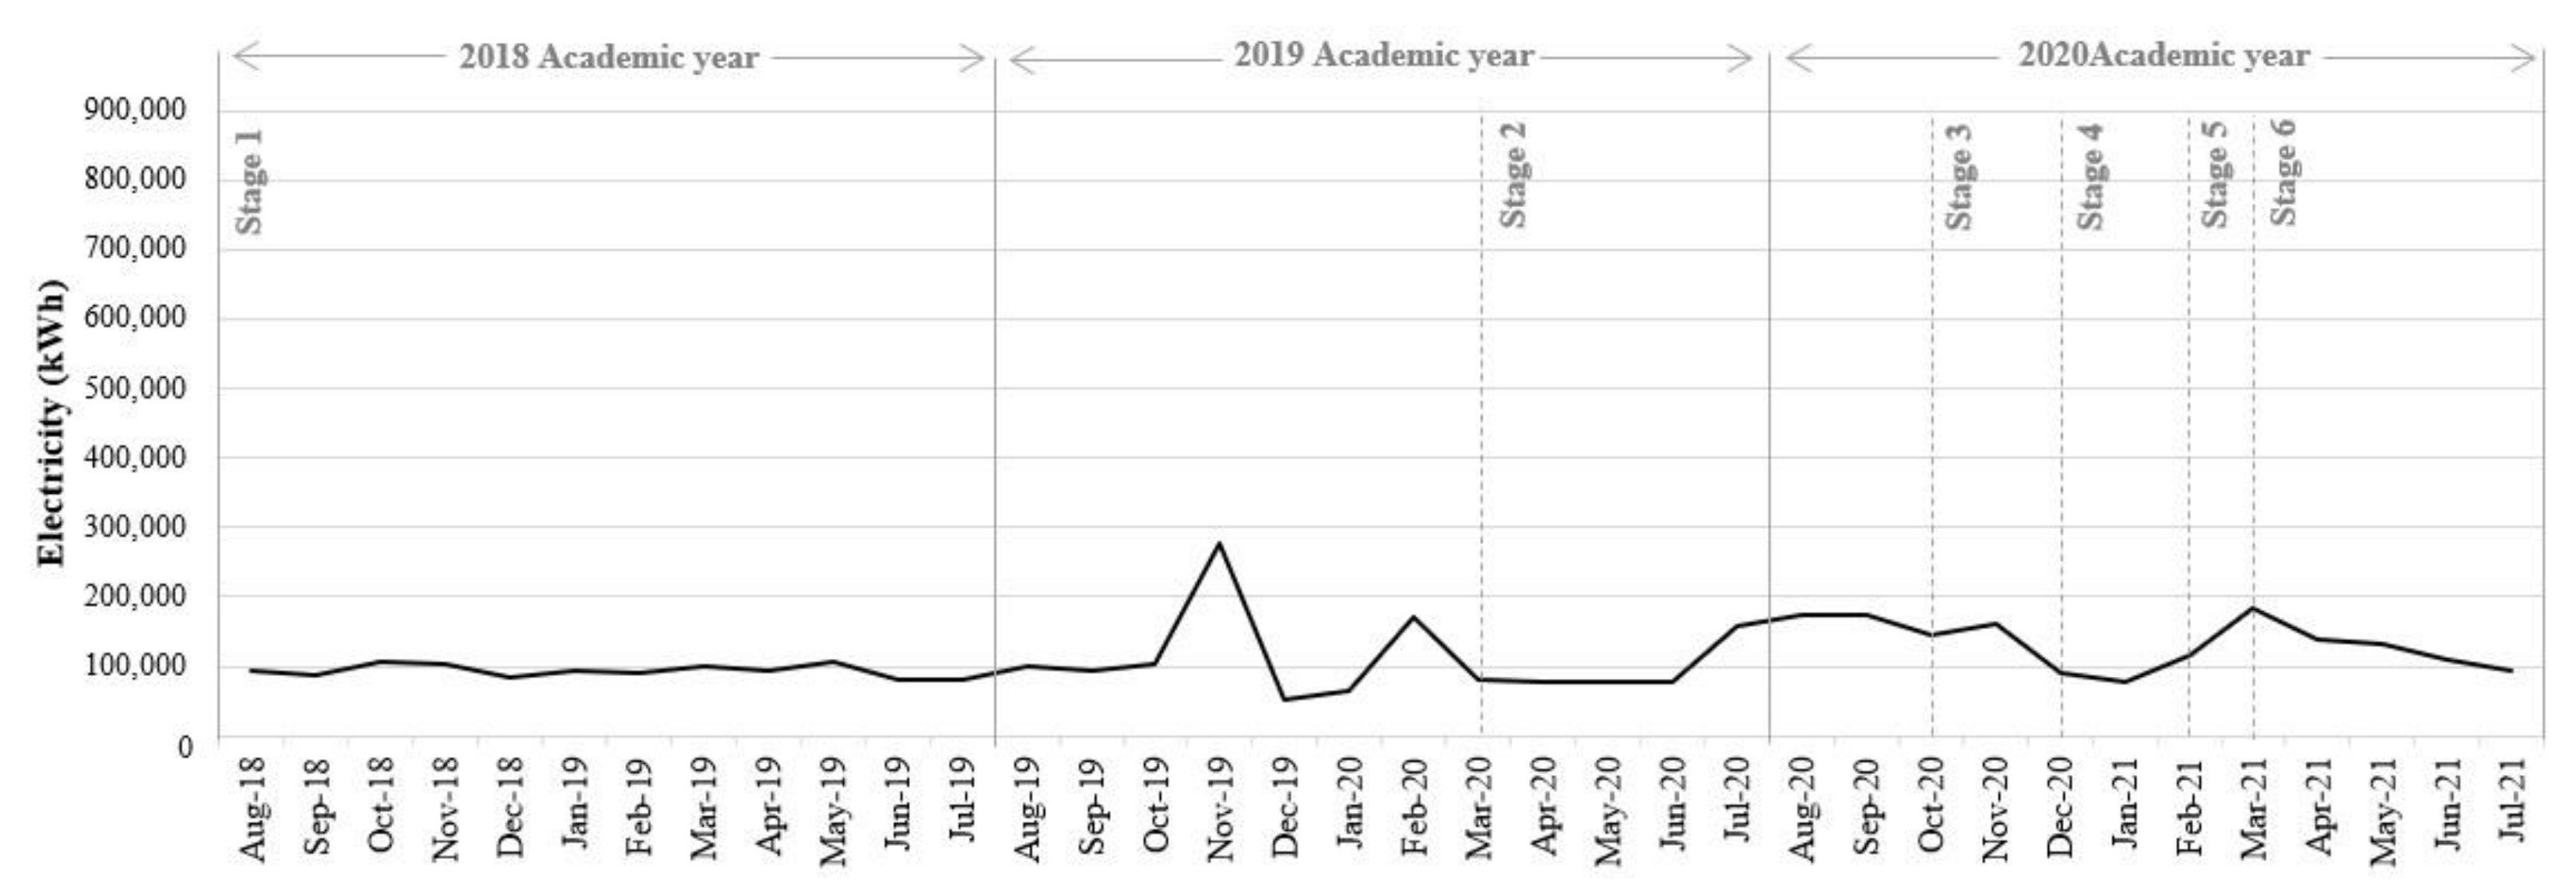
Figure 4.
Change of monthly electricity consumption (kWh) from 2018 to 2020 academic years, plotting against their monthly average outdoor air temperature (°C).
Focusing on the building function types, a significant change with respect to time periods was found in the library type. The electricity consumption in AY2019 was 80.21% lower than in AY2018 (1,626,792 kWh in AY2018, and 321,908 kWh in AY2019). An even larger reduction was found in AY2020 when the consumption was 86.52% less than in 2018 (219,263 kWh in AY2020). However, for the research type, the discrepancies were not as obvious; the electricity consumption in AY2019 was 7.53% lower than in AY2018 (12,572,241 kWh in AY2018, and 11,624,340 kWh in AY2019), and the AY2020 consumption was 13.24% less than in AY2018 (10,907,293 kWh in AY2020). Conversely, the only building function type in which an increase in electricity consumption was noticeable was the residence type, electricity consumption in AY2019 was 18.29% greater than in AY2018 (1,124,913 kWh in AY2018, and 1,330,739 kWh in AY2019), and in AY2020 was 41.93% greater than 2018 (1,596,655 kWh in AY2020). Detailed energy consumption patterns of academic, research, office, and residential types can be found in Figure A1, Figure A2, Figure A3 and Figure A4 in Appendix A. In general, the energy usage dropped rapidly when the learning mode was changed from onsite to online as seen in academic and office building types (Figure A1 and Figure A3). For the research and dormitory buildings, the energy usage slightly decreased at the initial phase of the outbreak, then slowly recovered, and stayed near pre-pandemic levels. (Figure A2 and Figure A4).
Figure 4 contains a histogram showing the changes in total monthly electricity consumption. The results suggest that monthly electricity consumption decreased significantly from the AY2018 to AY2019, with the largest and smallest differences occurring in April and July, respectively. When the outbreak was declared to be a global pandemic in March 2020, its impacts on students and staff were direct and obvious since the university announced the temporary closure and the changes to teaching and working via online platforms. As a result of these changes, the electricity consumption in March 2020 decreased drastically and simultaneously with the temporary closure of the university by 33.38% compared to March 2019. The gap was even wider in April 2020, which marked the largest change in the AY2019, at 51.13%. During the pandemic in the AY2020, the second semester started in January 2021 under the online learning mode, without on-campus activities. This marked the widest gap during the studied period, with a reduction of 57.60% when compared to January 2020 (in the 2019 academic year). It was envisaged that electricity consumption decreased during the policies of a temporary closure of the university, where a significant reduction in yearly or monthly consumption was found.
For the assessment of the relationship between weather conditions and electricity demand, Figure 3 illustrates the monthly electricity consumption plotted against corresponding average temperatures. In contrast to previous research [18,37], the simple linear regression analysis showed no significant relationship between weather conditions and energy consumption (r2 = 0.0002, p > 0.05). It was hypothesized that the electricity consumption in university buildings during the COVID-19 pandemic mainly varies based on campus occupancy and activities.
3.2. Academic Year Comparison Analysis
The results in this study indicate that less electricity was consumed in most of the higher education buildings during the COVID-19-related academic years compared to the typical year. Table 4 presents the Energy Use Index of all building function types. Figure 5 illustrates the average change percentage, derived from Table 4, to take a closer look at the changes in electricity demand based on building function types between the typical year and the COVID-19 year.
Table 4.
The Energy Use Index (kWh/m2-y) based on buildings function types during the typical academic year (AY2018) and the COVID-19-related academic years (AY2019 and AY2020).
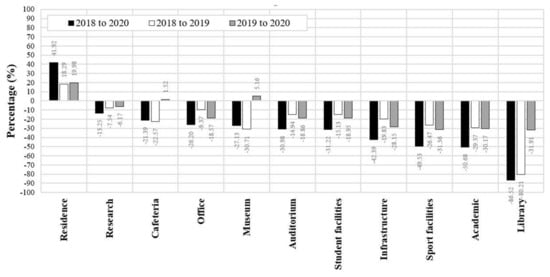
Figure 5.
Comparison of Energy Use Index (kWh/m2-y) based on their building function types during the typical academic year (AY2018) and the COVID-19-related academic years (AY2019 and AY2020).
With respect to the most significant change in electricity per floor area, similar to previous studies [32,37], the on-campus support facilities like the library type marked the largest reduction; the result in AY2019 was 80.21% lower than in AY2018 (72.04 kWh/m2-y in AY2018, and 14.26 kWh/m2-y in AY2019), and in AY2020 was 86.52% lower than AY2018 (9.71 kWh/m2-y in AY2020). Meanwhile, for the research type, the changes were small; the result in AY2019 was 7.54% lower than in AY2018 (77.84 kWh/m2-y in AY2018, and 71.94 kWh/m2-y in AY2019), and in AY2020 was 13.24% lower than in AY2018 (67.53 kWh/m2-y in AY2020). However, only the result in the residence type was greater than in AY2018, rising by 18.30% in AY2019 (30.34 kWh/m2-y in AY2018, and 35.89 kWh/m2-y in AY2019), and by 41.93% in AY2020 (43.06 kWh/m2-y in AY2020). These data clearly indicate their gradual declining patterns of energy consumption in many building types.
Among the on-campus support facilities, not only the library, but all support facilities experienced a significant decrease in electricity consumption, especially in the sports facilities type. The result in AY2019 was 26.47% lower than in AY2018 (69.32 kWh/m2-y in AY2018, and 58.83 kWh/m2-y in AY2019). An even larger reduction was found in AY2020 when it was 49.53% less than in AY2018 (10.20 kWh/m2-y in AY2020). The explanation can be found in the fact that a small number of students were utilizing these facilities due to the implications of health and safety risks in campus operation policies and temporary closures. These support facilities first went into lockdown starting in March 2020 and remained in lockdown until the time of this study (May 2022) as part of the policy to mitigate the spread of COVID-19. These restrictions on opening hours and the limitations on the number of users played a key role in the reduction in usage of electricity. This is in line with Chihib et al. [32], who found the largest reduction in electricity consumption in library buildings during the lockdown.
Notable changes were noted in the academic type as well, with a significant decrease from year to year. The result in AY2019 was 29.37% lower than in AY2018 (61.62 kWh/m2-y in AY2018, and 43.52 kWh/m2-y in AY2019), and, in AY2020, was 50.68% less than in AY2018 (30.39 kWh/m2-y in AY2020). This is in line with previous research [33,37], which reported the largest reduction in the academic type among the university buildings since learning and teaching activities moved off campus during the temporary closure. Furthermore, when compared to others, the academic type is worthy of note due to its in-aggregate yearly consumption totaling 36.08–48.89% of all consumption in the three studied academic years, representing the largest share of electricity consumption of all building types on the campus. For these reasons, even though the most dramatic drop in percentage terms was found in the on-campus support facilities type, they accounted for a smaller portion of total electricity usage and reduction. Thus, the electricity consumption in academic type buildings must be of primary concern. The severity of the lockdowns was the main factor that affected electricity changes in the AY2019 and AY2020 when the university switched teaching and learning activities from on-campus to online or blended learning methods in reaction to the pandemic conditions. Analysis of the electricity consumption based on those learning mode implementations will be presented in a later subsection.
The smallest reduction was identified in the research type, which was in line with Chihib et al. [32] and Kang et al. [34], who found less lockdown influence on electricity use within university research facilities. This finding could be explained by the fact that many research projects remained activated with their overtime schedule for ongoing projects, even when the university closed, along with the nature of research activities and heavy electricity load for laboratory facilities such as laboratory materials, fridges, ultra-freezers, telecommunication equipment, even when the university was locked down. Furthermore, due to the unprecedented situation during the temporary closure, the reopening schedule that started near the end of 2020, in stages 2 and 3, allowed university personnel or students with approval to reside in or enter the campus for the purpose of work, research, and dissertation activities. Thus, those involved in research, and working in the research type, maintained a certain level of on-campus activities, resulting in only small changes to electricity consumption in the AY2019 and AY2020.
Electricity consumption in most of the building types tended to decrease during the time of the pandemic. However, only consumption in the student dormitories was found to have increased. This is in line with Kang [34], which found increasing electricity usage in residential buildings during the pandemic lockdown. From March 2020 to May 2022, the university announced measures to reduce the outbreak, as well as to ensure that university operations proceeded in an orderly way by switching learning to online mode. Students were requested to refrain from leaving their places of residence or engaging unnecessarily in on-campus activities, while classes were offered via online platforms, and alternative evaluations and assessment methods were utilized such as online examinations, assignments, reports, or take-home examinations. Especially during the online learning mode in stages 2, 4, and 6, they were asked to carry on studies via home-based activities within the dormitories for a period of seventeen months. Thus, electricity consumption in the residence type continued to rise during the pandemic.
From an overall perspective, the comparative analysis of yearly data sets reveals patterns through time, allowing us to understand the electricity performance of higher education buildings. The findings in this study reveal a similar trend in energy consumption as in past research; although, the magnitude of changes was different. The results of this study indicated that, during the pandemic in the AY2019 and AY2020, the demand for electricity on the university campus was much lower compared to the typical year, as represented by the 2018 academic year. The temporary closure and restrictions of on-campus activities led to significant changes in electricity consumption. It is important to note that, a substantial reduction, for the semi-COVID-19 academic year at 20.92% and the COVID-19 academic year at 35.50%, was found in this study when compared to the National University of Malaysia [36], University of Almeria [32], Griffith University [33], and Universitat Politècnica de Catalunya [37], as 11%, 15%, 16%, and 19%, respectively. This can be attributed to specific contextual factors such as lockdown restriction levels, building characteristics, facility management, HVAC systems, and climate conditions, which need to be interpreted cautiously.
Furthermore, this study provides additional evidence to support the idea put forward by past research that electricity patterns varied based on the nature of building functions. The library type marked the biggest change in electricity reduction in percentage terms; however, the academic type should be considered more significant as it was the main contributor to the aggregate electricity consumption of the university. Meanwhile, the smallest change was found in the research type, where most of the essential work remained on campus. Only in the residence type did electricity consumption increased due to the extended period of students observing lockdown restrictions and study-from-home policies.
3.3. Learning Mode Comparison Analysis
The comparative analysis of academic years points out that the increasingly strict lockdown protocols had a great influence on electricity consumption. During the lockdown period, switching to alternative learning modes was determined on a month-by-month basis which had the potential to affect electricity consumption. Therefore, additional analysis was performed with respect to the learning modes. The aggregate monthly data are presented in Table 5.
Table 5.
Total electricity consumption (kWh) of the building function types in different learning modes as stage of online learning (stage 2: online learning 1 and stage 4: online learning 1) and blended learning (stage 3: blended learning 1), compared with their same period in stage 1.
In summary, switching to the online learning mode significantly decreased electricity consumption on campus, while a smaller change was found during the blended learning mode. The electricity consumption in stage 2 was 25.35% lower than the corresponding months in stage 1 (31,629,841 kWh in stage 1, and 23,611,631 kWh in stage 2), while the electricity consumption in stage 4 was 49.44% lower than the corresponding months of stage 1 (7,685,570 kWh in stage 1, and 3,885,180 kWh in stage 4). The smaller difference was observed under the blended learning mode since it usually allowed for certain university personnel or students to enter the campus for the purposes of work or maintaining ongoing projects. The electricity consumption in stage 3 was 7.71% lower than the corresponding months in stage 1 (6,977,516 kWh in stage 1, and 6,439,100 kWh in stage 3).
During the periods of online learning, the largest reduction in electricity consumption was found in the sports facilities type. Its electricity consumption in stage 4 was 72.20% lower than that of stage 1 (202,413 kWh in stage 1, and 56,260 kWh in stage 4), while during stage 2, the library showed the largest reduction, with its electricity consumption being 53.22% lower than that of stage 1 (438,350 kWh in stage 1, and 205,020 kWh in stage 2). The academic type also showed a notable reduction. Its electricity consumption in stage 2 was 36.72% lower than that of stage 1 (14,597,308 kWh in stage 1, and 9,236,276 kWh in stage 2). An even larger reduction was found in stage 4 when it was 63.91% less than that of stage 1 (3,518,836 kWh in stage 1, and 1,269,868 kWh in stage 4).
Conversely, the smallest reduction was found in the research type, where electricity consumption in the online learning mode of stage 2 was 11.05% lower than that of stage 1 (8,234,915 kWh in stage 1, and 7,324,527 kWh in stage 2). The only building function type where electricity consumption increased was the residence type, where its electricity consumption in stage 2 was 26.46% greater than that of stage 1 (759,870 kWh in stage 1, and 960,914 kWh in stage 2). The results indicate that the same pattern can be seen across the analysis of academic years, where the library type, sports facilities type, and academic type all show a significant reduction in the consumption of electricity, while the demand for electricity increased in the residence type. These patterns are evidence to support the critical role of building functions on electricity consumption.
3.4. Potential Strategies for Electricity Management in the Post-COVID-19 Period
Although the COVID-19 pandemic had disrupted the learning methods of higher education institutes, temporary closure provides a rare opportunity to examine the energy performance of the university. Below are potential strategies for electricity management in the post-COVID-19 period.
- The findings suggest that the academic type must be of primary concern when planning for improved energy efficiency since it accounts for the largest proportion of area and energy consumption. In the future, the administrative team may need to compulsory enforce green building design principles on renovation and new-construction projects of this building type.
- Further discussion on clustering-related building functions is crucial for achieving optimal operations. As a single building comprises of various functions, grouping and sharing techniques among buildings clusters appear to offer a promising approach to managing electricity demand [60] by planning and controlling the electricity in individual buildings or across building types based on university schedules [61], all of which can help to establish efficient strategies in the post-pandemic period at the university level.
- The results suggest that online learning can potentially be implemented to manage electricity demands in academic buildings. Data analysis showed that electricity consumption significantly decreased at the beginning of the online learning mode. Within a month of its implementation, electricity consumption of the academic type in stages 2 and 4 decreased by 69.91% and 71.79%, respectively. Therefore, switching to the online learning mode may be an effective strategy to be further promoted, although many other factors, such as changes in dormitories electricity consumption would need to be considered in analyzing the overall efficiency and effectiveness.
- It is important to consider the wide range of options with respect to learning environments [62,63], not only focus on the energy perspective but also on all aspects of course design and effectiveness. The blended learning can potentially be integrated into the new teaching model. Depending on activities, certain classes can be held online. Other classes requiring practices or face-to-face collaboration, such as research, tutorials, and workshops, can be held on campus as part of the effort to manage occupancy schedules in the buildings. At the university level, since the results suggest that the blended learning 1 (Stage 3) and the blended learning 2 (Stage 5) mark a 26.09% and 29.55% reduction, respectively, the university can propose these initiative values as a new approach to offer most potential electricity savings while providing equal access to education in the future.
- Although the COVID-19 pandemic caused temporary closure of campus, the monthly overall campus energy usage right after the outbreak period reduced to approximately 55% when compared to the previous year. This consumption could be from electricity loads of equipment that remained operational and unplugged equipment. An automated building energy management system (BEMS) might help improve building energy efficiency. Energy-saving actions and awareness should be raised among university members. It may also be worthwhile to investigate the value of individual metering tools, or combine smart and centralized control methods for electricity data collection to separately measure consumption in specific areas.
- This study is one of the first attempts to examine electricity consumption in student dormitories. Similar to prior research [34], consumption of electricity in these buildings during the pandemic increased noticeably which suggest potential resource consumption shift from higher education institutions to on- and off-campus residence. Further study should be carried out to examine the complex linkages between electricity demands and online-based learning environments during a long period of stay-from-home restrictions, such as the increase in air-conditioning running time [64].
- Lastly, this research had several limitations due to the data collection method. Since COVID-19 is an emergency event, data collected in this study were limited to existing metering records in which data granularity were too coarse. For further energy analysis, this study suggests that university administration might explore the options to install advanced energy metering and management system that can be remotely accessible which would enhance the university’s management and response capability during the time of crisis.
4. Conclusions
The COVID-19 pandemic has had a direct impact on electricity consumption in higher education buildings. This study was the first comprehensive investigation of Thai universities. Significant changes were found during the temporary closure compared to the pre-pandemic time as described in the key findings shown below.
- When comparing the electricity consumption during the temporary closure academic years (AY2019 and AY2020) to the typical academic year (AY2018), it was lower by 20.92% (9,929,555 kWh) in AY 2019 and 35.50% (16,855,912 kWh) in AY2020. It shows that time-varying conditions such as temporary closure and learning mode implementations had a significant impact on changes in electricity usage in higher education buildings.
- The results indicate that changes in electricity consumption can be described by building functions, which agrees with prior research. During the time of the pandemic, less electricity was consumed compared to the typical period; however, the changes in electricity consumption were neither universal nor uniform. The most significant changes were found in the support facilities like the library buildings, and the academic type. Small consumption reduction was found in the research type buildings. On the contrary, energy demand increased in dormitory buildings.
- This study strengthens the idea that teaching and learning activities have a strong influence on electricity consumption. As online learning is becoming more popular, this learning method could be promoted as a part of the future energy management policy and action plan.
Although the COVID-19 pandemic caused many challenges, it offers opportunities to investigate patterns of energy consumption under limited activity conditions and to rethink energy-efficiency scenarios for the post-COVID-19 period. The contribution of this research on a local and global scale are highlighted as follows.
- At the local level, as Chulalongkorn University is currently revising its sustainability policy and carbon footprint reduction action plan, the results reported in this study can be used as the basis for the development of such policy and action plan. For example, the reported Energy Use Index can be used for internal energy benchmarking among various university units. The energy-saving potentials of the online and blended learning mode can be promoted as an alternative action to reduce energy use and carbon emission. As the consumption demand pattern varies, enhancing energy resilience for the campus such as the installation of renewable energy sources may offer alternative sustainable energy efficiency solutions. The systematic examination of energy usage during the COVID-19 pandemic revealed many opportunities for university energy efficiency operational improvement. The administrative team may use the information for revising its facility planning and management. New design and operating approaches need to be integrated to enhance energy efficiency and promote the health and well-being of building occupants. Lastly, energy consumption could be reduced by raising awareness and promoting energy-saving behavior such as turning off or unplugging unused equipment.
- In Thailand, the study on electricity consumption in higher education institutions has received less attention. On a national scale, the analysis method reported in this study can be replicated in other universities or extended to other building types in other regions of Thailand. As Thailand aims to reduce its carbon footprint, this type of study can also contribute to the development of the national energy/carbon emission reduction plan, especially, from the education sector perspective.
- On the global scale, the results indicate that, while general patterns have been found, the changes in energy consumption highly depend on contextual factors in which future studies should explore appropriate approaches to promote sustainable energy consumption in universities, cities, and countries. The understanding of energy consumption changes is crucial to quantify the global impact of the pandemic on energy consumption and carbon emissions.
The insights gained from this study provide a more thorough understanding of electricity consumption in different types of buildings in higher education institutions located in hot-humid climates. Potential strategies for electricity management in the post-COVID-19 period are proposed. This study suggests that future research should consider class schedules, timetables, and alternative energy sources for a comprehensive discussion. The results reported in this study can serve as actual baseline data for future energy audit and simulation research in the higher education sector. As the pandemic situation is resolving, more investigation is required to understand the energy consumption for infection control in university buildings. Through a larger set of data and analysis methods, which may include data related to the consumption of water, fossil fuels, or natural gas, a comprehensive energy benchmark or a university’s carbon footprint assessment could be developed to help identify practical opportunities for improvement of energy management systems for higher education institutions.
Author Contributions
All authors contributed substantially to all aspects of this article. Conceptualization, V.I.; Funding Acquisition, V.I.; Investigation, K.C. and V.I.; Methodology, V.I., K.C. and A.T.; Project Administration, V.I.; Writing—Original Draft Preparation, K.C.; Writing—Review and Editing, V.I. and A.T. All authors have read and agreed to the published version of the manuscript.
Funding
This research received no external funding.
Data Availability Statement
Restrictions apply to the availability of these data. Data was obtained from the Office of Physical Resources Management, Chulalongkorn University and are available from the authors with the permission of the Office of Physical Resources Management, Chulalongkorn University.
Acknowledgments
The authors would like to thank the Office of Physical Resources Management, Chulalongkorn University for providing data for the study. This research project is supported by the Second Century Fund (C2F), Chulalongkorn University.
Conflicts of Interest
The authors declare no conflict of interest.
Appendix A
Electricity consumption (kWh) of office, academic, research, and residence building type during AY2018 to AY2020.
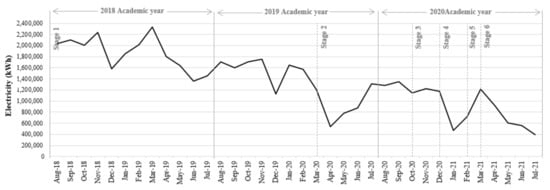
Figure A1.
Electricity consumption of the academic type during AY2018 to AY2020.
Figure A1.
Electricity consumption of the academic type during AY2018 to AY2020.

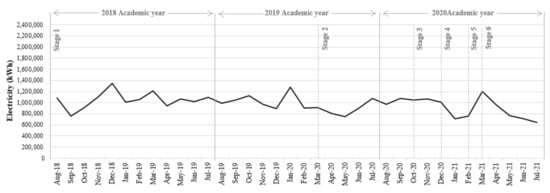
Figure A2.
Electricity consumption of the research type during AY2018 to AY2020.
Figure A2.
Electricity consumption of the research type during AY2018 to AY2020.
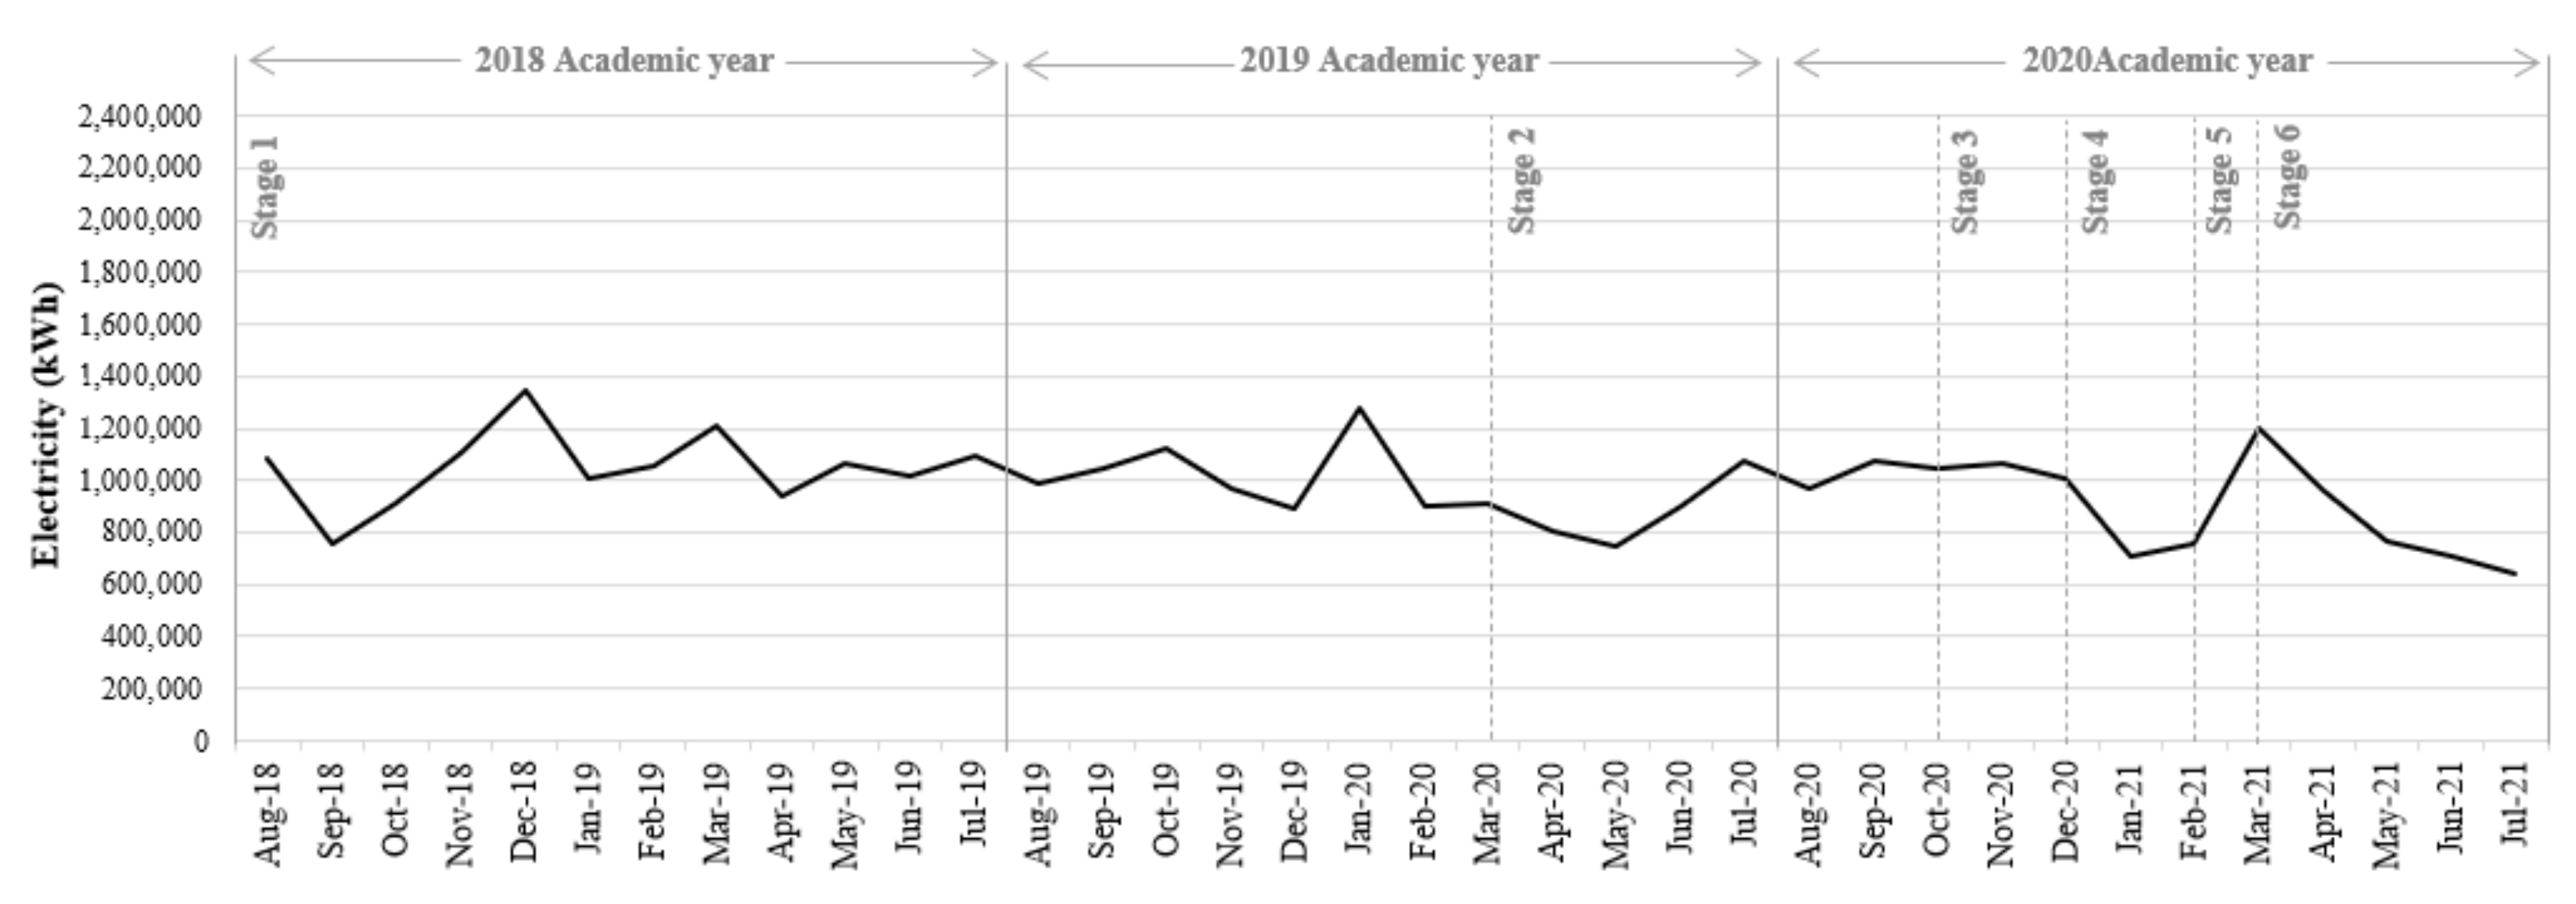
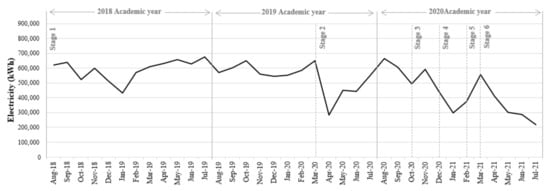
Figure A3.
Electricity consumption of the office type during AY2018 to AY2020.
Figure A3.
Electricity consumption of the office type during AY2018 to AY2020.

Figure A4.
Electricity consumption of the residence type during AY2018 to AY2020.
Figure A4.
Electricity consumption of the residence type during AY2018 to AY2020.
References
- World Health Organization (WHO). Director-General’s Opening Remarks at the Media Briefing on COVID-19. Available online: https://www.who.int/director-general/speeches/detail/who-director-general-s-opening-remarks-at-the-media-briefing-on-covid-19---11-march-2020 (accessed on 14 April 2022).
- International Energy Agency (IEA). Electricity Market Report—December 2020, 2020 Global Overview: The COVID-19 Pandemic; IEA: Paris, France, 2020; Available online: https://www.iea.org/reports/electricity-market-report-december-2020/2020-global-overview-the-COVID-19-pandemic (accessed on 11 September 2022).
- Abu-Rayash, A.; Dincer, I. Analysis of the electricity demand trends amidst the COVID-19 coronavirus pandemic. Energy Res. Soc. Sci. 2020, 68, 101682. [Google Scholar] [CrossRef]
- Alhajeri, H.M.; Almutairi, A.; Alenezi, A.; Alshammari, F. Energy Demand in the State of Kuwait During the COVID-19 Pandemic: Technical, Economic, and Environmental Perspectives. Energies 2020, 13, 4370. [Google Scholar] [CrossRef]
- Abulibdeh, A. Modeling electricity consumption patterns during the COVID-19 pandemic across six socioeconomic sectors in the State of Qatar. Energy Strategy Rev. 2021, 38, 100733. [Google Scholar] [CrossRef]
- Bento, P.M.R.; Mariano, S.J.P.S.; Calado, M.R.A.; Pombo, J.A.N. Impacts of the COVID-19 pandemic on electric energy load and pricing in the Iberian electricity market. Energy Rep. 2021, 7, 4833–4849. [Google Scholar] [CrossRef]
- De Mello Delgado, D.B.; de Lima, K.M.; Cancela, M.C.; Siqueira, C.A.S.; Carvalho, M.; de Souza, D.L.B. Trend analyses of electricity load changes in Brazil due to COVID-19 shutdowns. Electr. Power Syst. Res. 2021, 193, 107009. [Google Scholar] [CrossRef]
- Haxhimusa, A.; Liebensteiner, M. Effects of electricity demand reductions under a carbon pricing regime on emissions: Lessons from COVID-19. Energy Policy 2021, 156, 112392. [Google Scholar] [CrossRef]
- Santiago, I.; Moreno-Munoz, A.; Quintero-Jiménez, P.; Garcia-Torres, F.; Gonzalez-Redondo, M.J. Electricity demand during pandemic times: The case of the COVID-19 in Spain. Energy Policy 2021, 148, 111964. [Google Scholar] [CrossRef]
- Shekhar, J.; Suri, D.; Somani, P.; Lee, S.J.; Arora, M. Reduced renewable energy stability in India following COVID-19: Insights and key policy recommendations. Renew. Sustain. Energy Rev. 2021, 144, 111015. [Google Scholar] [CrossRef]
- Soava, G.; Mehedintu, A.; Sterpu, M.; Grecu, E. The Impact of the COVID-19 Pandemic on Electricity Consumption and Economic Growth in Romania. Energies 2021, 14, 2394. [Google Scholar] [CrossRef]
- Buechler, E.; Powell, S.; Sun, T.; Astier, N.; Zanocco, C.; Bolorinos, J.; Flora, J.; Boudet, H.; Rajagopal, R. Global change in electricity consumption during COVID-19. iScience 2022, 25, 103568. [Google Scholar] [CrossRef]
- Wang, Q.; Li, S.; Li, R.; Jiang, F. Underestimated impact of the COVID-19 on carbon emission reduction in developing countries—A novel assessment based on scenario analysis. Environ. Res. 2022, 204, 111990. [Google Scholar] [CrossRef] [PubMed]
- Deiss, B.M.; Herishko, M.; Wright, L.; Maliborska, M.; Abulencia, P. Analysis of Energy Consumption in Commercial and Residential Buildings in New York City before and during the COVID-19 Pandemic. Sustainability 2021, 13, 11586. [Google Scholar] [CrossRef]
- Geraldi, M.S.; Bavaresco, M.V.; Triana, M.A.; Melo, A.P.; Lamberts, R. Addressing the impact of COVID-19 lockdown on energy use in municipal buildings: A case study in Florianópolis, Brazil. Sustain. Cities Soc. 2021, 69, 102823. [Google Scholar] [CrossRef] [PubMed]
- Cortiços, N.D.; Duarte, C.C. COVID-19: The impact in US high-rise office buildings energy efficiency. Energy Build. 2021, 249, 111180. [Google Scholar] [CrossRef]
- Abdeen, A.; Kharvari, F.; O’Brien, W.; Gunay, B. The impact of the COVID-19 on households’ hourly electricity consumption in Canada. Energy Build. 2021, 250, 111280. [Google Scholar] [CrossRef]
- Kawka, E.; Cetin, K. Impacts of COVID-19 on residential building energy use and performance. Build. Environ. 2021, 205, 108200. [Google Scholar] [CrossRef]
- Krarti, M.; Aldubyan, M. Review analysis of COVID-19 impact on electricity demand for residential buildings. Renew. Sustain. Energy Rev. 2021, 143, 110888. [Google Scholar] [CrossRef]
- Li, L.; Meinrenken, C.J.; Modi, V.; Culligan, P.J. Impacts of COVID-19 related stay-at-home restrictions on residential electricity use and implications for future grid stability. Energy Build. 2021, 251, 111330. [Google Scholar] [CrossRef]
- Rouleau, J.; Gosselin, L. Impacts of the COVID-19 lockdown on energy consumption in a Canadian social housing building. Appl. Energy 2021, 287, 116565. [Google Scholar] [CrossRef]
- Duarte, C.C.; Cortiços, N.D. The Energy Efficiency Post-COVID-19 in China’s Office Buildings. Clean Technol. 2022, 4, 174–233. [Google Scholar] [CrossRef]
- Su, Y.; Cheng, H.; Wang, Z.; Wang, L. Impact of COVID-19 lockdown ion building energy consumption and indoor environment: A case study in Dalian, China. Energy Build. 2022, 263, 112055. [Google Scholar] [CrossRef] [PubMed]
- Wang, R.; Ye, Z.; Hsu, S.-C.; Chen, J.-H. Photovoltaic rooftop’s contribution to improve building-level energy resilience during COVID-19 work-from-home arrangement. Energy Sustain. Dev. 2022, 68, 182–191. [Google Scholar] [CrossRef]
- United Nations Educational, Scientific and Cultural Organization (UNESCO). COVID-19: Reopening and Reimagining Universities, Survey on Higher Education through the UNESCO National Commissions; UNESCO: Paris, France, 2021; Available online: https://unesdoc.unesco.org/ark:/48223/pf0000378174 (accessed on 27 August 2022).
- United Nations Educational, Scientific and Cultural Organization (UNESCO) International Institute for Higher Education in Latin America and the Caribbean. COVID-19 and Higher Education: Today and Tomorrow; Impact Analysis, Policy Responses and Recommendations; UNESCO-IIHELAC: Caracas, Venezuela, 2020; Available online: https://unesdoc.unesco.org/ark:/48223/pf0000375693 (accessed on 27 August 2022).
- Ding, Y.; Zhang, Z.; Zhang, Q.; Lv, W.; Yang, Z.; Zhu, N. Benchmark analysis of electricity consumption for complex campus buildings in China. Appl. Therm. Eng. 2018, 131, 428–436. [Google Scholar] [CrossRef]
- Chung, W. Review of building energy-use performance benchmarking methodologies. Appl. Energy 2011, 88, 1470–1479. [Google Scholar] [CrossRef]
- Nikolaou, T.; Kolokotsa, D.; Stavrakakis, G. Review on methodologies for energy benchmarking, rating and classification of buildings. Adv. Build. Energy Res. 2011, 5, 53–70. [Google Scholar] [CrossRef]
- Altan, H.; Douglas, J.S.; Kim, Y.K. Energy Performance Analysis of University Buildings: Case Studies at Sheffield University (UK). Archit. Eng. Technol. 2014, 3, 1000129. [Google Scholar]
- Shukri, M.A.A.; Jailani, J.; Hauashdh, A. Benchmarking the Energy Efficiency of Higher Educational Buildings: A Case Study Approach. Int. J. Energy Econ. Policy 2022, 12, 491–496. [Google Scholar] [CrossRef]
- Chihib, M.; Salmerón-Manzano, E.; Chourak, M.; Perea-Moreno, A.J.; Manzano-Agugliaro, F. Impact of the COVID-19 Pandemic on the Energy Use at the University of Almeria (Spain). Sustainability 2021, 12, 1336. [Google Scholar] [CrossRef]
- Gui, X.; Gou, Z.; Zhang, F.; Yu, R. The impact of COVID-19 on higher education building energy use and implications for future education building energy studies. Energy Build. 2021, 251, 111346. [Google Scholar] [CrossRef]
- Kang, H.; An, J.; Kim, H.; Ji, C.; Hong, T.; Lee, S. Changes in energy consumption according to building use type under COVID-19 pandemic in South Korea. Renew. Sustain. Energy Rev. 2021, 148, 111294. [Google Scholar] [CrossRef]
- López-Sosa, L.B.; Alvarado-Flores, J.J.; Marín-Aguilar, T.N.J.; Corral-Huacuz, J.C.; Aguilera-Mandujano, A.; Rodríguez-Torres, G.M.; Morales-Máximo, M.; Rodríguez-Magallón, M.C.; Alcaraz-Vera, J.V.; Ávalos-Rodríguez, M.L.; et al. COVID-19 Pandemic Effect on Energy Consumption in State Universities: Michoacan, Mexico Case Study. Energies 2021, 14, 7642. [Google Scholar] [CrossRef]
- Nasir, S.N.S.; Ludin, N.A.; Radzi, A.M.S.M.; Junedi, M.M.; Ramil, N.; Marsan, A.; Mohd, Z.F.A.; Roslan, M.R.; Taip, Z.A. Lockdown impact on energy consumption in university building. Environ. Dev. Sustain. 2022. [Google Scholar] [CrossRef]
- Gaspar, K.; Gangolells, M.; Casals, M.; Pujadas, P.; Forcada, N.; Macarulla, M.; Tejedor, B. Assessing the impact of the COVID-19 lockdown on the energy consumption of university buildings. Energy Build. 2022, 257, 111783. [Google Scholar] [CrossRef] [PubMed]
- Mokhtari, R.; Jahangir, M.H. The effect of occupant distribution on energy consumption and COVID-19 infection in buildings: A case study of university building. Build. Environ. 2021, 190, 107561. [Google Scholar] [CrossRef] [PubMed]
- Filimonau, V.; Archer, D.; Bellamy, L.; Smith, S.; Wintrip, R. The carbon footprint of a UK University during the COVID-19 lockdown. Sci. Total Environ. 2021, 756, 143964. [Google Scholar] [CrossRef]
- Baharom, N.A.; Yusuf, S.Y.; Za’aba, S.K.; Noor, N.M.; Ahmad, N.A.; Ahmad, W.A.A.W.; Boboc, M. Carbon Footprint Assessment from Purchased Electricity Consumption and Campus Commute in Universiti Malaysia Perlis (UniMAP): Pre and During COVID19 Pandemic. In Proceedings of the 3rd International Conference on Green Environmental Engineering and Technology, Penang, Malaysia, 8–9 September 2021; pp. 9–17. [Google Scholar]
- Muhammad, S.; Long, X.; Salman, M. COVID-19 pandemic and environmental pollution: A blessing in disguise? Sci. Total Environ. 2020, 728, 138820. [Google Scholar] [CrossRef]
- Khoshbakht, M.; Gou, Z.; Dupre, K. Energy use characteristics and benchmarking for higher education buildings. Energy Build. 2018, 164, 61–76. [Google Scholar] [CrossRef]
- Jareemit, D.; Suwanchaisakul, A.; Limmeechokchai, B. Assessment of key financial supports for promoting zero energy office buildings investment in Thailand using sensitivity analysis. Energy Rep. 2022, 8, 1144–1153. [Google Scholar] [CrossRef]
- Tevis, R.; Schuster, N.; Evans, F.; Himmler, R.; Gheewala, S.H. A multi-scenario life cycle impact comparison of operational energy supply techniques for an office building in Thailand. Energy Build. 2019, 190, 172–182. [Google Scholar] [CrossRef]
- Thinate, N.; Wongsapai, W.; Damrongsak, D. Energy performance study in Thailand hospital building. Energy Procedia 2017, 141, 255–259. [Google Scholar] [CrossRef]
- Damrongsak, D.; Wongsapai, W.; Thinate, N. Investigation on energy consumption of department store in Thailand. Energy Procedia 2019, 156, 217–221. [Google Scholar] [CrossRef]
- Jareemit, D.; Limmeechokchai, B. Impact of homeowner’s behaviours on residential energy consumption in Bangkok, Thailand. J. Build. Eng. 2019, 21, 328–335. [Google Scholar] [CrossRef]
- Promjiraprawat, K.; Winyuchakrit, P.; Limmeechokchai, B.; Masui, T.; Hanaoka, T.; Matsuoka, Y. CO2 mitigation potential and marginal abatement costs in Thai residential and building sectors. Energy Build. 2014, 80, 631–639. [Google Scholar] [CrossRef]
- Supasa, T.; Hsiau, S.-S.; Lin, S.-M.; Wongsapai, W.; Wu, J.-C. Household energy consumption behaviour for different demographic regions in Thailand from 2000 to 2010. Sustainability 2017, 9, 2328. [Google Scholar] [CrossRef]
- Ananwattanaporn, S.; Patcharoen, T.; Bunjongjit, S.; Ngaopitakkul, A. Retrofitted existing residential building design in energy and economic aspect according to Thailand Building Energy Code. Appl. Sci. 2021, 11, 1398. [Google Scholar] [CrossRef]
- Chulalongkorn University. Chulalongkorn University Sustainability Report 2020–2021; Office of the President, Chulalongkorn University: Bangkok, Thailand, 2021. [Google Scholar]
- Mahidol University. Mahidol University Sustainability Report 2020; Division of Physical Systems and Environment, Office of the President, Mahidol University: Nakhon Pathom, Thailand, 2020. [Google Scholar]
- Climatological Center. The Annual Report 2018–2021. Available online: http://119-46-126-48.static.asianet.co.th/ (accessed on 6 April 2022).
- Office of Planning and Budgeting, Chulalongkorn University. The Annual Report 2021; Chulalongkorn University: Bangkok, Thailand, 2021. [Google Scholar]
- Kangvan, S. Energy Consumption Benchmarks of University Buildings: A Case Study of Chulalongkorn University. Master’s Thesis of Architecture, Faculty of Architecture, Chulalongkorn University, Bangkok, Thailand, 2014. [Google Scholar]
- Chulalongkorn University. Chulalongkorn University Announcement. Available online: https://www.chula.ac.th/en/news-type/cu-announcement/ (accessed on 18 September 2022).
- Chulalongkorn University. Announcement Opening of Offices, Class Management and General Operations. Available online: https://www.chula.ac.th/en/covid-19/ (accessed on 2 April 2022).
- Department of Alternative Energy Development and Efficiency (DEDE), Ministry of Energy. Conservation of Energy in Educational Buildings; Ministry of Energy: Bangkok, Thailand, 2007. (In Thai) [Google Scholar]
- Zhang, C.; Liao, H.; Mi, Z. Climate Impacts: Temperature and Electricity Consumption. Nat. Hazards 2019, 99, 1259–1275. [Google Scholar] [CrossRef]
- Hachem-Vermette, C.; Singh, K. Optimization of energy resources in various building cluster archetypes. Renew. Sustain. Energy Rev. 2022, 157, 112050. [Google Scholar] [CrossRef]
- Li, X.; Chen, S.; Li, H.; Lou, Y.; Li, J. Multi-dimensional analysis of air-conditioning energy use for energy-saving management in university teaching buildings. Build. Environ. 2020, 185, 107246. [Google Scholar] [CrossRef]
- Al-Nasa’h, M.; Al-Tarawneh, L.; Awwad, F.A.; Ahmad, I. Estimating students’ online learning satisfaction during COVID-19: A discriminant analysis. Heliyon 2021, 7, e08544. [Google Scholar] [CrossRef]
- Kokkinos, C.M.; Tsouloupas, C.; Voulgaridou, I. The effects of perceived psychological, educational, and financial impact of COVID-19 pandemic on Greek university students’ satisfaction with life through Mental Health. J. Affect. Disord. 2022, 300, 289–295. [Google Scholar] [CrossRef]
- Joseph, B. Assessing the Long-Term Impacts of COVID-19 on Electricity Consumption (NI R 21-03); Nicholas Institute for Environmental Policy Solutions, Duke University: Durham, NC, USA, 2021. [Google Scholar]


Publisher’s Note: MDPI stays neutral with regard to jurisdictional claims in published maps and institutional affiliations. |
© 2022 by the authors. Licensee MDPI, Basel, Switzerland. This article is an open access article distributed under the terms and conditions of the Creative Commons Attribution (CC BY) license (https://creativecommons.org/licenses/by/4.0/).