
CFD Simulation Supported Development of Wind Catcher Shape Topology in a Passive Air Conduction System (PACS)


Abstract
:1. Introduction
2. Materials and Methods
2.1. Shape Design Test Variations of the PACS Intlet Structure
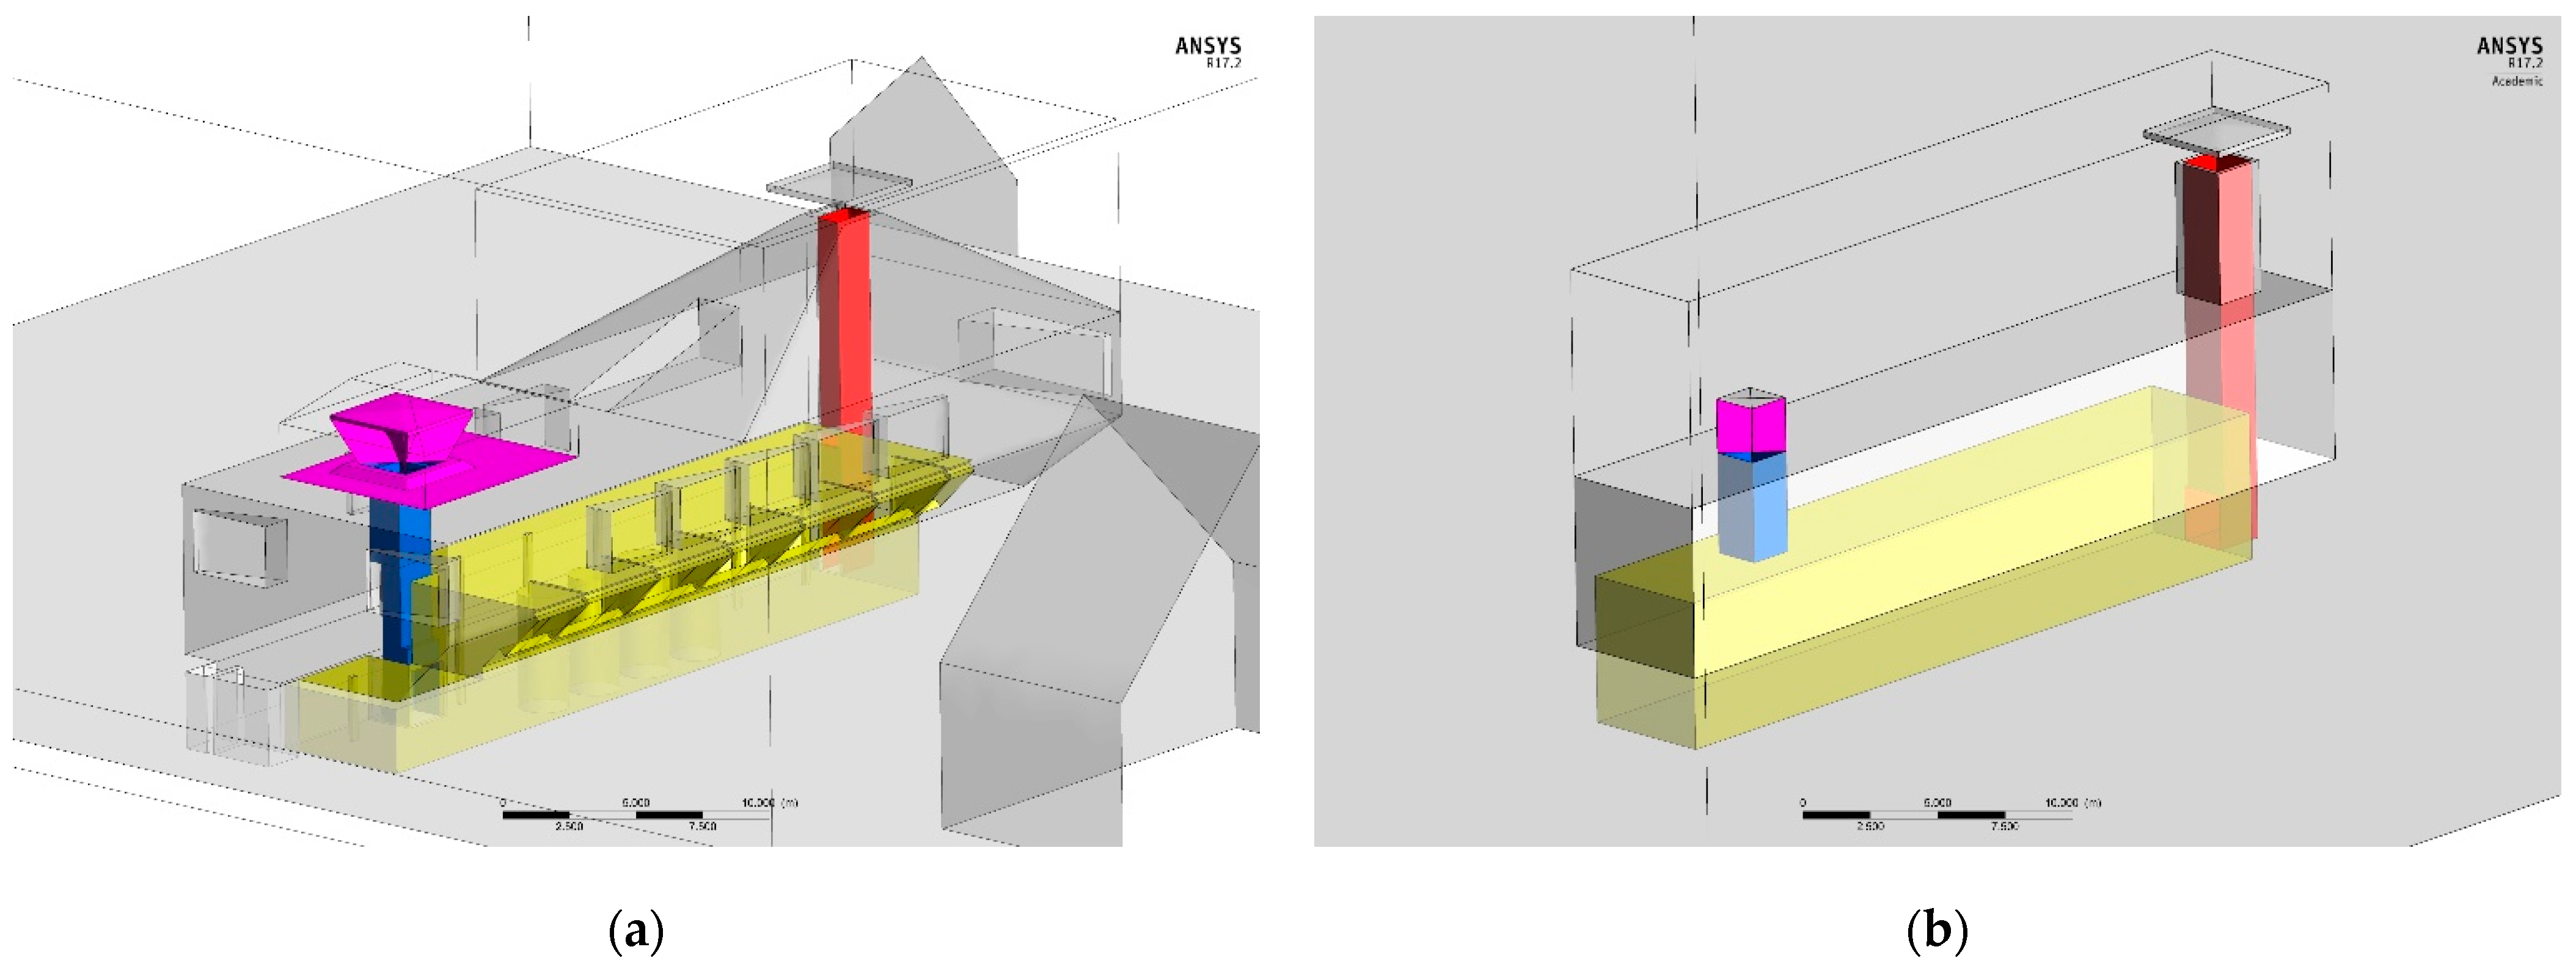
2.2. Simulations and Model Set Up
3. Results
3.1. Test Wind Catchers with Various Inlet Geometries
3.2. Effects of Deflectors
3.3. Modified Deflector Design
4. Discussion
Limitations
5. Conclusions
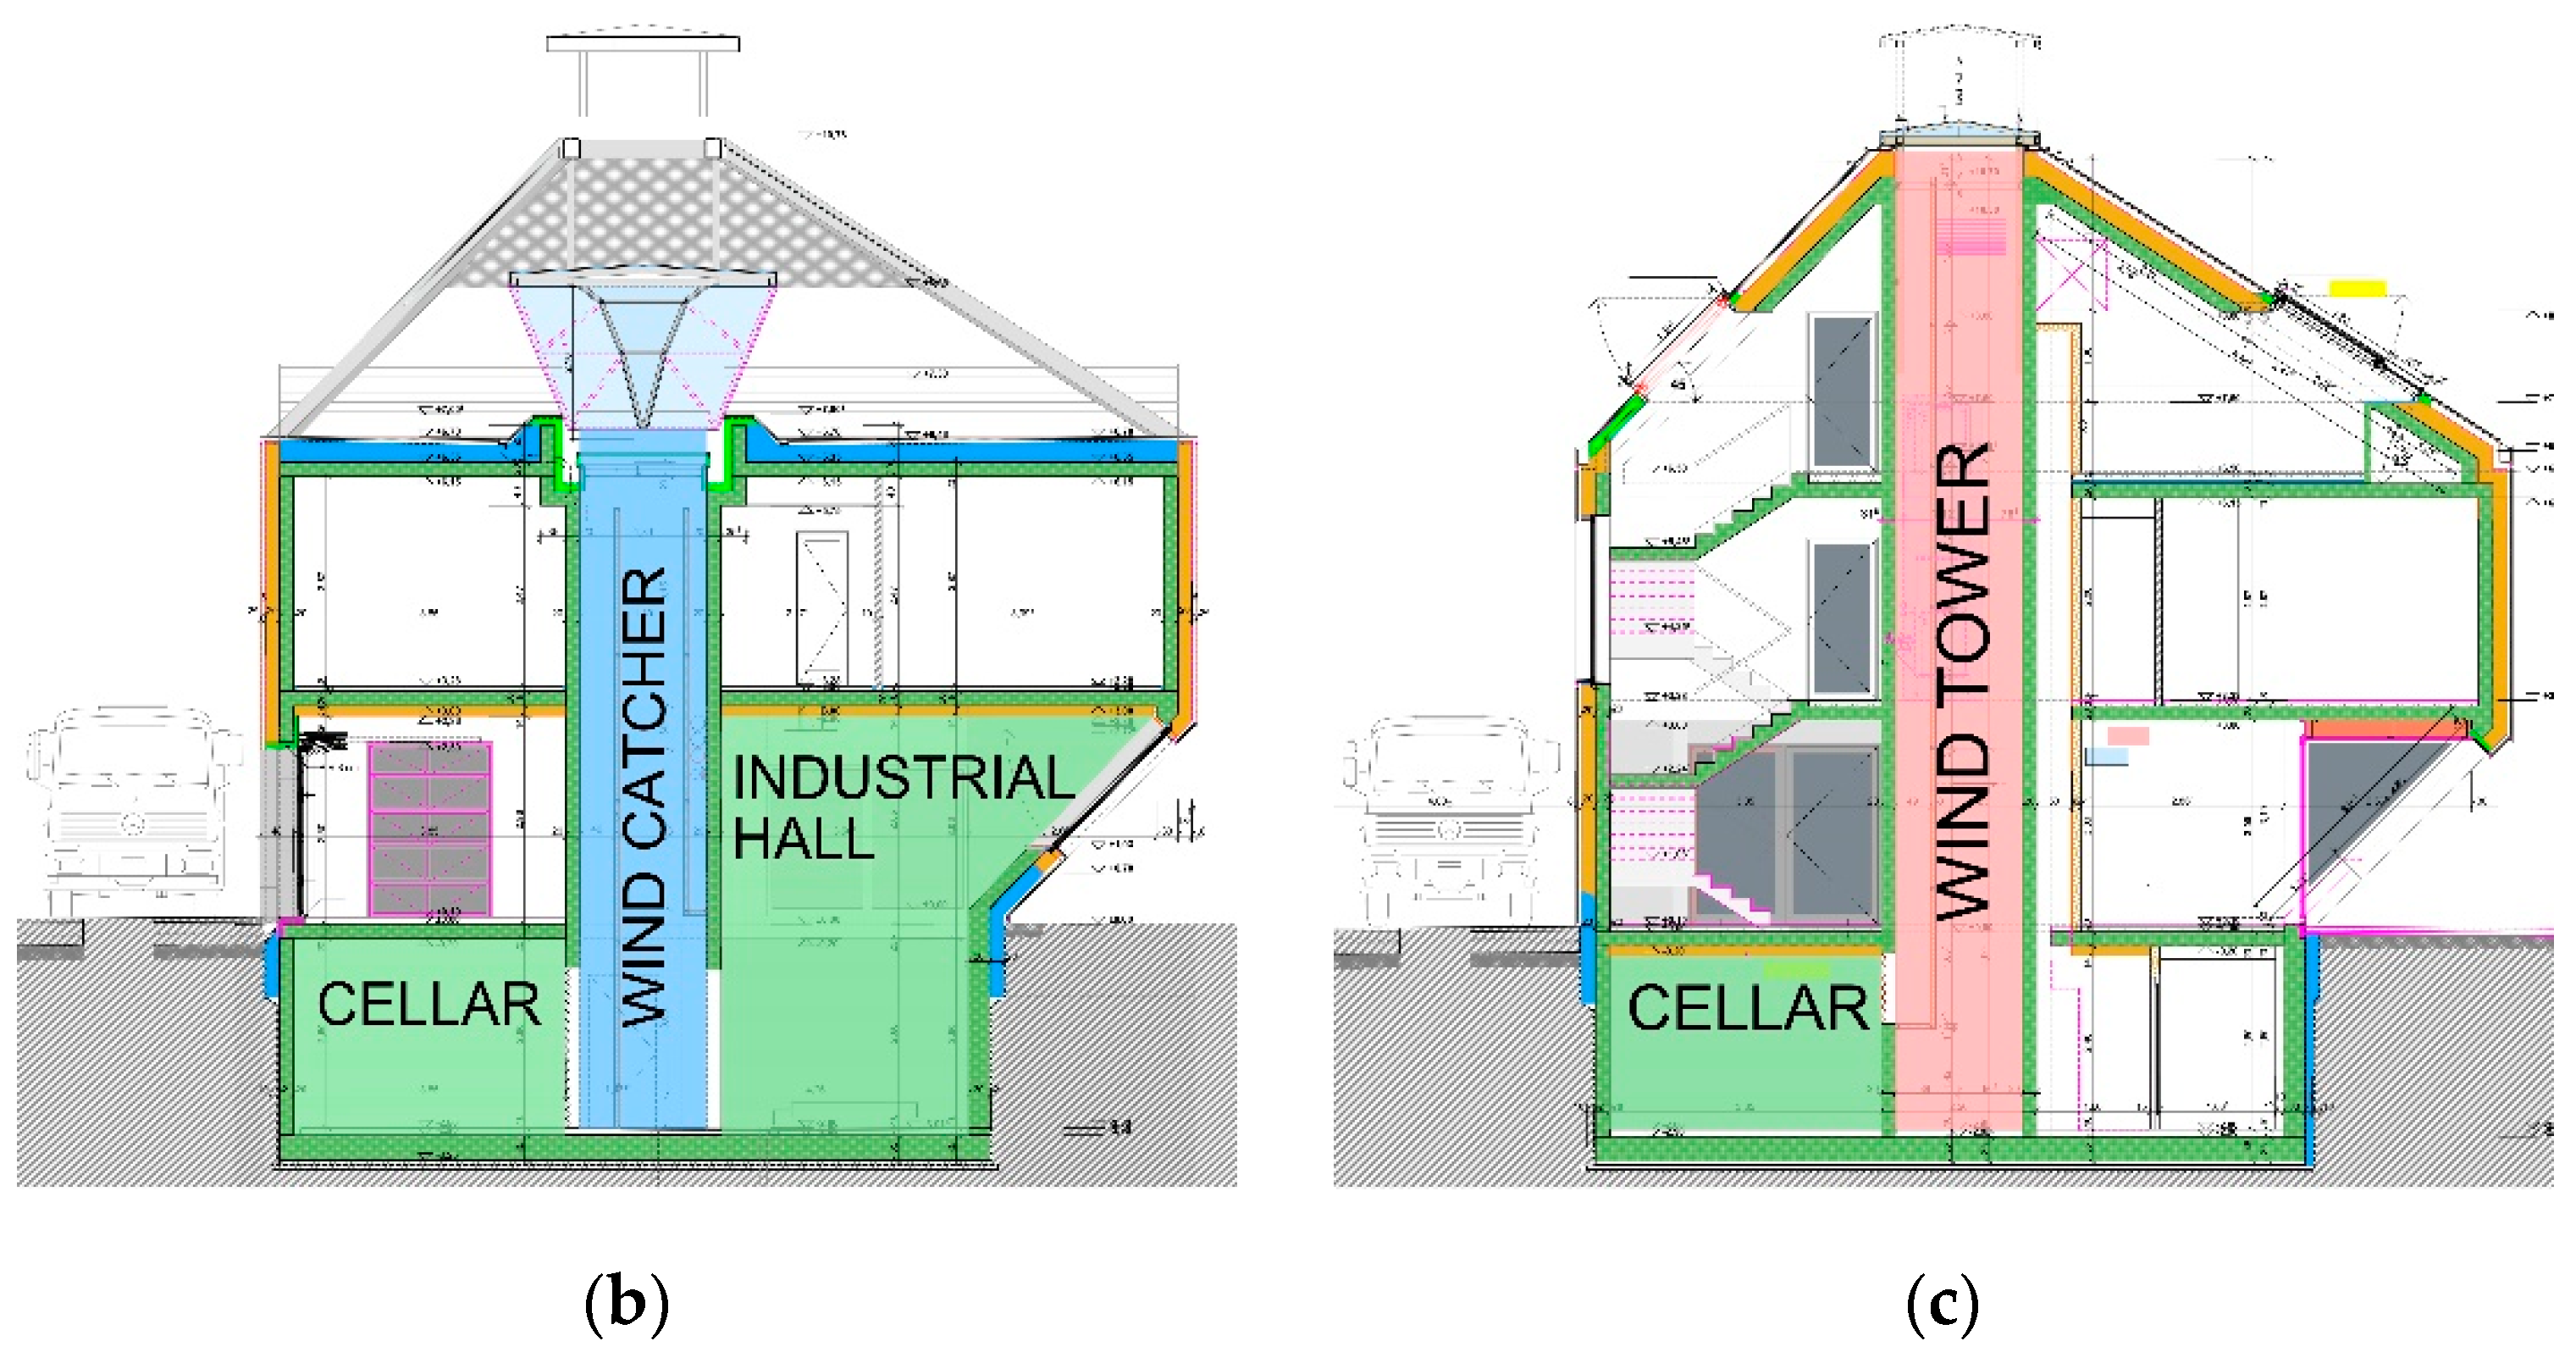
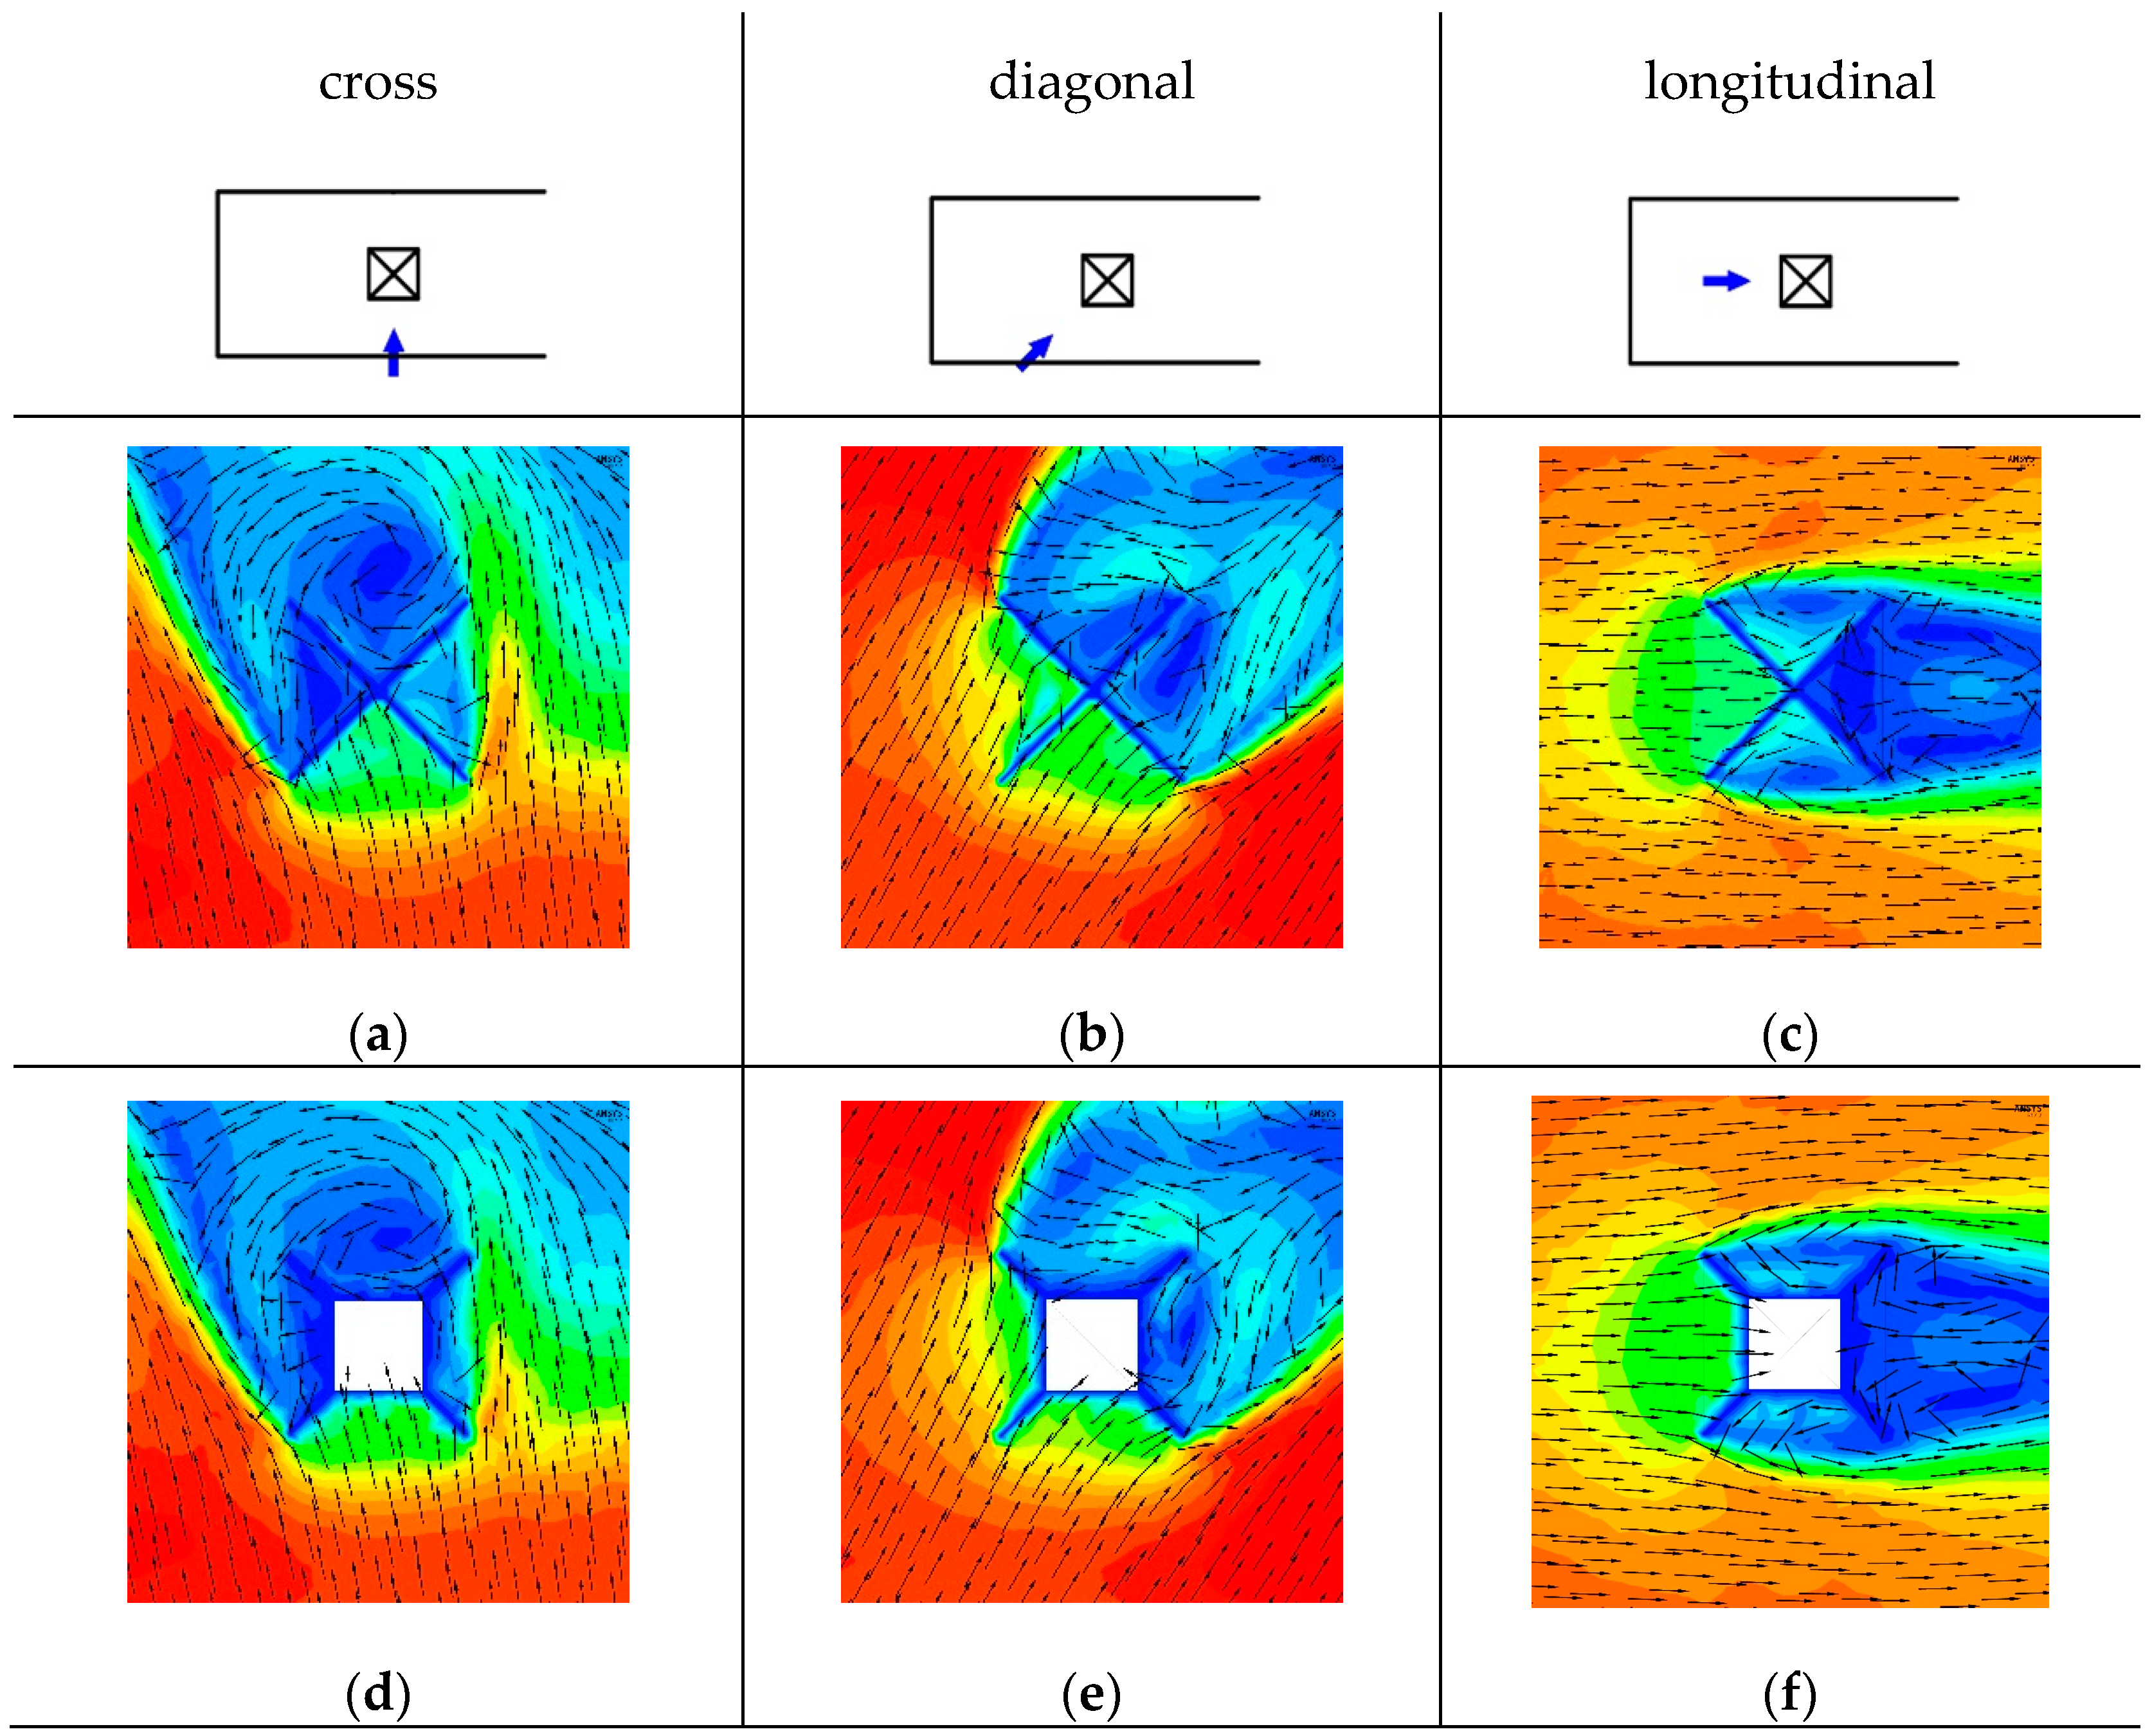
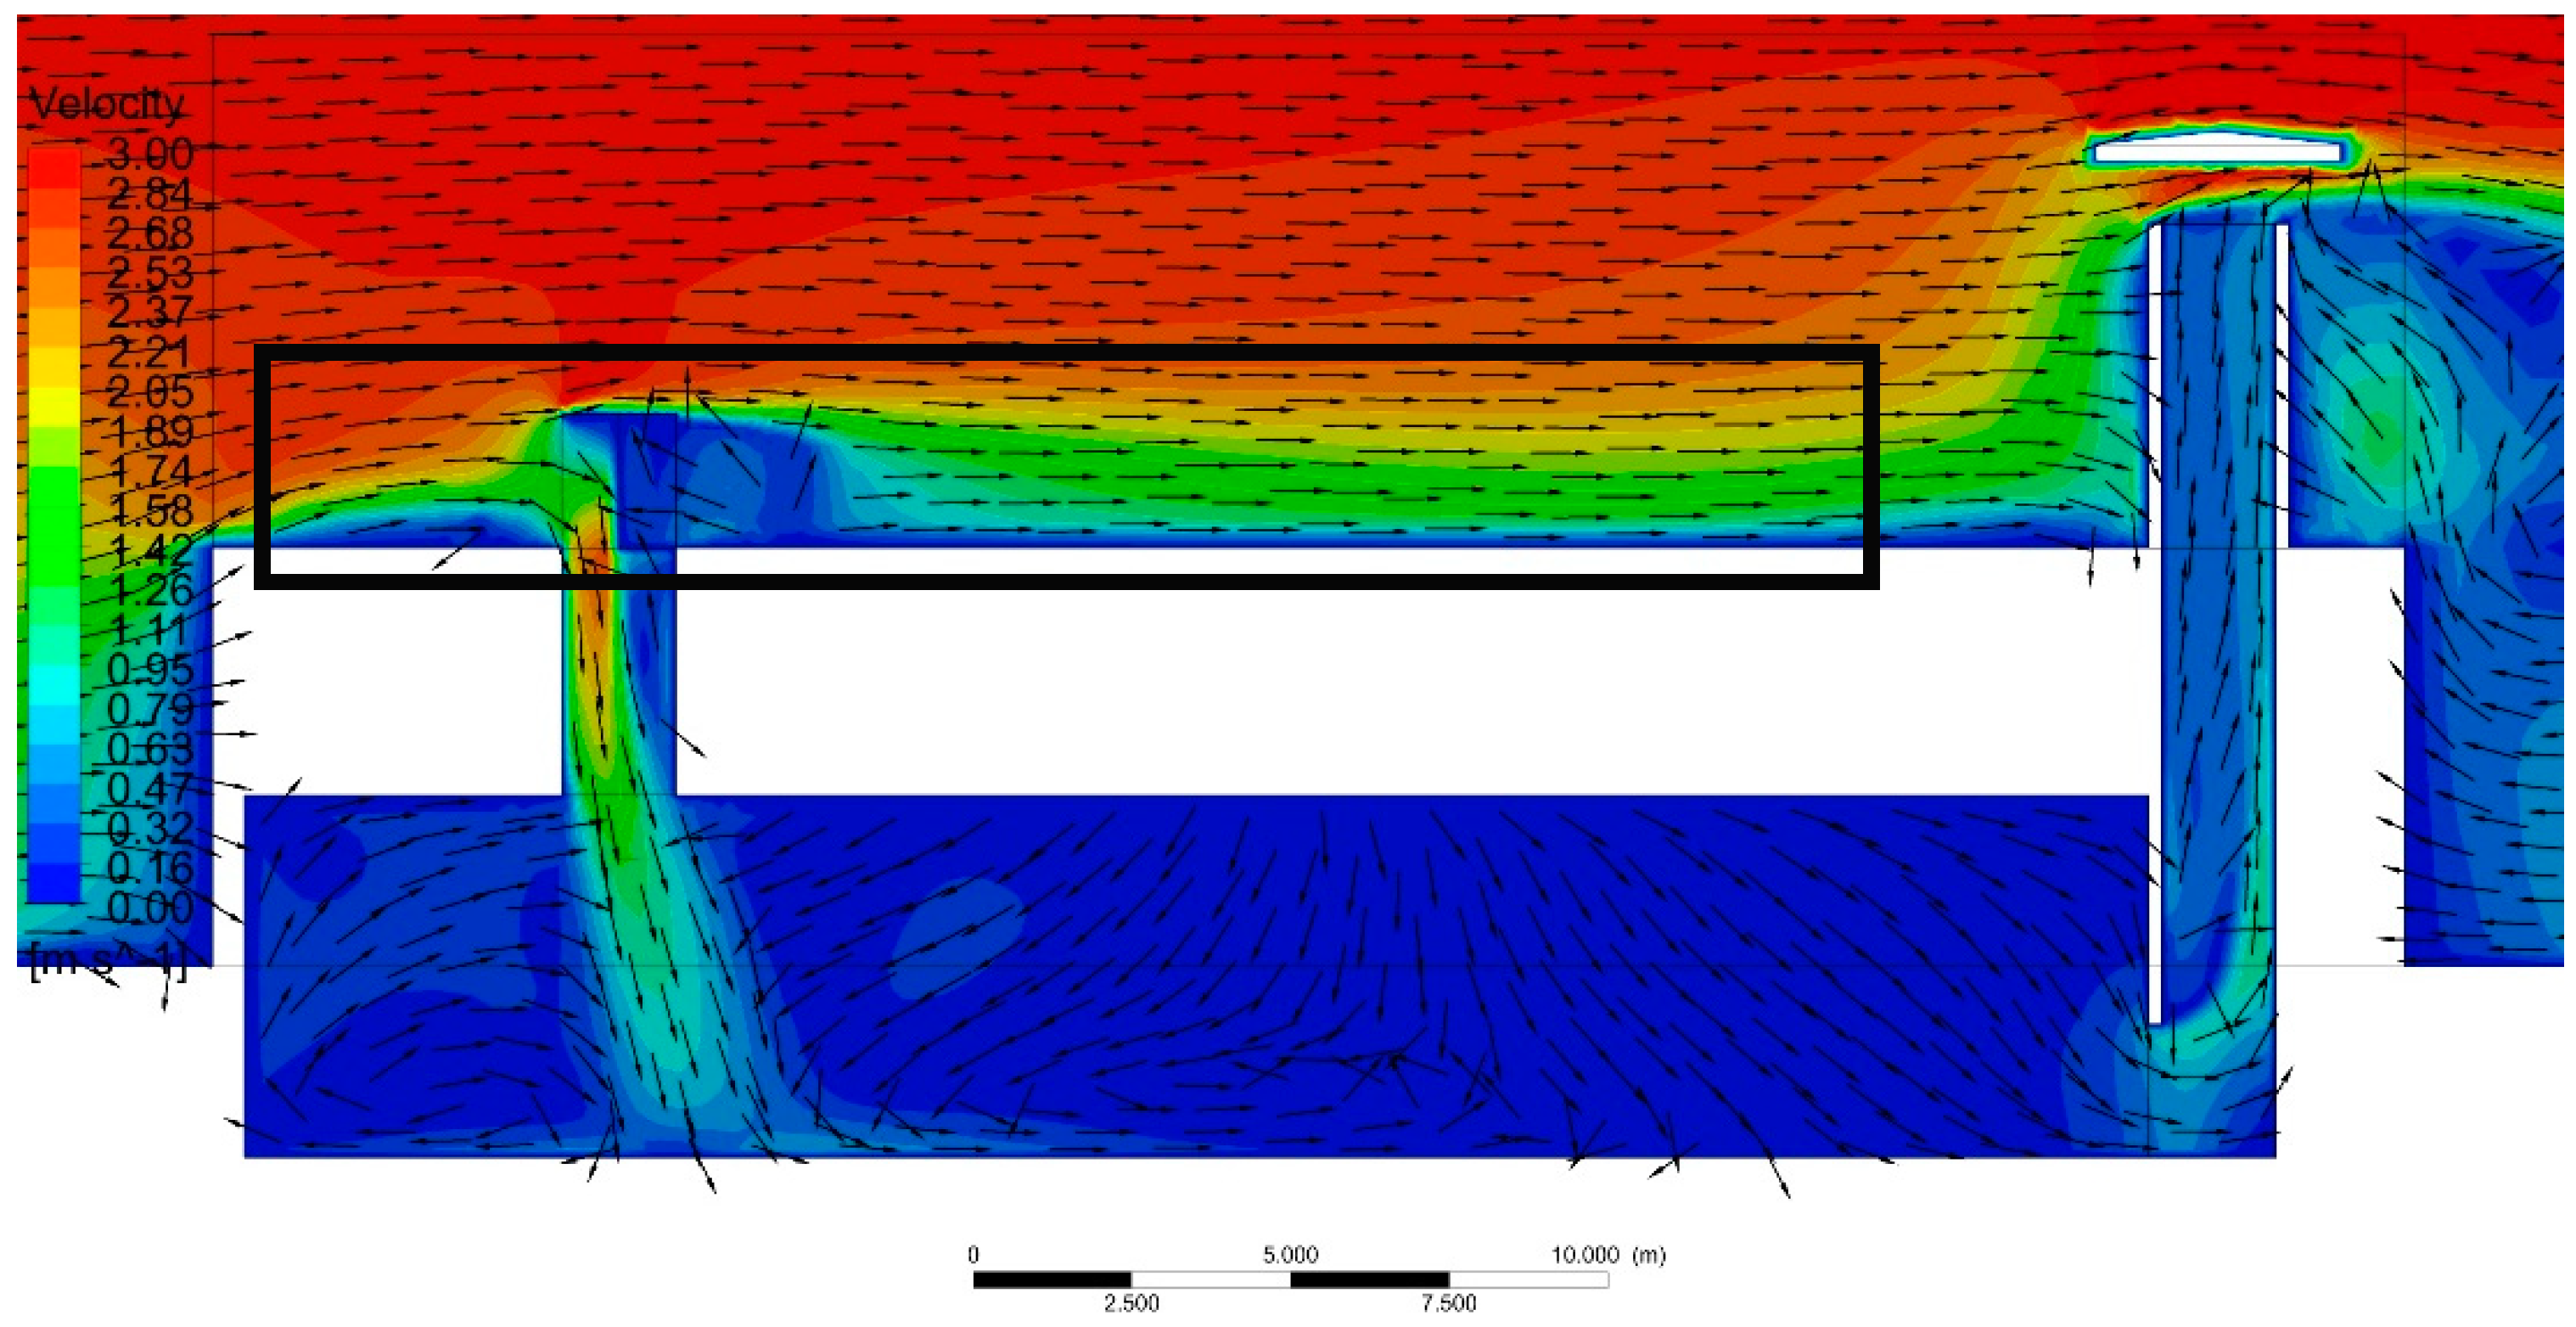
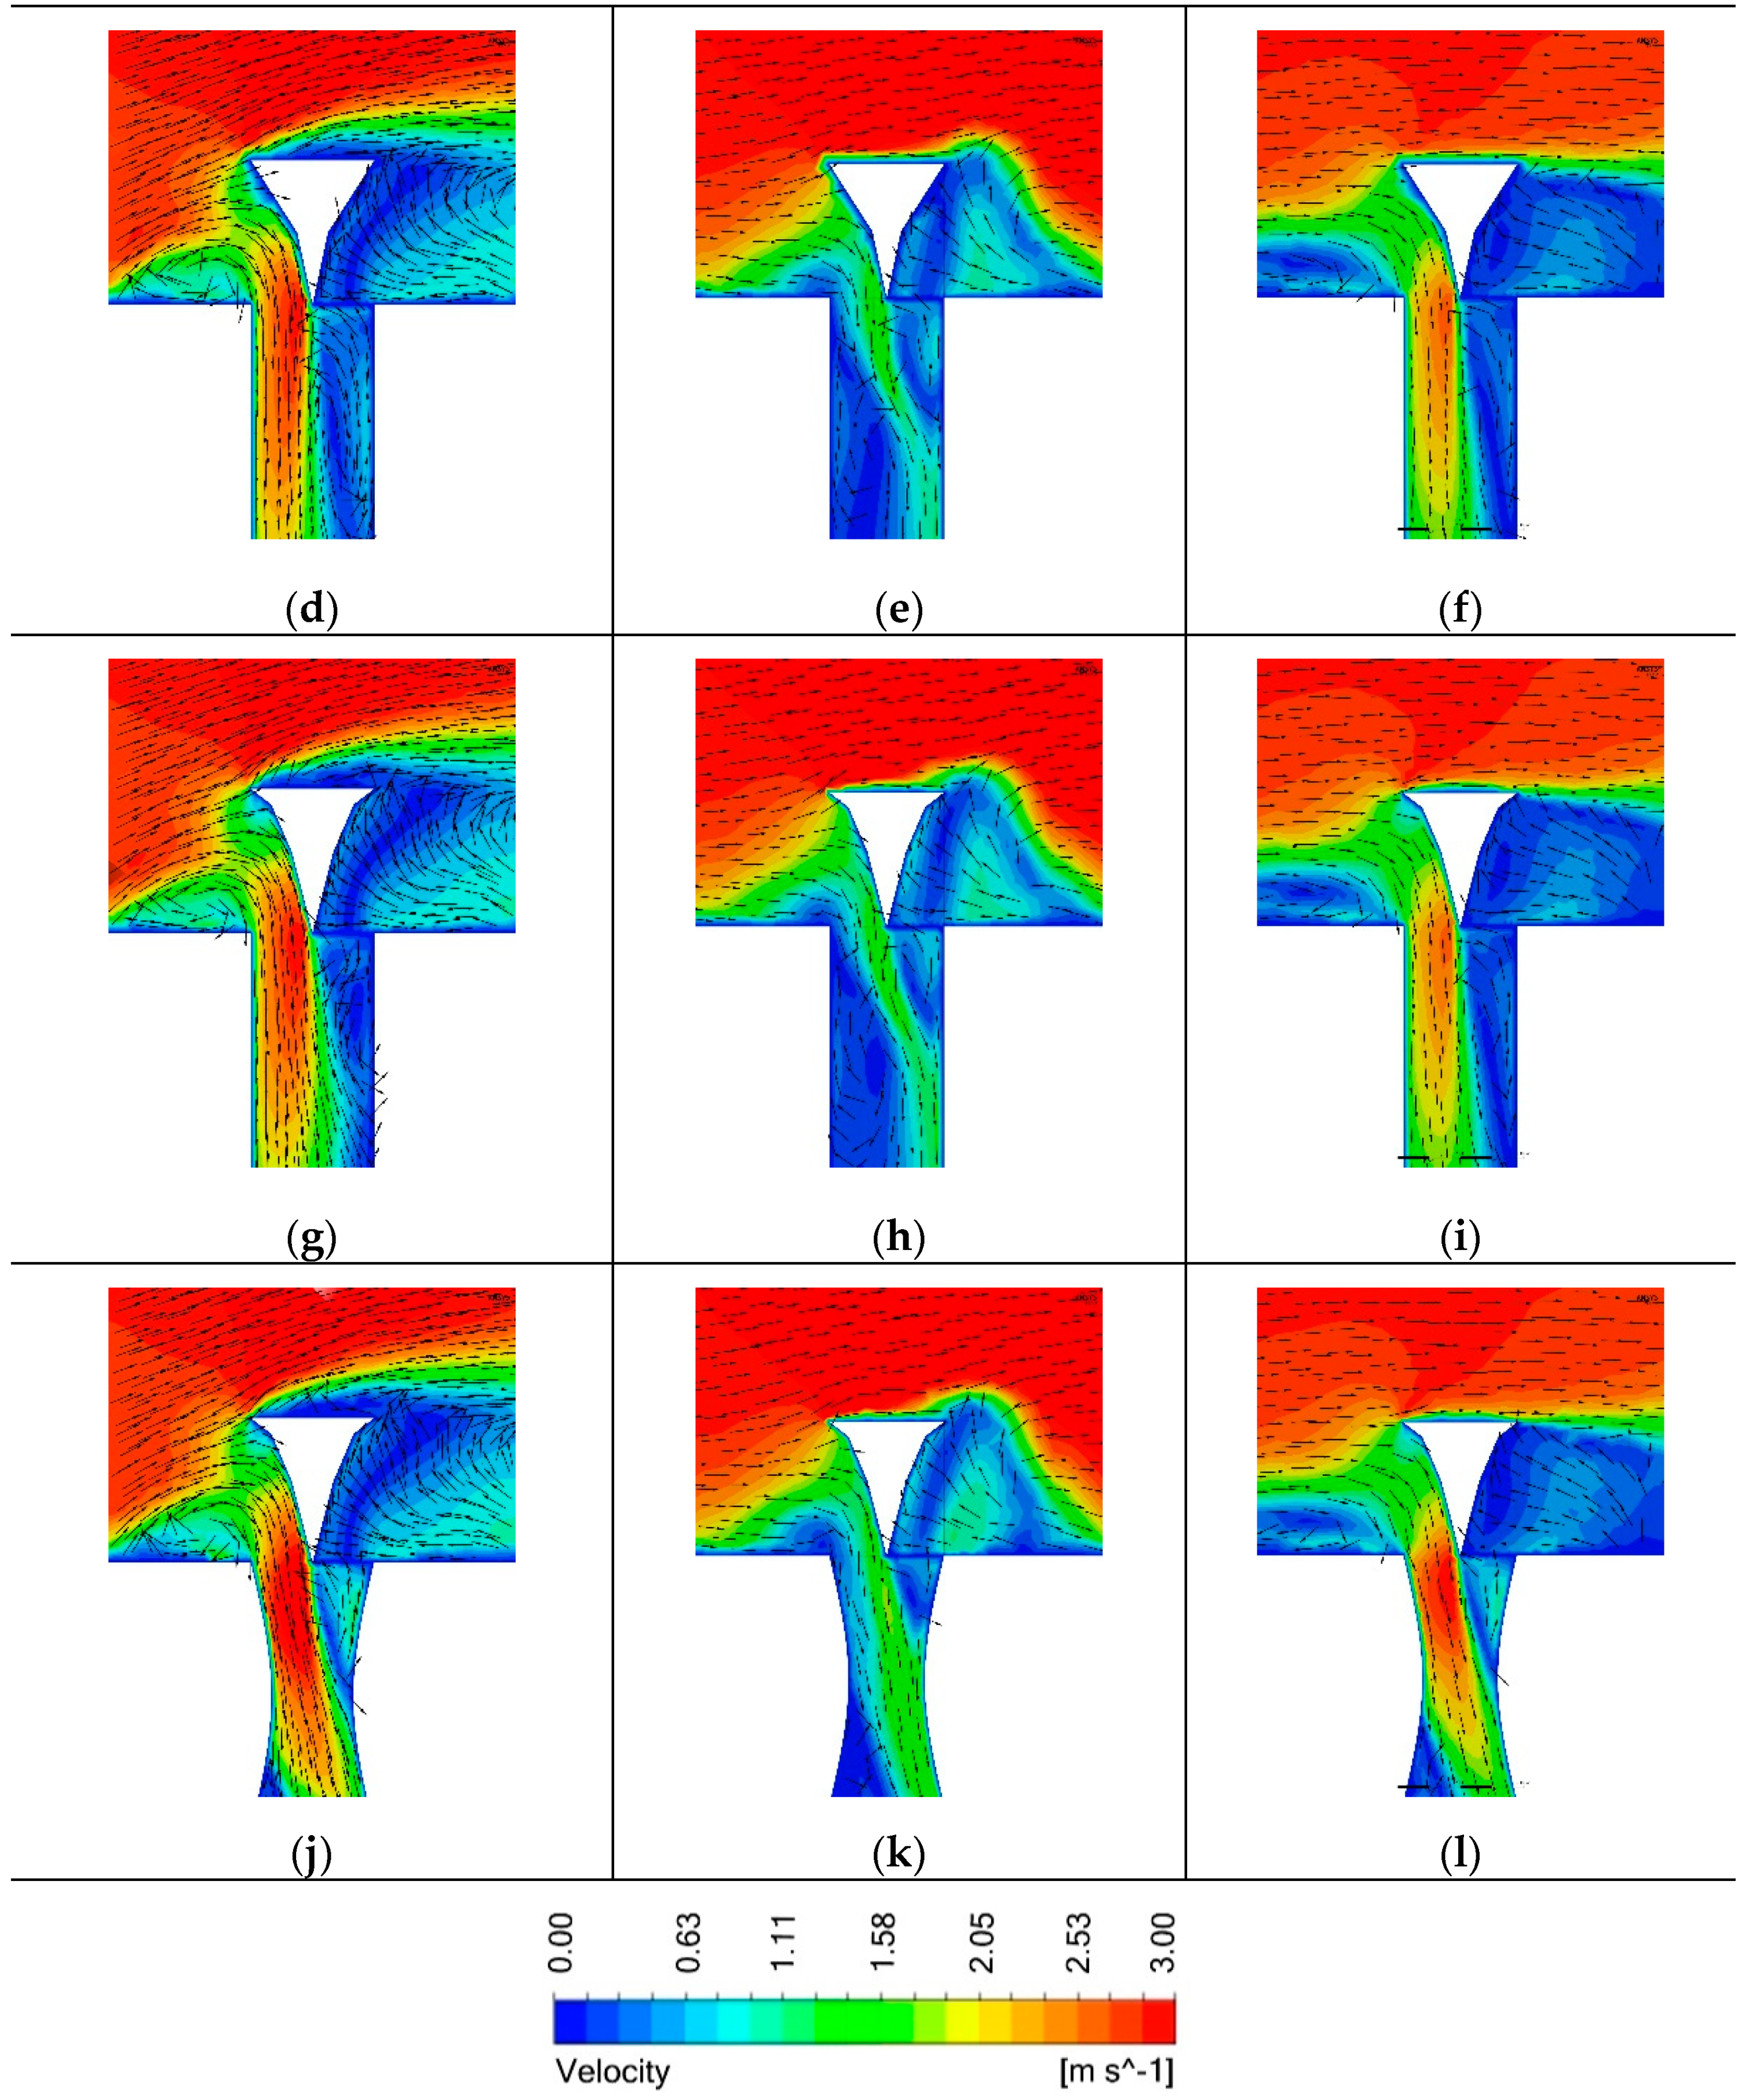
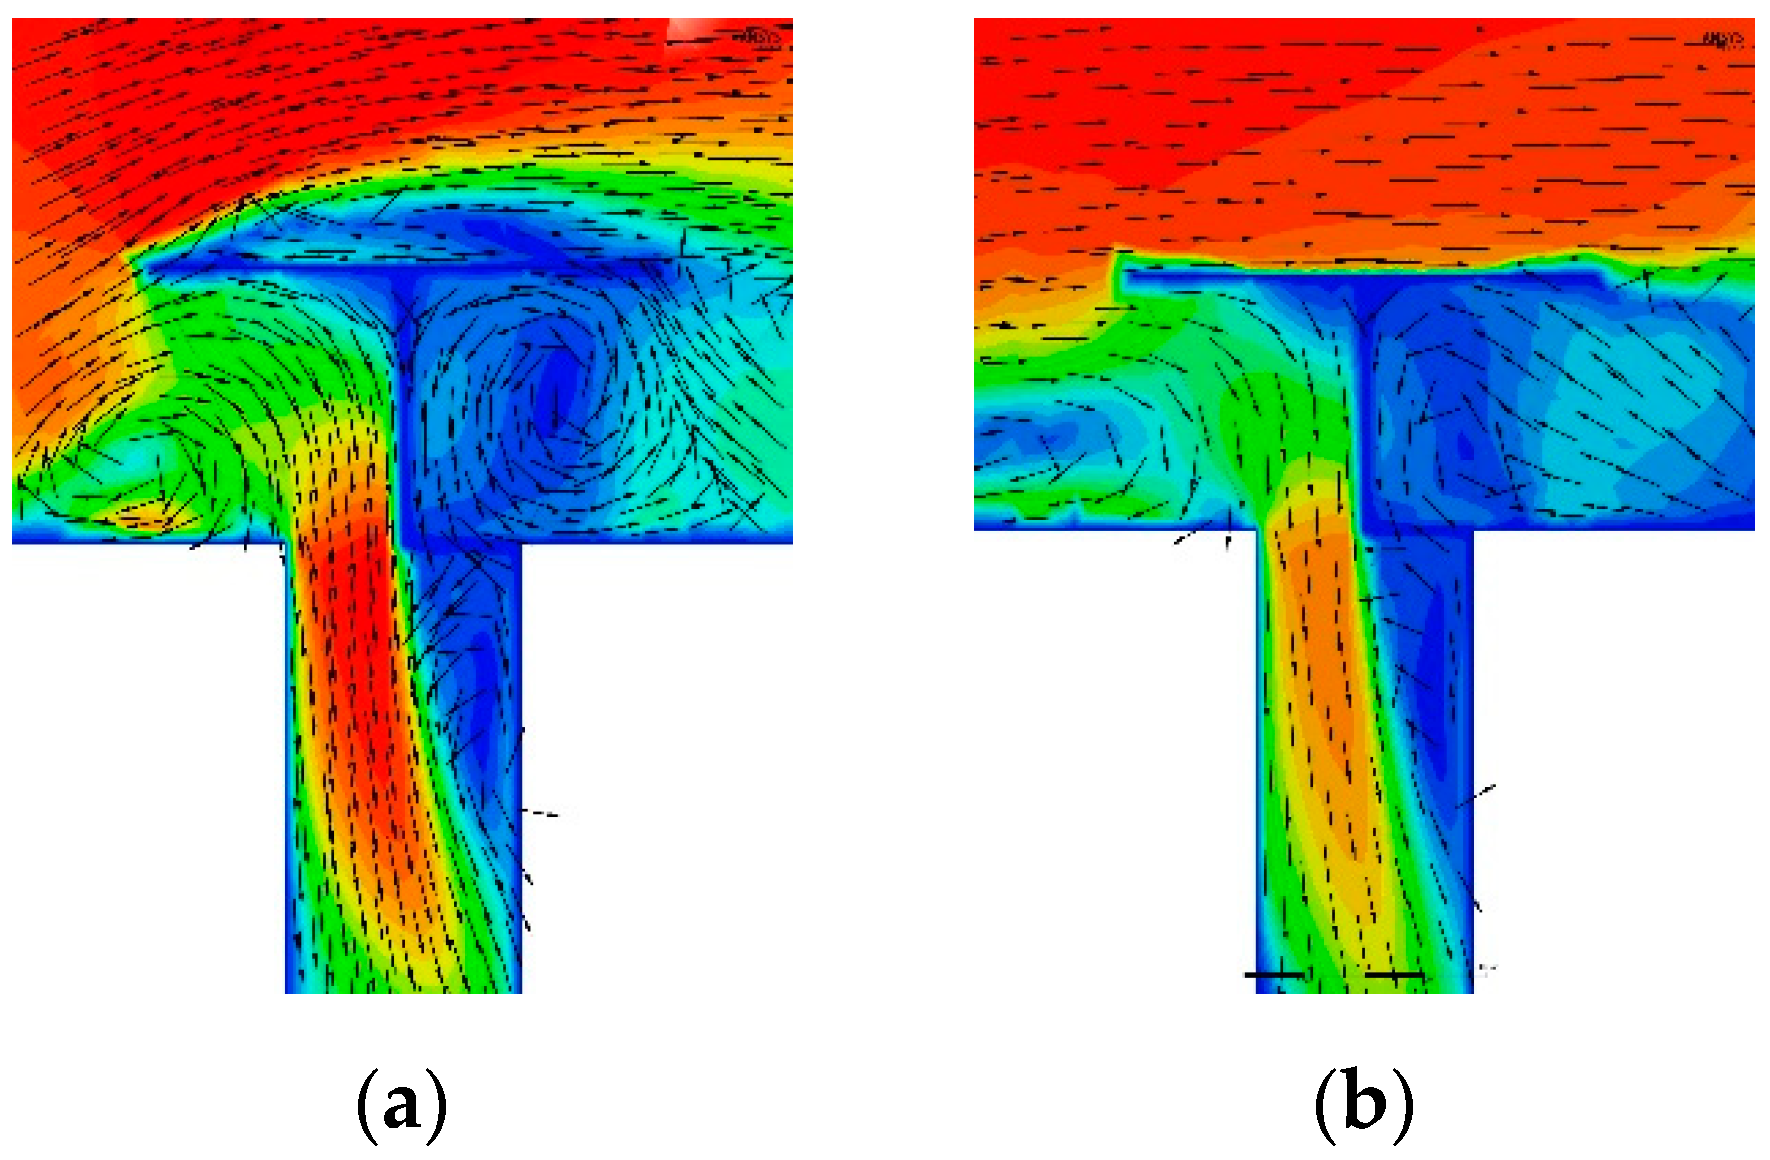
- The shape and size of the building body around the wind catcher can highly influence the flow field around the wind catcher and its air capturing performance. If the in- and outlet structures of the PACS are aligned in line with each other, the cross directed wind—unaffected from the building body—can enter with highest efficiency into the wind catcher structures’ inlet. In the longitudinal direction, the roof surface behind the wind catcher generates frictional losses and notably lower velocities at the exhaust tower’s outlet, and hence there is a decrease of the vent performance. Therefore, weaker ventilation is present under such circumstances in every construction situation. This lower vent performance can, however, still provide appropriate or even higher vent rates (in one particular study an ACH of 7.5 h−1 was provided, an 846% greater performance as required in EN 15215 [51].
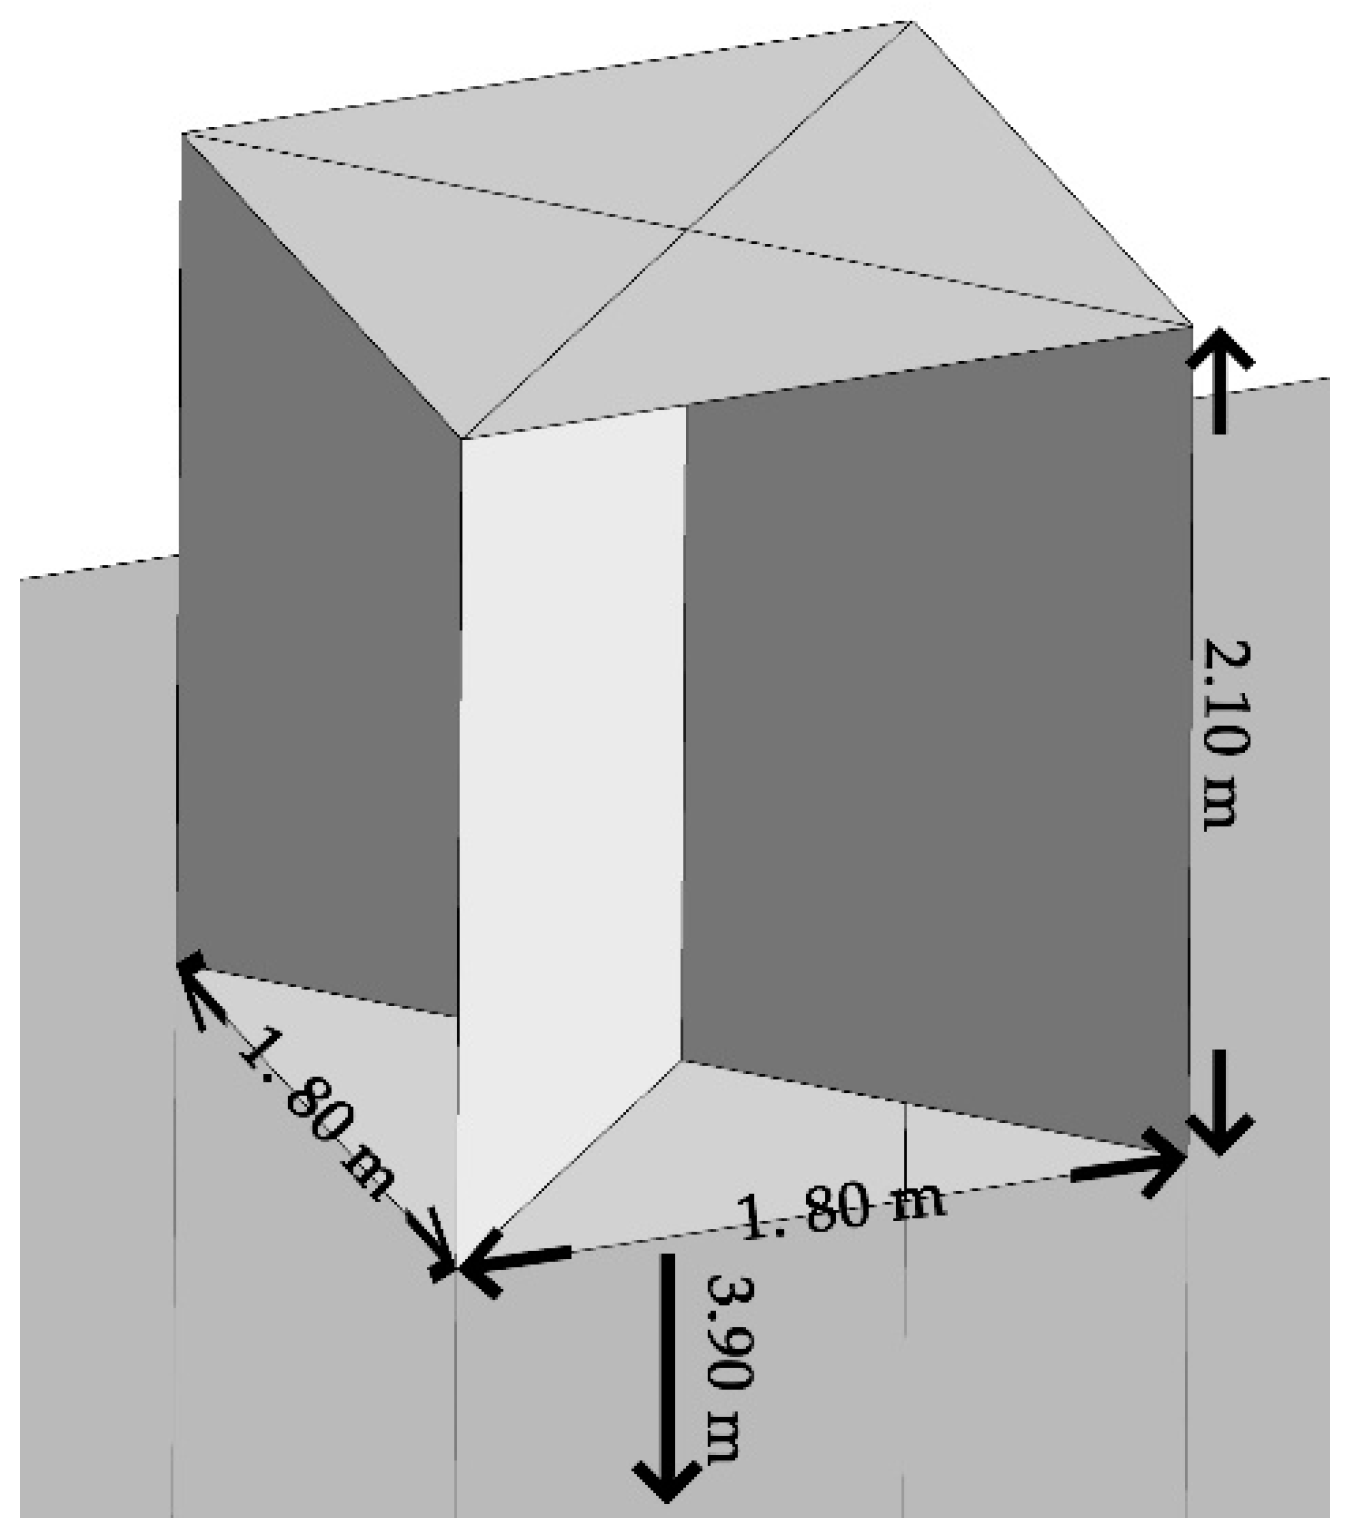
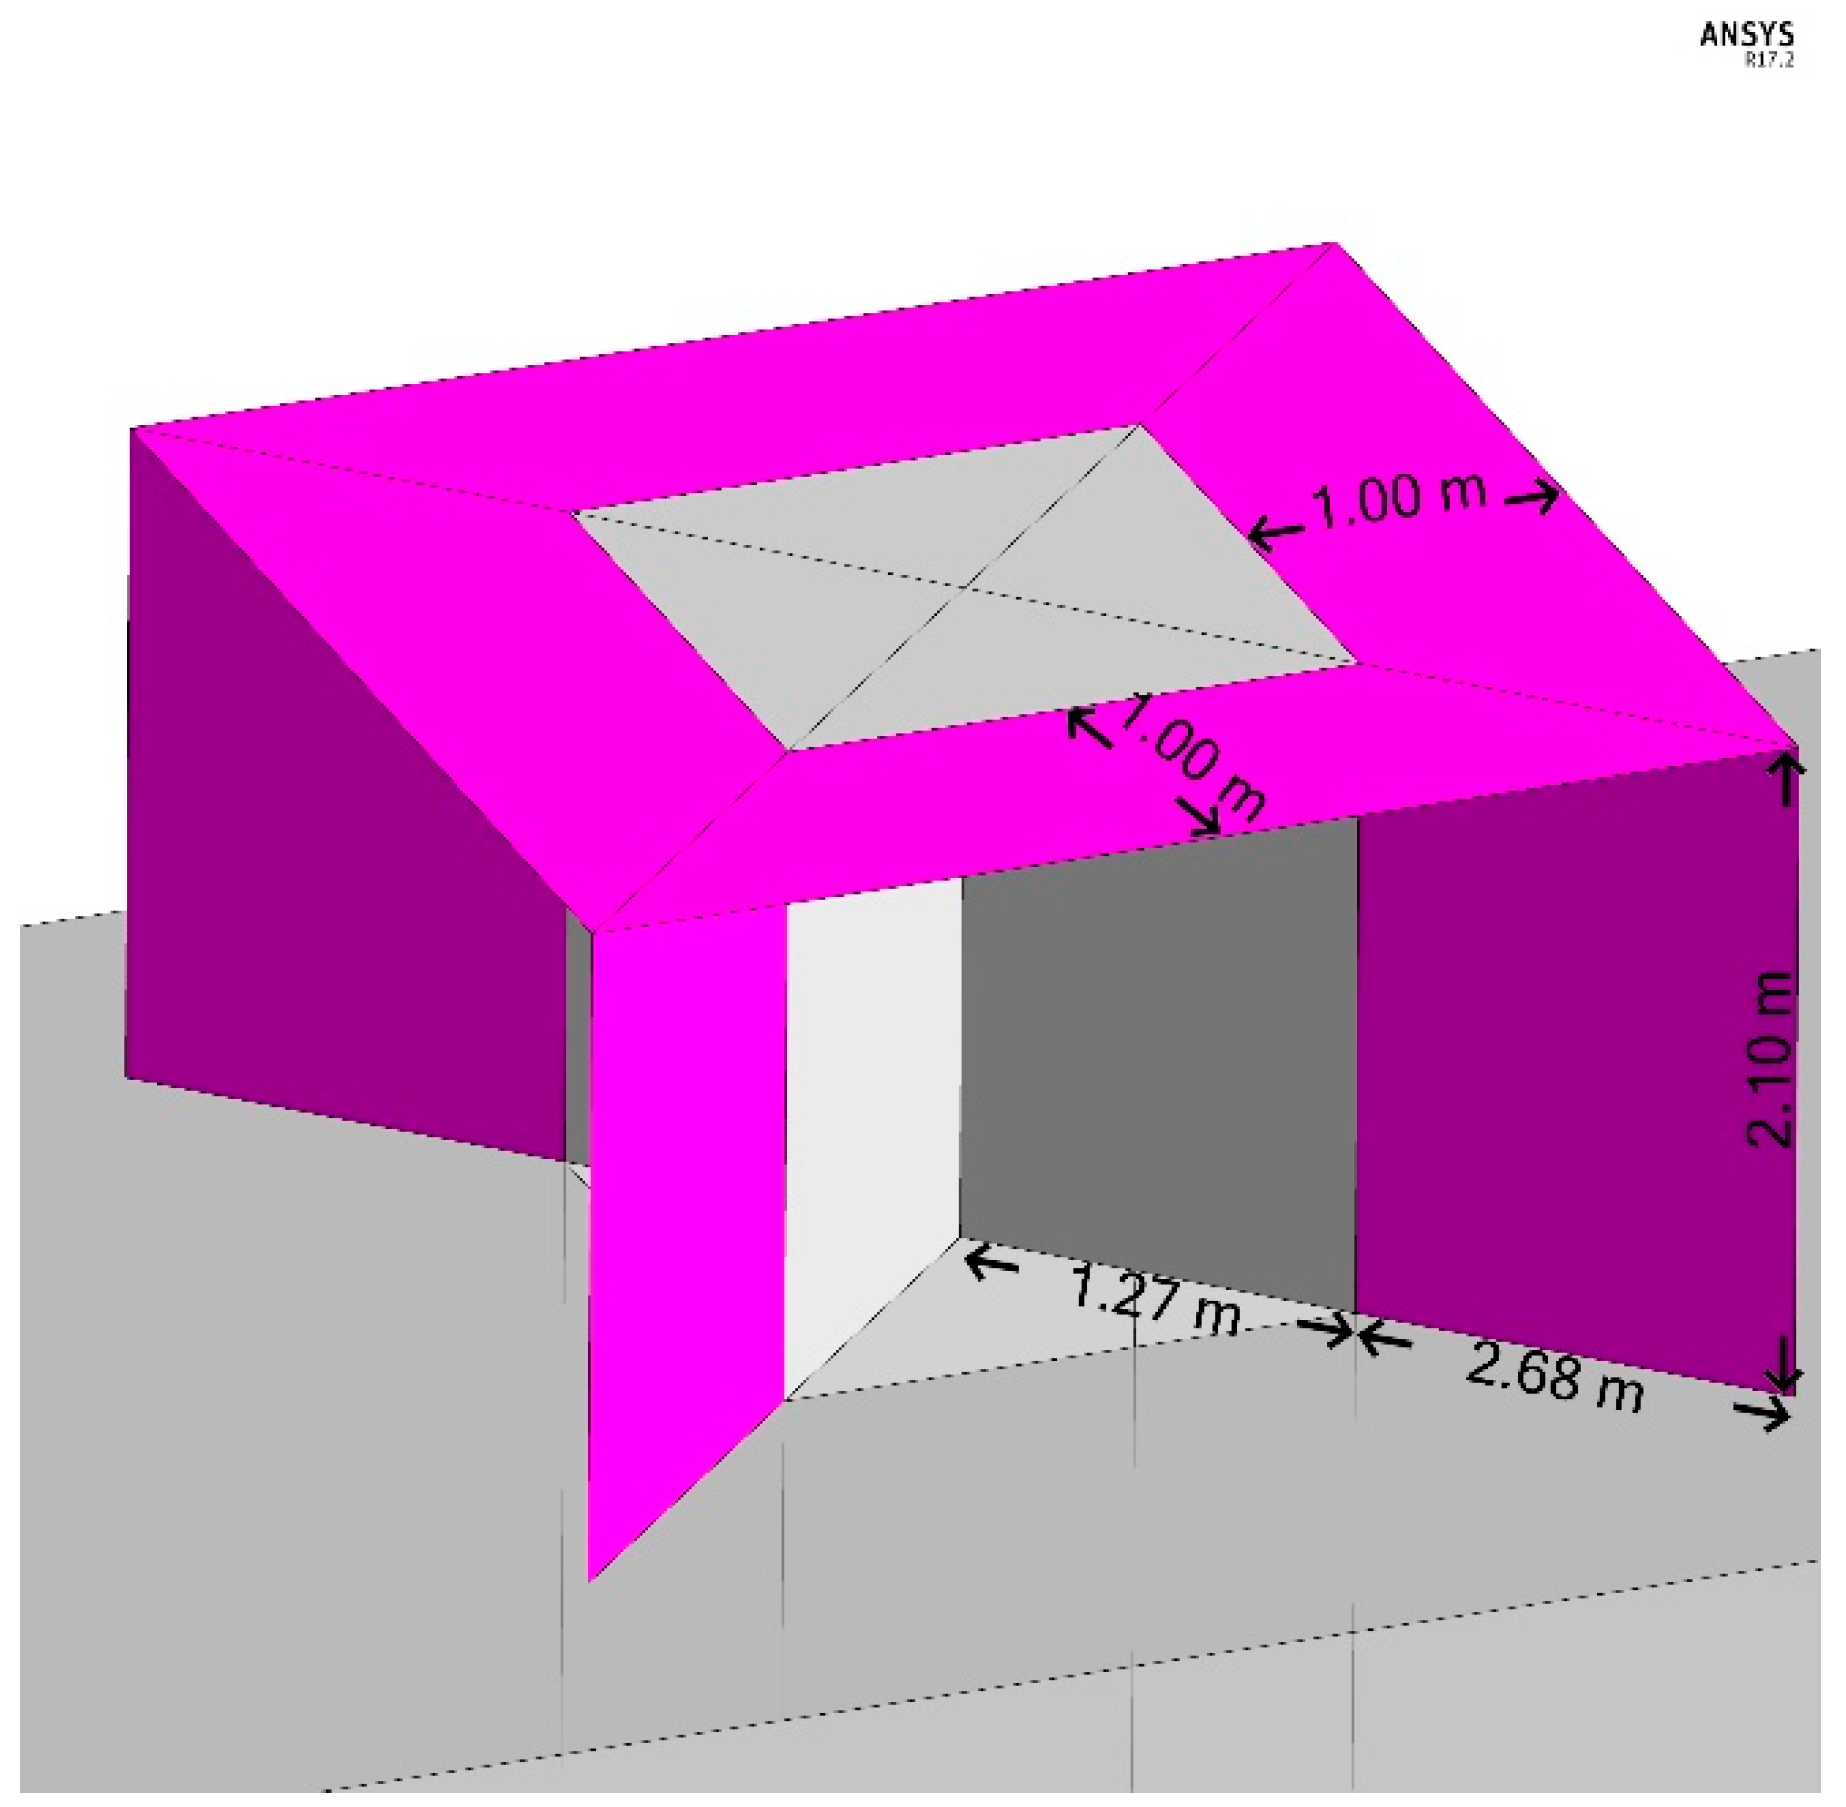
- The developed small-sized wind catchers (smaller than generic, traditional wind catchers [11,13,49]) possess a floor area-related PACS ratio of 2.43% and a volumetric PACS ratio of 5.55%. This cross section represents a small-scale inlet structure solution, in contrast to a previous measured real-world project [34] with a floor area-related PACS ratio of 10% and a volumetric PACS ratio of 30%. A future classification of the diverse historical and contemporary PACSs could rationalize design and development of such ventilation systems.
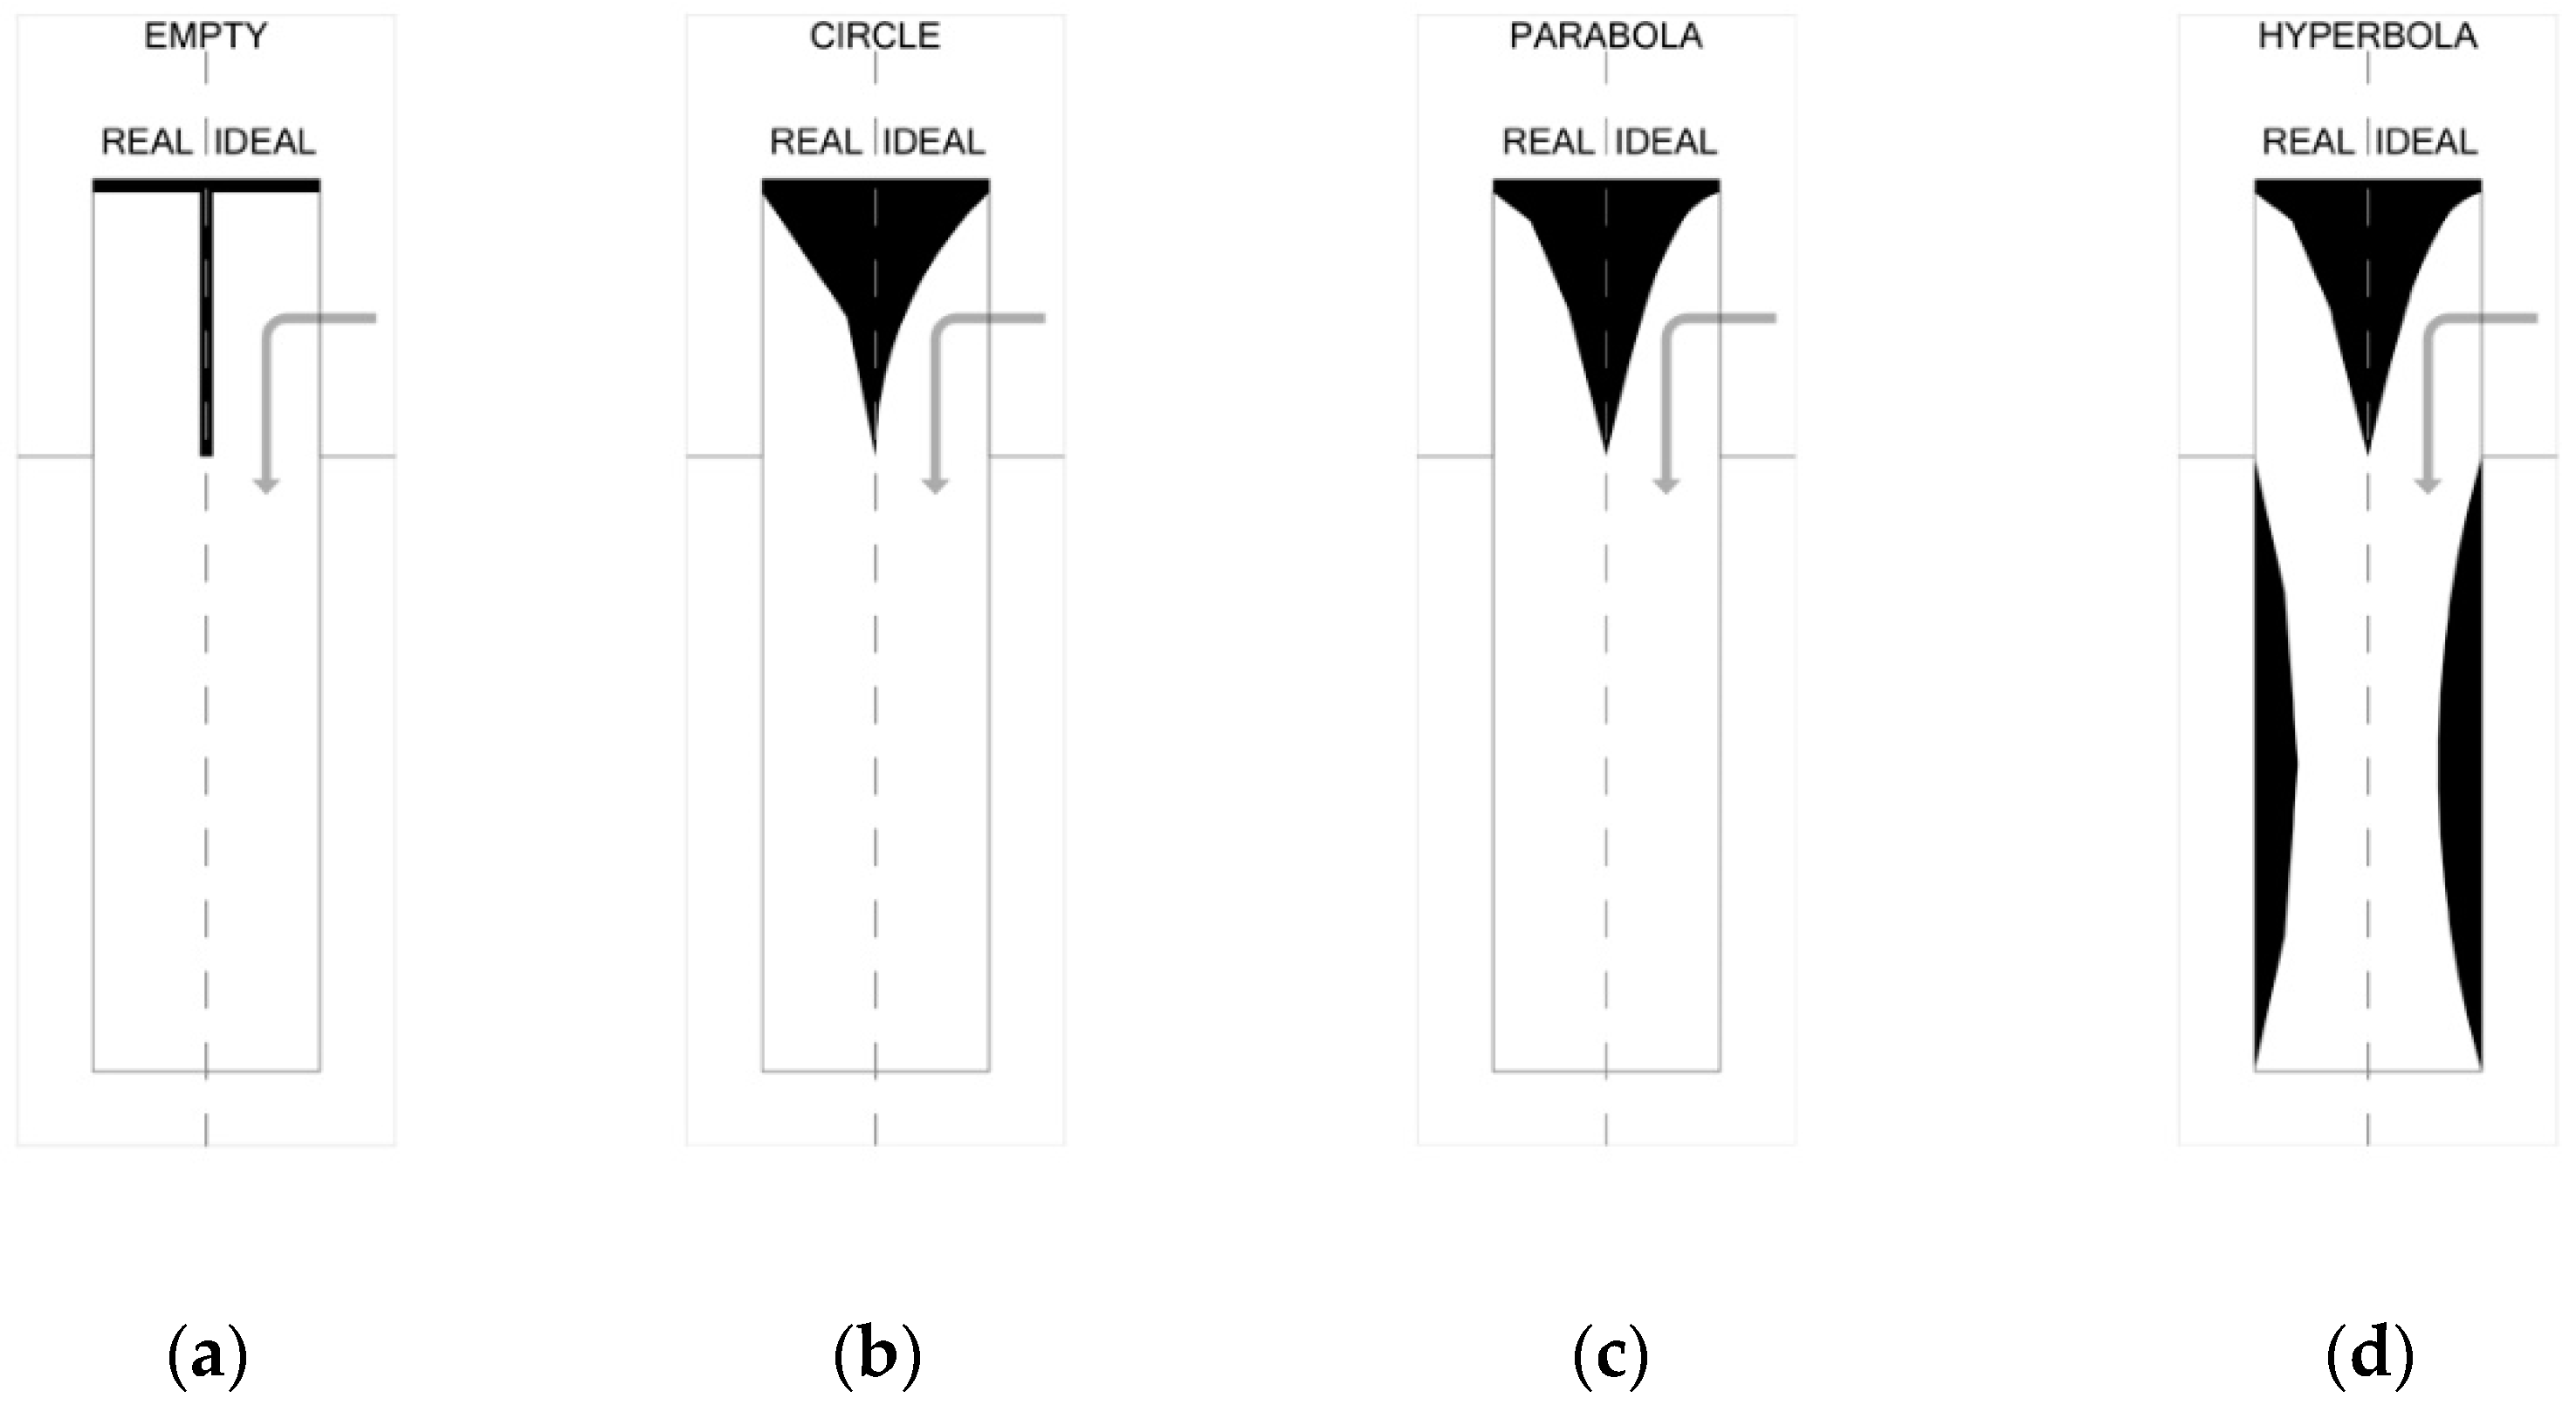
- The topology development confirms that small-scale wind catchers are less responsive to different shape changes regarding their role in the ACH rate distribution of the PACS. The very similar ventilation air flow values (7.50 h−1 ACH) of most shapes (three basic geometries) in this study supplement the Pearlmutter et al. [46] outcome: while ventilation efficiency rates show similar differences between different inlet geometries, by downscaling the cross section of an inlet chimney, the wind catcher’s ventilation performance becomes less sensible to different geometry types in contrast to larger chimney cross sections.
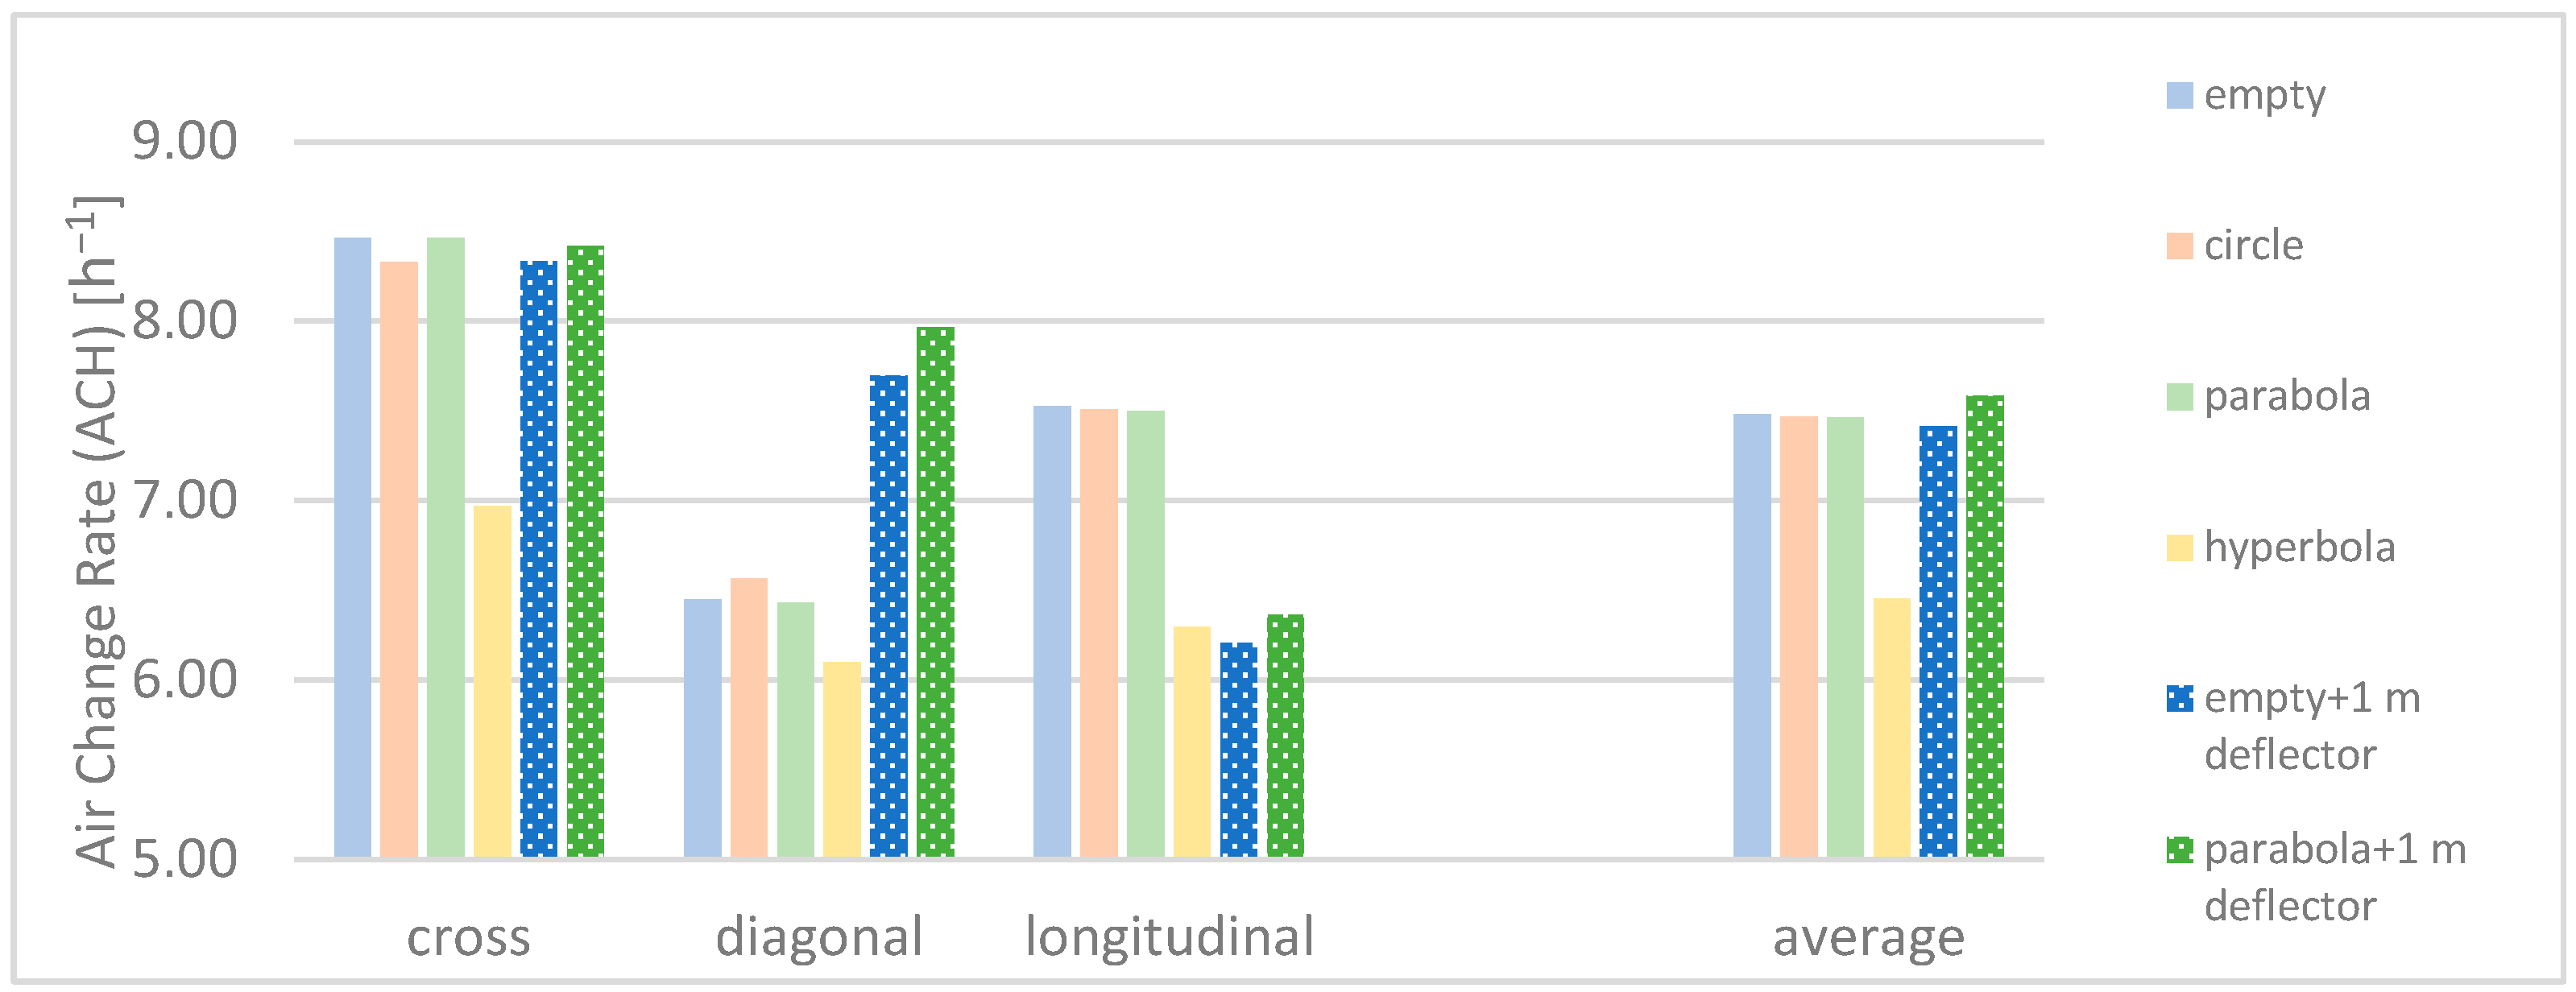
- A V-shaped layout of vertical deflector walls positively influence the air-capturing ability of a wind catcher’s inlet structure facing the approaching wind direction (in one particular study, the cross direction). If the incident angle of the coming wind flow to the deflector surfaces increases, the ventilation rate decreases (particularly with 2 h−1 ACH) due to unwanted impinging turbulences.
- A wind direction independent, roof-integrated ventilation inlet structure is developed for a DD PACS. Through significant upsizing, the wind catchers’ deflector walls (in this study by 211%) by simultaneously keeping the same inlet opening dimensions, improvements in ventilation rate occur when the wind incident angle to the deflector surfaces are high, i.e., in this study a significant increase of ACH is only in certain wind directions (almost 100% vent increase in the diagonal direction). If the capturing surfaces are in a lower incident angle with the coming wind, counterproductive turbulences enforce reduced ACH performance. In order to gain improvements in all directions, the enlarged deflectors’ lower part should be trimmed back to the initial inlet opening edge. In this way, significant improvement could be achieved in all wind directions (in this study, a mean increase of approx. 1 ACH is achieved).
- Even with enlarged and optimized capturing deflector walls, the shape independent vent behavior of wind catcher versions remains. The ‘parabola + 1 m’ version had only a slightly better mean performance than the ‘empty + 1 m’ wind catcher versions (2.1%), but the small improvement cannot possibly compensate the difficulty of the more complicated construction.
- Even if dimensions of a wind catcher are specified by general experiences, and those should positively influence the performance, sometimes unexpected behavior can occur, because aerodynamic systems react in a complex way to design changes. This is in accordance with the conclusions of Varela-Boydo et al. [30] and Zarmehr et al. [17]. To fundamentally understand the pressure difference-driven PACS, a wide and thorough knowledge is essential, where the parameters are investigated organically.
6. Outlook
Author Contributions
Funding
Data Availability Statement
Conflicts of Interest
Appendix A

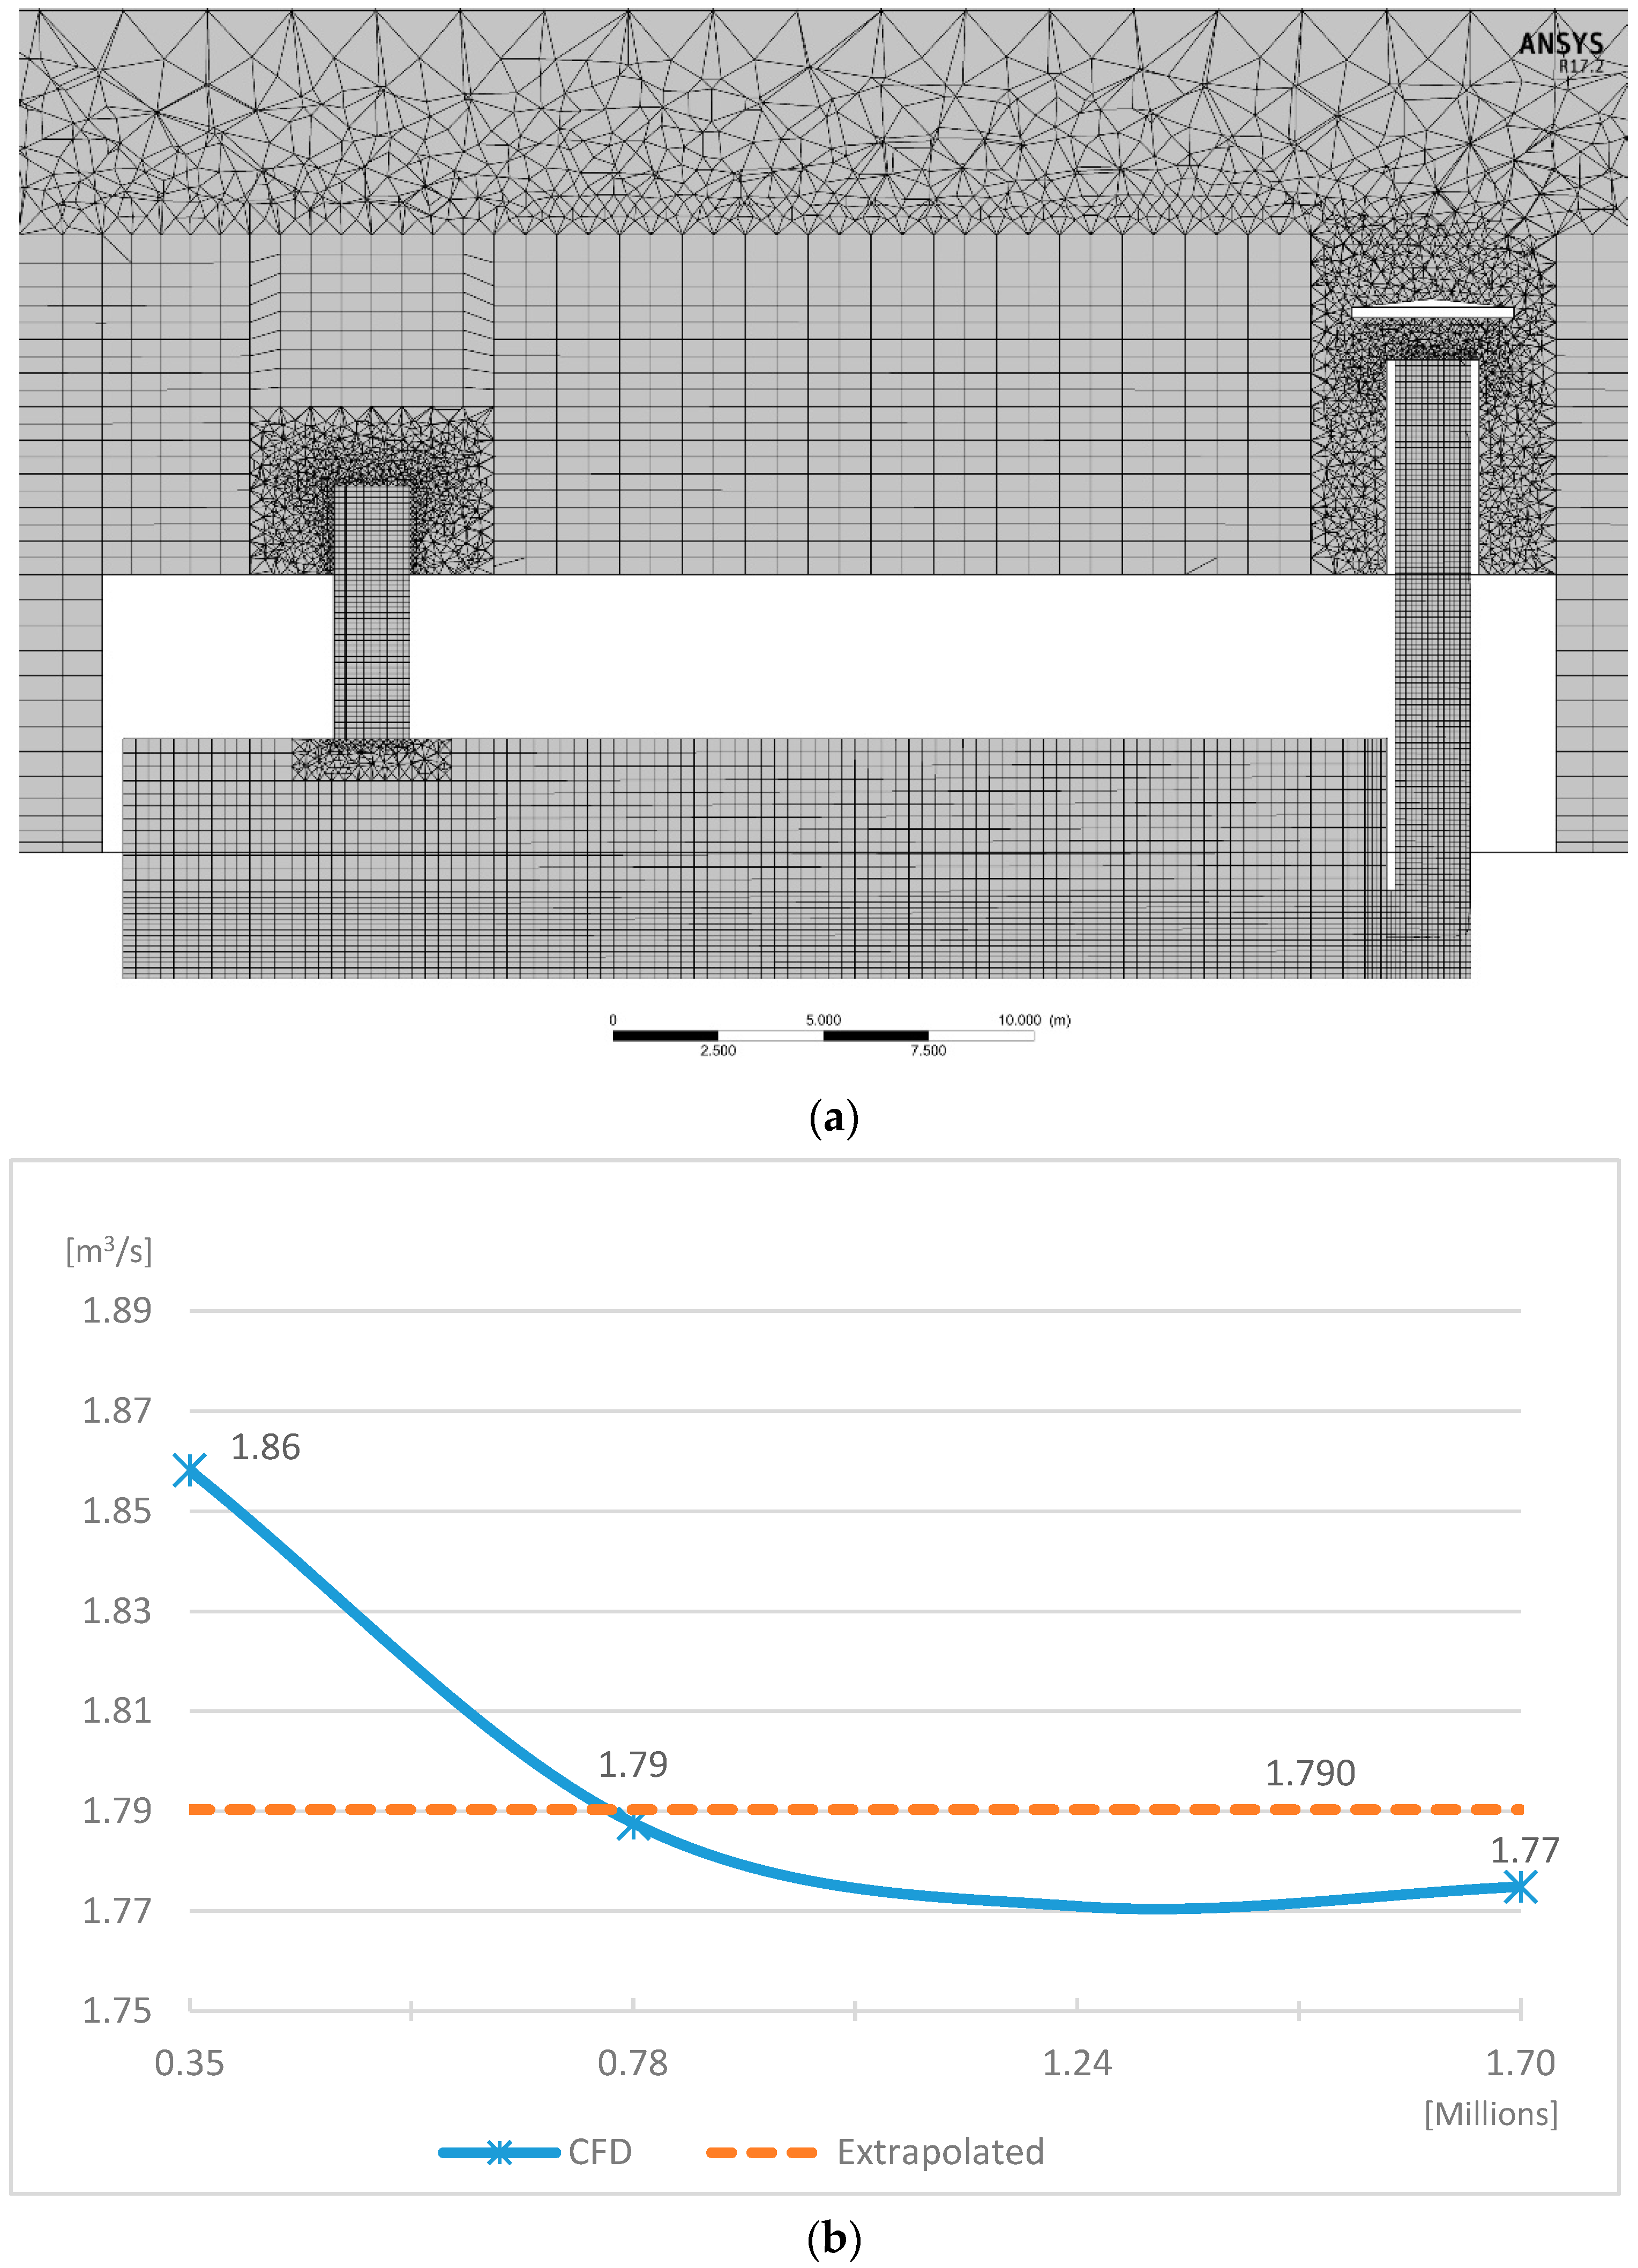
| Variable | Grid 3 (Coarse) | Grid 2 (Medium) | Grid 1 (Fine) | |
|---|---|---|---|---|
| N—number of elements | 353,622 | 776,196 | 1,696,657 | |
| V—volume of the mesh [m3] | 847,027 | 847,027 | 847,027 | |
| —volume flow rate [m3/s] | 1.86 | 1.79 | 1.78 | |
| h—representative cell size [m] | 1.338 | 1.030 | 0.793 | |
| Grid 3 Related to Grid 2 | Grid 2 Related to Grid 1 | |||
| r—refinement factor | 1.3 | |||
| p—apparent order | 6.58 | |||
| —extrapolated value | 1.79 | |||
| —approximate relative error | 3.80% | 0.71% | ||
| —extrapolated relative error | 0.83% | 0.16% | ||
| —fine grid convergence index | 1.04% | 0.19% | ||
References
- Gillett, N.P.; Kirchmeier-Young, M.; Ribes, A.; Shiogama, H.; Hegerl, G.C.; Knutti, R.; Gastineau, G.; John, J.G.; Li, L.; Nazarenko, L.; et al. Constraining human contributions to observed warming since the pre-industrial period. Nat. Clim. Chang. 2021, 11, 207–212. [Google Scholar] [CrossRef]
- United Nations. Framework Convention on Climate Change. In Proceedings of the Conference of the Parties on Its Twenty-First Session, Paris, France, 30 November–13 December 2015. [Google Scholar]
- A Roadmap for Moving to a Competitive Low Carbon Economy in 2050; European Union: Brussels, Belgium, 2011; pp. 1–15.
- Akashi, O.; Hijioka, Y.; Masui, T.; Hanaoka, T.; Kainuma, M. GHG emission scenarios in Asia and the world: The key technologies for significant reduction. Energy Econ. 2012, 34, S346–S358. [Google Scholar] [CrossRef]
- Pérez-Lombard, L.; Ortiz, J.; Pout, C. A review on buildings energy consumption information. Energy Build. 2008, 40, 394–398. [Google Scholar] [CrossRef]
- Rahman, M.; Rasul, M.; Khan, M. Energy conservation measures in an institutional building in sub-tropical climate in Australia. Appl. Energy 2010, 87, 2994–3004. [Google Scholar] [CrossRef]
- Chen, Y.; Tong, Z.; Malkawi, A. Investigating natural ventilation potentials across the globe: Regional and climatic variations. Build. Environ. 2017, 122, 386–396. [Google Scholar] [CrossRef]
- Khan, N.; Su, Y.; Riffat, S.B. A review on wind driven ventilation techniques. Energy Build. 2008, 40, 1586–1604. [Google Scholar] [CrossRef]
- Chen, Q. Ventilation performance prediction for buildings: A method overview and recent applications. Build. Environ. 2009, 44, 848–858. [Google Scholar] [CrossRef]
- Bahadori, M.N. Passive Cooling Systems in Iranian Architecture. Sci. Am. 1978, 238, 144–154. [Google Scholar] [CrossRef]
- Hughes, B.R.; Calautit, J.K.; Ghani, S.A. The development of commercial wind towers for natural ventilation: A review. Appl. Energy 2012, 92, 606–627. [Google Scholar] [CrossRef]
- Jomehzadeh, F.; Nejat, P.; Calautit, J.K.; Yusof, M.B.M.; Zaki, S.A.; Hughes, B.R.; Yazid, M.N.A.W.M. A review on windcatcher for passive cooling and natural ventilation in buildings, Part 1: Indoor air quality and thermal comfort assessment. Renew. Sustain. Energy Rev. 2017, 70, 736–756. [Google Scholar] [CrossRef]
- Dehghani-Sanij, A.; Soltani, M.; Raahemifar, K. A new design of wind tower for passive ventilation in buildings to reduce energy consumption in windy regions. Renew. Sustain. Energy Rev. 2014, 42, 182–195. [Google Scholar] [CrossRef] [Green Version]
- Heidari, A.; Sahebzadeh, S.; Dalvand, Z. Natural ventilation in vernacular architecture of Sistan, Iran; Classification and CFD study of compound rooms. Sustainability 2017, 9, 1048. [Google Scholar] [CrossRef] [Green Version]
- Badran, A.A. Performance of cool towers under various climates in Jordan. Energy Build. 2003, 35, 1031–1035. [Google Scholar] [CrossRef]
- Mohamadabadi, H.D.; Dehghan, A.A.; Ghanbaran, A.H.; Movahedi, A.; Mohamadabadi, A.D. Numerical and experimental performance analysis of a four-sided wind tower adjoining parlor and courtyard at different wind incident angles. Energy Build. 2018, 172, 525–536. [Google Scholar] [CrossRef]
- Zarmehr, A.; Kider, J.T., Jr.; Florida, C. Modeling and Simulation of Parametric Wind-Catcher Designs for Natural Ventilation in Sustainable Building Skin Architecture. In Proceedings of the Conference on Advanced Building Skins 2018, Bern, Switzerland, 1–2 October 2018. [Google Scholar]
- Calautit, J.K.; Hughes, B.R.; Nasir, D.S. Climatic analysis of a passive cooling technology for the built environment in hot countries. Appl. Energy 2017, 186, 321–335. [Google Scholar] [CrossRef]
- Calautit, J.K.; Hughes, B.R.; O’Connor, D.; Shahzad, S.S. Numerical and experimental analysis of a multi-directional wind tower integrated with vertically-arranged heat transfer devices (VHTD). Appl. Energy 2017, 185, 1120–1135. [Google Scholar] [CrossRef] [Green Version]
- Long, N.; Torcellini, P.; Pless, S.; Judkoff, R. Evaluation of the Low-Energy Design Process and Energy Performance of the Zion National Park Visitor Center: Preprint; National Renewable Energy Lab. (NREL): Golden, CO, USA, 2005. [Google Scholar] [CrossRef] [Green Version]
- Balabel, A.; Alwetaishi, M.; El-Askary, W.A.; Fawzy, H. Numerical Study on Natural Ventilation Characteristics of a Partial-Cylinder Opening for One-Sided-Windcatcher of Variable Air-Feeding Orientations in Taif, Saudi Arabia. Sustainability 2021, 13, 11310. [Google Scholar] [CrossRef]
- Haghighi, A.; Pakdel, S.; Jafari, A. A study of a wind catcher assisted adsorption cooling channel for natural cooling of a 2-storey building. Energy 2016, 102, 118–138. [Google Scholar] [CrossRef]
- Chew, L.W.; Nazarian, N.; Norford, L. Pedestrian-Level Urban Wind Flow Enhancement with Wind Catchers. Atmosphere 2017, 8, 159. [Google Scholar] [CrossRef] [Green Version]
- Alwetaishi, M. Use of Underground Constructions Enhanced with Evaporative Cooling to Improve Indoor Built Environment in Hot Climate. Buildings 2021, 11, 573. [Google Scholar] [CrossRef]
- Afshin, M.; Sohankar, A.; Manshadi, M.D.; Esfeh, M.K. An experimental study on the evaluation of natural ventilation performance of a two-sided wind-catcher for various wind angles. Renew. Energy 2016, 85, 1068–1078. [Google Scholar] [CrossRef]
- Benkari, N.; Fazil, I.; Husain, A. Design and Performance Comparison of Two Patterns of Wind-catcher for a Semi-enclosed Courtyard. Int. J. Mech. Eng. Robot. Res. 2017, 6, 396–400. [Google Scholar] [CrossRef]
- Ansar, H.; Arumugham-Achari, A.K.; Johnson, J. Parametric Study on the Effect of a Domestic Wind Catcher-Solar Chimney System for Arid Regions. Int. Res. J. Adv. Eng. Sci. 2017, 2, 316–322. [Google Scholar]
- Sarjito; Riyadi, T.W.B. A Parametric Study of Wind Catcher Model in a Typical System of Evaporative Cooling Tower Using CFD. Appl. Mech. Mater. 2014, 660, 659–663. [Google Scholar] [CrossRef]
- Alsailani, M.; Montazeri, H.; Rezaeiha, A. Towards optimal aerodynamic design of wind catchers: Impact of geometrical characteristics. Renew. Energy 2020, 168, 1344–1363. [Google Scholar] [CrossRef]
- Varela-Boydo, C.; Moya, S. Inlet extensions for wind towers to improve natural ventilation in buildings. Sustain. Cities Soc. 2020, 53, 101933. [Google Scholar] [CrossRef]
- Katona, L.; Háber, I.E.; Kistelegdi, I. Comparison of downdraught and up draft passive air conduction systems (PACS) in awinery building. Buildings 2021, 11, 259. [Google Scholar] [CrossRef]
- Beck, H.E.; Zimmermann, N.E.; McVicar, T.R.; Vergopolan, N.; Berg, A.; Wood, E.F. Present and future Köppen-Geiger climate classification maps at 1-km resolution. Sci. Data 2018, 5, 180214. [Google Scholar] [CrossRef] [PubMed] [Green Version]
- Remund, J. Accuracy of Meteonorm. Available online: https://meteonorm.com/assets/publications/Accuracy_of_Meteonorm_7.pdf (accessed on 16 August 2022).
- Katona, Á.L.; Xuan, H.; Elhadad, S.; Kistelegdi, I.; Háber, I. High-Resolution CFD and In-Situ Monitoring Based Validation of an Industrial Passive Air Conduction System (PACS). Energies 2020, 13, 3157. [Google Scholar] [CrossRef]
- Ford, B.; Errell, E. Component Design and Controls. In The Architecture and Engineering of Downdraught Cooling: A Design Source Book, 1st ed.; Ford, B., Schlano-Phan, R., Francis, E., Eds.; PHDC Press: Philadelphia, PA, USA, 2010; pp. 168–189. [Google Scholar]
- Chiesa, G.; Grosso, M.; Pearlmutter, D.; Ray, S. Advances in adaptive comfort modelling and passive/hybrid cooling of buildings. Energy Build. 2017, 148, 211–217. [Google Scholar] [CrossRef]
- Balogh, M.; Parente, A. Realistic boundary conditions for the simulation of atmospheric boundary layer flows using an improved k–ε model. J. Wind Eng. Ind. Aerodyn. 2015, 144, 183–190. [Google Scholar] [CrossRef]
- Balogh, M.; Parente, A.; Benocci, C. RANS simulation of ABL flow over complex terrains applying an Enhanced k-ε model and wall function formulation: Implementation and comparison for fluent and OpenFOAM. J. Wind Eng. Ind. Aerodyn. 2012, 104–106, 360–368. [Google Scholar] [CrossRef]
- Chen, Q.; Zhai, Z. The use of Computational Fluid Dynamics tools for indoor environmental design. In Advanced Building Simulation; Malkawi, A.M., Augenbroe, G., Eds.; Spon Press: New York, NY, USA, 2003; pp. 119–140. [Google Scholar]
- Tominaga, Y.; Mochida, A.; Yoshie, R.; Kataoka, H.; Nozu, T.; Yoshikawa, M.; Shirasawa, T. AIJ guidelines for practical applications of CFD to pedestrian wind environment around buildings. J. Wind Eng. Ind. Aerodyn. 2008, 96, 1749–1761. [Google Scholar] [CrossRef]
- Ramponi, R.; Blocken, B. CFD simulation of cross-ventilation for a generic isolated building: Impact of computational parameters. Build. Environ. 2012, 53, 34–48. [Google Scholar] [CrossRef]
- Norris, S.E.; Richards, P. Appropriate boundary conditions for computational wind engineering models using the k-ε turbulence model. J. Wind. Eng. Ind. Aerodyn. 2010, 46, 145–153. [Google Scholar]
- Celik, I.B.; Ghia, U.; Roache, P.J.; Freitas, C.J.; Coleman, H.; Raad, P.E. Procedure for estimation and reporting of uncertainty due to discretization in CFD applications. J. Fluids Eng. Trans. ASME 2008, 130, 078001-4. [Google Scholar] [CrossRef] [Green Version]
- Peng, L.; Nielsen, P.V.; Wang, X.; Sadrizadeh, S.; Liu, L.; Li, Y. Possible user-dependent CFD predictions of transitional flow in building ventilation. Build. Environ. 2016, 99, 130–141. [Google Scholar] [CrossRef]
- Kuznik, F.; Rusaouën, G.; Brau, J. Experimental and numerical study of a full scale ventilated enclosure: Comparison of four two equations closure turbulence models. Build. Environ. 2007, 42, 1043–1053. [Google Scholar] [CrossRef]
- Perén, J.; van Hooff, T.; Leite, B.; Blocken, B. CFD analysis of cross-ventilation of a generic isolated building with asymmetric opening positions: Impact of roof angle and opening location. Build. Environ. 2015, 85, 263–276. [Google Scholar] [CrossRef] [Green Version]
- Hosseini, S.; Shokry, E.; Hosseini, A.A.; Ahmadi, G.; Calautit, J. Evaluation of airflow and thermal comfort in buildings ventilated with wind catchers: Simulation of conditions in Yazd City, Iran. Energy Sustain. Dev. 2016, 35, 7–24. [Google Scholar] [CrossRef]
- Alwetaishi, M.; Gadi, M. New and innovative wind catcher designs to improve indoor air quality in buildings. Energy Built Environ. 2020, 2, 337–344. [Google Scholar] [CrossRef]
- Pearlmutter, D.; Erell, E.; Etzion, Y.; Meir, I.; Di, H. Refining the use of evaporation in an experimental down-draft cool tower. Energy Build. 1996, 23, 191–197. [Google Scholar] [CrossRef]
- Pearlmutter, D.; Erell, E.; Etzion, Y. A multi-stage down-draft evaporative cool tower for semi-enclosed spaces: Experiments with a water spraying system. Sol. Energy 2008, 82, 430–440. [Google Scholar] [CrossRef] [Green Version]
- EN 15251; Indoor Environmental Input Parameters for Design and Assessment of Energy Performance of Buildings Addressing Indoor Air Quality, Thermal Environment, Lighting and Acoustics. European Union: Brussels, Belgium, 2006; pp. 1–51.


| Region | Validated Mesh [34] | Detailed Domain [31] | Simplified Domain (Current Research) |
|---|---|---|---|
| Total domain size | 500 m × 500 m × 100 m | 200 m × 200 m × 80 m | 105 m × 135 m × 60 m |
| Atmospheric | 6 m | 4 m | 4 m |
| Macro environment | 3 m | 2 m | 2 m |
| Micro environment | 2 m | 1 m | 1 m |
| Near building walls | 0.5 m | 0.3 m | 0.3 m |
| Towers/openings | 0.3 m | 0.1 m | 0.1 m |
| Interior | 0.2 m | 0.25 m | 0.25 m |
Publisher’s Note: MDPI stays neutral with regard to jurisdictional claims in published maps and institutional affiliations. |
© 2022 by the authors. Licensee MDPI, Basel, Switzerland. This article is an open access article distributed under the terms and conditions of the Creative Commons Attribution (CC BY) license (https://creativecommons.org/licenses/by/4.0/).
Share and Cite
Katona, Á.L.; Háber, I.E.; Kistelegdi, I. CFD Simulation Supported Development of Wind Catcher Shape Topology in a Passive Air Conduction System (PACS). Buildings 2022, 12, 1583. https://doi.org/10.3390/buildings12101583
Katona ÁL, Háber IE, Kistelegdi I. CFD Simulation Supported Development of Wind Catcher Shape Topology in a Passive Air Conduction System (PACS). Buildings. 2022; 12(10):1583. https://doi.org/10.3390/buildings12101583
Chicago/Turabian StyleKatona, Ádám László, István Ervin Háber, and István Kistelegdi. 2022. "CFD Simulation Supported Development of Wind Catcher Shape Topology in a Passive Air Conduction System (PACS)" Buildings 12, no. 10: 1583. https://doi.org/10.3390/buildings12101583