Abstract
The supply chain for prefabricated buildings (PB) is vulnerable to the operation failure of node enterprises, with frequent damage occurring. Therefore, it is vital to establish an evaluation model of supply chain resilience (SCRE) to improve the ability to resist unanticipated risks. However, existing research falls short of explaining the hierarchy of the influential components. To fill this gap, this paper established an element-based system of PBSCRE affecting factors. The DEMATEL-ISM method, which combines Pythagorean fuzzy sets, was utilized to analyze the factors. The effectiveness of this framework was then verified via a case study. The results showed the following: the top six elements in terms of centrality were risk management level, inventory management, emergency response plan, visibility, environmental risk, and information technology level; all factors were divided into six levels: (1) factors in level 1 are surface direct influence factors, (2) factors in levels 2 to 5 are intermediate transfer factors, and (3) factors in level 6 are deep root factors. There are 4 root factors, namely, supplier level, environmental risk, information technology level, and visibility. The results indicate that the proposed model will assist managers in identifying critical aspects and achieving sustainable management.
1. Introduction
In recent years, the construction supply chain has been greatly affected by the international economy and society, resulting in the continuous occurrence of stoppages and delayed deliveries [1].The sustainable development of construction supply chains has become a major challenge. Because of the novel coronavirus in 2019, many local governments have implemented stringent blockade policies to limit the spread of the virus [2]. Production, logistics, and labor between countries have been greatly affected, bringing the world to a severe standstill [3]. Today, the level of resource sharing between upstream and downstream enterprises is low, and the cooperative relationship has not received much attention. With the increase in talent and technology costs, the anti-risk ability of construction supply chains to deal with uncertain events is becoming worse [4]. In light of this context, an increasing number of scholars are beginning to research the resilience of supply chains. Developing a resilient construction supply chain is considered the most appropriate goal in the current economic situation.
The concept of resilience comes from the field of physics [5]. Holling introduced the term to ecology in 1973, stressing the importance of being able to absorb disturbance before the system shifts [6]. Inspired by his study, the concept has been constantly introduced to other disciplines to describe the key features of complex dynamic systems, such as engineering, economics, psychology, sociology, etc. It can be concluded that resilience is an innate quality of the system, covering a wide range of issues from vulnerability to risk management and bounce-back ability after a setback [7,8]. Supply Chain Resilience(SCRE) can be defined as “the ability to proactively plan and design supply chain networks to prevent accidental interruptions, specifically to gain a competitive advantage by automatically responding to disruptions and even possibly beyond the activity after a steady running state, while maintaining control over structures and functions” [5].
In the construction industry, the supply chain can be defined from two perspectives: from an organizational standpoint, it comprises architectural planning, engineering design, materials manufacturing and delivery, subcontracting practices, facilities management and operations; from the social standpoint, it is a complex network of relationships involving all stakeholders [9]. Over the past few decades, a great deal of research has been devoted to construction supply chain management [10,11]. However, few studies have been conducted on the prefabricated building supply chains. Recently, the Chinese government has offered detailed regulatory assistance for the prefabricated building sector since it is in line with the highly industrialized construction industry and the idea of sustainable construction [12]. The prefabricated building supply chain can be defined as all node enterprises covered by direct or indirect coordination in the whole construction project process. There are several stages involved, including production, storage, transportation, and on-site lifting [13]. However, due to the overall layout of the PBSC, more participants, and the fact that the upper/lower-end companies have been subject to a range of unsettling factors, the supply chain has been exposed to the risk of disruption, seriously impacting engineering safety and the market advantages of general contractors [14].
Most of the previous research has only focused on the magnitude of certain aspects affecting the PBSC, such as employee behaviors, the production and assembly construction of components, skilled labor et al. [15,16,17] Few studies have been carried out to establish an index system that takes into account several dimensions and conduct in-depth analyses of the relationships between different factors. Additionally, the intrinsic links between factors are expected to be fully explored, which is instructive for enterprises to learn how to better withstand hazards. Therefore, a comprehensive index system for evaluating PBSCRE is needed.
The rest of the article is organized as follows. Section 2 is a literature review. Section 3 introduces the index system of the PBSCRE and the PF-DEMATEL-ISM method. Section 4 performs numerical calculations and results analysis using the method. Section 5 discusses and puts forward some possible suggestions. Section 6 summarizes the whole text.
2. Literature Review
Since the research topic of this paper has the dual characteristics of construction and manufacturing, a comprehensive literature review is summarized in a progressive way, including the supply chain resilience in a broad range and the supply chain resilience of prefabricated buildings.
2.1. Supply Chain Resilience
Due to the fact that global political, economic, and social concerns raise the risk of supply chain disruption, studies on SCRE have increased in recent years. The term “resilience” is a multidisciplinary concept, originally derived from psychology and ecology to describe the deterioration and recovery of system performance caused by different hazards [18]. A more comprehensive definition that reflects the integration of multiple disciplines is given by Ponomarov and Holcomb [19]. They pointed out that supply chain resilience is the adaptive capacity to prepare for, respond to, and recover from unexpected events. Cheng stated that a resilient system should include four phases: a deterioration in the system’s performance after a disaster, recovery process or absence of a recovery process (e.g., the system is irreparable or recovery is not possible), sudden deterioration in the recovery process, and a deterioration in the delayed recovery process [20].
Earlier conceptions of resilience emphasized reaction and recovery from disruptive occurrences. Scholars have recently begun to examine adaptability, anticipation, and preparedness. In conjunction with changes in the business environment, the development of supply chain resilience has extended its reach. Azevedo et al. [21] classified supply chain resilience into internal, supplier, and customer levels from the perspective of break nodes. Hohenstein et al. [22] argued that pre-risk preparedness facilitates rapid and low-cost recovery after the risk occurs. As a result, they divided supply chain resilience into four dimensions: pre-event planning, response, recovery, and growth. On this basis, Birkie et al. [23] argued that supply chain resilience should be classified as internal foresight, internal passivity, external foresight, and external passivity. Bhamra et al. [24] considered that the employee, organizational, and structural elements would be negatively affected when there is a supply chain disruption. So, they classified supply chain resilience into employee resilience, organizational resilience, and structural resilience into three dimensions.
By referring to previous research, the authors have found that the recognized academic definition of resilience comprises the following: anticipation, preparation, responsiveness, and resilience. This provides a solid theoretical foundation for the study of PBSCRE in this paper. As the PBSC encompasses many operational areas, intricate subcontracting arrangements, and numerous stakeholders, further study is required to build a suitable framework.
2.2. Resilience of Prefabricated Buildings Supply Chain
In contrast to conventional construction, the primary structural elements of prefabricated structures are manufactured in advance at a dedicated factory. Then, they are transferred according to the construction site’s hoisting timetable. As a result, as shown in Figure 1, there are clear distinctions between the nodal enterprises and the various divisions of labor in the prefabricated supply chain
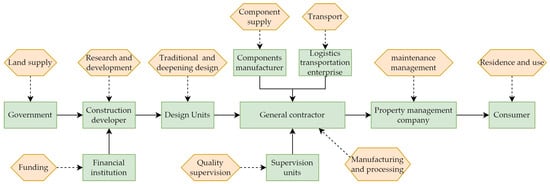
Figure 1.
Prefabricated buildings supply chain. Note: Green represents supply chain participants and yellow represents building life cycle activities.
As can be seen from the figure, the PBSC involves multi-level enterprise units. Upstream and downstream enterprises are intimately related throughout the lifespan. Therefore, any link in the supply chain exposed to external and internal uncertainties may raise the risk of disruption and operation of the whole supply chain.
However, this method cannot explain the causal and hierarchical relationships between factors due to its strong assumption constraints. Based on a thorough questionnaire and fuzzy-synthetic assessment, Ekanayake [25] developed a multi-level, multi-criteria mathematical model to determine the degree of vulnerability of industrialized construction supply chains (SCs) in Hong Kong.
In another paper, the authors also pointed out that supply chain capability (SCC) is a crucial prerequisite for supply chain resilience (SCR). The key capability components associated with achieving resilient SCs were identified through factor analysis, which included resourcefulness, flexibility, competence, adaptability, efficiency, financial strength, visibility, expectations, and decentralization [26].
A review of prior research suggests that researchers used to construct the PBSCRE evaluation system from the standpoint of independent firms, but not from the broader perspective of resilience’s inherent significance. Secondly, the prior assessment findings acquired just the degree of factors, not the conduction relationship between them. According to the unique manufacturing methods of prefabricated structures, identifying the major influencing elements of SCRE should be integrated with the features and actual circumstances of prefabricated construction, as well as the established manufacturing theory. It is also worth noting that because the majority of SCRE research has focused on the manufacturing supply chain, not even a fundamental understanding of PBSCRE has been established by studies. Therefore, this paper draws on the discussion of resilience in other research fields, and the evaluation system from the point of elements was constructed, taking into account the unique properties of PBSC.
Social network analysis (SNA) and the structural equation model (SEM) are the common methods to deal with influencing factors, which can reveal the interdependence of factors. However, SNA is complex and of limited applicability, and SEM requires a large sample size [15,27]. ISM reduces the number of relations by 50–80% through transitive reasoning, thus making the process more efficient [28]. ISM visualizes complex causal relationships but does not reveal indirect relationships between factors. DEMATEL happens to be able to assess indirect relationships further. Combining the two methods can extract a more comprehensible structural model from various factors. Meanwhile, the inclusion of Pythagorean fuzzy can be beneficial when lessening the ambiguity and hesitation of expert scores. This paper combined the Pythagorean fuzzy, DEMATEL, and ISM to analyze the key influencing factors of complex systems. It lends substantial assistance to quantitative analysis and scientific decision making of the PBSCRE’s affecting factors. It also makes it clear what the underlying mechanism is and how the factors are arranged in a hierarchy.
3. Materials and Methods
This section will introduce the establishment of the influencer system and a combination of Pythagorean-DEMATEL-ISM methods.
3.1. The Influence Factors System
In this paper, “supply chain resilience”, “construction”, and “prefabricated buildings” are used as keywords to screen the literature. A total of 70 papers were selected by searching through the web of science and Google Scholars et al. Then, the core collection from 2010 to 2022, available in full English and dated, was settled. In the end, 28 research papers were selected that fit the current theme. By using Microsoft Excel, the influencing factors were summarized and sorted out from the perspective of elements. The team then conducted semi-structured interviews with experts skilled in the assembly supply chain to confirm the validity and reliability of the influencing factors. Among the 8 respondents, there are 2 experts with senior engineer titles, 3 technicians with intermediate engineer titles, 3 construction site supervisors, 2 project planners, and 2 component purchasers. Based on activities within the industry, the experts identified 15 observation variables in Table 1 in five dimensions.

Table 1.
Influencing factors system of prefabricated buildings supply chain resilience.
3.1.1. Proactive Preparation
Proactive preparation is the stage of preparing before the supply chain breaks. At this stage, each nodal enterprise needs to respond to potential interruption risks by establishing an early warning system and reserving resources, etc. [26] Although the occurrence of unexpected disruption events is often random, people can still detect them within a period of time before they occur, and this ability to feel the risk in advance may come from historical information about engineering projects or from newspaper reports about relevant events at home and abroad. Proactive preparation is a proactive way to improve supply chain resilience, including three metrics: supply chain structure, supply chain capacity, and supply chain complexity.
The supply chain structure includes the number of nodal enterprises, and the cooperative relationships among them. The greater the number of nodal enterprises, the higher the probability of disruption risk and the lower the supply chain resilience.
Supply chain capacity includes maximum output, product varieties, and product production characteristics. The more product varieties, product design resilience, and production time resilience, the greater the supply chain resilience.
Supply chain complexity [29] encompasses supply chain cost, product quality, scheduling efficiency and delivery efficiency. In general, supply chains with lower costs and higher product quality are more resistant to market fluctuations.
3.1.2. Internal Absorption Ability
Internal absorption capacity dimension refers to the ability to resolve the process and management risk within the supply chain, as well as demand and supply risk outside the enterprise. This dimension mainly includes the following indicators.
The logistics support level includes several indicators, such as route layout, transportation capacity, and the number of routes. Common transportation methods include shipping, railways, trunks, etc. The single transportation capacity and costs associated with various modes of transportation are also quite diverse. More route layout levels correspond to higher transportation capacity as the number of common routes increases; higher logistics support reduces the risk of an interruption.
The inventory management dimension focuses on the level of redundancy of prefabricated components and other materials [34]. While increasing pre-installation and appropriate redundancy are thought to be effective measures to improve supply chain resilience, this can also significantly increase supply chain costs, which is contrary to lean supply chain management. So, it is important to maintain a balance between efficiency and redundancy.
In terms of the on-site lifting flexibility dimension, fabrication, transportation, and storage of prefabricated components are important parts of prefabricated building. As well as on-site installation and construction, these are critical components of prefabricated building, which differ greatly from the traditional construction industry.
3.1.3. External Absorption Ability
The external absorption capacity dimension refers to the ability of a supply chain to resist disruptions when risks to the supply chain’s external environment occur. Modern supply chains may face a wider range of risks than many managers realize. The presence of many disturbances in the business environment, such as war, plague, earthquakes, and inflation has been recognized as sources of risk. Specific indicators of this include the following.
Visibility. Visibility can also be called transparency, which refers to the knowledge and information that can be obtained through current changes between upstream and downstream companies [43]. Therefore, it is a prerequisite for response changes. Its specific connotation includes communication, collaborative relationships, and risk sharing among supply chain members. Visibility embodies the proper meaning of agility in supply chain resilience.
Environmental Risks. Environmental risks include external natural environmental risks such as extreme bad weather, large infectious diseases, earthquakes, fires, explosions, etc. They also include external economic and social environments, these are mainly national policy winds, inflation, etc. The construction supply chain involves a wide range of industries, and the huge amount of construction capital leads to its significant influence on the financial market.
Market stability. Supply and demand in the market is mainly reflected by the fluctuation of raw materials and product prices over the current period of time. Due to the limited natural resources and the recession caused by the epidemic, the market volatility becomes greater, which has an unavoidable impact on all nodal companies in the prefabricated supply chain.
3.1.4. Adaptability
Adaptability refers to the ability of the supply chain to quickly change the network structure to adapt to changes and establish new cooperative relationships when the external market environment changes rapidly [19]. Specific indicators include the level of risk management and information technology.
The level of risk management [18,44] includes the ability to respond to external risks, the incentive system within the company when emergencies occur, the ability to respond to risks in a timely manner, and the ability to integrate resources after supply chain breakdowns.
The level of information technology includes two aspects of information exchange efficiency and exchange platform construction. As we all know, construction supply chain management benefits from technologies such as building information modeling (BIM) and geographic information science (GIS), which are effective tools to support information exchange and decision analysis [13,40,41].
3.1.5. Restore Ability
Restore ability refers to the ability of the prefabricated supply chain to absorb disturbances and adapt to disruptions that prevent it from maintaining normal performance levels and necessitate a series of measures to quickly restore supply chain performance to the desired state [45]. Specifically, it includes the three indicators of funds dispatch, emergency response plan, and organizational management.
Funds dispatch [46] includes the timing of funds scheduling and the level of funds support. Nodal companies that can mobilize more available funds in a short period of time tend to recover from the risk of disruption more quickly. Companies with capital advantages can replace other resources needed to restore the supply chain in a shorter period of time, and they can also motivate all participants in the supply chain to perform their tasks more efficiently, so that the supply chain can return to normal levels as soon as possible.
Emergency response plans reflect the level of risk management of suppliers following disruptions, with the primary measures taken including supply chain reorganization, technical maintenance, information monitoring, and so on [47]. The history of the emergency response plan also serves as a reference for future emergency preparation and emergency management, thereby enhancing the enterprise’s emergency management.
Organizational management [48] includes the ability of managers to make decisions, the level of collaboration between managers and executives, and the training of professionals. Talent is the source of the stability of the prefabricated supply chain and is the main force to deal with the risk of disruption [49]. In addition to managers and executives, talent also includes collaboration between the two, which represents the total capability of the team. This indicator can be measured by the decision-making power and rallying power of managers, the number of professional staff trained and the proficiency of executives.
3.2. PF-DEMATEL-ISM
The phases of the proposed PF-DEMATEL-ISM method are presented in Figure 2.
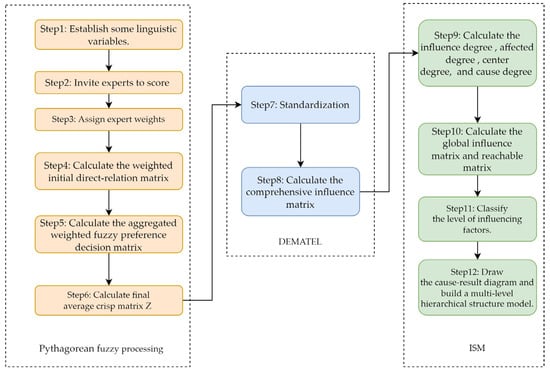
Figure 2.
Presents a detailed representation of the PF-DEMATEL-ISM method.
Pythagorean fuzzy is intended to lessen the ambiguity and hesitation in data, which is inevitable in expert scores. The hierarchical relationship between factors is clarified by integrating the expert opinions and using DEMATEL to obtain the importance of the influencing factors. ISM is used to classify factors into logical levels.
3.2.1. PYTHAGOREAN FUZZY SETS
The fuzzy set is one of the most powerful tools for explaining the uncertainties inherent in data. Atanassov defined the intuitionistic fuzzy sets (IFS) based on affiliation, non-affiliation and hesitation to describe the fuzziness and uncertainty of decision information [50]. The Pythagorean fuzzy set is an extension of the IFS, which improves the limitation that the sum of attribute affiliation and non-affiliation of the intuitionistic fuzzy set must be equal to 1. It can deal with uncertainty more reliably, reduce ambiguity and deal with imprecision in decision making.
Definition 1.
wherespecifies the membership degree anddenotes the non-membership degree of the, and
Assume that a set X is a universe of discourse, P is an object as:
Definition 2.
For a PFS, denoteas the degree of indeterminacy or hesitancy of x to P.
Definition 3.
Algebraic Operations of Pythagorean fuzzy number (PFN).
Given two PFNs, and , then some arithmetic operations can be described as follows:
These definitions will be used in the proposed PF-DEMATEL-ISM method.
3.2.2. PF-DEMATEL
Decision Making Trial and Evaluation Laboratory (DEMATEL) is a model that intuitively represents complex system factors by determinant computation. It was proposed by Gabus and Fontela at the Bastille National Key Laboratory in the 1970s and is an effective method for analyzing the combined effects of a set of factors on a system by considering both the direct and the indirect influence of the relationship between all factors [51].
In view of the considerations in the previous section, the combination of Pythagorean fuzzy sets and DEMATEL is proposed with the intention of proposing a decision model based on expert consensus judgment. The calculation steps of PF-DEMATEL are as follows:
Step 1: Establishing some linguistic variables. Table 2 lists the crisp and fuzzy numbers corresponding to the linguistic variables.
Table 2.
Linguistic variable in Pythagorean fuzzy sets.
Experts are invited to score between 0 and 6, where 0, 1, 2, 3, 4, 5 and 6 represent “very low influence”, “low influence”, “medium low influence”, “medium influence”, “medium high influence”, “high influence”, and “very high influence”, respectively. Then, they are transformed into corresponding Pythagorean fuzzy numbers.
Step 2: Every expert judges the relationship between any two indicators, and the initial direct-relation matrix Z by pair-wise comparisons is obtained, in which representing the degree to which the criterion i affects the criterion j. The hesitation fuzzy direct influence matrix given by the expert is:
Step 3: The expert weight based on the evaluation hesitation degree is calculated from Equation (3)
where .
Step 4: The weighted initial direct-relation matrix is calculated,
where .
Step 5: According to the decision results of n experts, the aggregated weighted hesitation fuzzy preference decision matrix is obtained.
Step 6: The final average crisp matrix Z is calculated by using score function as a defuzzification function.
where .
Step 7: In order to unify the dimension, the matrix Z is normalized to obtain the standardized matrix , so that is in the interval of [0,1].
Step 8: The comprehensive influence matrix is calculated according to Equation (8)
3.2.3. Interpretative Structural Modeling
Interpretative Structural Modeling [52] converts complex systems to a clear and intuitive multilevel recursive structure by creating a hierarchy of influencing factors, such as reachable matrices. It can break down a complex system into several subsystem elements by using people’s practical experience, knowledge and computers [53]. The method can transform semantically ambiguous evaluation into an intuitive, hierarchical model based on qualitative analysis.
The comprehensive influence matrix has been obtained in the previous subsection, and the following steps are unfolded according to the ISM:
Step 9: The influence degree , affected degree , center degree are calculated and cause degree
where: is the total number of indicators, denotes the row influence degree of the factors in the comprehensive influence matrix represents the column influence degree of the factors. Centrality is an important index for evaluating the influence degree of the influencing factor itself on complex systems, and cause degree is an important index for evaluating the influence degree of influencing factors on other factors. If cause degree is greater than zero, it is the cause factor, and less than zero is the result factor.
Step 10: The global influence matrix and reachable matrix are calculated. The following equation is used to calculate the global influence matrix:
To simplify the system structure, a threshold value is introduced to remove the redundant information from the matrix , which contains indicators with a small degree of influence. Usually, values are selected based on expert experience in the literature, which is less objective, while the calculation of the sum of mean and standard deviation based on statistical distribution can reduce the influence of subjectivity. The calculation formula is as follows:
are the mean and standard deviation of all factors in the combined influence matrix , respectively, and
The reachable matrix is calculated by simplifying matrix according to the value of . In the reachable matrix, represents the degree of influence of factor with , means factor has direct influence with , and if it means there is no direct influence between them.
Step 11: Classify the level of influencing factors.
The reachable matrix is hierarchized to obtain the reachable set , the antecedent set and the highest set of factors , if , then is taken as the highest level, and the above operation is repeated after deleting the hierarchical factors in turn, until all the influencing factors are hierarchically divided.
Step 12: The cause-result diagram is drawn and a multi-level hierarchical structure model is built.
4. Case Study and Results
This article takes the supply chain of the six-villages comprehensive renovation project in the Chaokou District of Wuhan as an example. The project is led by the Wuhan Development Zone Land and Planning Bureau, invested by Wuhan Chedu Group. The total building area of the project is 803,000 square meters, with an assembly rate of 56.2% and it adopts an assembled monolithic shear wall structure system.
On 4 August 2021, there were 20 coronavirus positive cases of new crown in Wuhan, and the flow investigation showed that all cases were related to the project site. More than 1000 staff were in close contact, and the site was forced to stop work, which is undoubtedly a greater test for the supply chain.
Table 1 lists the 15 influencing factors that have an effect on the PBSCRE. Eight experts and scholars with project-related work experience were invited to score. Then, all scores were collected and processed according to steps 1 to 12 above. Data processing with MATLAB and Excel resulted in a comprehensive influence matrix T listed in Table 3, center degree and cause degree of 15 factors listed in Table 4, and the reachable matrix listed in Table 5. The influencing factors are hierarchically divided by ISM, and the results are shown in Figure 3.
Table 3.
The comprehensive influence matrix.
Table 4.
The center degree and cause degree of all factors.
Table 5.
The reachable matrix.
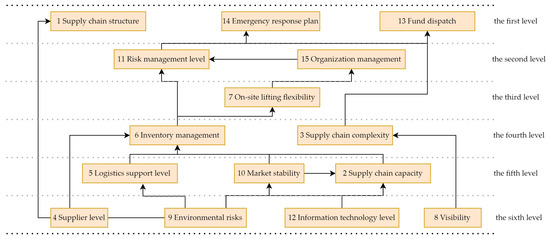
Figure 3.
Multi-level hierarchical structure diagram.
According to Table 4, in this case, there are 7 indicators with a cause degree greater than 0, ranked from largest to smallest as follows: environmental risk, information technology level, market stability, logistics support level, visibility, supplier level, and supply chain structure. The remaining 9 indicators with a reason degree less than 0 belong to the reason factors, among which the absolute value of emergency response plan is the largest.
Meanwhile, the greater the centrality mi of the influencing factors, the more important they are. The level of risk management, inventory management, emergency response planning, visibility, environmental risk, and information technology level are the top 6 factors in centrality, indicating that managers of enterprises in each node of the supply chain should strengthen the control of these factors.
By comparing the absolute values of the center and cause degrees of each influence factor, it can be concluded that the six key factors of the PBSCRE influence factor system include three key cause factors and three key result factors. The main cause factors are visibility, environmental risk, and information technology level, and the key result factors are risk management level, inventory management, and emergency response plan. Figure 3 shows that influencing factors are stratified according to ISM, resulting in a total of six levels.
5. Discussions and Implications
5.1. Hierarchical Analysis
Firstly, the first level of influencing factors includes supply chain structure, emergency response plan, and funds dispatch, indicating that these factors are the most immediate cause of supply chain disruptions. Meanwhile, the emergency response plan has the greatest degree of result factors that are susceptible to other factors. The results show that the emergency management capacity of chain enterprises and the intensity of emergency management training need to be strengthened in order to effectively deal with the problem of the deficiency of anti-risk capability in the assembly supply chain [54].
In the second level, risk management level and organization management are secondary direct factors. Additionally, the risk management level has the maximum center degree. This implies that risk sources in the supply chain of assembled buildings should be monitored and identified to fully implement risk management [55]. As senior leaders, they should improve their decision-making power and leadership when faced with risks, carry out emergency training within the company, and establish performance feedback mechanisms. Additionally, site managers and operators should prepare emergency plans to enhance risk awareness [56].
The only component of the third level is on-site lifting flexibility. The fourth level includes inventory management and supply chain complexity. This result indicates that increasing the number of prefabricated component dealers and establishing a flexible supplier evaluation system to classify their qualifications are very important to improving resilience [57]. According to the current situation in China, the demonstration effect of state-owned enterprises should be given due attention to improve the production and management efficiency of suppliers, thus increasing the redundancy of components to a proper extent.
The fifth level includes logistics support level, marketing stability and supply chain capacity, which are related to the stage of production of the prefabricated components. The research results show that it is of great significance to strengthen the storage management of components on construction sites by planning transportation routes and storage areas reasonably. Establishing a reliable, transparent and local supply chain is very necessary [58]. To protect the sustainability of the supply chain from the impact of epidemics and other disruptions, nodal companies should design a reasonable risk-sharing cooperation mechanism. Meanwhile, they could fully utilize the resource capacity of the government and reliable social capital for cooperation [59].
Finally, the base factor layer contains supplier level, environmental risks, visibility and information technology level. Meanwhile, the cause degree of environmental risk is the second highest, reaching 1.6360, and is the main cause of the disruption of PBSC. Environmental risk strikes the supply chain in an all-around way. It indicates that the enterprises at supply chain nodes should carry out more risk prevention and pay attention to the analysis of the current social market context when making decisions [32]. Visibility and information technology also have greater centrality. Visibility is primarily expressed by the extent to which nodal firms collaborate, communicate information with members in need in a timely way, and if the information is transparent [60].
The level of information technology often represents the ability of enterprises to adapt to the new era of economic development, which is also reflected in all aspects of the supply chain. Improving the level of information technology is significant for increasing the resilience of supply chains. Tracing systems and big data analysis can provide more reliable information for forecasting before disruption risk occurs. Effective information management can obtain a wide range of real-time information and simulate various recovery strategies in the event of an interruption. For example, general contractors should be able to fully share the information on design, production and transportation of assembled buildings through BIM, Radio Frequency Identification (RFID), the Internet of Things and other technologies [40,61,62]. In line with the current trend toward building informatization, a greater investment in these factors will enhance the supply chain resilience in an all-round way.
In this model, the factors at level 1 are the surface direct influencing factors, the factors at levels 2 to 5 are the intermediate transmitting factors, and the factors at level 6 are the deep root factors. As seen in Figure 3, there are four root factors, namely, supplier level, environmental risk, information technology level, and visibility, which are located at the bottom of the model, and play a fundamental role in the overall transmission mechanism, without any antecedent set. When bottom factors are improved, the impact caused by the remaining factors will be mitigated accordingly. Improvements in the surface factors can be used to test how well the program is being put into place.
5.2. Implications
In the previous study, the classification of SCRE was based primarily on the fracture nodes, and no research has created a more comprehensive elastic evaluation model from the perspective of elements. Therefore, a PBSCRE evaluation framework based on expert scoring has been developed. In this paper, the Pythagorean fuzzy sets were introduced to reduce the subjectivity and ambiguity of expert scoring. The DEMATEL-ISM is used to stratify the influencing factors and obtain a transfer diagram of the relationship between the factors. In this regard, the model established is of great theoretical significance.
In addition, combined with the case study, this paper puts forward some effective measures to improve the PBSCRE. A resilient supply chain means that, in times of disruption and uncertainty, node enterprises can quickly capture key issues and flexibly resolve them. These findings can assist managers in designing more resilient supply chains in uncertain environments and in identifying key drivers when disruption risks occur.
6. Conclusions
Against the background of social environmental uncertainty, the supply chain of PB is extremely vulnerable to disruption. Ensuring that supply chains are resilient is essential. Consequently, it is meaningful work to establish an evaluation system to measure the supply chain resilience of prefabricated buildings. However, previous studies have mostly focused on chain node enterprises in a limited scope and little research has investigated the conduction connection between the influential parameters. Therefore, the main contributions of this paper are as follows: (1) This paper proposed an evaluation system from the stand of elements, providing a new perspective for theoretical research in this field. Combining the cases, fifteen factors affecting PBSCRE were extracted from the knowledge of experts and scholars with relevant work experience. (2) New hybrid methods are proposed to address complex factorial relationships. The Pythagorean method is used to cope with the ambiguity and reluctance of expert decision making, while the DEMATEL-ISM method is used to generate a master-subordinate connection between components. The three methods are achieved with each other in order to obtain a hierarchical factor conduction map.
This paper also has certain practical significance. It can provide a reference list for scholars and practitioners in relevant fields. Program planning enables layer-by-layer analysis of individual problems and the formulation of focused countermeasures to address them. In addition, as the most essential raw materials and products in the assembly supply chain, the whole process of production management, transportation management and hoisting management must be reformed using information technology. Investing in these elements can significantly improve supply chain resilience. In addition, it is possible to provide a theoretical foundation for similar research in the future by assessing the long-term and consistent training of personnel, cooperating closely with universities.
Limitations of this paper include fewer research projects and interviews with experts. In addition, future research could focus on distinguishing between resilience and sustainability, developing a more comprehensive and integrated assessment framework covering both.
Author Contributions
Conceptualization, J.L. and J.W.; Data curation, J.L. and C.Y.; Formal analysis, J.L.; Funding acquisition, J.W. and C.Y.; Investigation, J.L. and C.Y.; Methodology, J.L. and Y.S.; Software, J.H.; Supervision, J.W.; Validation, J.L. and Z.C.; Visualization, J.L.; Writing—original draft, J.L.; Writing—review and editing, Y.S. All authors have read and agreed to the published version of the manuscript.
Funding
This study was supported by the National Key R&D projects (grant number 2018YFC0704301); Science and Technology Project of Wuhan Urban and Rural Construction Bureau, China (201943); Research on theory and application of prefabricated building construction management (20201h0439); Wuhan Mo Dou Construction Consulting Co., Ltd. (20201h0414); and Preliminary Study on the Preparation of the 14th Five-Year Plan for Housing and Urban–Rural Development in Hubei Province (20202s002).
Data Availability Statement
Not applicable.
Conflicts of Interest
The authors declare no conflict of interest.
References
- Wang, B.; Geng, L.; Dang, P.; Zhang, L. Developing a Framework for Dynamic Organizational Resilience Analysis in Prefabricated Construction Projects: A Project Life Cycle Perspective. J. Constr. Eng. Manag. 2022, 148, 04022110. [Google Scholar] [CrossRef]
- Abidin, N.A.Z.; Ingirige, B. (Eds.) Identification of the “Pathogenic” Effects of Disruptions to Supply Chain Resilience in Construction. In Proceedings of the 7th International Conference on Building Resilience (ICBR)—Using Scientific Knowledge to Inform Policy and Practice in Disaster Risk Reduction, Bangkok, Thailand, 27–29 November 2017. [Google Scholar]
- Ivanov, D. Supply Chain Viability and the COVID-19 pandemic: A conceptual and formal generalisation of four major adaptation strategies. Int. J. Prod. Res. 2021, 59, 3535–3552. [Google Scholar] [CrossRef]
- Zhang, S.; Fu, Y.; Kang, F. How to foster contractors’ cooperative behavior in the Chinese construction industry: Direct and interaction effects of power and contract. Int. J. Proj. Manag. 2018, 36, 940–953. [Google Scholar] [CrossRef]
- Tukamuhabwa, B.R.; Stevenson, M.; Busby, J.; Zorzini, M. Supply chain resilience: Definition, review and theoretical foundations for further study. Int. J. Prod. Res. 2015, 53, 5592–5623. [Google Scholar] [CrossRef]
- Holling, C.S. Resilience and Stability of Ecological Systems. Annu. Rev. Ecol. Syst. 2012, 4, 1–23. [Google Scholar] [CrossRef]
- Woods, D.D. Four concepts for resilience and the implications for the future of resilience engineering. Reliab. Eng. Syst. Saf. 2015, 141, 5–9. [Google Scholar] [CrossRef]
- Francis, R.; Bekera, B. A metric and frameworks for resilience analysis of engineered and infrastructure systems. Reliab. Eng. Syst. Saf. 2014, 121, 90–103. [Google Scholar] [CrossRef]
- Wang, T.-K.; Zhang, Q.; Chong, H.-Y.; Wang, X. Integrated Supplier Selection Framework in a Resilient Construction Supply Chain: An Approach via Analytic Hierarchy Process (AHP) and Grey Relational Analysis (GRA). Sustainability 2017, 9, 289. [Google Scholar] [CrossRef]
- Guan, L.; Abbasi, A.; Ryan, M.J. Analyzing green building project risk interdependencies using Interpretive Structural Modeling. J. Clean. Prod. 2020, 256, 120372. [Google Scholar] [CrossRef]
- Bui, T.-D.; Tsai, F.M.; Tseng, M.-L.; Tan, R.R.; Yu, K.D.S.; Lim, M.K. Sustainable supply chain management towards disruption and organizational ambidexterity: A data driven analysis. Sustain. Prod. Consum. 2021, 26, 373–410. [Google Scholar] [CrossRef]
- Luo, L.; Jin, X.; Shen, G.Q.; Wang, Y.; Liang, X.; Li, X.; Li, C.Z. Supply Chain Management for Prefabricated Building Projects in Hong Kong. J. Manag. Eng. 2020, 36, 05020001. [Google Scholar] [CrossRef]
- Ekanayake, E.M.A.C.; Shen, G.Q.P.; Kumaraswamy, M.M.; Owusu, E.K.; Saka, A.B. Modeling Supply Chain Resilience in Industrialized Construction: A Hong Kong Case. J. Constr. Eng. Manag. 2021, 147, 05021009. [Google Scholar] [CrossRef]
- Ekanayake, E.M.A.C.; Shen, G.; Kumaraswamy, M.; Owusu, E.K. A fuzzy synthetic evaluation of vulnerabilities affecting supply chain resilience of industrialized construction in Hong Kong. Eng. Constr. Arch. Manag. 2021, 29, 2358–2381. [Google Scholar] [CrossRef]
- He, Z.; Wang, G.; Chen, H.; Zou, Z.; Yan, H.; Liu, L. Measuring the Construction Project Resilience from the Perspective of Employee Behaviors. Buildings 2022, 12, 56. [Google Scholar] [CrossRef]
- Shi, W.; Mena, C. Supply Chain Resilience Assessment with Financial Considerations: A Bayesian Network-Based Method. IEEE Trans. Eng. Manag. 2021, PP, 1–16. [Google Scholar] [CrossRef]
- Ekanayake, E.M.A.C.; Shen, G.; Kumaraswamy, M.M. Critical capabilities of improving supply chain resilience in industrialized construction in Hong Kong. Eng. Constr. Arch. Manag. 2021, 28, 3236–3260. [Google Scholar] [CrossRef]
- Ivanov, D.; Sokolov, B.; Dolgui, A. The Ripple effect in supply chains: Trade-off ‘efficiency-flexibility-resilience’ in disruption management. Int. J. Prod. Res. 2014, 52, 2154–2172. [Google Scholar] [CrossRef]
- Ponomarov, S.Y.; Holcomb, M.C. Understanding the concept of supply chain resilience. Int. J. Logist. Manag. 2009, 20, 124–143. [Google Scholar] [CrossRef]
- Cheng, Y.; Elsayed, E.A.; Huang, Z. Systems resilience assessments: A review, framework and metrics. Int. J. Prod. Res. 2022, 60, 595–622. [Google Scholar] [CrossRef]
- Azevedo, S.G.; Govindan, K.; Carvalho, H.; Cruz-Machado, V. Ecosilient Index to assess the greenness and resilience of the upstream automotive supply chain. J. Clean. Prod. 2013, 56, 131–146. [Google Scholar] [CrossRef]
- Hohenstein, N.-O.; Feisel, E.; Hartmann, E.; Giunipero, L. Research on the phenomenon of supply chain resilience: A systematic review and paths for further investigation. Int. J. Phys. Distrib. Logist. Manag. 2015, 45, 90–117. [Google Scholar] [CrossRef]
- Birkie, S.E.; Trucco, P.; Campos, P.F. Effectiveness of resilience capabilities in mitigating disruptions: Leveraging on supply chain structural complexity. Supply Chain Manag. Int. J. 2017, 22, 506–521. [Google Scholar] [CrossRef]
- Bhamra, R.S.; Dani, S.; Burnard, K.J. Resilience: The concept, a literature review and future directions. Int. J. Prod. Res. 2011, 49, 5375–5393. [Google Scholar] [CrossRef]
- Ekanayake, E.M.A.C.; Shen, G.Q.; Kumaraswamy, M.; Owusu, E.K. Critical supply chain vulnerabilities affecting supply chain resilience of industrialized construction in Hong Kong. Eng. Constr. Arch. Manag. 2020, 28, 3041–3059. [Google Scholar] [CrossRef]
- Ekanayake, E.M.A.C.; Shen, G.Q.P.; Kumaraswamy, M.M. A fuzzy synthetic evaluation of capabilities for improving supply chain resilience of industrialised construction: A Hong Kong case study. Prod. Plan. Control 2021, 1–18. [Google Scholar] [CrossRef]
- Zhang, M.; Liu, Y.; Ji, B. Influencing Factors of Resilience of PBSC Based on Empirical Analysis. Buildings 2021, 11, 467. [Google Scholar] [CrossRef]
- Singh, R.K.; Gupta, A.; Gunasekaran, A. Analysing the interaction of factors for resilient humanitarian supply chain. Int. J. Prod. Res. 2018, 56, 6809–6827. [Google Scholar] [CrossRef]
- Chowdhury, M.H.; Quaddus, M. Supply chain resilience: Conceptualization and scale development using dynamic capability theory. Int. J. Prod. Econ. 2017, 188, 185–204. [Google Scholar] [CrossRef]
- Rad, M.H.; Mojtahedi, M.; Ostwald, M. The Integration of Lean and Resilience Paradigms: A Systematic Review Identifying Current and Future Research Directions. Sustainability 2021, 13, 8893. [Google Scholar] [CrossRef]
- Wu, C.; Barnes, D. Design of agile supply chains including the trade-off between number of partners and reliability. Int. J. Adv. Manuf. Technol. 2018, 97, 3683–3700. [Google Scholar] [CrossRef]
- Caldera, S.; Mohamed, S.; Feng, Y. Evaluating the COVID-19 Impacts on Sustainable Procurement: Experiences from the Australian Built Environment Sector. Sustainability 2022, 14, 4163. [Google Scholar] [CrossRef]
- Mohammadnazari, Z.; Aghsami, A.; Rabbani, M. A hybrid novel approach for evaluation of resiliency and sustainability in construction environment using data envelopment analysis, principal component analysis, and mathematical formulation. Environ. Dev. Sustain. 2022, 1–38. [Google Scholar] [CrossRef]
- Cheng, J.-H.; Lu, K.-L. Enhancing effects of supply chain resilience: Insights from trajectory and resource-based perspectives. Supply Chain Manag. Int. J. 2017, 22, 329–340. [Google Scholar] [CrossRef]
- Xue, X.; Shen, Q.; Tan, Y.; Zhang, Y.; Fan, H. Comparing the value of information sharing under different inventory policies in construction supply chain. Int. J. Proj. Manag. 2011, 29, 867–876. [Google Scholar] [CrossRef]
- Ekanayake, E.M.A.C.; Shen, G.Q.P.; Kumaraswamy, M.M. Identifying supply chain capabilities of construction firms in industrialized construction. Prod. Plan. Control 2021, 32, 303–321. [Google Scholar] [CrossRef]
- Miceli, A.; Hagen, B.; Riccardi, M.P.; Sotti, F.; Settembre-Blundo, D. Thriving, Not Just Surviving in Changing Times: How Sustainability, Agility and Digitalization Intertwine with Organizational Resilience. Sustainability 2021, 13, 2052. [Google Scholar] [CrossRef]
- Cui, Y. Knowledge-based System for Improving Supply Chain Resilience. In Proceedings of the 13th International Conference on Natural Computation, Fuzzy Systems and Knowledge Discovery (ICNC-FSKD), Guilin, China, 29–31 July 2017. [Google Scholar]
- Ojha, A.; Long, S.; Shoberg, T.; Corns, S. Bottom-Up Resource and Cost Estimation for Restoration of Supply Chain Interdependent Critical Infrastructure. Eng. Manag. J. 2021, 33, 272–282. [Google Scholar] [CrossRef]
- Bayramova, A.; Edwards, D.; Roberts, C. The Role of Blockchain Technology in Augmenting Supply Chain Resilience to Cybercrime. Buildings 2021, 11, 283. [Google Scholar] [CrossRef]
- Ben Mahmoud, B.; Lehoux, N.; Blanchet, P.; Cloutier, C. Barriers, Strategies, and Best Practices for BIM Adoption in Quebec Prefabrication Small and Medium-Sized Enterprises (SMEs). Buildings 2022, 12, 390. [Google Scholar] [CrossRef]
- Cui, Y. Improving Supply Chain Resilience with Employment of IoT. In Proceedings of the 2nd International Conference on Multidisciplinary Social Networks Research (MISNC), Matsuyama, Japan, 1–3 September 2015. [Google Scholar]
- Scholten, K.; Schilder, S. The role of collaboration in supply chain resilience. Supply Chain Manag. Int. J. 2015, 20, 471–484. [Google Scholar] [CrossRef]
- Mari, S.I.; Lee, Y.H.; Memon, M.S. Sustainable and Resilient Supply Chain Network Design under Disruption Risks. Sustainability 2014, 6, 6666–6686. [Google Scholar] [CrossRef]
- Li, R.; Dong, Q.; Jin, C.; Kang, R. A New Resilience Measure for Supply Chain Networks. Sustainability 2017, 9, 144. [Google Scholar] [CrossRef]
- Han, Y.; Chong, W.K.; Li, D. A systematic literature review of the capabilities and performance metrics of supply chain resilience. Int. J. Prod. Res. 2020, 58, 4541–4566. [Google Scholar] [CrossRef]
- Cao, C.; Li, C.; Yang, Q.; Zhang, F. Multi-Objective Optimization Model of Emergency Organization Allocation for Sustainable Disaster Supply Chain. Sustainability 2017, 9, 2103. [Google Scholar] [CrossRef]
- Annarelli, A.; Battistella, C.; Nonino, F. A Framework to Evaluate the Effects of Organizational Resilience on Service Quality. Sustainability 2020, 12, 958. [Google Scholar] [CrossRef]
- Dubey, R.; Gunasekaran, A.; Childe, S.J.; Wamba, S.F.; Roubaud, D.; Foropon, C. Empirical investigation of data analytics capability and organizational flexibility as complements to supply chain resilience. Int. J. Prod. Res. 2021, 59, 110–128. [Google Scholar] [CrossRef]
- Atanassov, K.; Vassilev, P. Intuitionistic fuzzy sets and other fuzzy sets extensions representable by them. J. Intell. Fuzzy Syst. 2020, 38, 525–530. [Google Scholar] [CrossRef]
- Yazdi, M.; Nedjati, A.; Zarei, E.; Abbassi, R. A novel extension of DEMATEL approach for probabilistic safety analysis in process systems. Saf. Sci. 2020, 121, 119–136. [Google Scholar] [CrossRef]
- Chen, J.-K. Improved DEMATEL-ISM integration approach for complex systems. PLoS ONE 2021, 16, e0254694. [Google Scholar] [CrossRef]
- Mathiyazhagan, K.; Govindan, K.; NoorulHaq, A.; Geng, Y. An ISM approach for the barrier analysis in implementing green supply chain management. J. Clean. Prod. 2013, 47, 283–297. [Google Scholar] [CrossRef]
- Feng, Y.; Xiang-Yang, L. Improving emergency response to cascading disasters: Applying case-based reasoning towards urban critical infrastructure. Int. J. Disaster Risk Reduct. 2018, 30, 244–256. [Google Scholar] [CrossRef]
- Thun, J.H.; Hoenig, D. An empirical analysis of supply chain risk management in the German automotive industry. Int. J. Prod. Econ. 2011, 131, 242–249. [Google Scholar] [CrossRef]
- Aven, T. Risk assessment and risk management: Review of recent advances on their foundation. Eur. J. Oper. Res. 2016, 253, 1–13. [Google Scholar] [CrossRef]
- Hosseini, S.; Morshedlou, N.; Ivanov, D.; Sarder, M.; Barker, K.; Al Khaled, A. Resilient supplier selection and optimal order allocation under disruption risks. Int. J. Prod. Econ. 2019, 213, 124–137. [Google Scholar] [CrossRef]
- Ivanov, D. Revealing interfaces of supply chain resilience and sustainability: A simulation study. Int. J. Prod. Res. 2018, 56, 3507–3523. [Google Scholar] [CrossRef]
- Zhao, L.; Liu, Z.; Mbachu, J. Optimization of the supplier selection process in prefabrication using BIM. Buildings 2019, 9, 222. [Google Scholar] [CrossRef]
- Jüttner, U.; Maklan, S. Supply chain resilience in the global financial crisis: An empirical study. Supply Chain Manag. Int. J. 2011, 16, 246–259. [Google Scholar] [CrossRef]
- Schönbeck, P.; Löfsjögård, M.; Ansell, A. Collaboration and knowledge exchange possibilities between industry and construction 4.0 research. Procedia Comput. Sci. 2021, 192, 129–137. [Google Scholar] [CrossRef]
- Bian, J.; He, Q. Research on Information Flow of Prefabricated Building Supply Chain Based on BIM. In Proceedings of the International Conference on Construction and Real Estate Management (ICCREM), Guangzhou, China, 10–12 November 2017. [Google Scholar]


Publisher’s Note: MDPI stays neutral with regard to jurisdictional claims in published maps and institutional affiliations. |
© 2022 by the authors. Licensee MDPI, Basel, Switzerland. This article is an open access article distributed under the terms and conditions of the Creative Commons Attribution (CC BY) license (https://creativecommons.org/licenses/by/4.0/).