Abstract
Owing to their distinct features, such as structural simplicity and excellent load-carrying capacity, steel truss bridges are widely applied as critical transportation networks. However, many previously designed steel truss bridges that are located in harsh environmental conditions are facing severe challenges of overloading and aging or deteriorating critical structural members due to increasing traffic load and corrosion problems (i.e., chloride-induced corrosion). As a consequence, these overloaded and deteriorated critical members may initialize localized damage (e.g., sudden member failure scenarios) and then trigger a disproportionate collapse (i.e., progressive collapse) of steel truss bridges. To this end, to protect the steel truss bridges from progressive collapse resulting from locally induced damages (e.g., sudden removal of a critical member), this paper proposed a generalized framework to identify the critical members and to qualify the alternate load path (ALP) redundancy of steel truss bridges subjected to sudden member loss of a critical member. Demand-to-capacity ratio (DCR) for linear elastic analysis and strain ratio (SR) for nonlinear dynamic analysis were employed as the design metrics and performance indicators to qualify the ALP redundancy of steel truss bridges. Effectiveness of the proposed framework in qualifying the ALP redundancy of steel truss bridges was demonstrated through the I-35W truss bridge under sudden member removal (MR) analyses. Results obtained from this study may provide beneficial information and could serve as good references for the protection of steel truss bridges that are vulnerable to sudden member loss scenarios.
1. Introduction
Progressive collapse is initialized by localized damage and subsequently develops as a chain reaction mechanism into a structural failure [1,2,3,4]. Localized damage could be initialized by various causes, such as sudden member loss, overloading, corrosion, blast, earthquakes, impact, and others. Progressive collapse analysis was first investigated after the collapse of the Ronan Point Tower (London, 1968). Since then, many similar high-profile collapse events have happened and have been studied, such as the collapse of the Alfred P. Murrah Federal Building (Oklahoma, 1995) and the World Trade Center Towers (New York, 2001) [4,5]. Based on the aftermath of these high-profile building failures, many studies have contributed to the progressive collapse analysis of buildings, whereas relatively limited studies have focused on the progressive collapse analysis of highway bridges, particularly steel truss bridges [5,6,7,8,9,10,11].
The concept of alternate load path (ALP) is rather more developed for building structures than for highway bridges. Due to the differences in the configurations of buildings and bridge structures, as well as their exposures to dynamic loads, such as earthquakes, vehicular impact, and blast [4,12], most of the existing specifications and design codes [13,14,15] in preventing progressive collapse have been developed exclusively for buildings, which cannot be directly applied to highway bridges. However, unlike buildings with multiple supports, highway bridges have few supports, which may make them much more vulnerable to progressive collapse in the event of localized failure, because they have less or no redundancy and unidentified alternate load paths (ALPs) [3,4]. Many catastrophic bridge collapse events, such as the collapse of the I-35W Truss Bridge in Minnesota in 2007, Florida International University Pedestrian Bridge on 15 March 2018, and Nanfang’ao steel single-arch bridge in Taiwan in 2019 [4], have emphasized the risk of progressive collapse following the sudden loss of a critical member, and it is necessary to develop integrated and systematic methods to provide effective ALPs to help highway bridges against progressive collapse.
Many steel truss bridges built between the 1920s and 1970s are aging and may have critical members with significant deteriorations. By investigating the bridge failures that took place in the United States from 1980 to 2012, Lee et al. [16] found that, although girder bridges were the most common structural type of failed bridges, truss bridges were much more vulnerable to failure than the girder bridges. In the event of loss of a critical member for a truss bridge due to corrosion, overloading, or terrorist events, continued stability and performance of the bridge could be attributed to “redundancy”. However, redundancy of long-span truss bridges is not well understood and is generally not considered in the design of existing steel truss bridges [3,4]. There are many observed cases where a truss bridge can survive without collapse from the local member damage or loss, such as the Neville Island Bridge, the Takoi Ohashi Bridge and the Honji Ohashi Bridge, the Lafayette Street Bridge, the Yukon River Bridge, and the East Brough’s Bridge [4,17,18,19,20,21,22,23]. Meanwhile, numerous steel truss bridges have collapsed due to localized damage, such as sudden loss a critical member. For example, the Sung Soo Grand Bridge in South Korea and the I-35W truss bridge in Minneapolis, etc., have been widely reported and have led to comprehensive investigations into the causes of these bridge failures [3,4,24,25,26]. These studies also suggested some prominent structural features of these steel truss bridges in helping them to facilitate the ALPs to enhance their redundancy. Although load-path redundancy of steel truss bridges has been discussed in these studies, there are still limited investigations focused on these factors contributing to the ALPs and load-path redundancy of steel truss bridges.
ALPs are generally defined as changes in the load paths and load distributions experienced by other members in the event of loss of a critical member. For instance, in a steel truss bridge, any load path would end up in transferring the structural loads to the supports, thereby making the bridge vulnerable to progressive collapse in the event of localized failure. A non-redundant bridge may be vulnerable to progressive collapse following the sudden loss of a critical member, even though the critical member has been designed to resist higher factored design loads [27]. Unlike buildings where guidance on ALPs has been prescribed through documents such as GSA [13], DoD [15], and GSA [16], considerations of ALPs have not been incorporated in the US bridge design guidelines until the most recent two editions of AASHTO [28,29]. In addition, Lwin [30] defined a system-redundant member (SRM) as a new type of primary steel tension member that could be damaged or removed without causing collapse of the bridge to evaluate the system-level redundancy of steel bridges. Recently, Connor et al. [22] performed a detailed investigation on the system-level redundancy of steel bridges, including steel truss bridges. They suggested several analytical procedures to evaluate the redundancy of steel bridges through advanced finite element analyses. Their findings were further compiled in the two recent guide specifications [31,32]. However, the redundancy evaluation approach suggested by Connor et al. [22] poses many challenges to engineers, such as the requirements of understanding the sophisticated modeling techniques and familiarity of material nonlinearities, large deformation theory, contact modeling simulations, etc.
The present study could be a complement to the current redundancy evaluation procedures suggested in [31]. Thus, this paper proposed a generalized framework to identify the critical members and to qualify the ALP redundancy of steel truss bridges in the event of sudden loss of a critical member. The DCR for linear elastic analysis and SR for nonlinear dynamic analysis were suggested as design metrics. Moreover, effectiveness of the proposed framework was investigated through numerical simulations of the I-35W truss bridge, which was a deck-truss bridge known as one of the most famous recently collapsed truss bridges due to localized damage. Results obtained in this study could provide beneficial information for steel truss bridge owners to understand the relationship between the ALPs, system performance, and the overall stability of steel truss bridges to ensure that they have sufficient ALPs and load-carrying capacity to survive from the progressive collapse following sudden member loss scenarios.
2. The Proposed Framework
2.1. Load Factors and Load Combinations
Load combinations for progressive collapse analysis are currently available for most buildings, whereas there are relatively less studies that have been found for highway bridges. For example, Ellingwood [1] presented load combinations for the progressive collapse analysis of buildings. In addition, many standards, such as “Minimum design loads for buildings and other structures” ASCE [33], recommended a live load (LL) factor of 0.5 because of the small probability of a joint occurrence of accidental and design loads. Bridge superstructures are designed using the load factors recommended in AASHTO LRFD Specifications [28,29]. These AASHTO load factors have been recommended based on extensive calibrations, and the load factor for the dead load (DL) is 1.5 using the LRFD method. These design codes suggest that the live load (LL) factor during the extreme events (Extreme Event II) is 0.5 when considering the likelihood of effects from simultaneous loads. For the present study, since there was still uncertainty regarding the survival of post-member failures, the failure event (i.e., sudden member loss scenario) was treated as an extreme event for the ALP redundancy analysis of steel truss bridges. Thus, load combinations for sudden member loss analysis in the present study using the LRFD method is expressed as
2.2. DCR Using Linear Static Analysis
According to AASHTO [29] and AISC [34], demand-to-capacity ratio (DCR) can be represented by the axial and flexural interaction equations. For steel members with the doubly and singly symmetric cross-sections, the DCR can be expressed as
where Pr and Pc represent the axial force demand (i.e., the LRFD load combinations) and capacity of the member, respectively. Similarly, Mrx and Mcx are the member’s bending moment demand and capacity with respect to the x-axis, while Mry and Mcy are its bending moment demand and capacity with respect to the y axis, respectively [34]. To further express this in terms of the stress variations, the DCR can be rewritten as Equations (4) and (5) according to AASHTO [29] and AISC [34].
where σrp is the axial stress; σMx and σMy are the stresses due to bending moments with respect to x and y axes, respectively; σdesign is the design stress obtained from the yield stress σy times the resistance factor based on the LRFD approach [29,34]. The resistance factors for compression, flexure, and tensile yielding are 0.9. The DCR of each member was computed by using the linear elastic analysis in SAP2000. Table 1 presents the defined limit states for the DCR utilized as the design metric to qualify the ALP of steel truss bridges. These limit states were based on general engineering practices. Specifically, the limit state of DCR ≤ 1.0 is commonly used to ensure that stress in a truss member is less than the design stress (0.9σy). The limit state of 1.0 < DCR ≤ 1.67 may be used to evaluate if the stress in a truss member is more than the design stress (0.9σy) but less than the yield stress (σy). A limit state of DCR > 1.67 implies the potential inelastic behavior in a truss member.

Table 1.
The proposed limit states for ALP redundancy analysis using the DCR metric.
2.3. SR Using Nonlinear Dynamic Analysis
Strain ratio (SR) of a truss member can be calculated through the nonlinear dynamic analysis in LS-DYNA. As described later, the LS-DYNA model of the bridge is simulated using the Hughes–Liu (H-L) beam elements and material model *MAT_Simplified_Johnson_Cook (*MAT_98) to represent the material nonlinearities and strain hardening in steel. The strain of each truss member (ε) can be obtained from the simulation directly, and the SR for a truss member can be calculated as
where εy is the yield strain of steel. Table 2 gives the defined limit states for the SR to qualify the ALPs of steel truss bridges. For the nonlinear dynamic analysis, the SR has a similar connotation as the displacement ductility ratio that is widely used in earthquake engineering. A limit state of SR ≤ 1 implies the elastic behavior at the component level, whereas a value of SR > 1.0 implies the inelastic response of a truss member.
Table 2.
The proposed limit states for ALP analysis using the SR metric.
Since truss members in a truss bridge may subject to both the axial force and bending moments, this paper employed *MAT_98 to investigate the structural behavior of a steel truss bridge following the loss of a critical member. This material model considers the stress–strain relationship by
where A, B, C and N are the input constants; εp is the effective plastic strain; ε* is the normalized effective strain rate. As seen from Equation (7), *MAT_98 considers the strain rate effect through the term ε*, although this effect may not be significant during the sudden removal of a truss member [3,4]. This material model considers material hardening nonlinearity by including the user-calibrated realistic material stress–strain curves. Moreover, this material model enables the users to calibrate the constitutive model parameters using the laboratory data without using a sophisticated numerical algorithm. A failure strain can be defined for the material as well define the failure of the structure.
The proposed generalized framework proposed in this paper to identify the critical members and to qualify the ALP redundancy of a steel truss bridge subjected to sudden member loss scenarios is shown in Figure 1. As seen in Figure 1, the flowchart mainly consists of 10 steps. For instance, in Step 1, finite element (FE) models of the truss bridge could be developed and validated based on the available geometric information and field measurements. In Step 2, a live load factor–displacement curve of the intact truss bridge was developed through the nonlinear push-down analysis in LS-DYNA. This curve provided the elastic displacement de (corresponding to yielding in the first primary truss member on the side truss) and the ultimate displacement du (corresponding to collapse of the bridge). Then, in Step 3, sudden MR analysis for each candidate truss member was investigated. Based on the symmetry in both the longitudinal and transverse directions, one quarter of the truss could be selected as a candidate for MR analysis, which was carried out by removing one truss member at a time to obtain the displacement–time history for each MR case. Both the peak and steady-state displacements and displacement ratios (with respect to the displacements de and du, respectively) for each MR case could be obtained. These displacement or displacement ratios were used to identify whether the member was a critical member or not in Step 4. Subsequently, a proper design metric was selected, such as the DCR and SR, in Step 5, and the corresponding desired limit states of the truss bridge could be defined in Step 6. Other possible design metrics, i.e., the internal forces, reactions, stresses, displacements, strains, and other demand or capacity metrics and combinations of any of the aforementioned metrics could also be candidates for the selected design metrics. In Step 7, a preliminary design of a truss bridge was obtained, within which all truss members satisfied the required limit states under base (normal) structural demands (i.e., service loads). The base load path was evaluated by the spectra of the design metrics selected in Step 5. Following that, after introducing changes into the target truss bridge (in Step 8), the new (or alternate) load path (ALP) of the damaged truss bridge could be evaluated according to the spectra of the selected design metrics in Step 9. An existing bridge may not satisfy the acceptance criteria defined in Step 8. Finally, in Step 10, we could check whether the spectra of the selected design metrics satisfied the desired limit states in Step 6. If not, further retrofit measures were needed to resist the changes to the bridge introduced in Step 8. Effectiveness of this framework would be verified using the I-35W truss bridge in the following subsections. Moreover, the proposed framework was also potential for other types of bridges with distinguished structural components, such as cable-stayed bridges and suspension bridges. Sudden loss of any stay cable or suspender could be the triggering events (i.e., changes introduced into the system in Step 8) to perform the relevant ALP redundancy analysis.

Figure 1.
Flowchart of the proposed framework for qualifying the ALP redundancy of steel truss bridges subjected to sudden member loss scenarios.
3. Case-Study Analysis: The I-35W Truss Bridge
3.1. Bridge Description, Modeling, and Validation of FE Models
The I-35W truss bridge, with a main span of 140 m and two side spans of 81 m each, collapsed on 1 August 2007, killing 13 and injuring 145 people. The cause of this failure was determined to be an under-designed gusset plate. Collapse of this bridge highlighted the safety concerns about steel truss bridges. This bridge was used for investigating the ALPs for long-span truss bridges in this study because of the detailed information available on its design and investigations. Most previous studies on this bridge focused mainly on the inadequate capacity of the undersized gusset plates at U10 [26,35,36,37,38]. However, the failure of the gusset plate at one joint is only a localized phenomenon. Unlike these previous studies on the collapse mechanisms of the I-35W truss bridge, this paper focused more on the global behavior under the sudden loss of a critical member.
Detailed FE models of the I-35W truss bridge were developed in SAP2000 and LS-DYNA. As shown in Figure 2, the bridge had 29 nodes along the upper chord (denoted by “U”) and 27 nodes along the bottom chord (denoted by “L”), and the lower chord nodes 1 (pier 5), 20 (pier 7), and 27 (pier 8) had roller supports, whereas node 8 (pier 6) had the hinge support. All truss members, bracings, and stringers were simulated by using ten Hughes–Liu (H-L) beam elements with *MAT_98 in LS-DYNA to consider the hardening in steel and buckling of the truss members. For buckling simulation, an initial imperfection of Δ = L/100 was added along the cross-sectional principal axes for all truss members, where L is the length of the truss member. Overall, the FE model of the bridge in LSDYNA had 12,490 beam elements. The reinforced concrete (RC) deck was simulated by using shell elements with material model *MAT_CONCRETE_EC2 (*MAT_172) in LS-DYNA to consider the failure of the deck system, and the LS-DYNA model of the bridge had approximately 0.5 million shell elements. The model in SAP2000 was similar to the LS-DYNA model, except for the equivalent nodal weight assigned at the deck stringers in SAP2000 instead of the shell elements in LS-DYNA. All truss members were simulated using frame elements and were assigned elastic material properties. The deck was not simulated in SAP2000. However, dead loads (DLs) of the RC deck and live loads (LLs) were applied at truss joints appropriately to include the effect of deck weight on the bridge. Nodal rigid body constraints were applied for the deck, transverse stringers, and a floor truss system to consider the connection between these three systems. All joints in SAP2000 and LS-DYNA models were treated as rigid. Geometrical, cross-sectional, and material properties for the FE models were obtained from the available shop drawings and reports [35].

Figure 2.
FE models of the I-35W truss bridge developed in SAP2000 and LS-DYNA: (a) 2D SAP2000 model, (b) 3D SAP2000 model, (c) 3D LS-DYNA model.
Ocel and Wright [35] performed a detailed estimation of DLs on the bridge. The original average thickness of the concrete deck was 165.1 mm, and it increased by 50.8 mm after the rehabilitations in 1977 and again substantially in 1998. Table 3 shows the DLs for the main span of the bridge from Ocel and Wright [35], where DL_1965 represents the DLs after the construction of the bridge in 1965, and DL_2007 represents the DLs in 2007 (before the collapse of the bridge but not including the construction loads at the time of collapse). As seen from Table 3, the DLs increased by approximately 24% from 1965 to 2007. In addition, according to AASHTO [29], live load is a combination of lane load with a magnitude of 0.87 kN/m and standard truckload. Since the I-35W truss bridge was a long-span truss bridge where the truck effect was negligible, only the lane load with a multilane presence factor was applied to simplify the loading scenarios. Moreover, accuracy of the FE models developed in SAP2000 and LS-DYNA could be validated by comparing the support vertical reactions, nodal vertical displacements, and the truss members’ axial forces, which were introduced in detail in Li [4]. For example, Figure 3 shows comparisons of the vertical displacements of the I-35W truss bridge obtained from the developed FE models in SAP2000 and LS-DYNA. In addition, Table 4 summarizes the support reactions of the I-35W truss bridge under the load case DL_1965. The aforementioned introductions regarding the basic information and FE modeling of the I-35W truss bridge could be treated as Step 1 in the proposed framework, as shown in Figure 1.
Table 3.
Dead loads (DLs) on the I-35W truss bridge.

Figure 3.
Comparison of the vertical displacement of the FE models in SAP2000 and LS-DYNA of the I-35W truss bridges under the load case DL_1965: (a) 2D model and (b) 3D model.
Table 4.
Support reactions of the I-35W truss bridge under the load case DL_1965. (Unit: kN.)
3.2. Push-Down Analysis of the Intact I-35W Truss Bridge
This part could be considered as Step 2 in the proposed framework as shown in Figure 1. Nonlinear push-down analysis could be performed based on the LS-DYNA model. The force-based control option was used, and the control node for the load-displacement curve was selected to be the node of the bridge at which the maximum vertical displacement was measured. Table 5 defines the construction stages for the nonlinear dynamic push-down analysis of the intact truss bridge. Construction stages could be defined by using the keywords *Control_Staged_Construction and *Define_Construction_Stages in LS-DYNA [39].
Table 5.
Defined construction stages for the push-down analysis of the intact I-35W truss bridge.
As seen from Table 5, there were four different construction stages. For instance, to be consistent with the practical construction sequence, for a long-span steel truss bridge, the deck should be cast when the bridge’s steel structural system is built. Thus, in stage 1, the self-weight of the steel structural system was applied to the structure. Then, the stiffness of the deck was increased to the actual stiffness of the RC deck system in stage 2. This procedure could be defined by using the keyword *Load_Stiffen_Part in LS-DYNA. After changing the elastic material models of the deck and steel members into the nonlinear material models (*MAT_172 and *MAT_98) and changing the global damping (Relay damping) to the critical level (2%) in stage 3, push-down analysis of the intact I-35W truss bridge was conducted by increasing the live load factor by 0.1 per second in stage 4. Thus, after the dynamic push-down analysis, the live load factor–displacement curve of the intact I-35W truss bridge could be developed as shown in Figure 4. The load combinations for the nonlinear dynamic push-down analysis can be expressed as
where α represents the live load (LL) factor. As observed from Figure 4, the live load factor–displacement curve was linear from the beginning to the first diagonal member L17/U18 yield, which had a live load factor α equal to 7.31. In addition, the displacement corresponding to this specific point (blue solid dot) was defined as the elastic displacement de, which was equal to 440.64 mm. During the simulation, the yielded diagonal member U10/L11 was found at the upper chord joint U10, where many previous studies have suggested that the failure of the gusset plate located at this joint resulted in the tragic collapse of the I-35W truss bridge. Thus, this observation was consistent with the conclusions drawn by many previous studies [26,35,36,37,38]. Afterward, the live load factor–displacement curve entered the nonlinear range, and as the live load increased, the bridge tended to have a large deformation, and the bridge’s global stiffness decreased significantly. Finally, the displacement du was defined as the ultimate displacement corresponding to the point when the bridge collapsed (1% stiffness).

Figure 4.
Live load factor–displacement curve of the intact I-35W truss bridge developed using the nonlinear dynamic push-down analysis in LS-DYNA.
3.3. MR Analysis of the Damaged I-35W Truss Bridge
Similarly, this part could be considered as Step 3 in the proposed framework, as shown in Figure 1. To identify the critical members, the I-35W truss bridge was analyzed assuming different damage scenarios. Since the bridge was symmetric in both the longitudinal and transverse directions, a total of 74 MR cases (primary members on the side truss) were investigated for one-fourth of the bridge. Damage in all four types of truss members was considered: (1) the upper chords (UC); (2) the lower chords (LC); (3) the diagonal members (DM); and (4) the vertical members (VM) on the side truss. MR analysis was performed by removing one entire member at a time. Similar to the defined construction stages in the nonlinear dynamic push-down analysis, Table 6 defines the required construction stages used for the following MR analyses. Thus, after the MR cases were analyzed, the displacement time-histories for different truss members could be developed. For example, Figure 5 shows the displacement time-history curves obtained from the removal of two diagonal members.
Table 6.
Defined construction stages for MR analysis of the I-35W truss bridge.
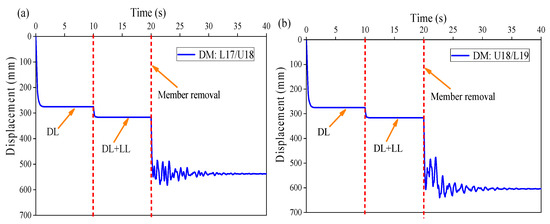
Figure 5.
Displacement time-histories of the diagonal members: (a) DM: L17/U18, (b) DM: U18/L19.
As seen in Figure 5, the representative displacement time-history curve consisted of three different ranges as the defined construction stages in Table 6. For example, from the beginning to 10 s, this displacement was due to the DL only. The vertical displacement due to DL was 275.08 mm, which was consistent with that from the linear static analysis in SAP2000. Then, from 10 to 20 s, this displacement under the service load (DL + LL) was 316.18 mm, which also agreed well with that from the linear static analysis in SAP2000. Finally, after each member was removed entirely at 20 s, the entire structure underwent dynamic vibration with a peak dynamic amplitude, and this vibration damped out after a few seconds, and the structure gradually reached a new steady state (stable).
3.4. Identification of the Critical Members
Likewise, this part could be considered as Step 4 in the proposed framework as shown in Figure 1. Based on the investigated MR cases, the peak and steady-state dis-placements as well as the corresponding displacement ratios and the dynamic factors for different MR cases could be obtained. Among these investigated MR cases, 11 MR cases tended to have larger displacement responses after the members were removed, and a value of 0.9 for the displacement ratio was defined as the threshold value in the present study to classify a member as critical, i.e., any member with a displacement ratio greater than or equal to 0.9 should be classified as a critical member. Thus, 11 members as given in Table 7 could be identified as critical members for the I-35W truss bridge (i.e., locations of these members are also illustrated in the figure in the following Section 4.2) and would be investigated in the following subsections.
Table 7.
MR cases for the I-35W truss bridge.
4. ALP Analysis of the I-35W Truss Bridge
4.1. As-Built Bridge and Design Bridge
Figure 6 shows the DCR spectra for the as-built I-35W truss bridge under the service load (DL + LL). In this figure, members with a DCR less than 1.0 are shown in black solid lines, and those with a DCR greater than 1.0 are shown in red dotted lines. A DCR of 1.0 implied that the stress in the member was at the design limit corresponding to the design stress, 0.9σy, while a DCR of 1.67 indicated that the stress in the member was at yield stress, σy. It can be observed from Figure 6 that some diagonal and lower chord members close to the bridge supports had a DCR larger than 1.0, which implied that the stresses due to the service load in these members were more than the design stress (0.9σy). This was probably because the DLs on the bridge from 1965 to 2007 increased by 24% after the rehabilitations in the 1970s and 1980s. However, no members had a DCR greater than 1.67, which means that all members were in the elastic range under the service load.

Figure 6.
DCR spectra for the as-built bridge under the service load (DL + LL).
For a bridge that has been designed to support the service load, the DCR for all members should be less than 1.0. Since the objective of the present study was to investigate the ALP redundancy in a well-designed steel truss bridge, a retrofit of the truss members with a DCR greater than 1.0 was performed by strengthening the member (by changing the I-section to a box section and by increasing the cross-sectional area) so that the DCR of all truss members became 0.9. This has been conducted so that change in the DCR of members after the removal of a critical member could be quantified easily (with respect to a uniform value of 0.9). After the strengthening, this bridge model was designated as “Design Bridge”. Retrofits by using member strengthening led to an increase in the weight of the steel by only 2.65%. Comprehensive ALP analyses were performed for the “Design Bridge” in the following subsections. The identified critical members are shown in Table 7. MR analyses were investigated in the SAP2000 model with linear static analysis for the DCR and in the LS-DYNA model with nonlinear dynamic analysis for SR metrics under the load combination given in Equation (1) (Step 5 in Figure 1).
4.2. Linear Static Analysis: DCR-Based Metric
Since the I-35W truss bridge was both symmetrical along the longitudinal and transverse directions, 11 MR cases are drawn on one-fourth of the bridge, which is the southern part of the west side girder truss, as shown in Figure 7. MR scenario in SAP2000 was implemented by analyzing two separate states of the structure: before and after the loss of the member. In LS-DYNA, MR analyses were performed by assigning a specific part and time interval by using the keyword *Load_Remove_Part.

Figure 7.
Locations of critical members for MR analyses in one-fourth of the I-35W truss bridge on the west side truss.
To investigate the global behavior of the truss bridge following the sudden loss of a critical member, the DCR spectra of the “Design Bridge” and its subcomponents for these MR cases in Table 7 and Figure 7 could be developed. For instance, for MR case 3 (removal of diagonal member U18/L19), the DCR spectra of the bridge are shown in Figure 8, because it has the maximum displacements or displacement ratios as shown in Table 7. Removal of this diagonal member might lead to load redistribution in the damaged bridge system and to an increase in the demand of the main truss members close to the damaged zone on the same (west) side truss, whereas the effect was less significant on members of the truss on the opposite (east) side. Since the member loss event was a localized phenomenon, damage to other members was concentrated around the removed member. The removed diagonal member U18/L19, as the web member, disrupted the normal load path of the steel truss bridge. In addition, as seen from Figure 8, apart from those members that were close to the damaged member, there were also several members of the upper braces and lower braces that had a DCR larger than 1.67. This indicated that these members may yield following the loss of this diagonal member.

Figure 8.
DCR spectra for the “Design Bridge” for MR case 3 (removal of diagonal member U18/L19).
Moreover, a complete envelope of the DCR spectra could be developed to show the ALP of the entire steel truss bridge. DCR values for truss members of the truss bridge for these 11 MR cases could be tabulated following the analysis of all member loss cases (this procedure was the same as MR case 3 discussed above), and a DCR value for a particular member was selected to be the largest DCR for that member among 11 MR cases. This process was mirrored in both the longitudinal and transverse directions to consider the MR events at the symmetric spots for the north end of the east side truss. Boundary conditions of roller and fixed support at joints 8 and 20, respectively, had a negligible effect on these results. Figure 9 shows the complete envelope for the entire truss bridge that could be used to identify members to be retrofitted to provide effective ALP to satisfy the design limit using the DCR metric. Some of the members, illustrated by a dashed dotted (red) line in this figure, were part of the ALP and were likely to yield following the removal of any member of the truss bridge. After these members highlighted by the red dash dotted line were retrofitted, all members of the truss would stay in the elastic range following the removal of any member of the retrofitted bridge. Thus, the developed envelope of the DCR spectra as shown in Figure 9 could be used as the quantification of ALP spectra of the steel truss bridge from an effective retrofit perspective. Further retrofit studies conducted based on this quantification of ALP spectra of the I-35W truss bridge are investigated in detail in [4].

Figure 9.
Complete envelope of the DCR spectra for the “Design Bridge” representing 44 MR cases (11 MR cases in each one-fourth of the truss bridge).
4.3. Nonlinear Dynamic Analysis: SR-Based Metric
Similar to the ALP analysis based on the DCR metric, nonlinear dynamic response of the structure under the MR events could be captured from the force and displacement time-histories in LS-DYNA. For instance, Figure 10 shows the vertical displacement time- histories of node 18 on the west-side truss (damaged) and node 18′ on the east-side truss (undamaged) for the MR case 3. As seen from Figure 10, the vertical displacement of nodes 18 and 18′ at the end of the dynamic relaxation (DR) phase (i.e., before the MR event) was 129.57 mm. After the removal of diagonal member U18/L19 at 6 s, the bridge underwent dynamic vibration with a peak dynamic amplitude of 698.81 mm at node 18. However, this vibration would damp out after a few seconds, and the structure gradually reached a new steady state of the damaged structure (structure with the member U18/L19 removed) with a steady-state vertical displacement of 580.78 mm at node 18. Although the truss on the east side also underwent dynamic vibration, the magnitude of the vertical displacement was significantly lower with a steady-state displacement of 223.44 mm. Larger permanent displacement on the damaged side (west side) truss implied that the dynamic effect was more significant in the side truss with the removed diagonal member. Moreover, larger peak and steady-state vertical displacements in the west side truss (compared to that in the east side truss) also exhibited a tendency of torsional rotation about the bridge’s longitudinal axis.

Figure 10.
Nodal vertical displacement time-histories for MR case 3 (removal of diagonal member U18/L19).
In addition, Figure 11 shows the axial force time-histories for lower chords L18/L19 in the west side truss (damaged) and L18′/L19′ in the east side truss (undamaged) for MR case 3. Similar to the displacement time-histories in Figure 10, member’s axial force also had a dynamic effect. For the lower chord L18/L19 on the damaged side truss, the compressive force was 3713.92 kN before the removal of diagonal member U18/L19. After the member loss, this force increased to the peak dynamic value of 10,773.57 kN before reaching a steady-state value of 8619.74 kN. Similarly, after the member loss of member U18/L19, the axial force in member L18′/L19′ on the undamaged side truss increased from 3713.92 kN to the peak dynamic value of 4342.71 kN and then reached a final steady-state value of 2594.11 kN.

Figure 11.
Axial force time-histories for the lower chords for MR case 3 (removal of diagonal member U18/L19).
During the simulations of the dynamic MR events in LS-DYNA, no buckling behavior was found for the truss members. However, to demonstrate, the nonlinear dynamic LS-DYNA model of the bridge could be used to simulate the buckling behavior of the truss member by reducing the cross-sectional area of a vertical member next to the damaged location (removal of diagonal member U18/L19), and this MR event was considered again. After the numerical simulation, the axial force contour as shown in Figure 12 was obtained, and it could be observed that the selected vertical member and a lower brace buckled (e.g., Euler buckling). In addition, the axial force time-histories of the buckled vertical member and the lower brace (in Figure 12) are shown in Figure 13. As observed from Figure 13a, for the selected vertical member, the calculated critical force by using the analytical formula () was 6825.80 kN, whereas that obtained from the numerical analysis was 6795.15 kN. Thus, the difference between the analytical computed critical force and that from the LS-DYNA model was only 0.45%, which is acceptable for the engineering community. After the vertical member reaches the critical force of 6795.15 kN, which was less than the yielding force (11,661 kN), this member began to not sustain the force and then failed. Similarly, as seen from Figure 13b, for the lower brace, the analytical calculated critical force was 3338.37 kN, while that from the LS-DYNA model was 3304.22 kN. The difference in the obtained critical force for the lower brace was approximately 1.03%, which is also acceptable.

Figure 12.
Axial force contour of the truss bridge under MR case 3 (removal of diagonal member U18/L19).

Figure 13.
Axial force time-histories of the vertical member and lower brace under MR Case 3 (removal of diagonal member U18/L19): (a) vertical member and (b) lower brace.
Furthermore, the SR spectra of the “Design Bridge” and its subcomponents for these MR cases could also be developed. Similar to the complete envelope of DCR spectra of the I-35W truss bridge as shown in Figure 9, Figure 14 shows the complete envelope of the SR spectra for the entire truss bridge. This complete envelope could be used to identify members to be retrofitted to provide effective ALP to satisfy the defined design limits using the SR metric. Detailed results could be referred to Li [4]. All members had an SR less than 4.0. Some members with an SR larger than 2.0 in this figure indicated that they had undergone yielding and might need to be retrofitted to ensure the elastic limit state under the sudden loss of any member. If the desired performance level was to have an SR less than 2.0, then the truss bridge was regarded as capable to provide sufficient ALP and without the additional retrofits needed.

Figure 14.
Complete envelope of the SR spectra for the “Design Bridge” representing 44 MR cases (11 MR cases in each one-fourth of the truss bridge).
5. Conclusions
This paper proposed an integrated framework to identify the critical members and to qualify the alternate load path (ALP) redundancy of steel truss bridges against the sudden loss of a critical member in terms of the DCR for linear static analysis and SR for nonlinear dynamic analysis. Effectiveness of the proposed framework was demonstrated through the ALP redundancy analysis of the I-35W truss bridge, which was a famous collapsed steel truss bridge due to localized damage. The proposed framework was demonstrated to be simple and straightforward for the bridge design community to use and target certain desired performance levels. In addition, a simplified modeling approach for truss members was suggested by using the Hughes–Liu beam formulation in LS-DYNA. The suggested modeling approach was found to be computationally efficient in identifying the critical members for steel truss bridges through nonlinear dynamic analysis, and it was also demonstrated to be effective and accurate in simulating both the yielding and buckling behavior of truss members following the sudden removal of a critical member. Results obtained from the present study may provide significant guidance for future studies on the protection of steel truss bridges that are vulnerable to progressive collapse results from sudden member loss scenarios. Furthermore, the proposed framework in identifying the critical members and qualifying the ALP redundancy was also potential for other types of bridges with distinguished structural components, such as cable-stayed bridges and suspension bridges. Sudden loss of any stay cables or suspenders could be treated as the triggering events to perform the relevant ALP redundancy analysis in cable-stayed bridges and suspension bridges. Therefore, this study could provide beneficial information for the design community and could serve as a good reference for the protection of long-span highway bridges that are vulnerable to sudden member loss scenarios and progressive collapse.
Although effectiveness of the proposed framework in identifying the critical members and qualifying the ALP redundancy of steel truss bridges were demonstrated by using the I-35W truss bridge through detailed FE models, there were some limitations that need to be further addressed. For example, the joints simulated in the current numerical modeling were assumed to be rigid and of infinitesimal size. Detailed simulations of critical truss joints and gusset plates with finer shell or solid elements should be further performed to examine the stress distributions and strain levels. In addition, the defined limit states and performance levels may also need to be further refined according to detailed experimental and numerical studies, and more advanced retrofit strategies based on the ALP analyses should be developed for bridge design community use in the future. Moreover, according to several previous studies [40,41], for the previously designed steel truss bridges subjected to corrosion problems (i.e., chloride-induced corrosion), the corrosion along the steel truss members may result in the reduction of the cross-section area of the steel members and further induce considerable axial force redistributions in these truss members. As a consequence, these deteriorated and damaged critical members may initialize localized damage (e.g., sudden member failure scenarios) and then trigger a progressive collapse of steel truss bridges. Thus, the aforementioned corrosion problems further highlight the necessity in identifying the critical members and improving the ALP redundancy of those aging steel truss bridges to protect them from progressive collapses.
Author Contributions
Conceptualization, H.L. and L.S.; methodology, H.L.; software, H.L.; validation, H.L., L.S. and S.D.; formal analysis, H.L.; investigation, H.L. and S.D.; resources, H.L., L.S. and S.D.; data curation, H.L.; writing—original draft preparation, H.L.; writing—review and editing, H.L.; visualization, L.S.; supervision, H.L. and L.S.; project administration, L.S. and S.D.; funding acquisition, L.S. and S.D. All authors have read and agreed to the published version of the manuscript.
Funding
This research was funded by the National Natural Science Foundation of China (Grant No. 52108211); the Training Program for Excellent Young Innovators of Changsha of China (Grant No. kq1905005); Hunan Provincial Department of Education (No. 21B0188); and the Natural Science Foundation of Hunan Province (No. 2022JJ40186).
Data Availability Statement
Not applicable.
Acknowledgments
The research described in this paper was supported by the National Natural Science Foundation of China (grant No. 52108211); the Training Program for Excellent Young Innovators of Changsha of China (grant No. kq1905005); Hunan Provincial Department of Education (No. 21B0188); and the Natural Science Foundation of Hunan Province (No. 2022JJ40186). The authors greatly acknowledge their financial supports.
Conflicts of Interest
The authors declare no conflict of interest.
References
- Ellingwood, B.R. Mitigating risk from abnormal loads and progressive collapse. J. Perform. Constr. Facil. 2006, 20, 315–323. [Google Scholar] [CrossRef]
- Naji, A.; Ghiasi, M.R. Progressive collapse analysis of cable-stayed bridges. J. Fail. Anal. Prev. 2019, 19, 698–708. [Google Scholar] [CrossRef]
- Agrawal, A.K.; Mohammed, E.; Chen, X.; Li, H.H.; Wang, H.F. Steel Truss Retrofits to Provide Alternate Load Paths for Cut or Blast-Damaged or Destroyed Members; Rep. No. FHWA-HRT-20-055; FHWA: McLean, VA, USA, 2020. [Google Scholar]
- Li, H.H. Alternate Load Paths and Retrofits for Long-Span Truss Bridges under Sudden Member Loss and Blast Loads. Ph.D. Thesis, Department of Civil Engineering, City College of New York, City University of New York, New York, NY, USA, 2021. [Google Scholar]
- Kiakojouri, F.; De Biagi, V.; Chiaia, B.; Sheidaii, M.R. Progressive collapse of framed building structures: Current knowledge and future prospects. Eng. Struct. 2020, 206, 110061. [Google Scholar] [CrossRef]
- El-Tawil, S.; Khandelwal, K.; Kunnath, S.; Lew, H.S. Macro models for progressive collapse analysis of steel moment frame buildings. In Structural Engineering Research Frontiers; ASCE: Long Beach, CA, USA, 2007. [Google Scholar]
- EI-Tawil, S.; Li, H.H.; Kunnath, S. Computational simulation of gravity-induced progressive collapse of steel-frame buildings: Current trends and future research needs. J. Struct. Eng. 2014, 140, A2513001. [Google Scholar] [CrossRef]
- Byfield, M.; Mudalige, W.; Morison, C.; Stoddart, E. A review of progressive collapse research and regulations. Proc. Inst. Civ.-Eng.-Struct. Build. 2014, 167, 447–456. [Google Scholar]
- Qian, K.; Li, B. Research advances in design of structures to resist progressive collapse. J. Perform. Constr. Facil. 2015, 29, B4014007. [Google Scholar] [CrossRef]
- Adam, J.M.; Parisi, F.; Sagaseta, J.; Lu, X.Z. Research and practice on progressive collapse and robustness of building structures in the 21st century. Eng. Struct. 2018, 173, 122–149. [Google Scholar] [CrossRef]
- Stochino, F.; Bedon, C.; Sagaseta, J.; Honfi, D. Robustness and resilience of structures under extreme loads. Adv. Civ. Eng. 2019, 4291703. [Google Scholar] [CrossRef]
- Chen, Q. Structural Robustness of Long-Span Cable-Supported Bridges. Ph.D. Thesis, Department of Civil Engineering, City College of New York, City University of New York, New York, NY, USA, 2021. [Google Scholar]
- GSA (General Services Administration). Progressive Collapse Analysis and Design Guidelines for New Federal Office Buildings and Major Modernization Projects; GSA: Washington, DC, USA, 2003. [Google Scholar]
- GSA (General Services Administration). Progressive Collapse Analysis and Design Guidelines for Progressive Collapse Resistance; GSA: Washington, DC, USA, 2016. [Google Scholar]
- DOD. Unified Facilities Criteria: Design of Buildings to Resist Progressive Collapse; Rep. No. UFC4-023-03; United States Department of Defense: Washington, DC, USA, 2009. [Google Scholar]
- Lee, G.C.; Mohan, S.; Huang, C.; Fard, B.N. A Study of US Bridge Failures (1980–2012); Technical Report 13-0008; MCEER: Buffalo, NY, USA, 2013. [Google Scholar]
- Fisher, J.W.; Roberts, R.; Pense, A.W. Evaluation of fracture of Lafayette Street bridge. J. Struct. Div. 1977, 103, 1339–1357. [Google Scholar] [CrossRef]
- Beauchamp, J.C.; Chan, M.Y.T.; Pion, R.H. Repair and evaluation of a damaged truss bridge—Lewes, Yukon River. Can. J. Civ. Eng. 1984, 11, 494–504. [Google Scholar] [CrossRef]
- Jelinek, J.J.; Bartlett, F.M. Material properties of historical bridge steel. In Proceedings of the 30th Annual Conference of the Canadian Society of Civil Engineering, Canadian Society for Civil Engineering, Montreal, QC, Canada, 5–8 June 2002. [Google Scholar]
- Diggelmann, L.M.; Connor, R.J.; Sherman, R.J.; Beshah, F. Evaluation of Member and Load-Path Redundancy on the US-421 Bridge over the Ohio River; Rep. No. FHWA-HRT-13-105; FHWA: McLean, VA, USA, 2013. [Google Scholar]
- Cha, H.; Lyrenmann, L.; Connor, R.J.; Varma, A.H. Experimental and Numerical Evaluation of the Postfracture Redundancy of a Simple Span Truss Bridge. J. Bridge. Eng. 2014, 19, 04014048. [Google Scholar] [CrossRef]
- Connor, R.J.; Bonachera Martín, F.J.; Varma, A.; Lai, Z.; Korkmaz, C. Fracture-Critical System Analysis for Steel Bridges; (No. Project 12-87A); FHWA: McLean, VA, USA, 2018. [Google Scholar]
- Lin, C.S. Deterioration Effects on Progressive Collapse of Bridges. Ph.D. Thesis, Department of Civil Engineering, Columbia University, New York, NY, USA, 2019. [Google Scholar]
- Lichtenstein, A.G. The silver bridge collapse recounted. J. Perform. Constr. Facil. 1993, 7, 249–261. [Google Scholar] [CrossRef]
- Cho, H.N.; Lim, J.K.; Choi, H.H. Reliability-based fatigue failure analysis for causes assessment of a collapsed steel truss bridge. Eng. Fail. Anal. 2001, 8, 311–324. [Google Scholar] [CrossRef]
- Hao, S. I-35W bridge collapse. J. Bridge Eng. 2010, 15, 608–614. [Google Scholar] [CrossRef]
- Grub, M.A.; Wilson, K.E.; White, C.D.; Nickas, W.N. Load and Resistance Factor Design (LRFD) for Highway Bridge Superstructures–Reference Manual; Rep. No. FHWA-NHI-15-047; FHWA: Washington, DC, USA, 2015. [Google Scholar]
- AASHTO. AASHTO LRFD Bridge Design Specifications, 8th ed.; AASHTO: Washington, DC, USA, 2017. [Google Scholar]
- AASHTO. AASHTO LRFD Bridge Design Specifications, 9th ed.; AASHTO: Washington, DC, USA, 2020. [Google Scholar]
- Lwin, M. Clarification of Requirements for Fracture Critical Members, FHWA Memorandum HIBT 10; Federal Highway Administration: Washington, DC, USA, 2012. [Google Scholar]
- AASHTO. Analysis and Identification of Fracture Critical Members and System Redundant Members; AASHTO: Washington, DC, USA, 2018. [Google Scholar]
- AASHTO. Guide Specifications for Internal Redundancy of Mechanically-Fastened Built-Up Steel Members; AASHTO: Washington, DC, USA, 2018. [Google Scholar]
- ASCE (American Society of Civil Engineers). Minimum Design Loads for Buildings and Other Structures; American Society of Civil Engineers: Reston, VA, USA, 2013. [Google Scholar]
- AISC. Specifications for Structural Steel Buildings; AISC: Chicago, IL, USA, 2016. [Google Scholar]
- Ocel, J.M.; Wright, W.J. Finite Element Modeling of I-35W Bridge Collapse-Final Report; Turner-Fairbank Highway Research Center, Federal Highway Administration: Washington, DC, USA, 2008. [Google Scholar]
- Astaneh-Asl, A. Progressive collapse of steel truss bridges, the case of I-35W collapse. In Proceedings of the 7th International Conference on Steel Bridges, Guimarăes, Portugal, 4–6 June 2008. [Google Scholar]
- Liao, M.; Okazaki, T.; Ballarini, R.; Schultz, A.E.; Galambos, T.V. Nonlinear finite-element analysis of critical gusset plates in the I-35W Bridge in Minnesota. J. Struct. Eng. 2011, 137, 59–68. [Google Scholar] [CrossRef]
- Higgins, C.; Dusicka, P.; Scott, M. Experimental Tests and Numerical Analyses of Steel Truss Bridge Gusset Connections; Rep. No. OTREC-RR-12-03; OTREC: Portland, OR, USA, 2012. [Google Scholar]
- Hallquist, J.O. LS-DYNA Keyword User’s Manual, Version 971; Livermore Software Technology Corporation: Livermore, CA, USA, 2014. [Google Scholar]
- Chang, K.-C.; Kim, C.-W. Modal-parameter identification and vibration-based damage detection of a damaged steel truss bridge. Eng. Struct. 2016, 122, 156–173. [Google Scholar] [CrossRef]
- Bonopera, M.; Chang, K.-C.; Chen, C.-C.; Lin, T.-K.; Tullini, N. Bending tests for the structural safety assessment of space truss members. Int. J. Space Struct. 2018, 33, 138–149. [Google Scholar] [CrossRef]


Publisher’s Note: MDPI stays neutral with regard to jurisdictional claims in published maps and institutional affiliations. |
© 2022 by the authors. Licensee MDPI, Basel, Switzerland. This article is an open access article distributed under the terms and conditions of the Creative Commons Attribution (CC BY) license (https://creativecommons.org/licenses/by/4.0/).