Article

Wind-Induced Response Characteristics and Equivalent Static Wind-Resistant Design Method of Spherical Inflatable Membrane Structures

1
School of Civil Engineering and Architecture, Northeast Electric Power University, Jilin 132012, China
2
Key Lab of Electric Power Infrastructure Safety Assessment and Disaster Prevention of Jilin Province, Northeast Electric Power University, Jilin 132012, China
3
Beijing Power Transmission & Transformation Corporation, Haotian Street, Liangxiang Town, Fangshan District, Beijing 102401, China
4
Key Lab of Structures Dynamic Behavior and Control (Harbin Institute of Technology), Ministry of Education, Harbin 150090, China
5
Tianjin Research Institute for Water Transport Engineering, Ministry of Transport of People’s Republic of China, Tianjin 300456, China
*
Author to whom correspondence should be addressed.
Buildings 2022, 12(10), 1611; https://doi.org/10.3390/buildings12101611
Submission received: 11 September 2022 / Revised: 28 September 2022 / Accepted: 30 September 2022 / Published: 5 October 2022
(This article belongs to the Section Building Structures)

Abstract

:
The wind-induced responses and wind-resistant design method of spherical inflatable membrane structures are presented in this paper. Based on the wind pressure data obtained from wind tunnel experiments, the characteristics of wind-induced responses are studied via nonlinear dynamic time–history analysis, considering the influences of spans, rise–span ratios, internal pressures, wind velocities, and cable configurations. The results show that with the increment of wind velocity, the position of the maximum displacement changes from the top to the windward region, which usually leads to the exceedance of the displacement limitation. Under high wind velocity, enhancing the internal pressure can effectively reduce deflection. However, the membrane stress will also increase. Particular attention should be paid to checking the strength. The restraint effect of cross cables on wind-induced response is better than radial cables. Furthermore, an equivalent static analysis method for the wind-resistant design of spherical inflatable membrane structures is developed. The empirical formulas and recommendation values of gust response factors and nonlinear adjustment factors are provided for engineering reference.

1. Introduction

Recently, spherical inflatable membrane structures have been widely used in the exhibition centers, warehouses, etc. [1]. The membrane structures are usually light-weighted with a low natural frequency. It will produce large deformation and vibration under wind load, and there is an obvious nonlinear relationship between the load and response [2]. As a result, they are typical wind-sensitive structures. Investigations on the wind-induced response characteristics of spherical inflatable membrane structures in the design stage are highly desired. As illustrated in Figure 1a, these structures are usually composed of the membrane, cables, inflator, and foundation. The membrane is fixed on the foundation peripherally to form a closed space. The air is injected into the closed space by an inflator to obtain the tension of the membrane. Generally, the cables are installed outside the membrane to avoid stress concentration on the membrane [3,4]. There are two typical configurations of cables, which are cross cables (Figure 1b) and radial cables (Figure 1c).
For spherical inflatable membrane structures, extensive investigations have been carried out on the wind load distribution characteristics. For example, through the wind tunnel experiments, Uematsu and Yamamura [5] studied the wind pressure distributions on domed free roofs with rise–span ratios ranging from 0.1 to 0.4. They proposed the peak wind force coefficients for the design of cladding/components. Cheon et al. [6,7] investigated the wind pressure characteristics of spherical domes with a central opening. Taylor [8] analyzed the effects of height to diameter ratios and Reynolds numbers on wind pressure distribution through wind tunnel experiments. He indicated that for the flow of high turbulence intensity (>15%), the wind pressure becomes insensitive to the Reynolds number at Reynolds numbers above 1.7 × 10⁵. Chen and Fu [9] also studied the effect of Reynolds number on wind pressure of spherical domes. Srivastava and Turkkan [10] compared the wind pressure of the rigid and flexible models. In addition, they predicted steady state wind pressure coefficients for air-supported cylindrical and hemispherical membranes by exploiting the technique of neural network [11]. Uematsu and Tsuruishi [12] proposed a wind load assessment method based on an aerodynamic database, an artificial neural network (ANN), and a time–series simulation technique.
It is important but difficult to evaluate the wind-induced responses in structural design appropriately. At present, the dynamic response of membrane structure is mainly studied by aeroelastic model experiments, in situ measurement, and numerical analysis [13,14,15,16,17,18]. Based on the wind tunnel experiments on aeroelastic models, Kassem and Novak [19] investigated the deflection characteristics of spherical inflatable membrane structures under different terrains, wind velocities, and internal pressures. Rizzo et al. [20] measured the damping ratio and natural frequency of the tensile structure with a hyperbolic paraboloid roof under wind load. Yin et al. [21] monitored wind-induced response data of a long-span strip inflatable membrane structure for two years. The wind pressure, deformation, and cable tension strain of the structure under typhoon Lekima are obtained and analyzed. In fact, the aeroelastic model experiment and in situ measurement are difficult to realize because of the difficulty in the similarity of models and excessive monitoring period. Therefore, numerical analysis methods are favored by researchers. Takadate and Uematsu [22] used large-eddy simulation to investigate the effects of vibration frequency on the pressure distribution and unsteady aerodynamic forces on a long-span membrane structure. Michalski et al. [23] introduced a simulation method considering the fluid–structure interaction effects to study the wind-induced response of umbrella-shaped tensile membrane structures. Huang et al. [24] and Kandel et al. [25] evaluated the wind-induced response of spoke-wise cable–membrane structures and oval-shaped arch-supported membrane structures by nonlinear dynamic time–history analysis, respectively.
In summary, nonlinear dynamic analysis is a common method to evaluate the wind-induced responses of membrane structures. However, this method is complex, and the calculation process is too tedious for ordinary designers to master. In comparison, the equivalent static analysis method appears more practically applicable for designers. Huang et al. [24] and Kandel et al. [25] gave the recommended values of gust response factors for spoke-wise cable–membrane structures and oval-shaped arch-supported membrane structures, respectively. This research provides guidance for the wind-resistant design of membrane structures.
The spherical shape is one of the most widely used shapes for inflatable membrane structures. However, research on the wind-induced response characteristics and equivalent static wind-resistant design methods for spherical inflatable membrane structures is still lacking. To address this issue, this paper presents an equivalent static wind-resistant design method of spherical inflatable membrane structures. The wind experiments for spherical inflatable membrane structures are presented in Section 2. Section 3 shows the method of wind-induced response analysis and data processing. Subsequently, the parametric influences of rise–span ratio, internal pressure, span, and cable configuration on the wind-induced responses are investigated and discussed in Section 4. Based on the characteristics of wind-induced responses, an equivalent static wind-resistant design method for spherical inflatable membrane structures is presented in Section 5. The recommendation values of the gust response and nonlinear adjustment factors are obtained through statistical analysis, thus providing guidance for the wind-resistant design of practical engineering.

2. Wind Tunnel Experiment

2.1. Summarization of Engineering Configurations

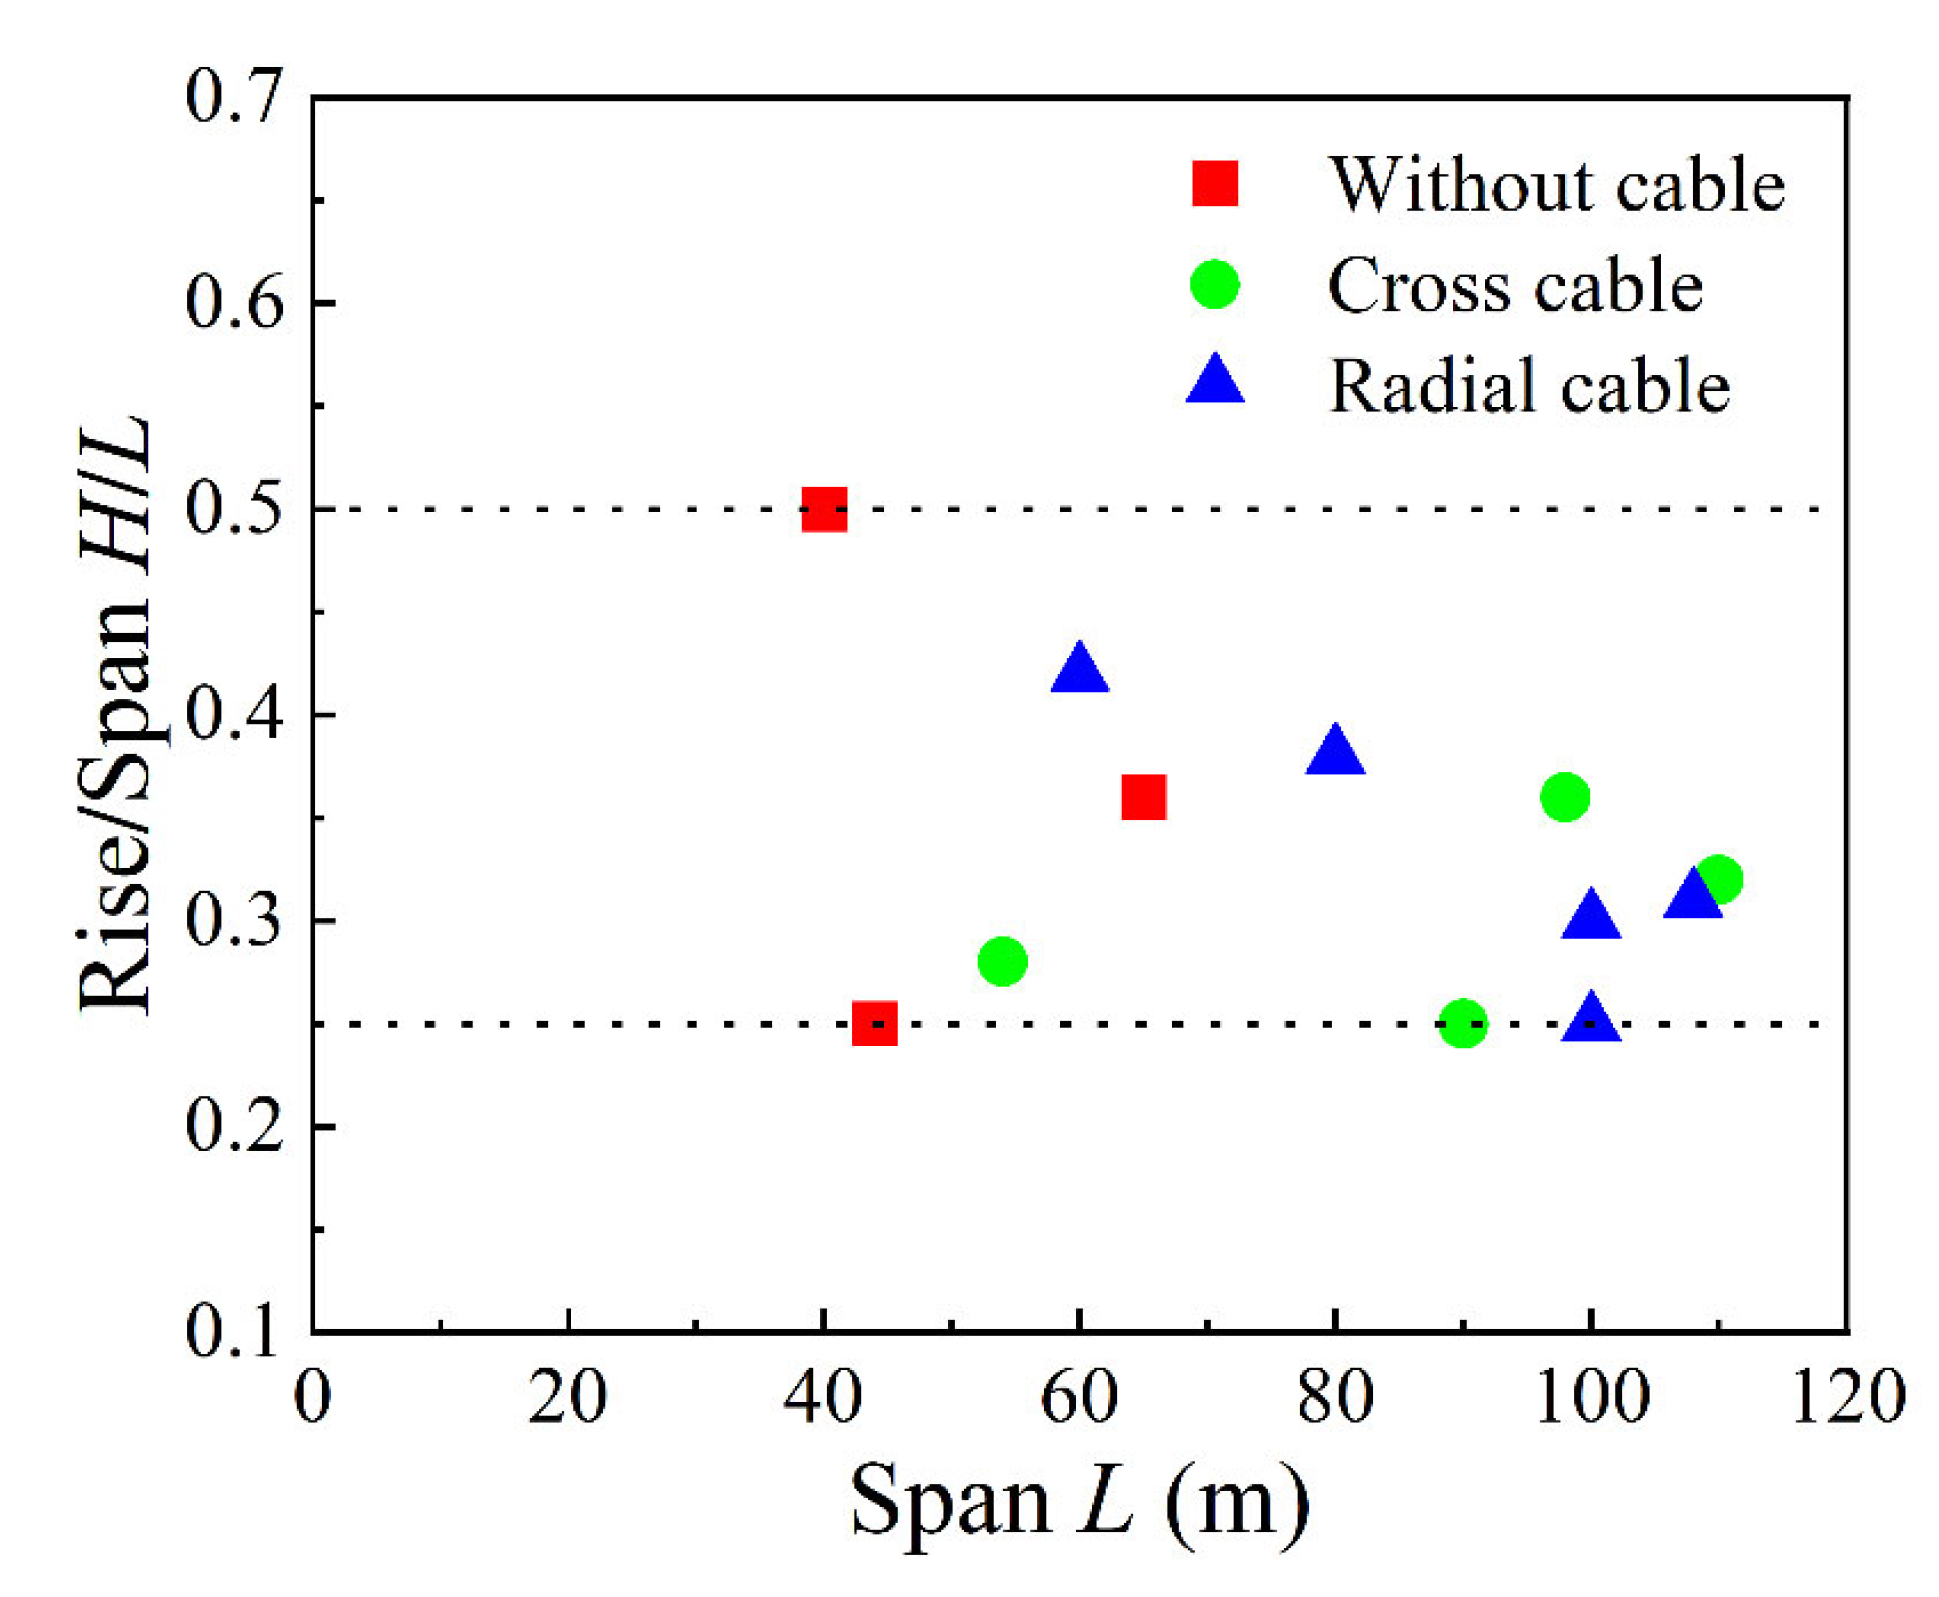
In order to select representative structural dimensions for the present investigations, some practical engineering information on spherical inflatable membrane structures is collected in Table 1. According to the information, the distribution of the span and rise–span ratio is plotted in Figure 2. It can be seen that the span of the spherical inflatable membrane structure is mainly distributed in the range of 60 to 100 m, and the rise–span ratio is generally in the range of 0.25 to 0.50. Therefore, three spherical models with representative rise–span ratios of 0.25, 0.33, and 0.50 are selected. Additionally, three typical spans of 60, 80, and 100 m are selected. In order to study the influence of cables, the cross cables (Figure 1b) and radial cables (Figure 1c) are adopted in the investigation.

2.2. Experimental Apparatus and Procedure

In order to study the wind load characteristics of spherical inflatable membrane structures, pressure measurement wind tunnel experiments on rigid models were conducted at the wind tunnel laboratory at the Harbin Institute of Technology. The test section of the wind tunnel laboratory is 25 m in length, 4 m in width, and 3 m in height.
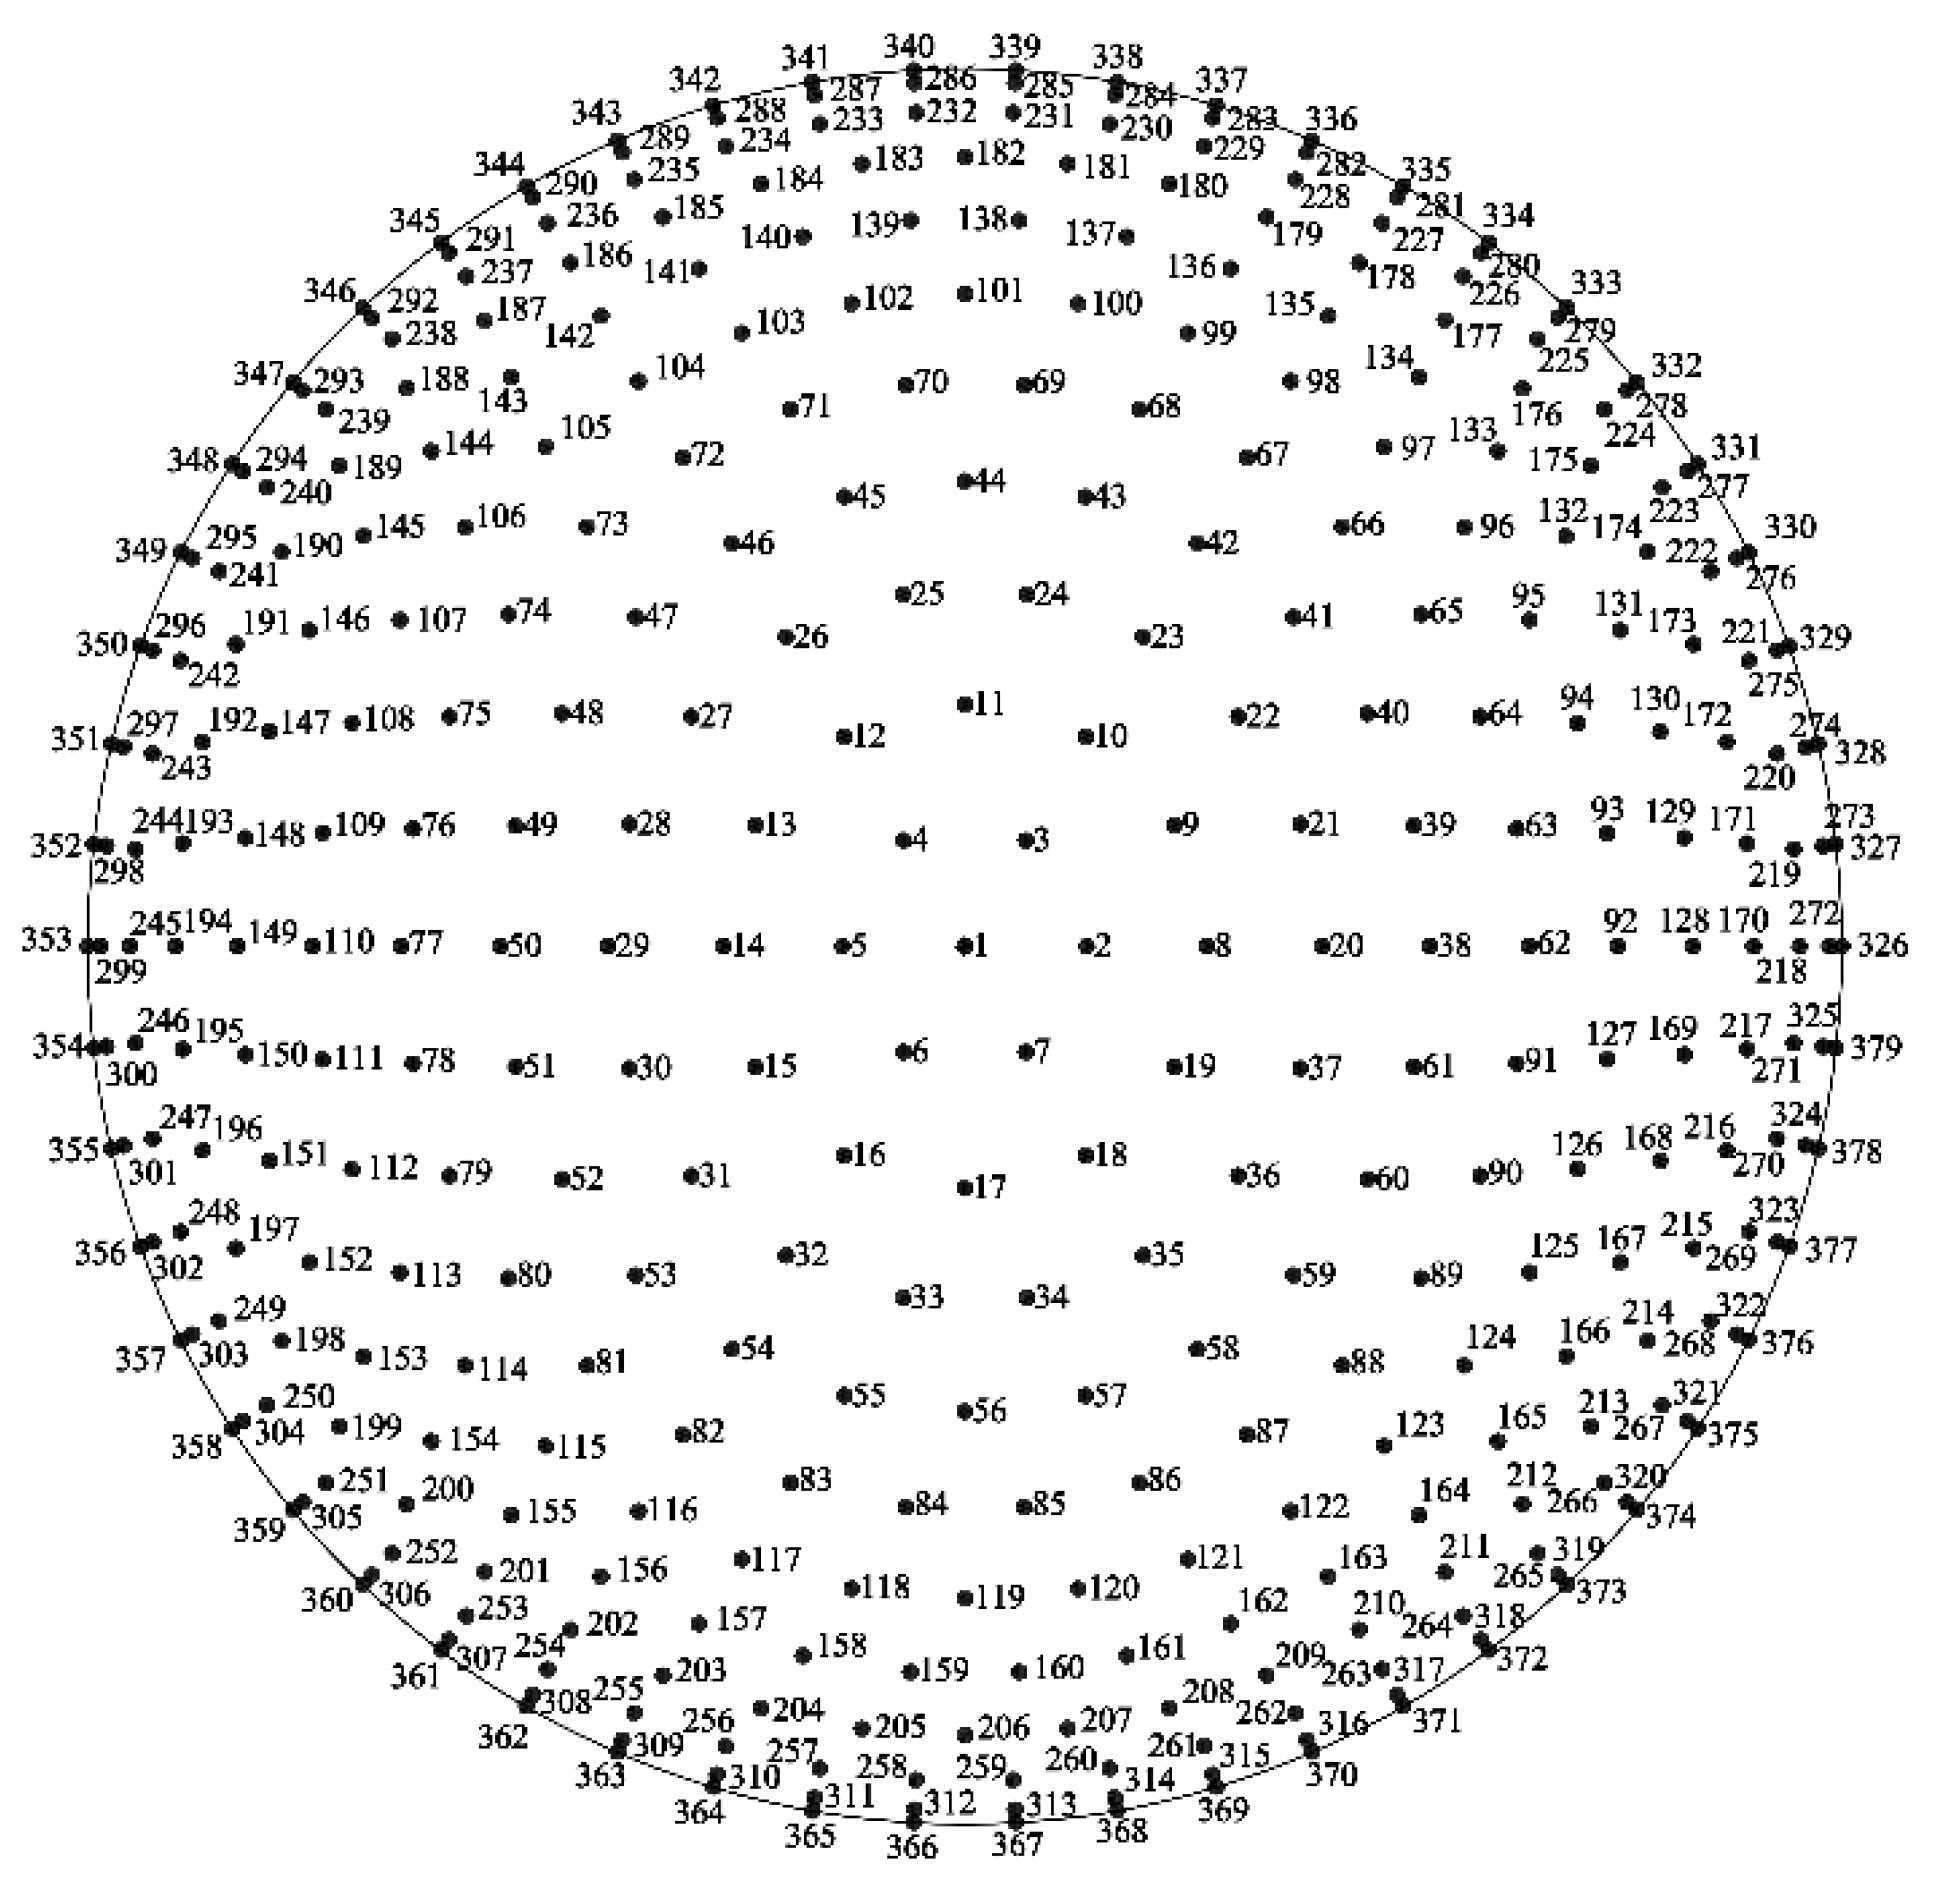
According to the engineering information collected in Section 2.1, a series of wind tunnel experiments was carried out on spherical inflatable membrane models with rise–span ratios of 0.25, 0.33, and 0.50. To measure the constraint of the wind tunnel boundary on the fluid and wake around the building, the ratio of the maximum windward area of the model to the cross-sectional area of the wind tunnel is defined as the blocking ratio. Considering the dimension of the wind tunnel, the geometric scale ratio of the model was assumed as 1:100. The maximum blocking ratio was 1.47%, which is less than 5% [26]. The experiment model was made of fiberglass, with a thickness of 0.006 m. The pressure measuring taps were uniformly arranged on the surface of each model. The details of the model parameters are shown in Table 2. Taking the model with rise–span H/L = 0.50 as an example, the arrangement of the measuring taps is given in Figure 3. The measuring taps were connected to the pressure scanning valve by PVC pipes. The instantaneous wind pressure measurements on the model were performed using a DSM3400 pressure scanner system with a sampling frequency of 625 Hz and a sampling time of 100 s. The experimental models are shown in Figure 4.
As shown in Figure 4, the spires and roughness elements [27] were installed in front of the test section to generate an atmospheric boundary layer flow with a power index of 0.15 in the Chinese load code (GB50009-2012) [28]. The experiment wind velocity was U0 = 10 m/s, corresponding to the mean wind velocity at the top height of the model. The simulations of the atmospheric boundary layer are shown in Figure 5. Figure 5a shows the agreement of wind velocity and turbulence intensity profiles generated in the wind tunnel experiment with the target profiles in GB50009-2012. Figure 5b shows the agreement between the measured wind velocity power spectrum and the Von Karman power spectrum model.

2.3. Results of Wind Pressure Coefficients

With the reference pressure measured by a pitot tube at the top height of the model in the upstream direction, the wind pressure coefficients and mean wind pressure coefficients can be calculated by the following formulas [24]:
C p j ( t i ) = P j ( t i ) P 0 0.5 ρ U 0 2
C ¯ p j = 1 N i = 1 N C p j ( t i )
where C p j ( t i ) is the wind pressure coefficient of jth tap at time ti; P j ( t i ) is the wind pressure of jth tap at time ti; P 0 is the static pressure measured at the reference height; ρ is the density of the air; U0 is the mean wind velocity at the reference height; C ¯ P j is the mean wind pressure coefficient of jth tap; N is the total number of data.
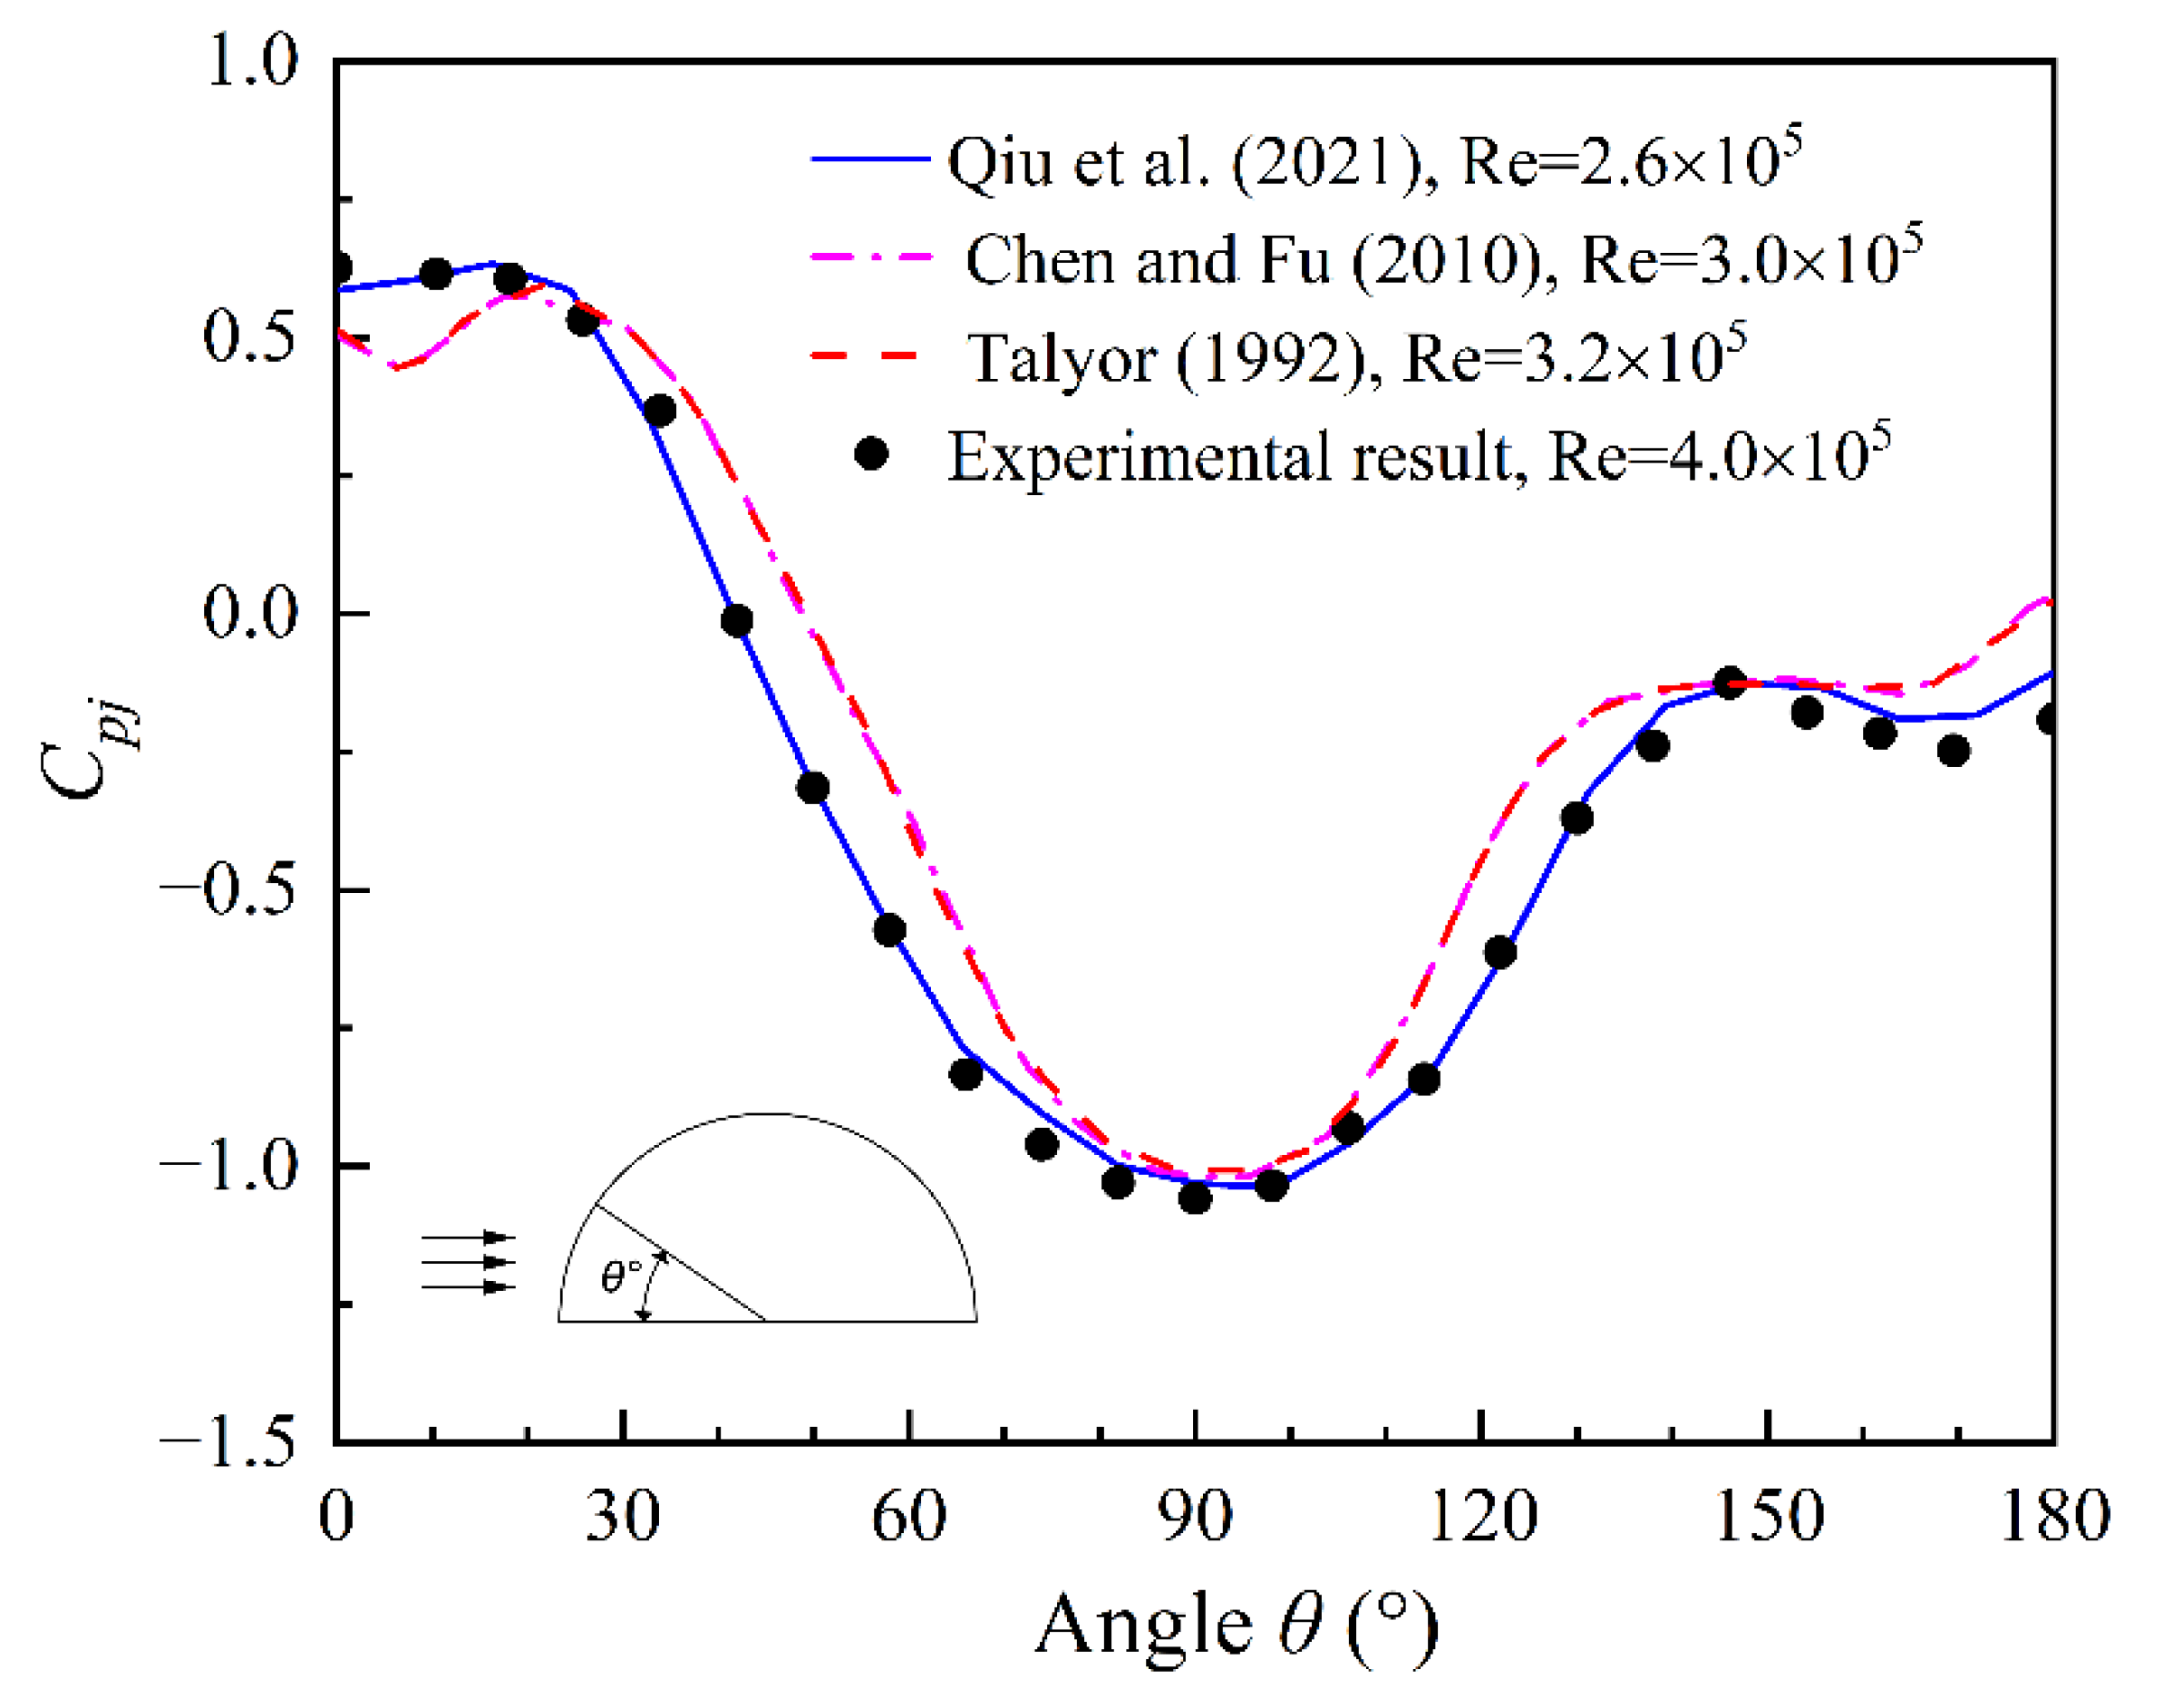
For the structures with a curved shape, it is difficult to perform accurate evaluation of the wind loads because of the Reynolds number effects. To verify the accuracy of the experiment results, Figure 6 compares the mean wind pressure coefficients on the central meridian of the model with the previous studies [8,9,29]. The model with rise–span H/L = 0.50 was selected. It is observed that the distributions of wind pressure coefficients are similar to previous experimental results. The Reynolds number of the experiment was 4.0 × 10⁵. It can be seen that the Reynolds number in the range of 2.6 × 10⁵~4.0 × 10⁵ has little influence on the experiment results. Thus, the data of the wind tunnel experiment in this paper are feasible.

3. Wind-Induced Response Analysis

With the experimental wind load data, based on nonlinear dynamic time–history analysis with ABAQUS, the wind-induced response characteristics of spherical inflatable membrane structures are obtained. The analysis method, cases, and processing procedures are introduced in this section.

3.1. Nonlinear Dynamic Time–History Analysis Method

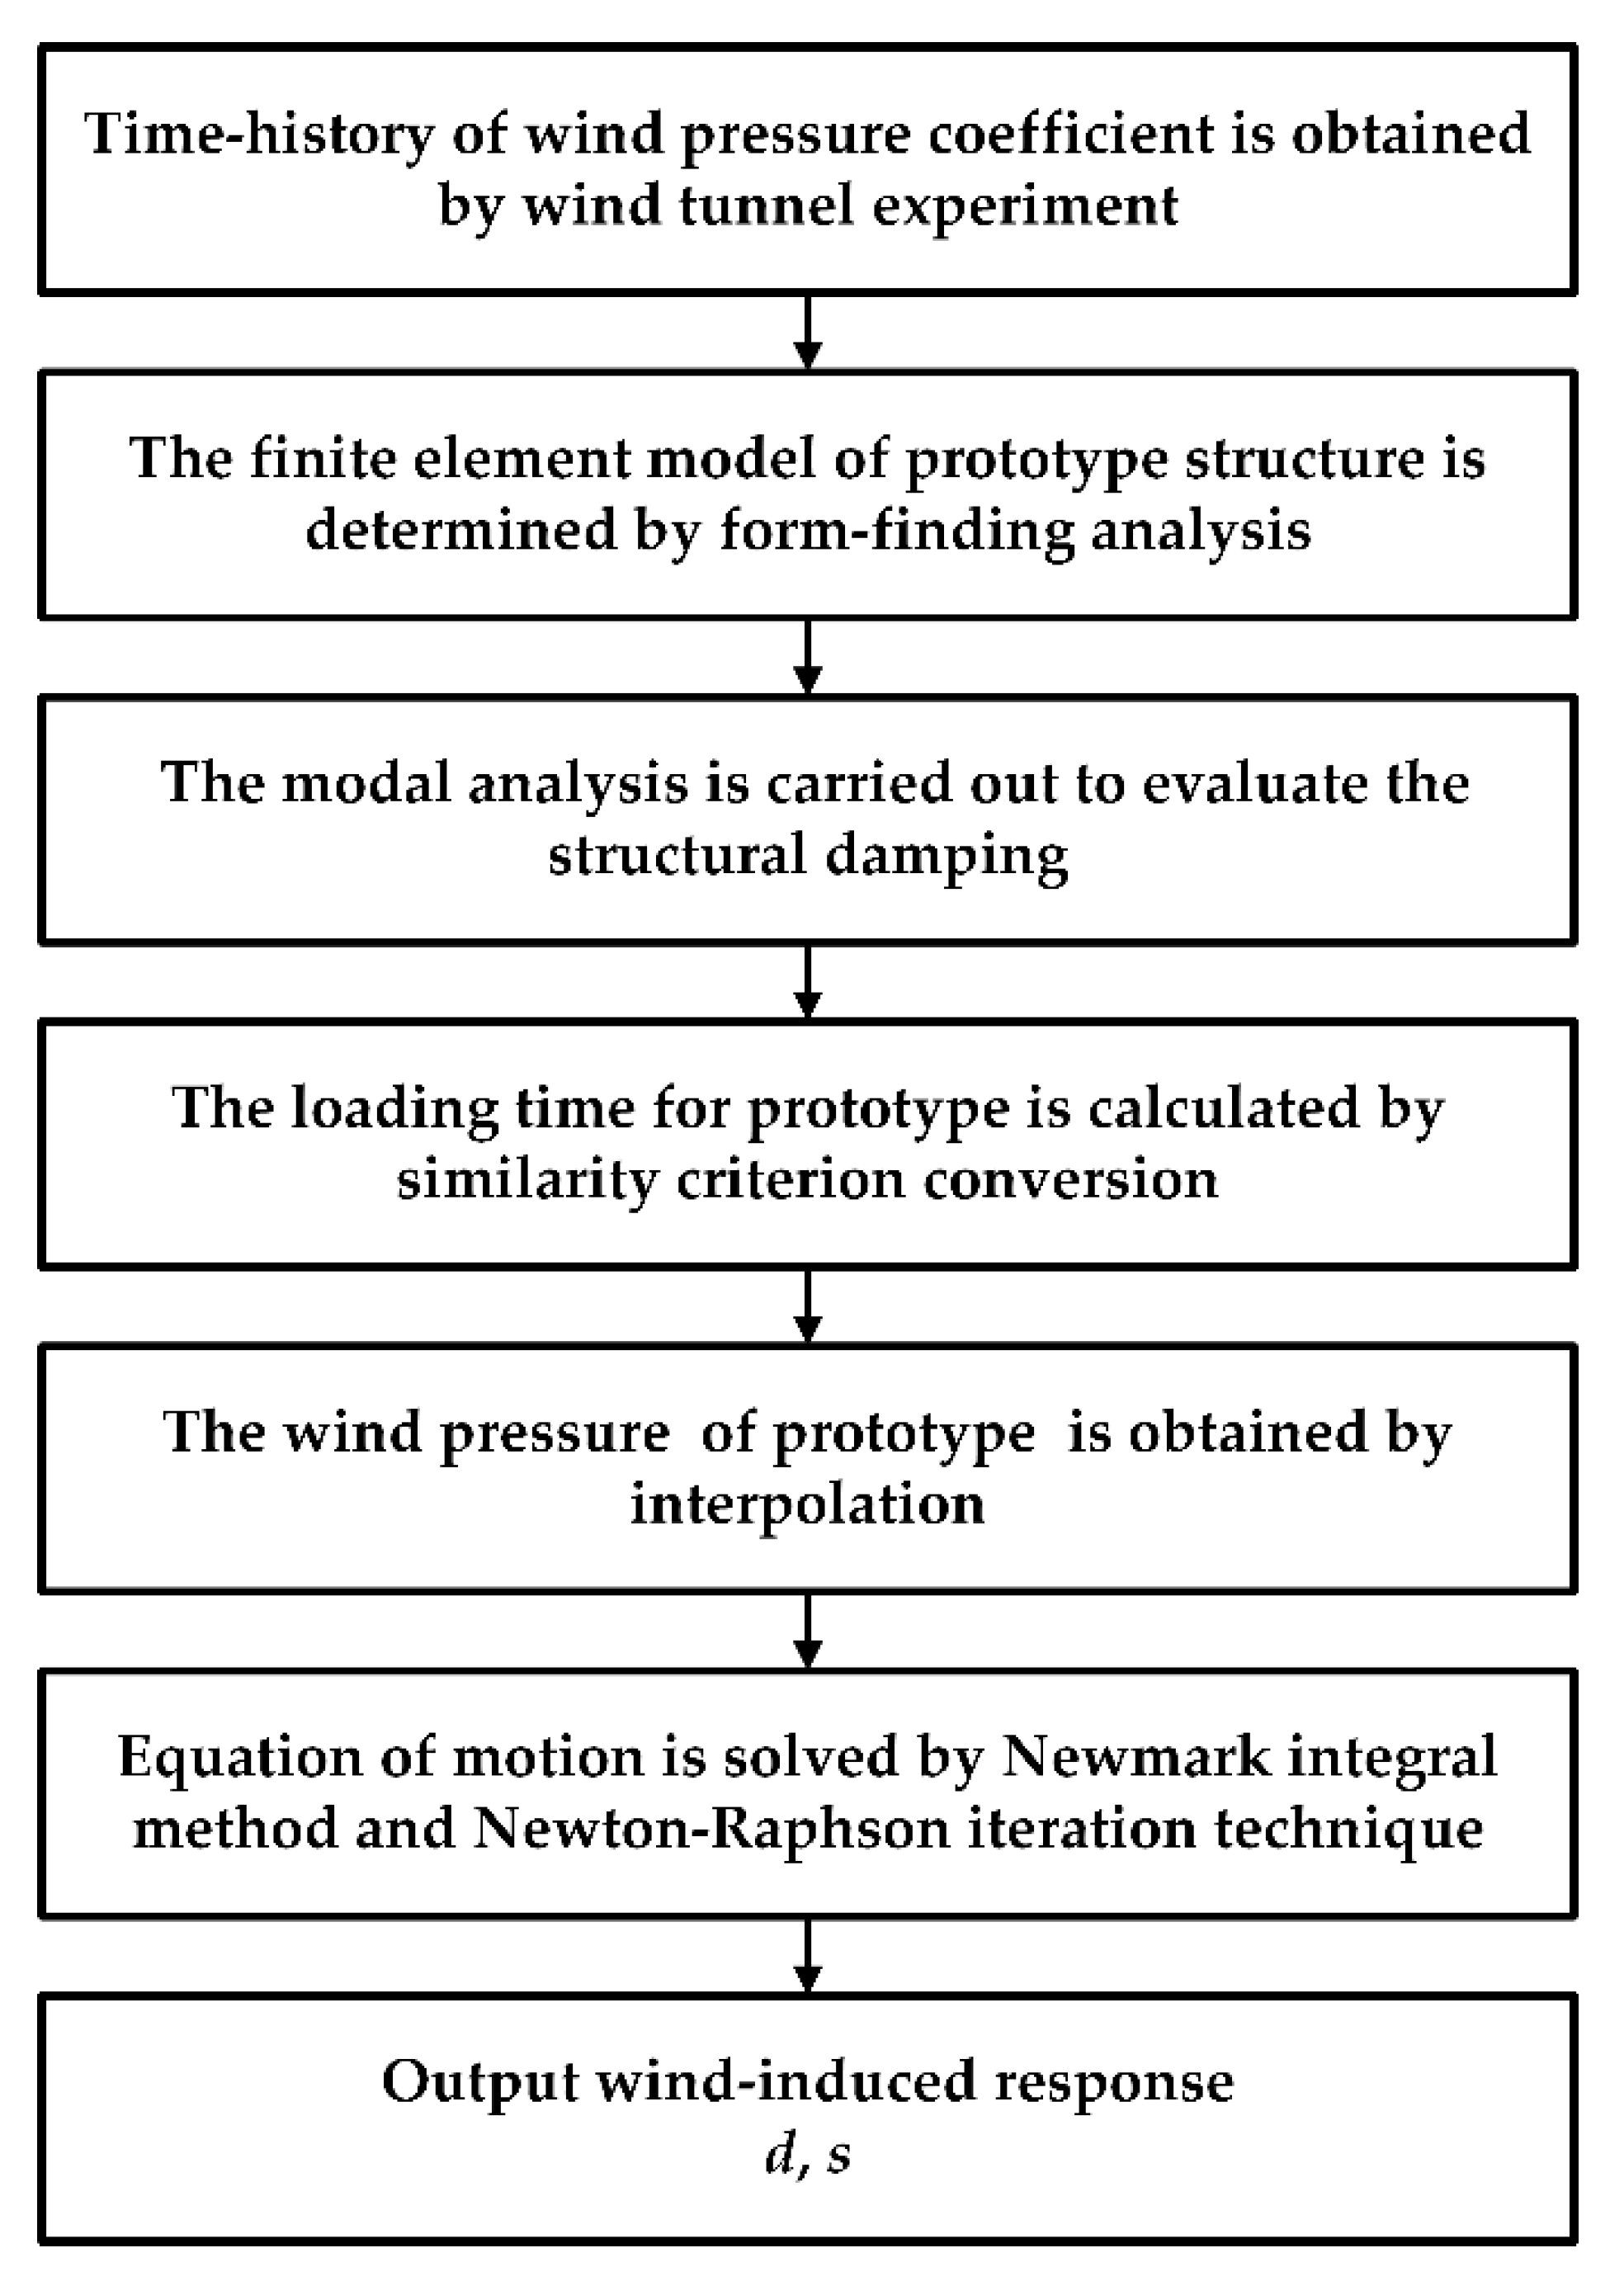
For the membrane structures with strong geometric nonlinearity, the large deformation and nonlinearity need to be considered in the finite element analysis [30]. The nonlinear dynamic time–history analysis becomes an effective means to study the wind-induced responses of membrane structures. A flow chart of nonlinear dynamic time–history analysis of inflatable membrane structure is shown in Figure 7.
Firstly, the form-finding analysis and modal analysis were completed based on the structural parameters (such as dimension, material, internal pressure). Different from the rigid long-span spatial structures such as grid structures, the finite element model of inflatable membrane structure cannot be directly obtained by the model with the geometric shape. The form-finding analysis is required to determine the stressed balance shape of the membrane structure for a given boundary condition and internal pressure, and provide the accurate calculation model for load effect analysis. The structure is modeled according to a given geometry shape, and the internal pressure load is applied uniformly and increases gradually to iteratively approach the accurate finite element model. The resulting model is with uniform stress and a consistent geometric shape with the target. To verify the accuracy of the results of morphological analysis and determine an economic element strategy for the parametric analysis, the analytical solution of spherical inflatable membrane stress can be obtained by [31]:
s = p r 2 t
where s is the stress of the spherical inflatable membrane; p is the internal pressure; r is the radius of the sphere; t is the thickness of membrane.
Then, based on the wind tunnel experiment data, the wind load at an arbitrary location and time on the spherical inflatable membrane can be obtained by interpolation technique. In addition, the dynamic equation is solved by the Newmark step-by-step integral method and the Newton–Raphson iteration to get the wind-induced responses.
The loading time and step length were determined by the Strouhal similarity criterion [25], whose expressions are shown as follows:
f P L P U P = f M L M U M
where fP and fM denote the loading frequency of the prototype finite element model and the sampling frequency of the wind tunnel experiment, respectively; LP and LM stand for the geometric dimensions of the finite element model and the wind tunnel experiment model, respectively; UP and UM are the wind velocity at the reference height of the finite element model and the wind tunnel test model, respectively.
The wind pressure coefficient C p j ( t i ) at an arbitrary location and time on the spherical inflatable membrane can be obtained by using the cubic polynomial interpolation based on the wind tunnel experiment data. Thus, the wind loads acting on the membrane are assumed to be perpendicular to the membrane surface. The wind load P j ( t i ) on the element j is calculated by the velocity pressure and wind pressure coefficient [32], the equation can be expressed as:
P j ( t i ) = C p j ( t i ) 0.5 ρ U h 2
where ti = i/fP (i = 1, 2, …, N) is the time series, fP is derived according to Equation (4).

3.2. Finite Element Model and Analysis Cases

The finite element model of the spherical inflatable membrane structure was established with ABAQUS. The material parameters of the membrane and cable for finite element analysis are shown in Table 3.
Considering the influences of different parameters on the wind-induced response of spherical inflatable membrane structures, this paper analyzed the influences of different rise–span ratios H/L, spans L, internal pressures p, and cable configurations on the structural response. The rise–span ratio H/L was taken as 0.50, 0.33, and 0.25. The span L was selected as 60, 80, and 100 m. The internal pressure p was considered 300, 350, 400, and 450 Pa. Two cable configurations were considered as cross and radial types, as shown in Figure 1. The number of cables on each analysis model is determined as 18, which is a commonly selected number in practical engineering. Totally, the wind-induced responses of spherical inflatable membrane structures under 345 cases at wind velocities of 10–20 m/s were analyzed. The parameters of all cases are shown in Table 4.
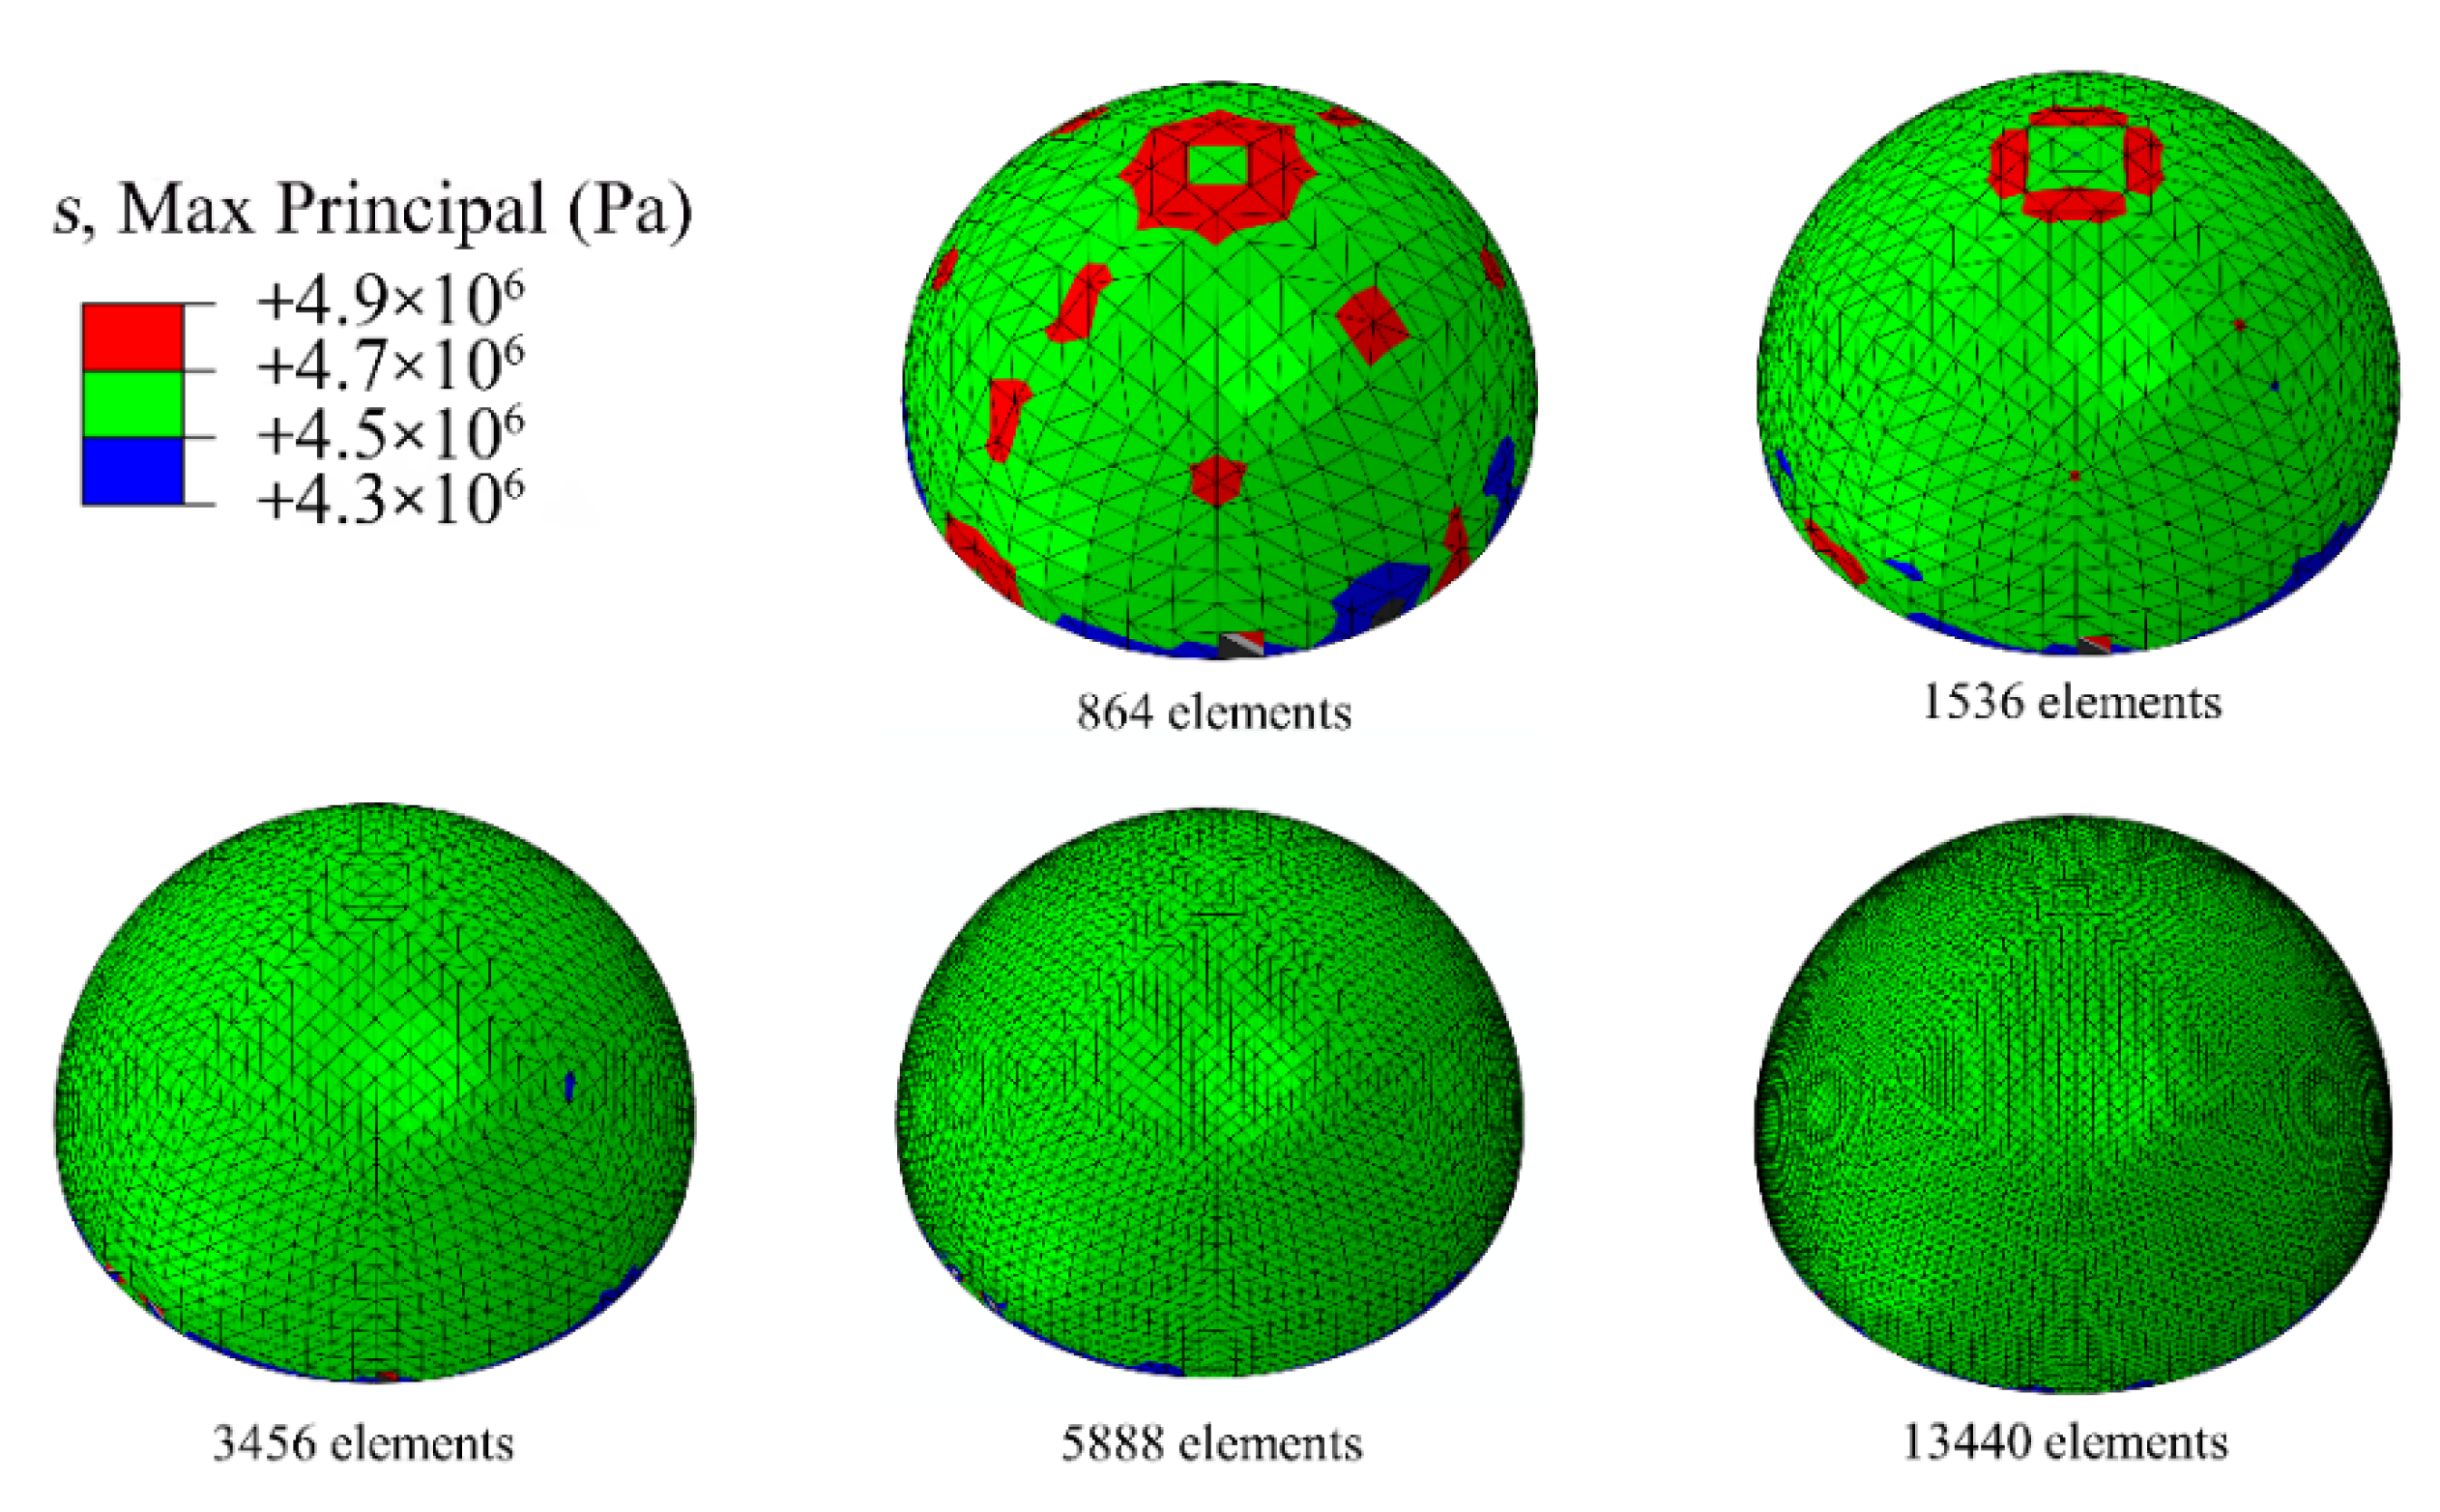
The regular triangular meshes were used for meshing. To determine the mesh refinement level, which is economical in the calculation, five refinement levels of the grid were tested. The element totals are 864, 1536, 3456, 5888, and 13,440, respectively. The form-finding analysis of a typical case (p = 300 Pa, L = 60 m, and H/L = 0.50) was carried out as an illustration. The membrane stress of spherical inflatable membrane structures can be calculated as 4.5 MPa by Equation (3). The results are shown in Figure 8. It can be shown that the stress distribution of 3456, 5888, and 13,440 elements is uniform to meet 4.5 MPa. Therefore, the meshing method of 3456 elements was selected to improve computation velocity.
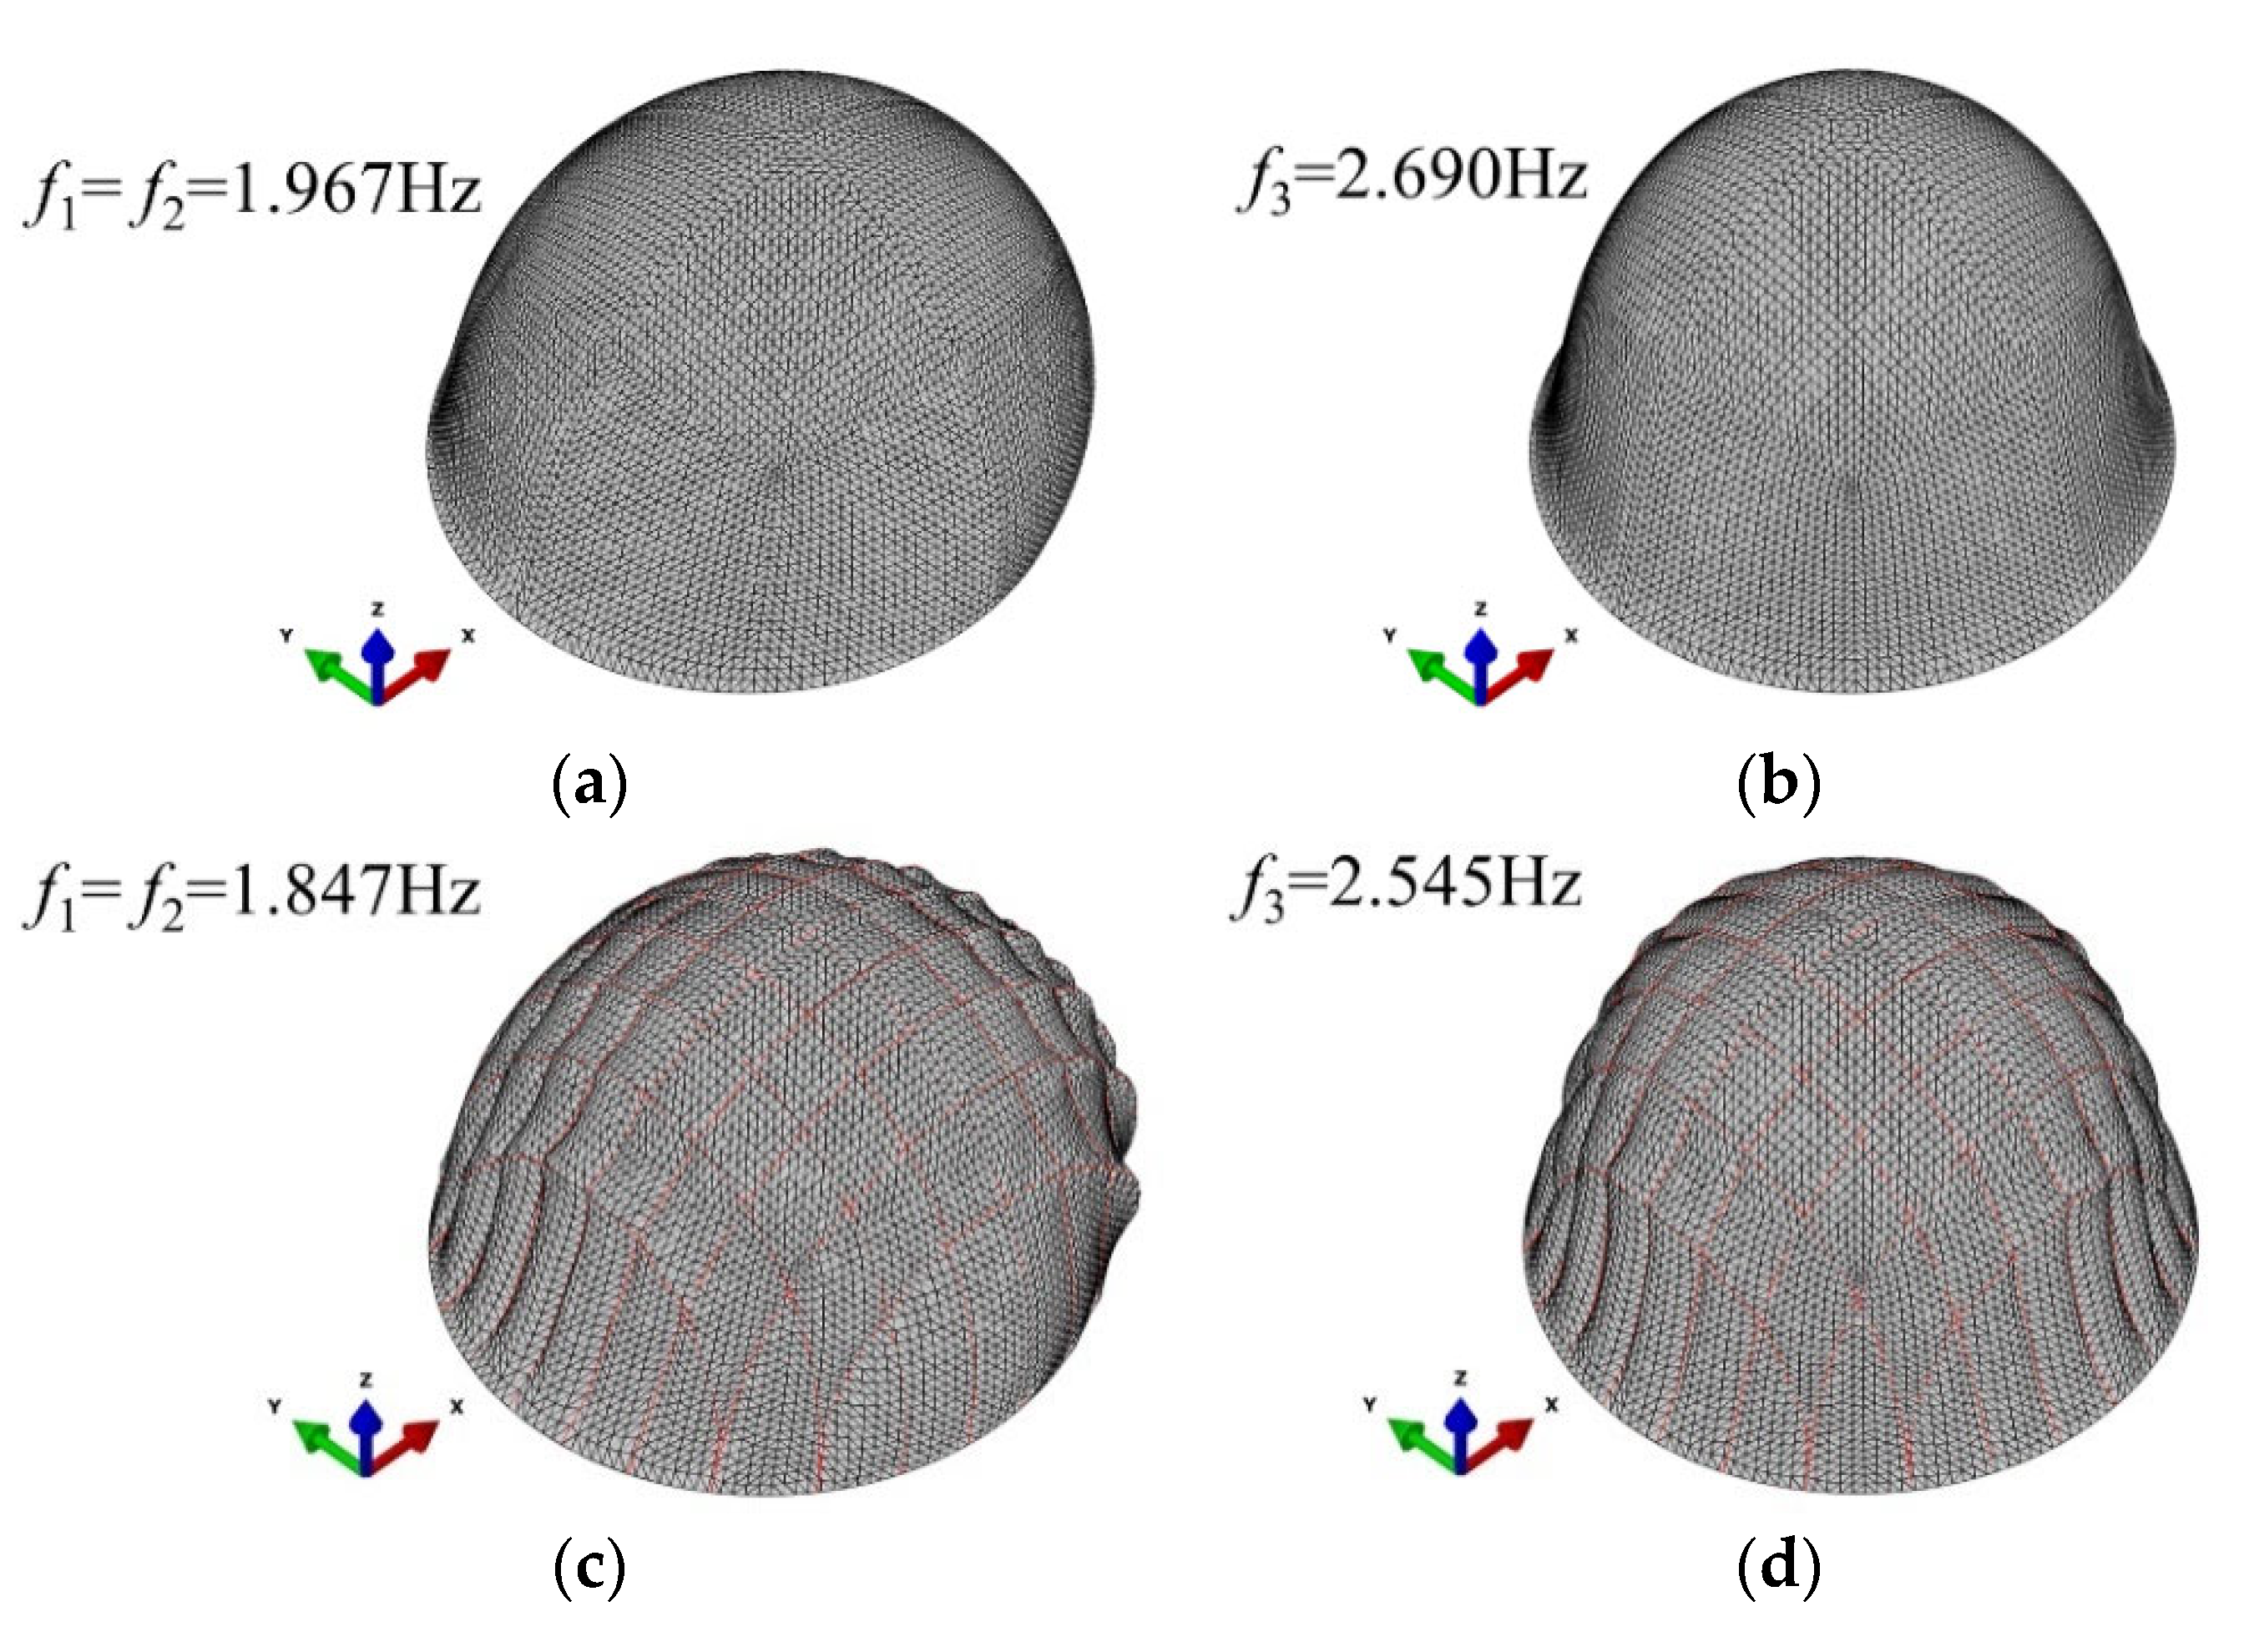
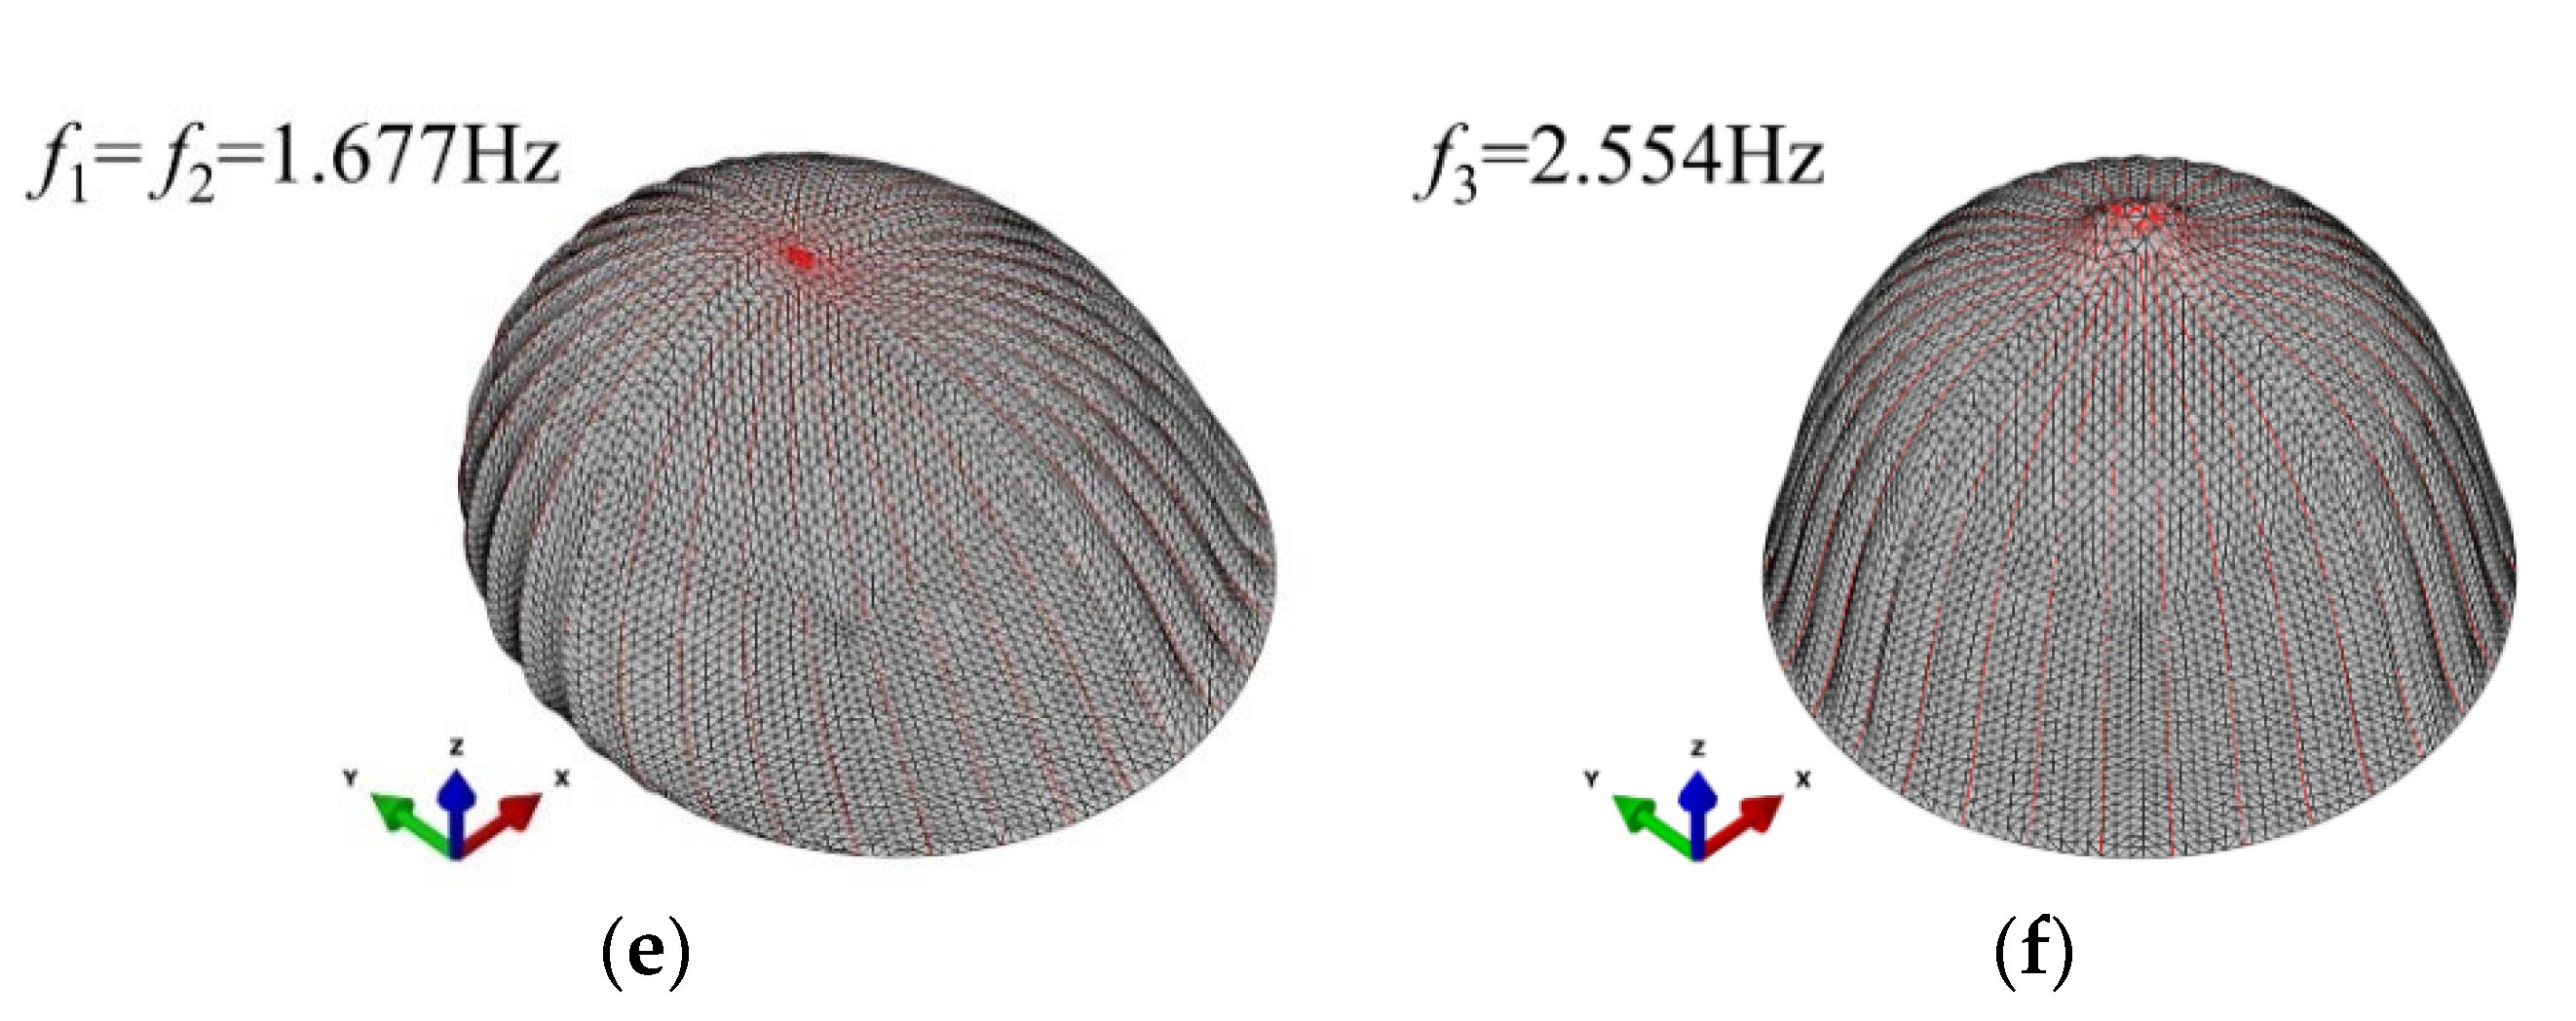
Before the dynamic analysis of the structure, the dynamic properties of different models are investigated through modal analysis. The modal frequencies and shapes of the spherical inflatable membrane structure were obtained by using the Lanczos vector iteration method on ABAQUS software. In order to compare the influences of cable configurations on structural frequency, Figure 9 shows the first three modal shapes of spherical inflatable structures with H/L = 0.50, L = 60 m, and p = 300 Pa. The results show that the first three modal shapes of the structure are similar regardless of whether the cables are installed. For the first two modes, the membrane vibrates in the horizontal (X or Y) direction. For the 3rd mode, the membrane vibrates in the vertical (Z) direction.
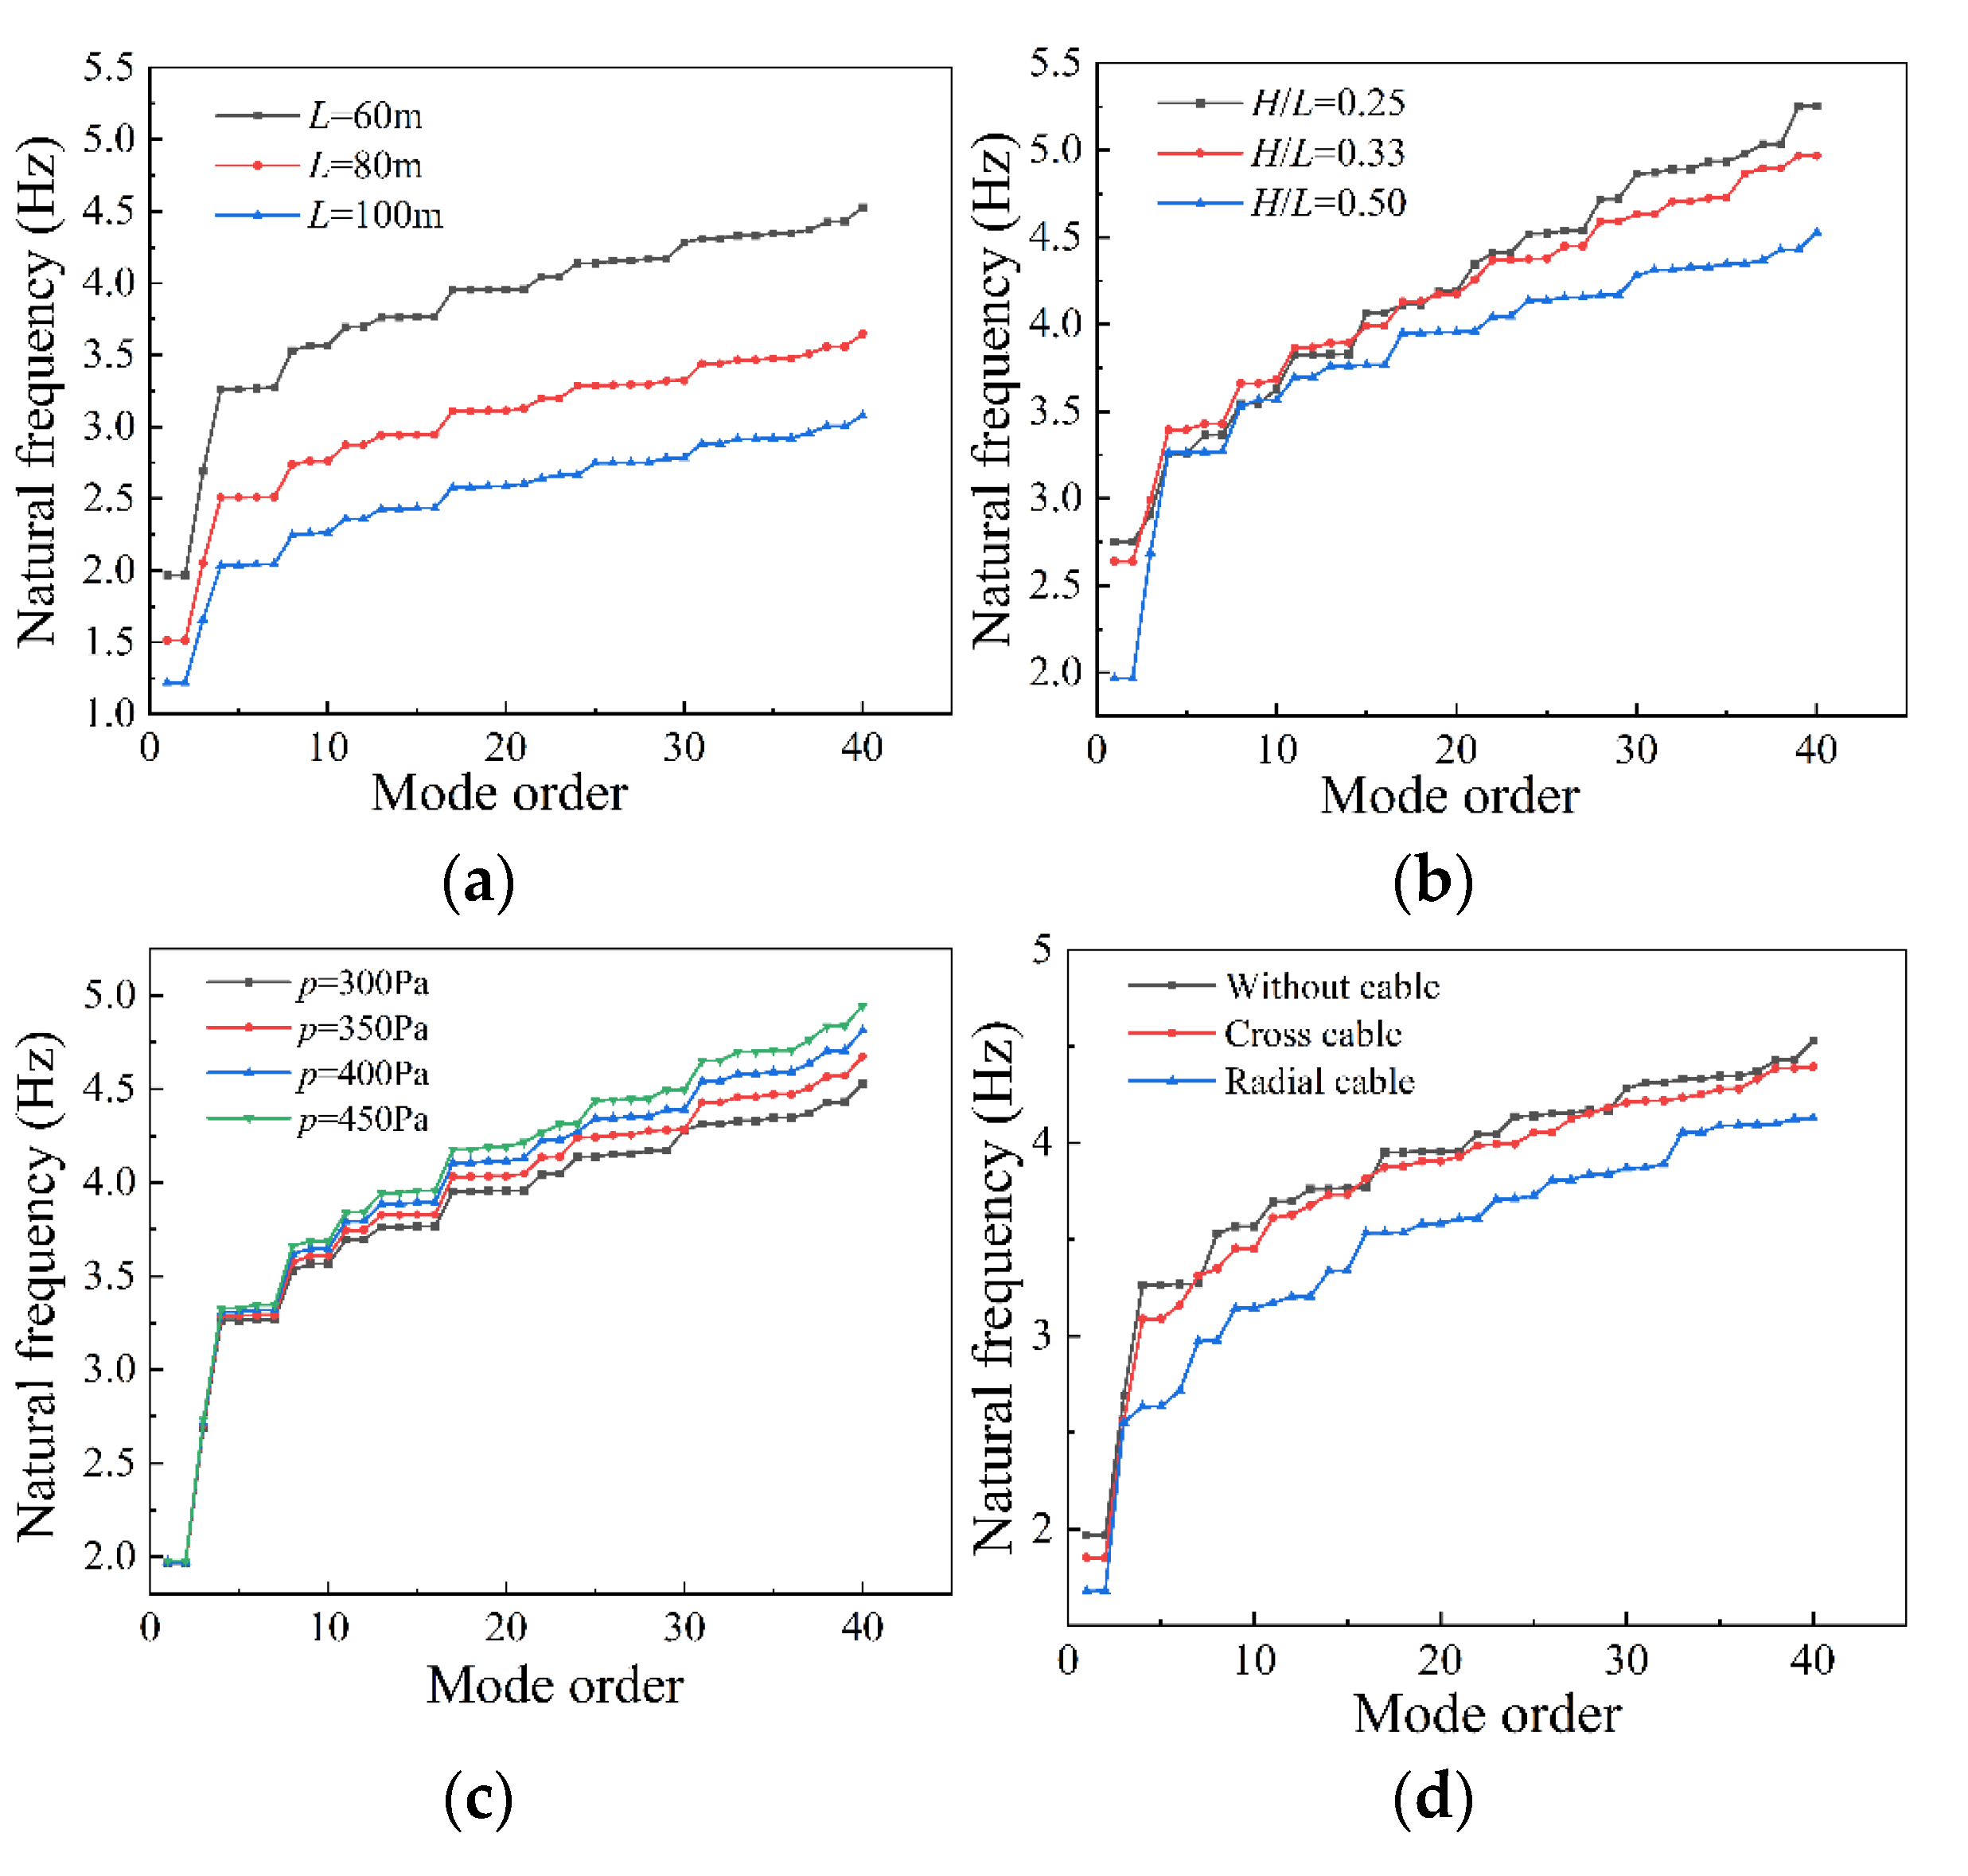
The influence of span, rise–span ratio, internal pressure, and cable configuration on natural frequency is shown in Figure 10. It is observed that the natural frequency characteristics of spherical inflatable membrane structures with different spans are similar. It is observed from Figure 10a that the natural frequencies of spherical inflatable membrane structures are decreased with the increment of the span. Therefore, with the increment of the span, the structure becomes more sensitive to wind load. As shown in Figure 10b, for the spherical inflatable membrane structures with the same span, the rise–span ratio has great influences on the fundamental modal frequency. The fundamental modal frequency decreases with the increment of the rise–span ratio. However, the rise–span ratio has less influence on higher order modes. From Figure 10c, it can be concluded that the natural frequencies of structure can be increased by increasing the internal pressure, especially for the high-order modes. Figure 10d shows that the cables can reduce the frequency of each order of the structure. The natural frequency of the structure with cables decreases, and the natural frequency of the structure with radial cable decreases more obviously. Conclusively, it is indicated that span is the main factor affecting the modal frequency of the structure.

3.3. Data Processing of Wind-Induced Responses

After the wind-induced displacement and stress response time histories are obtained through the nonlinear dynamic time–history analysis method, they are statistically studied in the subsequent sections.
In this paper, the along-wind direction is positive along the X-axis. The along-wind, cross-wind, and vertical displacements are denoted as u, v, and w, respectively. The mean value of each displacement component is defined as:
u ¯ j = i = 1 n u j ( t i ) n v ¯ j = i = 1 n v j ( t i ) n w ¯ j = i = 1 n w j ( t i ) n
where u ¯ j , v ¯ j , and w ¯ j are mean displacements of the along-wind, cross-wind, and vertical at the node j, respectively; u j ( t i ) , v j ( t i ) , and w j ( t i ) are the displacement components of the node j at time ti; n is the length of the time–history.
The total displacement dj(ti) of node j at time ti can be given by:
d j t i = u j 2 ( t i ) + v j 2 ( t i ) + w j 2 ( t i )
It should be noted that in subsequent analysis, the displacement referred to is the total displacement unless specifically specified as the displacement component. The mean and standard deviation of nodal displacement and element stress are denoted as:
d ¯ j = i = 1 n d j ( t i ) n s ¯ j = i = 1 n s j ( t i ) n
σ d j = i = 1 n [ d ¯ j d j ( t i ) ] 2 n 1 σ s j = i = 1 n [ s ¯ j s j ( t i ) ] 2 n 1
where d ¯ j is the mean displacement of the node j; s ¯ j is the mean membrane stress of element j; σ d j is the standard deviation value of displacement on node j; σ s j is the standard deviation value of stress on element j; s j ( t i ) is the membrane stress of element j at the time ti.
In practical engineering, the maximum responses of membrane structures can be named controlling responses, which is widely concerned by researchers. In this paper, the maximum values of the structural responses are given by:
d j max = max i d j ( t i ) s j max = max i s j ( t i )
d max = max j d j max s max = max j s j max
where d j max is the maximum displacement of node j; s j max is the maximum stress of element j; d max and s max are the maximum displacement and membrane stress of structure, respectively.

4. Wind-Induced Response Characteristics

In this section, the deformations law of the spherical inflatable membrane structures at different wind velocities are studied. The influences on the maximum response of different structural parameters such as span, rise–span ratio, internal pressure, and cable configuration are discussed.

4.1. Wind-Induced Deformation

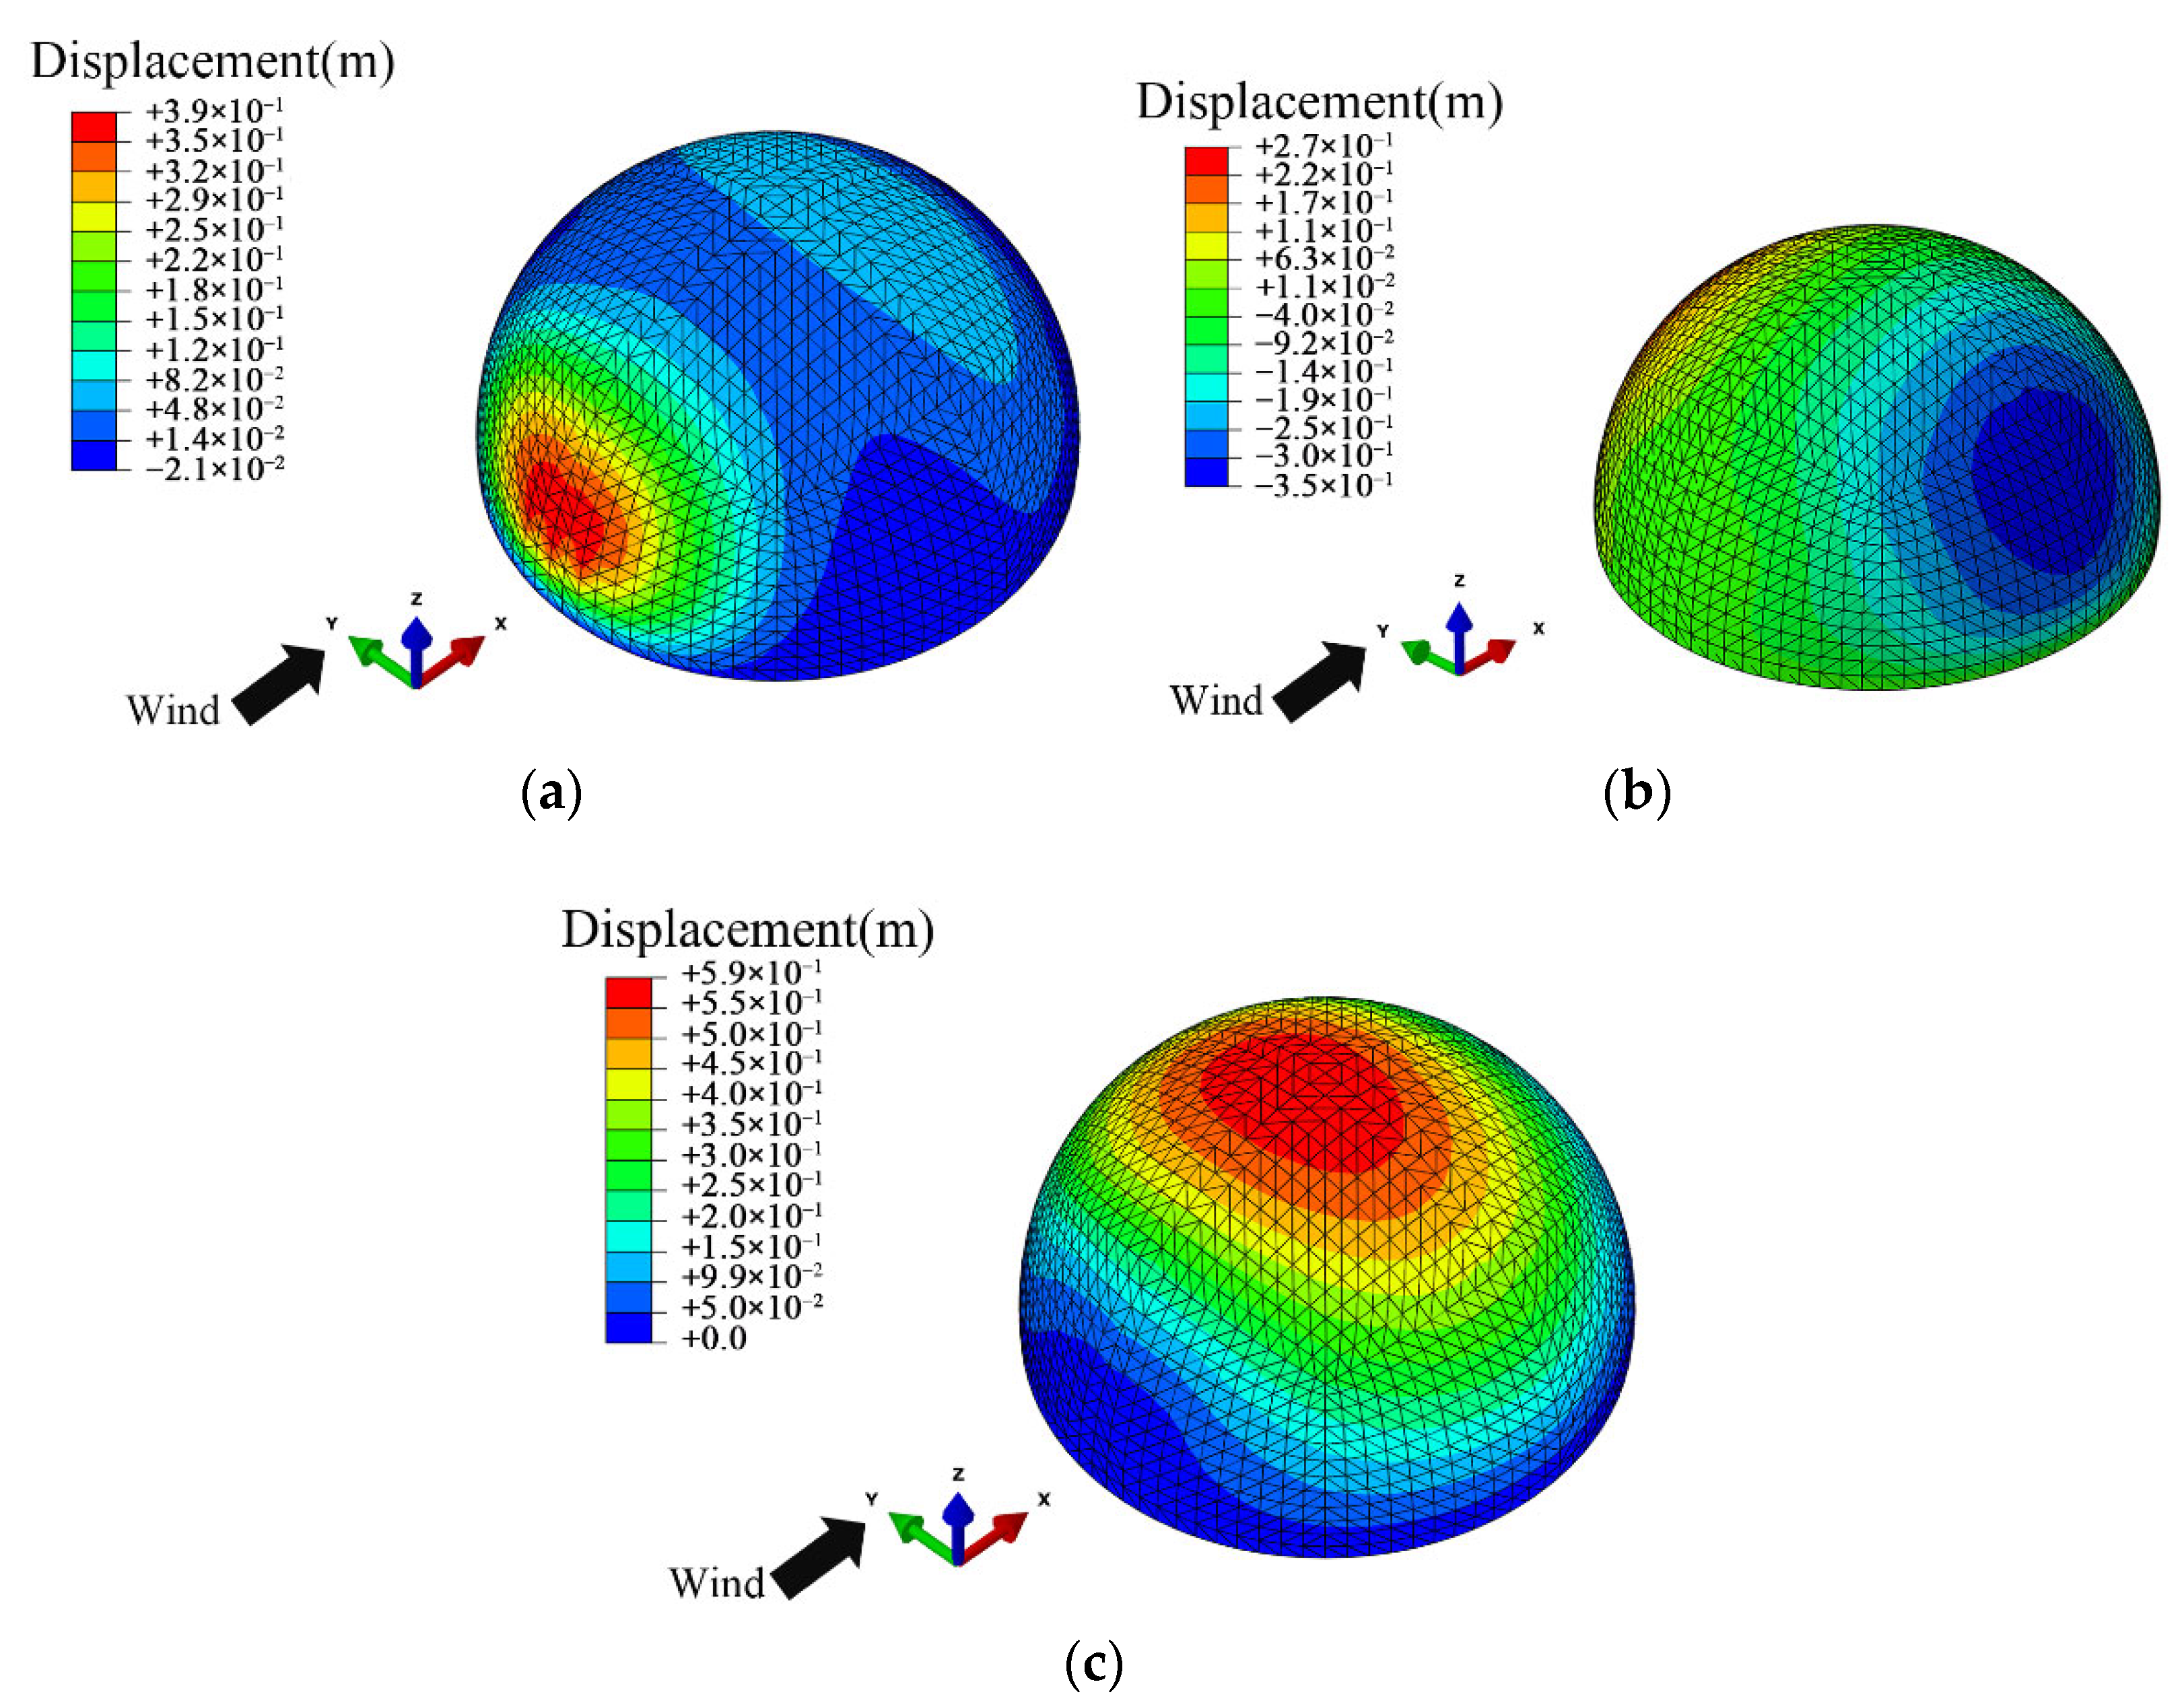
To study the deformation of the spherical inflatable membrane structure under wind load, based on the study of structure with L = 60 m, H/L = 0.50, p = 300 Pa, Figure 11 shows the contours of the structural maximum displacement component under the wind velocity Uh = 15 m/s. It is observed that the along-wind displacement u is dominant on the windward region, and the cross-wind displacement v and vertical displacement w are dominant on the side and top region, respectively.
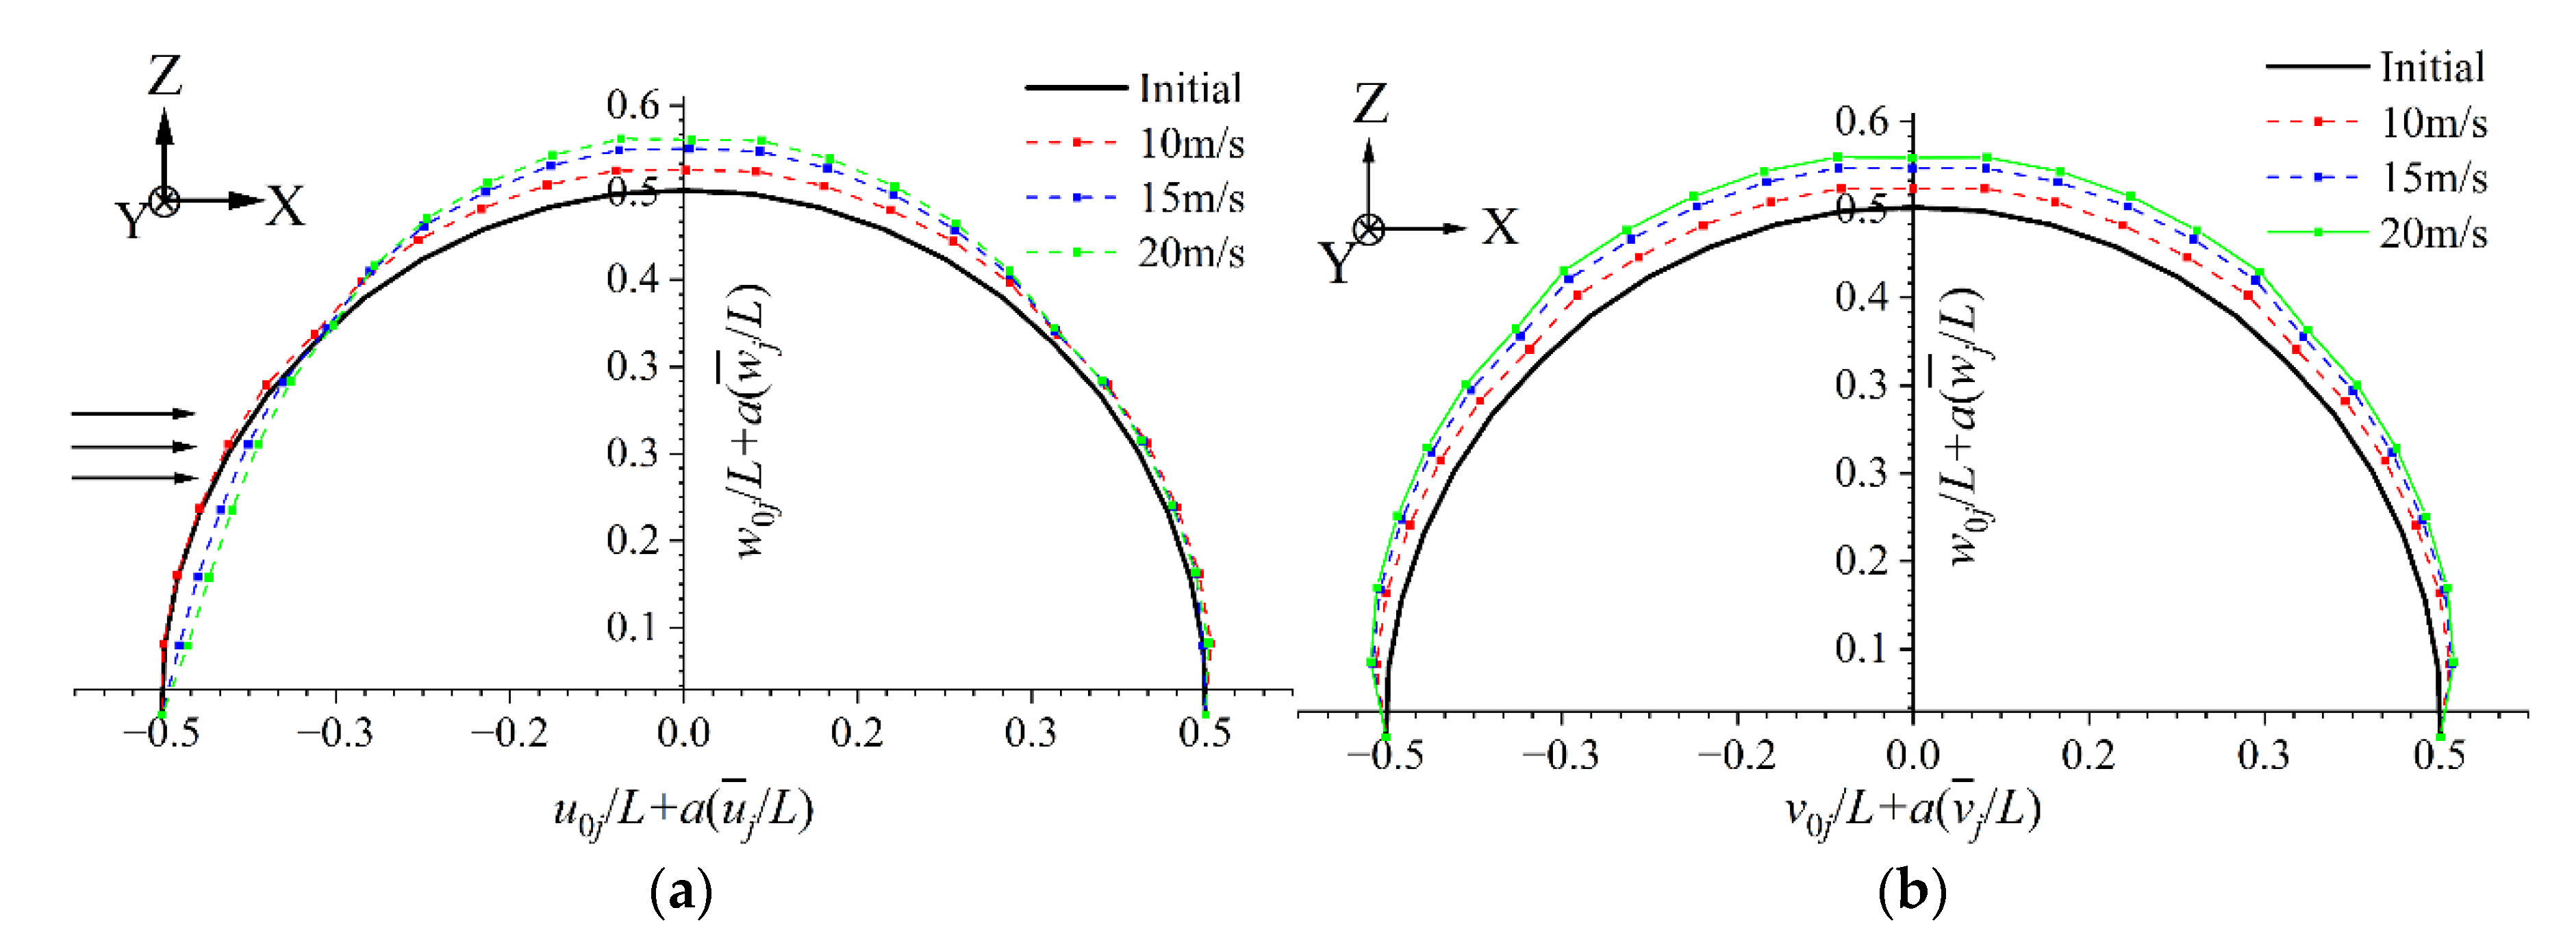
Along the central meridian of the structure, 25 nodes were selected in the along-wind and the cross-wind direction, respectively. In addition, the displacement component u, v, and w of nodes were reduced by span L. The mean deformation of the structure under different velocities is plotted in Figure 12, and the deformation is magnified 5 times (a = 5). It can be seen that with the increase of wind velocity, the structural deformation also increases, but the deformation trends under different wind velocities are consistent. The windward part of the structure deforms inward, and the top, side, and leeward parts of the structure deform outward.
In order to study the maximum wind-induced response with respect to different wind velocities, the contours of maximum responses under different wind velocities are illustrated in Figure 13 and Figure 14, based on the structure with L = 60 m, H/L = 0.50, p = 300 Pa. As shown in Figure 13, when the wind velocity is 10~15 m/s, the maximum displacement appears at the top region. However, when the wind velocity increases to 20 m/s, the maximum displacement occurs at H/3 height on the windward region. However, as shown in Figure 14, it can be known that the distributions of membrane stress are almost consistent under different velocities. The maximum stresses of the structure appear at the top region of the structure. Therefore, the position change of the maximum displacement response should be concerned under high wind velocity.

4.2. Parametric Analysis

In this section, the effects of span, rise–span ratio, and internal pressure on the maximum responses of the structures are studied.
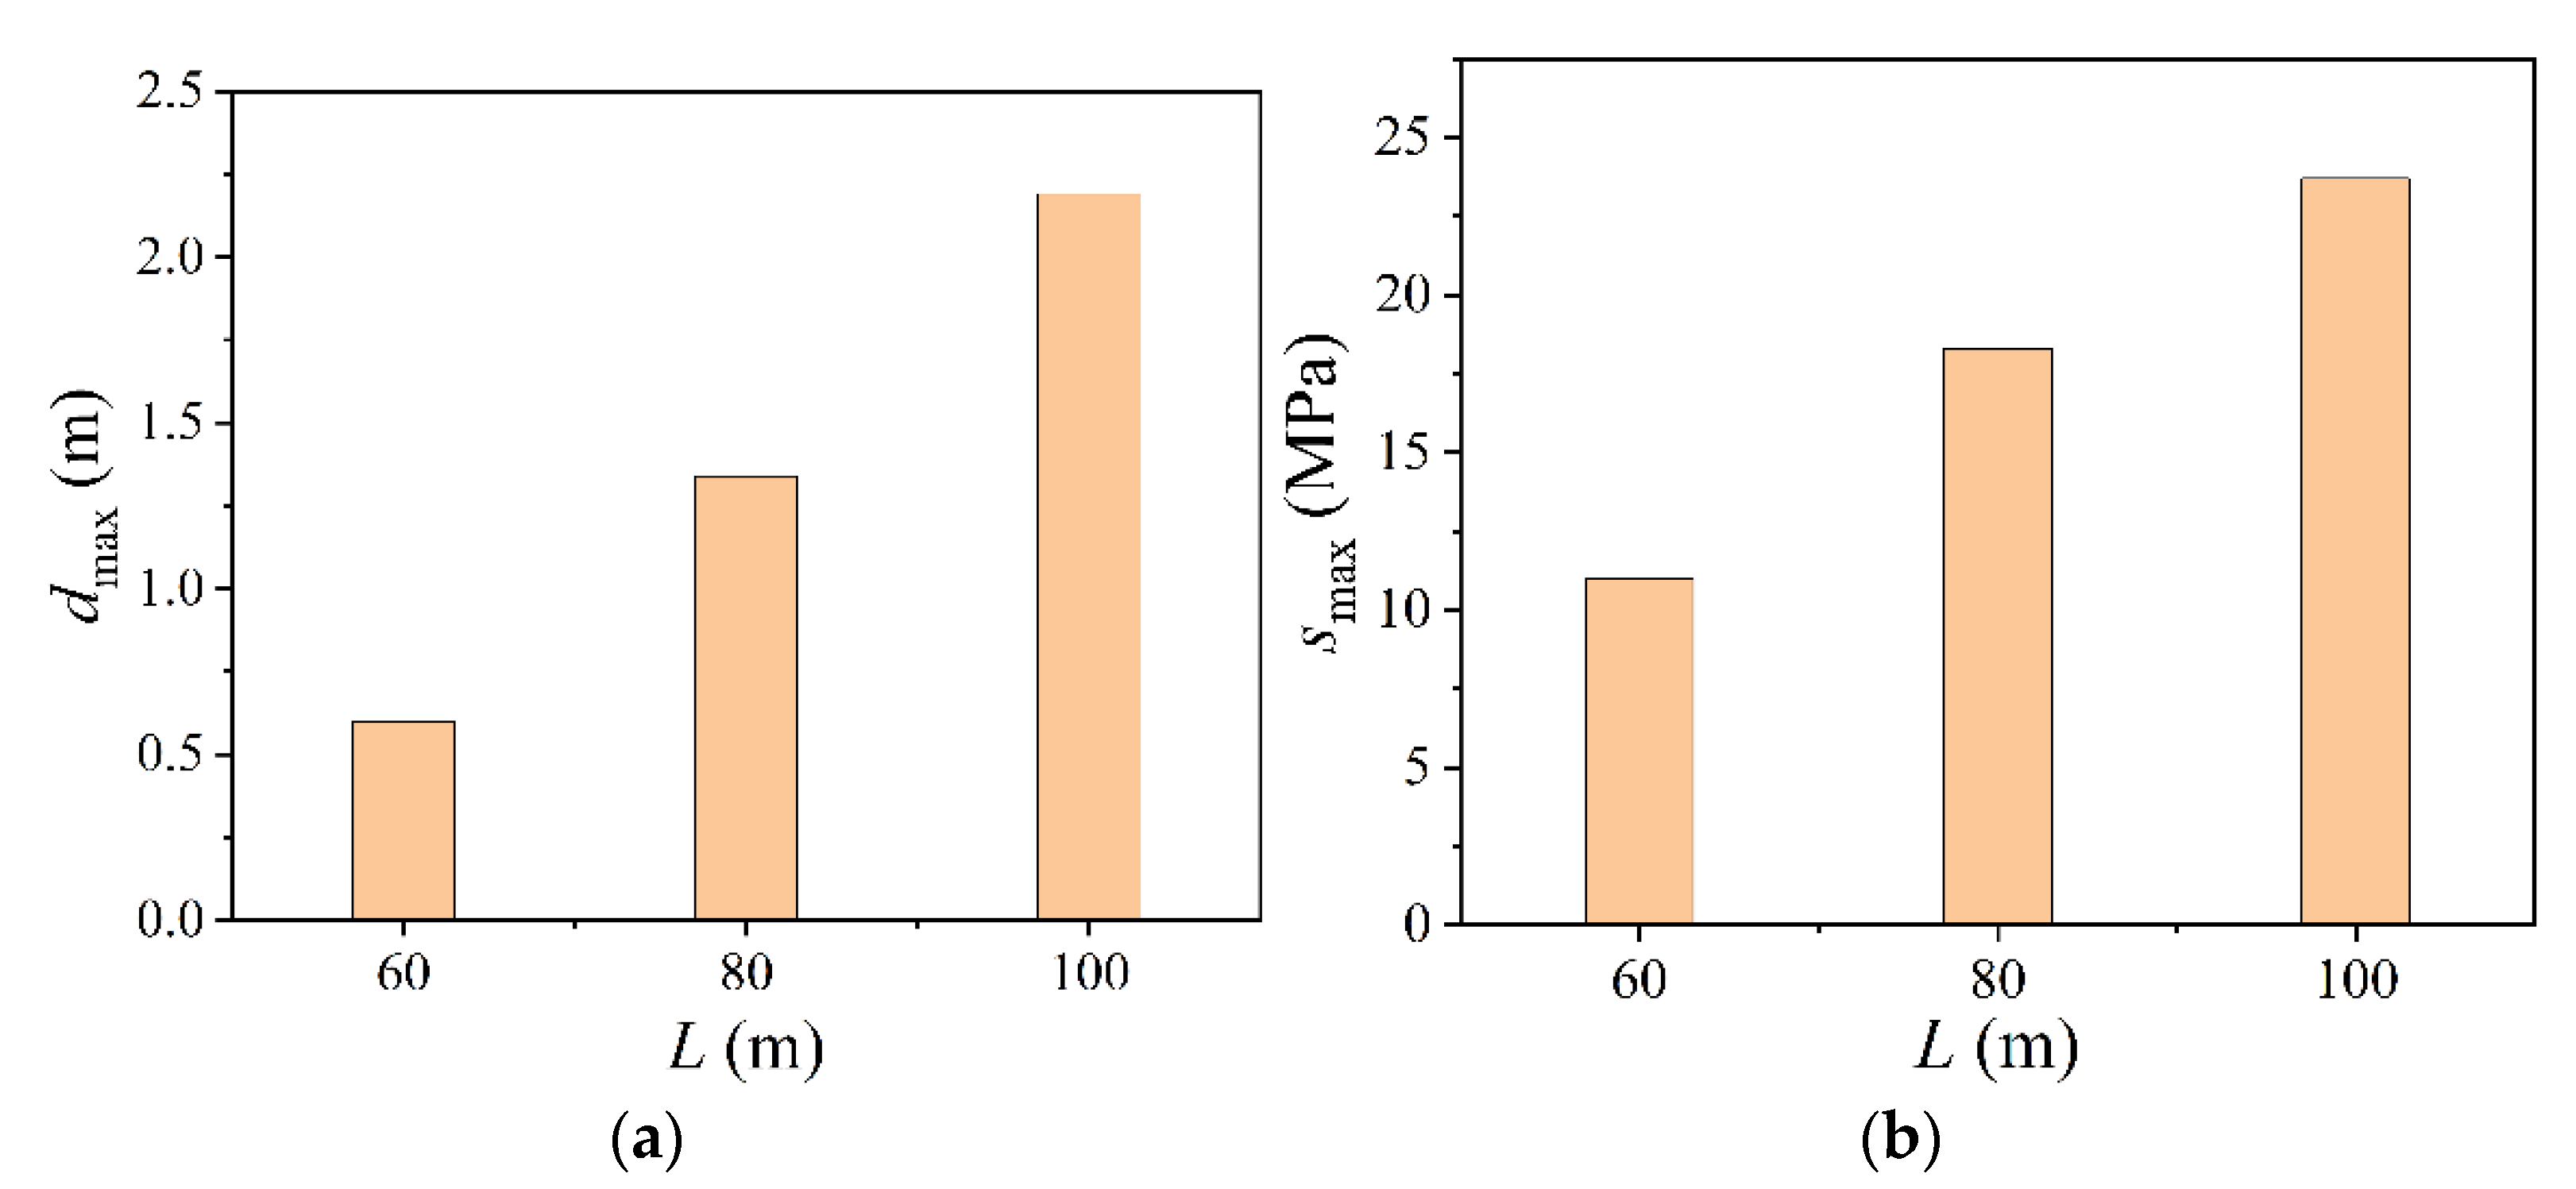
The effect of span on maximum structural response is shown in Figure 15, based on the study of a structure with H/L = 0.50 and p = 300 Pa at the basic wind velocity Uh = 15 m/s. When the span increases from 60 m to 100 m, the maximum displacement increases by 265%, and the maximum membrane stress response increases by 115%. The maximum displacement and membrane stress increase approximately linearly with the increment of span. By comparing Figure 15a,b, it can be found that the influence of span on the response of maximum structural displacement is more significant than that of maximum stress.
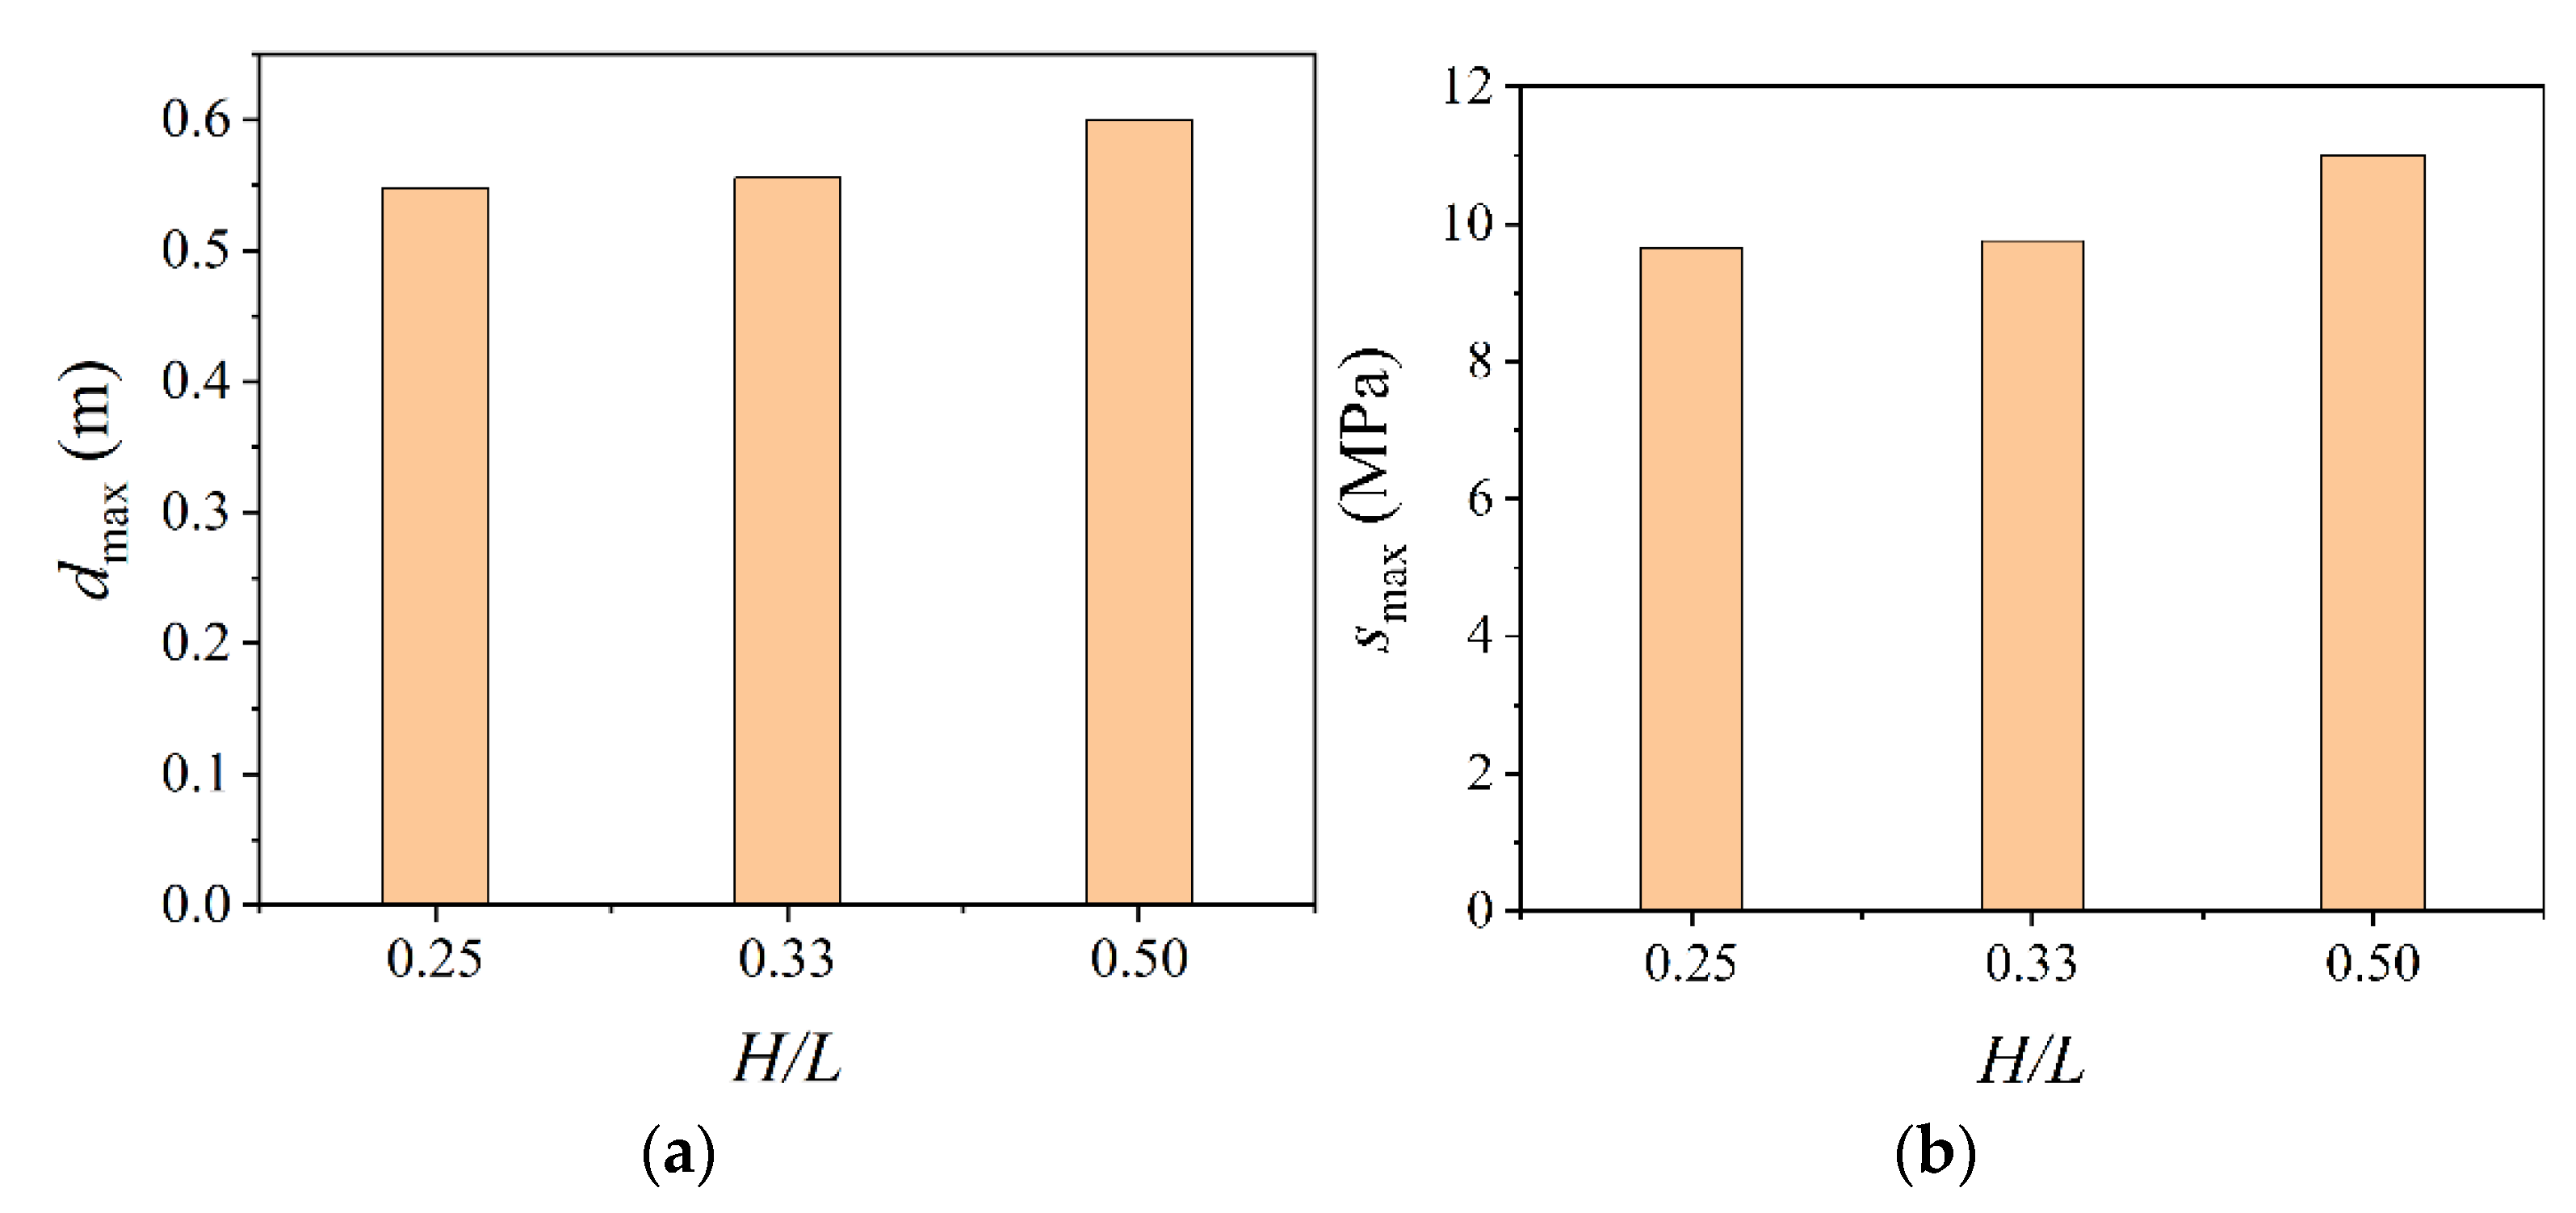
Figure 16 shows the effect of rise–span H/L on maximum structural response, based on the structure of L = 60 m and p = 300 Pa at the basic wind velocity Uh = 15 m/s. As can be observed from Figure 16, compared with the span, the rise–span ratio has less influence on the wind-induced responses of the structure. When the H/L is below 0.33, the maximum displacement and stress have changed a little. As the H/L increases from 0.25 to 0.50, the maximum displacement only increases by 11%, and the maximum stress increases by 14%.
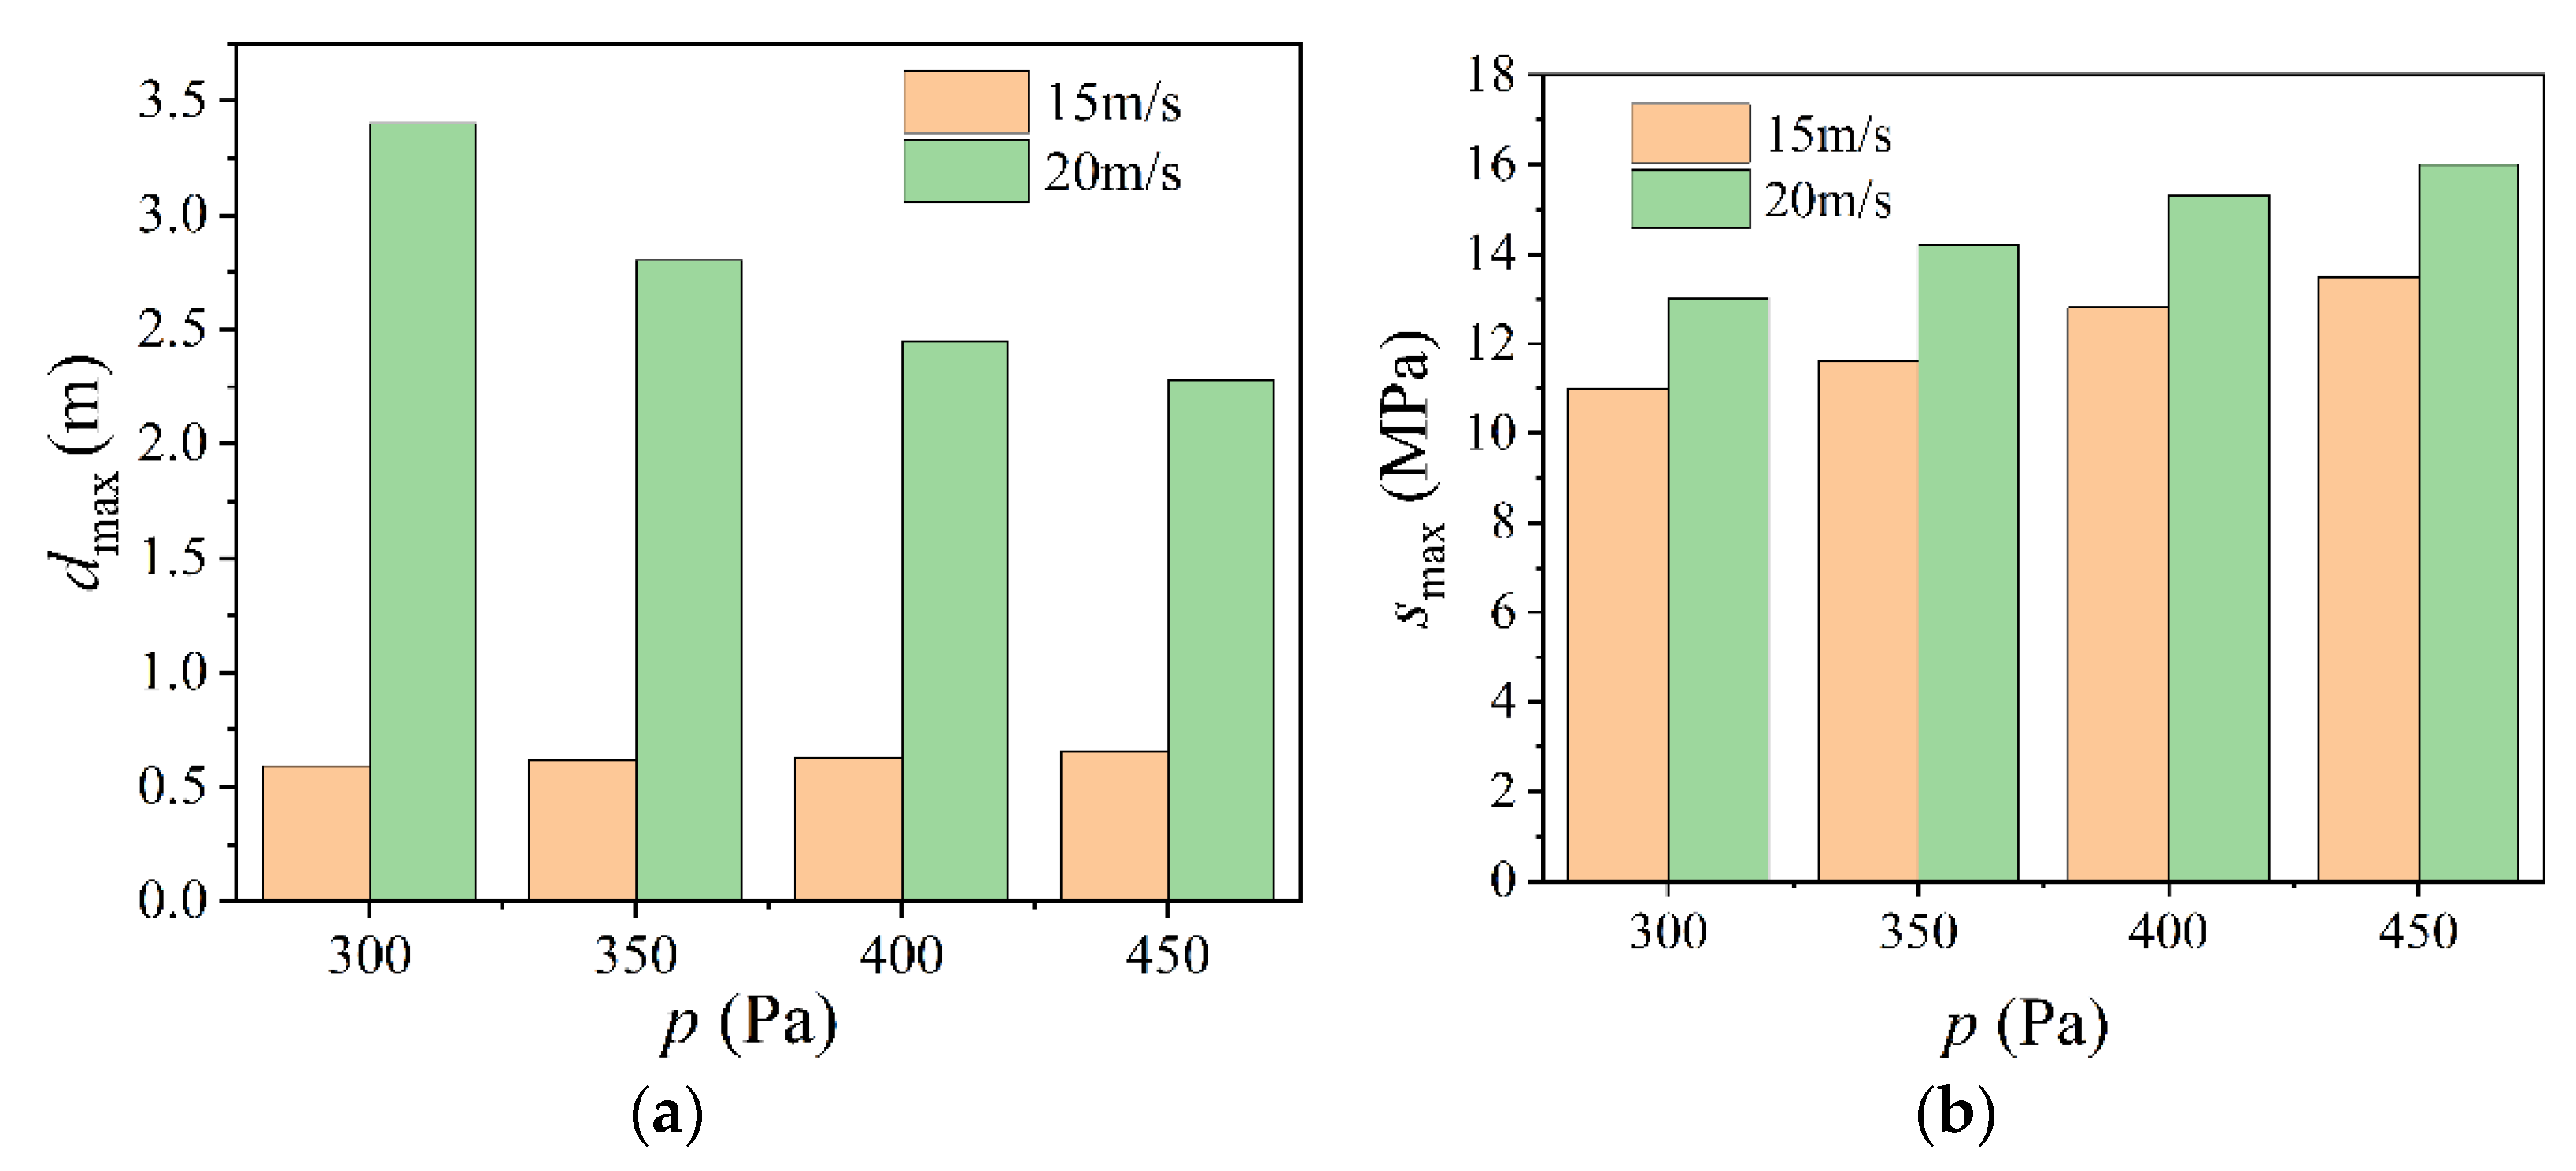
Based on the study of the structure with L = 60 m and H/L = 0.50 at Uh = 15 m/s and 20 m/s, the influence of internal pressure on structural response is presented in Figure 17. Under high wind velocity (Uh = 20 m/s), the maximum displacement of the structure appears on the windward region, and the structural deformation decreases with the increment of internal pressure. When the internal pressure increases from 300 to 450, the maximum displacement decreases by 33%, and the maximum stress increases by 23%. While for low wind velocity (Uh = 15 m/s), the maximum displacement is at the top region, which is less sensitive to the internal pressure. The maximum displacement and stress increase by 17 and 23% as the internal pressure increase from 300 to 450 Pa, respectively. Therefore, in practical engineering, the structural deformation caused by strong wind can be reduced by increasing internal pressure. However, it also results in the increment of membrane stress. Additionally, the strength of the membrane should also be considered when improving the internal pressure to reduce the structural deformation. When the internal pressure is too enormous, the membrane stress may exceed the tensile strength, resulting in membrane tearing failure, which deserves special attention in practice.

4.3. Influence of Cable Configurations

In practical engineering, the cables are usually applied to reduce the wind-induced response of the inflatable membrane structure. The influence of two cable configurations (Figure 1) on the structural response is discussed in this section.
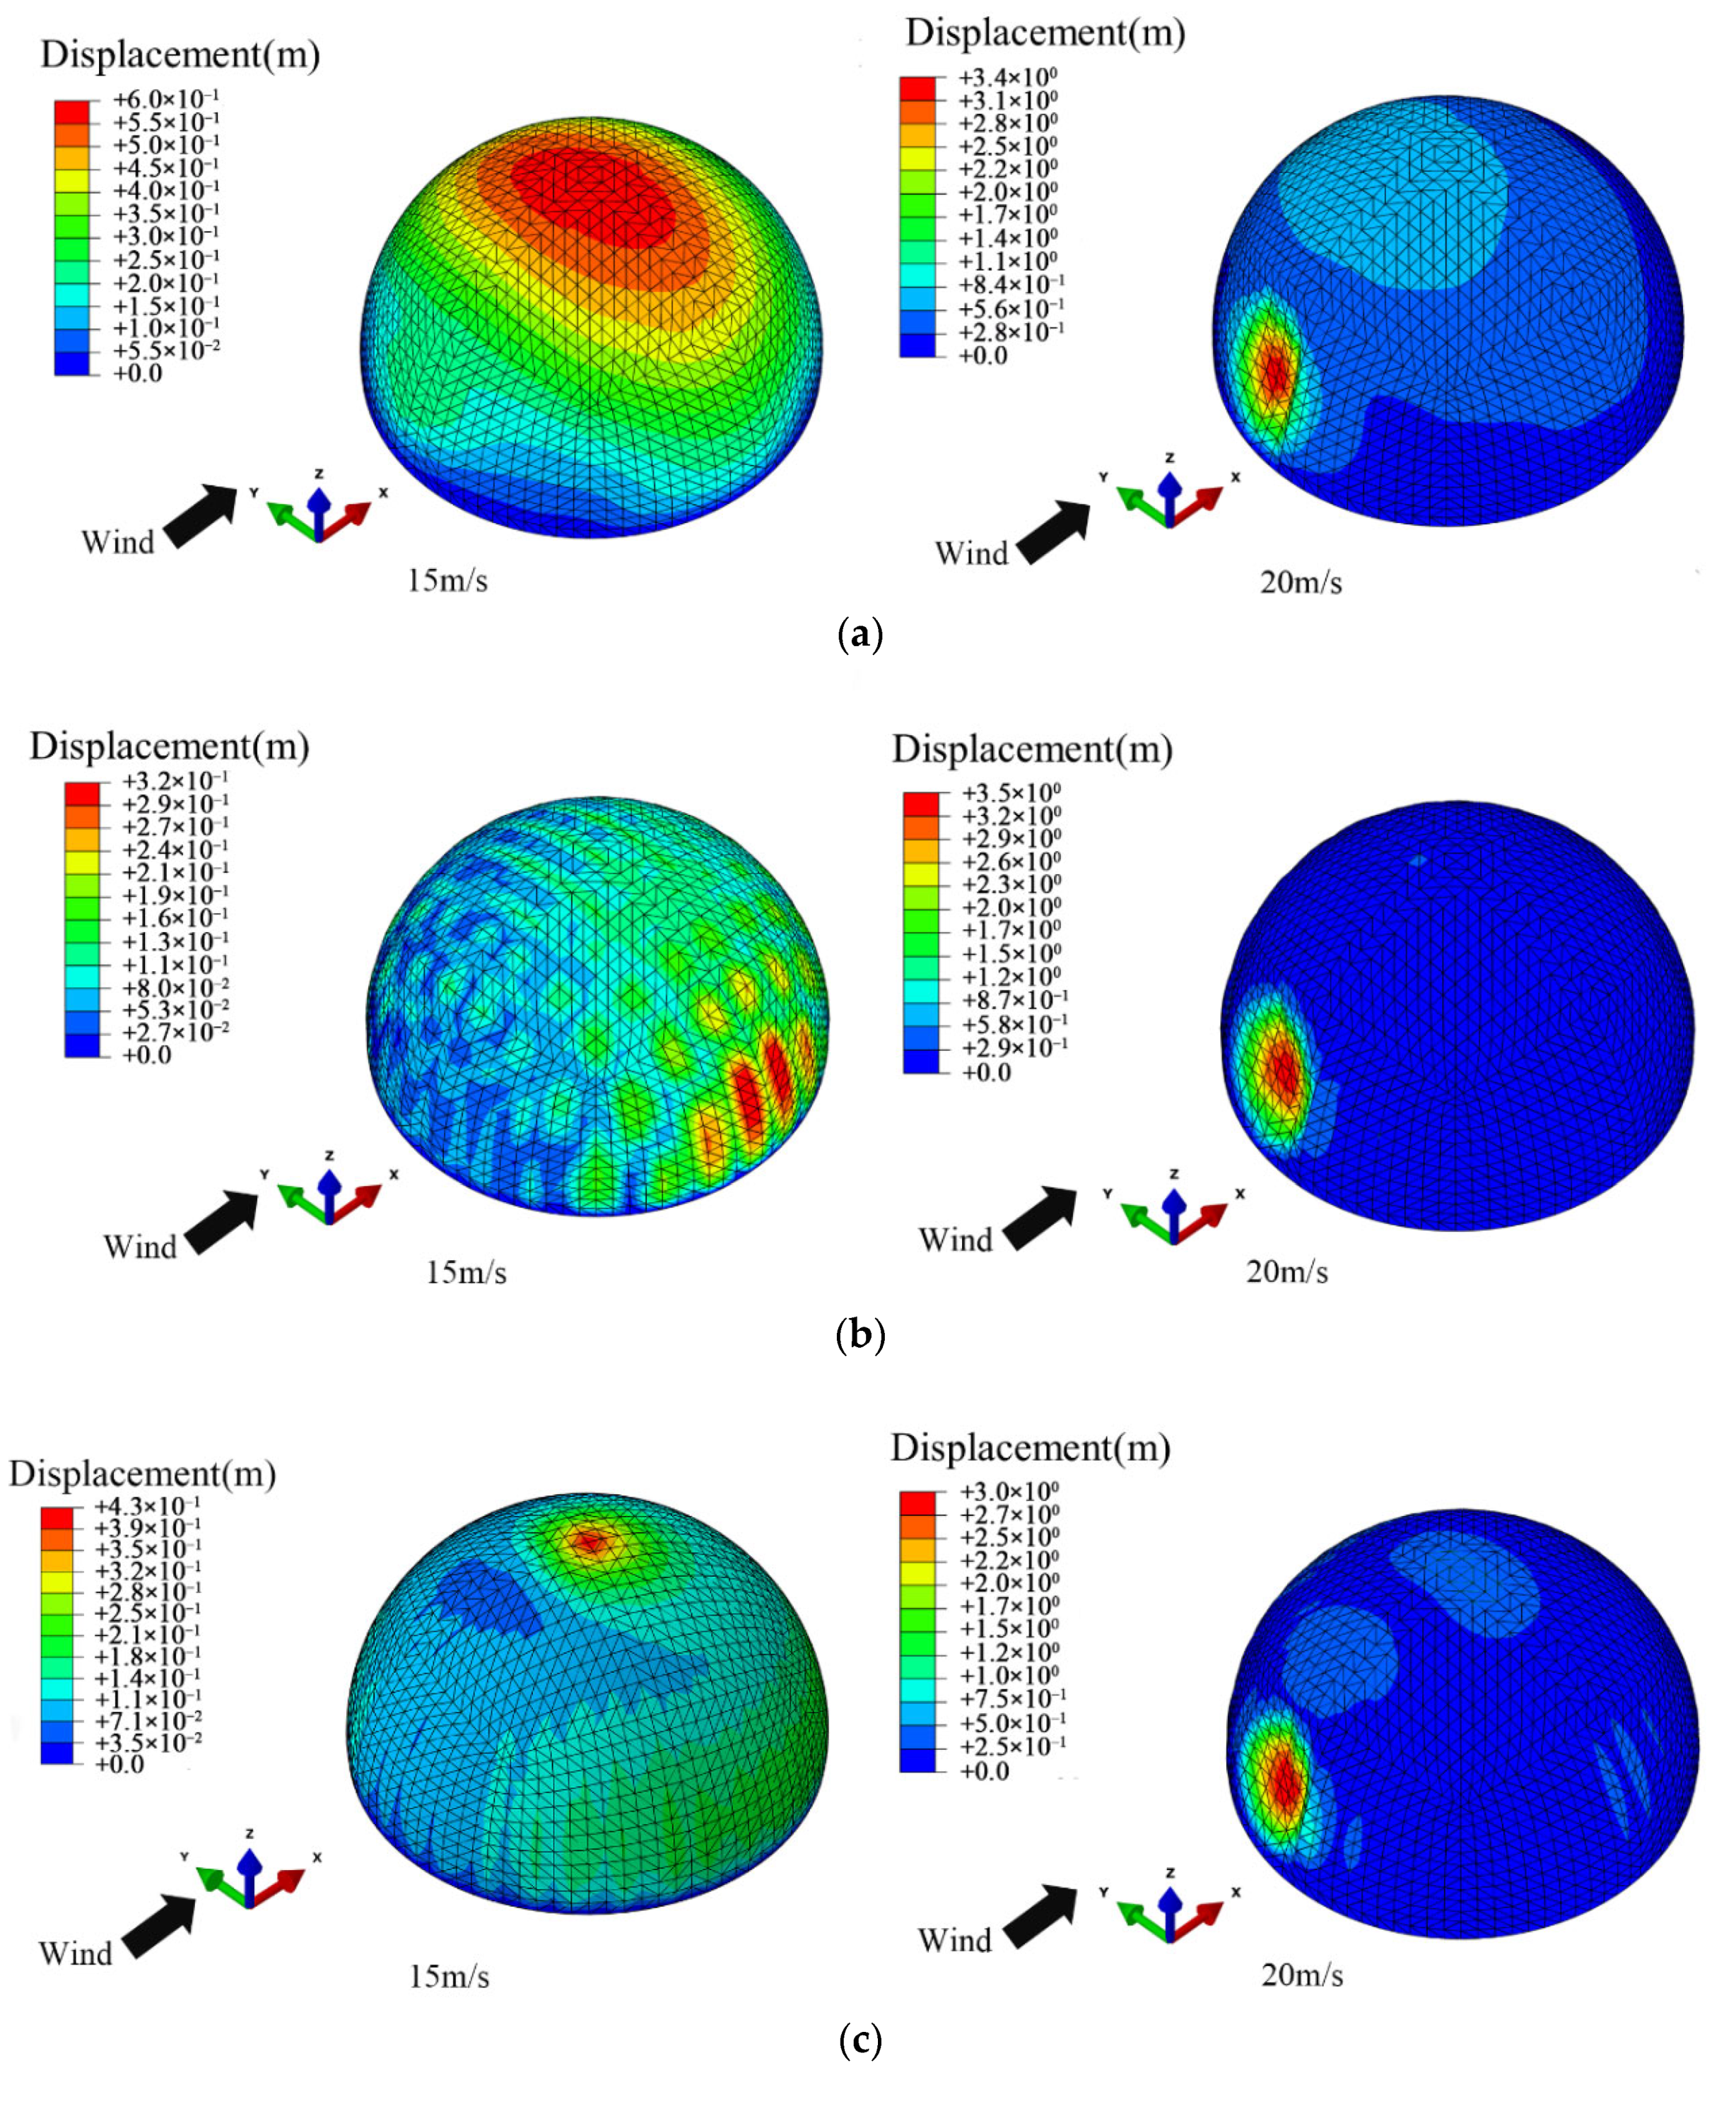
The contours of the maximum displacement of the structure with different cable configurations at low and high wind velocity are shown in Figure 18. It is observed that under low wind velocity, compared to the structure without cables, the maximum displacement point of the structure with cross cables changes from the top region to the side region, and the maximum displacement is significantly reduced by 47%. The maximum displacement point of the structure with radial cables is still at the top region, and the maximum displacement is reduced by 28%. The results indicate that the cross cables have a better limit on the wind-induced displacement of the spherical inflatable membrane structures than radial cables at low wind velocity (Uh = 15 m/s). However, when the wind velocity rises to 20 m/s, despite the cable configuration, the maximum displacements still appear at H/3 height on the windward region of the structures. Additionally, the maximum displacements are increased sharply, which may cause buckling instability of the structures. Therefore, the cables have little limitation under the strong wind.
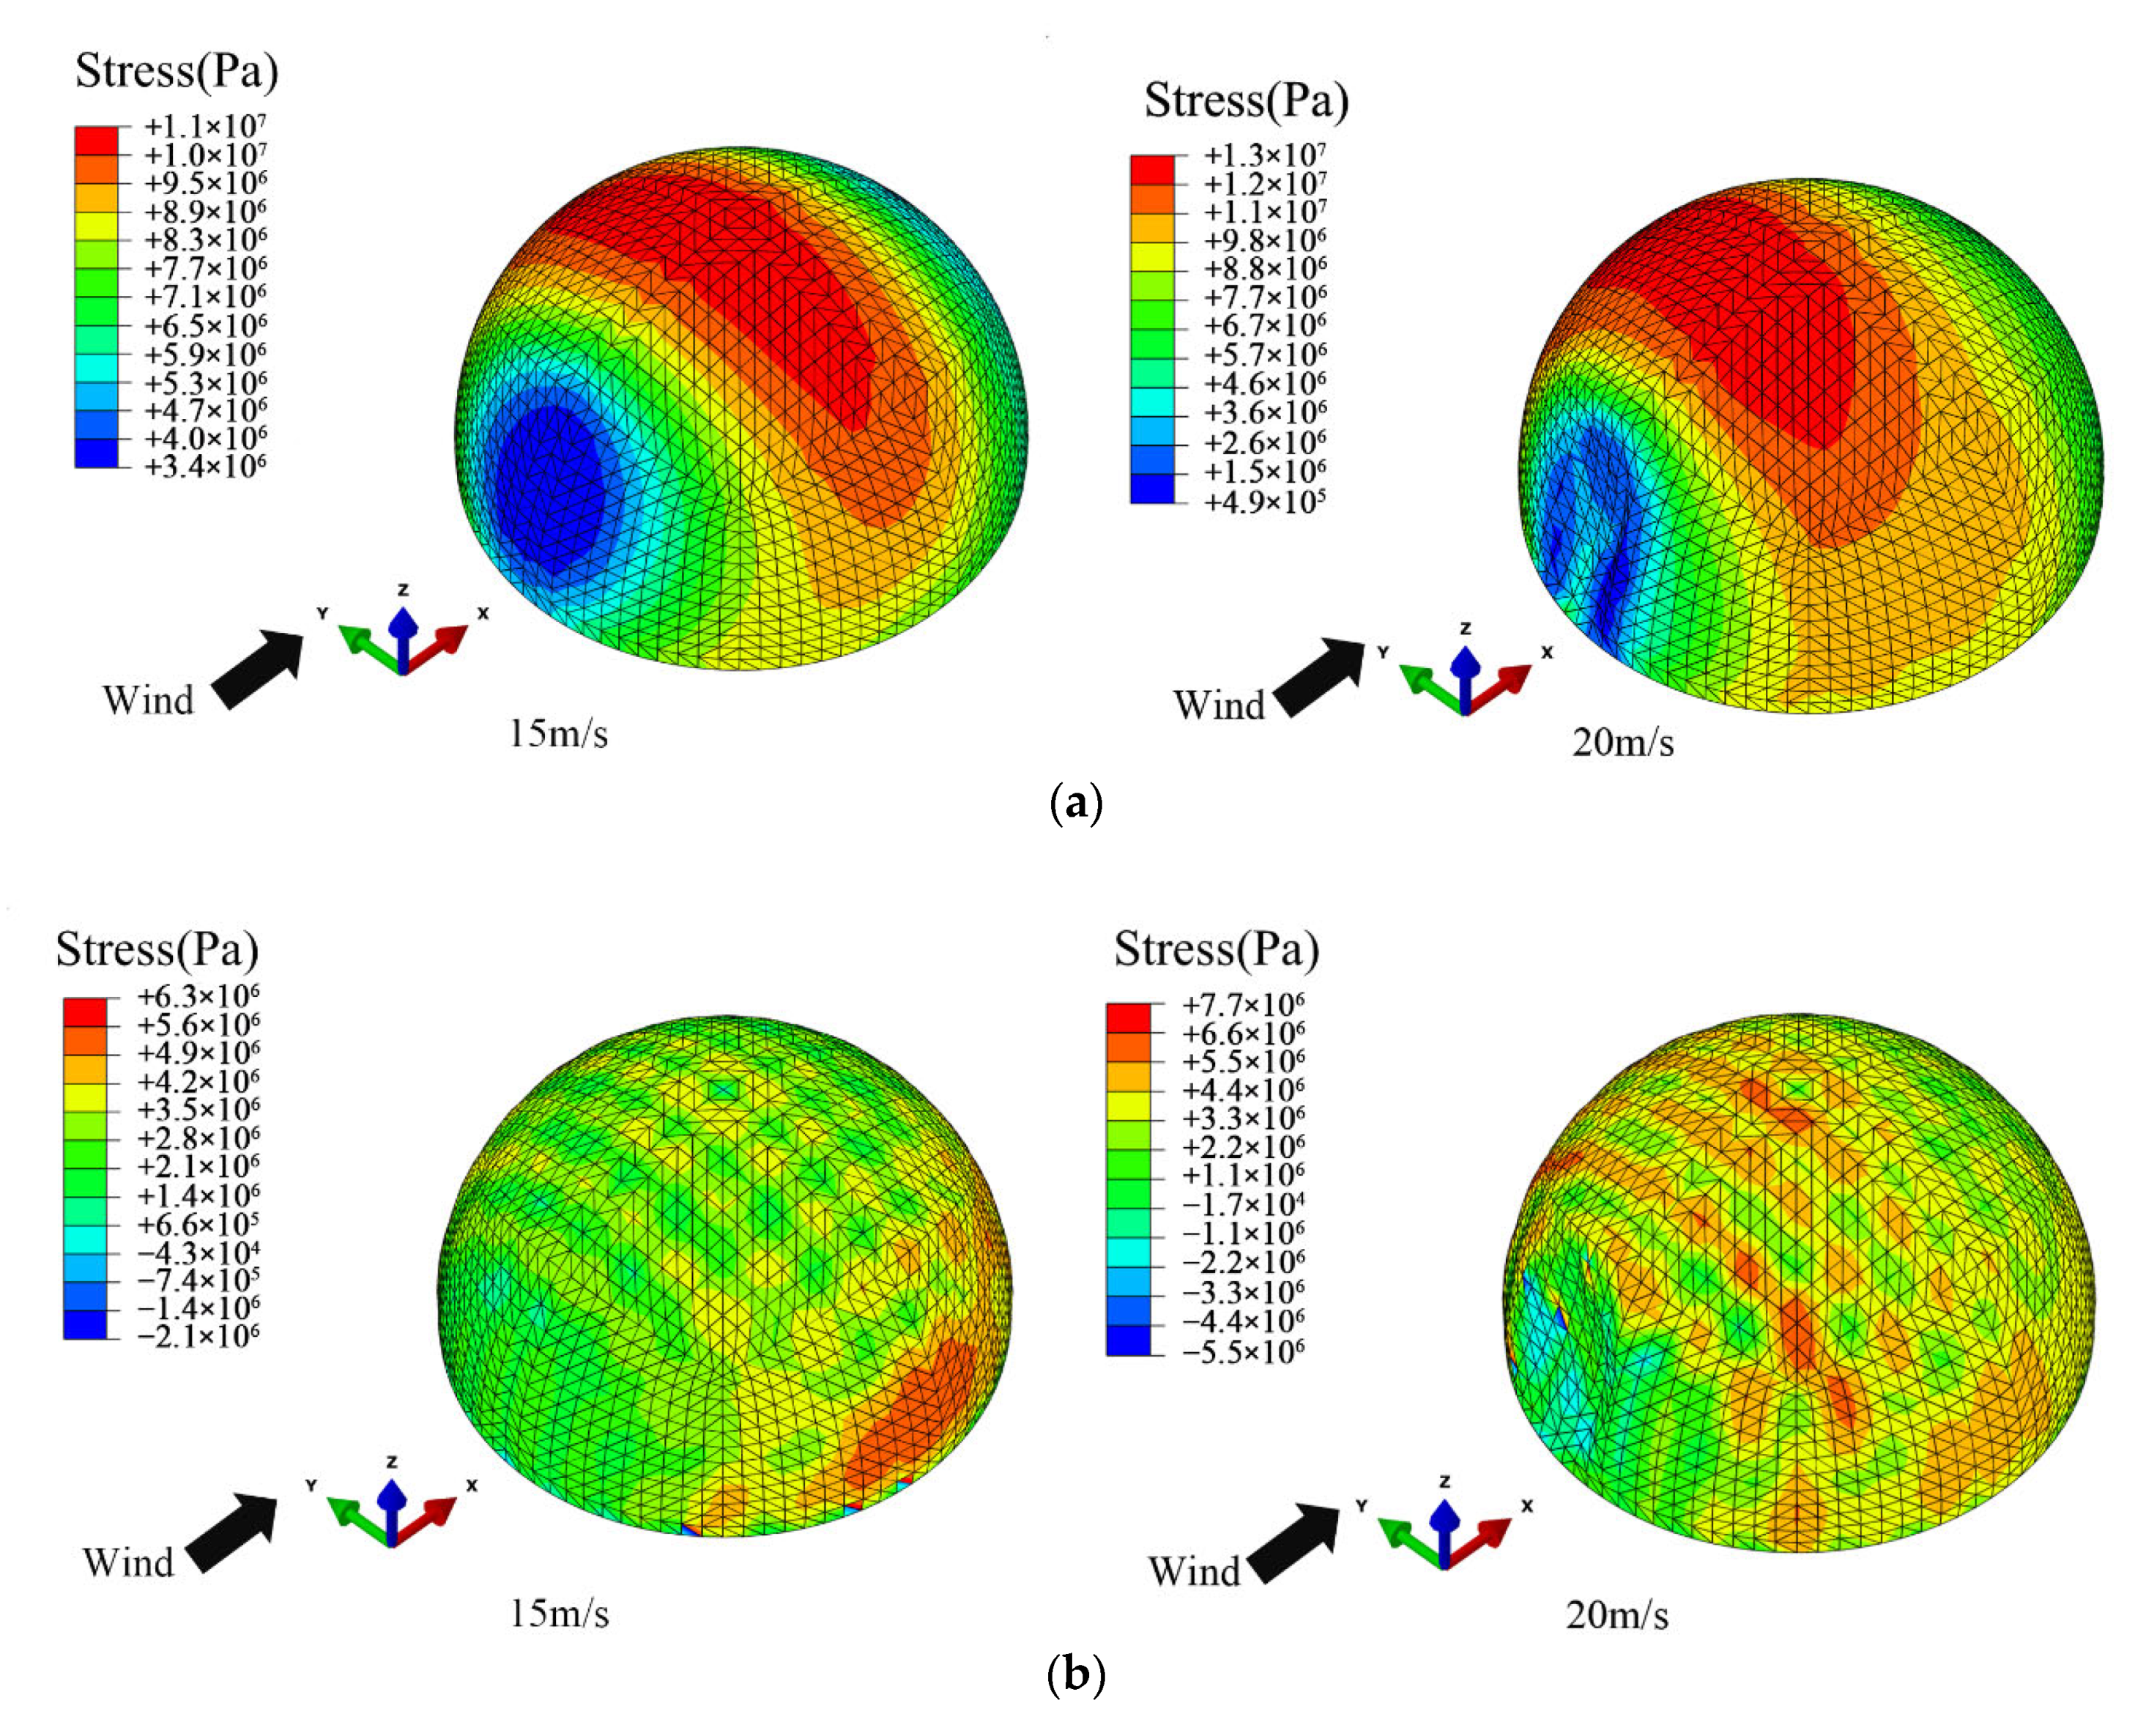
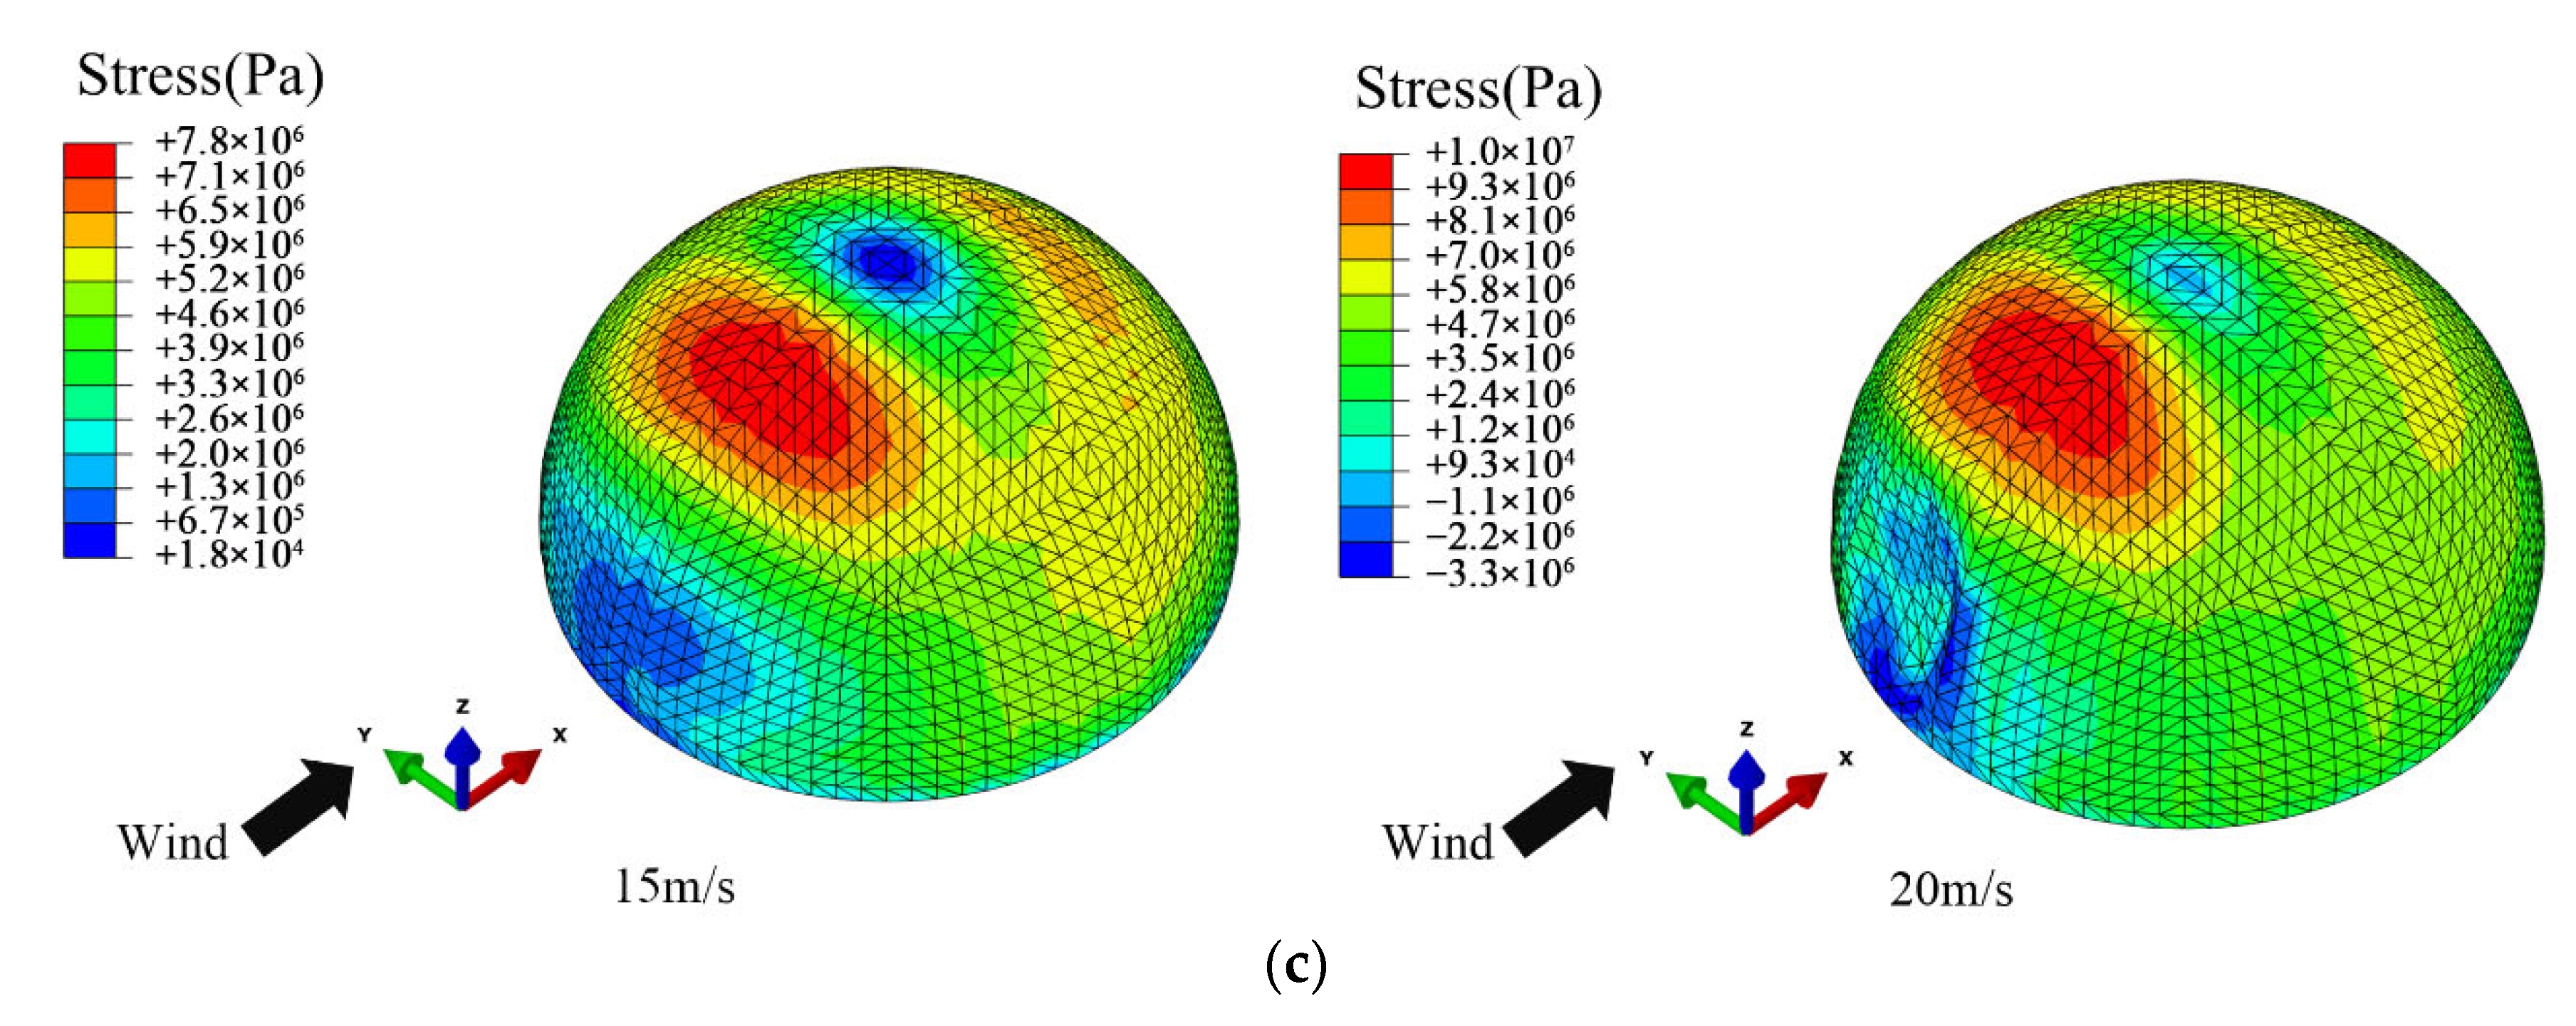
Figure 19 shows the contours of the maximum membrane stress of the structure with different cable configurations at low and high wind velocity. It can be seen that the stress distributions of the spherical inflatable membrane structures with different cable configurations are similar under high and low wind velocity. The maximum membrane stress point of the structure with cross cables changes from the top region to the side region. In addition, the maximum membrane stress point of structure with radial cables changes from the top region towards the windward region. From the whole distribution of membrane stress, the stress distribution of the structure with the cable is more uniform. It shows that the cables have a significant reduction effect on the stress response of the structure, which will be further discussed in the following part.
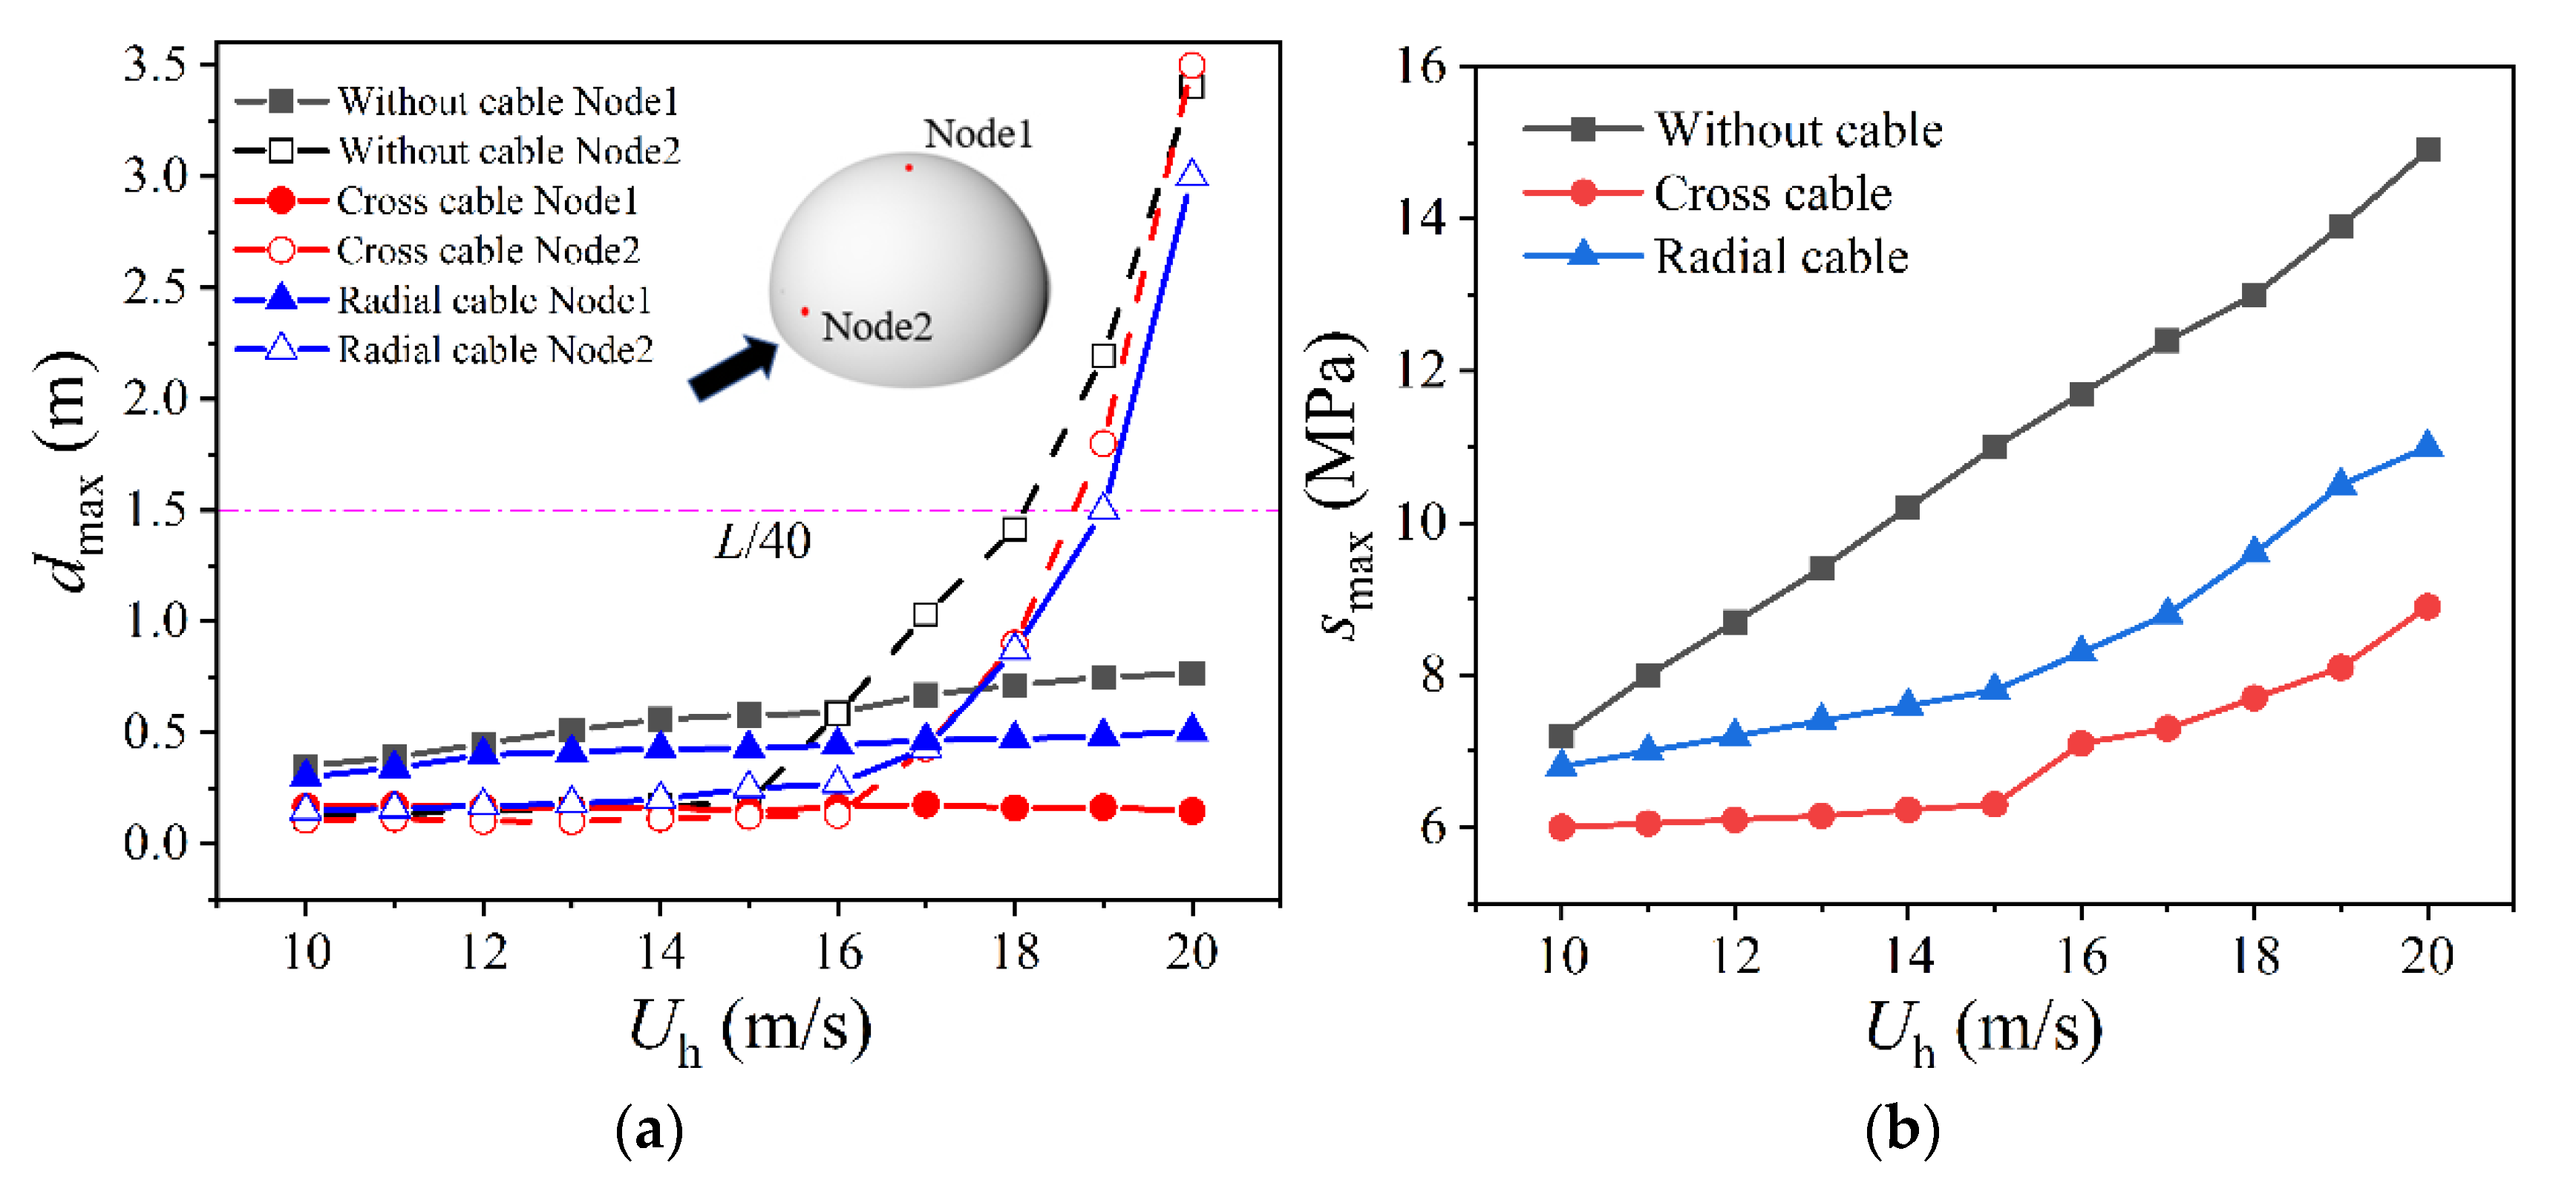
Based on the study of the structure with L = 60 m, H/L = 0.50, and p = 300 pa, the maximum responses of the structure with different cable configurations under different wind velocities are shown in Figure 20. According to the preceding, the maximum displacement of structure usually appears at H/3 height on the windward region and the top region. Therefore, the Node1 on the top region and Node2 on the windward region are selected for analysis in Figure 20a.
From Figure 20a, at low wind velocity (Uh = 0–15 m/s), the maximum displacement point of the structure is Node1. When the wind velocity reaches 16, 17, and 18 m/s, the maximum displacement points of the structure without cables, the structure with cross cables and radial cables, change from Node1 to Node2, gradually. Generally, the wind-induced displacement limit of the spherical inflatable membrane structure is known from experience to be L/40. Therefore, whether the cable is installed, the displacement of the structure exceeds the limit when the Uh = 19 m/s. Installing cables has no significant effect on controlling the wind-induced displacement after exceeding the limitation. It is because the stiffness of the inflatable membrane structure comes from internal pressure. When the wind load at Node2 exceeds the internal pressure, the structure loses the resistance to wind load, resulting in a large deformation. It is noteworthy that the Node1 position is subjected to wind suction, and the wind load direction is consistent with the internal pressure direction. At this position, the structure will not lose the ability to resist load due to increased wind pressure. Therefore, the displacement overrun position often occurs in Node2 rather than Node1. When the displacement of the structure exceeds its limitation, the peak displacement response of the structure increases rapidly with the increase of wind velocity, and such a large displacement is not allowed in engineering. Therefore, in the subsequent wind-resistant design method, the gust response factors are only applied when the structural displacement is within the limitation.
Figure 20b shows the maximum stress of structures with different cable configurations under different wind velocities. The results show that installing the cables can effectively reduce the stress of the structure. With the increase of wind velocity, the reduction effect of the cable on the structural stress is more obvious. The impact of cross cables on reducing the structural stress is better than radial cables. When the wind velocity is 20 m/s, the maximum stress of the structure with radial cable is reduced by 26.17%, and the maximum stress of the structure with cross cables is reduced by 40.26%. In addition, the tensile strength of the investigated membrane is 23.8 MPa. It can be found that the maximum membrane stress does not reach the tensile strength. Therefore, it can be concluded that the displacement overrun of the spherical inflatable membrane structure usually occurs before the strength failure.

5. Equivalent Static Wind-Resistant Design Method

5.1. Basic Framework of the Method

In the actual situation, the fluctuating wind loads will produce non-negligible dynamic effects that must be considered in the design. Therefore, the wind-induced response analysis of structure involves complex procedures, such as wind tunnel experiments and nonlinear random vibration analysis. It is difficult for designers to quickly determine the dynamic responses of the structures under fluctuating wind loads. To simplify the dynamic effect of wind, the equivalent static method as a simple wind-resistant design method was applied by scholars. The gust response factor (GRF) method has been used widely because of its simple form and practical convenience [33,34]. The dynamic response of the structure can be expressed by the static response under the mean wind load, which is defined by:
S e q = β S s t
where Seq is the equivalent static response; β is the gust response factor; Sst is the static response under mean wind load. In fact, the traditional equivalent static design method is made available for the linear structure. However, it is not suitable for inflatable membrane structures because of the nonlinearities. Therefore, Kandel et al. [25] introduced the nonlinear adjustment factor to evaluate the response of arch-supported membrane structures. Based on the equivalent static wind-resistance design method of tensioned membrane structures, this paper developed the required parameters of the equivalent static wind-resistance design method for spherical inflatable membrane structures.
According to the following equations discussed by Kandel [25], the equivalent static wind-resistant method by introducing the nonlinear adjustment factor μ can be expressed as:
S e q = μ β S s t
μ = max j S ¯ j max j S s t j
where max j S ¯ j is the maximum value of the mean response in the dynamic analysis results under fluctuating wind load; max j S s t j is the maximum response in the static analysis results under mean wind load. The formulas of displacement-based gust response factor βdj and stress-based gust response factor βsj of node j are as follows:
β d j = 1 + g σ d j d ¯ j
β s j = 1 + g σ s j s ¯ j
where g is the peak factor, the value is 4.0 by analyzing the data of wind tunnel experiment; σ d j and σ s j are the standard deviation values of the displacement and membrane stress of the node j, respectively; d ¯ j and s ¯ j are the mean values of displacement and membrane stress of node j, respectively.
The wind-resistant design method is for the responses of the structure within the deflection limitation. Therefore, the cases of wind velocity 15 m/s were used to calculate the gust response factor. The contours of displacement-based gust response factors and stress-based gust response factors of a spherical inflatable membrane structure with H/L =0.50 are shown in Figure 21. Peak values of displacement-based gust response factors and stress-based gust response factors appear on the windward region. However, by observing the displacement and stress distribution of the structure from Figure 13 and Figure 14, it can be found that the position of maximum response appears at the top of the structure, and the responses of other regions are small. The design results will be too conservative if the maximum displacement-based and stress-based gust response factors are used as structural gust response factors.
Therefore, in order to more reasonably determine the structural gust response factors, the maximum dynamic response is selected as the control index for the structural gust response factor, which are determined as follows:
β d * = max j ( β d j d ¯ j ) max j d ¯ j
β s * = max j ( β s j s ¯ j ) max j s ¯ j
where β d * and β d * are structural gust response factors for displacement and stress, respectively.

5.2. Recommendations of the Factors

According to the above wind-resistant design method of inflatable membrane structures, this section presents the displacement-based and stress-based gust response factors, which are usually the focus of researchers. Considering the space limitation, only the gust response factors of the structure without cables on different structural parameters are given, as shown in Table 5.
For convenience in application, the gust response factors of different structural parameters can be expressed by a multivariate linear regression formula, and its expression follows:
β = a 1 p E + a 2 L t + a 3 H L + k
where p is the internal pressure (Pa); E is the elastic modulus of membrane (Pa); L is the span of spherical inflatable membrane structure (m); t is the thickness of membrane (m); H is the rise of the spherical inflatable membrane structure (m); k is the intercept; ai is the regression coefficient. Different from the tensioned membrane structure, the membrane prestress of the inflatable membrane structure is caused by the internal pressure. Thus, Equation (19) considers the influences of internal pressure, span, and rise–span ratio on gust response factors for inflatable membrane structures.
In addition, in the calculation process, it is observed that the nonlinear adjustment factors of spherical inflatable membrane structures are insensitive to the structural parameters. The values are unchanged with the change in the structural parameters. Therefore, the mean values of nonlinear adjustment factors are selected as the recommendation value. The recommended gust response factors and nonlinear adjustment factors of the spherical inflatable membrane structure are shown in Table 6. Consequently, in the engineering design, based on the gust response factors and nonlinear adjustment factors provided in Table 6 for different conditions, the dynamic responses of the spherical inflatable membrane structures can be calculated from structural static response under the mean wind load by Equation (13).

5.3. Result Verification

To verify the accuracy of the empirical formulas in Table 5, based on the structure with cables, L = 60 m and p = 300 Pa, Figure 22 compares the gust response factors obtained by the empirical formula and nonlinear time–history analysis. It can be seen that the factors obtained by empirical formulas are in good agreement with the factors obtained by nonlinear time–history analysis. Additionally, the results of other cases are also consistent.
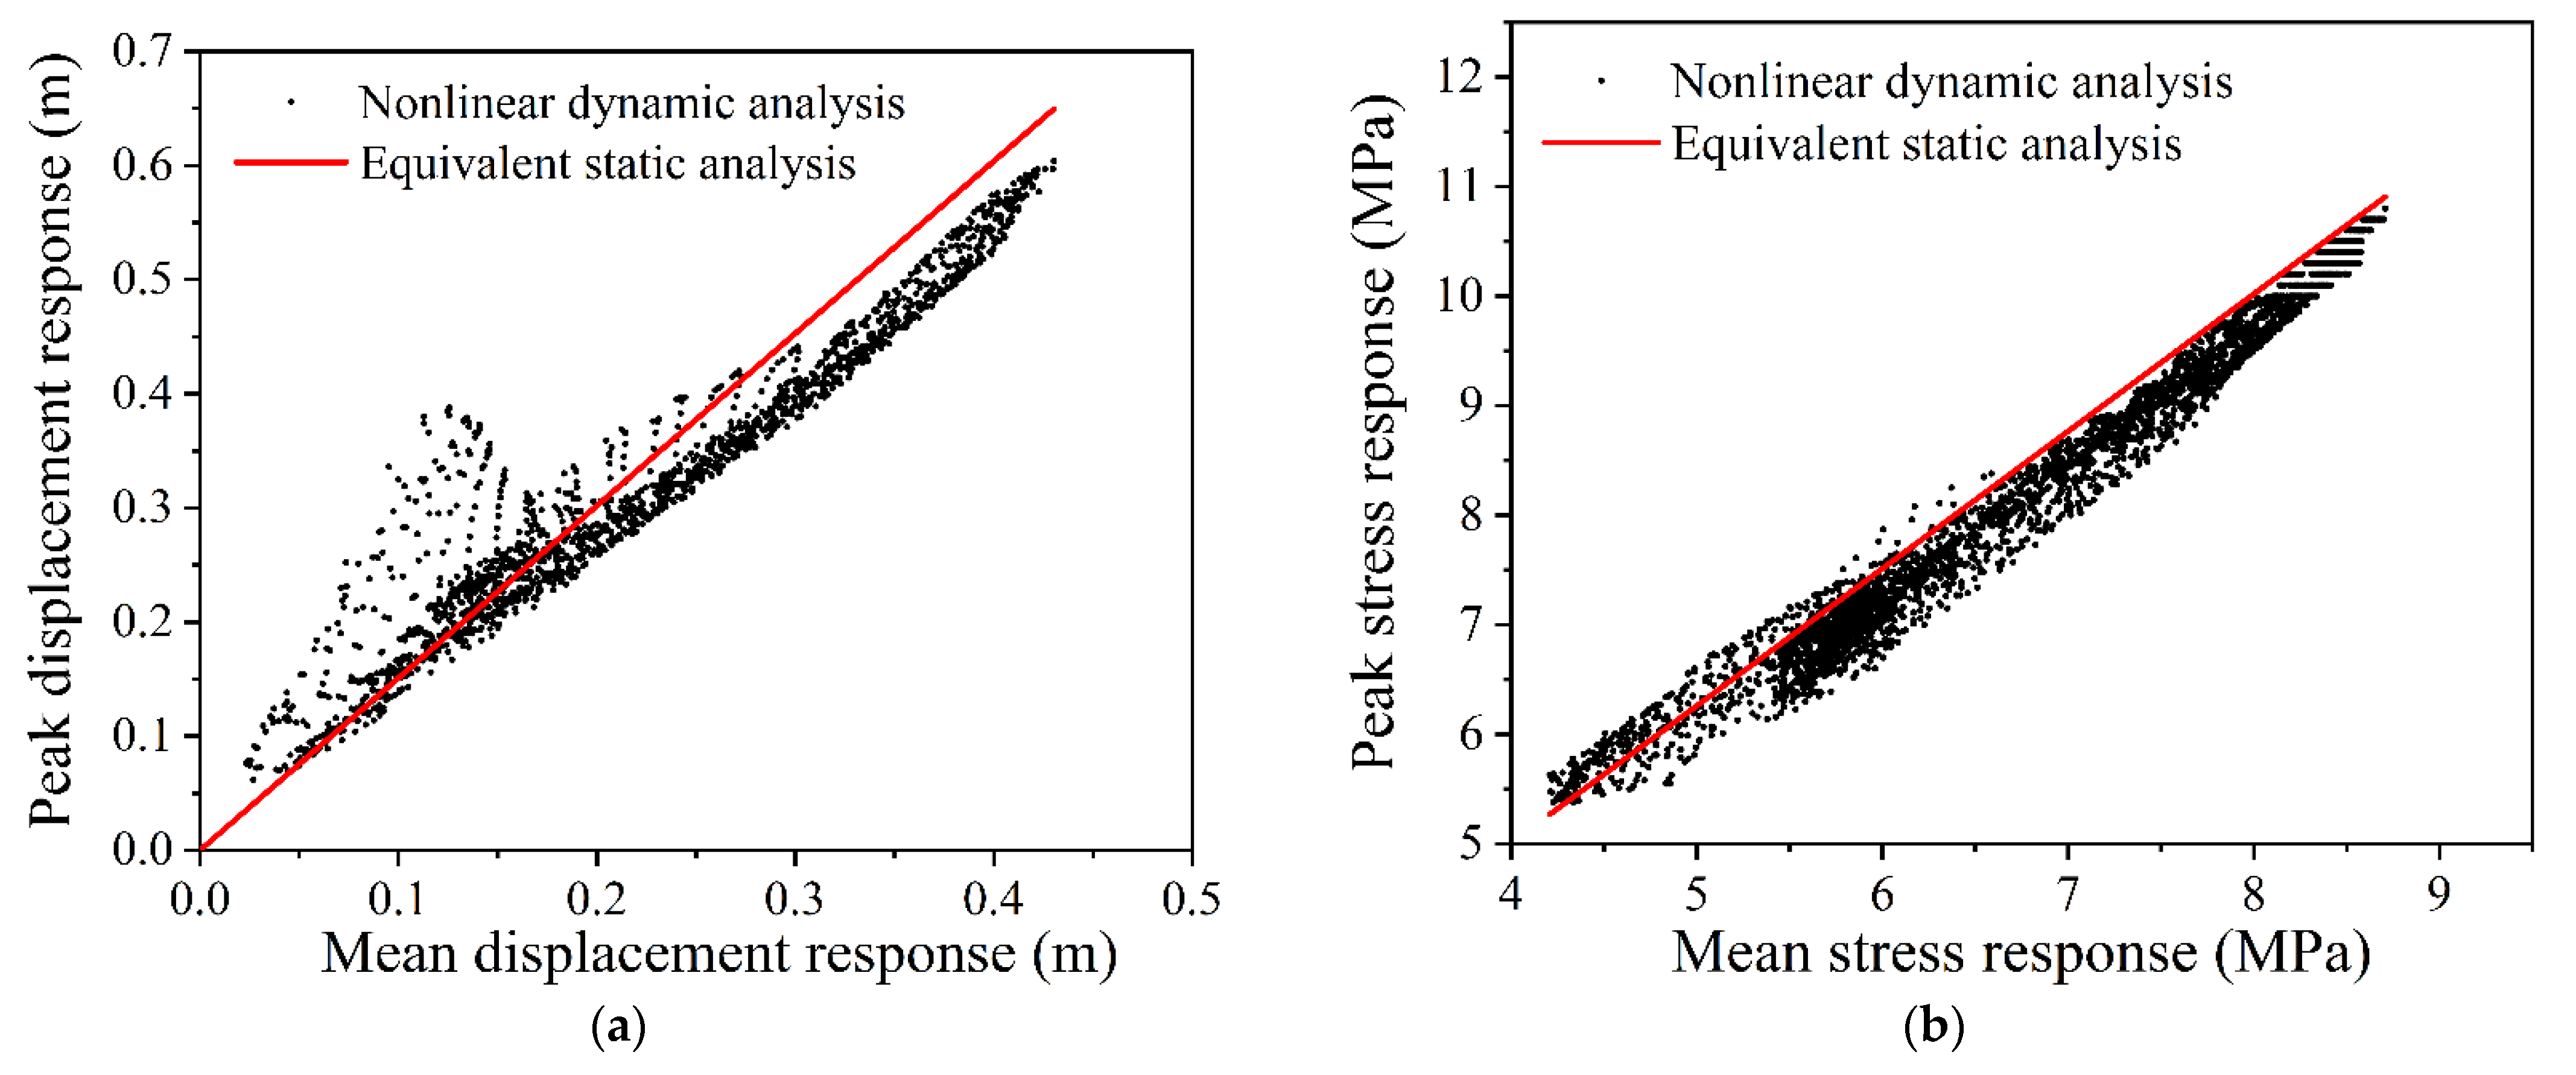
Figure 23 shows the comparisons between the equivalent static response results and nonlinear dynamic analysis results of the structure with H/L = 0.5, L = 60 m, p = 300 Pa. From the equivalent static analysis results in Figure 23, it can be concluded that the response of the structure has an excellent equivalent effect, and the peak response of equivalent displacement is 7.32 % larger than the maximum displacement of the nonlinear dynamic analysis method. In addition, the peak response of equivalent stress is 0.93% larger than that of the nonlinear dynamic analysis method. The coefficient of determination R-square of equivalent displacement and dynamic displacement is 0.94, and the coefficient of determination R-square of equivalent stress and dynamic stress is 0.98, showing a good correlation.
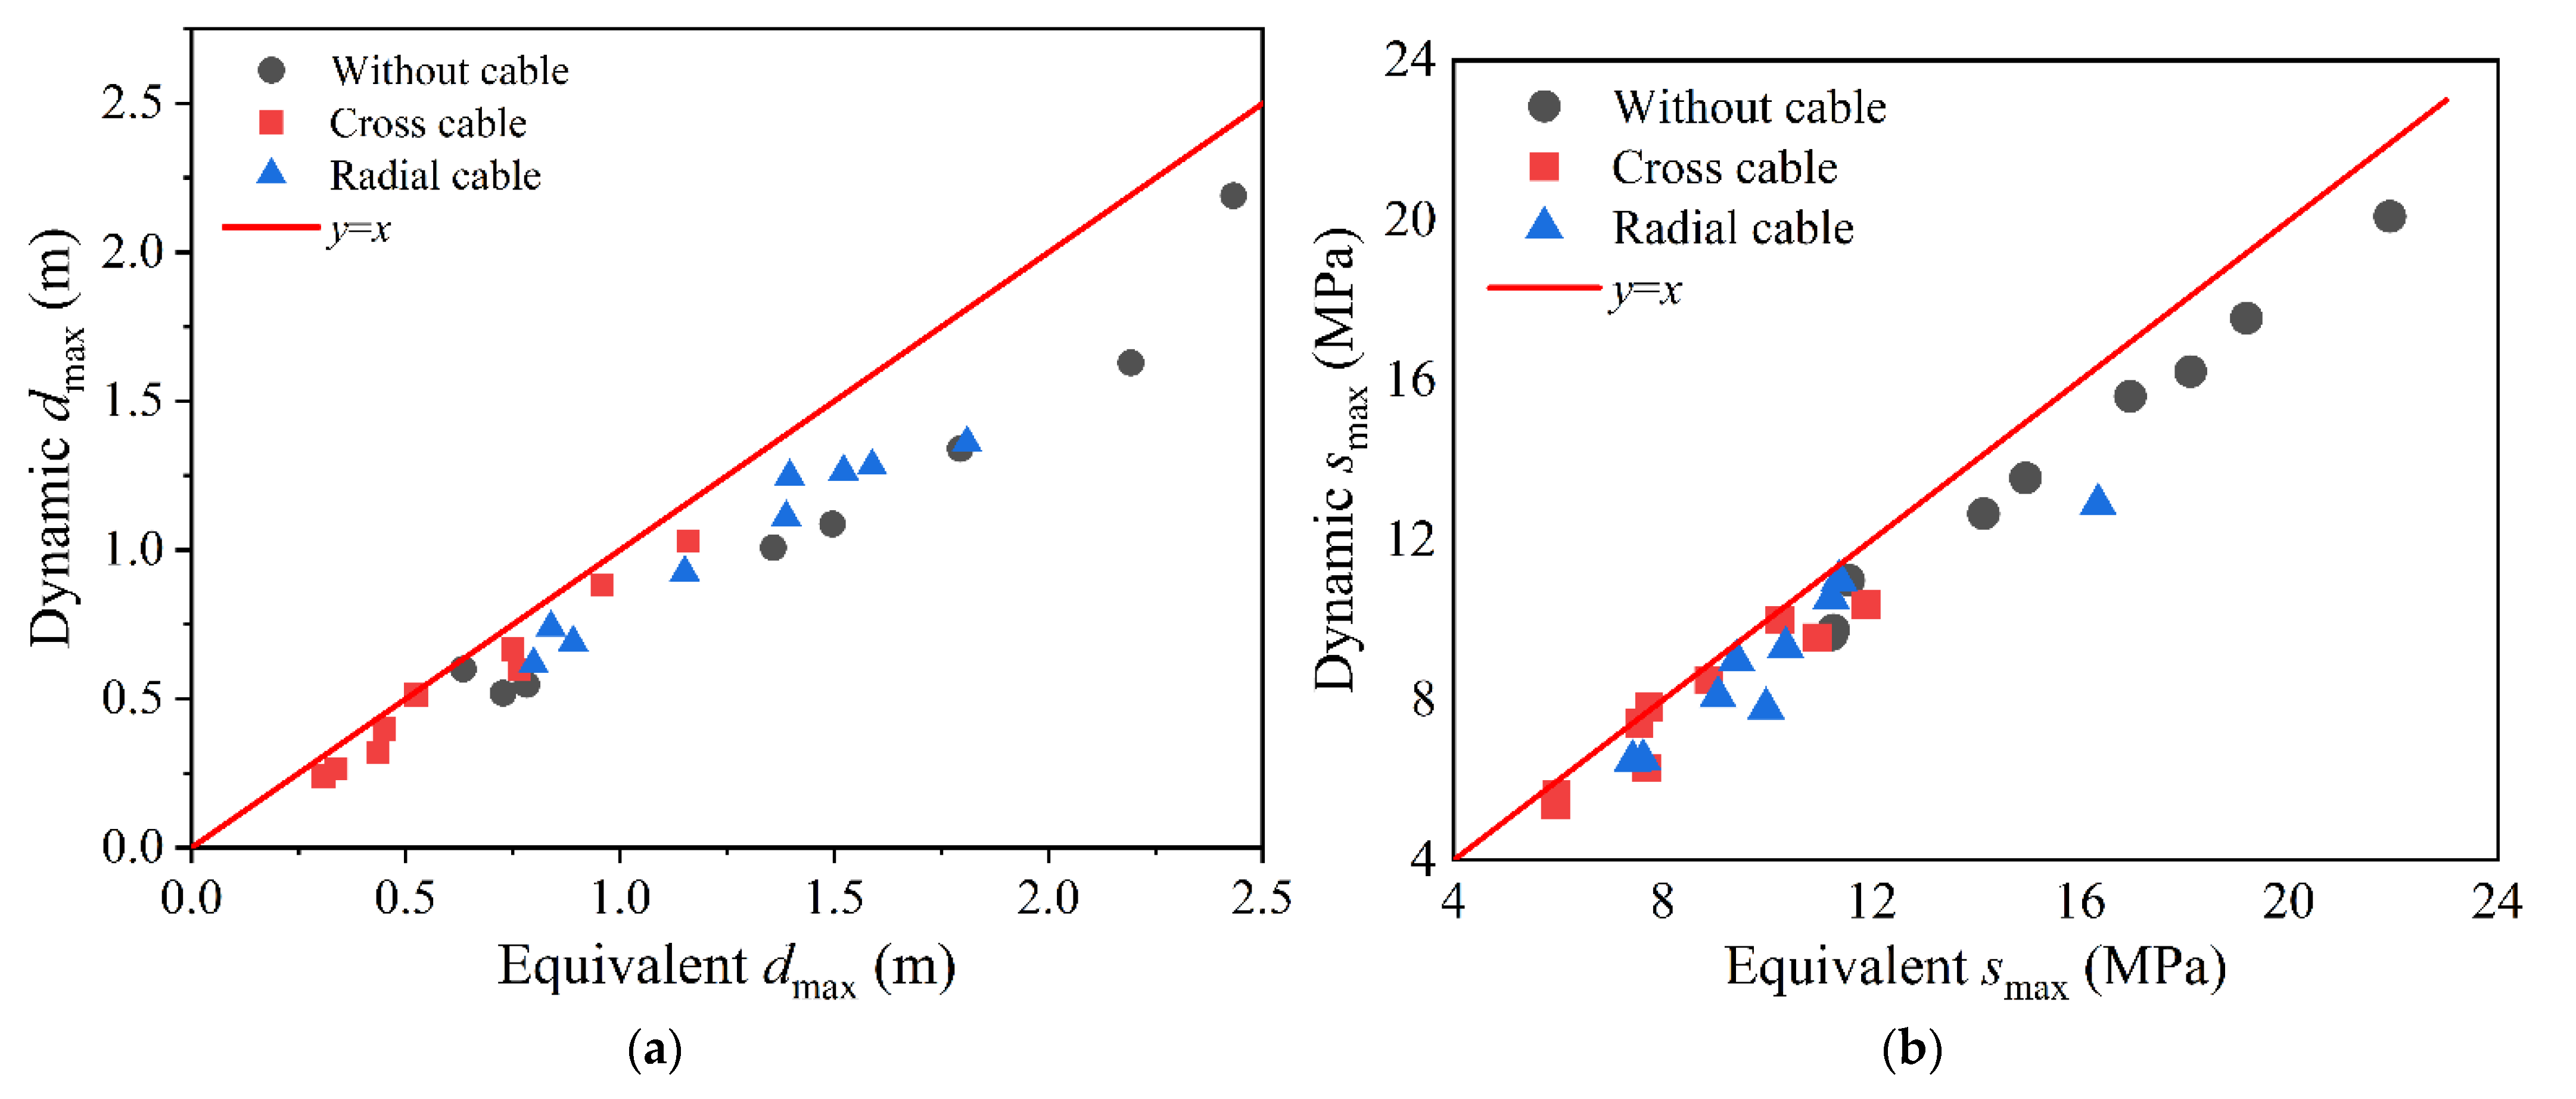
The dynamic analysis response results and equivalent static response results of different cable configurations are compared in Figure 24. The coefficient of determination R-square of equivalent displacement and dynamic displacement is 0.98, and the coefficient of determination R-square of equivalent stress and dynamic stress is 0.98. There is a significant correlation between dynamic response and equivalent response. It can be concluded that the presented response-based equivalent static wind-induced design method can well envelope the peak response of the structure, meeting the requirements used in practical engineering.

6. Conclusions

The present research aims to obtain the wind-induced response characteristics and provide a feasible equivalent static wind-resistant design for spherical inflatable membrane structures. Firstly, the wind load on the spherical inflatable membrane structure is obtained by wind tunnel experiments on rigid models. The wind-induced responses of spherical inflatable membrane structures are calculated via the nonlinear dynamic time–history analysis method. The influences of different parameters such as span, rise–span ratio, internal pressure, and cable configuration on the wind-induced responses are parametrically analyzed. Finally, an equivalent static wind-resistant design method for spherical inflatable membrane structures is formulated. The main conclusions are summarized as follows:
(1)
The raised wind-induced deflection at the top is dominant at low wind velocity. At high wind velocity, the concave wind-induced deflection on the windward region becomes dominant, which is prone to exceed the deflection limitation. In this case, the wind resistance of the structural windward region should be improved.
(2)
With the increment of span and rise–span ratio, the wind-induced responses of spherical inflatable membrane structures will be increased. However, the influence of the rise–span ratio is less significant than that of span. At high wind velocity, enhancing the internal pressure can effectively reduce deflection, but it also results in the increment of membrane stress. Particular attention should be paid to checking the strength.
(3)
Installing cables could effectively control the overall wind-induced deflection and stress. The control effect of cross cables proved to be better than radial cables. The reduction effect on the stress response improved with the increment of wind velocity. However, the effect on the displacement of the windward region is limited, particularly when it exceeds the deflection limitation.
(4)
An equivalent static analysis method for the wind-resistant design of spherical inflatable membrane structures based on gust response factors and nonlinear adjustment factors is developed. The empirical formulas of gust response factors and recommendation values of nonlinear adjustment factors for spherical inflatable membrane structures are provided for engineering reference. The equivalent static analysis results well envelope the nonlinear dynamic analysis results, and the coefficients of determination reach 0.98. The method proved to be feasible.
(5)
The gust response and nonlinear adjustment factors given in this paper are only applicable to the spherical inflatable membrane structures under given conditions. For other conditions, the factors need to be further calculated. In addition, it is found in this study that the spherical inflatable membrane structures are subject to buckling instability at a certain wind velocity. The critical wind velocities at which this instability occurs need to be further investigated.

Author Contributions

Conceptualization, Z.C. and N.S.; methodology, Z.C. and N.S.; data curation, J.Z. and Z.L.; software, C.W. and Z.L.; validation, Z.C., N.S. and C.Z.; formal analysis, N.H.; investigation, C.W.; resources, Z.C.; writing—original draft preparation, C.W.; writing—review and editing, N.H.; visualization, J.Z.; supervision, Z.C.; project administration, Z.C.; funding acquisition, Z.C. All authors have read and agreed to the published version of the manuscript.

Funding

The work described in this paper is grateful to the financial support of the National Natural Science Foundation of China (No. 51878129), the Supported by Foundation of Key Laboratory of Structures Dynamic Behavior and Control (Ministry of Education) in Harbin Institute of Technology (No. HITCE202004), and the Key Research and Development Plan of Jilin Science and Technology Department (20210203165SF).

Data Availability Statement

The data, models, and code generated or used during the study are available from the corresponding author by reasonable request.

Conflicts of Interest

The authors declare no conflict of interest.

References

  1. Torsing, R.; Oosterman, K.; Bakker, J.; Hinssen, M.; Bosveld, I.; Huijsmans, T. The Shaded Dome™: A Smart, Cool & Adaptable Facility for Sport Venues. Procedia Eng. 2016, 147, 848–853. [Google Scholar] [CrossRef] [Green Version]
  2. Gosling, P.; Bridgens, B.; Zhang, L. Adoption of a reliability approach for membrane structure analysis. Struct. Saf. 2013, 40, 39–50. [Google Scholar] [CrossRef] [Green Version]
  3. Pauletti, R.M.D.O. Some issues on the design and analysis of pneumatic structures. Int. J. Struct. Eng. 2010, 1, 217–240. [Google Scholar] [CrossRef] [Green Version]
  4. Kromoser, B.; Huber, P. Pneumatic Formwork Systems in Structural Engineering. Adv. Mater. Sci. Eng. 2016, 2016, 4724036. [Google Scholar] [CrossRef] [Green Version]
  5. Uematsu, Y.; Yamamura, R. Experimental Study of Wind Loads on Domed Free Roofs. In Proceedings of the XV Conference of the Italian Association for Wind Engineering, Naples, Italy, 9–12 September 2018; pp. 716–729. [Google Scholar] [CrossRef]
  6. Cheon, D.J.; Kim, Y.C.; Lee, J.H.; Yoon, S.W. Experimental Investigation of Wind Pressure Characteristics for Cladding of Dome Roofs. Materials 2021, 14, 5266. [Google Scholar] [CrossRef] [PubMed]
  7. Park, M.J.; Yoon, S.W.; Kim, Y.C.; Cheon, D.J. Wind Pressure Characteristics Based on the Rise-Span Ratio of Spherical Domes with Openings on the Roof. Buildings 2022, 12, 576. [Google Scholar] [CrossRef]
  8. Taylor, T. Wind pressures on a hemispherical dome. J. Wind Eng. Ind. Aerodyn. 1992, 40, 199–213. [Google Scholar] [CrossRef]
  9. Cheng, C.; Fu, C. Characteristic of wind loads on a hemispherical dome in smooth flow and turbulent boundary layer flow. J. Wind Eng. Ind. Aerodyn. 2010, 98, 328–344. [Google Scholar] [CrossRef]
  10. Srivastava, N.K.; Turkkan, N. Experimental determination of wind pressure distribution for cylindrical and spherical flexible membrane structures. Can. J. Civil Eng. 1995, 22, 23–31. [Google Scholar] [CrossRef]
  11. Turkkan, N.; Srivastava, N.K. Prediction of wind load distribution for air-supported structures using neural networks. Can. J. Civil Eng. 1995, 22, 453–461. [Google Scholar] [CrossRef]
  12. Uematsu, Y.; Tsuruishi, R. Wind load evaluation system for the design of roof cladding of spherical domes. J. Wind Eng. Ind. Aerodyn. 2008, 96, 2054–2066. [Google Scholar] [CrossRef]
  13. Irwin, H.P.A.H.; Wardlaw, R. A wind tunnel investigation of a retractable fabric roof for the Montreal Olympic stadium. In Proceedings of the Fifth International Conference on Wind Engineering, Fort Collins, CO, USA, 8–14 July 1979; pp. 925–938. [Google Scholar] [CrossRef]
  14. Kassem, M.; Novak, M. Experiments with Free Vibration of Light Roofs Backed by Cavities. J. Eng. Mech. 1990, 116, 1750–1763. [Google Scholar] [CrossRef]
  15. Kim, J.Y.; Yu, E.; Kim, D.Y.; Tamura, Y. Long-term monitoring of wind-induced responses of a large-span roof structure. J. Wind Eng. Ind. Aerodyn. 2011, 99, 955–963. [Google Scholar] [CrossRef]
  16. Wood, J.N.; Breuer, M.; De Nayer, G. Experimental studies on the instantaneous fluid–structure interaction of an air-inflated flexible membrane in turbulent flow. J. Fluid. Struct. 2018, 80, 405–440. [Google Scholar] [CrossRef] [Green Version]
  17. He, Y.; Shen, J. The Wind Response of Double Layer Membrane Gas Holders When Considering the Effect of FSI. J. Int. Assoc. Shell SP. 2017, 58, 125–135. [Google Scholar] [CrossRef]
  18. Yang, Q.; Wang, T.; Yan, B.; Li, T.; Liu, M. Nonlinear motion-induced aerodynamic forces on large hyperbolic paraboloid roofs using LES. J. Wind Eng. Ind. Aerodyn. 2021, 216, 104703. [Google Scholar] [CrossRef]
  19. Kassem, M.; Novak, M. Response of hemispherical, air-supported structures to wind. J. Eng. Mech. 1991, 117, 1718–1737. [Google Scholar] [CrossRef]
  20. Rizzo, F.; Kopp, G.A.; Giaccu, G.F. Investigation of wind-induced dynamics of a cable net roof with aeroelastic wind tunnel tests. Eng. Struct. 2021, 229, 111569. [Google Scholar] [CrossRef]
  21. Yin, Y.; Chen, W.; Hu, J.; Zhao, B.; Wang, Q. In-situ measurement of structural performance of large-span air-supported dome under wind loads. Thin-Walled Struct. 2021, 169, 108476. [Google Scholar] [CrossRef]
  22. Takadate, Y.; Uematsu, Y. Steady and unsteady aerodynamic forces on a long-span membrane structure. J. Wind Eng. Ind. Aerodyn. 2019, 193, 103946. [Google Scholar] [CrossRef]
  23. Michalski, A.; Gawenat, B.; Gelenne, P.; Haug, E. Computational wind engineering of large umbrella structures. J. Wind Eng. Ind. Aerodyn. 2015, 144, 96–107. [Google Scholar] [CrossRef]
  24. Huang, H.; Xian, Y.; Zhang, W.; Guo, M.; Yang, K.; Xi, K. Analysis of Wind-Induced Vibration of a Spoke-Wise Cable–Membrane Structure. J. Mar. Sci. Eng. 2020, 8, 603. [Google Scholar] [CrossRef]
  25. Kandel, A.; Sun, X.; Wu, Y. Wind-induced responses and equivalent static design method of oval-shaped arch-supported membrane structure. J. Wind Eng. Ind. Aerodyn. 2021, 213, 104620. [Google Scholar] [CrossRef]
  26. Colliers, J.; Degroote, J.; Mollaert, M.; De Laet, L. Mean pressure coefficient distributions over hyperbolic paraboloid roof and canopy structures with different shape parameters in a uniform flow with very small turbulence. Eng. Struct. 2020, 205, 110043. [Google Scholar] [CrossRef]
  27. Irwin, H.P.A.H. The design of spires for wind simulation. J. Wind Eng. Ind. Aerodyn. 1981, 7, 361–366. [Google Scholar] [CrossRef]
  28. GB50009-2012; Load Code for the Design of Building Structures. China Architecture and Building Press: Beijing, China, 2012. (In Chinese)
  29. Qiu, Y.; He, H.; Xu, C.; San, B. Aerodynamic optimization design of single-layer spherical domes using kriging surrogate model. Adv. Struct. Eng. 2021, 24, 2105–2118. [Google Scholar] [CrossRef]
  30. Opatowicz, D.; Radoń, U.; Zabojszcza, P. Assessment of the Effect of Wind Load on the Load Capacity of a Single-Layer Bar Dome. Buildings 2020, 10, 179. [Google Scholar] [CrossRef]
  31. Riches, C.; Gosling, P. Pneumatic structures: A review of concepts, applications and analytical methods. In Proceedings of the IASS International Congress, Sydney, Australia, 5–9 October 1998; pp. 874–882. [Google Scholar]
  32. Picozzi, V.; Malasomma, A.; Avossa, A.M.; Ricciardelli, F. The Relationship between Wind Pressure and Pressure Coefficients for the Definition of Wind Loads on Buildings. Buildings 2022, 12, 225. [Google Scholar] [CrossRef]
  33. Holmes, J.D.; Allsop, A.C.; Ginger, J.D. Gust durations, gust factors and gust response factors in wind codes and standards. Wind Struct. 2014, 19, 339–352. [Google Scholar] [CrossRef]
  34. Ding, W.; Uematsu, Y. Discussion of Design Wind Loads on a Vaulted Free Roof. Wind 2022, 2, 479–494. [Google Scholar] [CrossRef]
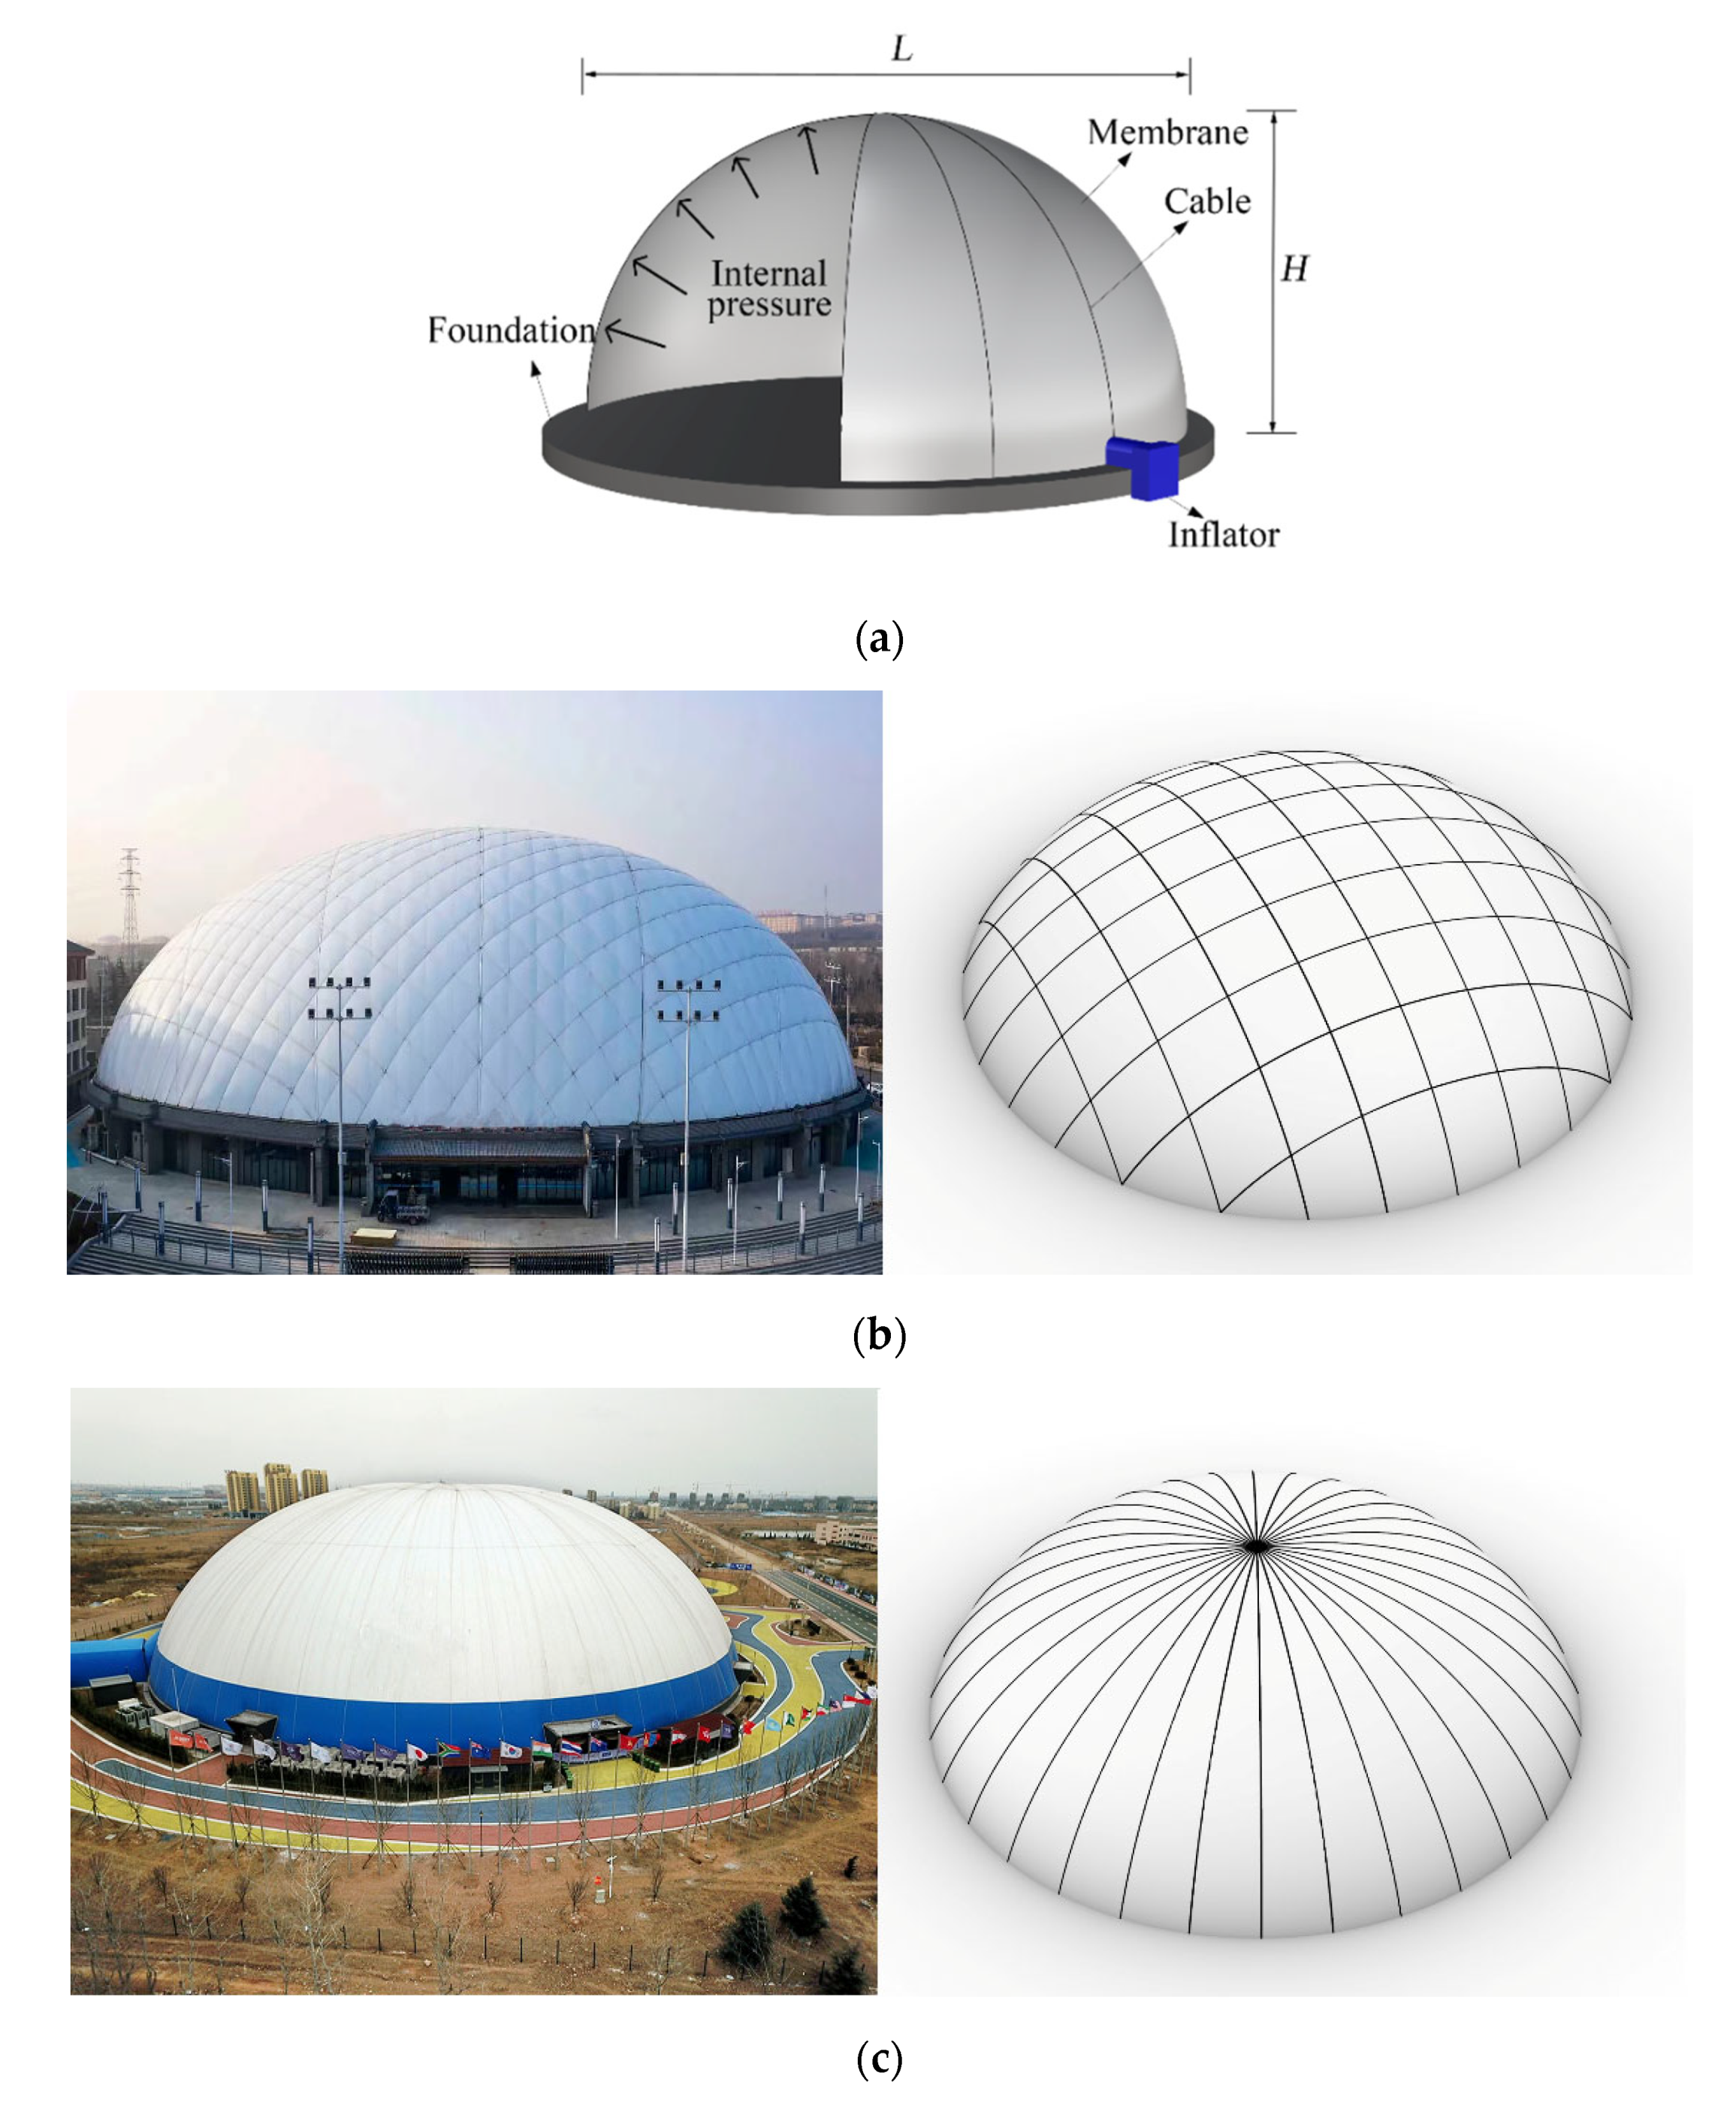
Figure 1. Schematic diagrams and practical photos of spherical inflatable membrane structures: (a) A schematic diagram of structural shape and composition; (b) Spherical inflatable membrane structure with cross cables; (c) Spherical inflatable membrane structure with radial cables.
Buildings 12 01611 g001
Figure 2. A plot of spans and rise–span ratios for practical spherical inflatable membrane structures displayed in Table 1.
Buildings 12 01611 g002
Figure 3. Distribution and numbering of pressure measuring taps.
Buildings 12 01611 g003
Figure 4. Photos of experiment models: (a) H/L = 0.25; (b) H/L = 0.33; (c) H/L = 0.50.
Buildings 12 01611 g004
Figure 5. Boundary layer simulation results: (a) Wind velocity and turbulence intensity profiles; (b) Wind velocity power spectrum.
Buildings 12 01611 g005
Figure 6. Comparison of the mean pressure coefficients along centerline of the model (H/L = 0.50) [8,9,29].
Buildings 12 01611 g006
Figure 7. A flow chart of nonlinear dynamic time–history analysis.
Buildings 12 01611 g007
Figure 8. Contours of membrane stress with different mesh levels.
Buildings 12 01611 g008
Figure 9. Modal shapes of spherical inflatable membrane structures: (a) 1st and 2nd horizontal modes (without cable); (b) 3rd vertical mode (without cable); (c) 1st and 2nd horizontal modes (cross cable); (d) 3rd vertical mode (cross cable); (e) 1st and 2nd horizontal modes (radial cable); (f) 3rd mode vertical (radial cable).
Buildings 12 01611 g009aBuildings 12 01611 g009b
Figure 10. The influence of different parameters on the first 40 natural frequencies: (a) Span; (b) Rise–span; (c) Internal pressure; (d) Cable configuration.
Buildings 12 01611 g010
Figure 11. Contours of the maximum displacement component: (a) u component; (b) v component; (c) w component.
Buildings 12 01611 g011
Figure 12. Mean deformation profiles in different sections (amplification coefficient a =5): (a) XZ-plane; (b) YZ-plane.
Buildings 12 01611 g012
Figure 13. Contours of the maximum displacement under different wind velocities (L = 60 m, H/L = 0.5, p = 300 Pa).
Buildings 12 01611 g013
Figure 14. Contours of the maximum membrane stress under different wind velocities (L = 60 m, H/L = 0.50, p = 300 Pa).
Buildings 12 01611 g014
Figure 15. The maximum wind-induced responses with different spans (H/L = 0.50, p = 300 Pa, Uh = 15 m/s): (a) Displacement; (b) Stress.
Buildings 12 01611 g015
Figure 16. The maximum wind-induced responses with different rise–span ratios (L = 60 m, p = 300 Pa, Uh = 15 m/s): (a) Displacement; (b) Stress.
Buildings 12 01611 g016
Figure 17. The maximum wind-induced responses with different internal pressures (L = 60 m, H/L = 0.50, Uh = 15 m/s and 20 m/s): (a) Displacement; (b) Stress.
Buildings 12 01611 g017
Figure 18. Contours of maximum displacement of structures with different cable configurations (L = 60 m, H/L = 0.50, p = 300 Pa): (a) Without cables; (b) Cross cables; (c) Radial cables.
Buildings 12 01611 g018
Figure 19. Contours of maximum membrane stress of structures with different cable configurations (L = 60 m, H/L = 0.50, p = 300 Pa): (a) Without cables; (b) Cross cables; (c) Radial cables.
Buildings 12 01611 g019aBuildings 12 01611 g019b
Figure 20. The influence of cables under different wind velocities: (a) Displacement; (b) Stress.
Buildings 12 01611 g020
Figure 21. Contours of gust response factors: (a) Displacement-based; (b) Stress-based.
Buildings 12 01611 g021
Figure 22. Comparisons of the gust response factors obtained by the proposed empirical formula and nonlinear time–history analysis: (a) Displacement; (b) Stress.
Buildings 12 01611 g022
Figure 23. Comparisons between the equivalent response results and nonlinear dynamic analysis results: (a) Displacement; (b) Stress.
Buildings 12 01611 g023
Figure 24. Comparisons between the equivalent response results and nonlinear dynamic analysis results under different cable configurations: (a) Displacement; (b) Stress.
Buildings 12 01611 g024
Table 1. Engineering information of spherical inflatable membrane structures.
Engineering ProjectSpan L (m)Rise H (m)Rise/Span H/LCable Configuration
Nalati Horse Dance Performance Hall80300.38Radial cable
SOCT Children’s Paradise54150.28Cross cable
Jinxiu Water Sports Carnival100250.25Radial cable
Yanjing Shenmuyuan Water Park110350.32Cross cable
Jiaozhou Sports Center108330.31Radial cable
Junmei Gymnasium90230.25Cross cable
Zibo International Convention and Exhibition Center98350.36Cross cable
Xiangshawan Desert Art Museum100300.30Radial cable
Large granary in Liaoning40200.50Without cable
Zhongwei Starry Sky Theater60250.42Radial cable
Inflated Airform for Pabco Gypsum near Las Vegas6523.50.36Without cable
The Double Membrane cover in Exeter Maine44110.25Without cable
Table 2. Detailed parameters of the experiment models.
No.Span L (m)Rise H (m)Rise/Span H/LNumber of Taps
10.60.300.50379
20.60.200.33217
30.60.150.25217
Table 3. Material properties of the finite element model.
Membrane Cable
Thickness1 × 10−3 mSectional area2 × 10−4 m2
Elastic modulus600 MPaElastic modulus1.5 × 105 MPa
Poisson ratio0.32Poisson ratio0.3
Density1.38 kg/m2Density7850 kg/m2
Table 4. The parameters of all cases.
ParametersRange
Span L (m)60, 80, 100
Rise–span H/L0.50, 0.33, 0.25
Internal pressure p (Pa)300, 350, 400, 450
Cable configurationWithout cables, cross cables, radial cables
Wind velocity Uh (m/s)10–20 (Interval of 1)
Table 5. Gust response factors for spherical inflatable membrane structures without cables.
ResponseInternal PressureH/L = 0.25H/L = 0.33H/L = 0.50
L = 60 mL = 80 mL = 100 mL = 60 mL = 80 mL = 100 mL = 60 mL = 80 mL = 100 m
Displacement300 Pa1.261.271.281.301.351.351.411.501.52
350 Pa1.241.251.261.251.321.321.401.501.50
400 Pa1.221.231.231.231.301.301.401.481.50
450 Pa1.201.211.211.211.281.281.401.481.50
Stress300 Pa1.191.201.201.211.221.231.241.241.24
350 Pa1.181.181.191.201.201.201.231.231.23
400 Pa1.161.151.171.181.191.201.231.231.23
450 Pa1.151.121.161.171.181.181.231.221.23
Table 6. Recommendations of gust response factors and nonlinear adjustment factors.
ResponseCable ConfigurationGust Response FactorNonlinear Adjustment Factor
DisplacementWithout cable β d = 2.08 × 10 5 p E + 1.52 × 10 6 L t + 0.93 H L + 1.01 1.03
Cross cable β d = 3.33 × 10 5 p E + 2.63 × 10 6 L t + 0.12 H L + 1.24 1.04
Radial cable β d = 0.48 × 10 5 p E + 0.98 × 10 6 L t 0.12 H L + 1.07 1.07
StressWithout cable β s = 1.45 × 10 5 p E + 0.19 × 10 6 L t + 0.24 H L + 1.19 1.03
Cross cable β s = 1.36 × 10 5 p E + 0.44 × 10 6 L t + 0.18 H L + 1.17 1.02
Radial cable β s = 1.07 × 10 5 p E + 0.21 × 10 6 L t + 0.18 H L + 1.17 1.00
Publisher’s Note: MDPI stays neutral with regard to jurisdictional claims in published maps and institutional affiliations.