Abstract
Supplementary cementing materials (SCMs) and the challenges associated with admixture compatibility and durability performance are continuous challenges for the construction industry. Utilizing SCMs has apparent benefits in reducing the carbon footprint and improving the durability performance of concrete structures. This work investigates the performance of mortars composed of Portland limestone cement, calcium carbonate, butyl stearate, and oleic acid. The effort focuses on transport properties using electrical resistivity, chloride migration, porosity, and water permeability measurements. Then, various methods based on the last parameters are compared to assess the changes in the effective chloride diffusion coefficient and the intrinsic liquid water permeability. Measurements for drying shrinkage, thermal expansion, and compressive strength are conducted to verify durability and mechanical performance. The effect of the admixture addition on the service life of a structure fully submerged in marine exposure conditions is then evaluated using Fick’s second law of diffusion and the approach described by FIB model code 34. The results indicate that incorporating calcium carbonate, butyl stearate, and oleic acid in mortar mixtures provides enhanced durability compared to plain Portland limestone cement mortars.
Keywords:
limestone cement; durability; butyl stearate; calcium carbonate; oleic acid; migration; service life 1. Introduction
In recent years, sustainable development and long-term durability of concrete structures have become a significant challenge. Lean construction and design, the use of recycled materials, alternative binders, new admixtures, and concrete surface treatments are some approaches to reducing the societal, economic, technical, and environmental impact [1,2,3]. There is a consensus in the literature stating that incorporation of cement replacements, such as limestone dust, ground granulated blast furnace slag, or fly ash in concrete, improves resistance to chloride ingress, but the resulting concrete may be less resistant to carbonation-induced corrosion [4,5,6]. In addition, superplasticizers and water-repellent admixtures reduce porosity and retard or inhibit chemical agent movement [7,8]. Consequently, there is an increasing demand for the current design practices and concepts of service life prediction to include performance-based and probabilistic approaches that incorporate the effect of additives and admixtures.
A concept to evaluate durability performance is through a system of classes for durability indicators (DIs) such as porosity, diffusion, and permeability [9]. The evaluation compares the measured DI to the threshold value for each class. Furthermore, the measured values can be used as input data in multi-level modelling concepts for service life predictions. However, to perform an objective assessment, reviewing all of the available data and understanding the processes leading to different material performances is necessary. Hence, it is essential to focus on the synergistic effect of the various material combinations and investigate whether the DIs can be assessed for those mixtures using conventional methods.
In this context, the present work developed several mortar combinations with Portland limestone binder, calcium carbonate filler, butyl stearate, and oleic acid. The partial replacement of Portland cement with limestone filler undoubtedly brings environmental benefits, but comparable mechanical properties and durability must be achieved compared to ordinary Portland cement mixtures. At replacement levels of up to 15%, limestone filler can improve compressive strength and reduce chloride permeability [10,11]. However, replacements above that level typically lead to lower strengths, greater porosity, and permeability.
The hydrophobic action of butyl stearate has been investigated in previous studies [12,13,14] and found similar to that of soaps. During cement hydration, butyl stearate hydrolyses in the alkaline environment and produces precipitates that form hydrophobic coatings and pore blockers in the hardened concrete. While this effect is beneficial for reducing agent movement in the pore structure, it appears to influence the shrinkage mechanism [12]. Furthermore, combinations of different types of stearates may activate chemical reactions that complicate further durability assessment.
This study focused on assessing the effective chloride diffusion coefficient and intrinsic liquid water permeability with various methods in a range of mixture combinations. The range of admixture contents was selected according to BS EN 934-2 [15] recommendations and the standard practice for mortar production. Oleic acid was incorporated into the mixtures to promote material dispersion and improved homogeneity. The purpose was to validate rapid assessment methods and compare them with more theoretical and sophisticated approaches. An additional goal was to contribute to existing databases for the estimation of effective chloride diffusion coefficients and intrinsic liquid water permeability by considering compositional parameters, such as the presence of SCMs and permeability-reducing admixtures.
2. Materials and Methods
2.1. Materials
The evaluated cementitious systems were produced using the following materials: Portland limestone cement (CEM II A-L 32,5R) conforming to BS EN 197-1 [16], containing between 6% and 20% by weight of limestone, with a total organic content not exceeding 0.5% by weight, and being of a strength class 32.5 MPa with an ordinary early strength; natural quartz sand; distilled water; and the additives butyl stearate, oleic acid, and calcium carbonate.
Table 1 presents the chemical composition of cement and sand, accrued with X-ray fluorescence analysis. Cement had a specific gravity equal to 3100 kg/m3, and sand, 2650 kg/m3. The particle size distribution of sand, measured through the sieving method according to BS EN 933-1 [17], is presented in Figure 1.

Table 1.
Chemical composition of cement and sand (wt.%).
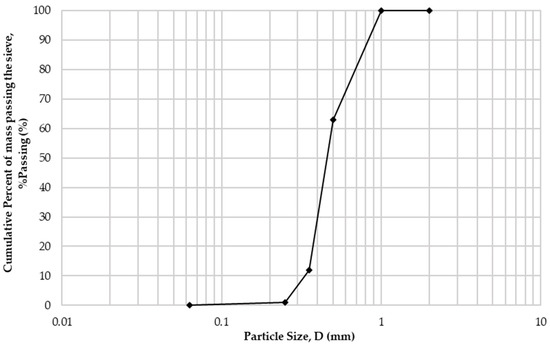
Figure 1.
Sand particle size distribution.
The three different additives considered in this study were acquired from Sigma-Aldrich. Butyl stearate (C22H44O2) was of technical grade 58.2% and consisted of a mixture of butyl stearates, palmitates, and other fatty acids with a density equal to 861 kg/m3 at 20 °C. Oleic acid (C18H34O2) and calcium carbonate (CaCO3) were of technical grade with higher purity levels corresponding to 90% and 98%, respectively. The particle size of CaCO3 was smaller than 50 μm, and the specific gravity was equal to 2930 kg/m3.
2.2. Specimen Preparation
Ten cementitious systems were produced for testing, as depicted in Table 2. Each mix was assigned an identification code Ox-By-Cz, in which O, B, and C denoted the C18H34O2, the C22H44O2, and the CaCO3 component, respectively. The x, y, and z symbols indicated the content of each additive in the mix as a percentage of the total binder content. The reference mixes with no additives were assigned a code Rw, where w denoted the W/C ratio (water to cement ratio). Two conventional reference mortars were used: (a) LC-R0.5, in the proportions 1.0:3.0:0.5 (cement:sand:water), and (b) LC-R0.45, whose unit formulation was 1:0:3.0:0.45 (cement:sand:water).
Table 2.
Composition of cementitious systems.
The mortar mixes with a designation code Ox-By-Cz had an additive content of 0.7–6.0% by weight of Portland limestone cement. Percentages were selected according to their expected reactivity. The process involved partially replacing cement, sand, and water for volumetric purposes. The effect of these changes produced, at the most, approximately a 1.5% change in the expected density of fresh mortar.
All materials were stored under standard laboratory conditions or as prescribed by the manufacturer. Cement was sampled and homogenized according to BS EN 196-7 [18] before taking sub-samples for specimen preparation. The sand was cured at 105 °C until the total moisture content was reduced to less than 0.2% by mass of sand. C22H44O2 was brought to the liquid state upon heating up to 30 °C prior to adding to the blend.
Test specimens were prepared according to BS EN 196-1 [19], with admixtures added after an initial 90 s mixing period of water with sand and cement. At the end of the mixing period, three mortar increments were placed in each mold. Compaction of each increment was conducted with 25 jolts, using a jolting table. At the end of the process, the specimens were covered with impermeable polyethylene sheets for 24 h in standard laboratory conditions. Subsequently, the specimens were removed from the molds and placed in a water tank containing a lime-saturated distilled water solution at 20 ± 1 °C. Curing was continuous up to the testing age.
2.3. Experimental Procedure
Electrical resistivity measurements, non-steady-state migration tests, and water permeability under hydrostatic pressure were conducted. The following sections detail the test procedures. Compressive strength tests were performed on 40 mm nominal dimension cubes according to BS EN 196-1 [19], with the loading rate regulated using an ELE compression machine (ELE ADR-Auto V2.0 2000 kN). Drying shrinkage was determined from day 2 to day 28 according to ASTM C157 [20]. The thermal expansion coefficient experiments were carried out according to BS EN 1770 [21], with readings at −20, 0, +23, +40, and +60 ± 1 °C. In addition, the porosity accessible to water () was measured using the vacuum water absorption method [22]. All tests except for the thermal expansion measurements were carried out under standard laboratory conditions of 23 ± 2 °C and 65% RH.
2.4. Electrical Resistivity
An indirect method to assess durability performance of cementitious systems is through electrical resistivity or conductivity testing. Whittington et al. defined the electrical resistivity of any material as the resistance in ohms per unit length between the opposite faces of a unit cube of the material [23]. The resistivity of mortar (ρ′) depends on the moisture content, porosity, tortuosity, and interconnectivity of the pore system. Surface conductivity of the pore walls, conductivity of the pore solution, and the nature of aggregates may further influence this parameter [24,25].
The standard method for electrical resistivity measurements is ASTM C1760 [26]. However, the standard is rarely followed, probably because authors prefer to use the available instrumentation in their labs, electrode configurations, and different geometrical dimensions of the specimen concerning the standard [27,28,29,30]. The technique used in the present study involved two cylindrical specimens of 100 mm in diameter and 50 mm in length, extracted from a Ø100 × 200 mm cast cylinder. Each specimen was saturated with a calcium hydroxide saturated solution in a vacuum container at a pressure of 5 kPa. The specimen was sealed into a rubber sleeve, exposing the two parallel surfaces. A pair of stainless steel electrodes were then placed on the parallel surfaces of the sample, and current I (A) was induced through application of a potential drop () of 10 V. Measurements were taken of 28-d age specimens for each mortar mix designation, with readings taken at first contact and after 24 h of continuous exposure to electric current. Resistivity was then calculated according to Ohm’s law:
where (m2) was the cross-sectional area of the electrodes and (m) was the distance between electrodes.
2.5. Effective Chloride Diffusion Coefficient
2.5.1. Definition and Significance
The effective chloride diffusion coefficient, (m2/s), is one of the governing parameters in the chloride-induced corrosion models, reflecting the ability of the material to resist chloride penetration. In the Nernst–Planck equation or Fick’s first law, this is an intrinsic property, independent of the chloride binding capacity or chloride concentration [31,32]. This can be measured by means of a steady-state migration test in saturated conditions or calculated using analytical formulas from parameters such as the apparent chloride diffusion coefficient or the electrical resistivity [25].
Ion movement in solution arises from differences in electrical or chemical potential or from hydrodynamic transport (convection). Mass transfer to an electrode can be described by the Nernst–Planck equation, using the approach for one-dimensional mass transfer along the x axis [33,34]:
where x is the distance from the surface, is the flux of species i [mol/(s·cm2)], Di is the diffusion coefficient (cm2/s), is the potential gradient, is the concentration gradient, is the charge, is the concentration (mol/L) of species i, and is the velocity with which a volume element in solution moves along the axis, expressed in cm/s.
In a steady-state migration test, the chloride ion content is measured against time in the downstream compartment of the migration cell. The effects of chemical activity and diffusion flow are neglected concerning the electrical migration flow. An effective chloride diffusion coefficient can be calculated when the potential drop and chloride flux are constant, using the modified Nernst–Planck equation [35]:
where is the ideal gas constant ( = 8.3144 J/mol·K), the absolute temperature (K), the valence number of chloride ion ( = 1), F′ the Faraday constant (F′ = 96,480 J/V·mol), the sample thickness (m), denotes the electrical potential drop between the two sides of the sample (V), the cumulative quantity of chloride ions arriving in the downstream compartment during the test duration (s), and and (mol/m3) are the activity coefficient and concentration of chloride ions, respectively, in the catholyte solution.
Other techniques can also be used to assess via conductivity measurements in the downstream compartment or titration in the upstream [31,36,37]; however, measurements can suffer from poor accuracy and reproducibility. An easy method to assess the is through the non-steady-state migration test with some assumptions for chloride binding.
2.5.2. Assessment of the Effective Chloride Diffusion Coefficient from Non-Steady-State Migration Tests
A method to determine the non-steady-state migration coefficient is presented in the standardized procedure NT Build 492 [38]. According to this method, an external electrical field is applied axially across a cylindrical concrete or mortar specimen. After a certain test period, the specimen is axially split, and the freshly split sections are sprayed with silver nitrate solution. The chloride penetration depth is measured from the visible white silver precipitation. The is then calculated by the following solution:
where is the average penetration depth (m) and and are supplemental terms defined in [38] as functions of the test conditions.
During this test, the contact time is short (usually less than 48 h), and the velocity of the ions transported through the pore structure is remarkably high. Therefore, a non-equilibrium state is expected, and chloride binding can be neglected, according to L. Tang and L.O. Nilsson [39,40]. Furthermore, L. Tang [41] derived the following relationship between and :
where denotes the gel content in concrete (kg/m3), ε is the volume fraction of pore or porosity (m3/m3), and and are adsorption constants. The weak interaction of chlorides with cementitious systems during non-steady-state migration tests was further observed by M. Castellote et al. [42]. According to V. Baroghel-Bouny et al. [25], by assuming no binding, can be deduced from according to the Equation (6):
where represents the porosity accessible to water.
2.5.3. Assessment of the Effective Chloride Diffusion Coefficient from Electrical Resistivity Measurements
If the mortar is considered a solid electrolyte, then the of charged species i in mortar is related to its partial conductivity . This relationship is expressed through the Nernst–Einstein Equation (7) [43]:
A more simplified equation for is presented in [25]. According to this study, the effective chloride diffusion coefficient is inversely proportional to the water-saturated material’s electrical resistivity (ρ′).
The pore solution in a mortar specimen has relatively high conductivity, whereas the solid phase has a low value. The solid and pore solution conductivity σ is defined according to [44] as the ratio of the pore solution electrical conductivity to the formation factor:
The of the pore solution can be determined experimentally for each mortar designation with ionic concentration analysis [45]. However, the technique may require high precision equipment to avoid errors during sampling and testing, or measurement could be impossible for specimens with low porosity. Another method to determine is through algebraic forms, aiming at an accuracy within 10%. According to [34,46], can be expressed as the weighted sum of the equivalent ionic conductivity of each ionic species:
where and (mol/L) are the species valence and molar concentration.
The OH− ion is the most significant contributor to the pore solution conductivity of a well-hydrated specimen. Other ionic species, such as Na⁺, K⁺, Ca2+, and , should be secondary contributors due to their concentration changes resulting from cement dissolution, product precipitation, and ettringite growth after the first 24 h of cement hydration [47]. According to [46], the electrical conductivity of most pore solutions can be accurately estimated from the contribution of the Na⁺, K⁺, and OH− ions. For concentrations near 1 mol/L, an approximation of the can be given by Equation (10):
where the equivalent conductivity of the ionic species at infinite dilution, , can be found in [48], the ionic strength, , can be estimated using Equation (11), and the empirical conductivity coefficients, for each ion, are reported in [46].
A method to describe the alkali content in cement pore solution was developed by H.F.W. Taylor [49]. The total number of Na+ and K+ moles per cement mass is calculated from the corresponding mass fraction and molecular weight. Alkalis in cement are partly bound in the clinker phase and partly present as readily soluble sulfates. The available moles of alkali ions in the pore solution, released through cement hydration, are predicted as [50]:
where is the total quantity of the alkali ion I in the anhydrous cement (mol/g), is the fraction of alkali as sulfate, is the fraction of alkali ion i in the clinker phase, is the mass of ordinary Portland cement (g), is the volume of water in the pore solution (cm3), is the binding factor (cm3), and is the hydration degree.
S.Y. Hong and F.P. Glasser [51,52] studied the alkali binding in synthetic hydration products (C-S-H (calcium silicate hydrate) and C-A-S-H (calcium aluminate silicate hydrate)) using the concept of the distribution ratio, (cm3/g), to describe the alkali-binding capacity of the synthetic gels. The alkali-binding capacity of the C-S-H increases linearly with increasing alkali concentrations in the solution. Employing the concept of binding yields:
in which is the mass of C-S-H in the hydrated paste (g).
The alkali binding capacities of hydrated Portland cement pastes were investigated by Brouwers and Van Eijk [50] using a three-dimensional computer model CEMHYD3D, the H.F.W. Taylor’s method and the concept of the distribution ratio. They proposed that only the hydration product C-S-H can bind alkalis instead of the relative fraction of C-S-H and AFm phases forming in the paste.
In the present study, the C-S-H content for each mixture was estimated using the analytical formula for cement hydration kinetics proposed by Mounanga [53], and the mix composition of each designation. The Na+ and K+ fractions in sulfate phases and clinker were taken from [50], and the distribution ratios from the literature [51,52]. Table 3 presents the numerical predictions for the alkali content based on the binder type and content and the W/C ratio [49,50,51,52]. The concentration of OH− was deduced from the electroneutrality condition [31].
Table 3.
Pore solution composition (mol/m3) based on Taylor [49], H and G [51,52], and B and VE [50] expressions for the binder type, content, and W/C ratios of the present study.
2.6. Intrinsic Liquid Water Permeability
The liquid water permeability of mortar can be measured using the Taywood Engineering permeability test rig and the flow method. The intrinsic permeability can be expressed using Darcy’s law [54], with the assumption that the effective porosity is fully saturated, and no interactions occur between water and mortar:
where is the flow rate (m3/s), is the water permeability coefficient under steady-state conditions (m2), is the specimen’s ingress area (m2), is the difference in pressure between the two ends of the test specimen (Pa), is the water viscosity (Pa·s), and is the length of the test specimen (m).
An equivalent expression to Darcy’s law was developed by Valenta [55] for specimens exhibiting low permeability and where the flow rate cannot be measured:
where is the water permeability coefficient (m/s), is the depth of water penetration (m), is the void content which does not become filled with water except under pressure (%), is the hydraulic head (m), and is the exposure period under hydraulic pressure (s). The relationship between and is expressed in Equation (16) [55]:
where is the water density (kg/m3) and is the acceleration due to gravity (m/s2).
According to the literature [56,57,58], for normal strength ordinary Portland cement (OPC) hardened pastes, can be estimated using the Katz–Thompson relationship (see Equation (17)), where the critical pore diameter and the formation factor of the material are known.
The pore diameter can be measured using the mercury intrusion porosimetry method; however, the measurements are strongly influenced by parameters such as sampling, specimen preparation, drying methods, heterogeneity of the specimens, and the colloidal cement matric [59,60]. As a result, the method gives a wide range of distributions for hydrated cement materials that do not reflect the actual sizes of the present pores. In the present study, the and were obtained from water permeability measurements using Valenta’s expression and Equations (16) and (17). The values for are given in Section 3.2.
2.7. Shrinkage Strains
Cracking occurs when tensile strain arising from restrained contraction or strain differential exceeds the tensile strain capacity of mortar and concrete structures. Early thermal strains, autogenous and drying shrinkage, expansion from water absorption, and annual temperature variations contribute to early and long-term contraction [61,62]. Numerous factors, including the coefficient of thermal expansion (CTE), the restraint to movement, the strain differential within an element, and the resistance to tensile strain influence the risk of early-age cracking. According to BS EN 1922-1-1 [63], these strains should be included in the design process as excessive cracking in a concrete structure reduces its strength, durability, and service life.
Physical actions such as drying shrinkage are influenced by changes in the hardened cement paste’s moisture content, the degree of hydration, and the external environment’s relative humidity (RH). The binder and alkali content, the cement fineness, and the binder type are known parameters for governing the associated capillary stresses [64,65,66,67]. Furthermore, some admixtures may compensate for shrinkage by minimizing the moisture losses or by producing expansive compounds, resulting in an initial net volume increase in the mortar, which offsets subsequent shrinkage [12,68]. BS EN 1992-1-1 provides a method for calculating drying shrinkage based on the RH, the dimensions of the element, and the strength class of the concrete. In addition, this parameter can be determined experimentally according to ASTM C157 [20] using a length comparator.
The main factors affecting the thermal expansion coefficient, ac, are the moisture content and the type and quantity of the aggregate. The influence of other factors such as cement type, mix proportions, and age on this property is of a lesser extent [69]. A value equal to 10 με/°C for ac is given by BS EN 1992-1-1 and BS EN 1992-3 with limited consideration on early-age thermal strains [63,70]. Characteristic values for ac based on the aggregate type are given in [61]; however, it is recommended for this parameter to be determined experimentally. The test methods involve subjecting mortar specimens to a change in temperature and measuring deformation [21] or by measurement of strain during the cooling arm of the heat cycle [61].
3. Results and Discussion
3.1. Results from Electrical Resistivity Measurements
Figure 2 displays the average electrical resistivity results with their standard deviations measured upon initial contact and after 24 h of continuous exposure to electric current. Resistivity and rapid chloride penetration testing methods take the electrical resistance of cementitious systems as an indication of their resistance to chloride ion penetration. An empirical classification, given in [71], defines high chloride permeability for bulk resistivity < 50 Ω·m and moderate permeability for resistivity 50–100 Ω·m. Furthermore, estimated chloride diffusion coefficients are >15 × 10−12 m2/s and 10–15 × 10−12 m2/s for high and moderate chloride permeability, respectively.
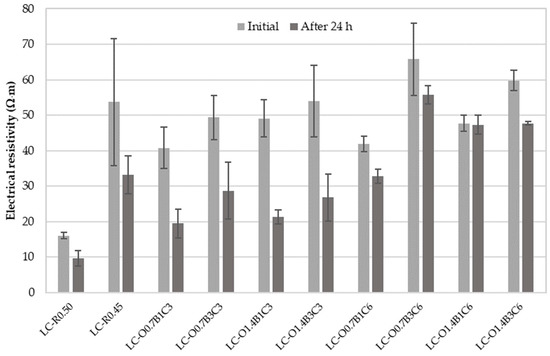
Figure 2.
Experimental mean values of electrical resistivity measured on water-saturated mortar specimens initially and after 24 h of continuous exposure to electric current.
The results suggested that electrical resistivity was reduced with the period of exposure to direct current (DC). Resistivity was independent of specimen length, but DC measurements were expected to be affected by polarization. The relatively high DC combined with the increased exposure period made the DC measurements susceptible to the Joule effect [71,72], thereby, resulting in a current increase and further resistivity reduction over time.
The difference in resistivity between the LC-R0.5 and LC-R0.45 indicated that the lower W/C ratio influenced the volume of pores facilitating ionic conduction in the mortar specimens [73,74]. The mixtures containing 3% CaCO3 by weight of cement exhibited a corrosion probability similar to the reference LC-R0.45 regardless of the presence of C22H44O2 or C18H34O2. A minor improvement to the resistivity of specimens containing 1.4% C18H34O2 by weight of cement was attributed to the plasticizing effect of this polymer [75] and the better degrees of compaction and deflocculation of cement particles.
The synergistic effect of CaCO3, C22H44O2, and C18H34O2 was evident on the specimens LC-O0.7B3C6, LC-O1.4B1C6, and LC-O1.4B3C6. Figure 3 presents the cylindrical specimens produced for electrical resistivity and rapid chloride migration testing for each mixture. The absence of surface defects on these specimens served as evidence of improved homogeneity and compaction. In addition, the lower standard deviation of the electrical resistivity measurements of these specimens compared to the reference LC-R0.45 provided greater confidence concerning the expected performance.
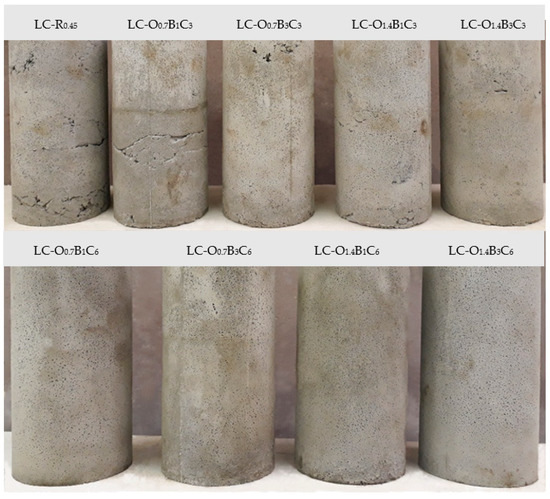
Figure 3.
Specimens for electrical resistivity and rapid chloride migration testing.
3.2. Effective Chloride Diffusion Coefficient
Figure 4 presents a comparison of the from resistivity and chloride migration measurements. Excellent agreement was observed for obtained through the Taylor, Brouwers, and Van Eijk models for pore solution resistivity estimation. The following order describes the correlation of effective diffusivities obtained from the non-steady-state migration and the conductivity test method:
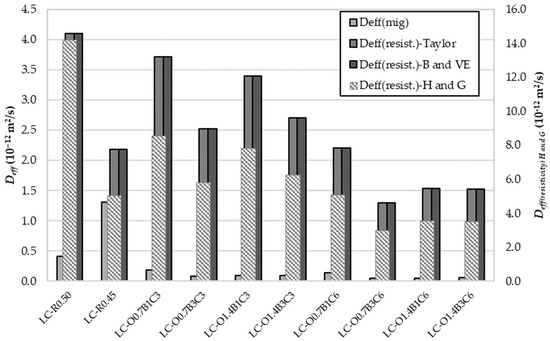
Figure 4.
Effective chloride diffusion coefficient obtained from nss migration test and electrical resistivity on saturated samples.
The non-steady-state (nss) migration method provided the lowest effective diffusivity, being several times lower than that of the conductivity method using the S.Y. Hong and F.P. Glasser model. It should be noted that the values of could be questioned by the assumptions made for the distribution ratio and the Na+ and K+ fractions in sulfate and clinker phases. However, a specific correlation between the diffusivities may have still existed.
As shown in Figure 5a,b, the W/C ratio and the exposure period to DC influenced the correlation between and . The was reduced with the increase in the water content. This occurrence could be attributed to the lower porosity or tortuosity caused by improved homogeneity and particle distribution at the higher W/C ratio. A linear increase in the chloride transport with the pore size and volume was reported by S. Li and D.M. Roy [76]. As illustrated in Figure 5a, all specimens containing C18H34O2, C22H44O2, and CaCO3 exhibited improved durability compared to the reference LC-R0.45. However, after 24 h of continuous exposure to DC, only the specimens with 6% CaCO3, 1.4% C18H34O2, and 1–3% C22H44O2 by weight of the cement content retained this performance.
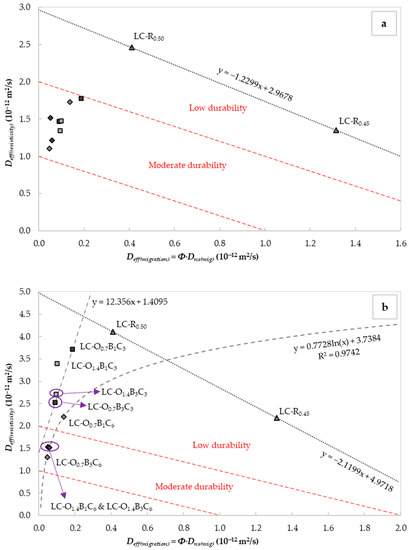
Figure 5.
Correlation of the effective chloride diffusion coefficients obtained from nss migration tests and (a) the initial electrical resistivity (Equation (12)), and (b) the electrical resistivity (Equation (12)) after 24 h of continuous exposure to electric current on saturated samples. The indicated durability classes were taken from [25].
The diffusion coefficient from electrical resistivity measurements is related to the microstructure, saturation degree, chemical composition of the pore solution, and testing temperature [77]. An easy method to evaluate the changes in the microstructure was by assessment of the changes in the formation factor. This parameter corresponded to the inverse of the pore connectivity and porosity. It could be estimated using the effective chloride diffusion coefficients or Equation (8) [44,78]. Figure 6a and 6b present the changes occurring in this factor from the corresponding adjustments to the CaCO3 and C18H34O2 content. The chloride permeability was significantly reduced in the case of mortars with 6% CaCO3 by weight of cement. The performance further improved when C22H44O2 content rose from 1 to 3% by cement weight, confirming that was related to the By-Cz content. In the case of C18H34O2 incorporation, the effect was not sufficiently clear. Figure 6b points out the inverse effect when C18H34O2 content rose from 0.7 to 1.4% in mixtures with 3% C22H44O2 by weight of cement. This observation was also consistent with the chloride migration measurements.
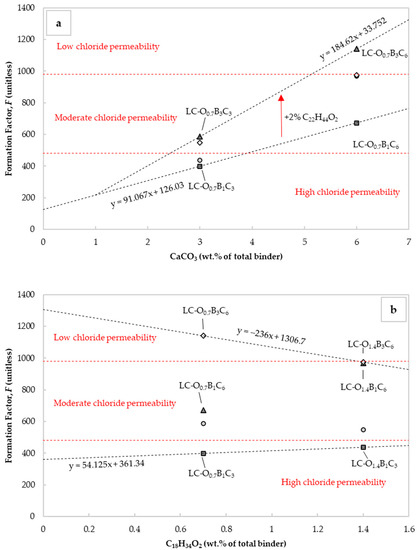
Figure 6.
Influence of (a) CaCO3 and (b) C18H34O2 content on formation factor. The indicated chloride permeability classes were taken from [79].
3.3. Results from Water Permeability Measurements
Figure 7a shows the relationship between the measured and the derived for the different mixes. The increase in the W/C ratio significantly reduced the water permeability and critical pore diameter. This was consistent with observations made and discussed in the previous sections. For specimens with 6% CaCO3 by weight of cement, the was reduced below 0.11 μm and the below 7.4 × 10⁻²⁰ m2. This corresponded to a water permeability reduction of 85.2% and a critical pore diameter decrease of 60.7% compared to the reference LC-R0.45. The lower permeability exhibited by these specimens could be attributed to the void filling capacity of CaCO3 and the plasticizing effect of C22H44O2 and C18H34O2.
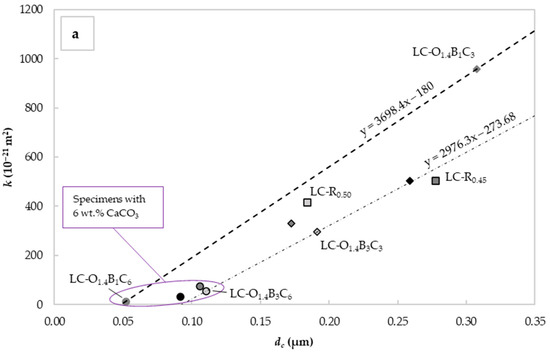
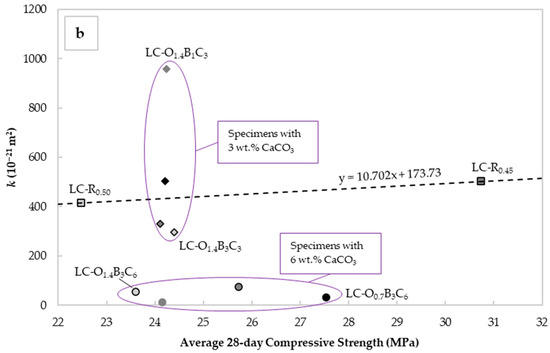
Figure 7.
Mean values of “intrinsic” liquid water permeability k assessed using Valenta’s expression vs. (a) critical pore diameter determined with the Katz–Thompson relationship and (b) the average 28-day compressive strength for each mix design.
The C22H44O2 capacity to perform as an effective water repellent admixture under hydrostatic pressure seemed to depend on the C18H34O2 content and the degree of dispersion in the specimen. While some improvement was observed between the specimens LC-O1.4B1C3 and LC-O1.4B3C3, this was not consistent with specimens LC-O0.7B1C3 and LC-O0.7B3C3. The latter could be assigned to variations in the homogeneity of the specimens obtained with the lower C18H34O2 content.
Figure 7b depicts the values of vs. the average 28-day cube compressive strength for each mortar specimen. The standard deviation varied from 0.7 to 2.4 MPa, with the highest value observed in the specimens for LC-O1.4B3C6 and the lowest in LC-O1.4B1C3 and LC-O0.7B1C6. For ease of assessment, the standard deviations are excluded from Figure 7b. The plain OPC mixtures exhibited ranges from 22.5 to 30.7 MPa, with the lower values observed in the LC-R0.50, indicative of the lower strengths usually observed at higher W/C ratios. Incorporating CaCO3, C22H44O2, and C18H34O2 had an inverse effect on strength, with values generally rising at higher CaCO3 and C22H44O2 contents. Nevertheless, these results confirmed that permeability and strength provided complementary information concerning durability, and justified the selection of both parameters as durability indicators.
3.4. Results from Drying Shrinkage and Thermal Expansion Measurements
Using the Controls digital length comparator 62-L0035/A, drying shrinkage measurements were undertaken at 2- and 28-day age, according to ASTM C157. The ac parameter was determined with readings taken at −20, 0, +23, +40, and +60 ± 1 °C on 28-day age specimens, according to BS EN 1770. The specimens were initially cured for seven days in lime-saturated water at 23 ± 2 °C, followed by a twenty-one-day curing period at 65% RH. Figure 8 presents the drying shrinkage vs. compressive strength from experimental measurements and estimations using BS EN 1992-1-1 for cement class CEM 32,5R [16]. Findings showed that for the same binder type, the experimental measurements for LC-R0.50 demonstrated similar values to those predicted by BS EN 1992-1-1. The lower shrinkage strains observed in LC-R0.45 could be attributed to the lower water content and volume contraction during the different stages of curing and drying.
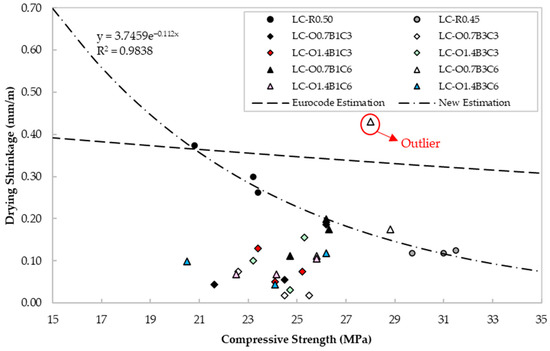
Figure 8.
Drying shrinkage values vs. compressive strength for each mix design.
The specimens containing CaCO3, C22H44O2, and C18H34O2 generally demonstrated similar to or lower shrinkage strains than the reference LC-R0.45. A specific relationship between the admixture content and the shrinkage cannot be verified from the present results of this study. CaCO3 is less reactive than Portland cement, but it may provide nucleation sites for hydration products to precipitate and fill the voids between cement particles, thus, leading to improved particle size distribution, higher density and milder moisture loss compared to the reference specimens. This, in turn, can reduce the magnitude of internal strains from drying shrinkage [80]. In addition, the presence of CaCO3 promotes transformation of monosulfoaluminates to ettringite, which increases the total volume of hydrate products, thus reducing the chemical shrinkage [81,82].
More recent studies showed that soluble soaps of unsaturated fatty acids function as surfactants and swell when in contact with water [83,84]. This reaction may start at any stage of cement hydration, resulting in expansion phenomena. In addition, calcium stearate is the product of butyl stearate hydrolysis. Calcium stearate may react during cement hydration and generate lighter hydrophobic compounds that fill smaller voids. This process promotes a higher BET surface area and mitigates moisture loss from evaporation. As a result, entrapped solvent water leads to different hydration rates, capillary tensions, and contraction.
The CTEs from −20 to 60 °C for all mixtures are reported in Figure 9. According to [60], concrete containing quartzite or limestone aggregate exhibits a CTE in the range of 11.7–14.6 and 4.3–10.3 με/°C, respectively. The values reported in Figure 9 appeared in their majority to be within the range for the characteristic CTE of quartzite mortars. Moreover, there was no distinct pattern between the admixture content and this property, thus, providing evidence that the three admixtures investigated in this study did not affect this parameter negatively.
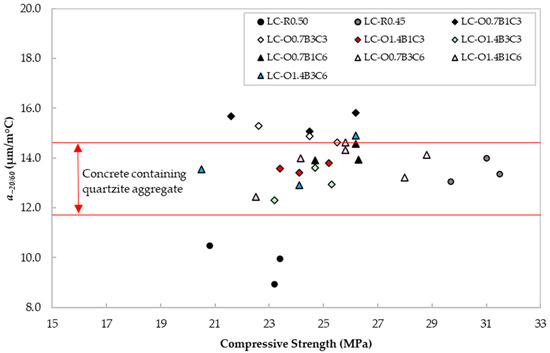
Figure 9.
CTE vs. compressive strength for each mix design.
3.5. Estimated Service Life
The service life definition given by FIB model code 34 [85] is the time elapsed for the reinforcement to reach a certain chloride concentration level, where depassivation and corrosion initiation occurs. A full probabilistic design approach in [85] is based on Fick’s second law of diffusion, with the condition that diffusion processes dominate the transport of chlorides. Furthermore, an increase in temperature increases the rate of diffusion and lowers the effective threshold value to initiate corrosion. The model employed in this study assumes that the diffusion coefficient and threshold values are estimated at 20 °C. The initial chloride content of mortar was calculated from the chloride content of each component of the mix.
The service life estimates for the types of mortars studied in this work are based on submerged marine exposure conditions at 1 m depth. On this basis, it is assumed that chlorides for marine conditions are 18.3 ± 2.5 g/L (North Sea) converted to chloride surface concentration using the methods developed by Lindvall [86]. Based on [85], the chloride threshold is considered approximately 0.6% by weight of binder but varies greatly depending on the concrete, steel properties, and exposure conditions. In the submerged marine zone, where little oxygen is available, the chloride threshold can increase to 2.0% [86].
Considering a 50 mm coverage with no convection zone and an aging factor between 0.17 and 0.20 [87], which was not taken into consideration beyond 40 years, an estimate of a 34–43-year service life was predicted for the reference specimen LC-R0.45. For the same composition, with no admixtures and a W/C ratio equal to 0.5, the service life extended up to 78 years. As expected, incorporating CaCO3, C22H44O2, and C18H34O2 generally extended the service life. The results summarized in Table 4 indicate that the mixtures with 6.0% CaCO3, 1.4% C18H34O2, and C22H44O2 content greater than 0.7% by weight of cement exceeded the 100-year life expectancy. Combinations with lower contents exhibited comparable performance depending on material dispersion and compaction degree. Nonetheless, the overall extension of life expectancy by incorporating these admixtures was 76.7 to 269.8%.
Table 4.
Service life estimate using two aging factors.
4. Conclusions
Based on the experimental findings of this study, the following conclusions can be drawn:
- Portland limestone cement mixtures with no plasticizing additives may exhibit lower strengths and higher drying shrinkage when the W/C ratio increases from 0.45 to 0.50.
- Portland limestone cement mixtures with a lower W/C ratio require additional effort or the addition of plasticizing admixtures to achieve the required level of compaction. Otherwise, durability may be impaired, as was proven in the present study by the higher chloride migration coefficients observed in specimens with lower W/C ratios.
- Incorporating CaCO3 in Portland limestone cement mortars may improve durability, reduce shrinkage, and lower compressive strength marginally. The mechanical and durability properties extensively depend on the material dispersion degree and, thus, the presence of supplementary admixtures with plasticizing properties that improve rheology and compaction.
- Good durability-related properties were pointed out for Portland limestone cement mortars containing butyl stearate and oleic acid, particularly where a 6% CaCO3 by weight of cement was incorporated. The effective chloride diffusion and intrinsic liquid water permeability were significantly lower than the reference specimen LC-R0.45 due to lower porosity. This further confirms the complementary nature of the two DIs to assess durability to potential corrosion.
- The thermal expansion coefficients were indicative of the aggregate type, and the presence of CaCO3, C22H44O2, and C18H34O2 in the mixtures did not alter this property. The drying shrinkage at 28 days was equal to or lower than the reference specimen LC-R0.45. Therefore, it was concluded that material combinations of this study cannot impose risks for shrinkage strains to exceed the design codes and model recommendations.
- The methods presented in this paper to assess DIs can be helpful to engineers in selecting material types or methodologies for durability assessment. For example, the data displayed can provide helpful references when testing or entering data in predictive models. However, some of the parameters used for the service life predictions, such as the aging factor, may require further investigation, particularly for cementitious composites containing the aforementioned admixtures.
- The depassivation time and chloride threshold depend on the pore solution OH− content. While some estimates were made in the present study using several approaches, these excluded the potential effect of the admixture hydrolysis. Furthermore, the potential effect of the sulfate content on the early hydration kinetics requires further assessment and validation. For future work, the pore solution chemistry is recommended to be determined experimentally for a more accurate calculation of the service life.
Author Contributions
Conceptualization, A.M. and A.S.; methodology, A.M. and A.S.; project administration, A.S.; validation, A.M. and A.S.; formal analysis, A.M.; investigation, A.M.; data curation, A.M.; writing—original draft preparation, A.M.; writing—review and editing, A.M. and A.S.; visualization, A.M.; supervision, A.S.; All authors have read and agreed to the published version of the manuscript.
Funding
This research received no external funding.
Data Availability Statement
Not applicable.
Conflicts of Interest
The authors declare no conflict of interest.
Abbreviations
| CTE | Coefficient of thermal expansion |
| C-S-H | Calcium silicate hydrate |
| C-A-S-H | Calcium aluminate silicate hydrate |
| DIs | Durability indicators |
| OPC | Ordinary Portland cement |
| RH | Relative humidity |
| SCMs | Supplementary cementing materials |
| W/C | Water to cement ratio |
References
- Basheer, P.A.M. Durability of Concrete Structures. In Proceedings of the Sixth International Conference (ICDCS2018), University of Leeds, Leeds, UK, 18–20 July 2018; Whittles Publishing Ltd.: Dunbeath, UK, 2018. [Google Scholar]
- Badr, A.; Fentiman, C.; Grantham, M.; Mangabhai, R. Concrete for the modern age, Developments in materials and processes. In Proceedings of the 1st International ICT Conference on Cement and Concrete Technology, Military Technology College, Muscat, Oman, 20–22 November 2017; Whittles Publishing Ltd.: Dunbeath, UK, 2017. [Google Scholar]
- Dhir, R.K.; Hewlett, P.C.; Csetenyi, L.; Newlands, M.D. Role for concrete in global development. In Proceedings of the International Conference, University of Dundee, Scotland, UK, 10 July 2008; IHS BRE Press: London, UK, 2008. [Google Scholar]
- Sun, J.; Chen, Z. Influences of limestone powder on the resistance of concretes to the chloride ion penetration and sulfate attack. Powder Technol. 2018, 338, 728. [Google Scholar] [CrossRef]
- Dhir, R.K.; Jones, M.R. Development of chloride-resisting concrete using fly ash. Fuel 1999, 78, 137–142. [Google Scholar] [CrossRef]
- Luo, R.; Cai, Y.; Wang, C.; Huang, X. Study of chloride binding and diffusion in GGBS concrete. Cem. Concr. Res. 2003, 33, 1–7. [Google Scholar] [CrossRef]
- Dransfield, J.M.; Hewlett, P.C.; Hodgkinson, L.; Gibb, I.; Price, W.F. A Guide to the Selection of Admixtures for Concrete, 2nd ed.; Technical Report 18; The Concrete Society: Blackwater, UK, 1980; p. 28. [Google Scholar]
- Neville, A.M.; Brooks, J.J. Concrete Technology, 2nd ed.; Pearson: Harlow, UK, 2010; p. 158. [Google Scholar]
- Baroghel-Bouny, V. Evaluation and Prediction of Reinforced Concrete Durability by Means of Durability Indicators, Part I: New Performance-Based Approach, ConcreteLife ’06, International RILEM-JCI Seminar on Concrete Durability and Service Life Planning: Curing, Crack Control, Performance in Harsh Environments; RILEM Publications SARL: Paris, France, 2006; pp. 259–269. [Google Scholar] [CrossRef]
- Panesar, D.K.; Zhang, R. Performance comparison of cement replacing materials in concrete: Limestone fillers and supplementary cementing materials—A review. Constr. Build. Mater. 2020, 251, 118866. [Google Scholar] [CrossRef]
- Dhir, R.K.; Limbachiya, M.C.; McCarthy, M.J.; Chaipanich, A. Evaluation of Portland limestone cements for use in concrete construction. Mater. Struct. 2007, 40, 459–473. [Google Scholar] [CrossRef]
- Malakopoulos, A.; Chatzigeorgiou, M.; Boukos, N.; Salifoglou, A. Durability performance of Portland limestone cement mortar containing butyl and zinc stearate admixtures. Mater. Struct. 2021, 54, 6–8. [Google Scholar] [CrossRef]
- Hewlett, P.C. Lea’s Chemistry of Cement and Concrete, 4th ed.; Elsevier Ltd.: Oxford, UK, 2006; pp. 869,887–890. [Google Scholar]
- Lagazzo, A.; Vicini, S.; Cattaneo, C.; Botter, R. Effect of fatty acid soap on microstructure of lime-cement mortar. Constr. Build. Mater. 2016, 116, 384–390. [Google Scholar] [CrossRef]
- BS EN 934-2:2009+A1:2012; Admixtures for Concrete, Mortar, and Grout—Part 2: Concrete Admixtures—Definitions, Requirements, Conformity, Marking and Labelling. The British Standards Institution: London, UK, 2012.
- BS EN 197-1:2011; Incorporating Corrigenda November 2011, October 2015, and February 2019; Cement—Part 1: Composition, Specifications, and Conformity Criteria for Common Cements. The British Standards Institution: London, UK, 2011.
- BS EN 933-1:2012; Tests for Geometrical Properties of Aggregates—Part 1: Determination of Particle Size Distribution—Sieving Method. The British Standards Institution: London, UK, 2012.
- BS EN 196-7:2020; Method of Testing Cement—Part 7: Methods of Taking and Preparing Samples of Cement. The British Standards Institution: London, UK,, 2020.
- BS EN 196-1:2016; Methods of Testing Cement—Part 1: Determination of Strength. The British Standards Institution: London, UK, 2016.
- ASTM C157-75; Standard Test Method for Length Change of Hardened Hydraulic-Cement Mortar and Concrete. ASTM International: West Conshohocken, PA, USA, 2017.
- BS EN 1770; Products and Systems for the Protection and Repair of Concrete Structures—Test Methods, Determination of the Coefficient of Thermal Expansion. The British Standards Institution: London, UK, 1998.
- RILEM TC. CPC 11.3 Absorption of Water by Concrete by Immersion under Vacuum; Recommendations for the Testing and Use of Construction Materials; E & FN SPON: London, UK, 1994; pp. 36–37. [Google Scholar] [CrossRef]
- Wittington, H.W.; McCarter, J.; Forde, M.C. The conduction of electricity through concrete. Mag. Concr. Res. 1981, 33, 48–60. [Google Scholar] [CrossRef]
- Bamforth, P.B.; Price, W.F. An International Review of Chloride Ingress into Structural Concrete; Contractor Report 359; Transport Research Laboratory: Scotland, UK, 1997; pp. 83–87. [Google Scholar]
- Baroghel-Bouny, V.; Kinomura, K.; Thiery, M.; Moscardelli, S. Easy assessment of durability indicators for service life prediction or quality control of concretes with high volumes of supplementary cementitious materials. Cem. Concr. Compos. 2011, 33, 832–847. [Google Scholar] [CrossRef]
- ASTM C1760-12; Standard Test Method for Bulk Electrical Conductivity of Hardened Concrete. ASTM International: West Conshohocken, PA, USA, 2012.
- Zhang, L.; Ding, S.; Han, B.; Yu, X.; Ni, Y.Q. Effect of water content on the piezoresistive property of smart cement-based materials with carbon nanotube/nanocarbon black composite filler. Compos. Part A Appl. Sci. Manuf. 2019, 119, 8–20. [Google Scholar] [CrossRef]
- Ding, S.; Ruan, Y.; Yu, X.; Han, B.; Ni, Y.Q. Self-monitoring of smart concrete column incorporating CNT/NCB composite fillers modified cementitious sensors. Constr. Build. Mater. 2019, 201, 127–137. [Google Scholar] [CrossRef]
- D’Alessandro, A.; Meoni, A.; Ubertini, F.; Luigi Materazzi, A. Strain measurement in a reinforced concrete beam using embedded smart concrete sensors. In Conference on Italian Concrete Days, Proceedings of the Italian Concrete Days 2018, Lecco, Italy, 14–15 June 2018; Springer: Cham, Switzerland, 2019; pp. 289–300. [Google Scholar] [CrossRef]
- Cosoli, G.; Mobili, A.; Tittarelli, F.; Revel, G.M.; Chiariotti, P. Electrical resistivity and electrical impedance measurement in mortar and concrete elements: A systematic review. Appl. Sci. 2020, 10, 9152. [Google Scholar] [CrossRef]
- Nguyen, T.Q.; Baroghel-Bouny, V.; Dangla, P. Prediction of chloride ingress into saturated concrete on the basis of a multi-species model by numerical calculations. Comput. Concr. 2006, 3, 401–422. [Google Scholar] [CrossRef]
- Baroghel-Bouny, V.; Thiery, M.; Wang, X. Performance-based assessment of durability and prediction of RC structure service life: Transport properties as input data for physical models. Mater. Struct. 2014, 47, 1669–1691. [Google Scholar] [CrossRef]
- Bard, A.J.; Faulkner, L.R. Electrochemical Methods: Fundamentals and Applications, 2nd ed.; John Wiley & Sons: Hoboken, NJ, USA, 2001; pp. 28, 29, 138. [Google Scholar]
- Bockris, J.O.; Reddy, A.K.N. Modern Electrochemistry, 2nd ed.; Kluwer Academic Publishers: New York, NY, USA, 2002; p. 1. [Google Scholar]
- Andrade, C. Calculation of chloride diffusion coefficients in concrete from ionic migration measurement. Cem. Concr. Res. 1993, 23, 724–742. [Google Scholar] [CrossRef]
- Truc, O.; Ollivier, J.P.; Carcasses, M. A new way for determining the chloride diffusion coefficient in concrete from steady state migration test. Cem. Concr. Res. 2000, 30, 217–226. [Google Scholar] [CrossRef]
- Castellote, M.; Andrade, C.; Alonso, C. Measurement of the steady and non-steady-state chloride diffusion coefficients in a migration test by means of monitoring the conductivity in the anolyte chamber Comparison with natural diffusion tests. Cem. Concr. Res. 2001, 31, 1411–1420. [Google Scholar] [CrossRef]
- Nordtest Method NT Build 492; Concrete, Mortar, and Cement-Based Repair Materials: Chloride Migration Coefficient from Non-Steady-State Migration Experiments. Nordic Council of Ministers: Copenhagen, Denmark, 1999.
- Tang, L.; Nilsson, L.O. Rapid determination of the chloride diffusivity in concrete by applying an electrical field. ACI Mater. J. 1992, 81, 49–53. [Google Scholar]
- Samson, E.; Marchand, J.; Snyder, K.A. Calculation of ionic diffusion coefficients on the basis of migration test results. Mater. Struct. 2003, 36, 156–165. [Google Scholar] [CrossRef]
- Tang, L. On Chloride Diffusion Coefficients Obtained by Using the Electrically Accelerated Methods. 1st RILEM Workshop on Chloride Penetration into Concrete; RILEM: St Rémy lès Chevreuse, France, 1995. [Google Scholar]
- Castellote, M.; Andrade, C.; Alonso, C. Chloride-binding isotherms in concrete submitted to non-steady-state migration experiments. Cem. Concr. Res. 1999, 29, 1799–1806. [Google Scholar] [CrossRef]
- Lu, X. Application of the Nernst-Einstein equation to concrete. Cem. Concr. Res. 1997, 27, 293–302. [Google Scholar] [CrossRef]
- Collins, R.E. Flow of Fluids through Porous Materials; PennWell Books: Tulsa, OK, USA, 1961; p. 38. [Google Scholar]
- Page, C.L.; Vennesland, O. Pore solution composition and chloride binding capacity of silica-fume cement pastes. Matér. Constr. 1983, 16, 19–25. [Google Scholar] [CrossRef]
- Snyder, K.A.; Feng, X.; Keen, B.D.; Mason, T.O. Estimating the electrical conductivity of cement paste pore solutions from OH−, K+ and Na+ concentrations. Cem. Concr. Res. 2003, 33, 793–798. [Google Scholar] [CrossRef]
- Taylor, H.F.W. Cement Chemistry, 2nd ed.; Thomas Telford: London, UK, 1997; pp. 212–218. [Google Scholar]
- Haynes, W.M. Handbook of Chemistry, 97th ed.; CRC Press: Boca Raton, FL, USA; Taylor & Francis Group: Boca Raton, FL, USA, 2017; pp. 5-75–5-76. [Google Scholar]
- Taylor, H.F.W. A method for predicting alkali ion concentrations in cement pore solutions. Adv. Cem. Res. 1987, 1, 5–16. [Google Scholar] [CrossRef]
- Brouwers, H.J.H.; Van Eijk, R.J. Alkali concentrations of pore solution in hydrating OPC. Cem. Concr. Res. 2003, 33, 191–196. [Google Scholar] [CrossRef]
- Hong, S.Y.; Glasser, F.P. Alkali binding in cement pastes: Part I. The C-S-H phase. Cem. Concr. Res. 1999, 29, 1893–1903. [Google Scholar] [CrossRef]
- Hong, S.Y.; Glasser, F.P. Alkali sorption by C-S-H and C-A-S-H gels: Part II. Role of alumina. Cem. Concr. Res. 2002, 32, 1101–1111. [Google Scholar] [CrossRef]
- Mounanga, P.; Khelidj, A.; Loukili, A.; Baroghel-Bouny, V. Predicting Ca(OH)2 content and chemical shrinkage of hydrating cement pastes using analytical approach. Cem. Concr. Res. 2004, 34, 255–265. [Google Scholar] [CrossRef]
- A Concrete Society Working Group. Permeability Testing of Site Concrete; Technical Report No. 31; The Concrete Society: Witney, UK; Alden Press: Witney, UK, 2008; pp. 31–41. [Google Scholar]
- Neville, A.M. Properties of Concrete, 5th ed.; EYROLLES: Paris, France, 2011; pp. 486,496. [Google Scholar]
- Tumidajski, P.J.; Lin, B. On the validity of the Katz-Thompson equation for permeabilities in concrete. Cem. Concr. Res. 1998, 28, 643–647. [Google Scholar] [CrossRef]
- El-Dieb, A.S.; Hooton, R.D. Evaluation of the Katz-Thompson model for estimating the water permeability of cement-based materials from mercury intrusion porosimetry data. Cem. Concr. Res. 1994, 24, 443–455. [Google Scholar] [CrossRef]
- Scherer, G.W.; Valenza, J.J., II; Simmons, G. New methods to measure liquid permeability in porous materials. Cem. Concr. Res. 2007, 37, 386–397. [Google Scholar] [CrossRef]
- Rübner, K.; Fritz, T.; Jacobs, F. Precision of porosity measurements on cementitious mortars. Stud. Surf. Sci. Catal. 2002, 144, 459–466. [Google Scholar] [CrossRef]
- Diamond, S. Durability of Concrete and Cement Composites, Physical and Chemical Characteristics of Cement Composites; Woodhead Publishing Series in Civil and Structural Engineering; Purdue University: West Lafayette, IN, USA, 2007; pp. 10–44. [Google Scholar] [CrossRef]
- Bamforth, P.B. Control of Cracking Caused by Restrained Deformation in Concrete; C766; CIRIA: London, UK, 2018; pp. 47–49. [Google Scholar]
- Bensted, J.; Barnes, P. Structure and Performance of Cements, 2nd ed.; CRC Press: Boca Raton, FL, USA, 2008; pp. 158,163,194,384. [Google Scholar]
- BS EN 1992-1-1:2004+A1:2014; Eurocode 2: Design of Concrete Structures—Part 1-1: General Rules and Rules for Building. The British Standards Institution: London, UK, 2014.
- O’ Donoghue, V. Shrinkage of Concrete; Concrete Advice No. 56; The Concrete Society: Blackwater, UK, 2016. [Google Scholar]
- Bentz, D.P.; Jensen, O.M.; Hansen, K.K.; Olesen, J.F.; Stang, H.; Haecker, C.J. Influence of cement particle size distribution on early age autogenous strains and stresses in cement-based materials. J. Am. Ceram. Soc. 2001, 84, 129–135. [Google Scholar] [CrossRef]
- Wittmann, F.H.; Beltzung, F.; Zhao, T.J. Shrinkage mechanisms, crack formation and service life of reinforced concrete structures. Int. J. Struct. Eng. 2009, 1, 13–28. [Google Scholar] [CrossRef]
- Beltzung, F.; Wittmann, F.H. Role of disjoining pressure in cement-based materials. Cem. Concr. Res. 2005, 35, 2364–2370. [Google Scholar] [CrossRef]
- ACI 364.15T; Technical Note: Significance of the Shrinkage-Compensating and Nonshrink Labels on Packaged Repair Materials, ACI Committee 364. American Concrete Institute: Indianapolis, IN, USA, 2018.
- ACI 209R; Prediction of Creep, Shrinkage, and Temperature Effects in Concrete structures, ACI Committee 209. American Concrete Institute: Farmington Hills, MI, USA, 1997.
- BS EN 1992-3; Eurocode 2: Design of Concrete Structures Part 3: Liquid Retaining and Containment Structures. The British Standards Institution: London, UK, 2006.
- Thomas, R.J.; Ariyachandra, E.; Lezama, D.; Peethamparan, S. Comparison of chloride permeability methods for Alkali-Activated concrete. Constr. Build. Mater. 2018, 165, 104–111. [Google Scholar] [CrossRef]
- Stanish, K.D.; Hooton, R.D.; Thomas, M.D.A. Testing the Chloride Penetration Resistance of Concrete: A Literature Review, FHWA Contract DTFH61-97-R-00022; University of Toronto: Toronto, ON, Canada, 1997. [Google Scholar]
- Amorim, J.N.S.; Silva, G.A.O.; Dias, C.M.R.; Ribeiro, D.V. Concrete containing recycled aggregates: Estimated lifetime using chloride migration test. Constr. Build. Mater. 2019, 222, 108–118. [Google Scholar] [CrossRef]
- Sigh, N.; Singh, S.P. Carbonation and electrical resistance of self-compacting concrete made with recycled concrete aggregates and metakaolin. Constr. Build. Mater. 2016, 121, 400–409. [Google Scholar] [CrossRef]
- Sander, M.M.; Nicolau, A.; Guzatto, R.; Samios, D. Plasticiser effect of oleic acid polyester on polyethylene and polypropylene. Polym. Test. 2012, 31, 1077–1082. [Google Scholar] [CrossRef]
- Li, S.; Roy, D.M. Investigation of relations between porosity, pore structure, and Cl- diffusion of fly ash and blended cement pastes. Cem. Concr. Res. 1986, 16, 756. [Google Scholar] [CrossRef]
- Spragg, R.; Bu, Y.; Snyder, K.A.; Bentz, D.P.; Weiss, J. Electrical Testing of Cement-Based Materials: Role of Testing Techniques, Sample Conditioning, and Accelerated Curing; Report FHWA/IN/JTRP-2013/28; Joint Transportation Research Program, Indiana Department of Transportation and Purdue University: West Lafayette, IN, USA, 2013; p. 16. [Google Scholar] [CrossRef]
- Archie, G.E. The electrical resistivity log as an aid in determining some reservoir characteristics. Trans. AIME 1941, 146, 54–62. [Google Scholar] [CrossRef]
- AASHTO PP 84-18; Standard Practice for Developing Performance Engineered Concrete Pavement Mixtures. American Association of State and Highway Transportation Officials: Washington, DC, USA,, 2018.
- Meddah, M.S.; Lmbachiya, M.C.; Dhir, R.K. Potential use of binary and composite limestone cements in concrete production. Constr. Build. Mater. 2014, 58, 193–205. [Google Scholar] [CrossRef]
- Wang, D.; Shi, C.; Farzadnia, N.; Zhenguo, S.; Huangfei, J. A review on effects of limestone powder on the properties of concrete. Constr. Build. Mater. 2018, 192, 153–166. [Google Scholar] [CrossRef]
- Valcuende, M.; Marco, E.; Parra, C.; Serna, P. Influence of limestone filler and viscosity-modifying admixture on the shrinkage of self-compacting concrete. Cem. Concr. Res. 2012, 42, 583–592. [Google Scholar] [CrossRef]
- Maryoto, A.; Gan, S.B.; Hermanto, N.I.S.; Setijadi, R. Effect of calcium stearate in the mechanical and physical properties of concrete with PCC and fly ash binders. Materials 2020, 13, 1394. [Google Scholar] [CrossRef] [PubMed]
- Stolz, H.J. Oleochemicals—Important additives for building protection. ZKG Int. 2008, 61, 78–86. [Google Scholar]
- Task Group 5.6. Bulletin 34—Model Code for Service Life Design; International Federation for Structural Concrete: Lausanne, Switzerland, 2006. [Google Scholar]
- Lindvall, A. Environmental Actions on Concrete Exposed in Marine and Road Environments and Its Response. Consequences for the Initiation of Chloride Induced Reinforcement Corrosion. PhD Thesis, Department of Building Technology, Building Materials, Chalmers University of Technology, Göteborg, Sweden, 2003. [Google Scholar]
- Attari, A.; McNally, C.; Richardson, M.G. A probabilistic assessment of the influence of age factor on the service life of concretes with limestone cement/GGBS binders. Constr. Build. Mater. 2016, 111, 488–494. [Google Scholar] [CrossRef]


Publisher’s Note: MDPI stays neutral with regard to jurisdictional claims in published maps and institutional affiliations. |
© 2022 by the authors. Licensee MDPI, Basel, Switzerland. This article is an open access article distributed under the terms and conditions of the Creative Commons Attribution (CC BY) license (https://creativecommons.org/licenses/by/4.0/).