1. Introduction
Reinforced concrete (RC) slab-column structures comprised of slabs and columns are susceptible to punching shear, because the beams are not arranged for the considerations of structural layout under slabs [
1]. Under excessive punching shear loads, the interior slab-column joint is usually destroyed first, the rest of the joints are destroyed in succession, and the progressive collapse of overall structure takes place [
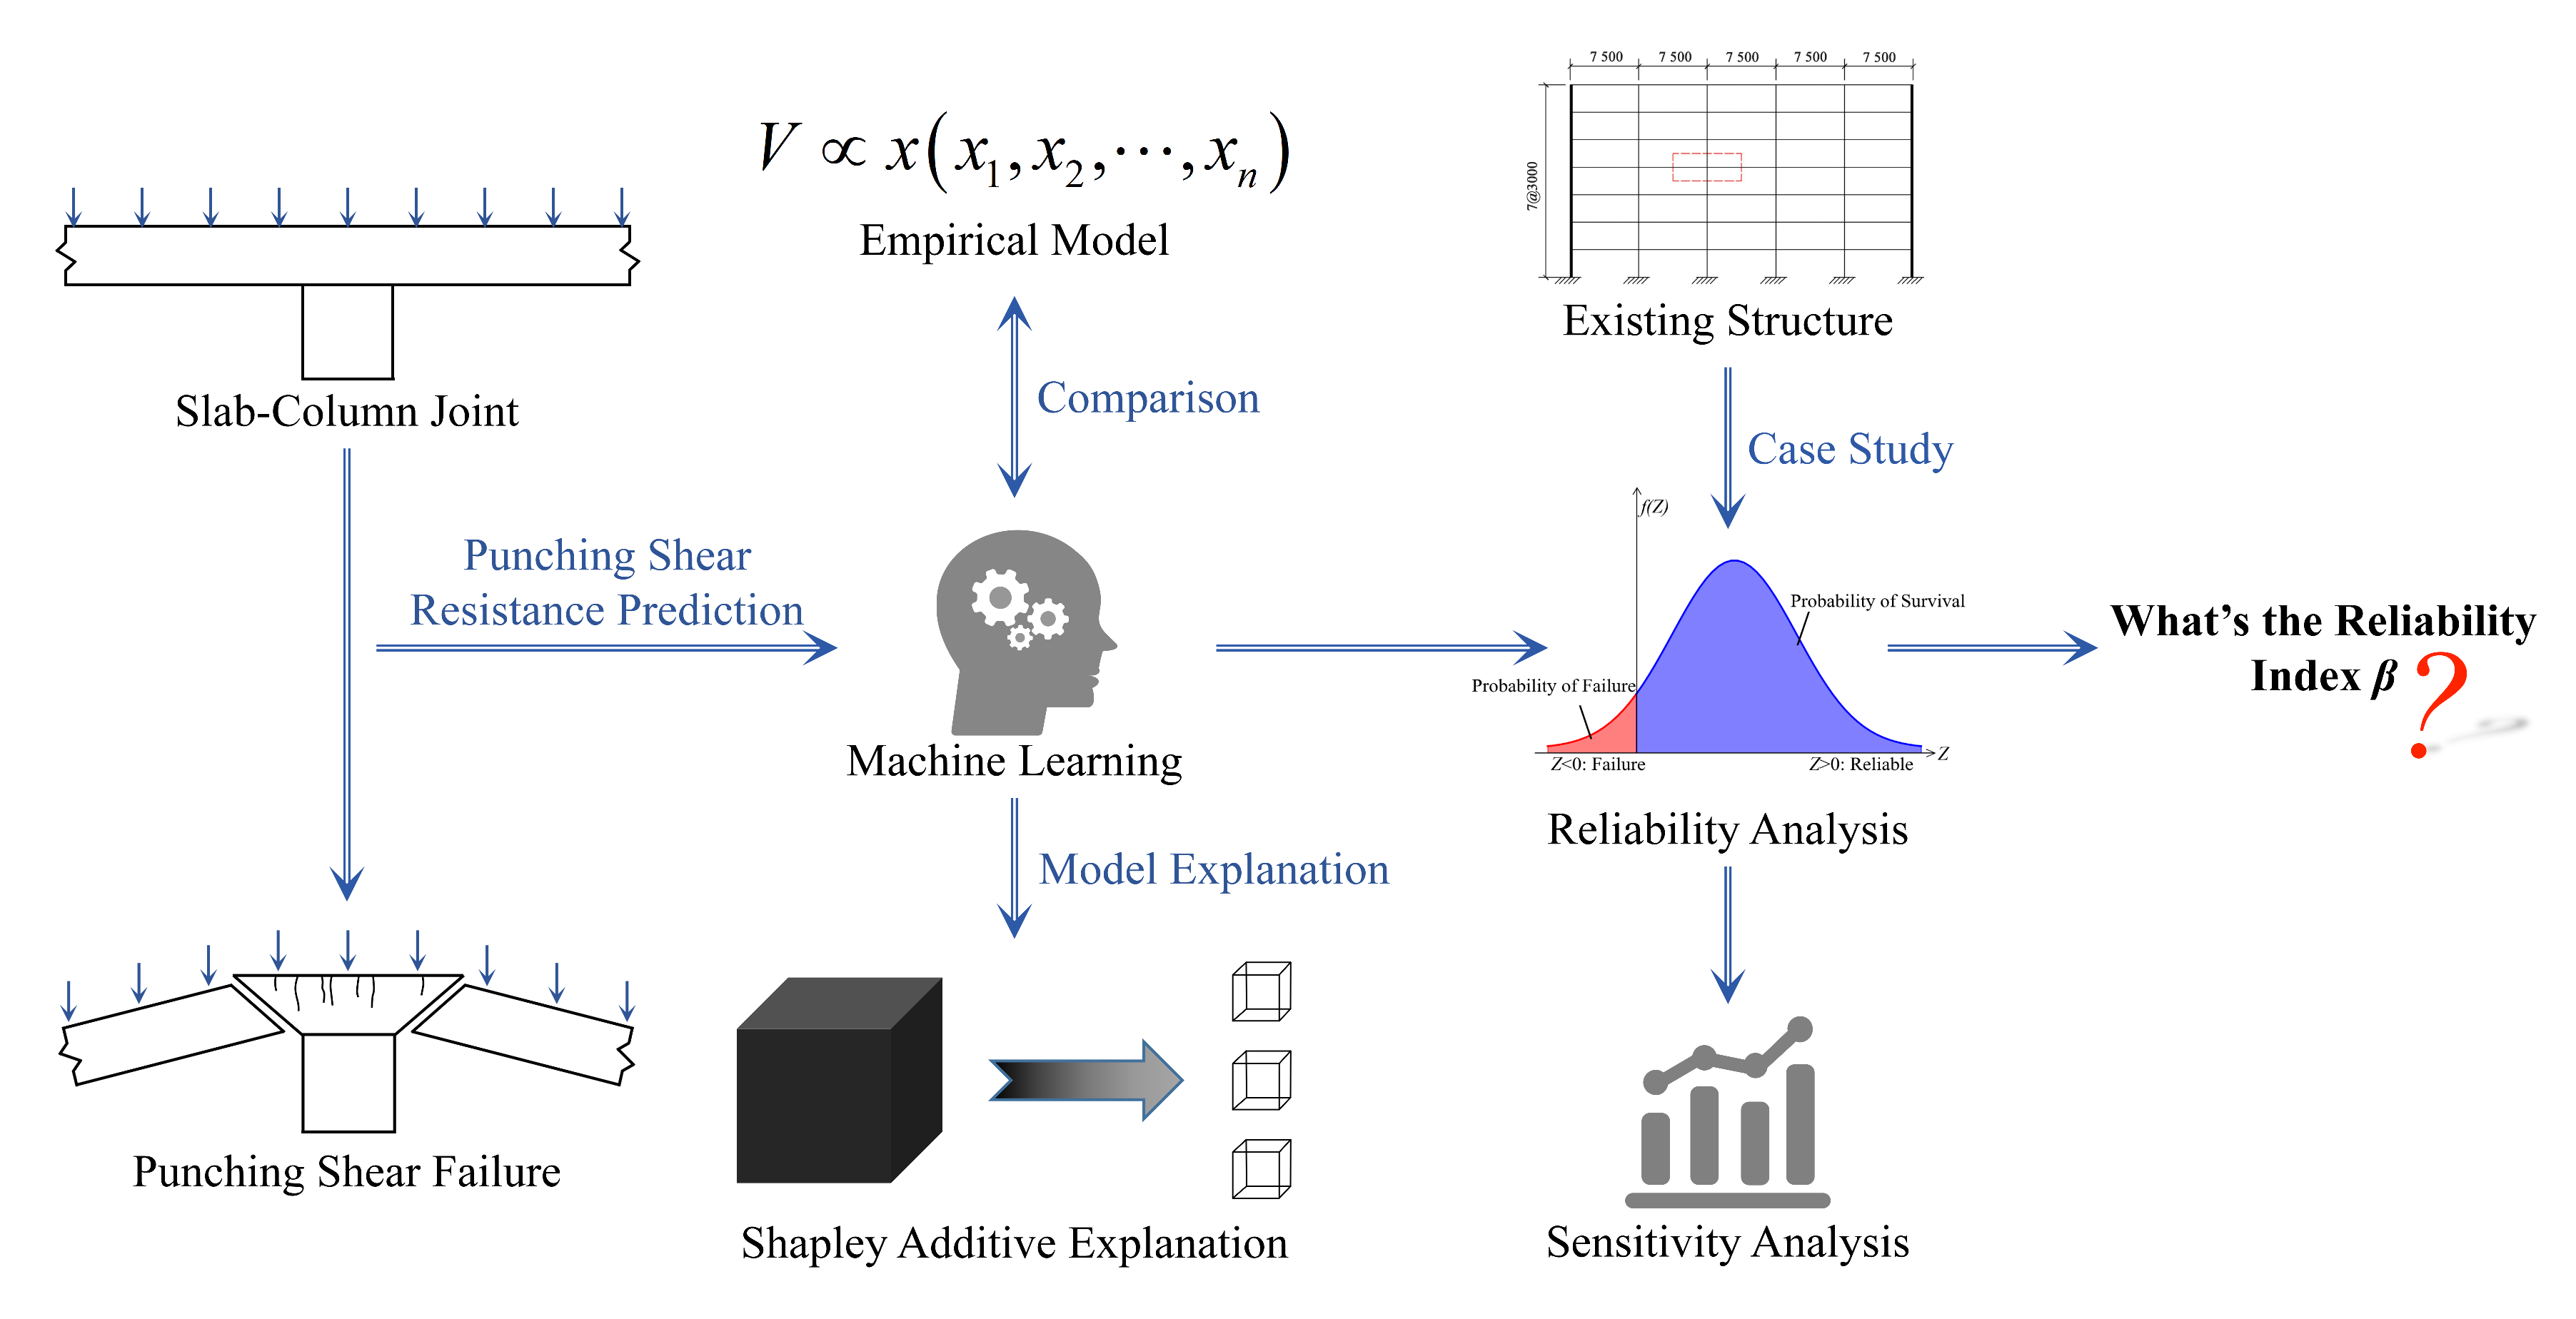
2]. Accidents (
Figure 1), such as the collapse of a 16-storey apartment building [
3] in Boston, US and Skyline Plaza [
4] in Virginia, US, have caused severe damage, which arouse the researchers’ attention regarding the reliability analysis of RC slab-column joints.
To assess the performance of slab-column structures, especially the slab-column joints, a number of experimental studies have been conducted on the punching shear resistance. With the experimental results, some empirical models [
5,
6,
7,
8,
9,
10,
11,
12,
13,
14,
15] have been proposed based on a variety of mechanical theories. Kinnunen and Nylander [
5] analyzed the experimental data of circle slab-circle columns, and created the sector model. Based on this, Broms [
6,
7] proposed a modified model considering the impact of size effect, which obtained the solution of the ultimate angle of the slabs. Tian et al. [
8] proposed a prediction model considering the impact of reinforcement strength (
ρfy). According to the eccentric shear stress model proposed by Stasio et al. [
9], an improved model with stronger applicability was proposed by Moe [
10], which became the theory basis of both GB 50010-2010 [
11] and ACI 318-19 [
12]. After analyzing the critical cracks of slab-column joints and considering the impact of aggregate size, the critical shear crack theory (CSCT) was proposed by Muttoni [
13]. Based on the modified compression field theory (MCFT), Wu et al. [
14] developed a prediction model; its prediction performance was validated by many experimental data. According to the regression analysis of the experimental data, a prediction model was proposed by Chetchotisak et al. [
15].
However, the aforementioned mechanical or empirical models possess the problem of prediction precision [
16,
17]. As a typical data-driven model with advantages such as superior prediction performance and high computational efficiency, machine learning (ML) is applied to many engineering fields successfully [
18,
19,
20,
21,
22,
23,
24,
25]. In the resistance prediction of slab-column joints, Nguyen et al. [
16] established a prediction model using extreme gradient boosting (XGBoost), the performance of which was validated by empirical models and other two ML models. Mangalathu et al. [
17] also constructed XGBoost models, and used SHapley Additive exPlanation (SHAP) to illustrate the prediction process of XGBoost. Shen et al. [
23] established an ML model to predict the punching shear resistance of fiber-reinforced polymer (FRP) -reinforced concrete slabs, the performance of which was better than that of the compared empirical models. Truong et al. [
24] studied the punching shear strength of FRP-RC slab column connections with the assistance of ML models.
The objective of reliability analysis is to evaluate the safety of structures by considering how their performances are affected by the uncertainties, which are introduced by random material properties or stochastic loads [
26]. There are two types of methods for reliability analysis, namely the gradient-based method and the simulation-based method [
27]. The first method contains the first-order reliability method (FORM), and the second-order reliability method (SORM) aims to find the most likely failure point through the limit state function estimation. Such a method has a high computational efficiency, but it introduces approximations that are sometimes unacceptable from a precision point of view [
28]. As the main simulation-based method, the Monte Carlo sampling method is conventional, clear, and easy to use, but such a method requires numerous samples [
29,
30]. Nassim et al. [
31] studied the reliability of two cases by using the response surface method (RSM) as well as Monte Carlo simulation (MCS). Olmati et al. [
32] proposed a simplified analysis framework and used MCS to analyze the reliability of an office building. Chetchotisak et al. [
15] studied the structural reliability within two kinds of concrete (normal-strength concrete and high-strength concrete) by using MCS. Ricker et al. [
33] utilized three reliability analysis techniques, such as the mean-value first-order second moment method (MVFOSM), the first-order second moment method (FOSM), and MCS, to assess the safety levels of the punching shear resistance of flat slabs without shear reinforcement. However, the relatively low prediction accuracy of the aforementioned mechanical or empirical models led to unsatisfying results of the reliability analysis. To obtain more accurate reliability analysis results, the finite element method (FEM) is popularly applied as the surrogate model of structural response under stochastic material properties or loading conditions [
34]. The complexity and nonlinearity existing in structures, as well as the randomness produced by influential factors of a structure itself, prove that FEM becomes a fine choice. However, the mechanical property-based analysis restricts the computational efficiency of FEM, which is inapplicable to practical projects [
35]. Furthermore, as the most commonly used parallel analysis method in a stochastic context, MCS has a problem of inadequate computational efficiency, because the number of samples needed for analysis is considerably large [
36]. The ML model is a prospective solution for the contradiction between computational efficiency and accuracy, and has been applied in the reliability analyses of RC structures in the latest studies [
37].
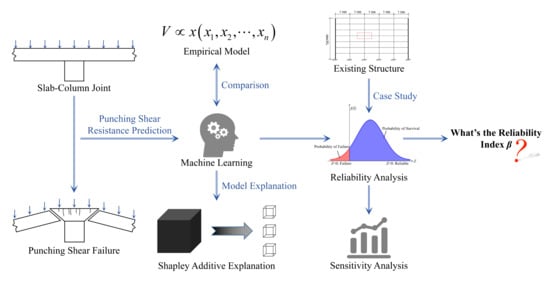
To the best knowledge of the authors, there is no available example combining reliability analysis of RC slab-column joints and ML; thus, this paper establishes an ML-MCS model for reliability analysis to meet the requirements of practical projects. The candidate ML models selected in this paper are artificial neural network (ANN), decision tree (DT), random forest (RF), and XGBoost. The final prediction model is screened from these four ML models, and the performance comparison between them is implemented through three performance measures: root mean squared error (RMSE), mean absolute error (MAE), and coefficient of determination (R
2). To display the advantages of the ML models, two design provisions (GB 50010-2010 [
11] and ACI 318-19 [
12]), as well as three prediction models proposed by Tian et al. [
8], Wu et al. [
14], and Chetchotisak et al. [
15], are used for prediction performance comparison with ML models. Furthermore, SHAP is introduced for model explanation and analysis of influential factors; the prediction process can be visualized to facilitate the understanding [
22]. Based on the established ML model, a slab-column structure in an actual engineering application is used for reliability analysis through MCS. Moreover, the safety assessment of the structure is discussed through sensitivity analysis.
2. Punching Shear Resistance Database of RC Slab-Column Joints
The high-fidelity data is the basis of the construction of ML models, so that the compilation of the experimental database is required. The punching shear resistance database containing 610 experimental data is shown in
Appendix A, and the statistic information of input variables is listed in
Table 1. Some relevant studies [
8,
14,
38] report that there are seven main influential factors affecting slab-column joints: cross-section shape of column (
s), cross-section area of column (
A), slab’s effective depth (
d), compressive strength of concrete (
f’c), yield strength of reinforcement (
fy), reinforcement ratio (
ρ), and span-depth ratio (
λ). Their distributions are described in four measures: minimum, maximum, standard deviation, and average. The cross-section of each column has three shapes: square (
s = 1), circle (
s = 2), and rectangle (
s = 3). The prediction target of the ML models is the punching shear resistance (
V) of slab-column joints.
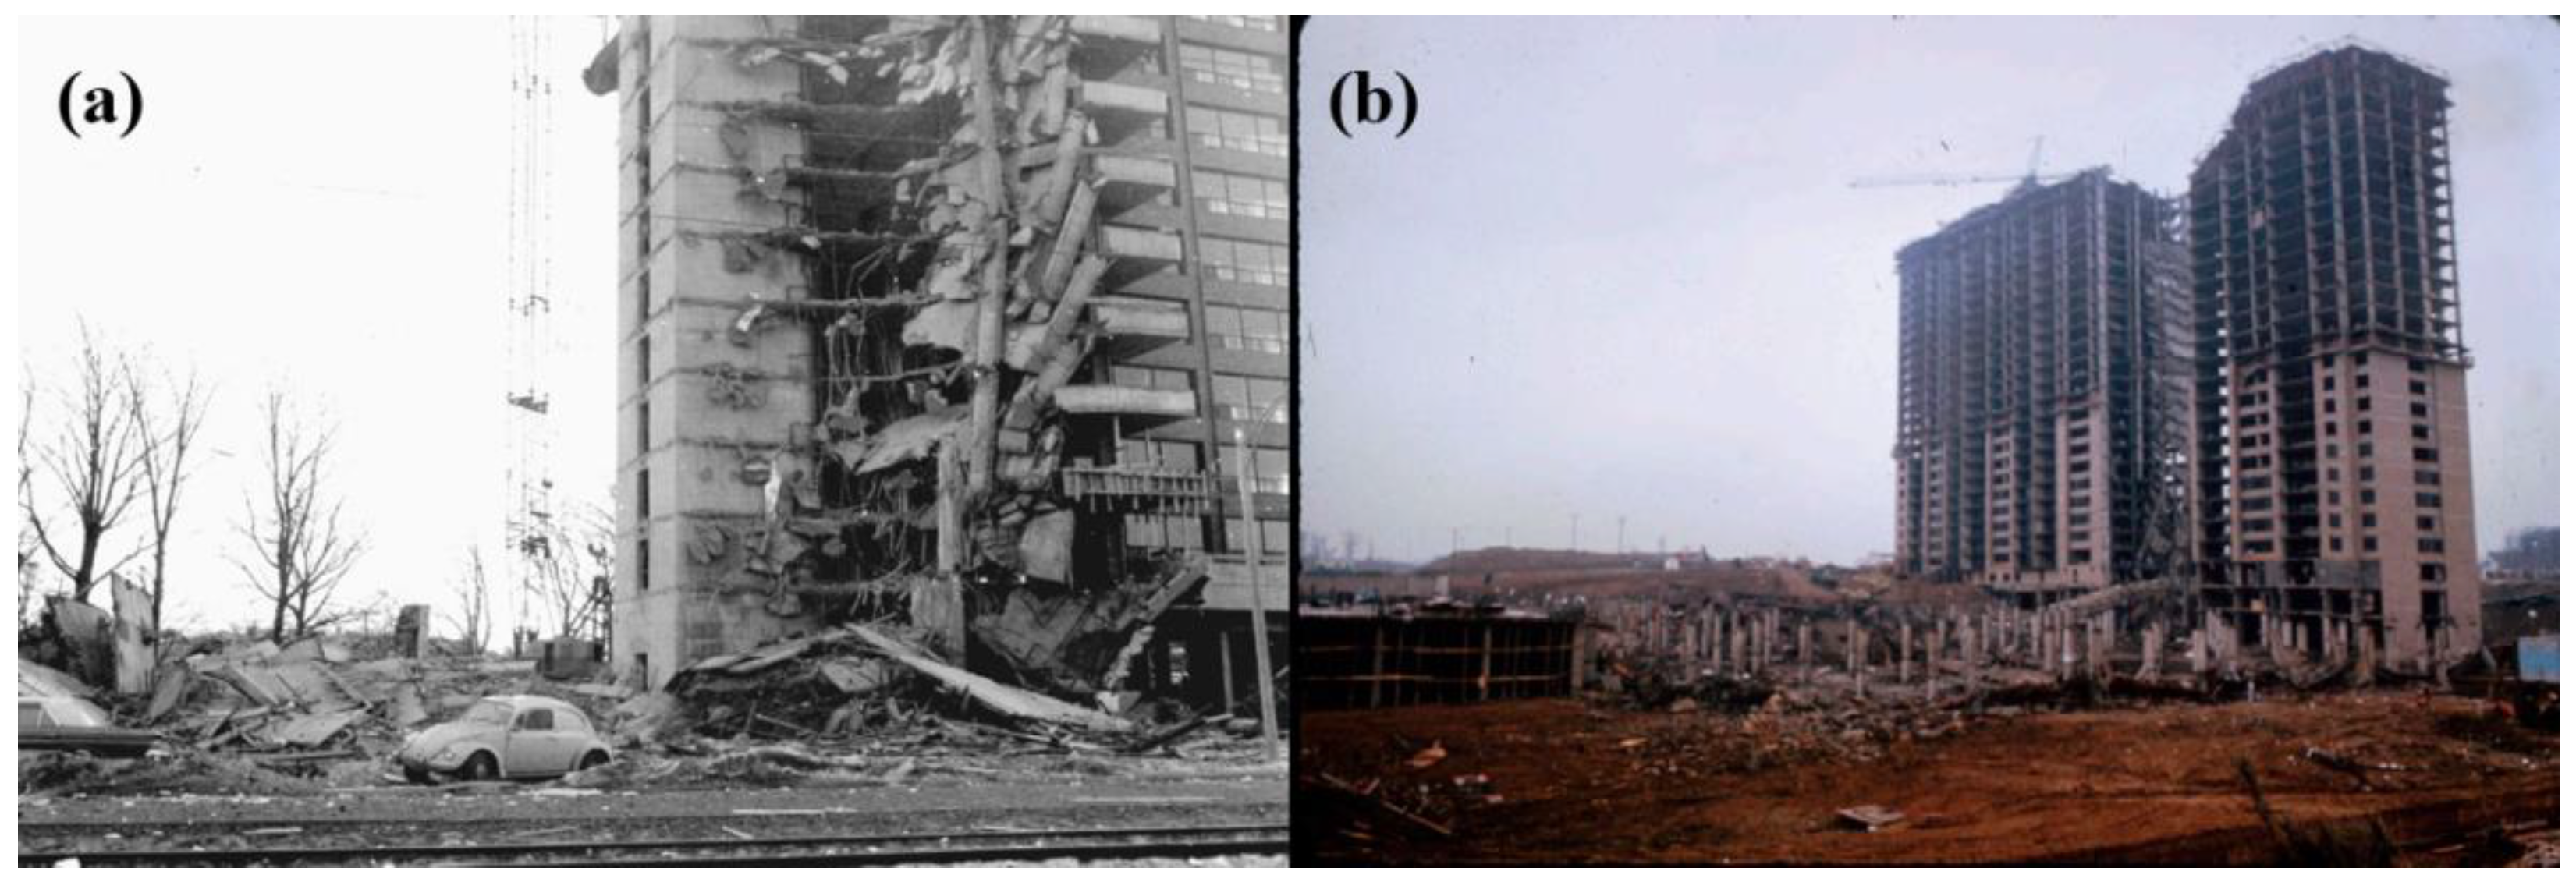
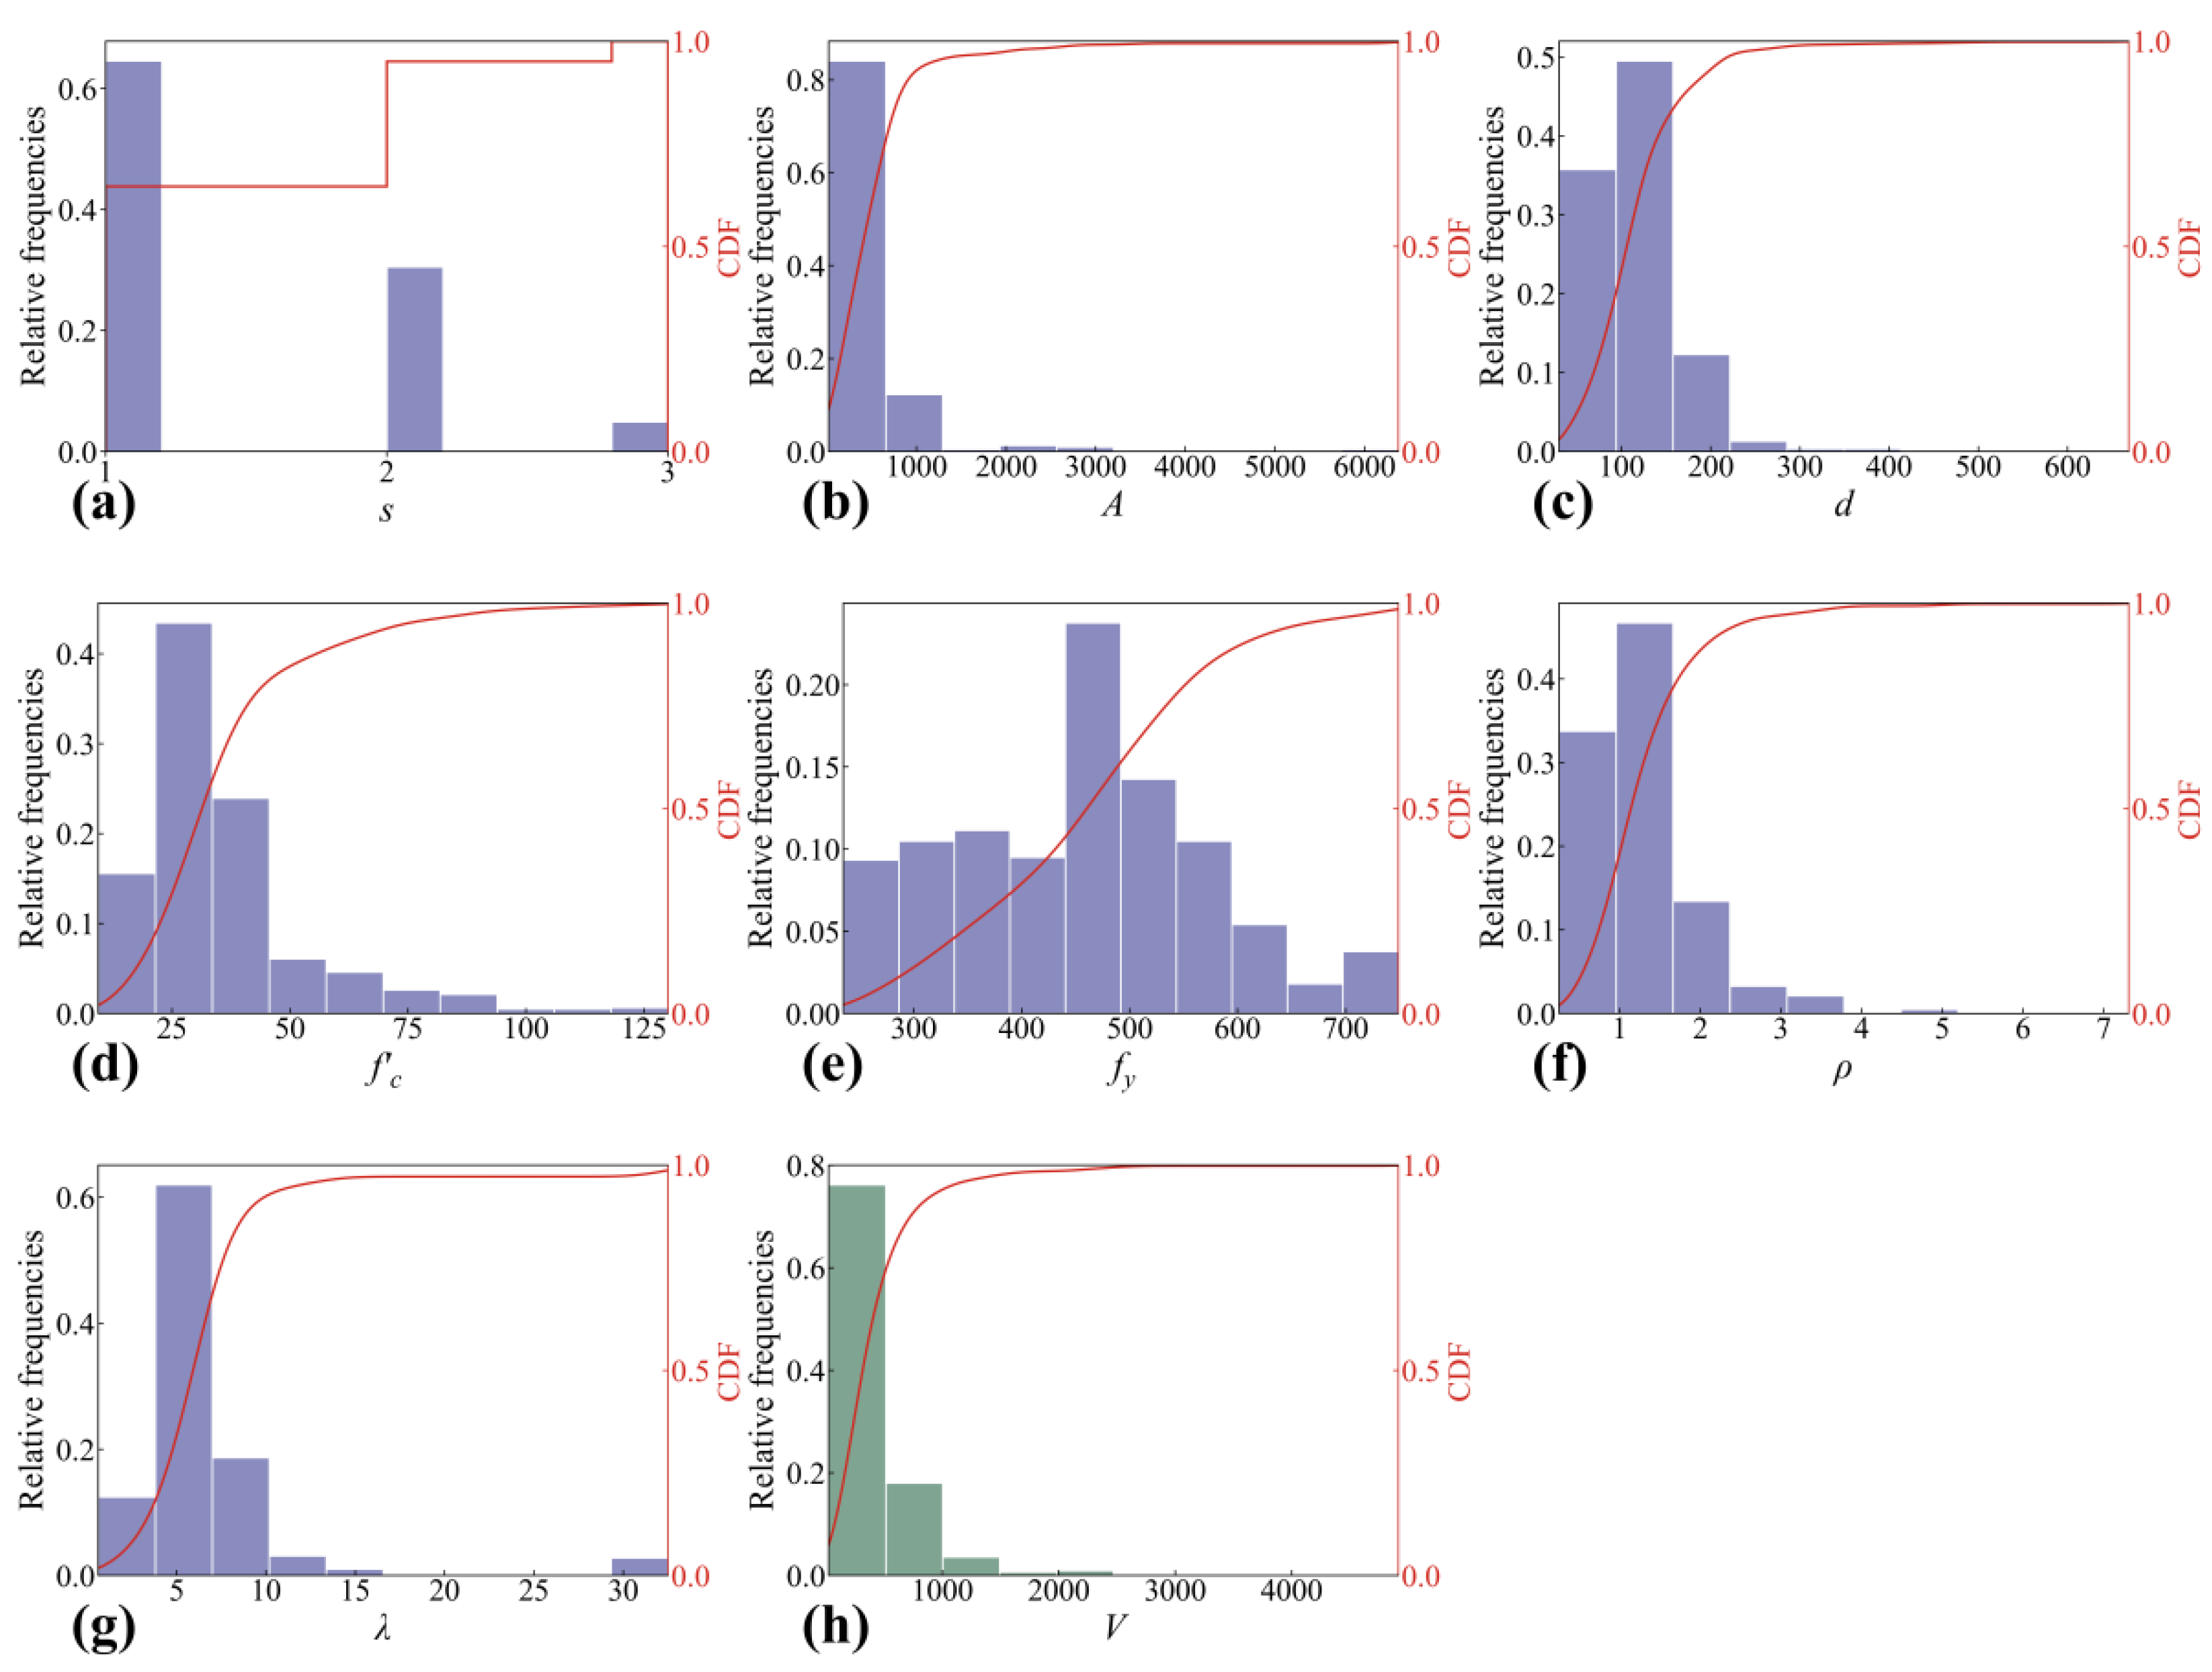
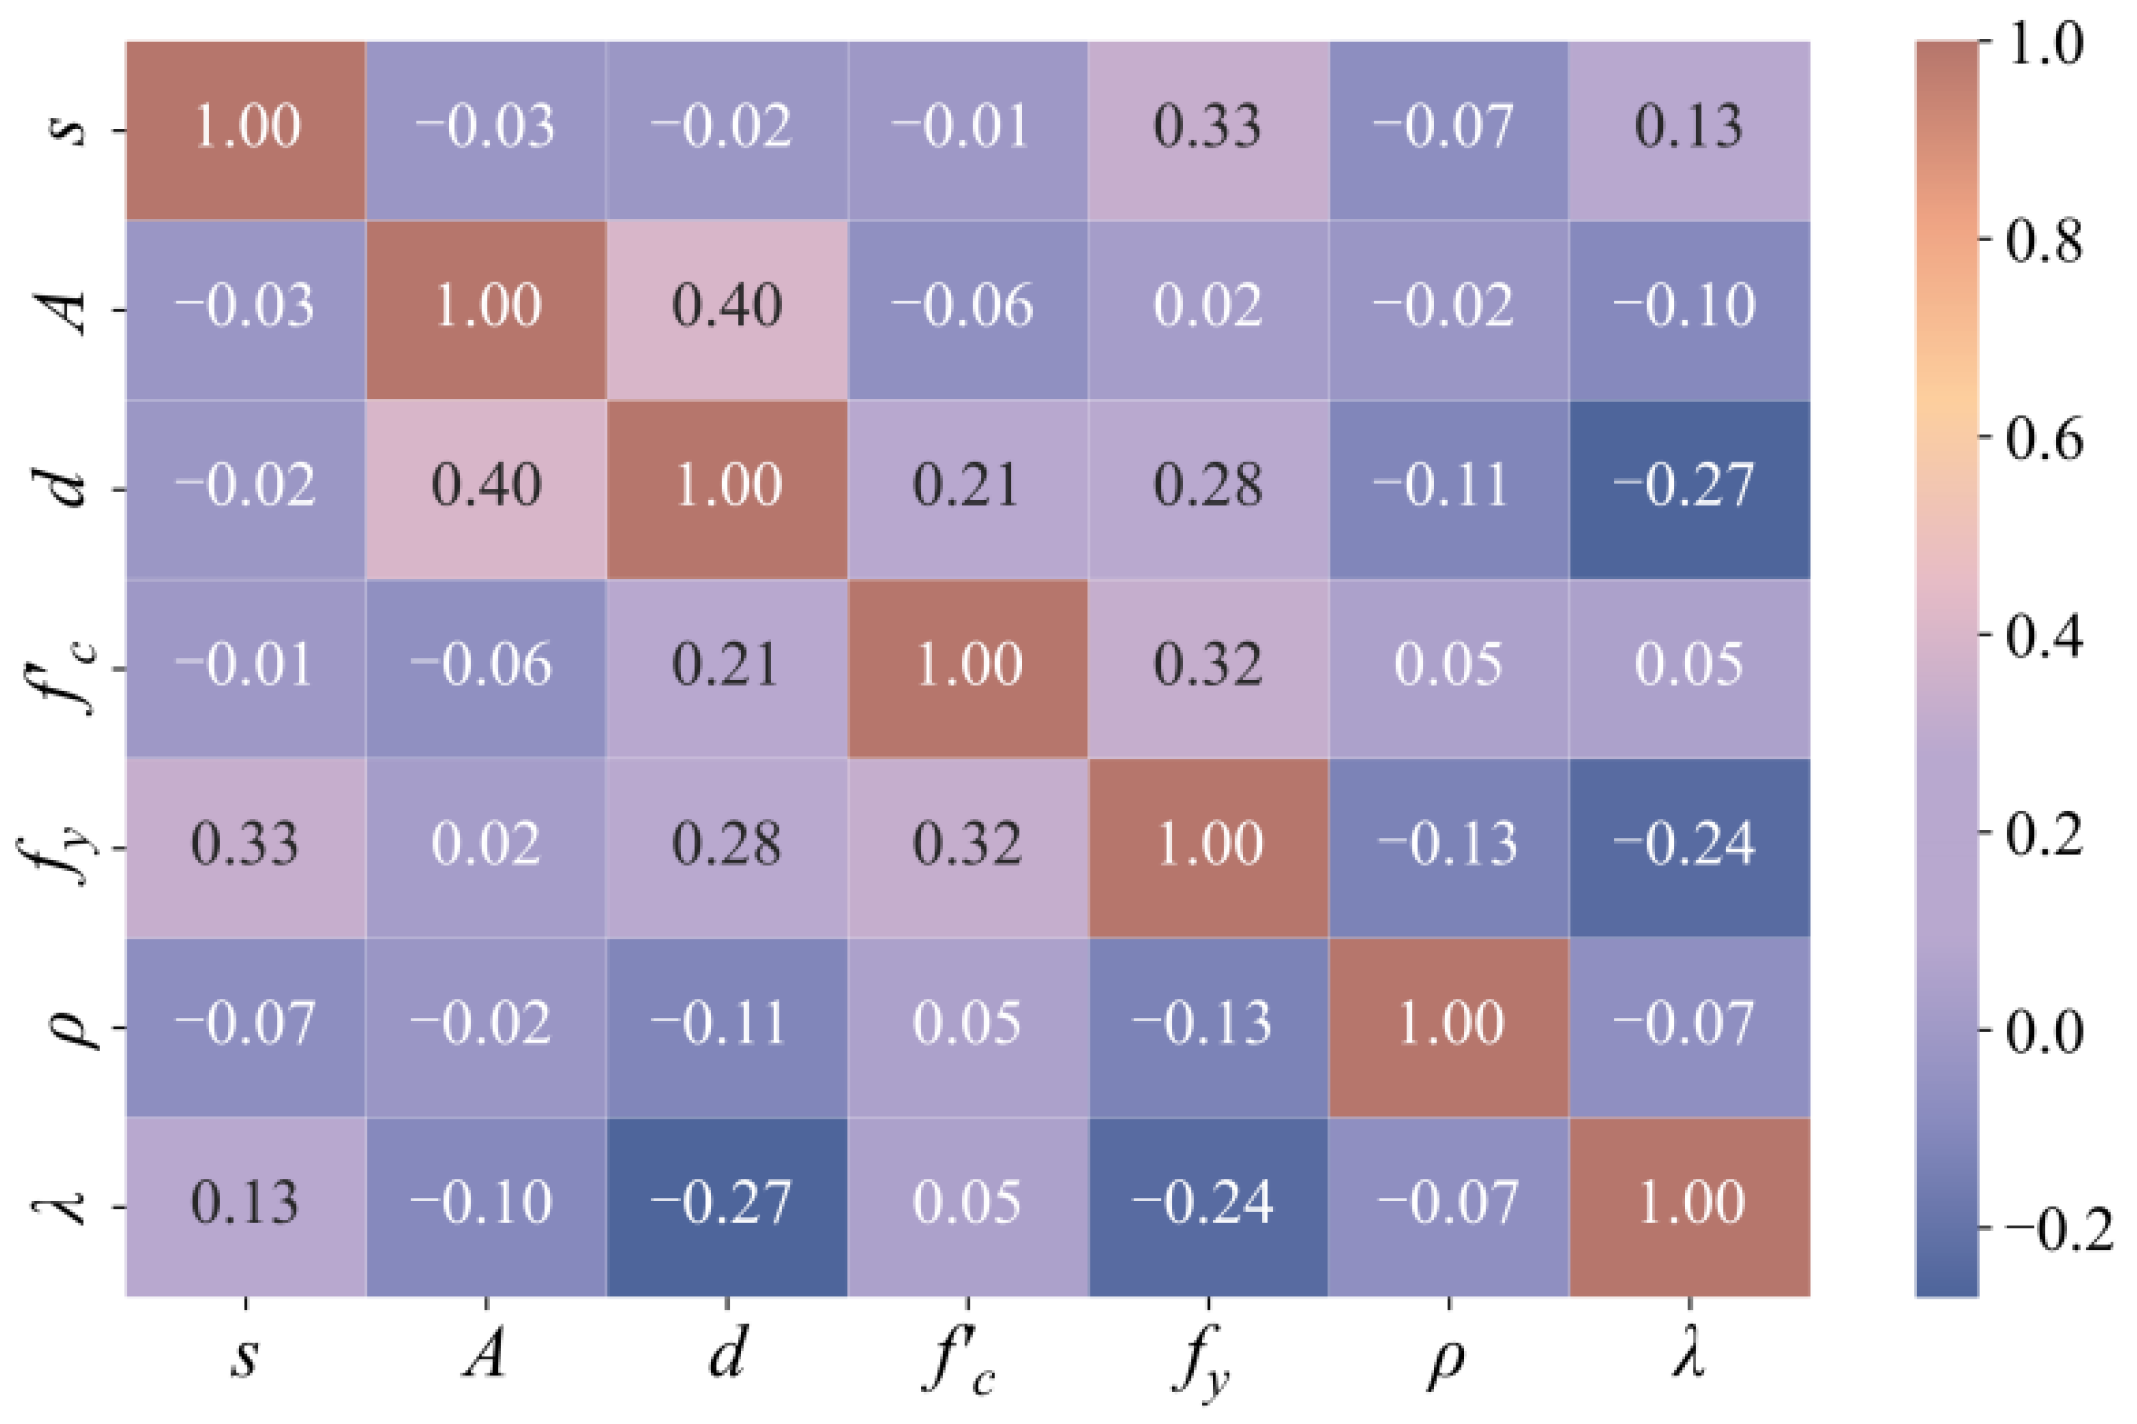
The histograms displayed in
Figure 2 show the relative frequency distributions of the input variables and the output, and the red lines represent the cumulative distribution functions (CDF) of the parameters. To further understand the correlations between the input variables, they are quantified as a Pearson correlation coefficient matrixand shown in
Figure 3, where coefficients represent the degree of linear correlation between input variables [
39]. The coefficients close to −1 or 1 represent the obvious negative or positive linear correlation, and the degree of linear correlation between
A and
d is highest.
4. Reliability Analysis: RC Slab-Column Joint of an Office Building
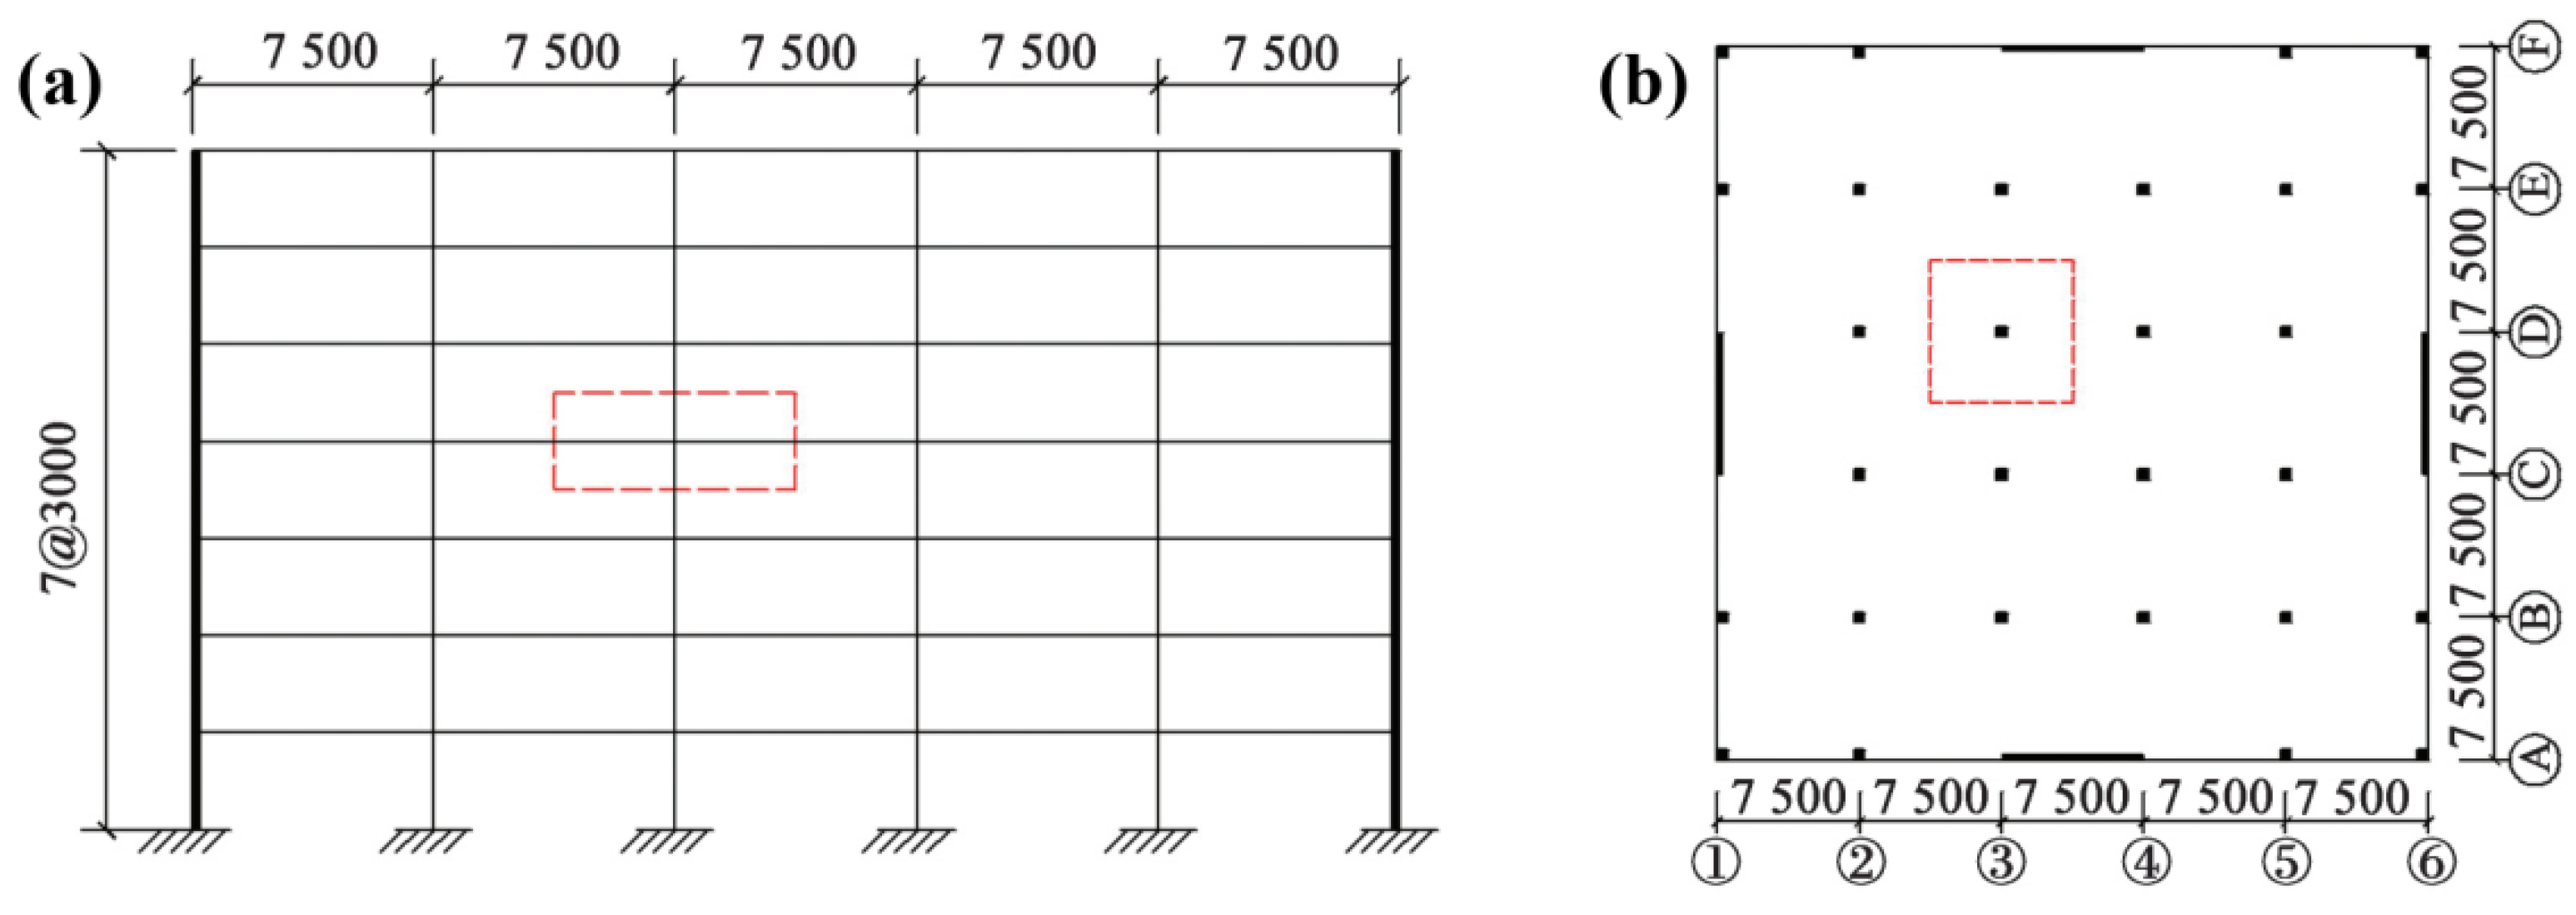
The prototype building used for reliability analysis is a 7-story, 5-span RC slab-column shear wall office building [
53], and it was designed using GB 50010-2010 [
11] and GB 50011-2010 [
54]. The building itself contains 3 m storey height and is supported by a 7.5 m × 7.5 m column grid, and the interior joint shown in
Figure 9 is selected as the study object. The selected joint consists of a slab with an effective depth of 209 mm and a square column with side length of 530 mm, which is subjected to the specified dead load of 7.0 kN/m
2 and live load of 2.0 kN/m
2. According to the requirement of GB 50068-2018 [
55], the dead load and live load used for limit state design must be adjusted by multiplying the partial safety factors for the load, such as 1.3 and 1.5. Therefore, the limit state function Z of structure can be defined as:
where
R is the punching shear resistance;
SG is the dead load;
SQ is the live load. Furthermore, the measured compressive strength of C50 concrete in the slab is 39.31 Mpa, and the measured yield strength of HRB400 reinforcement is 421 Mpa. The reinforcement ratio of the joint is 0.81%, and the main influential factors are listed in
Table 4.
The statistic information and suitable probability density functions of the stochastic variables used for reliability analysis are listed in
Table 5 [
33,
56], where COV is the coefficient of variance. According to the study conducted by Chojaczyk et al. [
27], the COV of failure probability
Pf calculated by MCS is accepted when its value is around 0.1; then the
Pf around 10
−4 (the normal failure probability of an existing structure) can be calculated through the simulation based on
N samples [
57]:
where
N signifying 1,000,000 can be determined according to the aforementioned conditions. Another method used in the study conducted by Hadianfard et al. [
58] stipulates that the number of samples needed for MCS can be determined through:
where
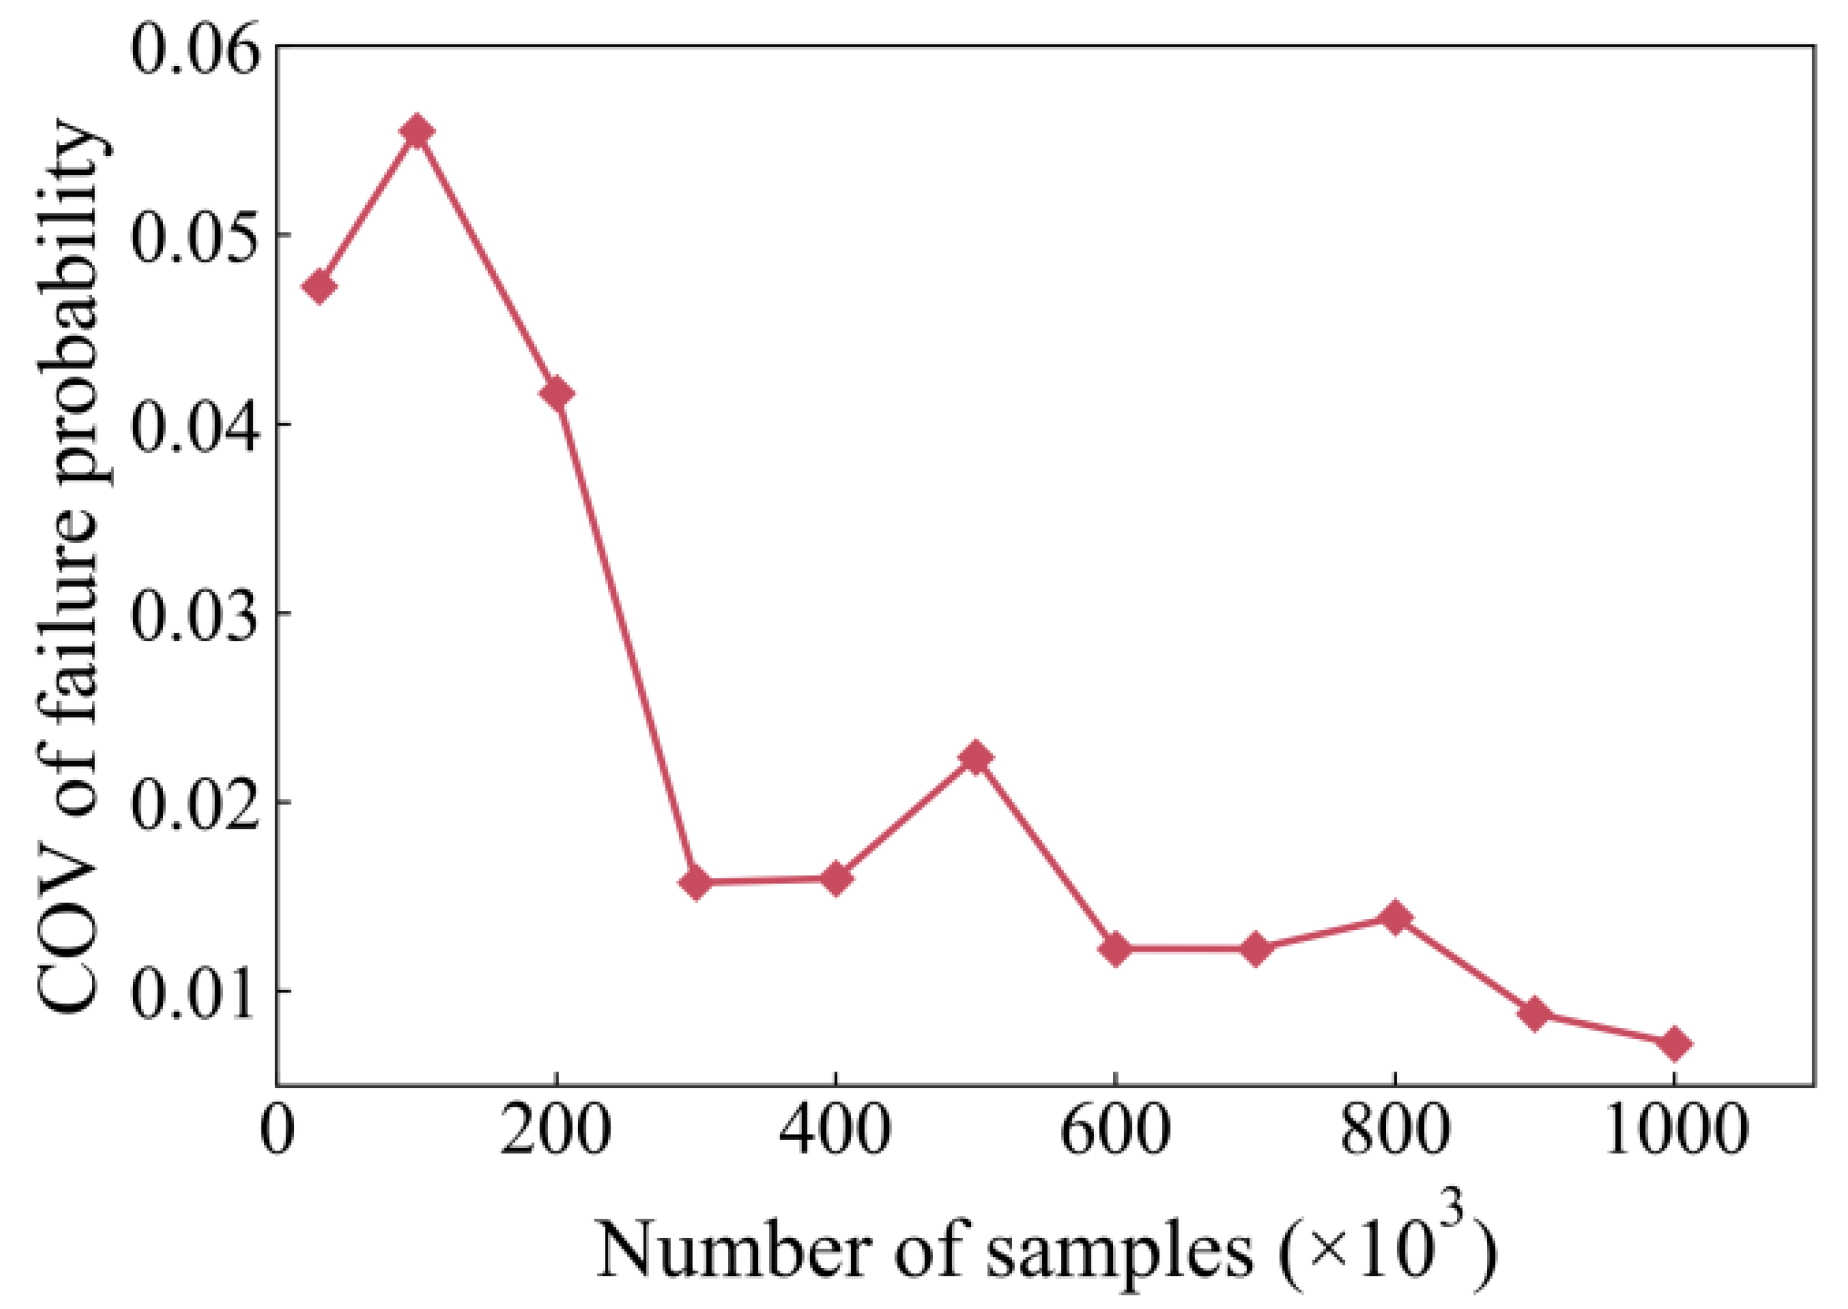
C is the confidence level, with values of 0.95 in this paper. Equation (11) suggests that the number of samples should not be less than 30,000, so that the value range calculated by Equations (10) and (11) is determined between 30,000 and 1,000,000. In this range, the variation of COV of failure probability
Pf within 10 simulations is shown in
Figure 10. The COV of failure probability decreases with the increase of the sample size from 30,000 to 1,000,000, which means that the result of the reliability analysis increasingly stabilizes. Based on this knowledge, 1,000,000 samples are produced randomly and conduced for reliability analysis by XGBoost and MCS.
4.1. Results of Structural Reliability Analysis
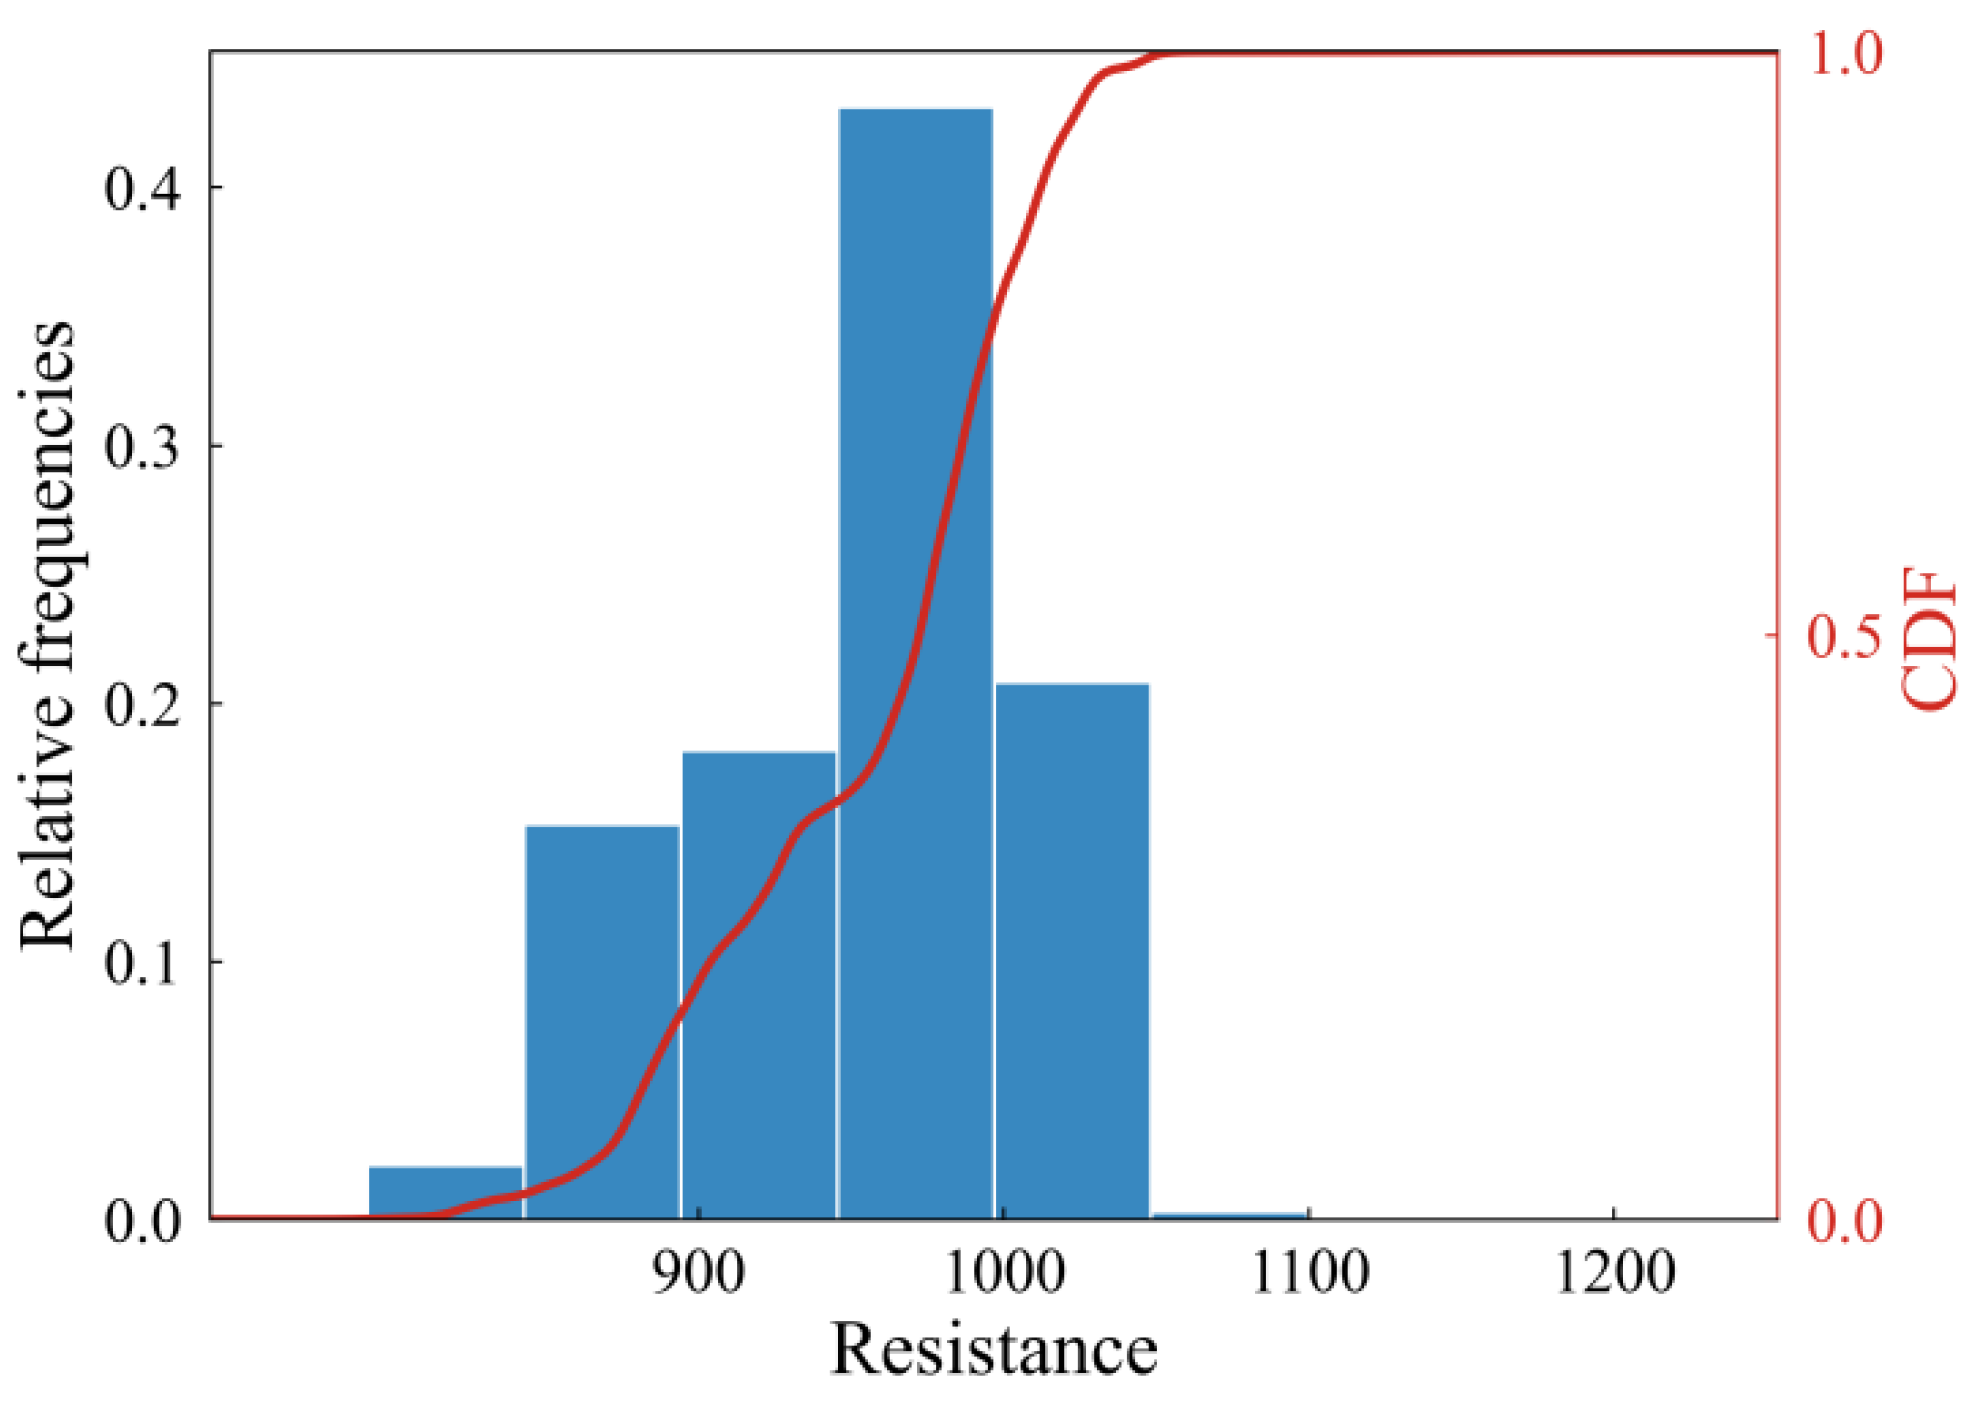
The efficient implementation of Monte Carlo simulation (MCS) is restricted by the sample size and the computational efficiency of the surrogate model [
59], but this can be solved by XGBoost. The average computation time for 1,000,000 samples and the reliability analysis of the slab-column joint is 30 s. This is done by a laptop with four-core CPU and 8 GB memory, which demonstrates the efficiency of ML-MCS. Based on the regression prediction of punching shear resistance, the distribution and CDF of structural resistance are shown in
Figure 11. The average and standard deviations of the distribution of structural resistance are 955.96 kN and 52.42 kN, respectively. MCS can estimate the failure probability of a structure effectively by calculating the probability of Z < 0 in Equation (9), and the related reliability analysis can also be realized.
Table 6 displays the result of reliability analysis, where
Pf is the failure probability of the structure;
β is the reliability index;
αR and
αS are the sensitivity coefficients of resistance and load;
r* and
s* are the coordinates of the design point. The reliability index
β indicates that the reliability and safety of the selected interior joint are good and meet the requirement of GB 50068-2018 [
55].
4.2. Sensitivity Analysis
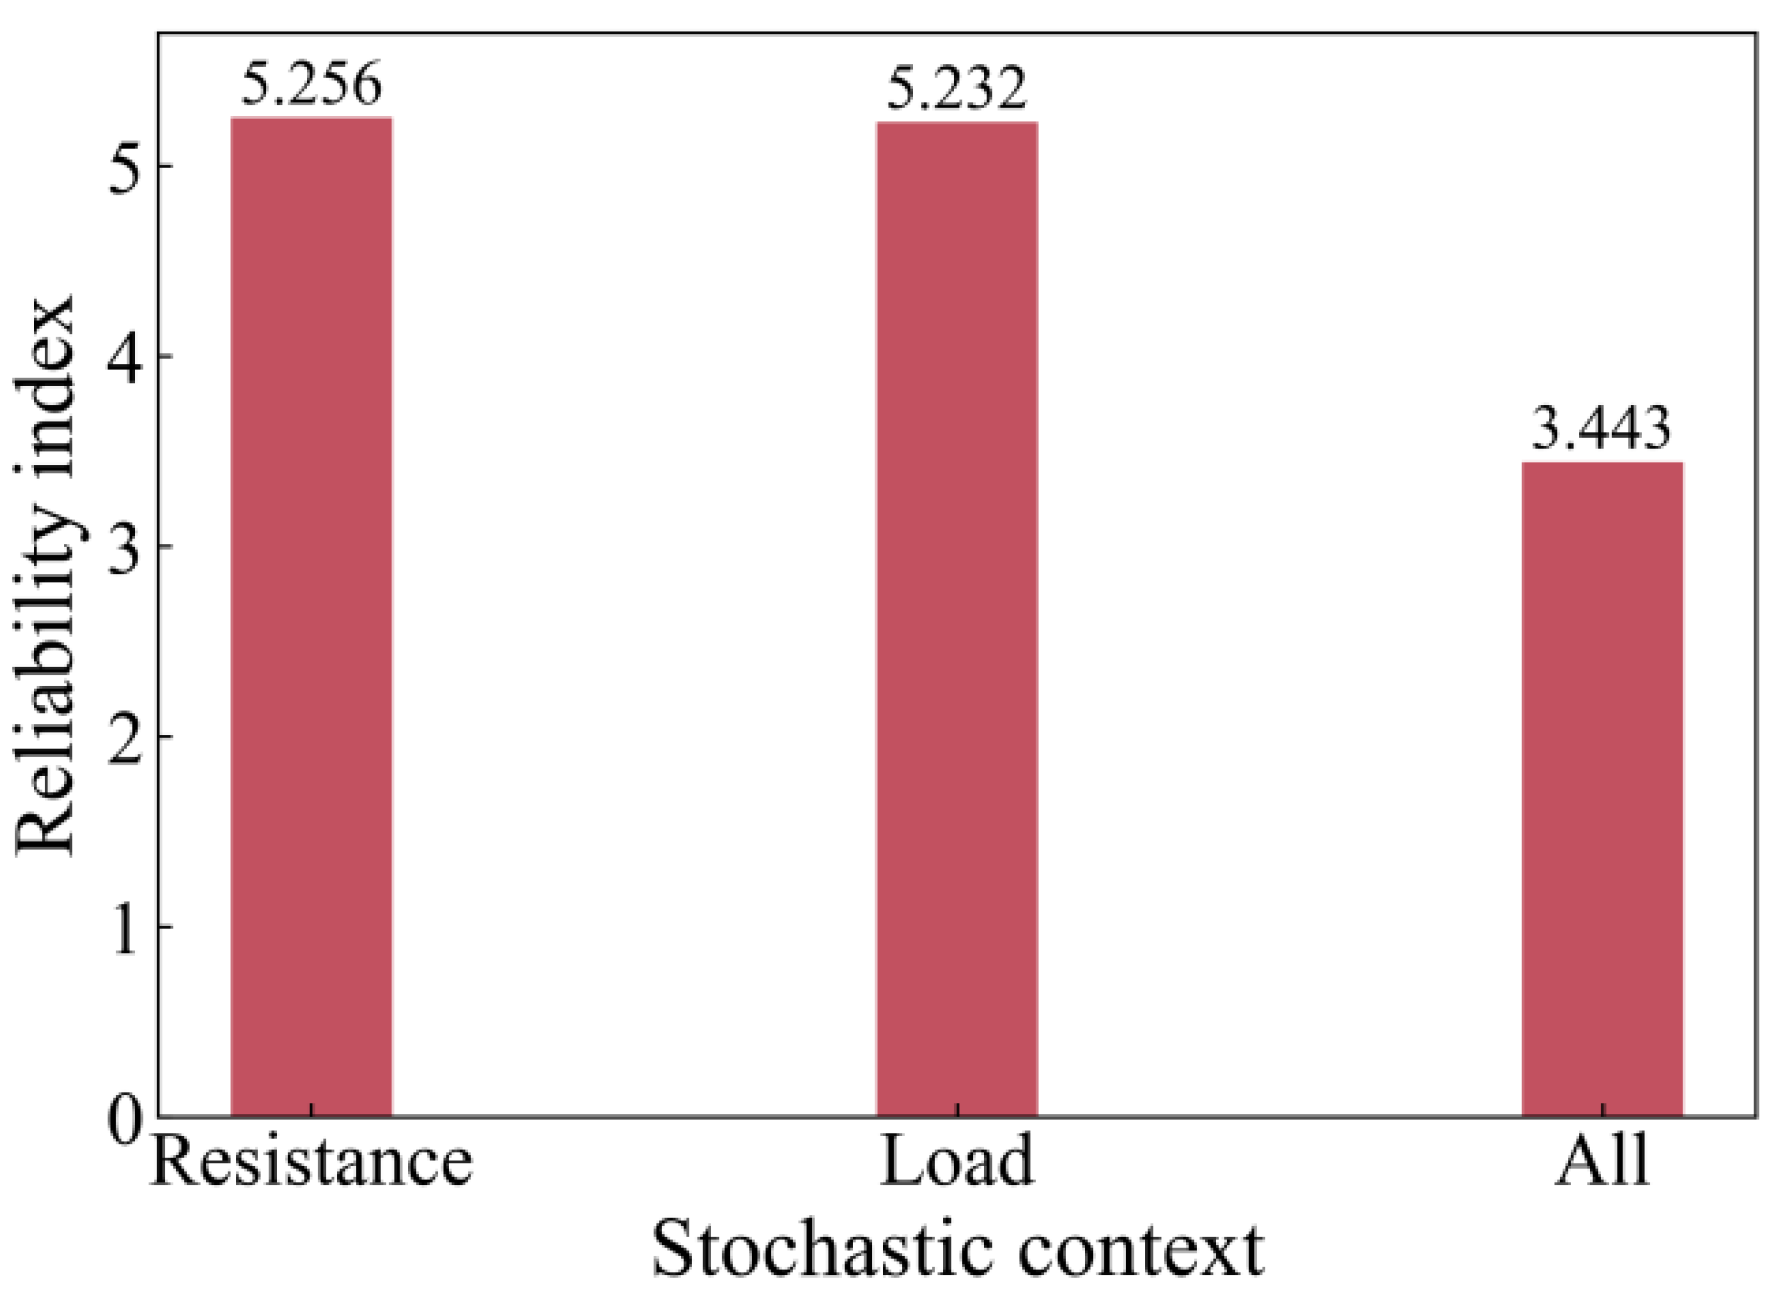
The relationship between structural reliability and stochastic variables can be examined through sensitivity analysis [
60]. The reliability index of the structure in the other two stochastic contexts (the stochastic structural resistance and stochastic loading condition) is shown in
Figure 12. The reduction of the randomness of structural resistance or loading conditions can improve the reliability index, and the safety and stability of the structure also can be enhanced.
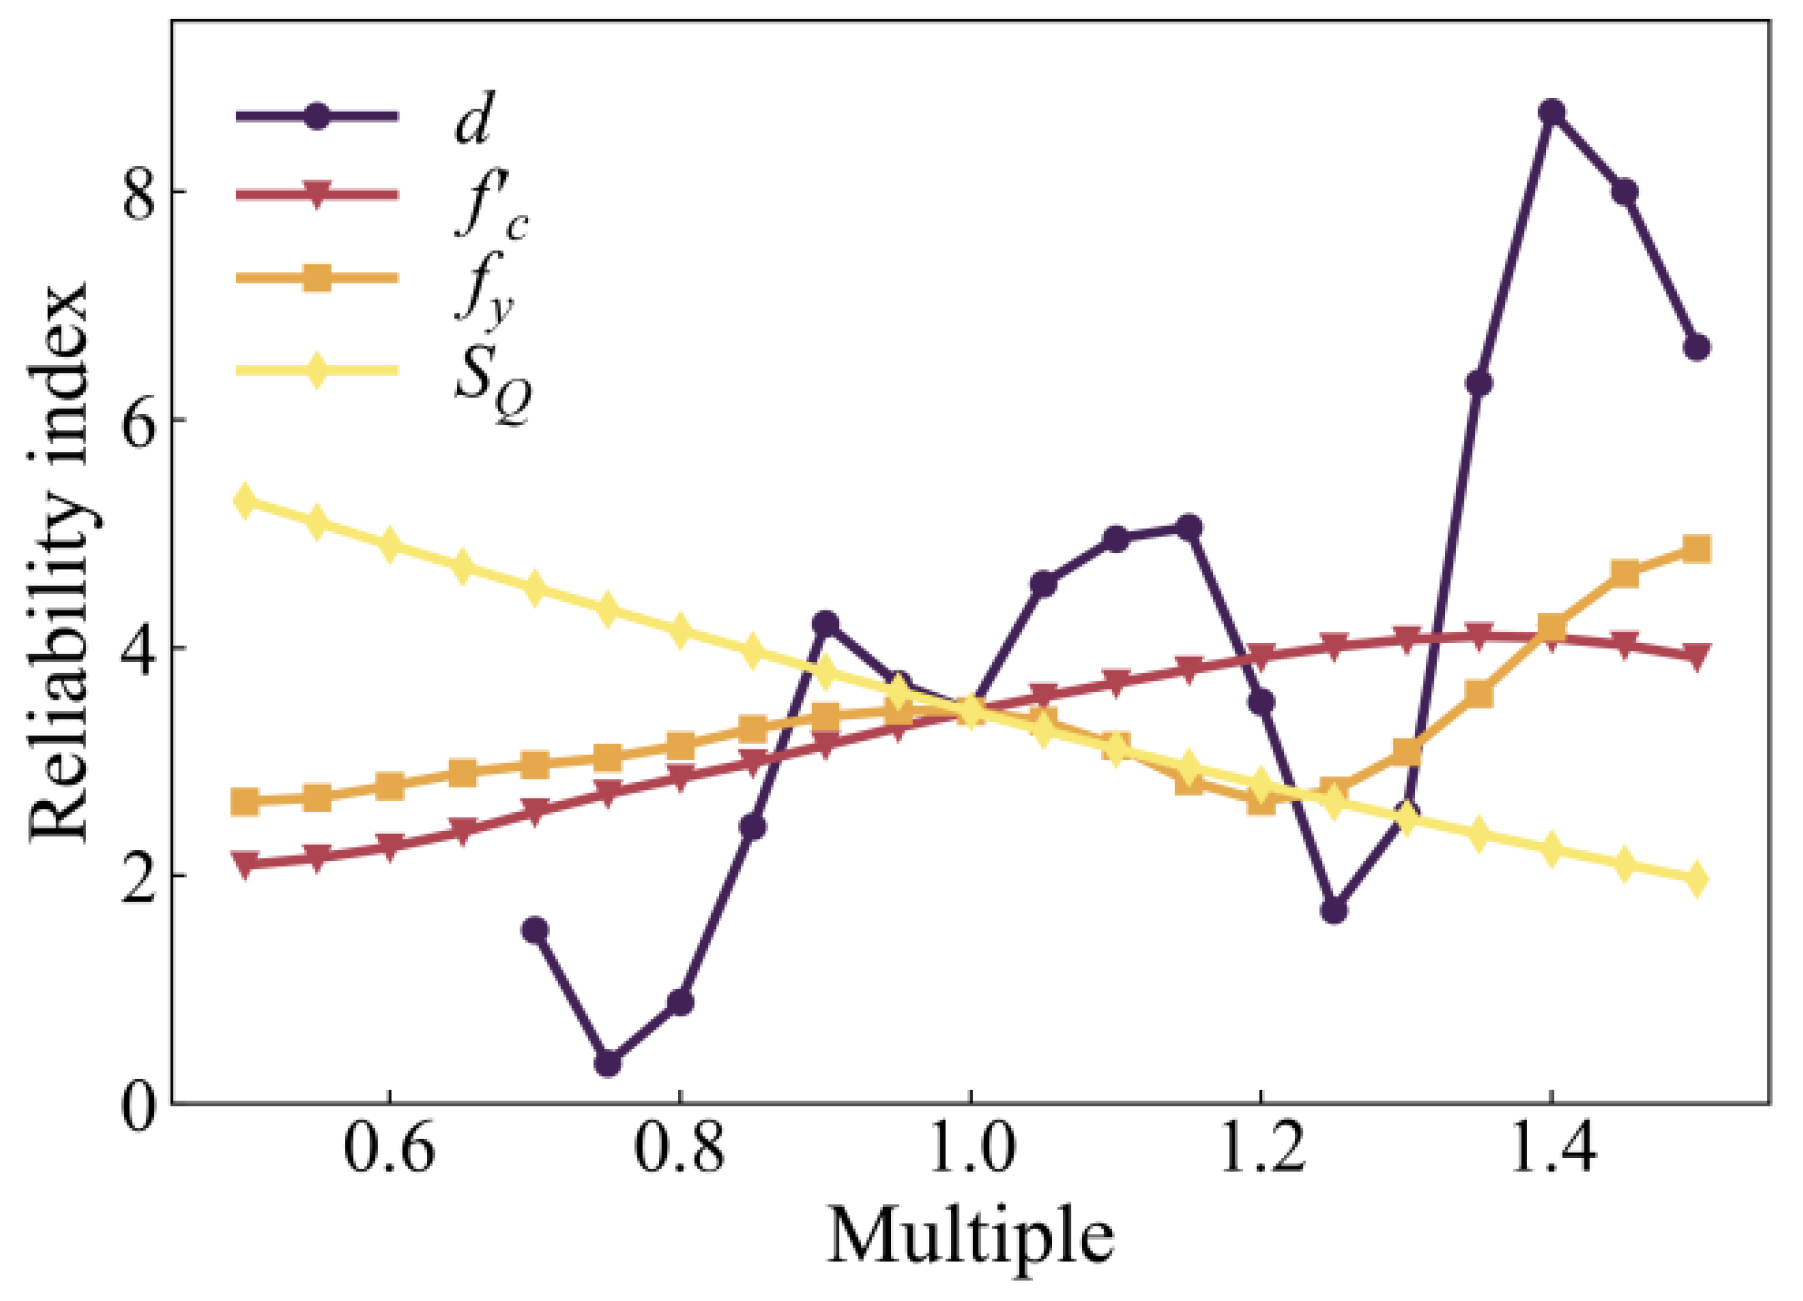
To study the impact of stochastic variables such as
d,
f’c,
fy, and
SQ, their multiples are changed and their relationship with the reliability index is shown in
Figure 13. The reliability index can be improved effectively with the increase of
f’c and
fy or the decrease of
SQ. However, there exists a complex relationship between slab depth
d and reliability index; the reliability index is reduced when the multiple of
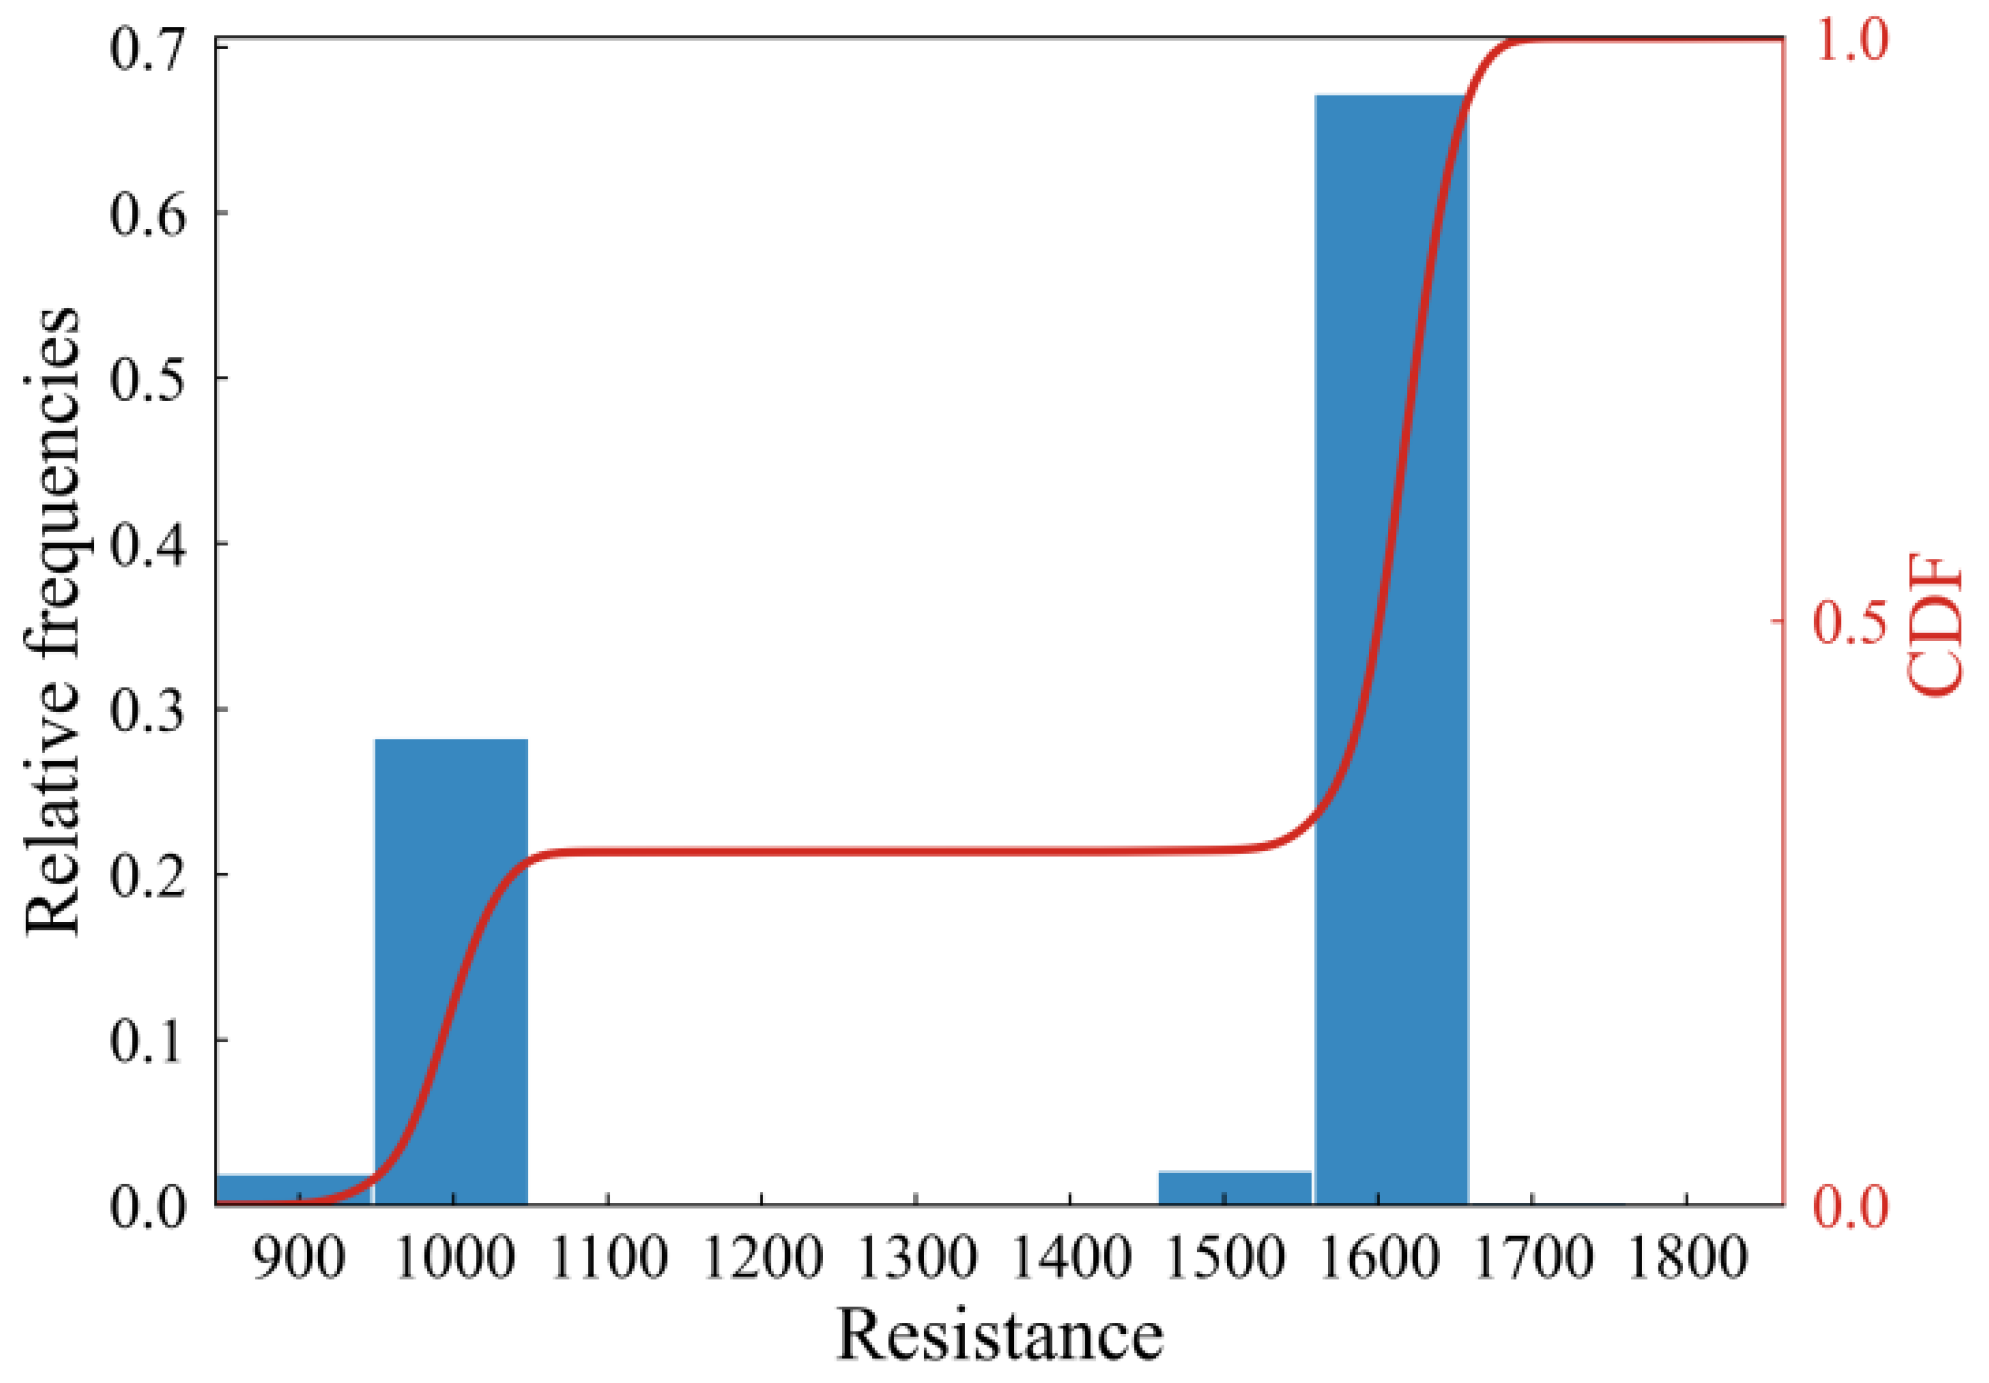
d is between 1.15 and 1.35. The distribution of structural resistance with 1.3
d is shown in
Figure 14, which can be used to understand the reason for the reduction of the reliability index. The discontinuous distribution of structural resistance is existed, and the transition of failure modes from flexure to punching shear may exist, both through experimental and theoretical observations [
22,
61,
62,
63]. Therefore, the standard deviation of structural resistance is large, and the reliability index calculated by that is small.
5. Conclusions
Structural reliability reflects the safety and stability of the entire practical structure subjected to permanent action and variable action [
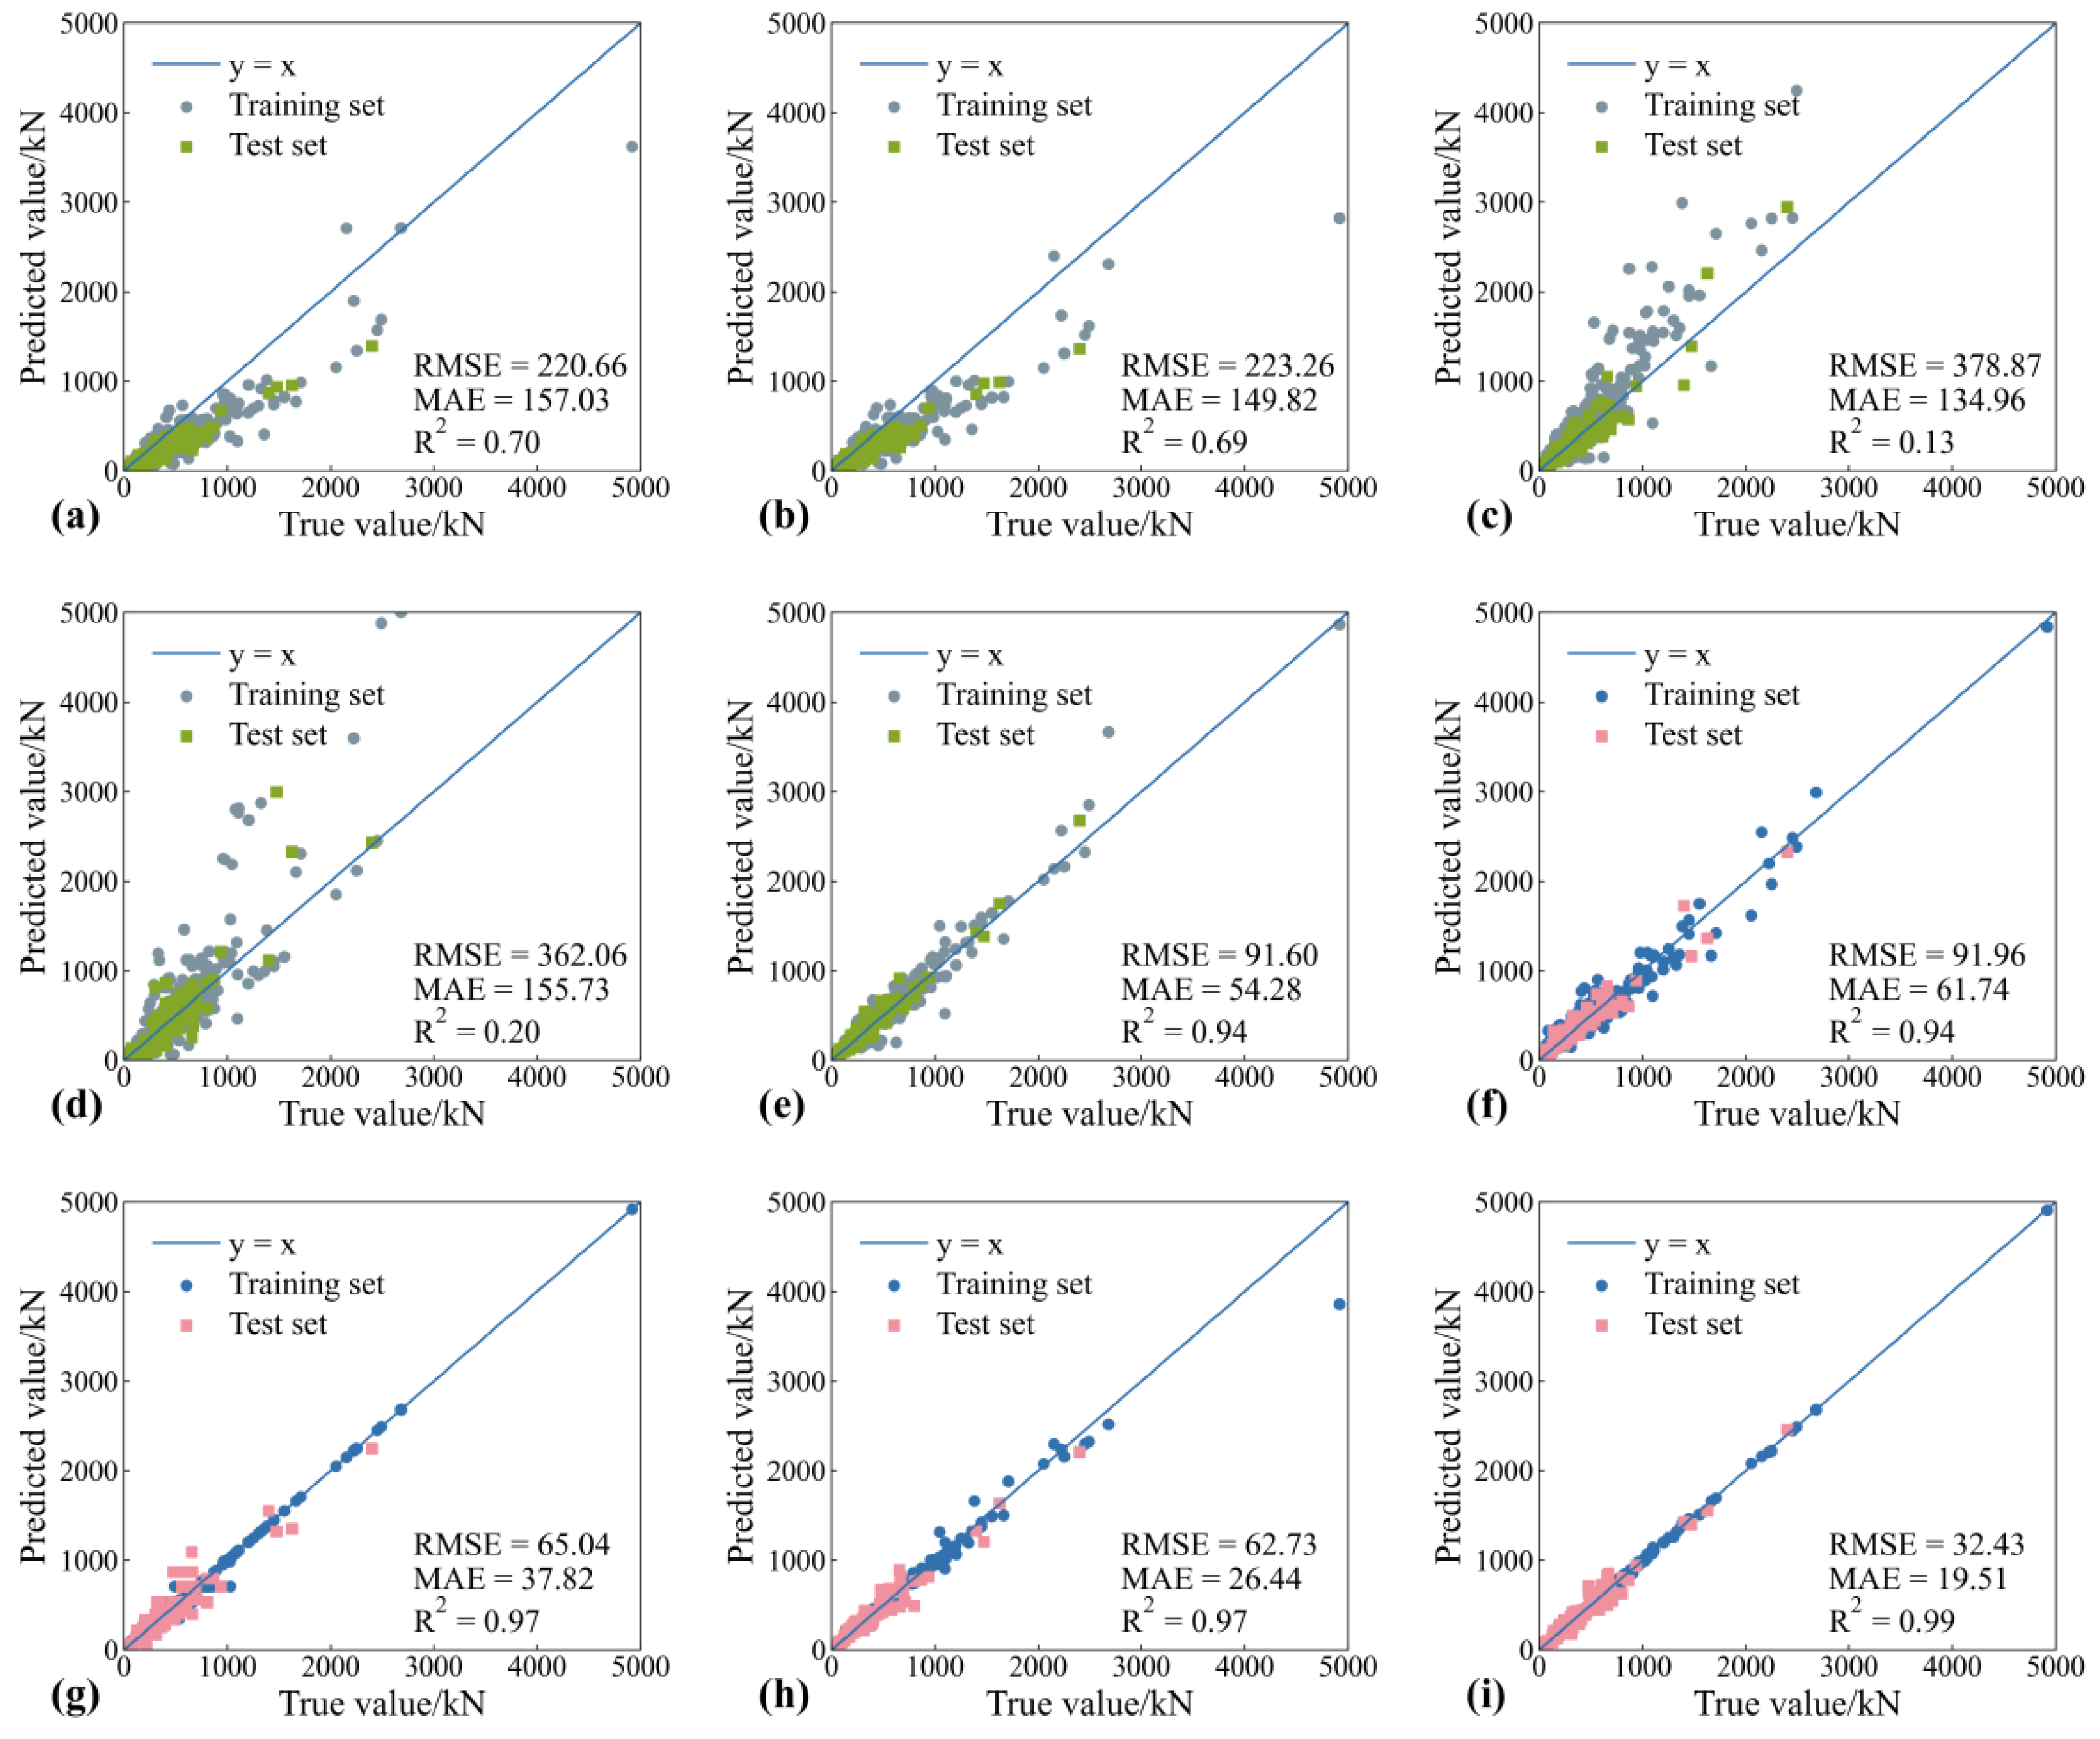
36], the calculation of which, through MCS, is restricted by the computational efficiency of the surrogate model. This work presents a framework for integrating the machine learning-based surrogate model into a Monte Carlo simulation to perform the reliability analysis with a satisfying accuracy and efficiency. An ML model is established and screened from four candidate ML models: as ANN, DT, RF, and XGBoost; the prediction performances of these are examined through three performance measures such as RMSE, MAE, and R
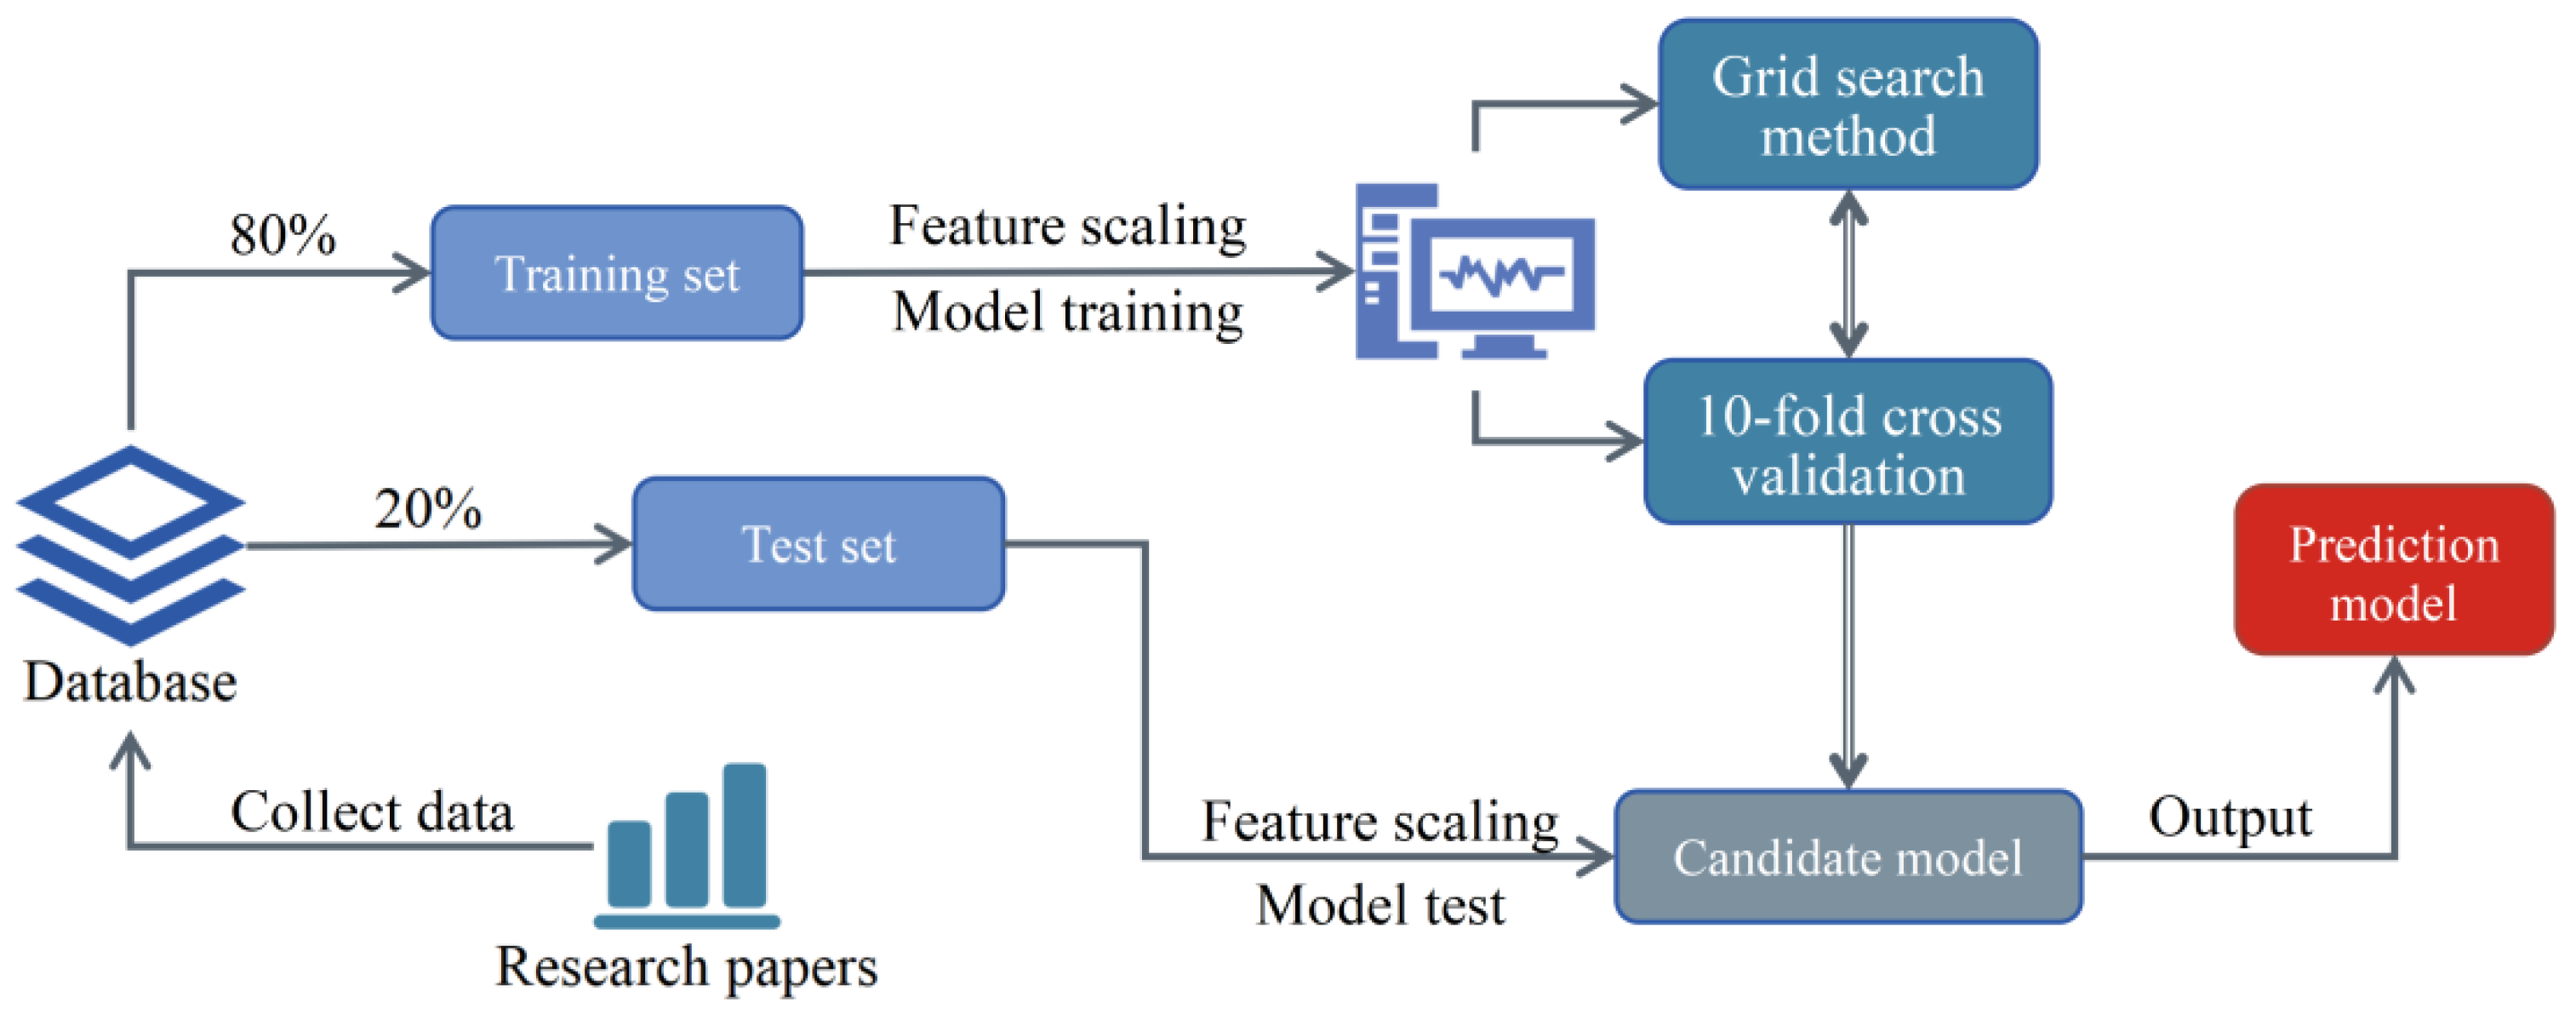
2. Furthermore, the advantages of ML models are embodied by comparison with five empirical models. The final prediction model is used as the surrogate model of MCS, and an RC slab-column joint in an actual structure is introduced as the object of reliability analysis. The following conclusions can be drawn from this paper:
The punching shear resistance of RC slab-column joints is influenced mainly by seven influential factors:
s,
A,
d,
f’c,
fy,
ρ, and
λ [
38]. The capture of the mapping relationship between them can guarantee the construction of the ML model. With the help of the grid search method and 10-fold cross validation, four ML models with optimal hyperparameters are established. After comparison, XGBoost has the best prediction performance reflected in RMSE, MAE, and R
2, and is selected as the final prediction model and used for reliability analysis.
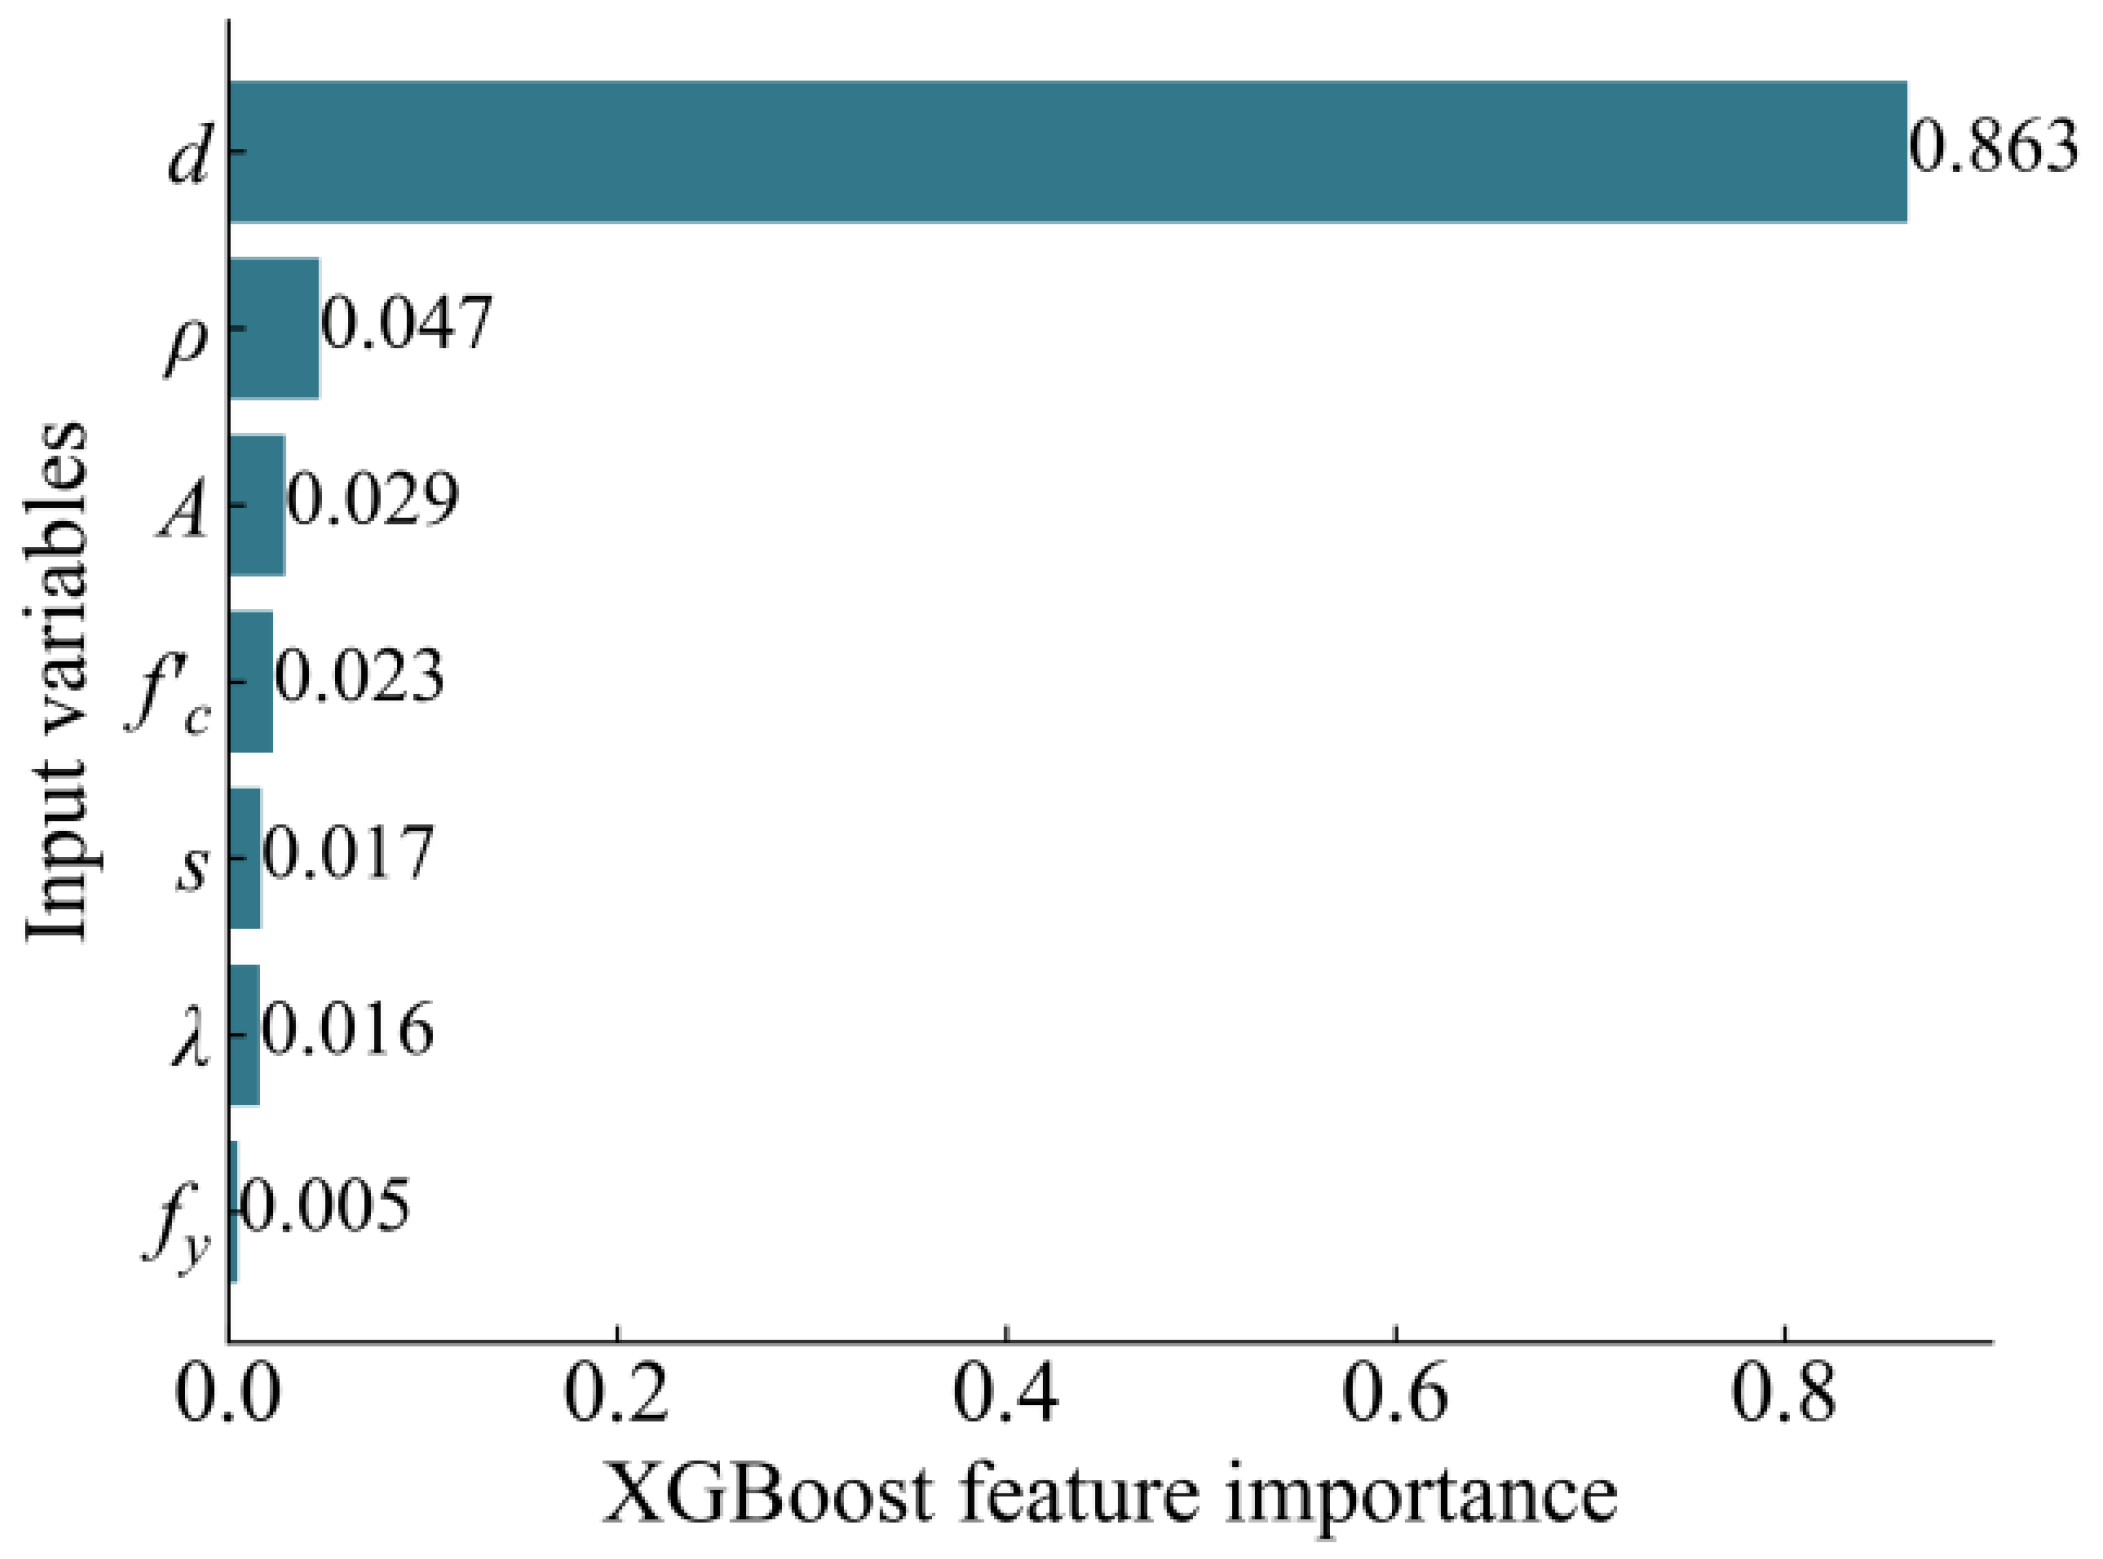
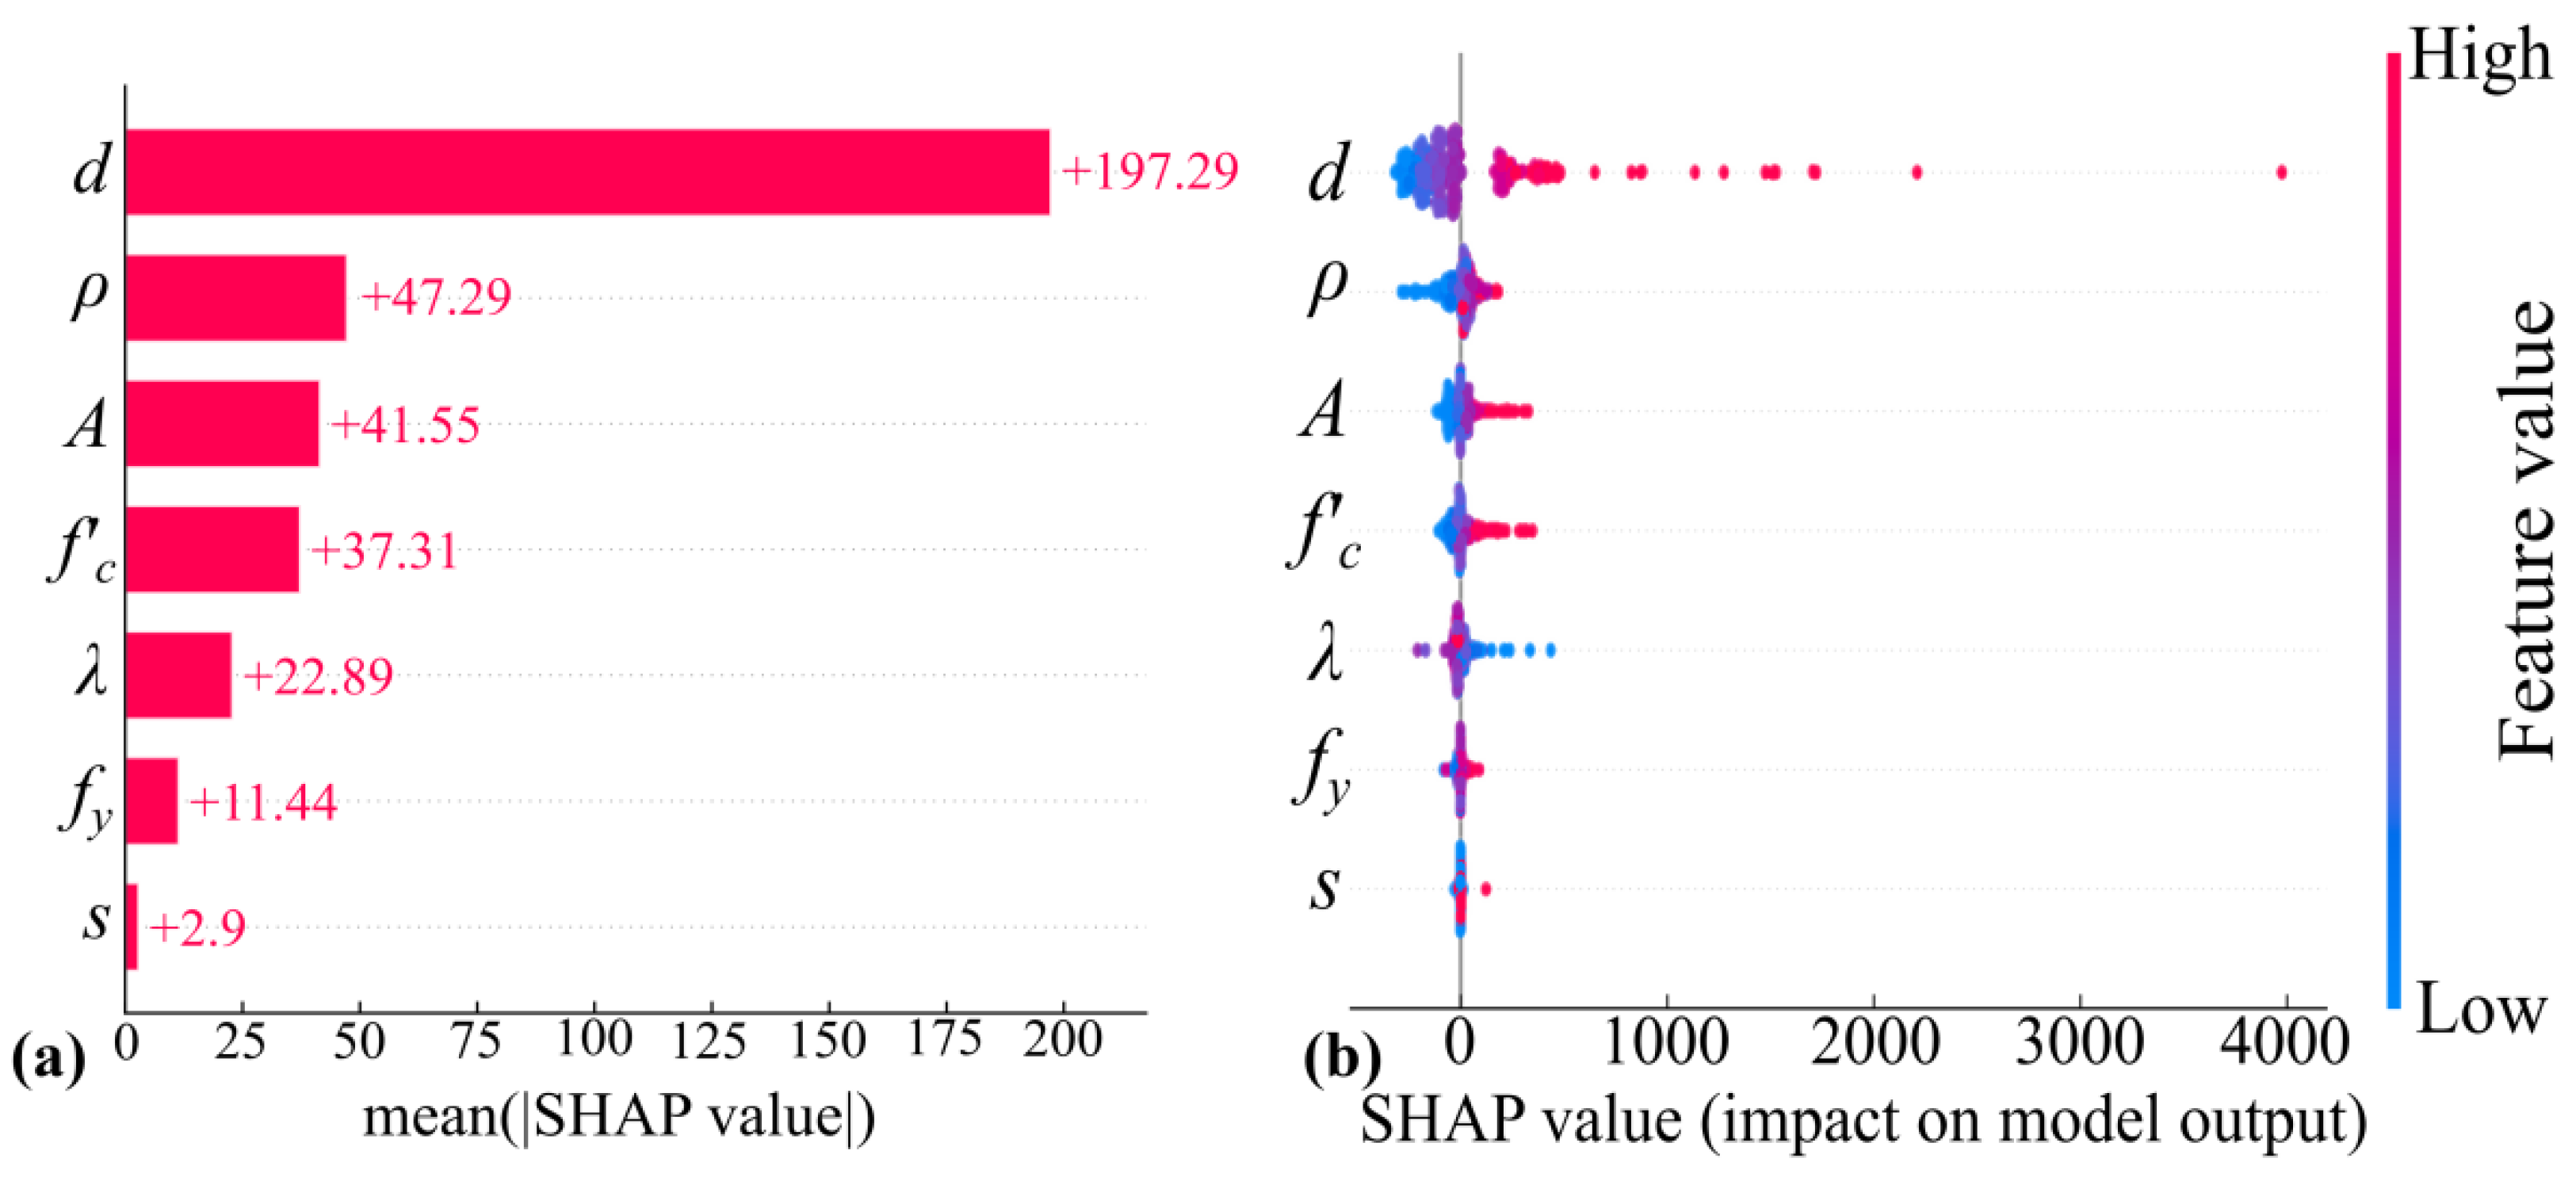
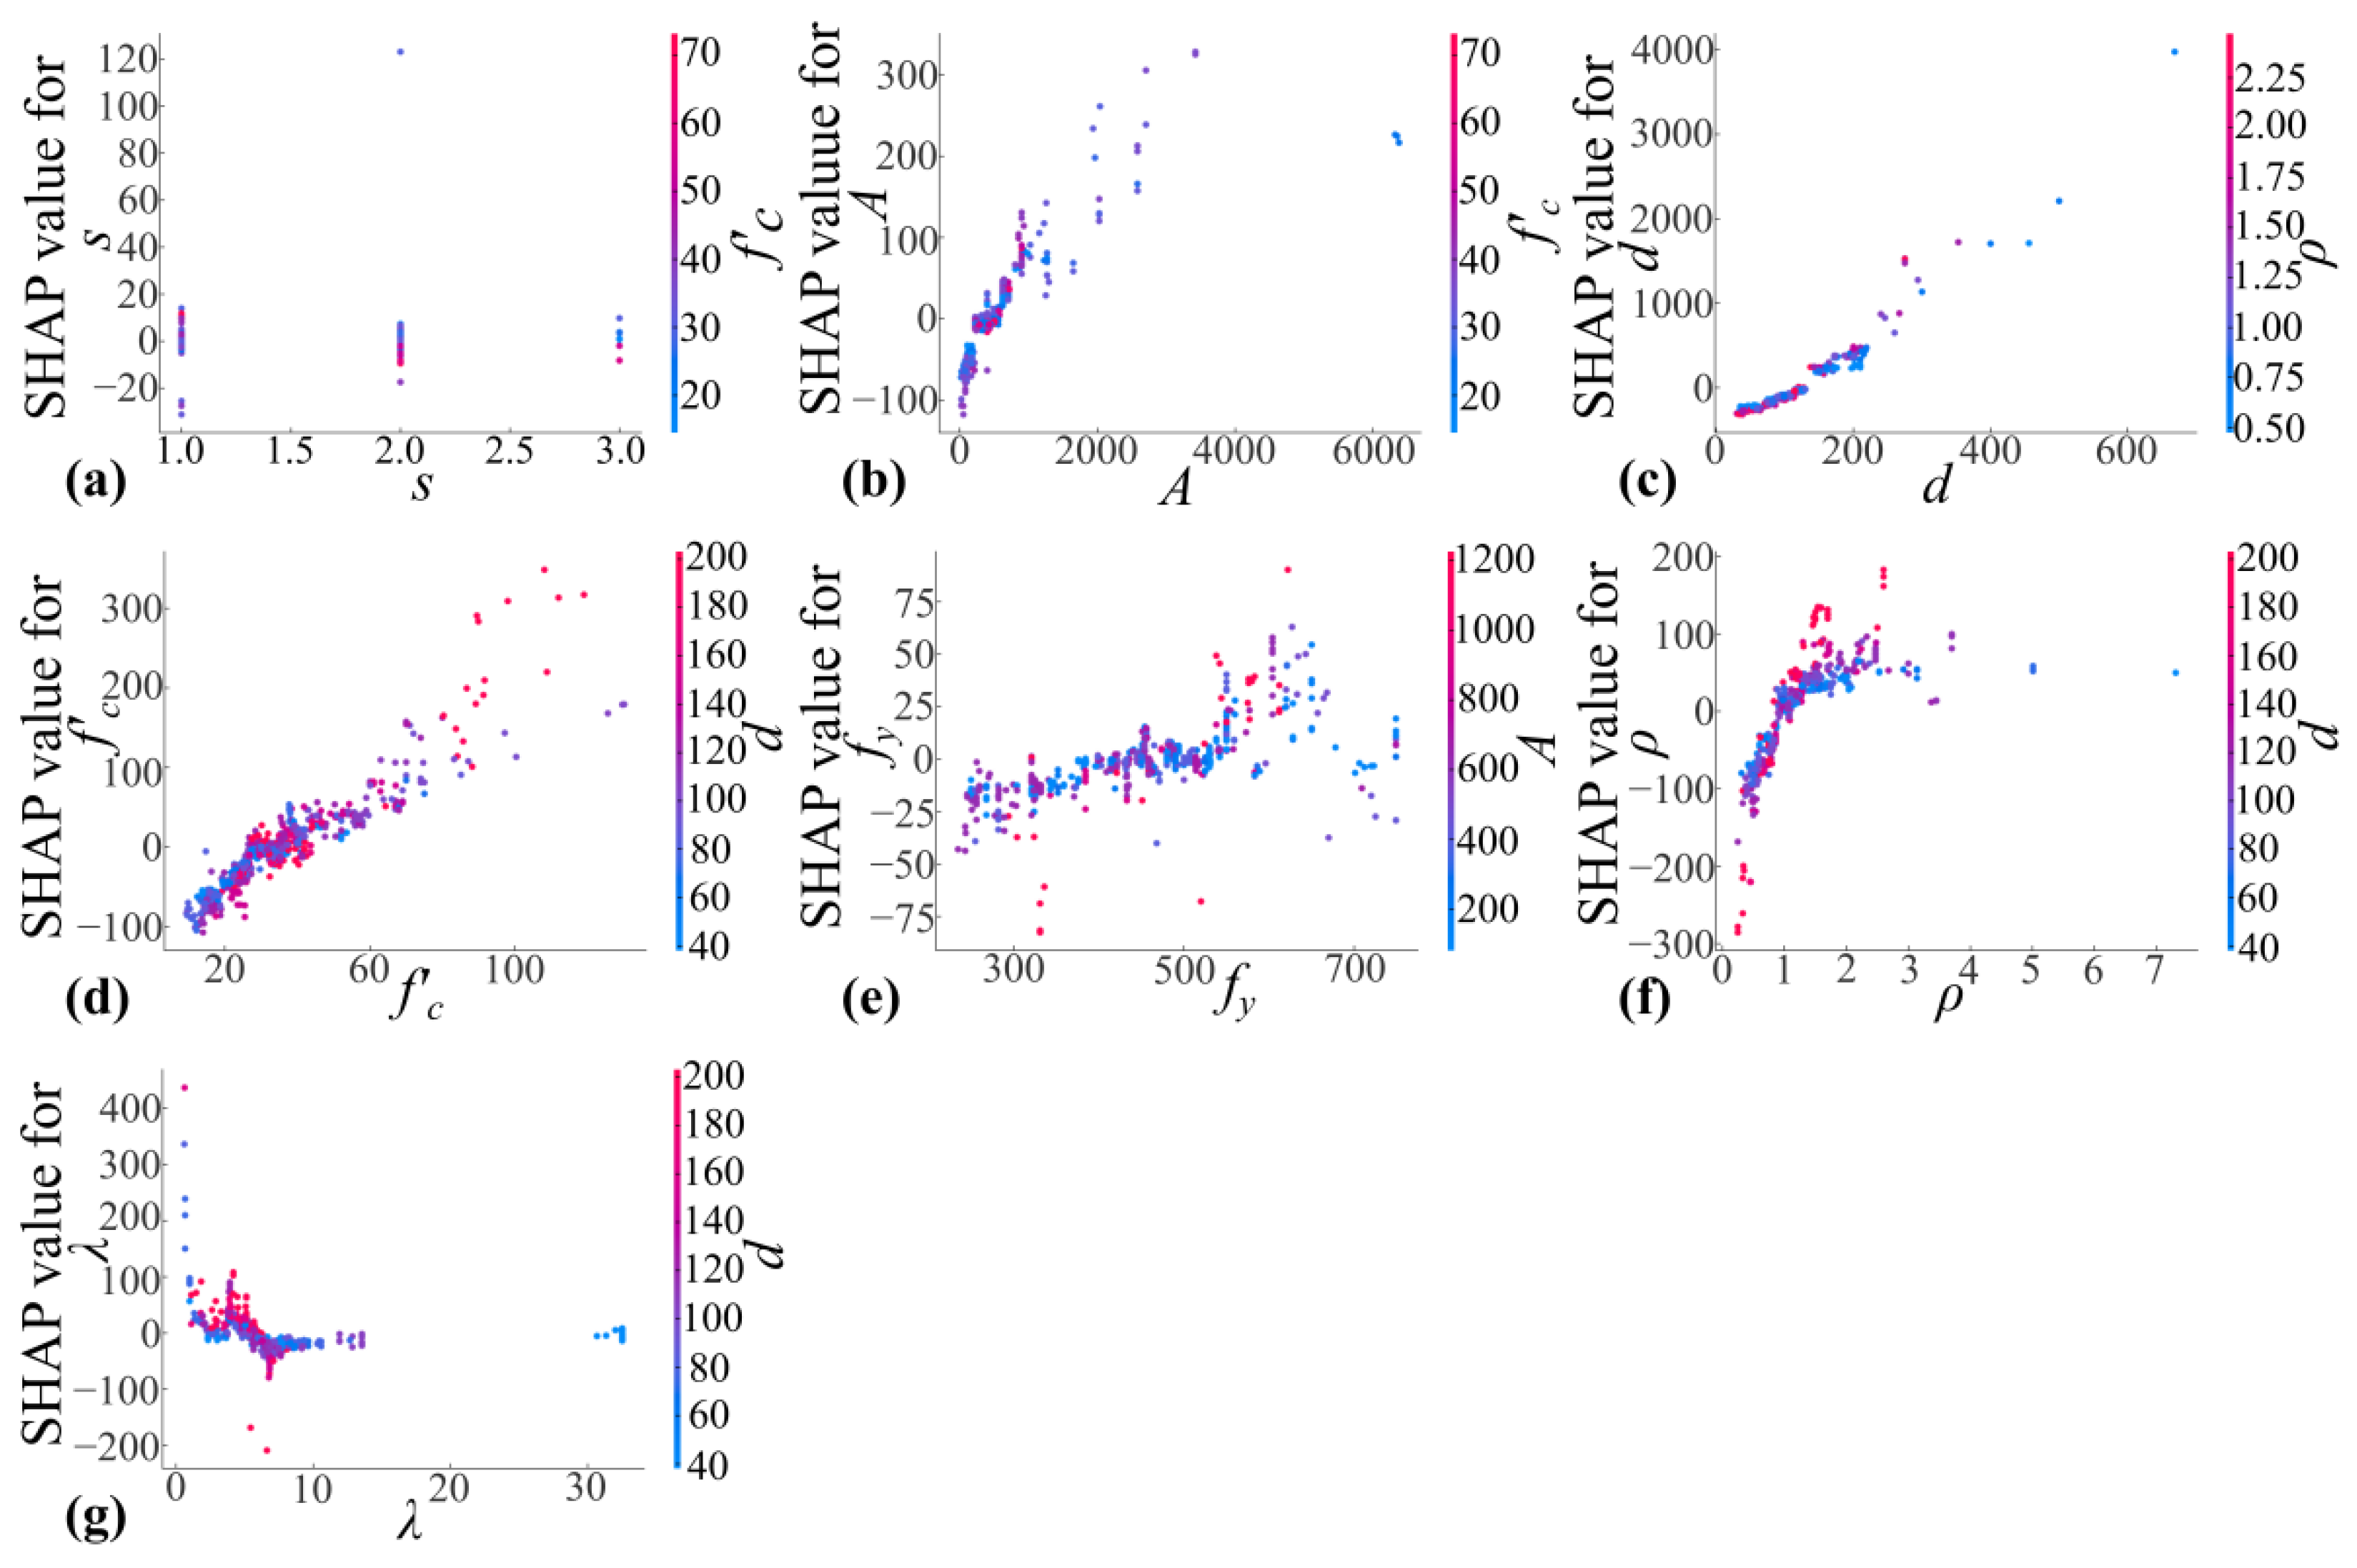
To facilitate the understanding of the prediction process of ML, SHAP is utilized to quantify the contribution of input variables to punching shear resistance, and to visualize the prediction process. According to the importance sorting of input variables, d and s have the greatest and least impacts, respectively, on punching shear resistance. Furthermore, feature dependency plots display the specific impact of each input variable by marginalizing the impacts of other variables. The analysis of the influential factors provides not only the understanding of prediction process, but also the suitable optimization sorting in structural design.
The actual structure adopted for the case study is an RC slab-column shear wall office building. The punching shear resistance of 1,000,000 samples produced by random sampling is calculated through XGBoost. The reliability analysis of the interior joint selected from the prototype building is conducted through MCS, and the final reliability index
β meets the requirement of the design provisions of GB 50068-2018 [
55]. Moreover, the sensitivity analysis reveals the impact of the stochastic context and the values of stochastic variables on structural reliability. Based on these, the computational efficiency of the reliability analysis of the slab-column joints can be enhanced on the premise of high computational accuracy. In future reliability analysis, some advanced sampling methods, such as Latin hypercube sampling and importance sampling, can be used to reduce the number of simulations appropriately. Furthermore, a program with some input windows of influential factors can be designed as a practical tool for reliability analysis.


