1. Introduction
High-rise residential estates are an important type of living space in Chinese cities. High-rise residential neighborhoods are characterized by high floor area ratios and many floors, which make the shading effect of high-rise residential estates more significant in this microclimate. As an important element of the microclimate, outdoor air temperature in residential estates has an important influence on both outdoor activities and the indoor environment. Beijing is located in cold areas with hot summers. The daytime maximum temperatures in summer could reach over 35 °C. High daytime temperatures in the summer can affect human thermal comfort and discourage outdoor activity. In addition to this, high outdoor temperatures can also cause overheating problems indoors. Hot outdoor air enters the room through the windows, resulting in higher energy usage for cooling to alleviate the indoor overheating problem. The purpose of this study was to provide guidelines for optimizing the outdoor air temperature of residential estates by focusing on the relationship between shading and summer daytime outdoor air temperature in high-rise residential estates in Beijing.
In recent years, more studies have focused on the relationship between air temperature and urban morphology at small scales. Urban form parameters in these studies include sky view factor (SVF), building cover ratio, the ratio of building height to cover, building wall area, impervious ground surface fraction, green area ratio, and ground albedo [
1,
2,
3,
4,
5,
6]. The relationship between air temperature and urban form parameters was quantified using field measurements and statistical methods. The effect of land use on local temperature was studied and models were established to describe their relationship [
7]. In another study, the microclimate data were collected at a university in Malaysia to explore the influence of urban morphology on the microclimate [
8]. A study concerning a similar topic was also conducted in Harbin [
9]. There are also studies on how to optimize the outdoor thermal environment of cities from the perspective of building layout alone. Various indices describing the building layout have been used in these studies. Some studies have determined the influence of the height-to-width ratio or building orientation on outdoor thermal environment [
10,
11,
12]. Some studies utilized SVF to describe the layout of urban buildings. In this study, the daytime air temperature difference in dense urban areas in summer was negatively correlated with the average SVF [
13]. In another study, the correlation between SVF and the physiological equivalent temperature was different in the summer and winter [
14]. Moreover, it was found that the building length and the porosity of the low-level space have an influence on the heat pressure at the pedestrian level [
15].
In addition to streets or public spaces, some studies evaluated the effects of landscape in residential areas on the microclimate or thermal comfort of the outdoor environment using simulations [
16,
17]. The cooling effect of green spaces in residential areas was studied in this research. The study took different green coverage rates and building layout into account [
18]. Moreover, the influence of the distribution of water features in residential areas on the summer microclimate was studied [
19]. In these studies, the relationship between outdoor thermal comfort and different types of design parameters in residential areas, such as roads, plants, shelters, and buildings, was analyzed [
20,
21]. The influence of design parameters in residential areas on the heat island intensity was also studied [
22]. In the study above, the morphological characteristics of settlements vary depending on the region and climate. Studies need to be carried out for specific geographical areas in order to obtain accurate results.
Shading is capable of blocking solar radiation and is an important factor affecting the outdoor thermal environment [
23]. Many studies have been conducted to investigate the role of shading in the thermal environment. The indicators chosen to evaluate the thermal environment include physiological equivalent temperature (PET) [
24], mean radiant temperature (MRT), and air temperature (Ta). Kántor et al. found that the air temperature at the urban square could decrease by 1 °C with tree shading [
25]. Another study discovered that in a humid hot climate, the air temperature difference between a highly tree-shaded community and an unshaded community was up to 3.5 °C [
26]. In addition to trees, the types of shading studied include sun umbrellas, photovoltaic shelters, and structures. Middel et al. found that the maximum air temperature in the shade was 2 °C lower than that without shading [
27]. Cheung et al. found that the average cooling effect of tree shading was 0.6 °C in a park in Hong Kong, while the average cooling effect of artificial shelters was 0.2 °C [
28]. This study found that the temperature difference between streets with and without overhead shading was within 1 °C [
29]. Artificial shade facilities in hot and humid environments may lower air temperature by 0.8 °C at most and the quantity of solar radiation received by 90% [
30]. Several studies quantified the relationship between shading strategies and shading effectiveness. This study explored the best sun-sail shading coverage in a school courtyard when concerning the thermal environment. It was found that 60% of the courtyard sun-sail shading coverage was appropriate [
31]. In another study, the shading effect of four shading strategies in Guangzhou traditional shophouse neighborhoods was analyzed. The height-to-width ratio of canyons and arcades, the area covered by trees, and orientation were all factors in the shading approach [
32]. A tree placement strategy was devised to provide for as much sidewalk shade as feasible, resulting in improved thermal comfort [
33].
Previous studies on shading are mainly on streets or urban public spaces (
Table 1), but less on shading in high-rise residential estates. The spatial form of high-rise residential estates is different from that of streets or urban public spaces. The average number of floors in high-rise residential estates is generally above ten, and the green space ratios of different high-rise residential estates are similar. Apart from this, most of the studies on the cooling effect of shading are qualitative in nature, and very little quantitative analysis of the relationship between shading and air temperature has been conducted. This study investigates the relationship between outdoor air temperature and different types of shading from a quantitative perspective in high-rise residential estates in Beijing. Multiple indicators are used to quantify the characteristics of different types of shading, and a prediction model has been developed. The model can provide specific guidance for the planning of high-rise residential estates from the perspective of shading.
Beijing is located in cold areas with hot summers, where the landscape of residential estates is mainly lawn, trees, and shrubs, with little water. Therefore, shading in residential estates is mainly divided into three types (
Figure 1): building shading, tree shading, and building–tree integrated shading.
Figure 1a indicates that direct solar radiation is not blocked by buildings or trees.
Figure 1b indicates that direct solar radiation is shaded by both buildings and trees.
Figure 1c indicates that direct solar radiation is only shaded by buildings.
Figure 1d indicates that direct solar radiation is only shaded by trees.
3. Results
3.1. Differences of Outdoor Air Temperatures in Residential Estates
In order to accurately analyze the relationship between outdoor air temperatures and the SVFs in four different angle ranges, the summer daytime was divided into three time intervals (7:00–11:00, 11:00–15:00, and 15:00–18:00).
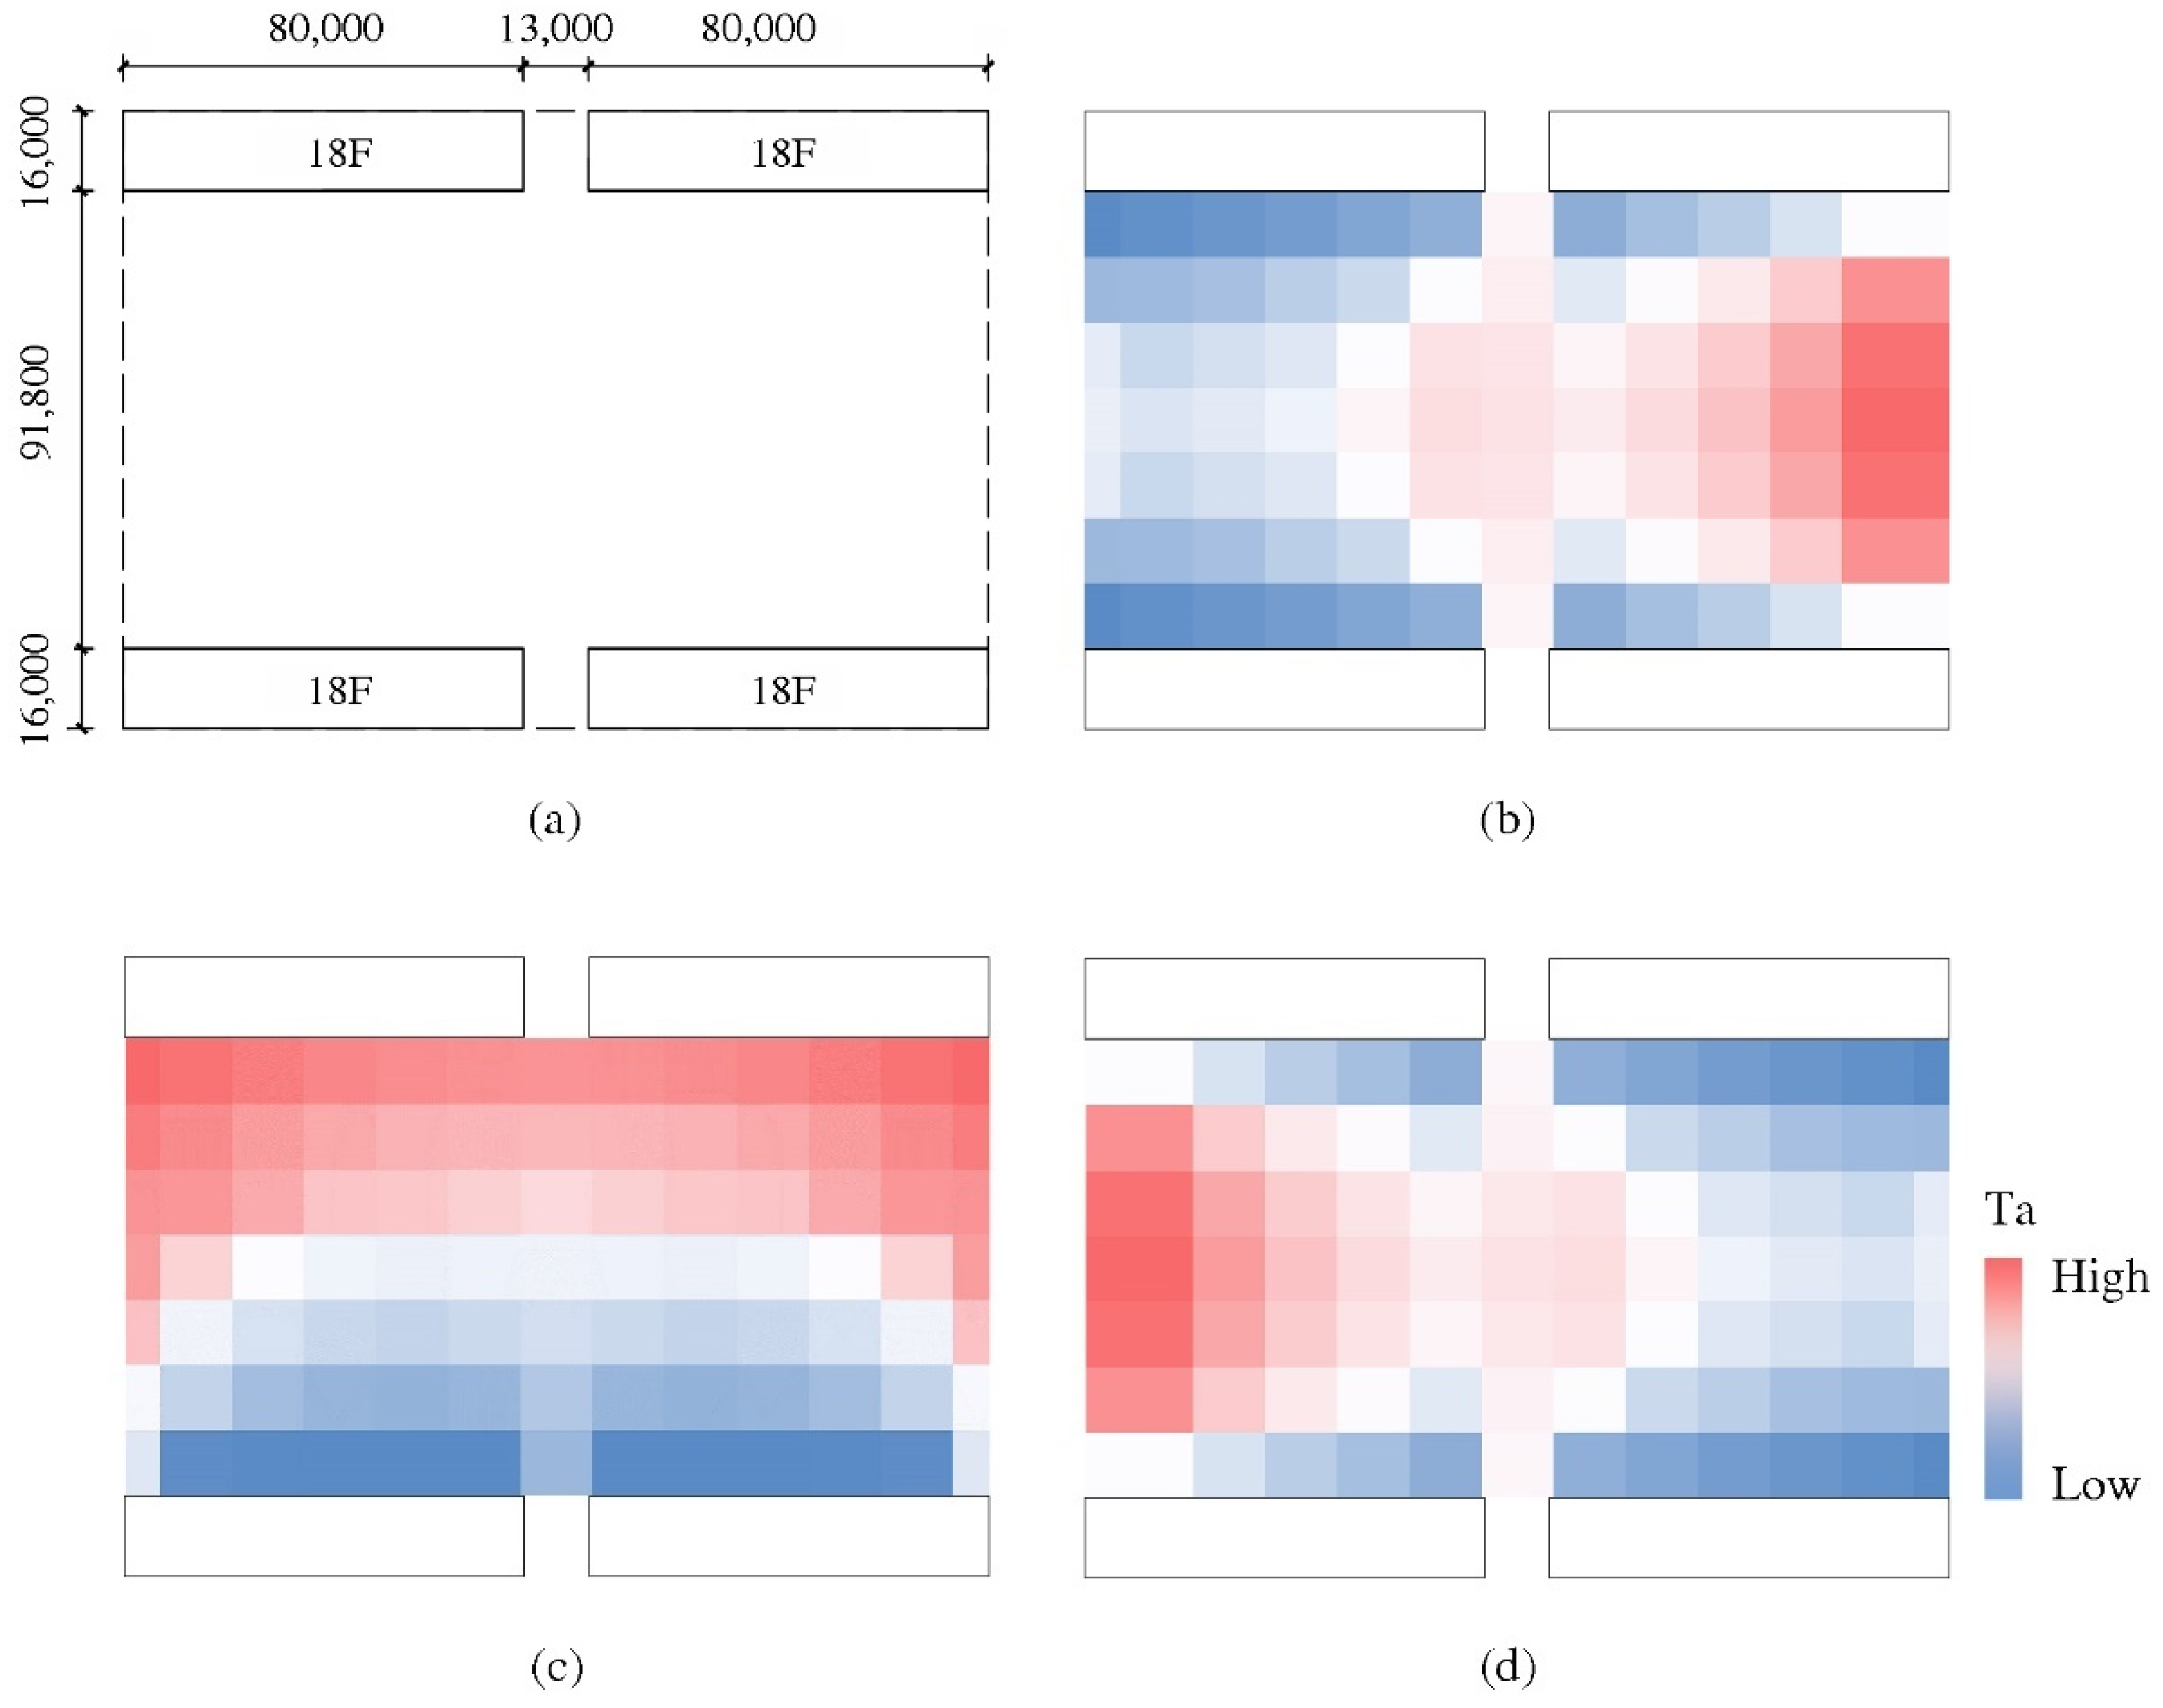
Figure 9 presents the air temperatures at different observation points in the two residential estates during the three time intervals. The maximum air temperature differences in the three time intervals were about 2.5 °C, 2.6 °C, and 2.3 °C in Shuangqing Estate and about 2.9 °C, 2.8 °C, and 3.3 °C in Xueqing Estate, respectively. The maximum air temperature differences between the two residential estates during the daytime in summer were similar, and the maximum air temperature differences were both 2.3 °C or more. The comparison of two residential estates proves that there are significant differences in the outdoor air temperatures of high-rise residential estates.
Figure 10 presents the air temperatures at the observation points of the two residential estates with or without shading. It can be seen from the figure that most of the observation points have a lower average air temperature with shading than without shading. The finding appears in both residential estates. The average temperatures of the shaded observation points were about 1.2 °C, 1.3 °C and 0.5 °C lower than those of the unshaded observation points in Shuangqing Estate and about 1.6 °C, 1.5 °C and 1.5 °C in Xueqing Estate during the three time intervals, which proves that the cooling effect of shading on air temperature is quite significant.
3.2. Comparing the Cooling Effect of Three Types of Shading
Different observation points in the residential estates are compared to analyze the cooling effect of four types of cases: building shading, tree shading, building–tree integrated shading, and no shading on the air temperature.
3.2.1. Comparison of the Observation Points in Xueqing Estate
Figure 11 shows the fisheye photos of six observation points in Xueqing Estate. The yellow line in the photo is the trajectory of the sun at 7:00–18:00.
Table 5 presents the average Ta, SVF, SVF
A, and SVF
G of the six observation points in Xueqing Estate during the three time intervals on 22 June.
From 7:00–11:00, X1, X2, and X7 were shaded by both buildings and trees. X3 was shaded by trees. X4 was shaded by buildings, and X5 was unshaded. The average Ta of each observation point varied under the effect of different shadings. Among the observation points, X1, X2, and X7 have the lowest average Ta (28.4 °C, 27.9 °C, and 27.3 °C, respectively). Second place went to X3 and X4 (29.1 °C and 29 °C, respectively). X5 (30.2 °C) had the highest average air temperature. The average air temperature of the observation points shaded by the building–tree integrated shading was 27.9 °C. The air temperature of the observation points shaded by trees (X3) and buildings (X4) was slightly higher, and the air temperature of the observation point without shading (X5) was the highest. The cooling effect of the building-tree integrated shading is approximately 2.3 °C when compared to no shade, and the cooling effect of building shading and tree shading is approximately 1.2 °C and 1.1 °C, respectively.
From 11:00 to 15:00, X1 and X7 were shaded by both buildings and trees. X2 and X4 was shaded by trees. X3 and X5 were all unshaded. Among the six observation points, the average Ta of X1 and X7 (31.7 °C, 31.3 °C) was the lowest, followed by X2 and X4 (32.9 °C, 33.7 °C), and finally X3 and X5 (33.7 °C, 34.1 °C). The average temperature of the observation points affected by building–tree integrated shading was 31.5 °C and the average temperature of the measurement points not affected by shading was 33.9 °C. Compared to no shade, the cooling effect of building–tree integrated shading is about 2.4 °C and the cooling effect of tree shading is about 0.6 °C.
At 15:00–18:00, X7 was shaded by both buildings and trees, and had the lowest average air temperature (31.8 °C). Trees shaded X1, X2, X3 and X4, and their average Ta (32.6 °C, 33.7 °C, 33.6 °C, and 34.3 °C) were all second to X7. Without any shading, X5 had the highest average Ta (35.1 °C) of the six observation points. The average air temperature of the observation points shaded by trees was 33.6 °C. Compared to no shade, the cooling effect of building–tree integrated shading is about 3.3 °C and the cooling effect of tree shading is about 1.5 °C.
The results of the analysis of the three time intervals in Xueqing Estate show that the cooling effect of the building–tree integrated shading is the most significant, and the cooling magnitude is about 2.3 °C, 2.4 °C and 3.3 °C respectively. The cooling effect of building shading or tree shading is the second most effective, and the cooling magnitude is about 0.6–1.5 °C. The cooling magnitude is the difference in average temperature between observation points impacted by the same shade type and observation points not affected by shading.
3.2.2. Comparison of Observation Points in Shuangqing Estate
Table 6 presents the average air temperatures and shading characteristics of eight observation points in Shuangqing Estate during the three time intervals of the day from 17 to 18 June.
Figure 12 shows the fisheye photos of the eight observation points.
From 7:00 to 11:00, S6 and S8 were shaded by the building-tree integrated shading. S2 and S7 were shaded by buildings. S1, S3, S4, and S5 were unshaded. The average temperature of the observation points affected by the building-tree integrated shading is 26.5 °C, the average temperature of the observation points affected by the building shading is 27.3 °C, and the average temperature of the observation points without shading is 28.1 °C. Therefore, compared with no shading, the cooling effect of the building–tree integrated shading is about 1.6 °C, and the cooling effect of building shading is about 0.8 °C.
From 11:00 to 15:00, S6 was shaded by both buildings and trees. S1, S4, S7, and S8 were shaded by buildings, and S2, S3, and S5 were not shaded. The average temperature of the observation points affected by the building shading is 31.5 °C and the average temperature of the observation points without shading is 32.5 °C. Therefore, compared with no shading, the cooling effect of building–tree integrated shading is about 2.3 °C and the cooling effect of building shading is about 1 °C.
From 15:00 to 18:00, S4, S6 and S8 were shaded by both buildings and trees. S1 was shaded by trees. S2, S3, S5, and S7 were unshaded. The average temperature of the observation points subjected to the building–tree integrated shading was about 32.5 °C, and the average temperature of the observation points without shading was about 33.1 °C. Compared with no shading, the cooling effect of the building–tree integrated shading is about 0.6 °C, and the cooling effect of the tree shading is about 0.4 °C.
The results of the three time intervals of Shuangqing Estate show that the cooling effect of the building–tree integrated shading is the most significant, with the cooling effect of the three time intervals being about 1.6 °C, 2.3 °C and 0.6 °C respectively. The cooling effect of building shading and tree shading is the second most significant, with a decrease of about 0.8 °C, 1 °C, and 0.4 °C in air temperatures, respectively.
3.2.3. Summary of the Comparison of Observation Points
The cooling effect of building-tree integrated shading is the most significant, followed by building shading and tree shading. By comparing the two residential estates, it was found that the average daytime cooling effect of the building–tree integrated shading could reach 1.5 °C and the cooling effect of both building shading and tree shading could reach 0.4 °C. The shading characteristics of different locations in the residential estate are different, so the types of shading that play a dominant role on air temperature in different time intervals are also different, which is verified by the following comparisons.
Figure 13a and
Figure 14a show the air temperature changes of four observation points in Shuangqing Estate from 20 to 23 August. S4 (
Figure 13b) was shaded by trees between 7:00 and 14:00, while S7 (
Figure 13c) was not shaded. As a result, the Ta of S4 was lower than that of S7 at 7:00–14:00. At 15:00–18:00, both were shaded by buildings or trees, and their air temperatures tended to be the same. S5 (
Figure 14c) was shaded by trees between 7:00 and 15:00, while S3 (
Figure 14b) was not shaded. The air temperature of S5 was lower than S3 at 7:00–15:00. At 15:00–18:00, the shading on S5 by trees was weakened, while S3 was shaded by buildings at this time. Thus, the air temperature of S5 was a little higher than that of S3.
3.3. Correlation of Average Ta with SVF, SVFA, SVFG
Figure 15 presents the average Ta, SVF, SVF
A, and SVF
G of the observation points in the two residential estates. The temperature of Shuangqing Estate was from 17–18 June, and the temperature of Xueqing Estate was from 22 June. The average air temperatures in the three time intervals showed a positive correlation with SVF
(0–180), SVF
(90–270), and SVF
(180–360), respectively. At 7:00–11:00, the fitted R
2 of SVF
(0–180) and average Ta in the two residential estates were 0.62 and 0.90, respectively. At 11:00–15:00, the fitted R
2 of SVF
(90–270) and average Ta were 0.78 and 0.75, respectively, while they were 0.13 and 0.52 at 15:00–18:00. The fitted R
2 of average Ta and SVF was higher than 0.5 for most of the time, indicating that there is a significant correlation between outdoor air temperature and SVF.
There are differences in landscape configuration and building layout between residential estates, which means that the types of shading that play a dominant role may be different. For example, at 11:00–15:00 in Xueqing Estate or 11:00–15:00 and 15:00–18:00 in Shuangqing Estate, the fitted R2 of SVFA and Ta was higher than that of SVF or SVFG, indicating that building shading played a dominant role in the average Ta during this time interval. For the other time intervals, the fitted R2 of SVF and Ta was higher than that of SVFA or SVFG, indicating that the average Ta during this time interval was affected by both tree shading and building shading.
3.4. Quantify the Effect of Shading on Ta in Residential Estates
Data from 17–20 June and 21–24 August at Shuangqing Estate were used in a linear regression analysis to quantify the effect of different types of shading on air temperature. From 7:00–11:00, 914 valid observations were available; 895 valid observations were available from 11:00–15:00, and 747 valid observations from 15:00–18:00.
The Ta of the observation point is the dependent variable. Independent variables included T
ref, Solar, SVF, SVF
A, and SVF
G. Firstly, the regression analysis was performed with T
ref and Solar as independent variables to determine the influence of the boundary meteorological conditions of the residential estate on Ta. Then, SVF, SVF
A, and SVF
G were added to the model, respectively.
Table 7 presents the results of different models.
At 7:00–11:00, among the four types of SVFs (SVF(0–180), SVF(0–180)A, SVF(0–180)G, and SVF(0–360)), the model adjusted R2 of SVF(0–180) was the highest. At 11:00–15:00, among the four types of SVFs (SVF(90–270), SVF(90–270)A, SVF(90–270)G, and SVF(0–360)), the model adjusted R2 of SVF(90–270) was the highest. At 15:00–18:00, the model adjusted R2 of SVF(180–360)A was the highest, which is close to the adjusted R2 of SVF(180–360). This indicates that the effect of SVF(180–360)A on the air temperature is similar to that of SVF(180–360) in this time interval. Compared with the model with only Tref and Solar as independent variables, the adjusted R2 of the model after adding SVF(0–180), SVF(90–270) and SVF(180–360) as independent variables increases by 10.5%, 8.4%and 4.5% respectively, which indicates that SVF has a significant effect on air temperature. When SVF(0–360) is added to the model, the adjusted R2 of the models for the three time intervals increases by 1.7%, 4.2%, and 1.9% respectively. This indicates that the influence of SVF(0–360) on air temperature is not as significant as those of SVF(0–180), SVF(90–270) and SVF(180–360).
By comparing different models, it is found that the models with SVF(0–180), SVF(90–270), and SVF(180–360) as independent variables have the largest or near-maximum adjusted R2 values in three time intervals. Although the type of shading that plays a dominant role in air temperature varies by time or space, it is more appropriate to quantify the shading characteristics of different locations in high-rise residential estates using SVF(0–180), SVF(90–270), and SVF(180–360) as indicators with regard to analyzing the relationship between air temperature and shading. At 7:00–11:00, the air temperature will increase by about 1.63 °C for every 0.1 increase in SVF(0–180). At 11:00–15:00, for every 0.1 increase in SVF(90–270), the outdoor air temperature will increase by about 0.65 °C. At 15:00–18:00, for every 0.1 increase in SVF(180–360), the outdoor air temperature will increase by about 0.49 °C. The effect of shading on air temperature decreases with time, and the effect of shading on morning air temperature is the strongest, while the effect of shading on afternoon air temperature is the weakest.
4. Discussion
4.1. Cooling Effect of Shading
The analysis results of the two residential estates both prove that shading has a significant effect on the summer outdoor air temperature in high-rise residential estates. The average differences in air temperature between the observation points with and without shading during the three time intervals was about 0.5–1.6 °C. Shading affects the air temperature by influencing the direct solar radiation reception at ground level. Furthermore, the cooling effect of shading is related to the degree of shading from solar radiation. One study [
20] also showed that more solar radiation leads to higher long-term air temperatures. The cooling effect of shading varies depending on the shading type and climate of the region studied. This study discovered that under the shade of trees, the urban square can be cooled by 1 °C [
25]. Another study discovered that under the shade of dense trees, the air temperature of the street in hot and humid areas can be reduced by 3.5 °C [
26]. Among the three types of shade, building-tree integrated shading has the most significant cooling effect, followed by building shading and tree shading. The average cooling effects of building-tree integrated shading in Xueqing Estate and Shuangqing Estate in the daytime are about 2.7 °C and 1.5 °C, respectively. The building-tree integrated shading produces double shelter against solar radiation, which greatly reduces radiation transmission. Both building shading and tree shading have a cooling effect, and their cooling effects in the daytime can both reach 0.4 °C or more. Cheung et al. found that the average cooling effect of tree shade was 0.6 °C and the average maximum cooling effect was 2.1 °C [
28], which was similar to the finding in our study. Tree shading can compensate for the lack of building shading in some areas of high-rise residential estates, indicating that more attention should be paid to tree layout planning. Reasonable planning of three types of shading can effectively improve the outdoor thermal environment in residential estates.
There are some differences in the cooling effects of shading in the two high-rise residential estates. For example, the average cooling effect of the building-tree integrated shading in Xueqing Estate in the daytime is about 2.7 °C, while that in Shuangqing Estate is about 1.5 °C. Since the cooling effect was derived by comparing the measurement data of observation points, the subjectivity of measurement point selection has some influence on the cooling effect. In addition to this, there are also differences in the greenery and building layout of the two estates, which can also have an impact on the difference in the cooling effect of the three types of shading. Therefore, this study quantifies the shading characteristics by introducing three indicators, SVF, SVFA, and SVFG.
4.2. Correlation between SVF and Air Temperature
This study quantified the shading characteristics of residential estates by dividing the sky viewable fields according to four angle ranges (0–360°, 90–270°, 0–180°, and 180–360°). The four angle ranges were based on the trajectory of the sun during three summer daytime intervals. Our study found that SVF
(0–360) was not the most significant variable in relation to air temperature among the SVFs in four angle ranges. One study [
38] also demonstrated that the fitted R
2 of SVF
(90–270) and Tmrt is higher than that of SVF
(0–360). It also concluded that SVF
(90–270) is more suitable for describing urban space with regard to outdoor thermal perception. SVF
(0–360) refers to the sky’s visibility from all angles. Scattered solar radiation comes from different directions, corresponding to SVF
(0–360). However, most of the solar radiation reaching the ground on a sunny day is direct solar radiation. Several studies [
2,
3,
14,
35,
39] that analyzed the relationship between SVF
(0–360) and air temperature or heat island intensity used SVF
(0–360) as a variable. Their findings depended on the research area and time. For example, studies [
3,
39] reported positive correlations between air temperature and SVF. In another study, it was found that the correlation between SVF and temperature was negative when SVF was less than 0.2 and positive when SVF was greater than 0.2 [
35]. The solar radiation intensity depends on the time and location, resulting in different influences of the SVF on air temperature. Large SVF
(0–360) values indicate that more solar radiation is received by the ground. However, the heat above the ground is also transmitted. They have opposite influences on the air temperature. Therefore, the influence of SVF
(0–360) on the air temperature depends on the location and time.
In our study, SVFA, SVFG, SVF are used to quantify building shading, tree shading, and all types of shading, respectively. The correlations between SVF and air temperature were found to be stronger for most of the time than those between SVFA or SVFG and air temperature. The shading characteristics of high-rise residential estates are complex, and even the same location may be affected by two or three kinds of shading. Therefore, it is suitable to use SVF as an index to quantify shading in its correlation analysis with air temperature. SVF(0–180), SVF(90–270), and SVF(180–360) show a positive correlation with air temperature in the three time intervals, respectively. The coefficients of SVF(0–180), SVF(90–270), and SVF(180–360) are 16.35, 6.51, and 4.92, indicating that the influence of shading on air temperature is the strongest in the morning, and begins to weaken by noon. The model of SVF and air temperature can be used to evaluate the effect of tree and building shade on air temperature, which will guide the layout planning of residential estates.
An 18-story parallel group (
Figure 16a) is taken as an example. Based on the analysis of building shading,
Figure 16b–d shows the outdoor air temperature differences of 9:00, 12:00, and 17:00 in summer. At 9:00, Ta is higher on the east side of the courtyard than in any other area. At 12:00, Ta is higher on the north side of the courtyard than the south side, and at 17:00, Ta is higher on the west side of the courtyard than the east side. After finishing designing the building layout, the outdoor thermal environment can be optimized by using tree shading. Trees are preferably planted on the north, west, and east sides of the courtyard, which will provide the cooling effect of tree shading. The cooling effect of shade in the morning is stronger than that in the noon or afternoon. Therefore, the distance between the trees on the east side of the courtyard can be slightly larger, while the distance between the trees on the north and west sides needs to be smaller to obtain a good cooling effect (
Figure 17). Furthermore, tree species are appropriate to choose tall deciduous trees with dense foliage, which can give better shade in the summer and will not block direct solar radiation in the winter.
4.3. Contributions and Limitations
We categorized the shading of residential communities in cold areas into three types according to their characteristics. The cooling effects of different shading types were derived by analyzing the measured data. The effect of shading on air temperature has been studied in previous studies, but the scope of the study has rarely been focused on urban high-rise residential estates. Urban high-rise residential neighborhoods are an important building type in Chinese cities, and their higher floor area ratio and number of stories lead to layout characteristics that are different from other urban spaces. The SVF, SVFA, and SVFG indicators introduced in this study can quantitatively describe the complex shading characteristics of the neighborhood. The proposed model reveals the cooling effect of shading, while the model’s coefficients define the influence of shading on outdoor temperature to specific values, which can provide clear recommendations for high-rise residential estate development.
There are some limitations in the research, which need to be continued to be improved in future studies. First, the research object is mainly high-rise residential estates within Beijing, and the prediction model’s application conditions are sunny days in summer, so the results are not applicable to rainy or cloudy days. Second, the factors affecting the outdoor air temperature in residential neighborhoods are not only shading, but also other factors such as ground material and greenery, which are not considered in this study. Third, PET and MRT are often used to evaluate outdoor thermal comfort, but we chose air temperature for the study instead of them. On the one hand, it is because air temperature is an important parameter affecting outdoor thermal comfort. On the other hand, air temperature also has an important role in influencing the indoor environment. It was found that considering the microclimate around the building in the energy consumption simulation leads to higher cooling energy demand [
40]. This implies that the outdoor microclimate, such as air temperature, has a non-negligible influence on the indoor environment. Finally, this study did not investigate the height and leaf densities of trees, but only introduced SVF
G to quantify tree shading. A deeper study is needed to show the role of tree height and density on outdoor air temperature.
5. Conclusions
In our study, the shading of high-rise residential estates was categorized into three types: building shading, tree shading, and building–tree integrated shading. The cooling effects of the three types of shading on air temperature were studied through a comparative analysis of two high-rise residential estates in Beijing. The sky view factors (SVF, SVFA, SVFG) were introduced to characterize the different types of shading. Defining SVFs for three different angle ranges based on the trajectory of the sun at three time intervals enables a more accurate analysis of the role of shading on outdoor air temperature. The coefficients of the multivariate linear models reveal that the effect of shading on air temperature varies with the type of shading and is time dependent.
There is a significant difference in outdoor air temperature in Beijing’s high-rise residential estates in summer, with a maximum temperature difference of 2.3 °C or more. The cooling effect of shading in a high-rise residential estate is significant. In the same residential estate, the daytime air temperature difference between shaded and un-shaded areas can be 0.5 °C or more. Among the three types of shading, building–tree integrated shading has the strongest cooling effect, with an average cooling effect of about 1.5 °C during the day. Therefore, the outdoor activity space can use the building-tree integrated shading to obtain a better cooling effect. The cooling effect of tree shading and building shading is second to that of building–tree integrated shading. During the day, their cooling effect can both reach 0.4 °C or more.
By comparing the adjusted R2 of several models, it was found that SVF(0–180), SVF(90–270), and SVF(180–360) were suitable to be used to quantify the shading characteristics of high-rise residential estates during three time intervals of daytime, respectively. At 7:00–11:00, for every 0.1 increase in SVF(0–180), the outdoor air temperature increased by about 1.63 °C. At 11:00–15:00, for each 0.1 increase in SVF(90–270), the outdoor air temperature increased by about 0.65 °C. For 15:00–18:00, for each 0.1 increase in SVF(180–360), the outdoor air temperature increased by about 0.49 °C. The effect of daytime shading on air temperature decreases with time, and the effect of morning shading on air temperature is the greatest, while the effect of afternoon shading on air temperature is the least.
The adjusted R2 of the multivariate linear model for the three time intervals was 72.4%, 59.3 %, and 71.5%, respectively, which proved that the model was well constructed. The models can effectively help architects to select appropriate shading strategies in the planning stage of high-rise residential estates.


