Abstract
Building penetrations are the most-potent elements providing daylight and moderating the lighting energy consumption and affecting indoor comfort and consequent energy usage. In a semi-tropical climate with a green environment such as Sydney, there is a radical demand to extend windows providing views. This research aims to optimize sunlight admission and maintain indoor comfort while minimizing energy consumption. The method for investigation is to simulate a multiobjective optimization using NSGA-II considering visual and thermal comfort along with energy usage and view of the outside. A combination of human and machine assessments responding to manual and microcontroller-operated indoor validating simulation improves the generalizability. The solutions were assessed for local codes compliance and double-checked against statistical sky conditions. Regarding north, a window-to-wall ratio of 10.7–20% delivers an optimum daylight metric, yielding a 12.16% decrease in energy use intensity. For an east-facing window, altering 26.4% of WWR decreases 2% in lighting energy and a provides a drastic change in visual comfort. Regarding west, changing WWR by about 51% brings about a 50% saving in lighting but no change in other energy loads. Regarding south, when window length is limited to 39% envelope width, it delivers the optimum energy consumption. This study covers visual and thermal comfort together with energy usage and view of the outside, which has not been investigated for southern hemisphere dwellings. A combined simulation and field measurement of human and machine assessment justifies the solutions.
1. Introduction
Windows usually have conflicting effects on indoor lighting, heating, and cooling performance [1]. Window size and placement is the governing variable for annual cooling and heating energy and lighting demand [1,2], and the energy performance of buildings “is related to window system size and properties” [3]. Revising “the window design improves the overall performance of a building” [4]. According to ASHRAE Standard-90.1, “The ideal fenestration would allow light to enter the building but block solar radiation outside the visible spectrum”. Daylight has a conflicting effect on indoor thermal and visual comfort and energy consumption, and the concept of the “thermal-daylighting balance” is confusing due to various evaluation criteria and research methods [5]. Life-cycle cost analysis showed that initial investment in windows strongly influences the total life-cycle cost, even in a lifespan of 30 years [6].
Regarding the contradictory influence of window size on indoor metrics, a smaller window functions correctly in regulating heat loss in the heating season and solar heat gain in the cooling period. In contrast, a larger window provides outside views, admits daylight, and controls solar heat gains in the heating period. Designating a proper window configuration into a façade based on the convective heat transfer distribution can enhance building energy performance considerably [1]. Window size can also affect the daily air circulation and ventilation which has a significant effect on indoor air quality. As Ilies et al. (2021) investigated, the environment with poor quality air is potentially harmful to people [7].
Buildings account for approximately 20 percent of energy consumption in Australia. An increase in domestic air conditioning load is the principal contributor to peak electricity need, remarkably during hot summer afternoons [8]. According to Australian Energy Update 2020 and the Department of Industry, Science, Energy and Resources (2020), “Australia’s energy consumption rose by 0.6 percent in 2018–2019” and 0.4 percent over the last decade.
Whilst the energy consumption of a building related to window size has been well discussed, the impact of the aperture size optimizing visual and thermal comfort as well as visual contact to the outside has not been investigated, especially considering all orientations of the windows. The purpose of this paper is to optimize seven objectives of comfort and energy consumption for the variables of aperture size, layout, and glazing types in housing located in Sydney, Australia. The main aim of the optimization is to provide a range of optimized solutions for each orientation in order to enhance indoor visual and thermal comfort as well as moderate electricity consumption. The scope of the study is limited to simulation and validating field measurement for a single room constructed with typical Australian construction. This experiment period lasted for one year.
2. Literature Review
A large and growing body of literature has investigated optimized window layouts to decrease energy consumption. With regard to residential buildings, Feng et al. (2021) used Manta-Ray Foraging Optimizer and RIUSKA to optimize cost and energy for five climate conditions in the USA. They considered building envelope variables and building shape, no shading, Low-E, and Argon glazing; they found a 4.5% change in the life-cycle cost [9]. A parametric study on thermal comfort and energy efficiency in Singapore was conducted by Tong et al. (2021), considering indoor air temperatures and cooling loads. They reported a 60% reduction in WWR, resulting in the most considerable indoor air temperature reduction for northwest and northeast-facing windows [10]. Using DesignBuilder, Heydari et al. (2021) simulated building energy performance for different window configurations in Iran, focusing on the pane layers, thickness, and glass properties [11]. Employing Genetics Algorithm, Albatayneh (2021) optimized 12 design variables (including WWR) for Jordan. Savings of 88.1%, 94.2%, and 78.5% were achieved for total energy usage, cooling, and heating loads, respectively [12]. Kumar and Bardhan (2020) simulated optimum daylight level and energy savings for Mumbai, India. They reported that a 20% increase in WWR influenced daylight autonomy and useful daylight illuminance considerably [13]. Yilmaz and Yilmaz (2021) conducted a weighted multiobjective cost function to optimize energy, thermal comfort, and daylight performance in Turkish housing using EnergyPlus and GenOpt. They achieved an 11.42% reduction in primary energy, a 4.52% reduction in a predicted percentage of dissatisfied with 9.12%, and a reduction in lighting energy of 4.94% [14]. Using Optimo, Chen et al. (2020) developed a numerical-based window optimization model for non-tropical regions of Australia. They considered WWR, exposure factor, and window type as variables and effective aperture, summer heat gain, and winter heat loss as fitness functions. Energy savings of up to 8.57% were reported [15]. Hammad et al. (2019) optimized multiobjective criteria for Dubai, Kuwait, and Doha, including solar heat gain, window visibility to surroundings, daylighting, and installation cost using Green Building Studio. They recorded an almost 172 percent variation in the cost of installation, where the first preference was connected with visibility, and the last one was the installation cost [16].
Regarding other building types, Kahsay et al. (2021) optimized a south-facing window configuration for a high-rise building in Boston, USA, using NSGA-II to minimize energy consumption. An optimum WWR of 30%, 48%, and 30% was reported for the 2nd, 15th, and 29th floors, respectively [1]. Sedaghatnia et al. (2021) conducted a multiobjective simulation on educational spaces in Iran. They declared that regardless of the summer, energy consumption can reduce by 59% and 79% for 0.3 and 0.6 WWRs, respectively, for south windows and 34–41% for northern windows. They showed that the south-oriented window size is directly related to energy consumption, whereas north-oriented windows can be more oversized with careful assessment. They concluded that the larger the north-oriented windows, the more the indoor illuminance level [17]. Foroughi et al. (2021) found the optimum window dimension and location to minimize building energy consumption for small commercial buildings in the USA using EnergyPlus and Genetics Algorithm. Selecting optimum window dimensions and locations can reduce the total building energy consumption by 15% in hot climate zones [18]. Wang and Wei (2021) studied the optimization of office building envelopes using the Quantum Genetics Algorithm to minimize construction costs. They found that to minimize the energy load of the building envelope, increasing the total window area by 13.8% and the glass-to-wall ratio by 14% resulted in a total cost reduction of 35.3% [19]. Saadatian et al. (2021) conducted a Pareto bi-objective optimization for all office window directions in the European climate to find cost and environmental life-cycle assessment [6]. Pilechiha et al. (2020) adopted a multiobjective optimization regarding energy, daylight, and view for offices in Tehran, Iran. They targeted maximizing WWR and reported a 12% increase in energy intensity use and a more than 80% increase in quality of view [20]. Using a Genetics Algorithm-based simulation, Lakhdari et al. (2021) optimized daylight, thermal, and energy performance for classrooms in dry climates considering WWR, wall materials, glass types, and shading devices [21]. In 2011, Daum performed simulations and a field study assessing energy demand and indoor comfort for office space in Switzerland [22].
Sayadi et al. (2021) demonstrated that the dominant energy consumption increases as a function of WWR in all cases [23]. Mashaly et al. (2021) carried out a multiobjective/multi-scenario to design complex fenestration systems to optimize useful daylight availability, glare protection, and view to the outside [24]. Lee et al. (2013) showed that decreasing WWR from 100% to 25% in five Asian regions dramatically decreased cooling loads. A wider window contributes to more significant energy demand [3].
Gou and Su (2020) analyzed the effect of four different glazing systems on the educational space indoor environment in China. Using DesignBuilder, they assessed the optimizing retrofitting building windows. This study showed that the single lowE transparent 3 mm offers the most comfortable indoors. They also stated that for an actual situation, the designers could not ascertain the optimum glazing construction only by defining SHGC or U-value. In evaluating the comprehensive performance of a window, a detailed simulation is crucial [25].
Kumar et al. (2022) reviewed 260 papers evaluating building parameters to optimize the building envelope. For the main category of design parameters, under the geometry sub-category, they evaluated shape factor, orientation, shade level, and envelope type parameters on which the window can have an influence. This critical review showed that the dominant orientation (north in the southern hemisphere and south in the northern hemisphere) WWR has a modest effect on the cooling load but a substantial effect on the heating demand. They found that decreasing WWR by four times can reduce the total energy use by more than six times. Assuming thermal comfort, the researchers concluded an optimum WWR of 10–20% and 1.5–9.5% considering lighting load [26,27]. Wu and Zhang (2022) studied a multi-objective simulation considering useful daylight illuminance (UDI), energy use intensity (EUI), and thermal discomfort time percentage (TDP) for hot summer and cold winter zone. The parameters were openable-window-area-ratio (OWR), window-wall-ratio (WWR), solar-heat-gain-coefficient (SHGC), louver depth, and wall thickness. They achieved 2.5%, 48.4%, and 18% improvement in the beforementioned objectives, respectively. They concluded that OWR, WWR, SHGC, louver depth, and wall thickness profoundly impact thermal and visual comfort as well as daylight performance. Regarding visual comfort, a WWR of 0.6 with deep louvers of 0.7 m offers great improvement. For the mentioned climate, there is a negative correlation between energy and indoor thermal and indoor visual performance [28]. Pérez-Carramiñana et al. (2022) analyzed the energy performance of single-family housing in Spain’s Mediterranean climate which is similar to Sydney. Among the parameters they considered were thermal transmittance, solar control, and total solar energy transmittance of the glazing with the movable shading device. They showed that mobile solar protection could bring a 44% decrease in cooling load and a 20% decrease in annual energy demand. The other decisive factors are reducing the aperture size and increasing overhangs [29]. Chi et al. (2022) optimized the light-admitting areas of a building moderating solar radiation through the creation of a new skydome model. They studied six two-story office buildings and achieved an average of 14% savings in energy demand for the case buildings [30].
Ozel (2019) performed a numerical analysis on the influence of glazing area percentage (GAP) on optimum insulation thickness for Turkey. She considered single and double-glazing systems for all orientations. She found that as a double-glazing GAP increases, the heating demand increases for the north, while the cooling load increases for all orientations [31]. Using parametric modeling through the Ladybug plugin, Goharian et al. (2022) optimized a light-well configuration assuming daylight autonomy and useful daylight illuminance for a seven-story residential building in Tehran, Iran. The authors achieved a doubled UDI for the lowest floors [32].
Overall, these studies highlight the need for enhancing indoor environment quality by optimizing window layout. The generalisability of much-published research on this issue is problematic since much of the current literature on window optimization pays particular attention to simulation, and the field experiments are not well carried out. In addition, the sky conditions were assumed mainly clear in the simulation to investigate the worst-case scenario. In this study, the authors simulated four different sky conditions (clear, overcast, hazy, and heavy rain clouds) together with local cloud cover statistics, which makes the results more reliable. The majority of previous studies have focused on energy consumption or lighting energy, so there is a noticeable lack of comprehensive study on the window size or glazing type effects on thermal and visual comfort along with visual contact with the outside. Researchers have not treated window layout optimization for different glazing types for all orientations, especially for residential spaces which have been turned into home offices since the COVID-19 pandemic.
3. Materials and Method
3.1. Methodology
This study examines multiobjective optimization of the window configuration within the typical local construction finding the optimum range of window layouts for residentials in Sydney, Australia. The methodological approach and data collection taken in this study is a mixed methodology based on simulation as well as empirical field measurements. A combination of quantitative (metrics) and qualitative (human comfort) approaches was used in the data analysis.
A single residential zone of 6.00 m × 6.00 m × 3.00 m was considered (Figure 1) in Sydney (33°51′ S,151°12′ E), NSW (southeastern part of Australia) in a temperate climate. In order to have a robust analysis and generalize the results, the authors conducted an in-depth study on local construction. The applied construction detail, material properties, and climate data are shown in Table 1.
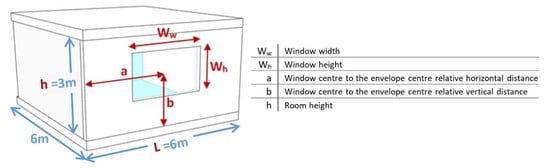
Figure 1.
A single zone residential room for the case, genomes in multi-objective simulation through NSGA-II, and acronyms for window and envelope parameters (modeled by authors).

Table 1.
Independent variables affect the thermal and lighting performance and parameters in simulation. About 80% of the cladding type in NSW is masonry veneer. According to AS/NZS 1680.1:2006, the average recommended illumination for a normal range of tasks from simple to ordinary is 200[lx]. (According to Australian Institute of Refrigeration Air Conditioning and Heating (AIRAH interior and workplace lighting, Part 1: General principles and recommendations).
It is beyond the scope of this study to examine the indoor air quality and natural ventilation due to the window size and its openable area. The current study has only examined a single residential room that could be used as a home office, and it was not explicitly designed to evaluate factors related to office spaces. The sky conditions in the simulation process were clear and overcast conditions, and the period of field measurement was one year which could bring some variation with the simulation results. To conform with reality, the minimum roof eave that does not affect the window lighting performance was assumed.
During the standard working time, Sydney experiences an average of 38.3% cloud coverage annually. The average outdoor temperature is 19.97 °C, 24.78 °C, 20.43 °C, and 14.45 °C from spring to winter, respectively.
Assessing daylight metrics, a network grid of 1.0 m × 1.0 m sensors at the working plane and on the floor was considered. In accordance with Illuminating Engineering Society’s Lighting Measurement 83, the reference working plane was assumed at 0.762 m from the floor; working time ranged from 8 a.m. to 6 p.m., considering the daylight saving time [33]. The independent variables and the simulation settings are outlined in Table 1. Lastly, a case study archetype with similar properties was used to validate the results.
Concerning compliance with the local codes, according to the Building Code of Australia, “Required windows to provide natural light must have a light-transmitting area of at least 10% of the floor area.” [34]. The Pareto Front solutions firstly were checked against these requirements, and then the filtered solution fed the validation process. In this case, the optimized WWR for window layout (please see the final part of the results and discussion section) was 10.89–13.60%, 21.78–29.86%, 10.74–14.50%, and 19.65–23.56% for north, east, and west-facing windows, respectively. All complied with the local national code.
Regarding natural lighting, “natural light, when available, provides an average daylight factor of not less than 2%” [34]. The optimized windows bring a mean daylight factor of 4.96%, 13.13%, and 7.27% for the north, east, and west, respectively.
By virtue of accurate environmental performance analysis software, the simulation method is one of the more practical ways of evaluating envelope effects on indoor conditions. Fostering optimization algorithms to simulation-based building design processes is a favourable attitude for fulfilling energy-efficient designs [35]. The main advantage of using the simulation method is a comprehensive investigation of millions of possible outcomes, which speeds up the analysis of the interaction between various climate conditions and design. Hence, for this study, a multi-objective simulation was used to explore the optimum set of efficient solutions and their long-term effect. The optimization process is going through a transformation from single-objective optimization to multiobjective optimization identifying a balance in the building design objectives [14].
This project set out to assess visual and thermal comfort and energy metrics for possible window configurations (dimensions, position, and glazing). The procedures began with a parametric optimization–simulation technique. All the work on the computer was carried out using Rhinoceros3D, a CAD application, and an algorithmic modelling plugin Grasshopper used to develop parametric models. ClimateStudio was used as a workflow feature for EnergyPlus, and an advanced daylight simulation engine of RADIANCE. RADIANCE considers four natural daylight components: direct and indirect sunlight and direct and indirect skylight through a dynamic climate-based model that analyses daylighting through raytracing calculation [36].
The aperture size, position, and glazing for each cardinal direction are genes for the NSGA-II optimization process [37,38] (see Figure 1). According to the literature survey and similar metrics investigated as well as the measures addressed by standards, seven objectives were chosen with the same weight. Objective (fitness) functions are as follows:
- Minimizing Energy Use Intensity (EUI) [kWhr/m2/yr];
- Maximizing LEED Quality view (v4.1) [%area];
- Maximizing Spatial Daylight Autonomy (sDA) [%area];
- Minimizing Annual Solar Exposure (ASE) [%time];
- Minimizing Predicted Percentage Dissatisfied (PPD) [%occupants];
- Minimizing Daylight Glare Probability (DGP) [%occupants]; and
- Maximizing Useful Daylight Illuminance (UDI) [% time].
The genomes are as follows:
- The window width (Ww) [m];
- The window height (Wh) [m];
- The horizontal and vertical window to the envelope relative distance (C/C) [m].
Since Genetics Algorithm is a suitable optimization method for daylighting performance of buildings [39] and building design should not concentrate only on energy efficiency as a single objective [14]. The method adopted for investigation was to first simulate a multiobjective optimization using a Non-dominated Sorting Genetic Algorithm (NSGA-II) that could provide various near-optimum options. NSGA-II advantages are as follows:
- Fast-sorting as in this algorithm, “the maximum number of accesses in the non-dominant ordering of non-first dominance i is (N − 1), and the number of non-dominated frontiers is a non-zero constant, that is n ≥ 1” [40];
- Elite, that “ensures that the fitness of the best solution in a population does not deteriorate as the generation advances” [41];
- Multi-objective Genetics Algorithm generates offspring using crossover to vary the programming of a chromosome(s) from one generation to the next. Crossover acts as a genetic operator (recombination) and mutation, a unary operator which only needs one parent to work on, selecting according to nondominated-sorting and crowding distance comparison. The algorithm acts by selecting lower-rank solutions from the population combining the parent population with offspring based on the cardinality of the solution sets and their distance to the solution boundaries [35,42]. It sorts the solution as close to the Pareto-optimal solution as possible. Compared to frequently-used Pareto-optimal methods, NSGA-II provides fast, accurate, and efficient convergence, making searching possible in a wide range and tackling problems that start with non-feasible solutions with diversity in solutions and uses elitist techniques to preserve the best solution for the current population in the next generation [41]. It does so through a better spread of solutions near the true Pareto-optimal [43] and can find a good approximation for the Pareto front [44,45].
NSGA-II algorithm (pseudo-code) is as follows [22]:
| Algorithm 1: NSGA-II. |
| 1: t←0 |
| 2: initialization:initialize population P(0) |
| 3: while termination condition ≠ true do |
| 4: evaluate P(t) |
| 5: selection:mating pool M(t)←select(P(t)) |
| 6: crossover:M′ (t)←crossover(M(t)) |
| 7: mutation:M′′(t)←mutation(M′(t)) |
| 8: update population:P(t + 1)←update(P(t) ∪ M′′(t)) |
| 9: t←t + 1 |
| 10: end while |
The simulated binary crossover gives the crossover observed as [46]:
where ci,k is the i-th child with k-th component;
pi,k is the chosen parent, and
βk is a sample from a randomly generated number. βk is to be ≥0.
The polynomial mutation is calculated as:
where ck and pk are the child and parent, respectively. , , and are the upper bound, lower bound for parents, and small variation from a polynomial distribution, respectively.
Regarding simulation parameters, to define the population, the generation size (how many individuals per generation) and generation count (how many generations are in the simulation) were set as 50 and 100, respectively. For algorithm parameters, the crossover probability (the percentage of solutions in the generation that will reproduce for the next generation), the mutation probability (the percentage of mutations taking place in the generation), the crossover distribution index, and the mutation distribution index were set to 0.9, 1/(number of variables) as recommended by [38], 20, and 20, respectively. For the indices, an extensive distribution index value gives a higher probability of creating offspring near parent solutions. A small distribution index value allows distant solutions to be selected as children’s solutions [47].
After extracting a Pareto Front set from the simulation, the options were filtered against local code requirements. For the purpose of validating Pareto Front solutions, this study adopted a field measurement empirical validating approach using both sensors and human subjects. The main advantage of the experimental method is ensuring researchers the simulation results reliability. In addition, human subjects’ assessment could approve that the result of the simulation can provide occupants with visual and thermal comfort. A major problem with the experimental method on energy consumption is that the occupants might over spec real-time adjustment of lighting and air-conditioning which results in overusing energy. Therefore, a compound approach for assessing comfort metrics and energy consumption was followed. A set of temperature sensors and light meter tools on a grid of 1 m × 1 m (similar to the simulation) was used to validate the simulation result. Sensor network and light meters were arranged both on the ground and working level (Figure 2d).
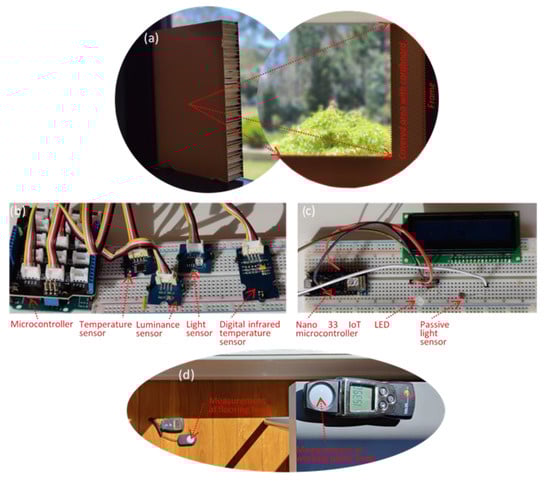
Figure 2.
Validating experiment: (a) partly blocking transparent area validating daylight simulation; (b) a module for sensing and recording data; (c) an automatic responsive module switching light and air-conditioner in response to comfort metrics threshold; and (d) field daylight measurement.
Electricity usage was measured in two ways. Once, human subjects (a total number of four persons, two males and two females between 30–42 years old) were asked to work in a case room for one year and operate the light and air-conditioning manually. Sensors attached to the switches recorded the on/off time. The second option for validating was setting an automatic sensor-based system (microcontroller) to operate the lighting system and air-conditioner when the metrics crossed the comfort thresholds, equipped with a timer to measure the time for any situation record of system performance. In addition, a Clamp Energy Meter (CLMT-1ZBS) by Zigbee® was used to measure, monitor, and report energy consumption.
However, there are certain drawbacks associated with the use of quantitative analysis. Hence, a qualitative interpretation by human subjects was also used. The design of the questionnaires was based on participants’ daily assessment of indoor comfort metrics.
For daylight admission, to build an aperture layout similar to the simulation results, the authors used 30 mm thick corrugated cardboard to cover unwanted areas of a 6 m × 3 m window (Figure 2a) to measure daylight metrics.
It is worth noting that the typical simulations assume similar sky conditions throughout the year. Although, to date, extensive research has been carried out on thermal or visual comfort or energy consumption, to the author’s best knowledge, research on the subject has been mostly restricted to limited comparisons or optimization of energy consumption or/and thermal comfort alone or in conjunction with illuminance. Considering visual and thermal comfort together along with energy usage and view of the outside has not been investigated for dwellings located in the southern hemisphere. In addition, human subjects’ assessment of comfort compared with simulation in response to human-operated and automatic microcontroller-managed air-conditioning and lighting improves the generalizability of findings.
In conclusion, this research followed several steps:
- Defining a case determining independent variables (local climate and construction, window properties, etc.);
- Optimizing a multiobjective function of lighting, heating, and cooling electricity consumption (dependent variables);
- Finding Pareto Front solutions, filtering them against local code requirements, ranking them (using TOPSIS technique), and field measurements.
- Applying a mixed approach for validating the solutions both by human subjects’ declaration and sensor measurement (Figure 3).
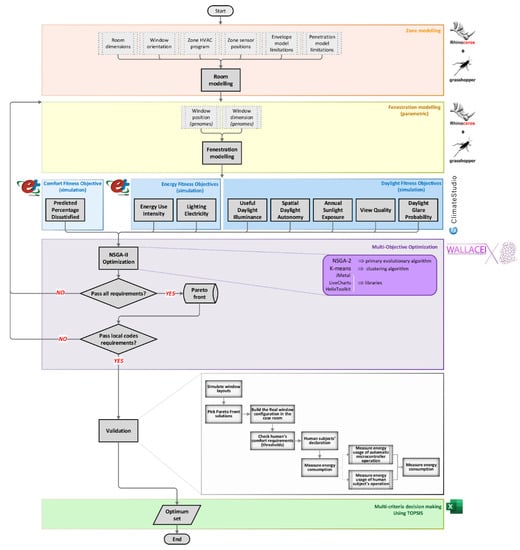 Figure 3. The research flowchart shows every step and technique/engine/software used.
3.2. Employed Methods and Metrics
The fitness objective of multiobjective optimization is as follows:
3.2.1. Spatial Daylight Autonomy (sDA)
The measure of sDA is a dynamic daylight metric that indicates the percentage of the working plane area, demonstrating daylight sufficiency in terms of the percentage of working hours occupants can work without the need for additional artificial lighting. As a part of the LEED rating system, it evaluates whether indoor space is given enough daylight during standard hours. The sDA specifies the annual percentage of the indoor area that receives illuminance of at least 300 [lx] for at least 50% of the standard operating timesteps [33]; sDA is formulated as:
where for a given point i, IT stands for the occurrence number when sDA outstrips the illuminance threshold, τ denotes the transitory fraction threshold, and ty is the annual date–time count [20]. According to LEED Ver. 4.1, an sDA greater than 75% receives 3 view credits [48].
3.2.2. Useful Daylight Illuminance (UDI)
Considering the interpretation of climate-based analyses, UDI was proposed by Nabil and Mardaljevic (2006) to assess indoor daylight. It “employs realistic, time-varying sky and sun conditions and predicts hourly levels of absolute daylight illuminance” [49]. UDI is defined as the percentage of annual occupied hours when the illuminance rates are useful. The useful range was firstly set by Nabil and Mardaljevic (2005) with 100–300 [lx] as useful and 100–3000 [lx] as desirable [49,50]. David et al. (2011) determined the threshold of excessive illuminance to be 8000 [lx].
3.2.3. Annual Solar Exposure (ASE)
ASE correlates the number of hours over a year “at a given point where direct sunlight is incident on the surface”, possibly causing visual discomfort, glare, or increased cooling demands [51]. ASE represents a ratio of room area to the whole in which the direct sun exposure is greater than 1000 [lx] for more than 250 h per year [20]. Assuming ASE as a proxy to glare [52], ASE greater than 10% probably needs glare avoiding strategies. ASE is calculated methodically as:
where xi at the point i describes the incident number exceeding the ASE illuminance threshold (1000 [lx]), and Ti is the annual absolute hour threshold [20].
3.2.4. View Quality
According to LEED-v4.1-Building Design and Construction (2019) “Achieve a direct line of sight to the outdoors via vision glazing for 75% of all regularly occupied floor area. View glazing in the contributing area must provide a clear image of the exterior” [48]. In this regard, the LEED standard requires that at least 75% of all frequently occupied floor areas have a direct line of sight to the outside through vision glazing. In addition to that, 75% of all regularly occupied floor areas must have at least two of the following [48]:
- Multiple lines of sight to the window in different directions at least 90 degrees apart;
- Views that include at least two of the following: (1) flora, fauna, or sky; (2) movement; and (3) objects at least 7.62 m from the outer side of the glazing;
- Unblocked views within a distance of three times the head height of the window; and
- View factor of >=3 or greater.
Any permanent interior obstructions must be included in the calculations. Movable furniture and partitions may be excluded. Views into interior atria may be used to meet up to 30% of the required area.
3.2.5. Daylight Glare Probability (DGP)
Whereas other glare indexes assess the subjects’ perception of glare, DGP expresses a probability that could result in occupants’ being disturbed by glare [53]. It can be used regardless of window size, shape, and position [54]. Equation 3 presents the DGP formula.
where EV is vertical eye illuminance [lx];
Ls,i is the luminance of ith window [cd/m2];
ωs,i is the solid angle (angular size of the window seen by the eye) of ith window [sr]; and
Pi is the position index of the ith window.
3.2.6. Energy Use Intensity (EUI)
EUI [kJ/m2] is an indicator that expresses a building’s energy efficiency based on design or operations attributes and indicates a building’s energy consumption as a function of the building’s size or other characteristics [55]. In this study, the effect of penetration layouts on monthly heating, cooling, and lighting is to be assessed.
3.2.7. Predicted Percentage Dissatisfied (PPD)
According to BREEM, PPD is a quantitative prediction index that assesses a given space that specifies the percentage of occupants finding the interior thermal conditions dissatisfactory (i.e., feel too warm or too cold) [56,57]. In contrast to PMV (Predicted Mean Vote), which shows occupants’ thermal sensation, PPD shows the reached goal degree of thermal comfort. According to ASHRAE 55, PPD needs to be kept below 20%.
4. Result and Discussion
Hereafter L, h, Wh, and Ww represent façade width, façade height, window width (height), and window length, respectively (see Figure 2).
4.1. View to the Outside
Since the view does not depend on the orientation, the result discussed here applies to all orientations.
Regarding full-facade-wide windows of Wh ≥ 50%h that are so popular locally, changing the window sill significantly affects view quality. The only exception is 80%h < Wh < 90%h where changing the window sill makes no change in view. For Wh = 50%h, the maximum view is attained when the sill is set at 1.0 m (Figure 4).
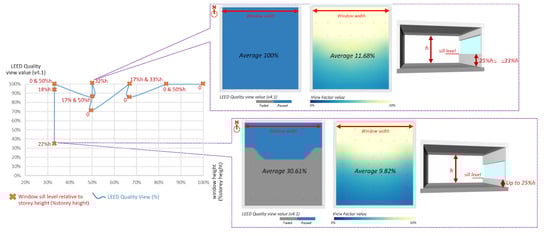
Figure 4.
LEED quality view for different window lengths and sill levels for full-wide windows.
A full-height window that is façade-centre-located can offer 100% view quality regardless of length except for Ww < 20%L. A full-height window of 35%L < Ww < 70%L can provide more than 96% view quality regardless of its transverse position relative to the façade. Therefore, a full-height window could be the best option in terms of view.
Windows of 30%L < Ww < 35%L by 55%h < Wh < 65%h with sill level greater than 15%h offer view quality over 85%. Changing the window sill from a no-sill up to 50%h brings significant differences in view quality. For a window of 25%L < Ww < 35%L by 25%h < Wh < 35%h, the maximum view quality was assessed at a sill level of 33%h.
Figure 5 shows that window dimension and position range offer an acceptable view of the outside quality (at least 75% of regularly occupied floors with a direct sight line). Figure 5a shows the acceptable range for window dimensions and sill levels so that every point on the surface can bring an acceptable view quality, and Figure 5b demonstrates the Pareto Front offering acceptable view quality. Any point on the blue line can satisfy the view quality requirement.
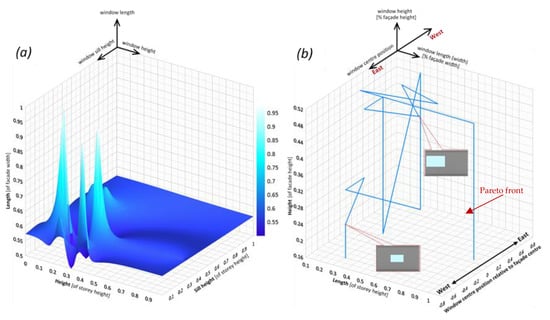
Figure 5.
Acceptable range for: (a) window dimensions and sill levels; and (b) window dimensions and position relative to the façade.
Generally, a WWR < 10% cannot meet the view requirements. It is worth noting that the window sill has more direct consequences on the view than penetration width and glazing properties and layers. Argon/Krypton gases do not affect the view quality, and the total window width does not offer a significant change in view value.
4.2. North-Facing Window Optimization
Concerning the southern hemisphere, northern windows have a prominent role in admitting sunlight. Hence, the majority of the discussion focused on this orientation. Simulation and experiments performed in this study show that considering the optimization of the mentioned variables, the optimum ratio is 13.60–14.96% for northern windows.
4.2.1. Visual Comfort
Overall, a WWR of 10.7–20% delivers optimum daylight metric results. A window of Ww = L can satisfy sDA requirement for more than 75% of layouts except for 33%h < Wh <5 0%h with sill at 15%h–33%h, which fails sDA and ASE.
Windows of Ww < 33%L cannot satisfy the sDA requirement except for Ww = 33%L–40%L by Wh = 30%h–50%h. If the sill is 50%h, it brings sDA from 55% to 100%, while ASE is less than 8%. Figure 6a demonstrates window layout range meeting daylight metrics.
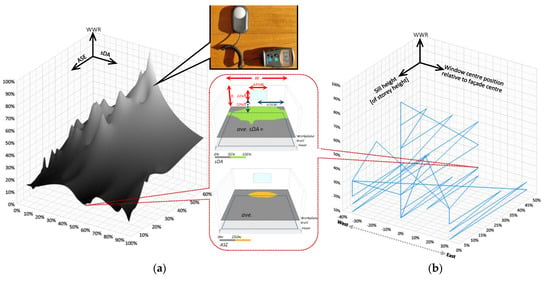
Figure 6.
Acceptable ranges for: (a) sDA and ASE according to WWR; and (b) window position according to WWR. The surface and line graphs represent the acceptable configurations.
On the effect of the window sill, increasing the sill level from zero to 33%h, sDA generally decreases. Concerning ASE, changing the window sill level reflects a similar change which is minimized both at floor level and 50%h. There are some immediately dependable conclusions for a window sill that is optimum around 50%h that can pass daylight and view threshold requirements.
As to penetration position relative to the envelope, for sill level greater than 40%h, moving the penetration to the eastern part of the façade, maximum sDA and minimum ASE were observed. For a Wh ≤ 33%h, the optimum position is at the centre of the wall, and then next to the western side is preferred (Figure 6b).
No change in daylight metrics was noticed for glazing properties as well as the number of layers and Argon/Krypton gases.
To simulate DGP, a sensor network of 1.0 m × 1.0 m was set at different levels in accordance with human subjects’ eye levels-at 1.1 m, 1.2 m, and 1.3 m for seated and 1.5 m, 1.6 m, and 1.7 m for standing eye level.
A full-façade window with any glazing construction is not tolerable in the matter of glare. For clear single-pane windows, which are the most glare-prone, windows of Ww=L by Wh > 50%h are unacceptable. Windows of Ww = L by Wh ≤ 34%h bring disturbing glare between 32% to 38%, which is acceptable. The exception is Wh = 34%h with no sill that sacrifices the view. For any Ww = L by Wh > 50%h window with any glazing and sill level window, disturbing glare is greater than 50% yearly.
Only a full-height window satisfies both glare comfort and view when 26%L < Ww < 33%L. The lateral position of a full-height window also affects the glare. Relative to a centre-positioned full-height one, an east-side positioned window decreases disturbing glare by 17.7% and a west-positioned window reduces it by 19.2%.
On glazing construction, a window of Ww = L with any sill level fails DGP acceptable value. The only acceptable Ww = L penetration is when 30%h < Wh < 34%h (Figure 7a), with the sill level of greater than 33%h to provide the view. Within the range of Ww = L by 30%h < Wh < 34%h, when the sill is placed at 50%h, it meets the glare comfort requirement while double-pane-lowE glazing is installed; other glazings bring disturbing glare to 34–40% yearly time.
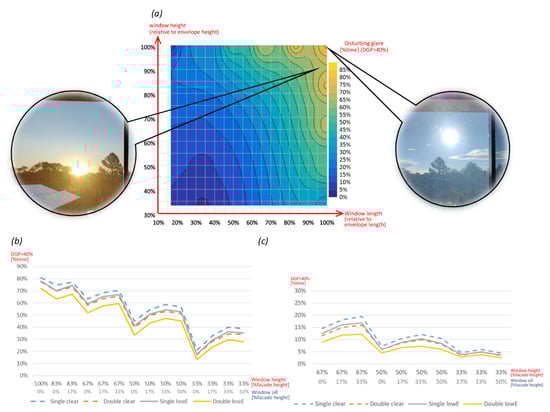
Figure 7.
Yearly fraction of disturbing glare time for: (a) DGP study based on window height and width for clear single-pane window dimensions as well as some HQ images for the specific point of the graph during working time; (b) DGP change based on window width, sill level, and glazing for Ww = L windows for different glazings; and (c) DGP change based on window width, sill level, and glazing for Ww < 33%L for different glazings.
From a glare standpoint, the best range of windows is Ww < 35%L. Replacing a clear-single-pane window with a double-lowE-glazing decreases DGP greatly (Figure 7). The west- and east-placed windows decrease up to 13% and 18% in DGP relative to centre-positioned ones. The exception is double-clear glazing which indicates no critical difference for different positions. Rationally, the more window width, the more indoor glare probability.
The conclusion that can be drawn from glare analysis confines either of the window dimensions to 33% of the corresponding façade dimension. In this regard, replacing single-pane glazing with lowE coated double-pane is more efficient than the number of layers. The optimum sill level is between 43%h and 52%h. The west-side installed windows can alleviate disturbing glare, better than the east-side-positioned. A vertical shade of 20–30%Wh on both sides of the north-facing windows seems to affect visual comfort significantly while not blocking the view and useful daylight [58].
4.2.2. Energy Consumption
Concerning EUI for the same penetration dimensions, changing the window sill level brings no significant change since any difference in air-conditioning is restituted by the saving/cost of artificial lighting energy. The windows on the western side of the façade show the same EUI as centre-positioned windows, while the eastern side makes an unnoticeable difference. There is a non-linear relationship between window dimensions and EUI in which window length is more significant than height.
Regarding window position and glazing properties, for the windows placed on the eastern part of the façade, the change of 0.43%, 3.72%, and 2.22% was noticed in EUI for clear-double-pane, LowE-single-pane, and LowE-double-pane, respectively. Regarding windows positioned on the western side of the envelope, the changes in EUI are 1.35%, 3.83%, and 2.25% for changing single-clear-glazing into the clear-double-pane, LowE-single-pane, and LowE-double-pane, respectively (Figure 8).
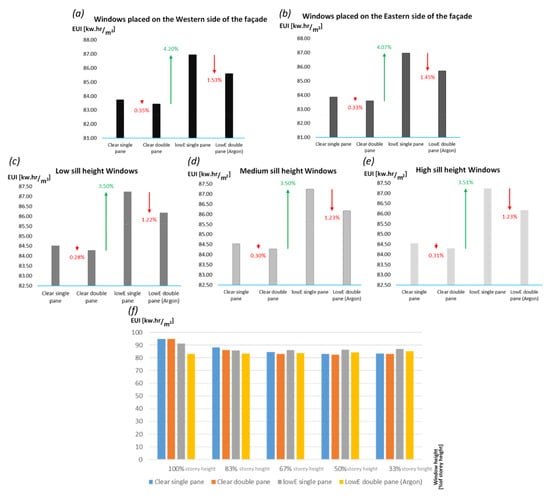
Figure 8.
(a) EUI differences for different window positions relative to the envelope for the western-side-placed window; (b) EUI differences for different window positions relative to the envelope for the eastern-side-placed windows; (c) EUI differences for low-sill windows; (d) EUI differences medium-sill windows; (e) EUI differences for high-sill windows; and (f) EUI differences for different window relative height to the envelope l for the Ww = L window placed at the envelope centre for different glazing properties.
Another important finding is that for Ww = L windows, substituting a single-clear-pane with a clear-double-pane (Argon between) does not change EUI significantly (Figure 8f). For windows Ww < 80%L, the best EUI is offered by double-pane-clear glazing. For windows of Ww > 80%L, lowE-double-pane glazing is the best option. Taking the cost increase of lowE-single-pane glazing into account, the improvement in EUI is out of the question. In addition, for the windows of Ww < 50%L, changing the glazing into a lowE assembly maintains no advantage in EUI (Figure 8f).
Changing the glazing of low sill level windows from a single-clear one into the clear-double-pane, LowE-single-pane, and LowE-double-pane brings a change of 0.28%, 3.21%, and 1.95% in EUI. For sill levels between 34%h to 50%h, similar changes in the glazing bring a change of 0.30%, 3.19%, and 1.93% in EUI. The changes for the high-sill window (greater than 50%h) are 0.31%, 3.19%, and 1.93% in EUI (Figure 8f).
4.2.3. Thermal Comfort
The highest PPD range is for windows of Ww < 33%L, which means the most uncomfortable environment. For Ww = L windows, raising the window sill level offers more thermal comfort to the occupants, and the optimum window width for a window of Ww = L is 50%h < Wh < 66%h. The full-height window PPD is slightly better than the full-façade, and the optimum length for such windows is 50%L < Ww < 55%L. Windows with lowE coating showed higher PPD, the same as replacing a single-pane with a double-glazing window. Replacing window glazing profoundly affects PPD, especially for western-side positioned penetrations.
Finally, the optimum solutions for all orientations, considering all the abovementioned metrics are illustrated in Figure 9.
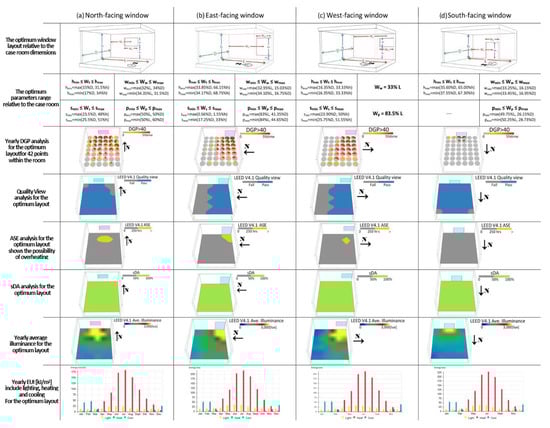
Figure 9.
Optimum layouts range relative to the case room dimensions and the metrics analysis for the optimized layout for: (a) north; (b) east; (c) west; and (d) south-facing windows.
4.3. East-Facing Window Optimization
Concerning east-oriented full-façade windows, the glazing type makes no difference in PPD and DGP. Even though windows of Ww = L provide indoor with excellent view and sDA; for Wh > 50%h, the bearable glare threshold has been crossed and also often fails ASE. Acceptable windows of Ww = L could have a 45%h < Ww < 50%h with a sill level between 17%h–20%h. This option fulfills all requirements. In this case, changing the glazing construction makes no significant difference. By increasing the sill level, disturbing glare is alleviated. Regarding glazing, replacing a single-pane with a double-pane decreases PPD by 1.2%, and lowE coatings decrease PPD by 5.5%. Changes in window sill level also show no significant variation in PPD, EUI, sDA, and view. Raising the sill level only makes DGP worse.
Full-height window length should be limited to 47%L unless DGP exceeds the critical threshold and replacing glass types only affects EUI. Positioning these window layouts on the southern part of the façade makes DGP acceptable. The northern part placed windows increased DGP by 7–10% with no change in PPD. For seeing the optimum solution, see Figure 9.
4.4. West-Facing Window Optimization
All windows of Ww = L with any glazing fail ASE. The full-height windows also make the interior overheated (ASE > 42%), excluding full-height windows of Ww < 35.5%L. This problem is more severe for the windows on the northern part of the façade than on the southern part.
Disturbing glare is very possible for the west-facing penetrations as there is a coincidence between the low sun height and occupancy time. The current study found that in terms of glare, nearly all Ww = L windows make the space unbearable unless confining Ww<33%h (regardless of sill level). A penetration of Ww = L by Wh = 50%, while using glazing other than clear single-pane, passes the DGP requirements, the same as the Wh = h by Ww = 50%L windows. As long as the window is limited to Ww < 32%L, it passes glare comfort needs with any glazing construction. There exists a direct relationship between heightening sill level up to 34%h and DGP. Rationally, replacing single-pane glazing with a double-pane and adding lowE coating decreases DGP.
It is interesting to note that as long as using double-pane lowE coated windows, no matter the window’s relative position to the façade, the thermal comfort is not markedly different. However, northern-part placed windows bring less satisfactorily visual comfort than southern-part ones. Generally, the higher the sill level, the lesser PPD. For seeing the optimum solution, see Figure 9.
4.5. South-Facing Window Optimization
Surprisingly, no differences were found in the visual comfort of south-facing windows with all glazings. Of DGP, all window layouts pass the acceptable glare comfort. The ASE for all possible layouts is zero. The sDA metric is acceptable for every layout except for low-height windows with a head height of less than 50%h. Distinctly, the more window area, the more EUI, and the optimum energy consumption is for Ww < 39%L.
The higher the window sill, the higher EUI, i.e., by raising the window sill by 15%h, EUI increased by about 0.5% and 0.75% for Ww = 67%h and Ww = 50%h, respectively. The window’s relative position within the façade has no significant effect on EUI.
The minimum PPD range is for windows of Ww < 32%L by Wh < 60%h. For these layouts, the window sill is not a matter of importance. Increasing penetration dimensions directly affects PPD in a way that would be doubled when the area is increased by 300%. The effect of window length is more than width on PPD.
Replacing glazing with low-E panes brings no significant change in thermal comfort for partly glazed envelopes (less than 3% change). However, when the window area exceeds 50% façade area, the change is considerable (45%). The optimum solution is shown in Figure 9.
5. Validation
To validate the simulation results, the authors performed a field experiment assessing the abovementioned metrics. A network of measurement sensors (attached to a microcontroller) conforms with the virtual sensors for simulation and captured the data for a period of one year (Figure 10). In addition, since the experiment was performed during the COVID-19 lockdown period, two human subjects (both male and female) were asked to work within the room for the same time span.
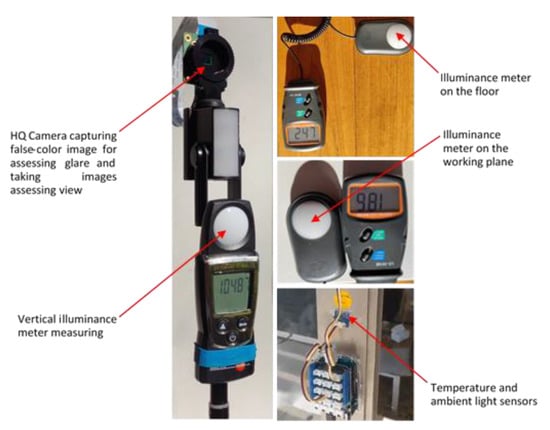
Figure 10.
Field experiment validation of the simulation results.
The measurement reflected less than an average 5% variation in the simulation results. Electricity consumption measurements for three operation options (female, male, and microcontroller) and the simulation are depicted in Figure 11.
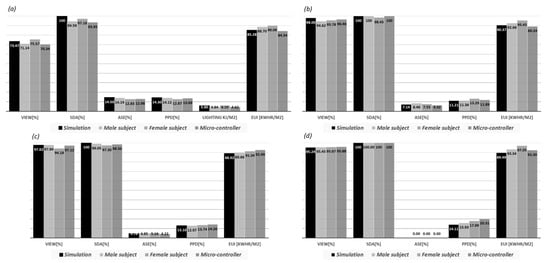
Figure 11.
Validating the simulation result by comparing with observed outcomes for (a) north; (b) east; (c) west; and (d) south.
6. Conclusions
The present study was designed to determine the effect of different window layouts and glazing properties on indoor visual and thermal comfort and energy consumption. It was decided that the method adopted for analysis was to simulate multiobjective optimization using NSGA-II, then examine through two different methods of the human subjects and microcontroller-controlled conditions.
In summary, these results show that compared with the most common window layout for local housing, regarding visual metrics, the optimized layouts improve spatial daylight autonomy for all orientations except the south. This study has also shown that the optimization of windows can bring some improvement in annual solar exposure which can result in alleviating glare probability and indoor overheating. The optimized window somewhat impairs the glare probability which could be avoided by adding some shading elements. Interestingly, for north-oriented windows (the dominant daylight admitting), no change in daylight metrics was noticed based on the glazing properties. The results of this research support the idea that despite confining the window aperture size to optimize indoor visual and thermal comfort, placing the window on the optimum envelope area can enhance the view to the outside.
One of the more significant findings to emerge from this study is that changing 6% in WWR for the north-oriented window makes a 12.16% decrease in the energy use intensity and a 10.55% decrease in average operational energy cost. For the other orientations, optimizing WWR can also change the lighting, heating, and cooling energy demand. The window’s relative position to the façade has no significant effect on EUI, and the window sill is not a matter of importance.
The findings in this report are subject to at least two limitations: the shading effect of surrounding facilities and the seasonal shading effect from surrounding vegetation were not taken into account.
This research has thrown up many questions in need of further investigation. It is recommended that further research be undertaken in the following areas: optimum window size and indoor air quality, the effect of surrounding flora shading and shading system optimization to enhance indoor comfort quality.
Author Contributions
Conceptualization, M.R. and P.R.; methodology, E.S.; software, E.S.; validation, E.S.; formal analysis, M.R. and E.S.; investigation, P.R. and E.S.; data curation, B.S.; writing—original draft preparation, M.R. and E.S.; writing—review and editing, P.R. and B.S.; visualization, E.S.; supervision, B.S.; project administration, M.R. and P.R. All authors have read and agreed to the published version of the manuscript.
Funding
This research received no external funding.
Data Availability Statement
Not applicable.
Acknowledgments
Special thanks to Faezeh Shateri and Fariborz Moshfeghinejad for facilitating the field measurements. Special thanks to Solemma for providing an educational license for ClimateStudio.
Conflicts of Interest
The authors declare no conflict of interest.
References
- Kahsay, M.T.; Bitsuamlak, G.T.; Tariku, F. Thermal zoning and window optimization framework for high-rise buildings. Appl. Energy 2021, 292, 116894. [Google Scholar] [CrossRef]
- Delgarm, N.; Sajadi, B.; Azarbad, K.; Delgarm, S. Sensitivity analysis of building energy performance: A simulation-based approach using OFAT and variance-based sensitivity analysis methods. J. Build. Eng. 2018, 15, 181–193. [Google Scholar] [CrossRef]
- Lee, J.-W.; Jung, H.-J.; Park, J.-Y.; Lee, J.; Yoon, Y. Optimization of building window system in Asian regions by analyzing solar heat gain and daylighting elements. Renew. Energy 2013, 50, 522–531. [Google Scholar] [CrossRef]
- Arntsen, T.-A.; Hrynyszyn, B.D.J.E. Optimization of Window Design for Daylight and Thermal Comfort in Cold Climate Conditions. Energies 2021, 14, 8013. [Google Scholar] [CrossRef]
- Yu, F.; Wennersten, R.; Leng, J. A state-of-art review on concepts, criteria, methods and factors for reaching ‘thermal-daylighting balance’. Build. Environ. 2020, 186, 107330. [Google Scholar] [CrossRef]
- Saadatian, S.; Simões, N.; Freire, F. Integrated environmental, energy and cost life-cycle analysis of windows: Optimal selection of components. Build. Environ. 2021, 188, 107516. [Google Scholar] [CrossRef]
- Ilieș, D.C.; Marcu, F.; Caciora, T.; Indrie, L.; Ilieș, A.; Albu, A.; Costea, M.; Burtă, L.; Baias, Ș.; Ilieș, M.J.A. Investigations of museum indoor microclimate and air quality. Case study from Romania. Atmosphere 2021, 12, 286. [Google Scholar] [CrossRef]
- COAG-Energy-Council. Trajectory for Low Energy Buildings. In Trajectory for Low Energy Buildings; COAG-Energy-Council: Canberra, Australia, 2018; Available online: https://apo.org.au/node/218601 (accessed on 1 October 2021).
- Feng, J.; Luo, X.; Gao, M.; Abbas, A.; Xu, Y.-P.; Pouramini, S. Minimization of energy consumption by building shape optimization using an improved Manta-Ray Foraging Optimization algorithm. Energy Rep. 2021, 7, 1068–1078. [Google Scholar] [CrossRef]
- Tong, S.; Wen, J.; Wong, N.H.; Tan, E. Impact of façade design on indoor air temperatures and cooling loads in residential buildings in the tropical climate. Energy Build. 2021, 243, 110972. [Google Scholar] [CrossRef]
- Heydari, A.; Sadati, S.E.; Gharib, M.R. Effects of different window configurations on energy consumption in building: Optimization and economic analysis. J. Build. Eng. 2021, 35, 102099. [Google Scholar] [CrossRef]
- Albatayneh, A. Optimising the Parameters of a Building Envelope in the East Mediterranean Saharan, Cool Climate Zone. Buildings 2021, 11, 43. [Google Scholar] [CrossRef]
- Kumar, N.; Bardhan, R. Optimizing Building Fenestration Design for Daylight and Energy Savings in Low-Income Housing: Case of Mumbai, India. Urban Sci. Eng. Proc. ICUSE 2021, 121, 447. [Google Scholar] [CrossRef]
- Yilmaz, Y.; Yilmaz, B.Ç. A weighted multi-objective optimisation approach to improve based facade aperture sizes in terms of energy, thermal comfort and daylight usage. J. Build. Phys. 2021, 44, 435–460. [Google Scholar] [CrossRef]
- Chen, Z.; Hammad, A.W.; Kamardeen, I.; Haddad, A. Optimising Window Design on Residential Building Facades by Considering Heat Transfer and Natural Lighting in Nontropical Regions of Australia. Buildings 2020, 10, 206. [Google Scholar] [CrossRef]
- Hammad, A.; Akbarnezhad, A.; Grzybowska, H.; Wu, P.; Wang, X. Mathematical optimisation of location and design of windows by considering energy performance, lighting and privacy of buildings. Smart Sustain. Built Environ. 2019, 8, 117–137. [Google Scholar] [CrossRef]
- Sedaghatnia, M.; Faizi, M.; Khakzand, M.; Sanaieian, H. Energy and Daylight Optimization of Shading Devices, Window Size, and Orientation for Educational Spaces in Tehran, Iran. J. Archit. Eng. 2021, 27, 04021011. [Google Scholar] [CrossRef]
- Foroughi, R.; Asadi, S.; Khazaeli, S. On the optimization of energy efficient fenestration for small commercial buildings in the United States. J. Clean. Prod. 2021, 283, 124604. [Google Scholar] [CrossRef]
- Wang, Y.; Wei, C. Design optimization of office building envelope based on quantum genetic algorithm for energy conservation. J. Build. Eng. 2021, 35, 102048. [Google Scholar] [CrossRef]
- Pilechiha, P.; Mahdavinejad, M.; Rahimian, F.P.; Carnemolla, P.; Seyedzadeh, S. Multi-objective optimisation framework for designing office windows: Quality of view, daylight and energy efficiency. Appl. Energy 2020, 261, 114356. [Google Scholar] [CrossRef]
- Lakhdari, K.; Sriti, L.; Painter, B. Parametric optimization of daylight, thermal and energy performance of middle school classrooms, case of hot and dry regions. Build. Environ. 2021, 204, 108173. [Google Scholar] [CrossRef]
- Daum, D. On the Adaptation of Building Controls to the Envelope and the Occupants; EPFL: Lausanne, Switzerland, 2011; Available online: https://infoscience.epfl.ch/record/155039 (accessed on 1 August 2021).
- Sayadi, S.; Hayati, A.; Salmanzadeh, M. Optimization of Window-to-Wall Ratio for Buildings Located in Different Climates: An IDA-Indoor Climate and Energy Simulation Study. Energies 2021, 14, 1974. [Google Scholar] [CrossRef]
- Mashaly, I.A.; Garcia-Hansen, V.; Cholette, M.E.; Isoardi, G. A daylight-oriented multi-objective optimisation of complex fenestration systems. Build. Environ. 2021, 197, 107828. [Google Scholar] [CrossRef]
- Gou, W.; Su, H. Analysis of Influence of Glazing Systems on Indoor Environment of a Passive Solar Building in Lhasa. In Proceedings of the IOP Conference Series: Earth and Environmental Science, Guiyang, China, 18–20 September 2020; p. 012139. [Google Scholar]
- Kumar, D.; Alam, M.; Memon, R.A.; Bhayo, B.A. A critical review for formulation and conceptualization of an ideal building envelope and novel sustainability framework for building applications. Clean. Eng. Technol. 2022, 22, 100555. [Google Scholar] [CrossRef]
- Pathirana, S.; Rodrigo, A.; Halwatura, R.J.I.J.o.E.; Engineering, E. Effect of building shape, orientation, window to wall ratios and zones on energy efficiency and thermal comfort of naturally ventilated houses in tropical climate. Int. J. Energy Environ. Eng. 2019, 10, 107–120. [Google Scholar] [CrossRef]
- Wu, H.; Zhang, T.J.J.o.B.E. Multi-objective optimization of energy, visual, and thermal performance for building envelopes in China’s hot summer and cold winter climate zone. J. Build. Eng. 2022, 59, 105034. [Google Scholar] [CrossRef]
- Pérez-Carramiñana, C.; González-Avilés, Á.B.; Galiano-Garrigós, A.; Lozoya-Peral, A.J.S. Optimization of Architectural Thermal Envelope Parameters in Modern Single-Family House Typologies in Southeastern Spain to Improve Energy Efficiency in a Dry Mediterranean Climate. Sustainability 2022, 14, 3910. [Google Scholar] [CrossRef]
- Xu, Y.; Wang, X.J.E. Transparent part design optimizations in buildings towards energy saving based on customized radiation sky dome model. Energy 2022, 253, 124074. [Google Scholar] [CrossRef]
- Ozel, M.J.A.T.E. Influence of glazing area on optimum thickness of insulation for different wall orientations. Appl. Therm. Eng. 2019, 147, 770–780. [Google Scholar] [CrossRef]
- Goharian, A.; Daneshjoo, K.; Yeganeh, M.J.E.R. Standardization of methodology for optimizing the well aperture as device (reflector) for light-wells; A novel approach using Honeybee & Ladybug plugins. Energy Rep. 2022, 8, 3096–3114. [Google Scholar] [CrossRef]
- IEM. Approved Method: IES spatial Daylight Autonomy (sDA) and Annual Sunlight Exposure (ASE). Illuminating-Engineering-Society. 2013. Available online: https://webstore.ansi.org/preview-pages/IESNA/preview_IES+LM-83-12.pdf (accessed on 1 June 2022).
- ABC. Building Code of Australia 2019, Volume 2, Amendment 1; Australian_Building_Codes_Board ed.; National Construction Code: Canberra, Australia, 2019. Available online: https://ncc.abcb.gov.au/editions/2019-a1/ncc-2019-volume-two-amendment-1 (accessed on 1 February 2022).
- Tian, Z.; Zhang, X.; Jin, X.; Zhou, X.; Si, B.; Shi, X. Towards adoption of building energy simulation and optimization for passive building design: A survey and a review. Energy Build. 2018, 158, 1306–1316. [Google Scholar] [CrossRef]
- Ayoub, M. 100 Years of daylighting: A chronological review of daylight prediction and calculation methods. Sol. Energy 2019, 194, 360–390. [Google Scholar] [CrossRef]
- Deb, K.; Agrawal, S.; Pratap, A.; Meyarivan, T. Agrawal, S.; Pratap, A.; Meyarivan, T. A Fast Elitist Non-dominated Sorting Genetic Algorithm for Multi-objective Optimization: NSGA-II. In Parallel Problem Solving from Nature PPSN VI. PPSN 2000; Lecture Notes in Computer Science; Springer: Berlin/Heidelberg, Germany, 2000; Volume 1917. [Google Scholar] [CrossRef]
- Deb, K.; Pratap, A.; Agarwal, S.; Meyarivan, T. A fast and elitist multiobjective genetic algorithm: NSGA-II. IEEE Trans. Evol. Comput. 2002, 6, 182–197. [Google Scholar] [CrossRef]
- Gagne, J.; Andersen, M. A generative facade design method based on daylighting performance goals. J. Build. Perform. Simul. 2012, 5, 141–154. Available online: https://www.tandfonline.com/doi/abs/10.1080/19401493.2010.549572 (accessed on 1 April 2022). [CrossRef]
- Yahui, W.; Ling, S.; Cai, Z.; Liuqiang, F.; Xiangjie, J. NSGA-II algorithm and application for multi-objective flexible workshop scheduling. J. Algorithms Comput. Technol. 2020, 14, 1748302620942467. [Google Scholar] [CrossRef]
- Subashini, G.; Bhuvaneswari, M. Comparison of multi-objective evolutionary approaches for task scheduling in distributed computing systems. Sadhana 2012, 37, 675–694. [Google Scholar] [CrossRef]
- Yang, X.-S. Multi-objective optimization. In Nature-Inspired Optimization Algorithms; Academic Press: Cambridge, MA, USA, 2014; pp. 197–211. [Google Scholar]
- OuYang, J.; Yang, F.; Yang, S.; Nie, Z. The improved NSGA-II approach. J. Electromagn. Waves Appl. 2008, 22, 163–172. [Google Scholar] [CrossRef]
- Rego, M.F.; Pinto, J.C.E.; Cota, L.P.; Souza, M.J. A mathematical formulation and an NSGA-II algorithm for minimizing the makespan and energy cost under time-of-use electricity price in an unrelated parallel machine scheduling. PeerJ Comput. Sci. 2022, 8, e844. [Google Scholar] [CrossRef]
- Sindhya, K.; Deb, K.; Miettinen, K. A local search based evolutionary multi-objective optimization approach for fast and accurate convergence. Proceedings of 10th International Conference on Parallel Problem Solving from Nature, Dortmund, Germany, 13–17 September 2008; pp. 815–824. [Google Scholar] [CrossRef]
- Seshadri, A. A fast elitist multiobjective genetic algorithm: NSGA-II. MATLAB Cent. 2006, 6, 182–197. [Google Scholar]
- Makki, M.; Showkatbakhsh, M.; Song, Y. Wallacei Primer 2.0. 2019. Available online: https://www.wallacei.com/ (accessed on 1 August 2022).
- USGBC. LEED v4.1 for Building Design and Construction; US Green Buildings Council: Washington, DC, USA, 2019. [Google Scholar]
- Nabil, A.; Mardaljevic, J. Useful daylight illuminances: A replacement for daylight factors. Energy Build. 2006, 38, 905–913. [Google Scholar] [CrossRef]
- Nabil, A.; Mardaljevic, J. Useful daylight illuminance: A new paradigm for assessing daylight in buildings. Light. Res. Technol. 2005, 37, 41–57. [Google Scholar] [CrossRef]
- Solemma-LLC. LEED version 4 Environmental Quality Credit 8. In ClimateStudio Documentation; Solemma LLC: 2020. Available online: https://climatestudiodocs.com/docs/daylightAvailability.html (accessed on 1 March 2022).
- Dutra de Vasconcellos, G. Evaluation of Annual Sunlight Exposure (ASE) as a Proxy to Glare: A Field Study in a NZEB and LEED Certified Office in San Francisco. 2017. Available online: https://escholarship.org/uc/item/3js1z0b8 (accessed on 1 June 2022).
- Pierson, C.; Wienold, J.; Bodart, M. Review of factors influencing discomfort glare perception from daylight. Leukos 2018, 14, 111–148. [Google Scholar] [CrossRef]
- Nazzal, A.A. A new evaluation method for daylight discomfort glare. Int. J. Ind. Ergon. 2005, 35, 295–306. [Google Scholar] [CrossRef]
- Energy-Star. What is Energy Use Intensity? Energy; United Stated Department of Energy Ed.; U.S. Environmental Protection Agency: Washington, DC, USA, 2019. Available online: https://www.energystar.gov/buildings/benchmark/understand_metrics/what_eui (accessed on 1 June 2022).
- BREEAM. BREEAM New Construction, Non Domestic Building; Global BRE: London, UK, 2012; Available online: https://www.breeam.com/wp-content/uploads/sites/3/2019/03/4.-BREEAM_New-Construction-_v1-March-2019.pdf (accessed on 1 January 2022).
- Cruse, A. Improving the Weather: On Architectural Comforts and Climates. In Examining the Environmental Impacts of Materials and Buildings; IGI Global: Pennsylvania, PA, USA, 2020; pp. 251–281. Available online: https://www.igi-global.com/chapter/improving-the-weather/250570 (accessed on 1 December 2021).
- Sorooshnia, E.; Rashidi, M.; Rahnamayiezekavat, P.; Rezaei, F.; Samali, B. Optimum external shading system for counterbalancing glare probability and daylight illuminance in Sydney’s residential buildings. Eng. Constr. Archit. Manag. 2021. [Google Scholar] [CrossRef]


Publisher’s Note: MDPI stays neutral with regard to jurisdictional claims in published maps and institutional affiliations. |
© 2022 by the authors. Licensee MDPI, Basel, Switzerland. This article is an open access article distributed under the terms and conditions of the Creative Commons Attribution (CC BY) license (https://creativecommons.org/licenses/by/4.0/).