Article

Influence of Urban Geometry on Thermal Environment of Urban Street Canyons in Hong Kong

1
Faculty of Architecture, Southwest Jiaotong University, Building and Design Hall, Building 8, West High-Tech Zone, Chengdu 611756, China
2
Faculty of Architecture, The University of Hong Kong, Queen’s Road West 537, Hong Kong
3
BEE Incorporations, Suite 1103A-04, Nanyang 1931 Plaza, 165 Yude Road, Xuhui District, Shanghai 200030, China
4
School of Architecture, Southwest Minzu University, 16 South Fourth Section, First Ring Road, Chengdu 610041, China
*
Author to whom correspondence should be addressed.
Buildings 2022, 12(11), 1836; https://doi.org/10.3390/buildings12111836
Submission received: 28 September 2022 / Revised: 20 October 2022 / Accepted: 27 October 2022 / Published: 1 November 2022
(This article belongs to the Topic Bioclimatic Designs to Enhance Urban/Rural Resilience)

Abstract

:
Hong Kong is a typical high-density city in a subtropical climate region, and deep street canyons are among the main features of its urban planning. How the urban geometry influences the urban thermal environment in this city has become a hot topic these days. The height-to-width ratio (H/W) and sky view factor (SVF) are commonly used to indicate the outdoor thermal environment performance, while previous studies in Hong Kong rarely analysed the importance bias of these two influencing factors systematically in this context. To fill this research gap, in this paper, we chose four typical sites in Hong Kong as research objects. Firstly, we conducted a field investigation to calculate the main influencing factors of urban street geometry (H/W and SVF) and then used field measurements to collect climatic data, including air temperature, wind speed, and relative humidity, and finally used regression to analyse the correlation between H/W, SVF, and temperature. The results indicate the following: (1) There is a greater correlation between H/W and air temperature than between SVF and air temperature by regression analysis, and H/W is more effective at improving the thermal environment within urban street canyons. (2) After field measurements, it was found that H/W at the measurement sites was 0.60 to 6.02, with an average of 2.13. (3) In the study area, H/W of 2.31–2.48 and 3.35–3.60 had a positive correlation with air temperature, and H/W had a dominant influence on outdoor air temperature, and H/W of 2.09–2.31 and H/W > 3.60 was inversely related to air temperature. The conclusions can provide support for urban planning in Hong Kong.

Graphical Abstract

1. Introduction

1.1. Basic Information of Hong Kong

Hong Kong is a coastal city in southern China, connected to Shenzhen to the north and the south China Sea (22°17’ N, 114°09’ E), and has a humid subtropical climate. Summer is the hottest and most humid season, while winter is more comfortable. The summer season usually lasts seven months, from May to November [1]. Therefore, heat and humidity in the summer is the main weather problem in Hong Kong compared to winter weather, as it is more likely to cause heat stress in urban areas. In addition, Hong Kong is also one of the most densely populated cities in the world, with a population density of 7132.25 people per square kilometre [2], and it has become extremely common to have residential spaces on narrow streets of 15–25 metres between approximately 40-to-60-storey buildings (Figure 1) [3]. These conditions have led to the formation of unique street canyons, making it more difficult for air above the street canyon level to pass through deeper canyons. The urban heat environment is currently a hot research topic in Hong Kong, triggered not only by global warming and the urban heat island (UHI) effects but also by epidemics, as the city has been severely hit by COVID-19 since 2020 in response to which the government introduced a mask law requiring people to wear masks when going out on the streets to reduce the number of infections and protect public health (Figure 2). This has undoubtedly also led to a higher demand by the public for a warmer environment on the streets. Therefore, how urban street canyons affect local microclimates and human thermal comfort during the daytime in summer has become a major planning issue in Hong Kong.

1.2. Current Study Situation

Globally, many scholars have studied the thermal environment of urban canyons, comparing it with other parameters such as solar path, building coverage, greenery coverage, and paving materials [6,7,8]. Studies show that the influential urban geometry factors H/W and SVF have a significant impact on the thermal environment, while in Hong Kong, the latest results indicate that current studies are more focused on quantifying and analysing the SVF effect on the thermal environment. Meanwhile, some scholars have conducted research on the urban thermal environment using Google Street View (GSV) images [9], but rarely have they mentioned the effect of H/W on outdoor thermal environment performance. Thus, it is necessary to find the correlation between H/W, SVF, and the thermal environment in order to clearly determine the dependence of the thermal environment of urban street canyons on urban geometry for future urban planning.

1.3. Research Objectives

In order to fill this research gap, we use urban geometry to study the outdoor thermal environment in Hong Kong at the street level and selected H/W and SVF as the study parameters to quantify their impact on the thermal environment and compare them. It is possible to determine which parameter has a greater impact on the thermal environment and, according to the regression result, find correlations between the influencing factors on the urban thermal environment to provide guidance for future urban planning in Hong Kong.

2. Literature Review

2.1. Effect of Urban Street Canyon Design on Thermal Environment

According to current research, many design aspects of urban street canyons, such as H/W and SVF, are noted to have a significant impact on the thermal environment of urban streets [10]. Even though other design factors, such as building coverage, greenery coverage, building and paving materials, and land use, also partly influence outdoor thermal comfort, H/W and SVF are considered to be the main influences on the thermal environment in urban street canyons. A specific analysis of the relationship between H/W and SVF and the urban thermal environment is available in the relevant literature.

2.1.1. H/W

H/W is the ratio between the height of a building (H) and the width of the street between buildings (W) in two-dimensional (2D) form and has a great effect on the amount of incident and outgoing solar radiation and wind distribution within urban street canyons [10,11,12].
Many scholars have conducted studies related to H/W in the tropics. For example, in 2005, Erik Johansson studied the influence of the geometry of the Moroccan city of Fez (33°158’ N, 4°159’ W) on the outdoor thermal environment by comparing the effect of H/W on the microclimate at street level. The results of the study showed that the maximum diurnal temperature difference between the deepest street canyon (H/W ≈ 10) and the shallowest street canyon (H/W = 0.6) was, on average, 6 K in summer and could reach 10 K on the hottest days. The average summer temperatures of deep and shallow street canyons compared to rural sites indicate that the cooling island effect of deep canyons is quite pronounced during hot summer days. Nighttime temperatures are higher in deep canyons than in shallow canyons because there is less open sky in deep canyons. The study also showed that in winter, shaded canyons are more comfortable than deep canyons because there is more solar access during the day [12].
A study was also conducted in the tropical city of Singapore. In this work, the researchers assessed the impact of urban geometry on outdoor thermal comfort (OTC), focusing on a new mixed-use high-rise development in the city. The authors analysed different urban design strategies/scenarios: two block forms, four street orientations (north–south, east–west, north–east–west, north–west–east), four H/W values (from 1.5 to 3.5), and three building height scenarios (height-based building alignment). The study was based on modelling techniques. Their results showed the best OTC levels on H/W of 2.5–3 and a north–south orientation [13].
Another study simulated 36 scenarios in winter and summer for the municipality of Campinas in São Paulo, Brazil, located in the mid-latitude tropics. The simulations included space between buildings, which varied in H/W (avenue, normal, and deep canyons with H/W = 0.5, H/W = 1.0, and H/W > 2.0) and L/H (short, medium, and long canyons with L/H = 3.0, L/H = 5.0, and L/H > 7.0). The results show that canyons with higher H/W values had increased wind speed and shading from buildings, thus affecting pedestrian thermal comfort, especially in summer. In contrast, in winter, increased H/W had no significant effect on thermal comfort at the pedestrian level [14]
Muniz-Gäal et al. showed that, in Campinas, the maximum temperature was 1.0 °C lower in the scenario with a higher correlation between canyon height and width (H/W > 1.0) than in the more open scenario (H/W = 0.4). The increase in H/W led to increased canyon shading and reduced daily comfort variability and peak physiological equivalent temperature (PET) [15].
Studies by Sun et al. in cold regions of China showed that shallow and weak canyons (0.5 < H/W < 1.5) were more favourable in cold climates, with the best streets being near the N–S direction, followed by intermediate directions, while deeper canyons (H/W > 1.5) were not recommended due to the lack of absorption of sunlight [16].

2.1.2. SVF

The SVF concept was first introduced by Oke in 1981 to assess the urban heat island effect [17]. More recently, it has been used as a geometric concept to provide a scale of the visible area of the sky within a street canyon, illustrated by dimensionless values [18]. Previous studies showed that the urban morphology is significantly related to local solar irradiance and air temperature [3], and in describing urban climate and its spatial variability, the skyscape factor (SVF) plays a key role.
SVF was used as the main indicator to assess the impact of urban geometry on air temperature using ENVI-met software for field measurements in the city centre of Curitiba, Brazil, which is in a tropical region. Two dependent variables were assessed in this study: diurnal heat island, defined by the temperature difference between the measurement site and the reference climate station, and ΔMRT-T, calculated from the difference between the measured hourly mean radiation temperature and the ambient air temperature. It shows the correlation between SVF and ΔMRT-T, which is higher than the correlation between SVF and diurnal heat island, with a coefficient of determination (R2) of 0.35, which is higher than 0.10, indicating that the mean radiation temperature is more closely related to SVF than to ambient air temperature [18].
He et al. studied the effects of SVF on outdoor thermal conditions and PET in the Beijing Central Business District (located in Chaoyang District), which has a temperate climate with highly shaded areas in hot summers and long, cold, windy, dry winters. The findings indicated that SVF < 0.3 was typically associated with fewer heat conditions in summer and longer periods of cold discomfort in winter than moderately shaded areas (0.3 < SVF < 0.5) and lightly shaded areas (SVF > 0.5), and vice versa [19].
Although researchers have demonstrated the importance of SVF to the urban thermal environment, there was one exception, a study that was conducted in Kano (12°00’ N, 8°31’ E), the largest city in northern Nigeria, a topical region. The city has an average annual temperature of 30.75 °C, usually receives about 49.8 mm of precipitation, and has 62.99 rainy days per year. The average maximum temperature throughout the year is 36.33 °C, and the minimum temperature reaches 22.52 °C. The researchers found there was little relationship between SVF and temperature distribution. This result implies a generally weak influence of SVF on the temperature in that city. This suggests that other factors, such as wind, cloud cover, proximity to bodies of water, and heat release from human activity, may have a greater influence on the temperature distribution in the region [20].
In addition, SVF has been used as a research parameter when studying the relationship between subtropical high-density urban geometry and urban microclimate. A UHI study was conducted in Hong Kong during the summer months. The results showed that SVF was highly correlated with diurnal UHI, with R2 values of 0.7 and 0.8. The relationship between SVF and intra-urban air temperature differences within the street canyons of Hong Kong during the summer was determined by generating SVF maps of the entire urban environment using ArcGIS-based software. The study noted that SVF analysis is valid for urban microclimate studies in Hong Kong. The study also noted that regional SVF averages are more suitable for quantifying the relationship between urban geometry and intra-urban daytime temperature differences than point SVF values [3]. Regarding SVF measurement, an empirical case study was conducted based on a simulated three-dimensional (3D) urban model of a typical street canyon in Hong Kong. It shows a general trend in the negative effect of SVF on temperature difference, which suggests that smaller SVF values generally lead to higher temperature differences, however, the coefficient of determination is relatively low (R2 = 0.18) [3].

2.1.3. Correlation between H/W, SVF, and Urban Thermal Environment

Past scholarly research has found that in tropical, subtropical, and Mediterranean climates, temperature cooling in summer is more effective as H/W and SVF increase [21,22,23]. This shows that H/W and SVF have an effect on the urban thermal environment at the same time, and which factor is greater for the urban thermal environment was analysed in the literature.
In the tropical climate of Constantine, Algeria, researchers assessed the effect of SVF on microclimate within a street canyon. In this study, the researchers set up seven sites to collect climate data and calculated SVF values and H/W for these sites. The air temperature at these sites directly indicated that lower SVF and higher H/W values led to colder conditions. The results of the study showed that the relationship between air temperature and SVF was lower than expected, with a lower coefficient of determination (R2) based on an entire 24-h period. A higher coefficient of determination between SVF and air temperature was found between 12:00 and 18:00 (R2 = 0.46) [21].
Deevi and Chundeli conducted a study in 2020 using regression of SVF and H/W, and they investigated the factors influencing the outdoor thermal comfort of a street canyon. User-perception surveys and empirical measurements using TESTO 480 and TESTO 870 thermal imagers were carried out at six selected grid points along the 600 m long, 12 m wide Besant Road, a semi-motorised commercial street in Vijayawada, Andhra Pradesh, India. SVF was the predominant physical parameter influencing thermal comfort in existing streets, while H/W slightly influenced the overall comfort condition. It was noted that SVF can be modified more easily than H/W [22].
Another study evaluated the thermal comfort of different spaces in five types of street microclimates in urban and rural Chongqing. The results showed that SVF had a more significant impact on the thermal environment of the streets than H/W. Among the various types of streets, B-N with one open side (SVF = 0.474) had the worst thermal environment, with an average universal thermal climate index (UTCI) of 44.7 °C. The two-sided closed B2-B2 (SVF = 0.052) had a better thermal environment, with an average UTCI of 35.5 °C. The R2 value of 0.88 reflected a greater linear correlation between UTCI and SVF than H/W, with an R2 value of only 0.04 [23].

2.2. Review Conclusion

According to the above findings, the conclusions of the review are summarised as follows:
In terms of climate regions, previous research was mainly conducted in the tropics and in cold climate zones [12,13,16], with very limited research in subtropical areas.
Most of the research showed that SVF has a greater effect on temperature than H/W [19].
Current studies in Hong Kong are mostly focused on the effect of SVF on the urban thermal environment and rarely mention the H/W effect [22,23].

3. Research Methodology

In order to find out the influence of street canyon design factors on the urban thermal environment, several variables had to be collected. Firstly, urban geometry data were collected through field surveys and used primarily to calculate H/W. Secondly, SVF was calculated using ArcGIS-based software. Then, data measurement instruments were used to monitor the open space around the research site, and the data were compared with the Hong Kong Observatory data to verify the accuracy of the instruments. On this basis, fixed-point field measurements were made using the instruments to obtain climate data such as temperature, relative humidity, and wind speed. After obtaining the urban geometry design factor and the thermal environment evaluation index, the correlation between the independent and dependent variables was determined through regression analysis, and the dependence of the urban street canyon thermal environment on urban geometry was indicated by the coefficient of determination (R2) value, while the range of optimal urban geometry data for the Hong Kong region in summer was derived by combining the monitored temperature with the urban geometry data obtained from the research.

3.1. Software Method for Calculating H/W

3.1.1. Calculation

In this step, the height and width of buildings on both sides of the street were measured using models of four site blocks provided by the Government of Hong Kong (HKSAR), as shown in Figure 3.

3.1.2. Validation

We visited four neighbourhoods and selected two main streets and two secondary streets in the study area: Mong Kok Road, Nathan Road, Shanghai Street, and Temple Street. The H/W data of these four streets were measured in the field and compared with the H/W values calculated from the SketchUp model data provided by the Government of Hong Kong. The results of the comparison are shown in Table 1, with an error of ≤0.02. It can therefore be concluded that the H/W calculated from the urban geometry data measured by the SketchUp model is somewhat accurate and can be used as research data.

3.2. GIS-Based Software Method for Calculating SVF

3.2.1. Calculation

In this paper, SVF is regarded as an urban geometry factor to evaluate its effect on the thermal environment. An ArcGIS-based computer program was used to calculate the SVF value of four selected urban areas, which has been proven efficient for calculating SVF in high-rise and high-density subtropical cities such as Hong Kong [8]. In this study, SVF was calculated by the SOLWEIG model [24] based on a shadow-casting algorithm and then imported into ArcGIS to generate the SVF map. The GIS-based software method uses a building database of 3D models and reconstructs the urban environment in the computer’s memory, which is greatly affected by the availability of the building database. It has been widely adopted in recent studies and has the advantage of rapid calculation of continuous SVF, even for large areas [24]. Figure 4a,b show several sky views of the Mong Kok area, illustrating typical street canyons of Hong Kong with limited openness to the sky.

3.2.2. Validation

ArcGIS-based software methods that are currently used in the field of architecture have become more authoritative for computing SVF. The method was validated by Chen et al. as follows: They tested two parameterised models proposed by Oke [3] and calculated SVF by the fisheye lens photo and ArcGIS analysis methods. Then they compared the results between the two methods, which showed that the calculations by both methods were generally satisfactory. They took six photos of areas in Hong Kong with densely built buildings and scarce vegetation and used the fisheye lens calculation method and then ArcGIS to calculate SVF in the same area. The difference between the two results was small (error < 0.05), much smaller than the difference found by Gal et al. The experimental data from Chen show that GIS data analysis has good accuracy and is feasible to use in Hong Kong [3].

3.3. Field Measurement

Most of the current methods used in research on the thermal environment of outdoor streets are software simulations, but we found that simulation experiments could simplify the model, such as simplifying the scale and complexity of the neighbourhood. However, there is no fixed standard for the degree of model simplification within this discipline, and different degrees of simplification will produce different errors in the experimental results, so the resulting parameters will not fully reflect the real situation of the thermal environment. Field measurements and simulations have a sequential relationship and should be used repeatedly to verify problems after they have been identified, so field measurements are essential in this study.

3.3.1. Measurement Method

The equipment used to collect climate data for this study was a TESTO 400 (Figure 5), which measures temperature, relative humidity, and wind speed with an accuracy of ±0.1 °C, ±1.5% RH, and ±0.1 m/s, respectively. The TESTO 400 is ISO certified for use in this research. It is placed in a specified research area during the experiment, and the measurement data are used for subsequent studies.

3.3.2. Validation

The research team placed the TESTO 400 instrument in an open space near the measurement area to collect climate data of temperature, humidity, and wind speed for a period of 24 h on 30 October 2021 ( Table 2). The average values measured by the instrument were compared with the daily averages of the Hong Kong Observatory for the day, and the difference in results were 0.3 °C for temperature, 2% for humidity, and 0.15 m/s for wind speed, which were all within the low margins of error. This demonstrated the accuracy of measurement data from this instrument.

3.4. Analysis Method

Regression analysis, which is a statistical process for estimating the relationship between variables, was used to predict the effects of urban street design factors on the thermal environment. The main independent variables evaluated in this paper were H/W and SVF, and the dependent variable was air temperature. By determining the value of the correlation coefficient (R2), the correlation between the thermal environment inside urban street canyons and the urban geometry design factors (H/W and SVF) could be determined. By comparing the magnitude of the correlation, the urban geometry design factors suitable for the study could be identified, and then the optimum factor for the summer period in the Hong Kong region could be analysed by combining the field measurement data and the actual situation. This was then combined with the field measurement data and the actual conditions in order to analyse the optimal H/W or SVF for the summer period and make recommendations for enhancing the urban outdoor environment in Hong Kong.

4. Case Study

4.1. Information Monitored in the Field

4.1.1. Basic Information of Selected Site

As Hong Kong is a densely packed city, deep street canyons are common, which means that less solar radiation will penetrate into narrow urban streets; however, they will also trap short- and long-wave radiation and reduce turbulent heat loss [25]. Four typical street canyon areas were selected as the target sites in this study to investigate the effect of urban street canyon geometry on urban thermal environment. Sites 1 and 2 are located in Mong Kok, where most buildings are commercial buildings, and sites 3 and 4 are located in Yau Ma Tei, where more buildings are residential. The general locations of the four sites are shown in Figure 6 and Figure 7, and they show their Google Street Views of different streets at the four sites.

4.1.2. Measurement Time, Parameters, and Distribution of Measurement Points (MP)

The fixed field survey was carried out at four street canyons in Mong Kok and Yau Ma Tei. Four sites with a total area of 300 m × 300 m were set up to cover each street in the selected area, with a total of 66 measurement points. The measurement period was 1 to 5 November 2021: site 1 on 1 November, site 2 on 2 November, site 3 on 3 November, and site 4 on 5 November. The measurement factors were temperature, humidity, and wind speed (Table 3). On-site measurement was carried out according to the different sites, with the sampling time of the data logger set at 2 s and the average measurement time for each site set at 5 min. The time interval between two adjacent measurement points was 5 min, and the average of temperature, wind speed, and humidity at each point was calculated as the reference data for this study.
The field measurement point distribution plan is shown in Figure 8. Each street has an average of two measurement points, one or two of which will be placed in the open space to cover the four sites. There were 16 measurement points at site 1, 15 at site 2, 17 at site 3, and 18 at site 4, for a total of 66 measurement points (Figure 8).

4.2. Basic Data Analysis

4.2.1. Calculation Results of H/W

The H/W of each street in the four study sites was calculated, and the values are given in Table 4. Urban street canyons in Hong Kong are usually asymmetrical, with the height of the buildings on either side of the street varying considerably depending on the location of the measurement point. The building heights were averaged over H1 and H2, then H/W was analysed in this paper.
Figure 9a shows the H/W at measurement points of site 1, with maximum and minimum values of 3.82 and 0.74, or a difference of 3.08. Figure 9b shows the H/W at measurement points of site 2, with maximum and minimum values of 6.02 and 1.40, or a difference of 4.62. Figure 9c shows the H/W at measurement points of site 3, with maximum and minimum values of 4.62 and 0.73, or a difference of 3.89. Figure 9d shows the H/W at measurement points of site 4, with maximum and minimum values of 4.96 and 0.60, or a difference of 4.36. The lowest variation of H/W was at site 1, and the highest was at site 2.

4.2.2. Result of SVF Calculation

The SVF maps of the four study sites are shown in Figure 10. The SVF values were calculated by SOLWEIG [24] and then imported into ArcGIS.
The SVF value for each point was calculated by the average value of a 5 m × 5 m rectangle with the measurement point at the centre, because the areal SVF average was proved to be more adequate to quantify the relationship between urban geometry and daytime intra-urban temperature differences than point SVF [3]. The calculated SVF values of study sites are summarised in Table 5.
Figure 11a shows SVF at measurement points of site 1, with maximum and minimum values of 0.6761 and 0.2206, or a difference of 0.4555. Figure 11b shows SVF at measurement points of site 2, with maximum and minimum values of 0.2904 and 0.0925, or a difference of 0.1979. Figure 11c shows SVF at measurement points of site 3, with maximum and minimum values of 0.5913 and 0.2013, or a difference of 0.3900. Figure 11d shows SVF at measurement points of site 4, with maximum and minimum values of 0.5619 and 0.1791, or a difference of 0.3828. The smallest change in SVF was at site 2, and the largest was at site 1.

4.2.3. Result of Field Measurement

Table 3 lists urban climate data, including temperature (T), relative humidity (RH), and wind speed (V), corresponding to the measurement points of every street at the four study sites, along with average values for these parameters.
By collating field measurement data from Table 4, we categorised humidity, temperature, and wind speed into four levels, A, B, C, and D, with temperature ranges of 30–31 °C, 29–30 °C, 28–29 °C, and 27–28 °C; humidity of 72–78%, 66–72%, 60–66%, 54–60%; and wind speed of 1.2–1.6 m/s, 0.8–1.2 m/s, 0.4–0.8 m/s, and 0–0.4 m/s, respectively. Combined with the field measurements, the spatial distribution of temperature, humidity, and wind speed in each urban street canyon is shown in the figures as follows.
The temperature distribution of measurement points at site 1 is shown in Figure 12a. There are seven measurement points at temperature level C and six at level D. Figure 12b shows the temperature distribution of measurement points at site 2, with eleven measurement points at temperature level C and three points at level D. Figure 12c shows that there are eight measurement points at level C and a few at level B and level D. The temperature distribution of measurement points at site 4 shows eleven at level B and three at level C in Figure 12d. Overall, the distribution of temperature level at site 4 is dominated by A, B, and C, with the highest average temperature, while site 2 is dominated by C, with the lowest average temperature.
Figure 13a shows that wind speed at site 1 is mainly at level B, distributed over eight measurement points. Figure 13b shows that there are five measurement points at site 2 with level B wind speed and five at level C. There are two points at site 3 with level A wind speed, five with level B, and five with level C (Figure 13c). There is a maximum of ten measurement points with level C wind speed and three with level B at site 4 (Figure 13d).
As can be seen in Figure 14, there are eight measurement points at site 1 with level B humidity, five with level C, and only one with level D (Figure 14a). Figure 14b shows that there is one measurement point at site 2 with level A humidity, eleven with level B, and two with level C. The distribution at site 3 shows that there are five measurement points with level A humidity and seven with level B (Figure 14c). Figure 14d shows that there are ten measurement points with level C humidity and six with level D at site 4. It can be seen that the overall humidity is higher at site three and lower at site 4.

4.3. Regression Analysis

Table 6 provides a reliable record of the outdoor temperature, wind speed, humidity and the H/W and SVF values at each measurement point, which is used as a data resource for the subsequent calculation of the correlation between H/W and SVF values and temperature respectively, and for comparing the correlation in this study.

4.3.1. Regression between H/W and Temperature

The relationship between air temperature and H/W of the four study sites is shown separately in Figure 15 based on the different climate conditions of the four field measurement periods. Through regression analysis of measurement point data, the linear correlation of air temperature and H/W for each site was generated. All four study sites show that H/W has a negative effect on air temperature (2 m above ground level) within street canyons, with the coefficient of determination (R2) ranging from 0.5232 to 0.5463 (Table 7). Site 2 shows the highest correlation, and site 4 has the relatively lowest correlation between air temperature and H/W. In general, H/W is an efficient parameter to use in evaluating the effect of shading of urban street canyons on the thermal environment.

4.3.2. Regression between SVF and Temperature

The relationship between air temperature and SVF of the four study sites is shown separately in Figure 16. Through regression analysis of measurement point data, the linear correlation of air temperature and SVF for each site was generated. Regression equations of all four sites show a slightly positive effect of SVF on air temperature, which means that air temperature increases with increased SVF (Figure 16). However, the correlation of SVF and air temperature is quite low, with the relatively highest determination coefficient (R2) of 0.2120 for site 2 and the relatively lowest R2 of 0.0523 for site 1 (Table 8). Compared with the correlation of air temperature and H/W, SVF has a relatively weaker effect on temperature.
By combining the graph of the relationship between point measurement temperature and H/W (Figure 17), it can be seen that outdoor temperature and H/W are not exactly linearly correlated. When H/W = 2.31, the outdoor temperature reaches a minimum of 27.38 °C, and when H/W = 2.54, the outdoor temperature reaches a maximum of 30.14 °C.
The research period was the summer season in Hong Kong. Due to the high population density and high summer temperature in Hong Kong, it is appropriate to reduce the outdoor temperature. Combining the analyses, H/W of 2.09–2.48 and H/W > 3.6 are the most suitable values for Hong Kong in summer (Figure 17).

5. Conclusions and Further Study

This paper investigates the relevance of the urban street canyon thermal environment to urban geometry factors and the extent to which different urban geometry factors affect the microclimate of urban streets in a subtropical, high-density city, Hong Kong. Field measurements were conducted in early November 2021 to obtain climate data, including temperature, wind speed, and relative humidity, for urban street canyons located in Mong Kok and Yau Ma Tei. Through a review of the literature, it was obtained that H/W and SVF are the main factors influencing urban street geometry, leading to the following conclusions.

5.1. Conclusions

The regression analysis showed a negative correlation between H/W and daytime air temperature at the four sites, with a mean coefficient of determination (R2) of 0.5347. SVF can also be used to indicate the level of shading within street canyons, which showed a positive correlation with air temperature during the measurement period. However, the correlation between SVF and air temperature is low, with a mean R2 of 0.1141, which is much lower than the correlation between H/W and air temperature. In summary, H/W has a greater effect on the thermal environment than SVF, which also suggests that H/W is a more effective parameter for urban planners to use in improving the thermal environment within urban street canyons and thermal comfort at the pedestrian level.
The field research sites are located in typical high-density neighbourhoods in Hong Kong; combining H/W obtained from the field survey, it can be seen that H/W varies greatly between areas due to differences in functional organisation and road levels; the lowest H/W was 0.60, and the highest was 6.02, giving a variance of 5.42. Further analysis of the data showed that H/W in this typical area lies between 0.60 and 6.02, with an average of 2.13.
Combining the graph of the relationship between point measurement temperature and H/W, it can be seen that outdoor temperature and H/W are not exactly linearly correlated, with the outdoor temperature reaching a minimum of 27.38 °C with H/W of 2.31 and a maximum of 30.14 °C with H/W of 2.54. Combining the analysis of the graphs, it can be seen that outdoor temperature is lower with H/W values of 2.31–2.48 and 3.35–3.60, and the temperature rises as H/W increases. The reason for this phenomenon is presumably because, within this range, H/W is the dominant factor affecting the outdoor air temperature in the city, so the temperature rises at the same time H/W increases. When H/W is 2.09–2.31 and H/W > 3.60, the outdoor air temperature is low and tends to decrease. It is assumed that within this H/W range, building shading is the dominant factor, and as building heights rise, solar radiation received by the street decreases throughout the day due to the mutual shading of buildings, and the temperature tends to decrease gradually.

5.2. Further Research

Our further research should focus on studying a single variable factor of the effect of street H/W on the thermal environment under typical summer conditions in Hong Kong. Field measurements should be carried out during the hot summer months, and climate data should be collected from each measurement point simultaneously as much as possible to control for variables. In addition, different weather conditions, such as sunny and cloudy, can also have an effect on temperature, which also needs to be considered. In addition to urban geometry, other factors such as greenery, building materials, road albedo, and anthropogenic heat can have different effects on the thermal environment, which also need to be studied and analysed in further work.

Author Contributions

Conceptualization and methodology, S.Z. and X.M.; investigation, S.Z., M.C. and S.L.; data curation and writing—review and editing, M.C. and S.L.; software, S.Z. and S.L.; supervision, X.M. All authors have read and agreed to the published version of the manuscript.

Funding

This research was funded by the Sichuan Provincial Youth Scientific and Technological Innovation Research Team on Ecological Adaptability of Plateau Architecture, grant number 2022JDTD0008.

Institutional Review Board Statement

Not applicable.

Informed Consent Statement

Not applicable.

Data Availability Statement

Not applicable.

Conflicts of Interest

The authors declare no conflict of interest.

References

  1. Climate of Hong Kong. Available online: https://www.hko.gov.hk/en/cis/climahk.htm (accessed on 12 October 2022).
  2. Hong Kong Population 2022 (Demographics, Maps, Graphs). Available online: https://worldpopulationreview.com/countries/hong-kong-population (accessed on 12 October 2022).
  3. Chen, L.; Ng, E.; An, X.; Ren, C.; Lee, M.; Wang, U.; He, Z. Sky View Factor Analysis of Street Canyons and Its Implications for Daytime Intra-Urban Air Temperature Differentials in High-Rise, High-Density Urban Areas of Hong Kong: A GIS-Based Simulation Approach: GIS-BASED SVF ANALYSIS AND APPLICATION IN HONG KONG. Int. J. Climatol. 2012, 32, 121–136. [Google Scholar] [CrossRef]
  4. World’s Greatest Urban Hike—Hong Kong Island. Available online: https://asiabooksandtravel.com/greatest-urban-hike-hong-kong/ (accessed on 12 October 2022).
  5. Hong Kong Considers Reopening Borders with 11 Countries. Available online: https://www.traveloffpath.com/hong-kong-considering-reopening-borders-with-11-countries/ (accessed on 12 October 2022).
  6. Gong, F.-Y.; Zeng, Z.-C.; Zhang, F.; Li, X.; Ng, E.; Norford, L.K. Mapping Sky, Tree, and Building View Factors of Street Canyons in a High-Density Urban Environment. Build. Environ. 2018, 134, 155–167. [Google Scholar] [CrossRef]
  7. Chatzipoulka, C.; Compagnon, R.; Nikolopoulou, M. Urban Geometry and Solar Availability on Façades and Ground of Real Urban Forms: Using London as a Case Study. Sol. Energy 2016, 138, 53–66. [Google Scholar] [CrossRef] [Green Version]
  8. Han, D.; Zhang, T.; Qin, Y.; Tan, Y.; Liu, J. A Comparative Review on the Mitigation Strategies of Urban Heat Island (UHI): A Pathway for Sustainable Urban Development. Clim. Dev. 2022, 1–25. [Google Scholar] [CrossRef]
  9. Gong, F.-Y.; Zeng, Z.-C.; Ng, E.; Norford, L.K. Spatiotemporal Patterns of Street-Level Solar Radiation Estimated Using Google Street View in a High-Density Urban Environment. Build. Environ. 2019, 148, 547–566. [Google Scholar] [CrossRef]
  10. Ali-Toudert, F.; Mayer, H. Thermal Comfort in an East–West Oriented Street Canyon in Freiburg (Germany) under Hot Summer Conditions. Theor. Appl. Climatol. 2007, 87, 223–237. [Google Scholar] [CrossRef]
  11. Emmanuel, R.; Johansson, E. Influence of Urban Morphology and Sea Breeze on Hot Humid Microclimate: The Case of Colombo, Sri Lanka. Clim. Res. Clim. RES 2006, 30, 189–200. [Google Scholar] [CrossRef] [Green Version]
  12. Johansson, E. Influence of Urban Geometry on Outdoor Thermal Comfort in a Hot Dry Climate: A Study in Fez, Morocco. Build. Environ. 2006, 41, 1326–1338. [Google Scholar] [CrossRef]
  13. Acero, J.A.; Koh, E.J.Y.; Ruefenacht, L.A.; Norford, L.K. Modelling the Influence of High-Rise Urban Geometry on Outdoor Thermal Comfort in Singapore. Urban Clim. 2021, 36, 100775. [Google Scholar] [CrossRef]
  14. Muniz-Gäal, L.P.; Pezzuto, C.C.; de Carvalho, M.F.H.; Mota, L.T.M. Urban Geometry and the Microclimate of Street Canyons in Tropical Climate. Build. Environ. 2020, 169, 106547. [Google Scholar] [CrossRef]
  15. Muniz-Gäal, L.P.; Pezzuto, C.C.; de Carvalho, M.F.H.; Mota, L.T.M. Urban Legislation and Thermal Comfort in Urban Street Canyons: A Case Study in Campinas. Ambiente Construído 2018, 18, 177–196. [Google Scholar] [CrossRef] [Green Version]
  16. Sun, C.; Lian, W.; Liu, L.; Dong, Q.; Han, Y. The Impact of Street Geometry on Outdoor Thermal Comfort within Three Different Urban Forms in Severe Cold Region of China. Build. Environ. 2022, 222, 109342. [Google Scholar] [CrossRef]
  17. Oke, T.R. Canyon Geometry and the Nocturnal Urban Heat Island: Comparison of Scale Model and Field Observations. J. Climatol. 1981, 1, 237–254. [Google Scholar] [CrossRef]
  18. Krüger, E.L.; Minella, F.O.; Rasia, F. Impact of Urban Geometry on Outdoor Thermal Comfort and Air Quality from Field Measurements in Curitiba, Brazil. Build. Environ. 2011, 46, 621–634. [Google Scholar] [CrossRef]
  19. He, X.; Miao, S.; Shen, S.; Li, J.; Zhang, B.; Zhang, Z.; Chen, X. Influence of Sky View Factor on Outdoor Thermal Environment and Physiological Equivalent Temperature. Int. J. Biometeorol. 2015, 59, 285–297. [Google Scholar] [CrossRef]
  20. Ibrahim, A.A.; Nduka, I.; Iguisi, E.O.; Ati, O. An Assessement of the Impact of Sky View Factor (SVF) on the Micro-Climate of Urban Kano. Aust. J. Basic Appl. Ldots 2011, 5, 81–85. [Google Scholar]
  21. Bourbia, F.; Boucheriba, F. Impact of Street Design on Urban Microclimate for Semi Arid Climate (Constantine). Renew. Energy 2010, 35, 343–347. [Google Scholar] [CrossRef]
  22. Deevi, B.; Chundeli, F.A. Quantitative Outdoor Thermal Comfort Assessment of Street: A Case in a Warm and Humid Climate of India. Urban Clim. 2020, 34, 100718. [Google Scholar] [CrossRef]
  23. Xiong, K.; Yang, Z.; Cheng, C. Microclimate Environmental Assessment and Impact of Mountain City Pedestrian Streets in Summer. E3S Web Conf. 2020, 172, 11001. [Google Scholar] [CrossRef]
  24. Lindberg, F.; Holmer, B.; Thorsson, S. SOLWEIG 1.0—Modelling Spatial Variations of 3D Radiant Fluxes and Mean Radiant Temperature in Complex Urban Settings. Int. J. Biometeorol. 2008, 52, 697–713. [Google Scholar] [CrossRef]
  25. Pearlmutter, D.; Berliner, P.; Shaviv, E. Integrated Modeling of Pedestrian Energy Exchange and Thermal Comfort in Urban Street Canyons. Build. Environ. 2007, 42, 2396–2409. [Google Scholar] [CrossRef]
Figure 1. High-density high-rise buildings in Hong Kong [4].
Buildings 12 01836 g001
Figure 2. People walking in Central District of Hong Kong wearing masks for protection against COVID-19 [5].
Buildings 12 01836 g002
Figure 3. SketchUp models of four site blocks. (a) SketchUp models of site 1 block. (b) SketchUp models of site 2 block. (c) SketchUp models of site 3 block. (d) SketchUp models of site 4 block.
Buildings 12 01836 g003
Figure 4. (a,b) Two sky views in typical street canyons of Mong Kok.
Buildings 12 01836 g004
Figure 5. TESTO 400.
Buildings 12 01836 g005
Figure 6. Location of four study sites.
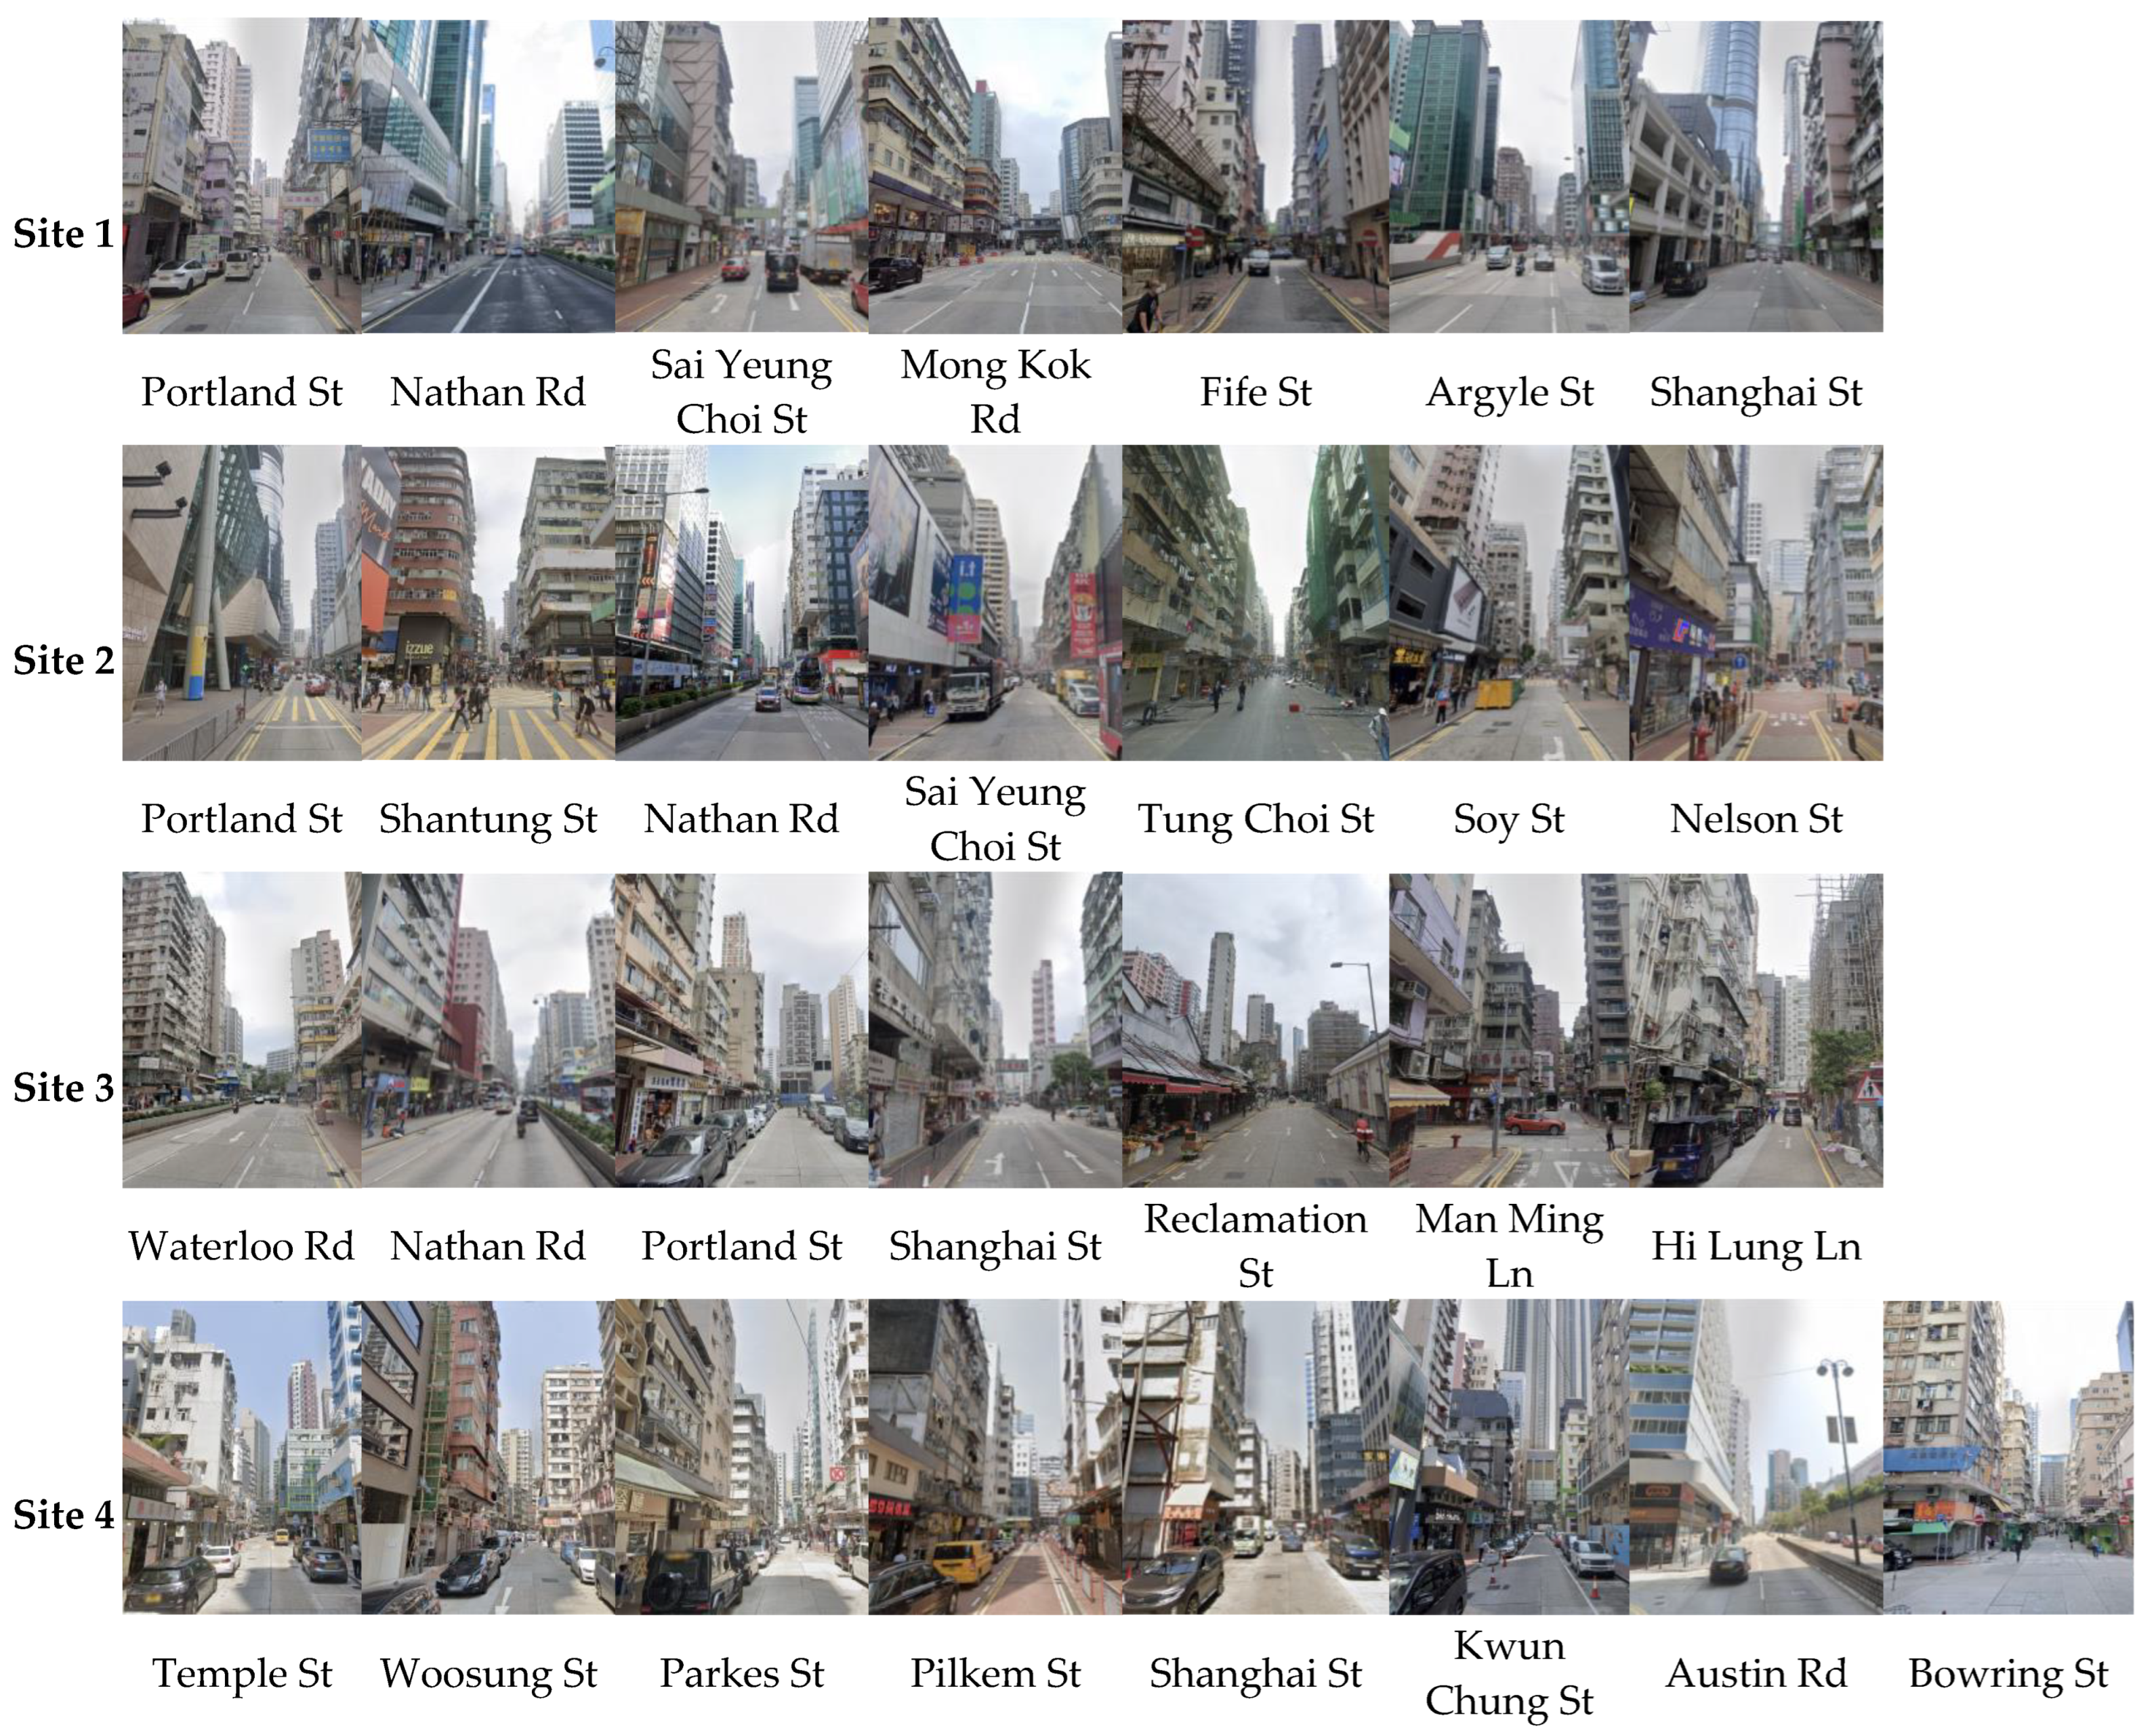
Buildings 12 01836 g006
Figure 7. Realistic views of streets in different sites.
Buildings 12 01836 g007
Figure 8. Plan of measurement points of different sites. (a) Plan of measurement points of site 1. (b) Plan of measurement points of site 2. (c) Plan of measurement points of site 3. (d) Plan of measurement points of site 4.
Buildings 12 01836 g008aBuildings 12 01836 g008b
Figure 9. H/W values at measurement points of different sites. (a) H/W values at measurement points of site 1. (b) H/W values at measurement points of site 2. (c) H/W values at measurement points of site 3. (d) H/W values at measurement points of site 4.
Buildings 12 01836 g009
Figure 10. SVF maps of different sites. (a) SVF maps of site 1. (b) SVF maps of site 2. (c) SVF maps of site 3. (d) SVF maps of site 4.
Buildings 12 01836 g010aBuildings 12 01836 g010b
Figure 11. SVF at measurement points of different sites. (a) SVF at measurement points of site 1. (b) SVF at measurement points of site 2. (c) SVF at measurement points of site 3. (d) SVF at measurement points of site 4.
Buildings 12 01836 g011aBuildings 12 01836 g011b
Figure 12. Temperature distribution of measurement points at different sites. (a) Temperature distribution of measurement points at site 1 on 1 November 2021. (b) Temperature distribution of measurement points at site 2 on 2 November 2021. (c) Temperature distribution of measurement points at site 3 on 3 November 2021. (d) Temperature distribution of measurement points at site 4 on 5 November 2021.
Buildings 12 01836 g012aBuildings 12 01836 g012b
Figure 13. Wind speed distribution of measurement points at different sites. (a) Wind speed distribution of measurement points at site 1 on 1 November 2021. (b) Wind speed distribution of measurement points at site 2 on 2 November 2021. (c) Wind speed distribution of measurement points at site 3 on 3 November 2021. (d) Wind speed distribution of measurement points at site 4 on 5 November 2021.
Buildings 12 01836 g013
Figure 14. Humidity distribution of measurement points in different sites. (a) Humidity distribution of measurement points in site 1 on 1 November 2021. (b) Humidity distribution of measurement points in site 2 on 2 November 2021. (c) Humidity distribution of measurement points in site 3 on 3 November 2021. (d) Humidity distribution of measurement points in site 4 on 5 November 2021.
Buildings 12 01836 g014
Figure 15. Relationship between air temperature (2 m above ground) and H/W of different sites. (a) Relationship between air temperature (2 m above ground) and H/W of site 1. (b) Relationship between air temperature (2 m above ground) and H/W of site 2. (c) Relationship between air temperature (2 m above ground) and H/W of site 3. (d) Relationship between air temperature (2 m above ground) and H/W of site 4.
Buildings 12 01836 g015
Figure 16. Relationship between air temperature (2 m above ground) and SVF at different sites. (a) Relationship between air temperature (2 m above ground) and SVF at site 1. (b) Relationship between air temperature (2 m above ground) and SVF at site 2. (c) Relationship between air temperature (2 m above ground) and SVF at site 3. (d) Relationship between air temperature (2 m above ground) and SVF at site 4.
Buildings 12 01836 g016
Figure 17. Summary of SVF and temperature correlation at each site.
Buildings 12 01836 g017
Table 1. Comparison of H/W by field measurement and SketchUp model measurement.
Measurement MethodMong Kok RdNathan RdShanghai StTemple St
H/W field measurement0.732.551.451.38
SketchUp model with H/W measurement0.722.541.451.39
Table 2. Statistics on measurement, weather station, and error data.
DataDateMeasurement PeriodTemperature (°C)Humidity
(%)
Wind Speed (m/s)
Hong Kong Observatory30 October 202100:00–00:00 (24 h)24.3753.25
On-site measurement30 October 202100:00–00:00 (24 h)24733.40
Data error30 October 202100:00–00:00 (24 h)0.320.15
Table 3. Measurement parameters.
DateStudy SiteMeasurement PeriodMeasurement Parameters
1 November 2021113:00–15:30TemperatureHumidityWind speed
2 November 2021213:00–15:25
3 November 2021313:00–15:45
5 November 2021413:00–15:50
Table 4. H/W of urban streets at four study sites.
Site No.Street NamePointsBuilding Height (m)Street Width (m)H/W
Left (H1)Right (H2)
1Portland StP841.6023.1015.482.09
P1043.6055.403.20
Nathan RdP1245.2070.8030.631.89
P1648.1069.101.91
Sai Yeung Choi St SouthP1132.4033.2018.001.82
P1467.6054.403.39
Mong Kok RdP339.405.0030.410.73
P921.2023.800.74
Fife StP520.9028.7011.062.24
P1316.8067.703.82
Argyle StP757.4053.0030.601.80
P1569.1072.102.31
Shanghai StP428.7081.4019.762.79
P623.7020.101.11
2Portland StP1182.0015.0015.513.13
P1327.6021.601.59
Shantung StP613.2031.7015.861.42
P1215.6063.002.48
Nathan RdP885.3071.1030.632.55
P985.1080.102.70
Sai Yeung Choi St SouthP517.6037.0018.391.48
P785.3026.603.04
Tung Choi StP224.3029.9018.261.48
P321.7029.401.40
Soy StP437.1071.0016.583.26
P1485.1026.003.35
Nelson StP130.6023.1012.082.22
P1074.4071.106.02
3Waterloo RdP678.3024.1030.551.68
P1742.7033.001.24
Nathan RdP1539.6046.3030.591.40
P1618.3045.101.04
Portland St P530.0053.0015.712.64
P7120.1025.004.62
Shanghai StP323.1029.8018.221.45
P1134.1030.301.77
Reclamation StP143.7023.4015.942.10
P124.0019.400.73
Man Ming LnP108.1015.709.191.29
Hi Lung LnP1422.0020.909.212.33
4Temple StP513.0021.2012.421.38
P1453.106.902.42
Woosung StP621.2015.1012.461.46
P1350.8072.704.96
Parkes StP828.0013.0015.641.31
P1133.906.902.54
Pilkem StP918.8014.1015.921.03
P107.0012.200.60
Shanghai StP362.4020.4015.432.68
P1628.803.801.06
Kwun Chung StP217.1010.1012.551.08
P1713.1019.801.31
Austin RdP1248.3010.0025.591.14
P1544.3097.802.78
Bowring StP451.6062.1015.803.60
P726.0031.601.82
Table 5. SVF values of urban streets at four study sites.
Site No.Urban SpaceStreet NameMPSVF
1Street canyonPortland StP80.2206
P100.2868
Nathan RdP120.4157
P160.2490
Sai Yeung Choi St SouthP110.2394
P140.2608
Mong Kok RdP30.6761
P90.3408
Fife StP50.3648
P130.2936
Argyle StP70.5236
P150.3535
Shanghai StP40.2901
P60.3252
2Street canyonPortland StP110.1926
P130.2092
Shantung StP60.2708
P120.2201
Nathan RdP80.2243
P90.2810
Sai Yeung Choi St SouthP50.1989
P70.1754
Tung Choi StP20.2646
P30.2412
Soy StP40.2600
P140.2904
Nelson StP10.1823
P100.0925
3Street canyonWaterloo RdP60.3240
P170.3424
Nathan RdP150.3139
P160.4821
Portland St P50.3926
P70.2013
Shanghai StP30.3034
P110.2468
Reclamation StP10.3775
P120.5913
Man Ming LnP100.3463
Hi Lung LnP140.3821
4Street canyonTemple StP50.2457
P140.1791
Woosung StP60.2064
P130.1905
Parkes StP80.2948
P110.2321
Pilkem StP90.2345
P100.2441
Shanghai StP30.2590
P160.1881
Kwun Chung StP20.3764
P170.2699
Austin RdP120.5619
P150.2321
Bowring StP40.3175
P70.2777
Table 6. Summary of thermal environmental parameter and SVF and H/W.
Site NO.Urban SpaceNameMPH/WSVFTa (°C)RH (%)V (m/s)
1Street canyonPortland StP82.090.220628.4464.300.22
P103.200.286827.8266.590.81
Nathan RdP121.890.415728.8964.011.03
P161.910.249028.8363.730.85
Sai Yeung Choi St SouthP111.820.239428.2467.640.58
P143.390.260828.0266.530.67
Mong Kok RdP30.730.676128.8765.640.85
P90.740.340829.0763.911.00
Fife StP52.240.364827.9866.660.96
P133.820.293627.8068.070.98
Argyle StP71.800.523627.9967.750.94
P152.310.353527.3869.411.20
Shanghai StP42.790.290127.7966.730.71
P61.110.325228.7065.020.59
2Street canyonPortland StP113.130.192628.1371.440.54
P131.590.209228.5468.400.99
Shantung StP61.420.270828.3868.151.01
P122.480.220128.3670.611.07
Nathan RdP82.550.224328.7467.510.83
P92.700.281028.9369.140.61
Sai Yeung Choi St SouthP51.480.198928.5465.530.41
P73.040.175427.8065.220.38
Tung Choi StP21.480.264628.4669.620.35
P31.400.241228.5769.030.31
Soy StP43.260.260027.5169.790.99
P143.350.290428.0771.580.77
Nelson StP12.220.182328.3968.180.64
P106.020.092527.4072.150.85
3Street canyonWaterloo RdP61.680.324028.1473.431.06
P171.240.342428.6572.330.78
Nathan RdP151.400.313928.8870.810.82
P161.040.482129.0070.800.91
Portland StP52.640.392628.4671.690.94
P74.620.201327.4575.871.56
Shanghai StP31.450.303428.4170.910.74
P111.770.246828.2871.920.43
Reclamation StP12.100.377527.9271.651.56
P120.730.591328.4072.060.74
Man Ming LnP101.290.346329.2671.310.97
Hi Lung LnP142.330.382128.0774.300.43
4Street canyonTemple StP51.380.245729.4261.810.72
P142.420.179128.4961.241.45
Woosung StP61.460.206429.1462.961.02
P134.960.190527.7563.540.75
Parkes StP81.310.294829.2361.800.49
P112.540.232130.1459.680.65
Pilkem StP91.030.234529.4760.010.75
P100.600.244129.9558.610.72
Shanghai StP32.680.259028.5164.761.13
P161.060.188129.6055.020.72
Kwun Chung StP21.080.376429.3562.480.97
P171.310.269929.4756.400.40
Austin RdP121.140.561929.7358.711.22
P152.780.232129.5557.800.67
Bowring StP43.600.317528.7664.450.51
P71.820.277729.2264.501.26
Table 7. Summary of H/W and temperature correlation at each site.
Site No.Regression EquationR2α (%)
1ΔT = −0.4125 × H/W + 29.1520.53655
2ΔT = −0.2639 × H/W + 28.9540.53265
3ΔT = −0.3583 × H/W + 29.0760.54635
4ΔT = −0.3807 × H/W + 29.9780.52325
Table 8. Summary of SVF and temperature correlation at each measurement point.
Site No.Regression EquationR2α (%)
1ΔT = 0.9695 × SVF + 27.9380.05235
2ΔT = 3.8822 × SVF + 27.4120.21205
3ΔT = 1.6861 × SVF + 27.8050.12065
4ΔT = 1.7361 × SVF + 28.7690.07165
Publisher’s Note: MDPI stays neutral with regard to jurisdictional claims in published maps and institutional affiliations.

