Abstract
Plants have the potential to reduce CO2 concentration, but their photosynthesis is directly influenced by the indoor lighting environment. As a result, the efficiency of indoor plants is limited by indoor lighting environment. In order to explore the effect of lighting environments on the reduction of indoor CO2 concentration by indoor plants, three representative lighting environments were constructed, including a natural lighting environment, a poor lighting environment and an all-day lighting environment, while five common plants were selected to be planted in five transparent sealed chambers. Experimental results show that the lighting environment affected the CO2 concentration largely in transparent sealed chambers. Compared to the transparent sealed chamber without plants, the highest and average CO2 concentrations were increased by from 47.9% to 160.9% and from 21.6% to 132.4% in the poor lighting environment, respectively, while they decreased by from 60.4% to 84.6% and from 71.4% to 89.7% in the all-day lighting environment. This indicated that plants did not purify the indoor air consistently. Among the selected plants, the most suitable houseplant was Scindapsus aureus, followed by Chlorophytum comosum and Bambusa multiplex.
1. Introduction
With the accelerated progress of urbanization, high-density buildings have become the theme of urban development due to the large amount of solar radiation absorbed by the reinforced concrete and asphalt that make up the urban surface [1,2], which brings serious environmental problems to cities. Serious environmental pollution and poor air quality are faced by humans globally, and due to the occupants’ breath and the building tightness, the pollutant concentration in an indoor environment is 2–4 times higher than that in an outdoor environment [3], especially for CO2 concentrations. Although CO2 is commonly considered non-toxic, excessive CO2 concentrations have been associated with sick building syndrome due to its narcotic effect [4]. Since urban residents spend about 80–90% of their time indoors [5], lowering the CO2 concentration has become important [6,7]. Studies have proved that elevated CO2 concentrations in office buildings are associated with the increased disease symptoms of workers [8] and that student academic performance and workplace productivity decrease with increasing CO2 levels [9,10].
With the continuous improvement of people’s living standards, people’s demand for life quality has increased, and introducing green plants indoors is one of the most convenient and effective ways to contact the natural environment [11,12]. Green plants have the potential to reduce indoor CO2 concentration, relieve anxiety, and gain additional benefits [13] for the physical and psychological health of building occupants [14]. High CO2 concentration and low relative humidity are common in buildings, which can be controlled by mechanical ventilation systems, but this is more costly as well as energy-consuming [14]. Green plants can absorb CO2 and release O2 simultaneously through photosynthesis, to reduce the CO2 concentration and thereby lower indoor air pollution naturally and sustainably [15]. In addition, the photosynthesis of green plants produces negative air ions, which are beneficial to people’s health [16,17]. Through a restorative effect, plants can act as a kind of biological filter to purify the air [18,19], so fresh air volume could be reduced appropriately in enclosed rooms with air-conditioning and heating under this conditioning, and therefore, due to the fresh air, the energy consumption can be certainly lowered in the air-conditioning and heating system [3]. Therefore, introducing green plants indoors is one of the most effective, convenient, economical and environmentally friendly methods of indoor air purification [20,21,22].
The CO2 concentration is a key parameter in determining the amount of fresh air, which indirectly affects the energy consumption of air-conditioning and heating [3]. Some studies have shown that indoor green plants can reduce ventilation requirements and reduce CO2 concentration [23,24]. Torpy et al. [25] analyzed the CO2 removal potential of eight common plants, and their results showed that plant types had an impact on photosynthetic capacity due to indoor light level and CO2 removal rate. Only when indoor light level was higher than a certain value were the higher increases in CO2 removal detected. Moreover, the absorption capacity of CO2 could be optimized by appropriately increasing the light. Tudiwer et al. [26] showed that the CO2 concentration in classrooms with plant systems decreased 3.5% faster than that in classrooms without plants for the same initial concentration of indoor CO2. Oh et al. [27] created an ideal room with an initial CO2 concentration of 1000 ppm and a real room with an initial CO2 concentration of 35–450 ppm with hamsters to comparatively analyze the CO2 absorbing ability of plants. Their results showed that the plants with the larger leaf area had a higher CO2 removal efficiency, and in real spaces, the CO2 concentration will gradually increase as occupants enter the room, so the CO2 absorption effect of indoor plants will be better under this condition. Vahdati et al. [28] showed that increasing CO2 concentration was an effective method to reduce in-vitro water loss during the in-vitro culture of walnuts, because exposing the leaves of in-vitro-grown plants to increased CO2 concentration was found to produce more small-sized stomata and fewer large-sized stomata, and the change in stomatal shape can improve the resistance of plants to in-vitro drying and reduce water loss in the first stage. In addition, Mutebi [29] indicated that the photosynthetic carbon sink of mulberry trees was greater than the total carbon emission and has a greenhouse gas mitigation effect.
These studies effectively demonstrated the effect of landscape plants on indoor CO2 removal, and the light level was a key factor in plant photosynthesis. Most plants had reduced photosynthesis rates in low-light or dark conditions indoors. Plants had different photosynthesis rates under different lighting environments, and within a certain range, the higher the light intensity, the higher the net photosynthesis rate, and therefore the higher the CO2 uptake rate [30].
Based on the above review, the effect of the lighting environment on indoor CO2 concentration was analyzed. Three representative lighting environments were built, including a natural lighting environment, a poor lighting environment and an all-day lighting environment, while five common plants were selected to be planted in five transparent sealed chambers, respectively. The CO2 concentrations in the five transparent sealed chambers with plants were monitored by using one sealed chamber without plants as a reference.
2. Description of Experimental System
2.1. Experimental Plants
To explore the effect of different plant species on indoor CO2 concentration and, therefore, to find suitable plants for indoor cultivation, five common plants are selected, by taking into account the cultivation status of domestic indoor plants. Five common plants are Scindapsus aureus, Chlorophytum comosum, Bambusa multiplex, Neottopteris nidus and Schlumbergera truncate, which belong to the genera of Araceae, Liliaceae, Poaceae, Aspleniaceae Newman and Cactaceae. The five plants were of similar height and shape, and the substrate was the same. The experiments were carried out from April 2021 to October 2021.
2.2. Experimental Chambers and Measurement Methods
In order to facilitate the measurement of CO2 concentration, six identical transparent sealed chambers were designed in the experiment and their size was 500 mm (length) × 500 mm (width) × 600 mm (height). A transparent, 120 mm-thick solar hollow plate was chosen as the chamber wall. All chambers were sealed with glass glue and silicone rubber, and their tightness was ensured before the experiment. To reduce the interference of air penetration with the experimental data, only the top of the chamber could be temporarily opened and closed. The instrument used for measuring CO2 concentration in this experiment was iBEM intelligent building indoor environment monitor, which had a CO2 concentration test range of 400–5000 ppm and test accuracy of ±5%.
2.3. Experimental Lighting Environments
This study focused on the effect of plant types on indoor CO2 concentration under different lighting environments, so three representative lighting environments were built, as shown in Figure 1.
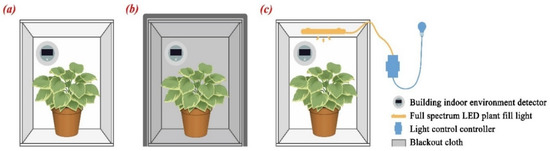
Figure 1.
Experimental diagram of three different indoor lighting environments: (a) natural lighting environment (b) poor lighting environment and (c) all-day lighting environment.
- Natural lighting environment: Plants were placed in favorable locations indoors and could make the maximum use of natural lighting indoors. In a day, there were about 9 h of natural light, as shown in Figure 1a.
- Poor lighting environment: Plants were placed indoors in relatively shady locations with lower natural lighting. Additionally, to unify the poor lighting environment, plants were shaded for 22 h and the lighting duration was only provided for 2 h in a day, as shown in Figure 1b.
- All-day lighting environment: Plants were illuminated indoors with alternating natural lighting and supplemental lighting. When the lighting illumination was lower than 100 Lx, a full-spectrum LED imitation sunlight plant supplemental light was opened to supplement the plants automatically, as shown in Figure 1c. Under this environment, the light illumination was always higher than 100 Lx in a day.
The full-spectrum LED mimicking sunlight with a wavelength of 450–800 nm, balancing red and blue light, was employed, while the plant illumination was intelligently controlled using an OKELE rail-light control controller at no less than 100 Lx. The light wavelengths (400–500 nm and 600–700 nm) met the nutritional requirements of plants [27].
2.4. Experimental Procedure
In this study, air temperature and relative humidity were controlled within the range of 23 ± 2 °C and 40 ± 10%, respectively. The five plants were put into the chamber, which was sealed at 8 a.m. An unplanted chamber was also used as a reference, as shown in Figure 2, with natural light coming mainly from the south-facing windows.
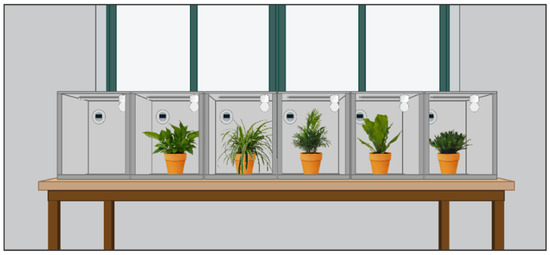
Figure 2.
Experimental site layout.
In addition, there were three experimental cases based on different lighting environments:
- Natural lighting environment: Plants could photosynthesize indoors in the natural lighting environment in the period of 8:00–17:00 (about 9 h/day), and in the other period, all chambers were shaded by the blackout cloth.
- Poor lighting environment: Plants could photosynthesize indoors in the natural lighting environment in the period of 9:30–11:30 (about 2 h/day), and in the other period, all chambers were shaded by the blackout cloth.
- All-day lighting environment: The natural lighting and full-spectrum LED were both employed to create the all-day illumination higher than 100 Lx.
3. Experimental Results and Discussion
At the beginning of the experiment, the CO2 concentration in each chamber was fundamentally the same, and all chambers were completely sealed during the experiment. Thus, the variability of CO2 concentration in the chamber could be identified due to photosynthesis and the respiration of the plant.
3.1. Effect of Lighting Environments on Plant Growth
A suitable lighting environment is essential for plant growth, and plants use photosynthesis to provide energy for their growth, so photosynthesis is closely related to plant growth. Table 1 shows the side and top photos of the growth states of the five plants before and after the experiment (30 days) in the three lighting environments. It can be seen that, regardless of whether the light duration was 2 h/day or 24 h/day, none of the five plants showed any visually observable difference in growth status before and after the experiment, nor did they show any obvious signs of death. This indicated that three lighting environments selected for this experiment did not negatively affect the growth of indoor plants visible to the naked eye for a short period of time.

Table 1.
Comparison of the status of five indoor plants selected for the experiment before and after the experiment (30 days).
3.2. Effect of Plants on Indoor CO2 Concentration in the Natural Lighting Environment
The natural light time was 9 h/day (8:00–17:00) in the natural lighting environment. Figure 3 shows the variation of CO2 concentration with time in six sealed chambers during the 72 h in the natural lighting environment. It can be seen that the initial CO2 concentration in the sealed chamber was around 750 ppm, while the CO2 concentration in the sealed chamber with plants changed drastically with the light intensity and the CO2 concentration decreased significantly, especially during the light period. The CO2 concentration showed the same sawtooth-type change trend in the chambers planted with Scindapsus aureus, chlorophytum comosum, Bambusa multiplex and Neottopteris nidus.
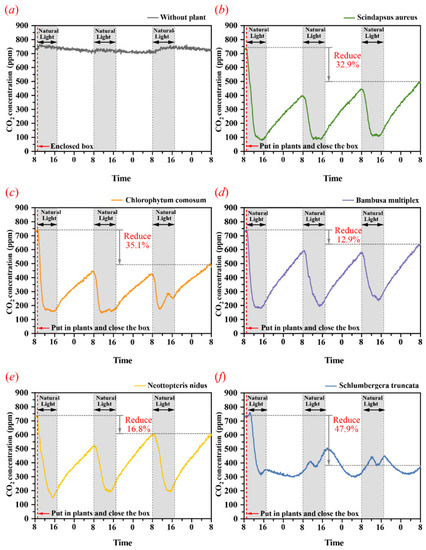
Figure 3.
Fluctuation of CO2 concentration in six sealed chambers in the natural lighting environment. (a) without plant (b) Scindapsus aureus (c) Chlorophytum comosum (d) Bambusa multiplex (e) Neottopteris nidus and (f) Schlumbergera truncate.
Natural lighting mainly came from the south-facing windows, and the CO2 concentration in the chamber decreased linearly and rapidly with the increase of indoor light intensity from 8:00 to 12:00. However, during the period from 12:00 to 15:00, the CO2 concentration was basically flat, which may be due to the fact that the plants closed their stomata to reduce water dissipation when solar radiation was too strong. The indoor light intensity gradually decreased from 15:00 to 17:00, and the photosynthetic rate of plants was gradually lower than the respiration rate, so the CO2 concentration in the sealed chamber continued to rise. After that, when the indoor natural light intensity was lower than a certain value, the plants mainly carried out respiration, and the CO2 concentration rose rapidly until 8:00 the next day. Therefore, the highest indoor CO2 concentration in the sealed chamber was in the morning.
Schlumbergera truncate was different from four other types of plants. In the daytime, Schlumbergera truncata closed its stomata to reduce water loss by transpiration and released CO2 by reducing it to sugar metabolism through the Calvin cycle. At night, it absorbed CO2 to form organic acids such as malic acid and opened its stomata to release O2. Therefore, the CO2 concentration increased during the day and decreased during the night in the chamber with Schlumbergera truncata, and the variation range of CO2 concentration was minimal.
In addition, as can be seen in Figure 3, compared to the initial CO2 concentration, CO2 concentration had obviously been reduced. At the end of the third day, the reduction rate of CO2 concentration was up to 47.9% for Schlumbergera truncate, 35.1% for Chlorophytum comosum, 32.9% for Scindapsus aureus, and 16.8% for Neottopteris nidus and for Bambusa multiplex. Therefore, Schlumbergera truncate was the best selection in the natural lighting environment.
Table 2 compared indoor CO2 concentration and the corresponding reduction rate in the natural lighting environment for each 24 h period among the five plants. To lower the influence from the initial CO2 concentration, the data were analyzed in the second and third 24 h. The highest, lowest and average values of CO2 concentration were from 453 ppm to 642 ppm, from 77 ppm to 309 ppm, and from 253 ppm to 431 ppm, and the corresponding reduction rates were from 16.7% to 41.2%, from 55.7% to 88.9%, and from 41.3% to 64.7% in the second and third 24 h, compared to the CO2 concentration in the sealed chamber without plants. By comparing the ability of five plants to reduce CO2 concentration in the natural lighting environment, it was easily found that Scindapsus aureus had the most significant effect, followed by Chlorophytum comosum, and their reduction rates of average CO2 concentration were from 53.0% to 61.2% and from 60.2% to 64.7%, respectively.
Table 2.
Comparison of CO2 concentration in sealed chambers in the natural lighting environment.
3.3. Effect of Plants on Indoor CO2 Concentration in the Poor Lighting Environment
Plants often suffer from insufficient light when placed in shaded locations or poor lighting environments. Figure 4 shows the variation of CO2 concentration in six sealed chambers with time during 72 h in the poor lighting environment. It can be seen that the CO2 concentration was steady at about 620 ppm in the sealed chamber without plants, while the CO2 concentration increased to different degrees due to the poor light in the sealed chamber with plants.
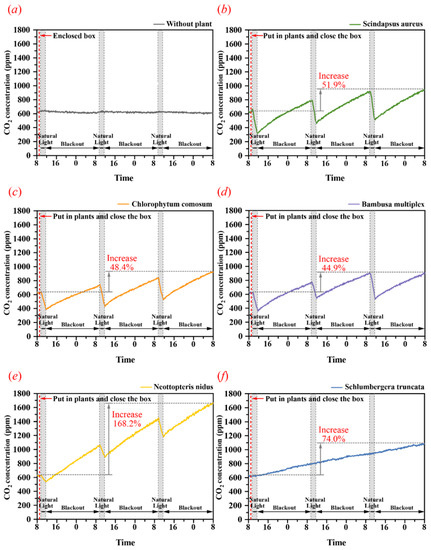
Figure 4.
Fluctuation of CO2 concentration in six sealed chambers in the poor lighting environment. (a) without plant (b) Scindapsus aureus (c) Chlorophytum comosum (d) Bambusa multiplex (e) Neottopteris nidus and (f) Schlumbergera truncate.
The plant photosynthesis was obvious during the 2 h with the natural light, while the plant respiration was obvious and CO2 concentration increased linearly during the 22 h with the poor light. The CO2 concentrations showed a zigzag trend in the sealed chambers of Scindapsus aureus, Chlorophytum comosum, Bambusa multiplex and Neottopteris nidus. In addition, Schlumbergera truncate was significantly different from the other four species. The CO2 concentration did not have a significant decrease and showed a continuous increase within 72 h in the sealed chamber with Schlumbergera truncate.
At the end of the third day, the CO2 concentrations were all above 900 ppm, which was 40% higher than in the sealed chambers with plants. Among five plants, the highest growth rate of CO2 concentration was 168.2% in the sealed chamber with Neottopteris nidus, followed by Schlumbergera truncate with a 74% growth rate, and by Scindapsus aureus and Chlorophytum comosum with a 51.9% and 48.4% growth rate respectively. The above results showed that when the lighting was insufficient, indoor planting obviously enhanced the CO2 concentration, and therefore polluted indoor air to a certain extent, which indicated that the lighting control was particularly important.
Table 3 compared indoor CO2 concentration and the corresponding reduction rate for each 24 h period among the five plants in the poor lighting environment. To lower the influence from the initial CO2 concentration, the data were also analyzed in the second and third 24 h. The highest, lowest and average values of CO2 concentration were from 818 ppm to 1672 ppm, from 428 ppm to 1178 ppm, and from 647 ppm to 1434 ppm, and the corresponding reduction rates were from −160.8% to −26.6%, from −102.8% to 8.3%, and from −132.4% to 4.2% in the second and third 24 h, compared to the CO2 concentration in the sealed chamber without plants. By comparing the five plants, the most unsuitable plants to be grown indoors were Neottopteris nidus and Schlumbergera truncate in the poor lighting environment, and their reduction rates of average CO2 concentration were from −83.9% to −132.4% and from −39.3% to −63.2%, respectively.
Table 3.
Comparison of CO2 concentration in sealed chambers in the poor lighting environment.
3.4. Effect of Plants on Indoor CO2 Concentration in the All-Day Lighting Environment
When the light was insufficient, the plants increased the CO2 concentration in the sealed chamber. The LED light was adopted to enhance the photosynthesis of plants. Figure 5 shows the variation of CO2 concentration over time in sealed chambers with plants during 72 h in the all-day lighting environment. It can be seen that the CO2 concentration was stable at about 700 ppm in the sealed chamber without plants, while the CO2 concentration decreased rapidly and gradually stabilized at 100 ppm to 200 ppm after 24 h in the sealed chamber with plants, and the balance between photosynthesis and respiration made the CO2 concentration relatively stable.
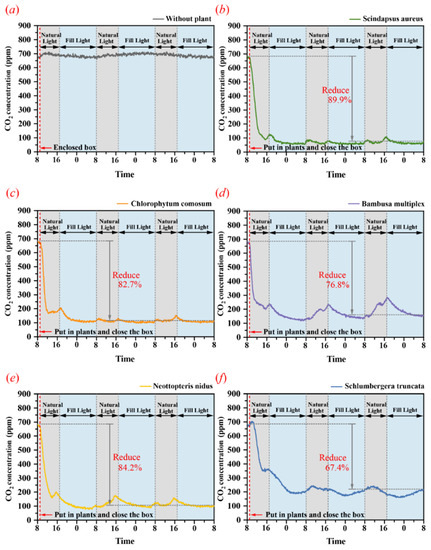
Figure 5.
Fluctuation of CO2 concentration in six sealed chambers in the all-day lighting environment. (a) without plant (b) Scindapsus aureus (c) Chlorophytum comosum (d) Bambusa multiplex (e) Neottopteris nidus and (f) Schlumbergera truncate.
From the CO2 concentration fluctuation curve, the CO2 concentration showed a small increase under natural light. This phenomenon was mainly related to the fact that the plant stomata were closed to photosynthesis when the natural light intensity was strong. The nighttime supplemental light used 100 Lx LED full-spectrum light, so the CO2 concentration showed a decreasing trend when the nighttime supplemental light was applied.
All five plants performed better during nighttime supplemental light. Scindapsus aureus, Chlorophytum comosum and Neottopteris nidus could reduce the CO2 concentration by from 82.7% to 89.9%, while Bambusa multiplex and Schlumbergera truncate could reduce the CO2 concentration by 67.4−76.8%. Since photosynthesis usually varied according to the balance of light quantity and CO2 concentration in plant cells, more-intense light induced higher photosynthetic rates and lowered CO2 concentration in cells. If the CO2 concentration was limited, the stomatal conductance and photosynthesis rate would also be limited [1].
Table 4 compared indoor CO2 concentration and the corresponding reduction rate for each 24 h period among the five plants in the all-day lighting environment. To lower the influence from the initial CO2 concentration, the data were also analyzed in the second and third 24 h. Compared to the chamber without plants, the highest, lowest and average values of CO2 concentration were from 90 ppm to 286 ppm, from 47 ppm to 169 ppm, and from 66 ppm to 206 ppm, and the corresponding reduction rates were from 60.4% to 84.6%, from 74.4% to 92.9%, and from 70.3% to 90.5% in the second and third 24 h, compared to the CO2 concentration in the sealed chamber without plants. The above data showed that the plants can significantly reduce the CO2 concentration in the sealed chamber in the all-day lighting environment.
Table 4.
Comparison of CO2 concentration in sealed chambers in the poor lighting environment.
3.5. Effect of Lighting Environments on the Effectiveness of Plant Action
To deeply analyze the effects of different lighting environments on the CO2 concentrations in sealed chambers with plants, Table 5 compared the CO2 concentrations in six sealed chambers in the natural lighting environment, poor lighting environment and all-day lighting environment for the 24 h on the third day. As shown in the table, growing plants in the sealed chambers could reduce the CO2 concentration significantly in the natural and all-day lighting environments. Especially in the all-day lighting environment, the highest and average CO2 concentrations were only from 111 ppm to 286 ppm and from 71 ppm to 196 ppm. When the light was insufficient, green plants polluted indoor air, and the highest CO2 concentration reached from 948 ppm to 1672 ppm, which could be harmful to the human body. In addition, by comparing five plants, it was found that the comprehensive performance of Scindapsus aureus and Chlorophytum comosum was more excellent, while for Neottopteris nidus and Schlumbergera truncate, we needed to consider indoor ventilation to reduce CO2 concentration.
Table 5.
Comparison of CO2 concentration in six sealed chambers at three lighting environments.
4. Conclusions
In this study, three representative lighting environments, including natural, poor, and all-day lighting environments, were set up, and the effect of five common plants on CO2 concentration was investigated by comparing the model experiments. The main conclusions were the following:
- (1)
- In the natural lighting environment, plants could reduce the average CO2 concentration in the sealed chamber. The average CO2 concentration ranged from 250 ppm to 450 ppm in the sealed chambers with plants, which was 40 to 60 percent lower than in the sealed chambers without plants.
- (2)
- In the poor lighting environment, plants obviously increased the average CO2 concentration in the sealed chamber. The highest CO2 concentration in the sealed chamber with plants was from 914 ppm to 1672 ppm, which was between 47.9% and 160.9% higher than that in the sealed chamber without plants. The average CO2 concentration was from 715 ppm to 1434 ppm, which was between 21.6% and 132.4% higher than that in the sealed chamber without plants.
- (3)
- In the all-day lighting environment, the photosynthesis of plants was profoundly enhanced. On the third day, the average CO2 concentration in the sealed chamber was only from 71 ppm to 196 ppm, which was between 53.0% and 61.2% lower than that in the sealed chamber without plants.
- (4)
- The lighting environment was critical for survival and photosynthesis. Plants kept indoor CO2 concentration at a low level in the high lighting environment, while it was the opposite in the low lighting environment, which would have some negative effects on the human body. Proper illumination control is beneficial for photosynthesis in plants.
- (5)
- According to the comprehensive comparison of the five selected plants in this study, the most suitable indoor plant was Scindapsus aureus, followed by Chlorophytum comosum and Bambusa multiplex. However, since the five plants studied emit a large amount of CO2 at night, these plants are not suitable for cultivation in the bedroom.
Author Contributions
Conceptualization, N.D.; methodology, N.D. and X.M.; formal analysis, F.L., X.D. and L.Y.; investigation, N.D. and X.M.; data curation, F.L., X.D. and L.Y.; writing—original draft preparation, F.L.; writing—review and editing, N.D. and X.M.; visualization, F.L., X.D. and L.Y.; supervision, N.D. All authors have read and agreed to the published version of the manuscript.
Funding
This research received no external funding.
Conflicts of Interest
The authors declare no conflict of interest.
References
- Wang, J.; Liu, S.H.; Liu, Z.F.; Meng, X.; Xu, C.B.; Gao, W.J. An experimental comparison on regional thermal environment of the high-density enclosed building groups with retro-reflective and high-reflective coatings. Energy Build. 2022, 259, 111864. [Google Scholar] [CrossRef]
- Gao, Y.N.; He, F.; Meng, X.; Wang, Z.Y.; Zhang, M.; Yu, H.T.; Gao, W.J. Thermal behavior analysis of hollow bricks filled with phase-change material (PCM). J. Build. Eng. 2020, 31, 101447. [Google Scholar] [CrossRef]
- Ding, N.; Zhao, B. Research on the garden configuration of New Chinese Style Landscape design. Resid. Ind. 2017, 9, 30–33. [Google Scholar]
- Liu, F.D.; Yan, L.Y.; Meng, X.; Zhang, C. A review on indoor green plants employed to improve indoor environment. J. Build. Eng. 2022, 53, 104542. [Google Scholar] [CrossRef]
- Meng, X.; Meng, L.; Gao, Y.; Li, H.R. A comprehensive review on the spray cooling system employed to improve the summer thermal environment: Application efficiency, impact factors, and performance improvement. Build. Environ. 2022, 217, 109065. [Google Scholar] [CrossRef]
- Russell, J.A.; Hu, Y.; Chau, L.; Pauliushchyk, M.; Anastopoulos, I.; Anandan, S.; Waring, M.S. Indoor-biofilter growth and exposure to airborne chemicals drive similar changes in plant root bacterial communities. Appl. Environ. Microbiol. 2014, 80, 4805–4813. [Google Scholar] [CrossRef]
- Parseh, I.; Teiri, H.; Hajizadeh, Y.; Ebrahimpour, K. Phytoremediation of benzene vapors from indoor air by Schefflera arboricola and Spathiphyllum wallisii plants. Atmos. Pollut. Res. 2018, 9, 1083–1087. [Google Scholar] [CrossRef]
- Milton, D.K.; Glencross, P.M.; Walters, M.D. Risk of sick leave associated with outdoor air supply rate, humidification, and occupant complaints. Indoor Air 2000, 10, 212–221. [Google Scholar] [CrossRef]
- Seppänen, O.A.; Fisk, W.J. Summary of human responses to ventilation. Indoor Air 2014, 14, 102–118. [Google Scholar] [CrossRef]
- Seppänen, O.A.; Fisk, W.J.; Lei, Q.H. Ventilation and performance in office work. Indoor Air 2016, 16, 28–36. [Google Scholar] [CrossRef]
- Fleck, R.; Gill, R.L.; Pettit, T.; Irga, P.J.; Williams, N.L.R.; Seymour, J.R.; Torpy, F.R. Characterisation of fungal and bacterial dynamics in an active green wall used for indoor air pollutant removal. Build. Environ. 2020, 179, 106987. [Google Scholar] [CrossRef]
- Claudio, L. Planting healthier indoor air. Environ. Health Perspect. 2011, 119, 426–427. [Google Scholar] [CrossRef] [PubMed]
- Pegas, P.N.; Alves, C.A.; Nunes, T.; Bate-Epey, E.F.; Evtyugina, M.; Pio, C.A. Could houseplants improve indoor air quality in schools? J. Toxicol. Environ. Health 2012, 75, 22–23. [Google Scholar] [CrossRef] [PubMed]
- Berger, J.; Essah, E.; Blanusa, T.; Beaman, C.P. The appearance of indoor plants and their effect on people’s perceptions of indoor air quality and subjective well-being. Build. Environ. 2022, 219, 109151. [Google Scholar] [CrossRef]
- Brilli, F.; Fares, S.; Ghirardo, A.; de Visser, P.; Calatayud, V.; Muñoz, A.; Annesi-Maesano, I.; Sebastiani, F.; Alivernini, A.; Varriale, V.; et al. Plants for Sustainable Improvement of Indoor Air Quality. Trends Plant Sci. 2018, 23, 507–512. [Google Scholar] [CrossRef]
- Yan, X.J.; Wang, H.R.; Hou, Z.Y.; Wang, S.Y.; Zhang, D.Y.; Xu, Q.; Tokola, T. Spatial analysis of the ecological effects of negative air ions in urban vegetated areas: A case study in Maiji, China. Urban For. Urban Green. 2015, 4, 636–645. [Google Scholar] [CrossRef]
- Bot, G.P.A. Developments in indoor sustainable plant production with emphasis on energy saving. Comput. Electron. Agric. 2011, 30, 151–165. [Google Scholar] [CrossRef]
- Paull, N.J.; Irga, P.J.; Torpy, F.R. Active green wall plant health tolerance to diesel smoke exposure. Environ. Pollut. 2018, 240, 448–456. [Google Scholar] [CrossRef]
- Pettit, T.; Bettes, M.; Chapman, A.R.; Hoch, L.M.; James, N.D.; Irga, P.J.; Torpy, F.R. The botanical biofiltration of VOCs with active airflow: Is removal efficiency related to chemical properties? Atmos. Environ. 2019, 214, 11683. [Google Scholar] [CrossRef]
- Cunningham, S.D.; Berti, W.R.; Huang, J.W. Phytoremediation of contaminated soils. Trends Biotechnol. 1995, 13, 393–397. [Google Scholar] [CrossRef]
- Salt, D.E.; Blaylock, M.; Kumar, N.P.; Dushenkov, V.; Ensley, B.D.; Chet, I.; Raskin, I. Phytoremediation: A novel strategy for the removal of toxic metals from the environment using plants. Biotechnology 1995, 13, 468–474. [Google Scholar] [CrossRef] [PubMed]
- Bandehali, S.; Miri, T.; Onyeaka, H.; Kumar, P. Current State of Indoor Air Phytoremediation Using Potted Plants and Green Walls. Atmosphere 2021, 12, 473. [Google Scholar] [CrossRef]
- Meng, X.; Yan, L.Y.; Liu, F.D. A new method to improve indoor environment: Combining the living wall with air-conditioning. Build. Environ. 2022, 16, 108981. [Google Scholar] [CrossRef]
- Pennisi, S.V.; van Iersel, M.W. Quantification of Carbon Assimilation of Plants in Simulated and In Situ Interiorscapes. HortScience 2012, 47, 468–476. [Google Scholar] [CrossRef]
- Torpy, F.R.; Irga, P.J.; Burchett, M.D. Profiling indoor plants for the amelioration of high CO2 concentrations. Urban For. Urban Green. 2014, 13, 227–233. [Google Scholar] [CrossRef]
- Tudiwer, D.; Korjenic, A. The effect of an indoor living wall system on humidity, mould spores and CO2-concentration. Energy Build. 2017, 146, 73–86. [Google Scholar] [CrossRef]
- Oh, G.S.; Jung, G.J.; Seo, M.H.; Im, Y.B. Experimental study on variations of CO2 concentration in the presence of indoor plants and respiration of experimental animals. Hortic. Environ. Biotechnol. 2011, 52, 321–329. [Google Scholar] [CrossRef]
- Vahdati, K.; Asayesh, Z.M.; Aliniaeifard, S.; Leslie, C. Improvement of ex vitro desiccation through elevation of CO2 concentration in the atmosphere of culture vessels during in vitro growth. HortScience 2017, 52, 1006–1012. [Google Scholar] [CrossRef]
- Mutebi, C. Mulberry (Morus spp) as a Plant for Building the Resilience of Smallholder Farmers during Climate Change and COVID 19 Pandemic. Int. J. Hortic. Sci. Technol. 2022, 9, 73–83. [Google Scholar]
- Deng, L.J.; Deng, Q.H. The basic roles of indoor plants in human health and comfort. Environ. Sci. Pollut. Res. 2018, 25, 36087–36101. [Google Scholar] [CrossRef]


Publisher’s Note: MDPI stays neutral with regard to jurisdictional claims in published maps and institutional affiliations. |
© 2022 by the authors. Licensee MDPI, Basel, Switzerland. This article is an open access article distributed under the terms and conditions of the Creative Commons Attribution (CC BY) license (https://creativecommons.org/licenses/by/4.0/).