Abstract
Crack assessment of bridge structures is essential for maintaining safe transportation infrastructure. Traditional crack detection by manual visual observation has drawbacks, as it is expensive, time-consuming, and limited by the height and volume of bridges. Recently, unmanned aerial vehicles (UAVs) with image processing have been used to address these limitations. However, cameras on UAVs will generally not be perpendicular to the crack surface during actual measurements; therefore, deviation in the perspective angle can lead to inaccuracies in crack identification. In this work, we propose a robust and straightforward crack detection method based on geometric correction and calibration algorithms to address these issues. Four parallel laser emitters were installed on the UAV camera for crack image acquisition, and the laser-obtained images were geometrically adjusted using the four-point linear correction algorithm. After crack image processing, the object-to-image resolution was analyzed, and the crack information was extracted. Compared to the lens imaging concept method, the method based on the four-point lasers showed greater precision for crack width identification, with a measurement accuracy of over 95%. This indicated that the proposed crack identification system showed great potential for actual crack detection of bridges.
1. Introduction
Over the past 20 years, large-scale infrastructure construction in China has rapidly increased the demand for the monitoring and maintenance of existing bridge structures [1,2]. As one of the most important parameters for evaluating state and structural performance, the development of cracks will affect the bearing capacity, stiffness, energy absorption capacity, and reinforcement corrosion resistance of structures [3,4,5]. Hence, the regular detection of cracks on concrete structure surfaces is essential. However, conventional bridge crack inspection is typically carried out by renting particular inspection vehicles, employing a number of inspectors, and sometimes even blocking traffic, as shown in Figure 1, which is costly, time-consuming, unsafe, and inaccessible to hazardous areas.
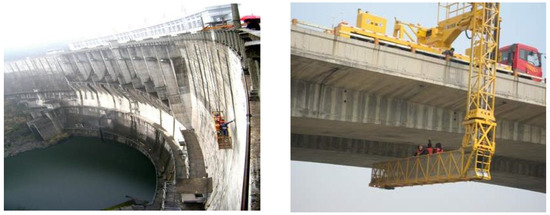
Figure 1.
Conventional inspection method.
Unmanned aerial vehicles (UAVs) have been increasingly recognized as practical vehicles for infrastructure inspection applications [6,7,8]. Images taken by UAVs can be used for three-dimensional (3D) modeling [9,10,11,12,13], structural condition evaluation [14,15,16], and traffic monitoring [17,18,19]. Meanwhile, numerous studies have combined image processing technology with UAVs to monitor the surface cracks of structures [20,21,22,23,24,25]. Zhong et al. [26] obtained the pixel resolution and calculated the crack width by installing a laser range finder synchronized with a camera shutter mounted on the UAV. Lei et al. [27] designed a crack central point method in conjunction with a UAV to extract crack information from the images. Liu et al. [28] proposed a new image-based crack assessment method using an UAV and three-dimensional scene reconstruction. Moreover, both infrared [29,30,31,32] and three-dimensional lidar technologies [33] have been used in conjunction with UAVs for crack identification. The above-mentioned studies have made meaningful attempts to promote UAV-based bridge crack detection.
Currently, various image processing methods have been implemented to effectively extract crack information from images, including morphological operation [34,35], adaptive crack template [36], wavelet transform [37,38], edge detector [39,40,41,42,43], artificial neural network methods [44,45,46], and deep convolutional neural networks (DCNNs) [47,48,49]. Nevertheless, machine learning methods, especially deep learning, have certain requirements for data training sample size, and in the actual application process, network training will be prone to overfitting due to sample scarcity. Edge detection is the use of filters (edge detectors) in image processing algorithms to detect or enhance cracks, making it easier and more efficient for crack extraction. Typical crack detection algorithms (Roberts, Sobel, Prewitt, and Laplacian of Gaussian) can emphasize edges by applying filters in the spatial or frequency domain [37]. Among them, the Roberts edge detector is a gradient calculation with oblique deviation score; the Sobel edge detector is a set of directional detectors that can detect edges from different directions; the Prewitt detector is an edge template detector, which can detect edges when the edges reach their extremes by utilizing the gray difference between the left and right neighbors at the top and bottom of the pixel points; the Laplacian of Gaussian detector is a second-order derivative detector which combines Gauss filtering with Laplace edge detection. The performance of common edge detectors has been evaluated and compared by Dorafshan et al. [40] and Abdel-Qader et al. [50].
Although numerous image processing techniques have been proposed, little attention has been paid to the perspective distortion of cracks [28]. In most cases, the camera will not be generally oriented to the detection object, or cracks will propagate along a non-flat surface. Thus, angles between the camera and the bridge (called the perspective angle) can cause distortion of the captured image, resulting in crack shape deformation and errors in the calculated crack width.
In this paper, we present an UAV-based system that can accurately measure bridge crack width. The images were acquired by an UAV-based system, which was equipped with particular square four-point laser emitters. A robust and straightforward perspective angle correction and calibration method based on the square laser was then proposed. Moreover, the images were processed by gray processing, binarization, and edge detector to obtain the correct crack information. Furthermore, a field test on the crack assessment of the Beiwang Bridge was carried out for validation and error analysis of the proposed methodology.
2. Flight System Configuration of the UAV
This study used a self-designed quadrotor UAV for crack detection, as shown in Figure 2. The quadrotor UAV consisted of four modules, namely, the control module, the image acquisition module, the global positioning system (GPS) module, and the ultrasonic module. Regarding the control module, an Ardu Pilot Mega (APM) flight controller was employed, produced by the DJI Innovation Company, which was used to automatically maintain the typical flight attitude of the aircraft. Meanwhile, the remote controller was used to handle the driving operation of the brushless motor in the quadrotor UAV. Moreover, two batteries with a capacity of 3500 mAh were equipped in the UAV, and a set of fully charged batteries can support up to 35 min of flight time
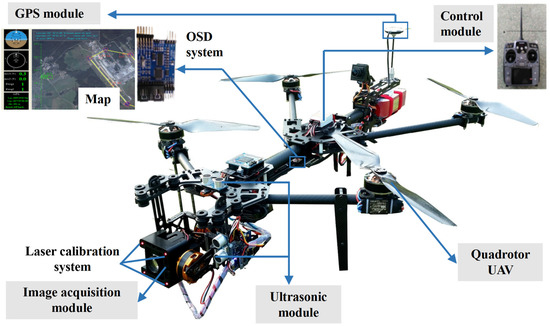
Figure 2.
UAV-based system for crack acquisition.
The image acquisition module was composed of a laser calibration system and a zoom camera with 48 megapixels. The laser calibration system consisted of four parallel 50 MW laser emitters and a frame on which the camera and the laser emitters were placed. Moreover, the camera was fixed on a controllable platform to obtain a horizontal angular freedom of 360° and a vertical angular freedom of 90° up and down. The GPS module was used for navigation and crack location, and the GPS at the tail of the UAV could display the coordinates of the aircraft during crack detection. Furthermore, the OSD system could superimpose the GPS coordinates on the crack image to locate the crack positions.
The ultrasonic module had two main functions. The first function was to determine the distance of the UAV shooting, while the other was to avoid obstacles, to automatically ensure the aircraft’s safety. The ultrasonic module was composed of a US-100 ultrasonic range finder and a Freescale 16-bit microprogrammed control unit (MCU) MC9S12XS128. The ultrasonic range finder near the camera could measure and record the shooting distance. When the distance measured by the ultrasonic range finder was less than 500 mm, the MCU temporarily controlled the flight control system to allow the UAV to hover at a fixed point, avoiding obstacles from the front and above.
A workflow of the UAV crack identification system is illustrated in Figure 3, which consisted of three parts. The first part was crack image acquisition, the second part was crack image processing, and the third part was crack information extraction. Detailed descriptions of the crack identification system are presented in the following sections.
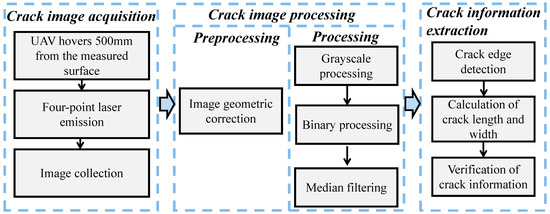
Figure 3.
Workflow of the crack identification system.
3. Crack Image Acquisition
The shooting angle correction of the crack image obtained by the UAV was fundamental for accurate crack information identification. Perspective distortion is usually embodied by the distant objects appearing smaller than nearby objects of the same size in the same image. The shooting angle is not perpendicular to the surface and the uneven surface of the structure is the main cause of perspective distortion. In this work, we proposed a robust and simple method for geometric correction and image-to-object scale calibration, which could effectively resolve the deformation of the crack image caused by perspective distortion.
3.1. Process of Geometric Image Correction
When acquiring the structural crack images by the UAV, if the camera was not perpendicular to the flat structural surface, the obtained crack images would be distorted, as shown in Figure 4a. When acquiring crack images on circular or rectangular piers, perspective distortion will often occur due to uneven structural surfaces, as shown in Figure 4b,c. If this perspective angle is not corrected, the subsequent crack information calculated based on the crack image will be inaccurate.
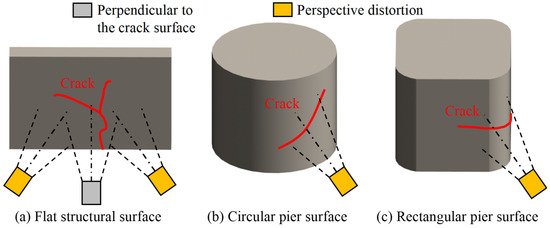
Figure 4.
Crack image acquisition for the different types of structural surfaces.
In this work, a novel image acquisition system based on a UAV was proposed for perspective angle correction, and its diagram is shown in Figure 5. The lens and four-point laser emitter were mounted and fixed on the frame of the image acquisition system. Four parallel lasers were emitted and distributed at each square vertex when the UAV found cracks. Images with cracks and laser points were obtained by a high-definition camera and processed by a geometric correction and calibration algorithm. To assure the emitted immunity, stability, and suitability of the laser for operation in bright sunlight and severe conditions, 50 MW industrial laser emitters were also utilized. Therefore, before image-to-object resolution analysis, the obtained image was corrected so that the distribution shape of the laser points was square. In this way, the acquired image could be calibrated by the four laser points, so that the ratio of actual cracks to image cracks could be accurately converted.
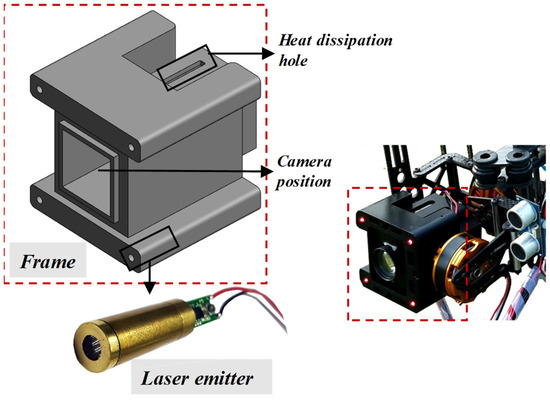
Figure 5.
Schematic of the image acquisition module.
3.2. Image Geometric Correction Algorithm
As mentioned above, the square enclosed by the laser dots in the image had the same length and did not distort if the camera was vertical to the structural surface. However, the graph encircled by the laser dots was not square but had somewhat different quadrangles due to the shooting angle of the camera. A linear correction algorithm was also proposed, and its schematic is shown in Figure 6. As presented, O1–O4 consisted of the four laser points of the original image, where the enclosed graph was trapezoidal. The linear correction algorithm could transform the trapezoid into a square (C1–C4), as given by Equations (1)–(6):
where ui, vi and wi indicate the transverse, longitudinal, and vertical coordinates of point i before correction, respectively, and xi, yi and zi indicate the transverse, longitudinal, and vertical coordinates of point i after correction, respectively. Because the image was two-dimensional, the values of wi and zi were constant to 1, and K was the coefficient matrix of coordinate transformation. The calculation formula is as follows:
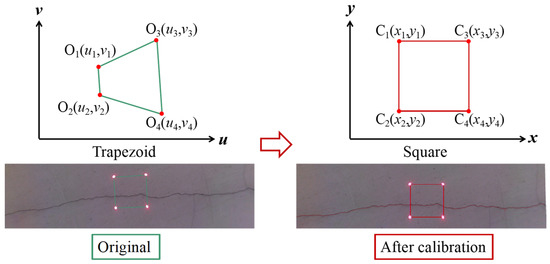
Figure 6.
Schematic showing the image geometric correction algorithm.
Typically, a33 = 1 when calculating the coordinate transformation matrix. Replacing the homogeneous coordinates with the non-homogeneous coordinates of the points, xi and yi could be transformed as follows:
Because the four laser points in the crack image were red and had high brightness, the small area where the four reference points were located could be determined by using the grayscale thresholding and red component detection methods. The center of mass of the small area was then determined as the coordinates of the reference point before correction (ui and vi). Moreover, the graph enclosed by the four-point coordinates after perspective transformation was square. Hence, assuming that the square had an edge length of a, the coordinates of C1–C4 could be calculated as follows:
By substituting Equations (3) and (4) into Equation (5), the simultaneous equation could solve , , , , , , , and , as follows:
The coordinate transformation matrix could be obtained by using Equation (6), allowing each pixel to be coordinate transformed. Then, the coordinated transformation process could be realized by using MATLAB software.
4. Crack Image Processing
4.1. Gray Processing
After geometric correction, the crack image underwent gray processing by linear transformation. Assuming that its gray level was dispersed on interval [a, b], the concrete served as the primary background of the image and occupied the majority of the pixels. However, the gray level of the pixels was composed of cracks, scratches, and fallout sites, which did not fall within this range. The gray values inside and outside the interval were linearly modified by using Equation (7) to improve image contrast while preserving edge information. Figure 7 shows the crack image after gray processing. The crack image after gray processing is shown in Figure 7, which followed:
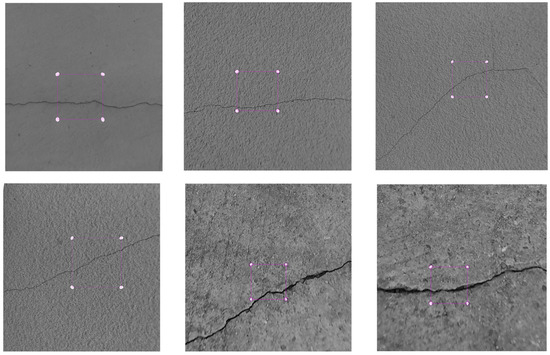
Figure 7.
Crack image after gray processing.
4.2. Binary Processing
The gray processed image was binarized to extract the crack information. Considering the effectiveness and operability of actual engineering detection, the Otsu algorithm was used to binarize the crack images in this work. The Otsu method [51] was unaffected by the luminance and contrast of the image and could automatically compute the thresholds for separating concrete foregrounds (such as cracks) and backgrounds. After calculating the distribution of gray levels using the histogram, the number of foreground pixels with an average gray level of was calculated as a percentage of the entire image, as denoted by . The ratio of the number of background pixel points with an average gray level of for the entire image was denoted as , whereas the total average gray level of the image was denoted as . The variance between foreground and background images was g. The calculations of and g are presented in Equations (8) and (9), respectively:
The point with the maximum variance was the best threshold point, which led to threshold T as image segmentation. After binary processing, median filtering was utilized to filter speckle and pretzel noise, thus protecting the sharp edges of the image. The crack image after binary processing is shown in Figure 8.
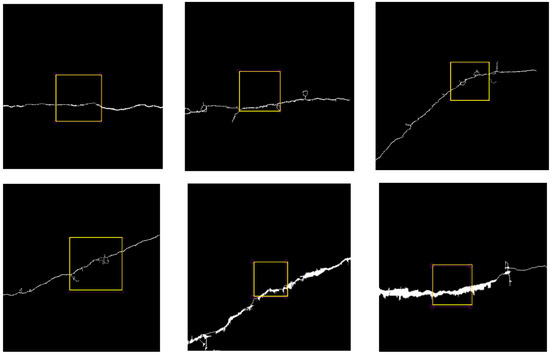
Figure 8.
Crack image after binary processing.
5. Crack Information Extraction
5.1. Crack Edge Detection
After crack image processing, it was necessary to extract the margins of the cracks to determine the crack width information. Edge detection consisted of the process of contour extraction of the different objects from the background. Several regularly employed edge detectors were evaluated [40], which determined that the Laplacian of Gaussian (LoG) detector had the most remarkable crack detection rate. Therefore, this study adopted the LoG detector for crack edge identification.
LoG was created by addressing the shortcomings of the Laplacian detector, which was susceptible to background noise. Before applying Laplacian, the LoG detector applied Gaussian smoothing to mitigate the impact of noise, as the LoG could lower the number of noise-induced erroneous edge detections. The expression for the two-dimensional LoG function centered at 0 and with a Gaussian standard deviation of σ was as follows:
5.2. Object-to-Image Resolution Analysis
The crack images could be resolved by the UAV’s image acquisition system for object resolution, followed by geometry correction, image processing, and morphological analysis. As mentioned above, the distance between the centers of the adjacent laser points was 100 mm. Therefore, the center coordinates of the laser reference points after geometric correction could be calculated by using Equations (5) and (6). Subsequently, the center distance of the laser point in the image was compared to the actual laser point center distance, and the size conversion factor between the image and the actual scene could be easily determined, as denoted by Method 1. The calculation process of Method 1 is as follows:
where is the pixel distance between the centers of the two adjacent laser points after correction, D is the actual distance between the centers of the two laser points, is the pixel rate of the image, and and indicate the widths of the cracks in the image and in reality, respectively.
Furthermore, the crack width calculation methods based on the lens imaging concept were compared with Method 1 in this study, as denoted by Method 2. Method 2 estimated the distance between the UAV and the measured target (L1) using the ultrasonic module synced with the camera shutter. The relationship between L1 and the image distance (L2) is shown in Equation (13), according to the lens imaging concept:
where f is the focal length of the lens, and the crack width in reality () can be calculated as follows:
The schematic of the two methods is illustrated in Figure 9, and the comparative results of the two methods for crack width estimation are presented in Section 5.2.
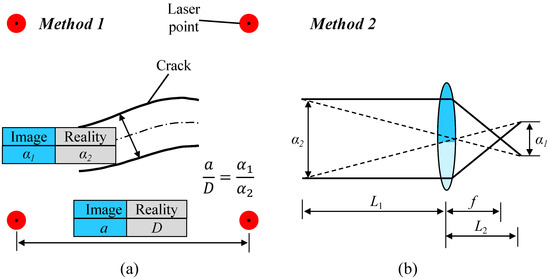
Figure 9.
Schematic of the two crack width calculation methods: (a) Method 1, (b) Method 2.
As an essential component of determining the actual crack width, the image crack width was calculated as follows. As shown in Figure 8, the pixel value of the crack shape area was either 0 or 1, and the borders of the crack were joined by the points with a pixel value of 1. The crack width had to be the smallest distance between two edges, and the distance from the pixel center of one edge (xn, ym) to the edge of the other could be calculated as follows:
where is the coordinate of the n − l columns in the second crack edge, corresponds to the y-coordinate of , and l can be taken as −5 to 5. Similarly, assuming that the number of columns m remained constant, the distance from the pixel center (xn, ym) in the first crack edge to the second crack edge could be calculated as follows:
where is the y-coordinate of the m − l columns in the second crack edge, and is the corresponding x-coordinate. The minimum values calculated by S1 and S2 were the crack widths at points xn, ym, and the calculation was performed by a pre-programmed computer.
5.3. Field Tests on Crack Assessment
The proposed crack identification system based on the UAV was applied for the inspection of the Beiwang Bridge in Nanchang City, Jiangxi Province, as shown in Figure 10. During bridge inspection, the crew would fly the UAV along the patrol route. When the crack location was determined, the UAV approached the measured surface and hovered at a distance of 0.5 m, emitting four parallel lasers and capturing photographs of the cracks using the camera. Crack detection software was built using Visual Studio, based on the above-mentioned crack image geometry correction and the processing procedure. Geometry correction and information extraction of the crack images are illustrated in Figure 11, where the software could clearly display the correction results of the crack images, the maximum, minimum, and average crack widths, as well as the crack lengths.
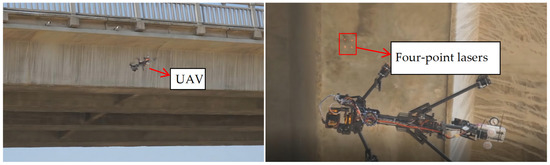
Figure 10.
Crack inspection of the Beiwang Bridge.
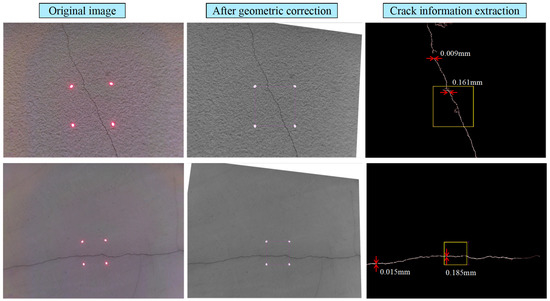
Figure 11.
Crack detection software process.
Twelve cracks were selected in the easily accessible areas, and the maximum crack width values were measured using high-precision width measurements. The results of the manual measurements were compared with those obtained by the UAV crack identification system, as shown in Figure 12 and Table 1. For Method 1, it was possible to observe nearly all of the data that were close to equal (X = Y) and fell below the 10% restriction. For Method 2, some discrepancies were observed between the manual and UAV crack measurement results. Moreover, the global average value of the crack width ratio of Method 1 to width measurement was 0.97, with a standard deviation of 0.07 and a coefficient of variation of 7.59%. In comparison, the global average value of the crack width ratio of Method 2 to width measurement was 1.15, with a standard deviation of 0.18 and a coefficient of variation of 15.73%. The results indicated that both the methods for the UAV crack identification system could successfully calculate the actual crack width. Four-point laser-based Method 1 identified the crack width with greater precision and showed considerable promise for use in actual engineering applications.
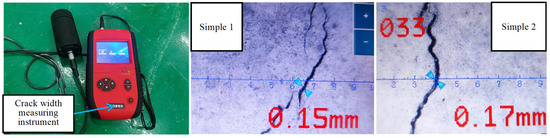
Figure 12.
Crack images of the digital display crack width measurements.

Table 1.
Crack width results obtained by manual measurement and the UAV crack identification system.
6. Discussion
This paper aimed to present an UAV-based system that can accurately measure the crack width of the concrete bridge. The theoretical contribution of this work is to develop a robust and straightforward perspective angle correction and calibration method based on square lasers. Accurate crack information identification requires appropriate and effective image processing methods. However, previous studies did not consider the inaccurate crack identification problem due to perspective distortion, thus limiting the development of this kind of technique. Compared with the traditional crack image processing technique, the contribution of this paper lies in the fact that the UAV is equipped with four lasers, and the crack image was geometrically corrected and calibrated through the square lasers technique. The field test results revealed that this system has high accuracy in identifying the crack width of the concrete bridge. This work offers a creative solution to the problem of perspective distortion, which can promote and popularize the use of new UAVs and robots in buildings [12,13].
The distinctive aspect of this paper is that the UAV’s camera is fitted with four parallel lasers, resulting in the acquisition of a crack image containing four laser points, as mentioned in Section 2. Moreover, the UAV includes an ultrasonic module and a GPS module (Figure 2). The ultrasonic module has two primary functions: to determine the shooting distance and to avoid obstructions, and the GPS module can be utilized for navigation and crack location. However, when fully charged, the UAV system presented in this research can only operate for 35 min. Therefore, future enhancements should be developed to minimize the UAV’s weight and increase its battery capacity in order to boost its endurance. Compared with the conventional UAV [6], the UAV system proposed in this paper is more suitable for crack identification of bridges.
Another innovation of this paper is the crack image correction based on a four-point laser, as presented in Section 3. The coordinates of the four laser spots were initially obtained using gray threshold and red component detection techniques. The distorted quadrilateral laser point is then transformed into a square using a linear correction technique (Figure 6). The linear correction solution suggested in this work resolves the issues of perspective distortion and image distortion, thus bridging the gap between previous pieces of research. Nevertheless, the method of image correction described in this study requires a four-point laser at the lens, which requires the UAV to be transformed. Future studies can investigate more practical and effective picture correcting techniques (such as artificial intelligence).
In this work, a LoG edge detector was adopted to extract the margins of the cracks to determine the crack width information. LoG detectors had the most remarkable crack detection rate compared to several regularly used edge detectors [40]. Compared with machine learning, the proposed method does not suffer from overfitting due to sparse training samples in practical applications. After identifying the crack’s edge, the author calculates its actual width by dividing the pixel distance between adjacent laser points by the actual distance (Figure 9). Moreover, the authors compile a series of image correction and processing procedures into software, making the UAV-based crack identification system more widely used (Figure 11).
The field tests on crack assessment were conducted on Beiwang Bridge (Figure 10). Since the ultrasonic module can determine the shooting distance between the UAV and the detected surface, the proposed method based on four-point lasers was compared to the lens imaging methods, as presented in Section 5.3. The results show that the proposed methods can accurately identify crack width, and the global average value of the crack width ratio of Method 1 to width measurement was 0.97 (Table 1). Moreover, the four-point laser method showed greater precision for crack width identification than the method based on lens imaging because Method 1 carries out the scale conversion directly on the crack image (Figure 13).
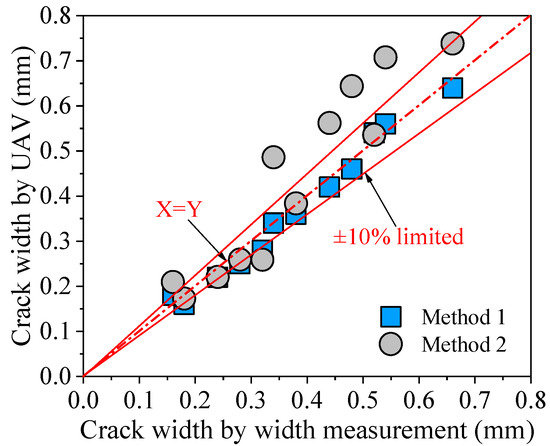
Figure 13.
Comparison of crack width values by the UAV and width measurements.
In summary, the proposed system can improve the accuracy of crack identification and is of great importance. Future research efforts can concentrate on carrying a high-precision flaw detector (X-ray, infrared) on the UAV to identify damage to concrete bridges in a more comprehensive and three-dimensional manner. Moreover, future research efforts can also concentrate on developing the automated detection technology to realize the automated visual measurement of the UAV. Non-contact large-area stereo detection and automated visual measurement are the main trends of future engineering detection, which have broad market and application prospects.
7. Conclusions
In this work, an UAV-based crack detection system for bridge structures was proposed. Based on four-point laser emission, robust and straightforward methods for perspective angle correction and crack width computation were provided. Then, a validation field test was conducted for crack evaluation. As discussed, the following conclusions were obtained:
- (1)
- The proposed simple and robust image correction method with a four-point laser could solve the problem of crack image distortion obtained by the UAV, and the correction method could offer a foundation for accurate crack width identification.
- (2)
- Combined with geometric image correction and crack image processing, two crack width calculation methods were proposed based on four-point lasers and lens imaging. The proposed methods were well suited for UAV remote crack width detection.
- (3)
- According to the field test results, the four-point laser method showed greater precision for crack width identification compared to the method based on lens imaging. The crack width ratio of the UAV method to the manual measuring method had a global average value of 0.97, a standard deviation of 0.07, and a coefficient of variation of 7.59%. We found evidence that the suggested crack identification method showed considerable potential for on-site bridge crack detection.
Author Contributions
Conceptualization, J.L. and X.L.; methodology, J.L. and X.L.; software, K.L. and Z.Y.; validation, J.L., X.L. and K.L.; formal analysis, J.L. and Z.Y.; investigation, J.L. and X.L.; resources, K.L. and Z.Y.; data curation, J.L. and X.L.; writing—original draft preparation, X.L.; writing—review and editing, J.L. and X.L.; visualization, J.L. and X.L.; supervision, K.L.; project administration, K.L.; funding acquisition, Z.Y. All authors have read and agreed to the published version of the manuscript.
Funding
This research was funded by China Postdoctoral Science Foundation (Grant No. 2022M710870).
Institutional Review Board Statement
Not applicable.
Informed Consent Statement
Not applicable.
Data Availability Statement
Not available.
Acknowledgments
This work was accomplished with the support of the China Postdoctoral Science Foundation (Grant No. 2022M710870).
Conflicts of Interest
The authors declare no conflict of interest.
References
- Zhang, L.; Qiu, G.; Chen, Z. Structural health monitoring methods of cables in cable-stayed bridge: A review. Measurement 2021, 168, 108343. [Google Scholar] [CrossRef]
- Ou, J.; Li, H. Structural health monitoring in mainland China: Review and future trends. Struct. Health Monit. 2010, 9, 219–231. [Google Scholar]
- Zhang, D.; Ueda, T.; Furuuchi, H. Average crack spacing of overlay-strengthened RC beams. J. Mater. Civ. Eng. 2011, 23, 1460–1472. [Google Scholar] [CrossRef]
- Zhang, D.; Rashid, K.; Wang, B.; Ueda, T. Experimental and analytical investigation of crack spacing and width for overlaid RC beams at elevated temperatures. J. Struct. Eng. 2017, 143, 04017168. [Google Scholar] [CrossRef]
- Rashid, K.; Li, X.; Xie, Y.; Deng, J.; Zhang, F. Cracking behavior of geopolymer concrete beams reinforced with steel and fiber reinforced polymer bars under flexural load. Compos. Part B Eng. 2020, 186, 107777. [Google Scholar] [CrossRef]
- Rakha, T.; Gorodetsky, A. Review of Unmanned Aerial System (UAS) applications in the built environment: Towards automated building inspection procedures using drones. Autom. Constr. 2018, 93, 252–264. [Google Scholar] [CrossRef]
- Freimuth, H.; König, M. Planning and executing construction inspections with unmanned aerial vehicles. Autom. Constr. 2018, 96, 540–553. [Google Scholar] [CrossRef]
- Outay, F.; Mengash, H.A.; Adnan, M. Applications of unmanned aerial vehicle (UAV) in road safety, traffic and highway infrastructure management: Recent advances and challenges. Transp. Res. Part A Policy Pract. 2020, 141, 116–129. [Google Scholar] [CrossRef]
- Ulvi, A. Documentation, Three-Dimensional (3D) Modelling and visualization of cultural heritage by using Unmanned Aerial Vehicle (UAV) photogrammetry and terrestrial laser scanners. Int. J. Remote Sens. 2021, 42, 1994–2021. [Google Scholar] [CrossRef]
- Drešček, U.; Kosmatin Fras, M.; Tekavec, J.; Lisec, A. Spatial ETL for 3D building modelling based on unmanned aerial vehicle data in semi-urban areas. Remote Sens. 2020, 12, 1972. [Google Scholar] [CrossRef]
- Khaloo, A.; Lattanzi, D.; Cunningham, K.; Dell’Andrea, R.; Riley, M. Unmanned aerial vehicle inspection of the Placer River Trail Bridge through image-based 3D modelling. Struct. Infrastruct. Eng. 2018, 14, 124–136. [Google Scholar] [CrossRef]
- Li, L.; Chen, J.; Su, X.; Nawaz, A. Advanced-Technological UAVs-Based Enhanced Reconstruction of Edges for Building Models. Buildings 2022, 12, 1248. [Google Scholar] [CrossRef]
- Wang, D.; Shu, H. Accuracy Analysis of Three-Dimensional Modeling of a Multi-Level UAV without Control Points. Buildings 2022, 12, 592. [Google Scholar] [CrossRef]
- Akbar, M.A.; Qidwai, U.; Jahanshahi, M.R. An evaluation of image-based structural health monitoring using integrated unmanned aerial vehicle platform. Struct. Control Health Monit. 2019, 26, e2276. [Google Scholar] [CrossRef]
- Jung, H.-J.; Lee, J.-H.; Yoon, S.; Kim, I.-H. Bridge Inspection and condition assessment using Unmanned Aerial Vehicles (UAVs): Major challenges and solutions from a practical perspective. Smart Struct. Syst. 2019, 24, 669–681. [Google Scholar]
- Saleem, M.R.; Park, J.-W.; Lee, J.-H.; Jung, H.-J.; Sarwar, M.Z. Instant bridge visual inspection using an unmanned aerial vehicle by image capturing and geo-tagging system and deep convolutional neural network. Struct. Health Monit. 2021, 20, 1760–1777. [Google Scholar] [CrossRef]
- Huang, H.; Savkin, A.V.; Huang, C. Decentralised Autonomous Navigation of a UAV Network for Road Traffic Monitoring. IEEE Trans. Aerosp. Electron. Syst. 2021, 57, 2558–2564. [Google Scholar] [CrossRef]
- Balamuralidhar, N.; Tilon, S.; Nex, F. MultEYE: Monitoring System for Real-Time Vehicle Detection, Tracking and Speed Estimation from UAV Imagery on Edge-Computing Platforms. Remote Sens. 2021, 13, 573. [Google Scholar] [CrossRef]
- Rumba, R.; Nikitenko, A. The wild west of drones: A review on autonomous-UAV traffic-management. In Proceedings of the 2020 International Conference on Unmanned Aircraft Systems (ICUAS), Athens, Greece, 1–4 September 2020; pp. 1317–1322. [Google Scholar]
- Pereira, F.C.; Pereira, C.E. Embedded image processing systems for automatic recognition of cracks using UAVs. IFAC-PapersOnline 2015, 48, 16–21. [Google Scholar] [CrossRef]
- Sankarasrinivasan, S.; Balasubramanian, E.; Karthik, K.; Chandrasekar, U.; Gupta, R. Health Monitoring of Civil Structures with Integrated UAV and Image Processing System. Procedia Comput. Sci. 2015, 54, 508–515. [Google Scholar] [CrossRef]
- Kim, H.; Lee, J.; Ahn, E.; Cho, S.; Shin, M.; Sim, S.-H. Concrete crack identification using a UAV incorporating hybrid image processing. Sensors 2017, 17, 2052. [Google Scholar] [CrossRef] [PubMed]
- Peng, X.; Zhong, X.; Zhao, C.; Chen, A.; Zhang, T. A UAV-based machine vision method for bridge crack recognition and width quantification through hybrid feature learning. Constr. Build. Mater. 2021, 299, 123896. [Google Scholar] [CrossRef]
- Peng, X.; Zhong, X.; Zhao, C.; Chen, Y.F.; Zhang, T. The feasibility assessment study of bridge crack width recognition in images based on special inspection UAV. Adv. Civ. Eng. 2020, 2020, 8811649. [Google Scholar] [CrossRef]
- Yeum, C.M.; Dyke, S.J. Vision-based automated crack detection for bridge inspection. Comput.-Aided Civ. Infrastruct. Eng. 2015, 30, 759–770. [Google Scholar] [CrossRef]
- Zhong, X.; Peng, X.; Yan, S.; Shen, M.; Zhai, Y. Assessment of the feasibility of detecting concrete cracks in images acquired by unmanned aerial vehicles. Autom. Constr. 2018, 89, 49–57. [Google Scholar] [CrossRef]
- Lei, B.; Ren, Y.; Wang, N.; Huo, L.; Song, G. Design of a new low-cost unmanned aerial vehicle and vision-based concrete crack inspection method. Struct. Health Monit. 2020, 19, 1871–1883. [Google Scholar] [CrossRef]
- Liu, Y.F.; Nie, X.; Fan, J.S.; Liu, X.G. Image-based crack assessment of bridge piers using unmanned aerial vehicles and three-dimensional scene reconstruction. Comput.-Aided Civ. Infrastruct. Eng. 2020, 35, 511–529. [Google Scholar] [CrossRef]
- Omar, T.; Nehdi, M.L. Remote sensing of concrete bridge decks using unmanned aerial vehicle infrared thermography. Autom. Constr. 2017, 83, 360–371. [Google Scholar] [CrossRef]
- Hiasa, S.; Karaaslan, E.; Shattenkirk, W.; Mildner, C.; Catbas, F.N. Bridge Inspection and Condition Assessment Using Image-Based Technologies with UAVs; American Society of Civil Engineers: Reston, VA, USA, 2018; pp. 217–228. [Google Scholar]
- Ellenberg, A.; Kontsos, A.; Moon, F.; Bartoli, I. Bridge deck delamination identification from unmanned aerial vehicle infrared imagery. Autom. Constr. 2016, 72, 155–165. [Google Scholar] [CrossRef]
- Ficapal, A.; Mutis, I. Framework for the detection, diagnosis, and evaluation of thermal bridges using infrared thermography and unmanned aerial vehicles. Buildings 2019, 9, 179. [Google Scholar] [CrossRef]
- Yan, Y.; Mao, Z.; Wu, J.; Padir, T.; Hajjar, J.F. Towards automated detection and quantification of concrete cracks using integrated images and lidar data from unmanned aerial vehicles. Struct. Control Health Monit. 2021, 28, e2757. [Google Scholar] [CrossRef]
- Peng, C.; Yang, M.; Zheng, Q.; Zhang, J.; Wang, D.; Yan, R.; Wang, J.; Li, B. A triple-thresholds pavement crack detection method leveraging random structured forest. Constr. Build. Mater. 2020, 263, 120080. [Google Scholar] [CrossRef]
- Yang, X.C.; Li, H.; Yu, Y.T.; Luo, X.C.; Huang, T.; Yang, X. Automatic Pixel-Level Crack Detection and Measurement Using Fully Convolutional Network. Comput.-Aided Civ. Infrastruct. Eng. 2018, 33, 1090–1109. [Google Scholar] [CrossRef]
- Huang, J.J.; Tian, P.; Xu, Y.M.; Xing, C. An Improved Adaptive Width Template Method for Crack Detection of Nuclear Containments. J. Surv. Eng. 2017, 143, 04017016. [Google Scholar] [CrossRef]
- Zhu, L.F.; Ke, L.L.; Zhu, X.Q.; Xiang, Y.; Wang, Y.S. Crack identification of functionally graded beams using continuous wavelet transform. Compos. Struct. 2019, 210, 473–485. [Google Scholar] [CrossRef]
- Nigam, R.; Singh, S.K. Crack detection in a beam using wavelet transform and photographic measurements. Structures 2020, 25, 436–447. [Google Scholar] [CrossRef]
- Wang, G.; Tse, P.W.; Yuan, M. Automatic internal crack detection from a sequence of infrared images with a triple-threshold Canny edge detector. Meas. Sci. Technol. 2018, 29, 025403. [Google Scholar] [CrossRef]
- Dorafshan, S.; Thomas, R.J.; Maguire, M. Comparison of deep convolutional neural networks and edge detectors for image-based crack detection in concrete. Constr. Build. Mater. 2018, 186, 1031–1045. [Google Scholar] [CrossRef]
- Yang, H.; Xu, X.Y. Intelligent crack extraction based on terrestrial laser scanning measurement. Meas. Control 2020, 53, 416–426. [Google Scholar] [CrossRef]
- Han, H.; Deng, H.; Dong, Q.; Gu, X.; Zhang, T.; Wang, Y. An Advanced Otsu Method Integrated with Edge Detection and Decision Tree for Crack Detection in Highway Transportation Infrastructure. Adv. Mater. Sci. Eng. 2021, 2021, 9205509. [Google Scholar] [CrossRef]
- Talab, A.; Huang, Z.; Xi, F.; Haiming, L. Detection crack in image using Otsu method and multiple filtering in image processing techniques. Opt.-Int. J. Light Electron Opt. 2016, 127, 1030–1033. [Google Scholar] [CrossRef]
- Rowshandel, H.; Nicholson, G.L.; Shen, J.L.; Davis, C.L. Characterisation of clustered cracks using an ACFM sensor and application of an artificial neural network. NDT E Int. 2018, 98, 80–88. [Google Scholar] [CrossRef]
- Li, S.; Zhao, X. Image-Based Concrete Crack Detection Using Convolutional Neural Network and Exhaustive Search Technique. Adv. Civ. Eng. 2019, 2019, 6520620. [Google Scholar] [CrossRef]
- Wu, C.-S.; Zhang, J.-Q.; Qi, L.-L.; Zhuo, D.-B. Defect Identification of Concrete Piles Based on Numerical Simulation and Convolutional Neural Network. Buildings 2022, 12, 664. [Google Scholar] [CrossRef]
- Dong, Y.; Su, C.; Qiao, P.; Sun, L. Microstructural crack segmentation of three-dimensional concrete images based on deep convolutional neural networks. Constr. Build. Mater. 2020, 253, 119185. [Google Scholar] [CrossRef]
- Zhou, S.L.; Song, W. Crack segmentation through deep convolutional neural networks and heterogeneous image fusion. Autom. Constr. 2021, 125, 103605. [Google Scholar] [CrossRef]
- Munawar, H.S.; Ullah, F.; Shahzad, D.; Heravi, A.; Qayyum, S.; Akram, J. Civil infrastructure damage and corrosion detection: An application of machine learning. Buildings 2022, 12, 156. [Google Scholar] [CrossRef]
- Abdel-Qader, I.; Abudayyeh, O.; Kelly, M.E. Analysis of edge-detection techniques for crack identification in bridges. J. Comput. Civ. Eng. 2003, 17, 255–263. [Google Scholar] [CrossRef]
- Hoang, N.-D. Detection of surface crack in building structures using image processing technique with an improved Otsu method for image thresholding. Adv. Civ. Eng. 2018, 2018, 3924120. [Google Scholar] [CrossRef]


Publisher’s Note: MDPI stays neutral with regard to jurisdictional claims in published maps and institutional affiliations. |
© 2022 by the authors. Licensee MDPI, Basel, Switzerland. This article is an open access article distributed under the terms and conditions of the Creative Commons Attribution (CC BY) license (https://creativecommons.org/licenses/by/4.0/).