Article

UHPC-Filled Rectangular Steel Tubular Beam–Column: Numerical Study and Design

1
School of Civil Engineering, Hubei Polytechnic University, Huangshi 435003, China
2
School of Civil Engineering, Hubei Engineering University, Xiaogan 432000, China
*
Author to whom correspondence should be addressed.
Buildings 2022, 12(11), 1882; https://doi.org/10.3390/buildings12111882
Submission received: 26 September 2022 / Revised: 23 October 2022 / Accepted: 31 October 2022 / Published: 4 November 2022
(This article belongs to the Special Issue New and Future Progress for Concrete Structures)

Abstract

:
This paper presents a numerical study on the nonlinear behaviors of UHPC-filled square steel tubular (UHPCFST) columns under complex actions. A novel fiber model was developed considering the local buckling effects of steel tubes. The reliability and robustness of the model were validated by a large amount of experimental data in the reported literature. Then, the current design codes were evaluated and discussed on the basis of the collected experimental data, and a practical calculation method was finally proposed to predict the bending moment capacities of UHPCFST beam–columns. The results indicate that the proposed fiber model can accurately predict the nonlinear behaviors of UHPCFST beam–columns, including axial compression, eccentric compression, pure bending, and hysteretic behaviors. Compared with current design codes, the practical calculation method presents high precision and can accurately predict the bending moment capacities of UHPCFST beam–columns.

1. Introduction

Concrete-filled steel tube members (CFST) have many merits, such as a high bearing capacity, high stiffness, and excellent ductility [1]. They are usually applied in high-rise buildings and long-span bridge structures, as shown in Figure 1. Ordinary concrete cannot meet the high performance demands of the structures due to its shortcomings, such as high self-weight, poor durability, etc. Compared with ordinary concrete, ultra-high-performance concrete (UHPC) possesses ultra-high compressive strength, high tensile strength, excellent durability, and long-term stability [2,3,4,5]. It has been gradually applied in engineering construction. For example, the usage of UHPC can be a great solution for structures such as concrete silos; bridge decks; and nuclear power plants for blast [6], impact, and high corrosion. Concrete matrix with ultra-high strength often possesses high brittleness under compression. To avoid this weakness, UHPC often needs to be confined by steel tubes (or FRP tubes) to form UHPCFST members. In this way, the sectional size and self-weight of members can be effectively decreased, and the structural available space can be increased under the same loading condition. Meanwhile, the bearing capacity and ductility can also be guaranteed [7,8]. As novel composite structures, UHPCFSTs can adapt the development of modern structures to the directions of super-rise, long-span, and heavy-load structures.
The width-to-thickness ratio of ordinary CFST column panels is controlled in practical engineering [9,10,11,12] (as shown in Table 1) so that the local buckling of the panels occurs after the overall buckling. Along with the basic advantages of ordinary CFST [13,14], thin-walled CFST can also save steel by 20~50% and reduce the cost by 10~40%, and it has a broad application perspective [9]. However, thin-walled steel tubes under compression—especially those with a square or rectangular cross-section shape (as shown in Figure 2) with large width-to-thickness ratios—are prone to local buckling due to the initial defect of the steel Local buckling has become an important factor influencing the bearing capacities and the post-peak ductility of thin-walled CFSTs [15,16,17]. In fiber models, the common approach to considering local buckling is to compute the effective distribution width of the steel tubes according to the sectional stress state [18,19,20,21]. It is known that this method needs to determine the critical buckling stress and ineffective distribution width of the steel tubes in advance. In addition, the regressive critical buckling stress and the ineffective distribution width of different types of steel present a large deviation, which brings about inconvenience for computation.
At present, there is some experimental research on the nonlinear behaviors of rectangular UHPCFST beam–columns, including axial compression, eccentric compression, cyclic, and fire-resistance behaviors. Although the confinement effect of steel tubes on the core UHPC is not as obvious as that on ordinary concrete, the local buckling of members is still inevitable under complex actions. In this work, a fiber model is put forward to the predict nonlinear behaviors of UHPCFSTs; in the model, the local buckling of the beam–column is considered by modifying compressive envelops of steel. Along with the effects of local buckling on the peak load and ductility of UHPCFSTs, the suitability of the current design codes is also comprehensively discussed. Finally, a practical calculation method is proposed to predict the bending capacities of UHPCFSTs.

2. Modeling Framework for UHPCFST Beam–Column

In this work, the fiber model, as shown in Figure 3, was adopted for computing the nonlinear behaviors of UHPCTST beam–columns.
In order to simplify the calculation model, several assumptions were made, as follows:
(1)
Plain section assumption.
(2)
The bond-slip in the interface between the UHPC and the steel tube was neglected.
(3)
The sine curve with a half wave for the lateral deflection curve of the beam–column.
In this work, considering that there would be large gaps in the interface after the local buckling of steel tubes (as shown in Figure 2); the slippage between the UHPC and the steel tube was neglected. On the basis of the plain section assumption, the strain in any place can be obtained:
ε i = ε 0 + φ y i
where ε0 is the strain at the central axial, yi is the distance between the center of ith fiber and the central axial, and φ is the sectional curvature. Hence, on the basis of the constitutive models of UHPC and steel as well as loading history, the internal forces such as axial load Nin and bending moment Min are expressed as:
N i n = i = 1 k σ c i A c i + i = 1 m σ s i A s i
M i n = i = 1 k σ c i A c i y i + i = 1 m σ s i A s i y k  
where σci and σsi are the stresses of UHPC and steel, Aci and Asi are areas of the UHPC and steel fibers, and k and m are the total numbers of fibers.

2.1. Constitutive Model of Materials

2.1.1. UHPC

The confinement effect needs to be considered in the fiber model. To date, many constitutive models of confined concrete have been proposed [1,22,23,24,25], some of which do not consider the confinement effect of square steel tubes, and some of the objects are circular steel tubes; most importantly, these models are usually aimed at ordinary concrete and may not be applicable to UHPC due to the mechanical property differences.
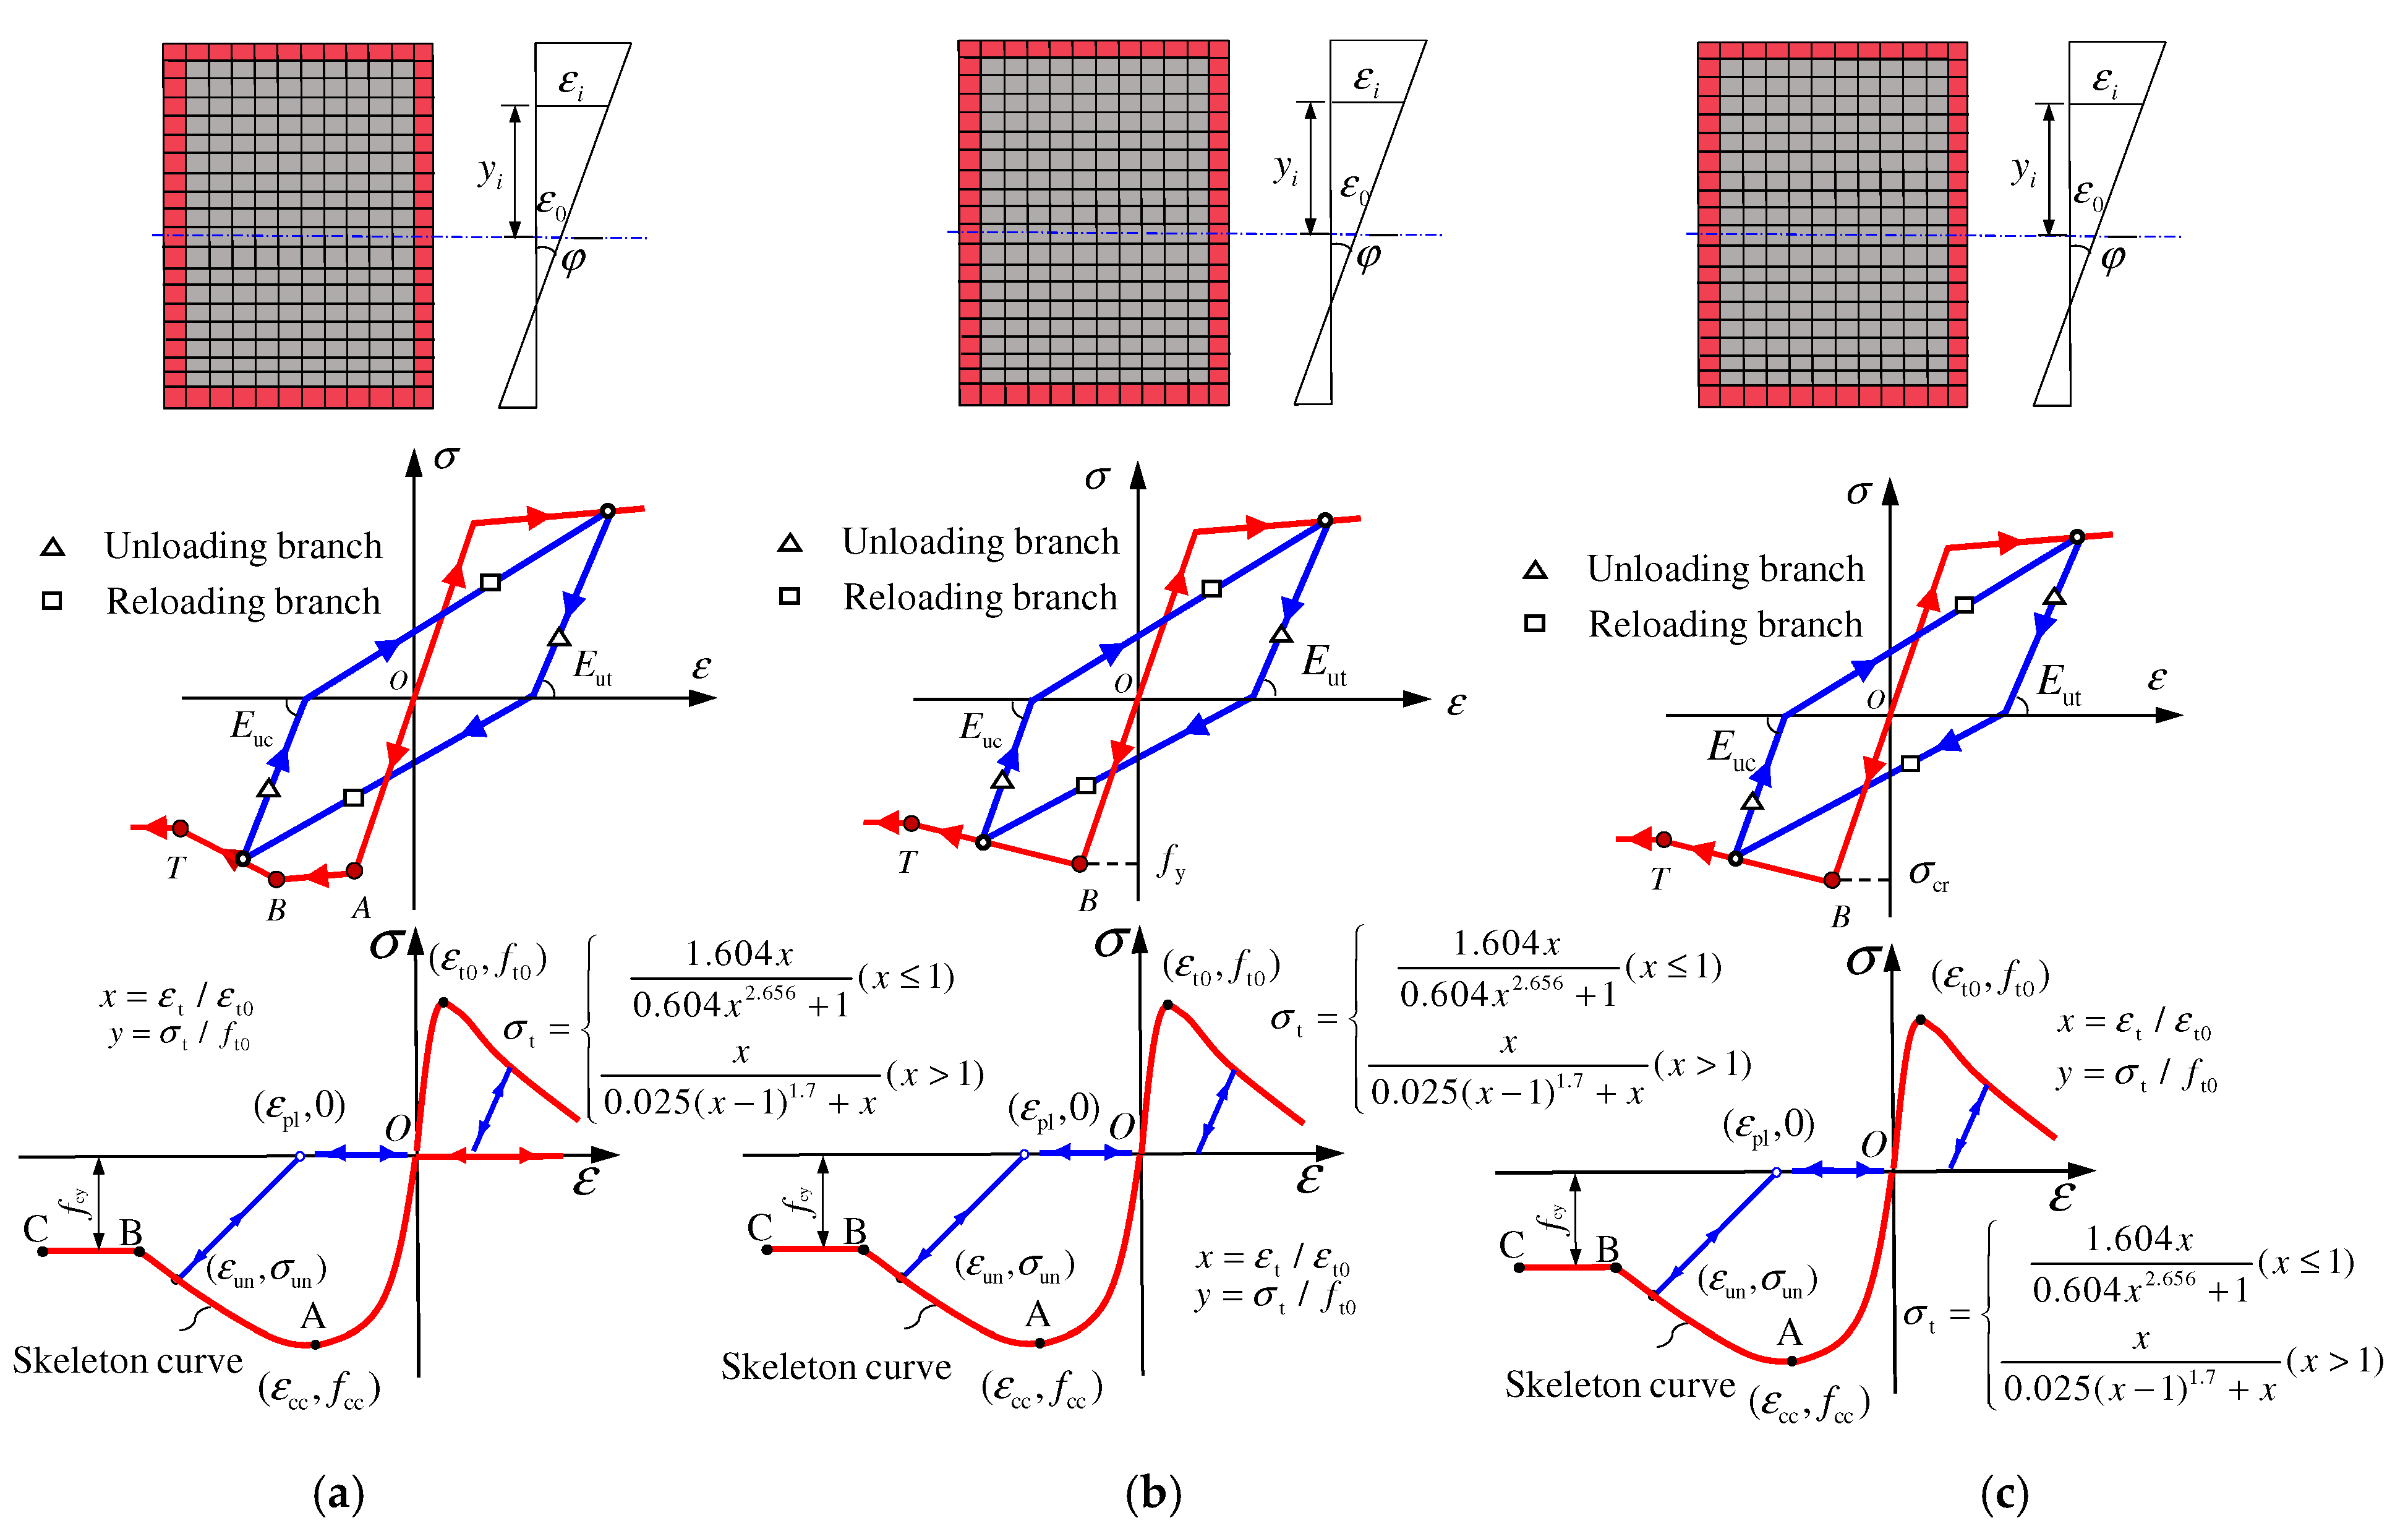
In this work, the constitutive model of confined UHPC proposed by Cai et al. [15] was adopted. As shown in Figure 3, the model contains skeleton curves and hysteretic criteria. The expressions of the skeleton curve are as follows:
The ascending branch OA:
σ c = f cc [ r ( ε / ε cc ) r 1 + ( ε / ε cc ) r ] ,   r = E c E c f cc / ε cc   for   ε     ε cc
The descending branch AB and horizontal branch BC:
σ c = f cy + ( f cc f cy ) exp [ ( ε ε cc α ) ς ] ,   f cy = 0.81 f cc 48
where fcy is the residual stress; ζ is the parameter that is taken as 4.0; α = 0.005 + 0.0075ξ; ξ is the confinement index; ξ = A s f y A c f c ; and εcc and fcc are the peak strain and stress of confined UHPC, which are shown as follows:
ε cc / ε c = 4.67 exp [ 24 ( f cc / f c 1 ) ] + 1.57 , f cc / f c = 1 + 0.051 exp ( 38.3 f el / f c )    
where fel is the equivalent lateral confining pressure; εc is the peak compression strain of UHPC without confinement, which is given by An and Fehling [26]. The expression is shown as Equation (7):
ε c = 0.00083 f c 0.276
In this work, the contribution of UHPC in the tensile region to the axial force and moment was also considered; the tensile stress–strain model of UHPC proposed by Hu et al. [27] was adopted, and the expressions are shown in Figure 3.
The hysteretic criteria incorporate unloading and reloading branches. In the present work, the residual plastic strain proposed by Mander et al. [28] was adopted, as shown in Figure 3. It should be noted that a straight line was adopted instead of curves in unloading and reloading branches.

2.1.2. Structural Steel

In the present work, the stress–strain envelope curve of steel under tension was still assumed as a bilinear hardening model with a hardening stiffness of 0.01 Es. As for the compressive skeleton curve, the local buckling effect was considered. The compressive stress–strain models proposed by Sakino et al. [29], as shown in Figure 4, were adopted.
In the equivalent constitutive model, the effect of local buckling of steel tubes was reflected by reducing the strength of the steel. The models were divided into 3 categories according to the width-to-thickness ratio coefficient ws. It is known that the models in Figure 4a,c are appropriate for steel tubes with small and large width-to-thickness ratios, and local buckling occurs after and before the yielding of steel tubes, respectively. The model in Figure 4b is appropriate for steel tubes with medium width-to-thickness ratios whose local buckling occurs exactly at yielding point B. The parameters are shown in Table 2.
Previous experimental research [30] indicated that the compressive unloading stiffness of the steel tube after buckling is obviously less than the initial elastic modulus Es, which is mainly attributed to the gradual loss of axial stiffness after the local buckling. In order to quantitatively describe this relationship, the compressive unloading stiffness Euc proposed by Dhakal [31] was adopted, as shown in Equation (8):
E uc / E s = ( f s , min / f t , min ) 2
where fs,min and ft,min are the stresses at the minimum strain point on the compressive envelope with and without local buckling considered, respectively.
As for tensile behavior, the unloading stiffness Eut gradually decreases with an increase in the maximum plastic tensile strain. Referring to research by Dodd [32], the relationship between the tensile unloading stiffness Eut and the maximum plastic tensile strain εs, max is given by:
E ut / E s = 0.82 + 1 5.55 + 1000 ε s , max
The complete constitutive models of UHPC and steel are shown in Figure 3. It should be noted that in computing the cyclic behavior of the UHPCFST beam–column, the stresses of UHPC and steel are also related to the loading history, except for strains.

3. Model Verification

In order to verify the universality of the proposed model, many experimental results of UHPCFST beam–columns in the reported literature were referenced for further verification.
In the modeling, an increment procedure was adopted, and an iterative algorithm was applied to meet the balance conditions between internal and external forces. The calculation flow diagram is shown in Figure 5.

3.1. Axial Behavior of UHPCFST Stub Columns

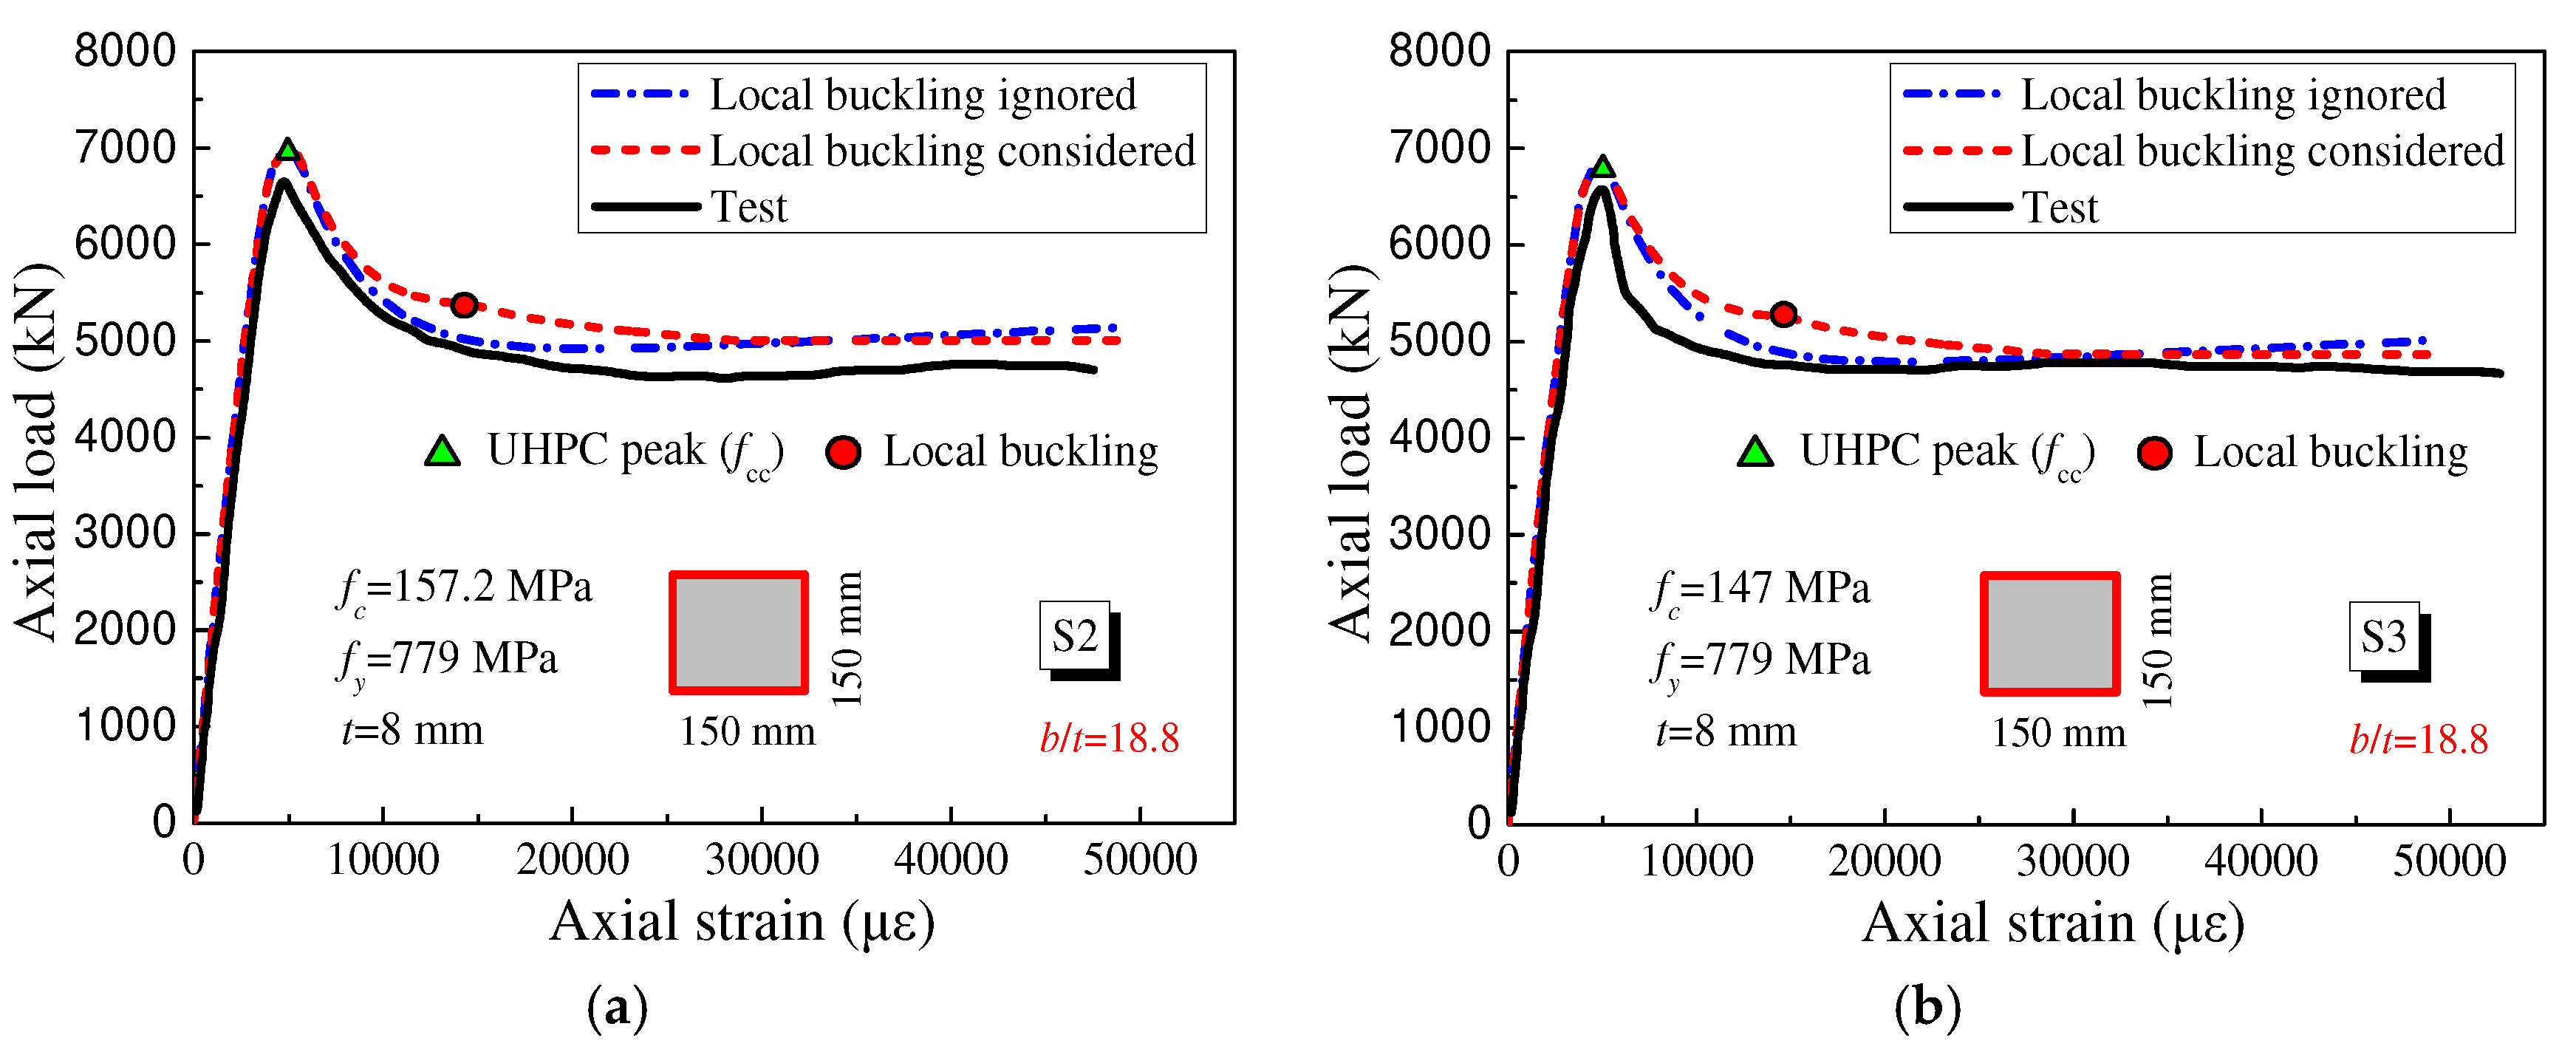
Chen et al. [33] and Xiong et al. [34] experimentally investigated square UHPCFST stub columns subjected to axial compression. In the present work, the axial force–strain (N-ε) curves of partial specimens with local buckling considered and ignored were calculated using the fiber model, and the comparisons between the predicted results and the test results are shown in Figure 6 and Figure 7.
As illustrated in Figure 6 and Figure 7, the axial loads of the specimens exactly reached the maximum value when the stress of the UHPC reached its peak value fcc. The calculated ascending branch slopes of specimens SS1-2 and SS1-3 were larger than the test results. This may be attributed to the interfacial slip between the UHPC and steel tubes. In addition, because of the hardening effect of steel and the reinforcing effect of the steel tube on the core UHPC, the axial load rapidly decreased after reaching the peak value and subsequently remained stable in the post-peak stage, which accounted for about 50~70% of the peak load and was related to the friction between the surfaces as well as the confinement effect of the steel tubes.
For the specimens SS1-2 and SS1-3 with a b/t of 50 in Figure 6, the local buckling occurred before the peak value, that is to say, local buckling occurred in the elastic stage. In this case, neglecting local buckling slightly overestimated the peak load and obviously overestimated the post-peak ductility of the UHPCFST columns. The predicted N-ε curves with local buckling considered were closer to the test results.
However, for specimens S2 and S3 with a b/t of 18.8 in Figure 7, the local buckling occurred in the plastic stage and had little influence on the predicted N-ε curves, which indicates that for specimens with a small b/t, local buckling can be neglected.

3.2. Eccentric Behavior of UHPCFST Columns

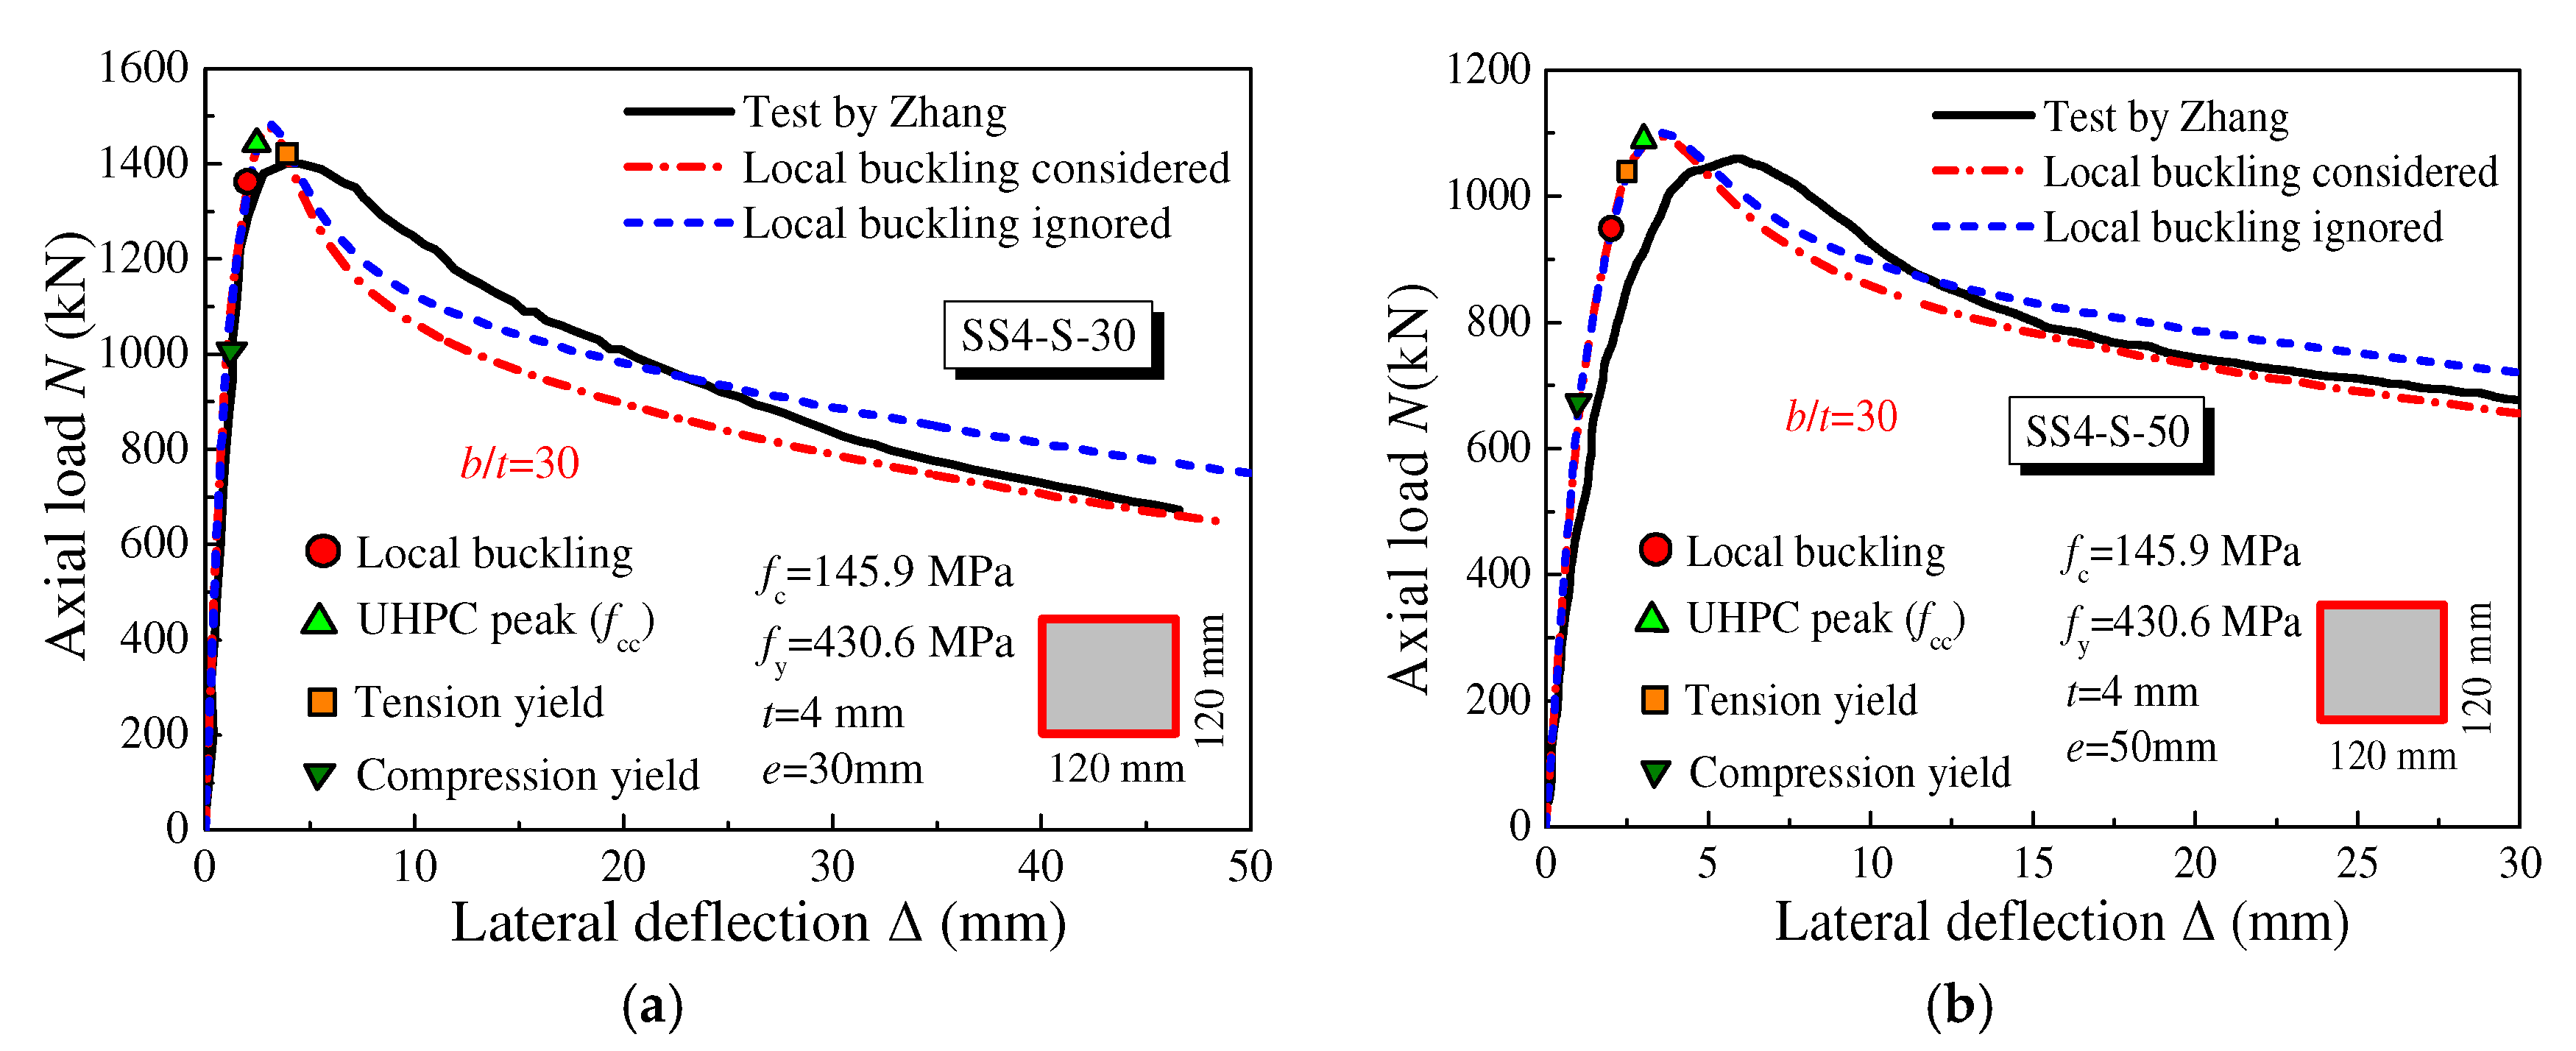
The behavior of square UHPCFST columns under eccentric compression was experimentally investigated by Zhang et al. [35]. The sectional size was 120 mm × 120 mm × 4 mm (b/t = 30), and the length of the column was 600 mm. The calculated behaviors of specimens SS-4-S-30 and SS-4-S-50 were compared with the experimental results, as shown in Figure 8.
It was found that the steel tube was first yielded in compression at relatively low load levels because of the relatively small value of the strength ratio fy/fc; the axial peak load was directly obtained once the point of peak stress (fcc) was slightly exceeded. The axial loads of the UHPCFST columns subsequently exhibited continuous reduction due to the stress degradation of UHPC and the P-Δ second-order effect. In addition, the comparison of SS4-S-30 and SS4-S-50 indicated that with an increase in eccentric distance, the tension yield of steel tubes occurred before the peak load, which means that the nonlinear behavior in the tensile regions of steel tubes develops faster.
In addition, local buckling for this series (b/t = 30) had little influence on the peak load and post-peak ductility and could be neglected.

3.3. UHPCFST Beams Subjected to Bending

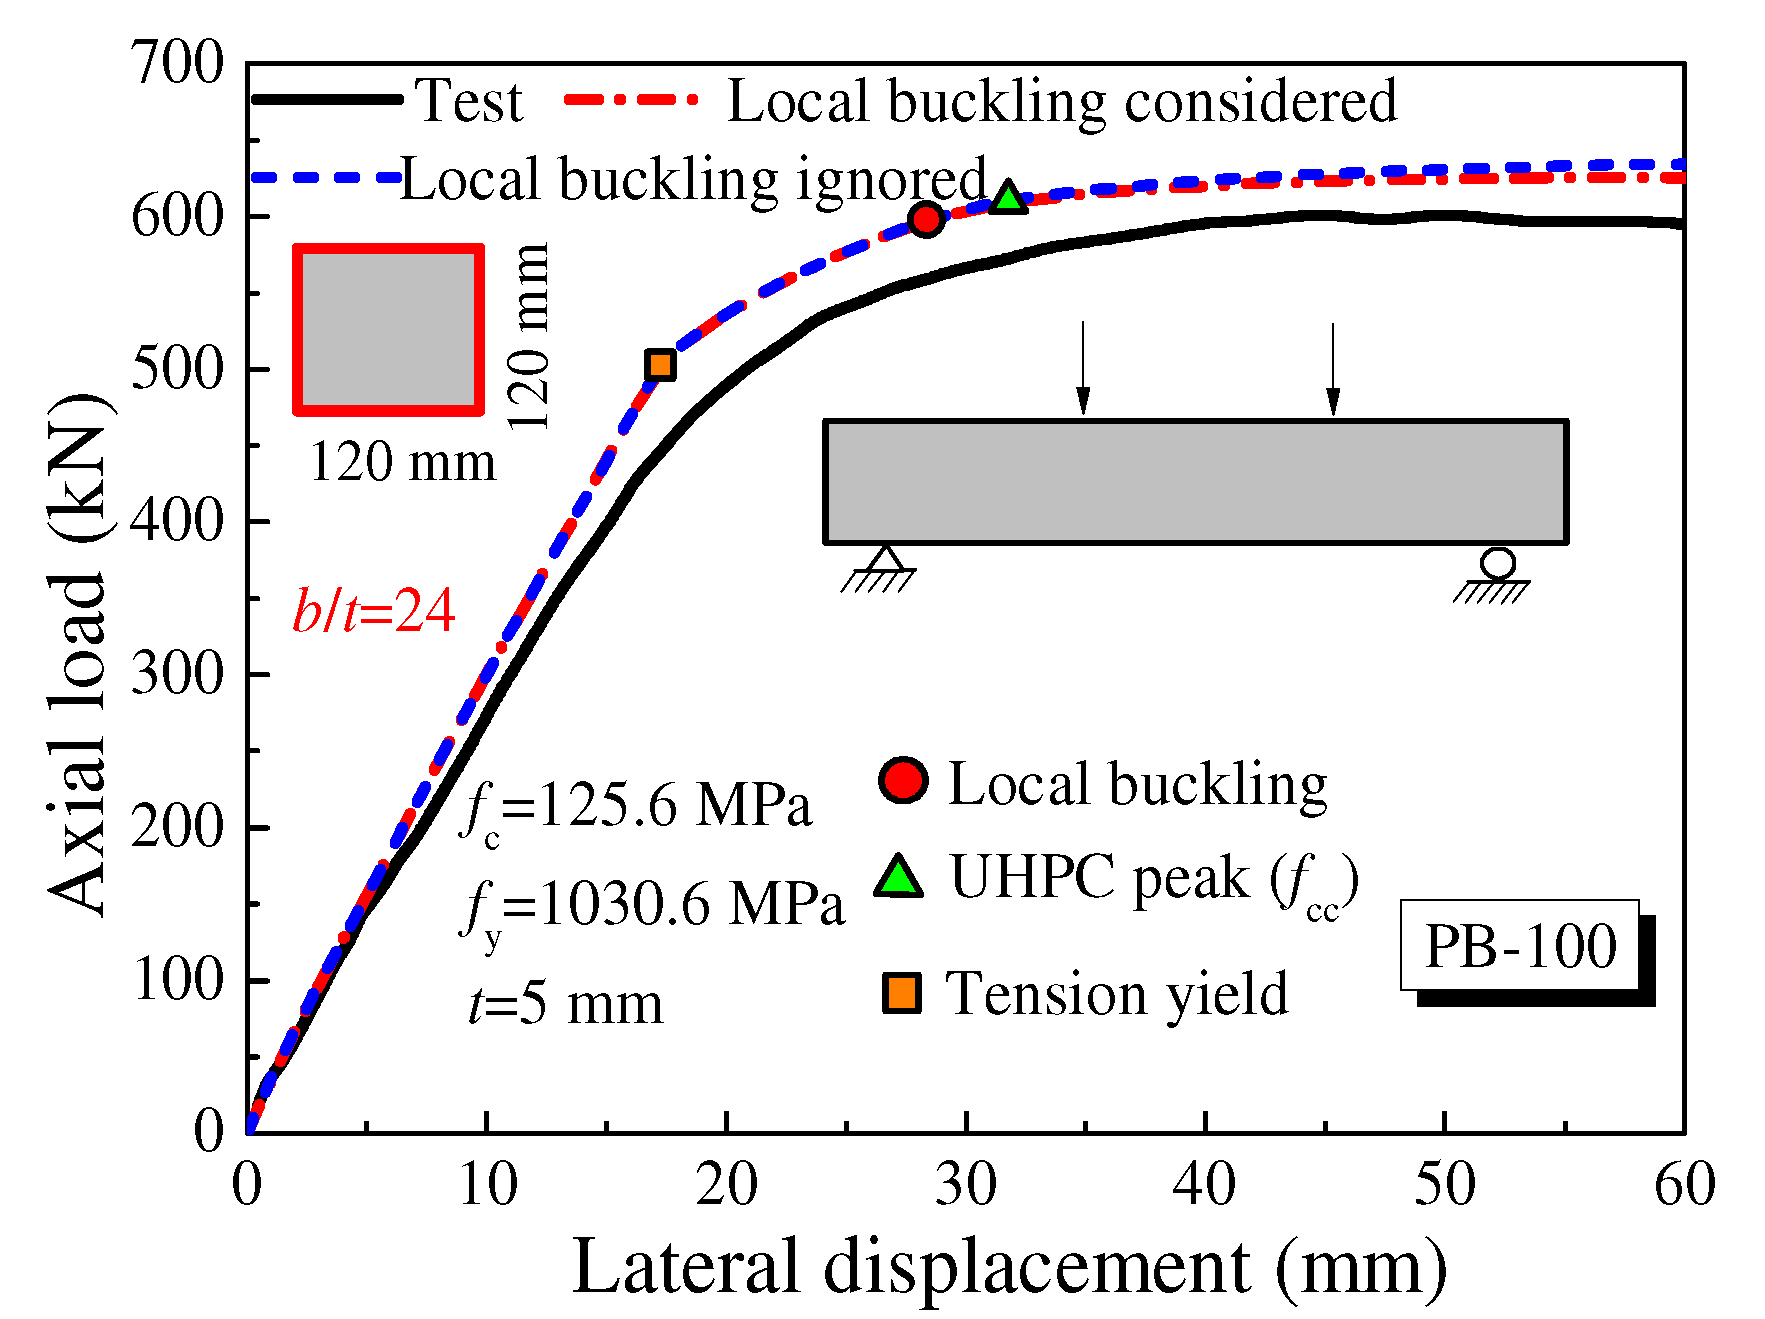
Huang et al. [36] and Guler et al. [37] experimentally researched the flexural behavior of UHPCFST beams. In this work, the load-deflection (F-Δ) at mid-span and moment-curvature (M-φ) curves were calculated using the fiber model; the comparisons of the predicted results with the test results are shown in Figure 9 and Figure 10.
For specimen PB-100 in Figure 9, the tension yield occurred first. Because of the small value of b/t (24), the local buckling occurred at high curvatures, and the local buckling had little influence on the flexural behavior of the UHPCFST beam. Furthermore, the slope of the predicted F-Δ curve was slightly larger than the test result; this may be attributed to the bond-slip between the steel tube and the UHPC interface in the loading process.
However, for the hollow steel tube (BH-2.5-1) with a width-to-thickness ratio of 32 in Figure 10, the predicted M-φ curve with local buckling ignored did not show a descending branch, whilst the predicted curve considering local buckling was closer to the test result. This is due to the fact that although the width-to-thickness ratio was not large, the hollow steel tube without infill UHPC was more prone to local buckling under compression.

3.4. UHPCFST Columns Subjected to Cyclic Loading

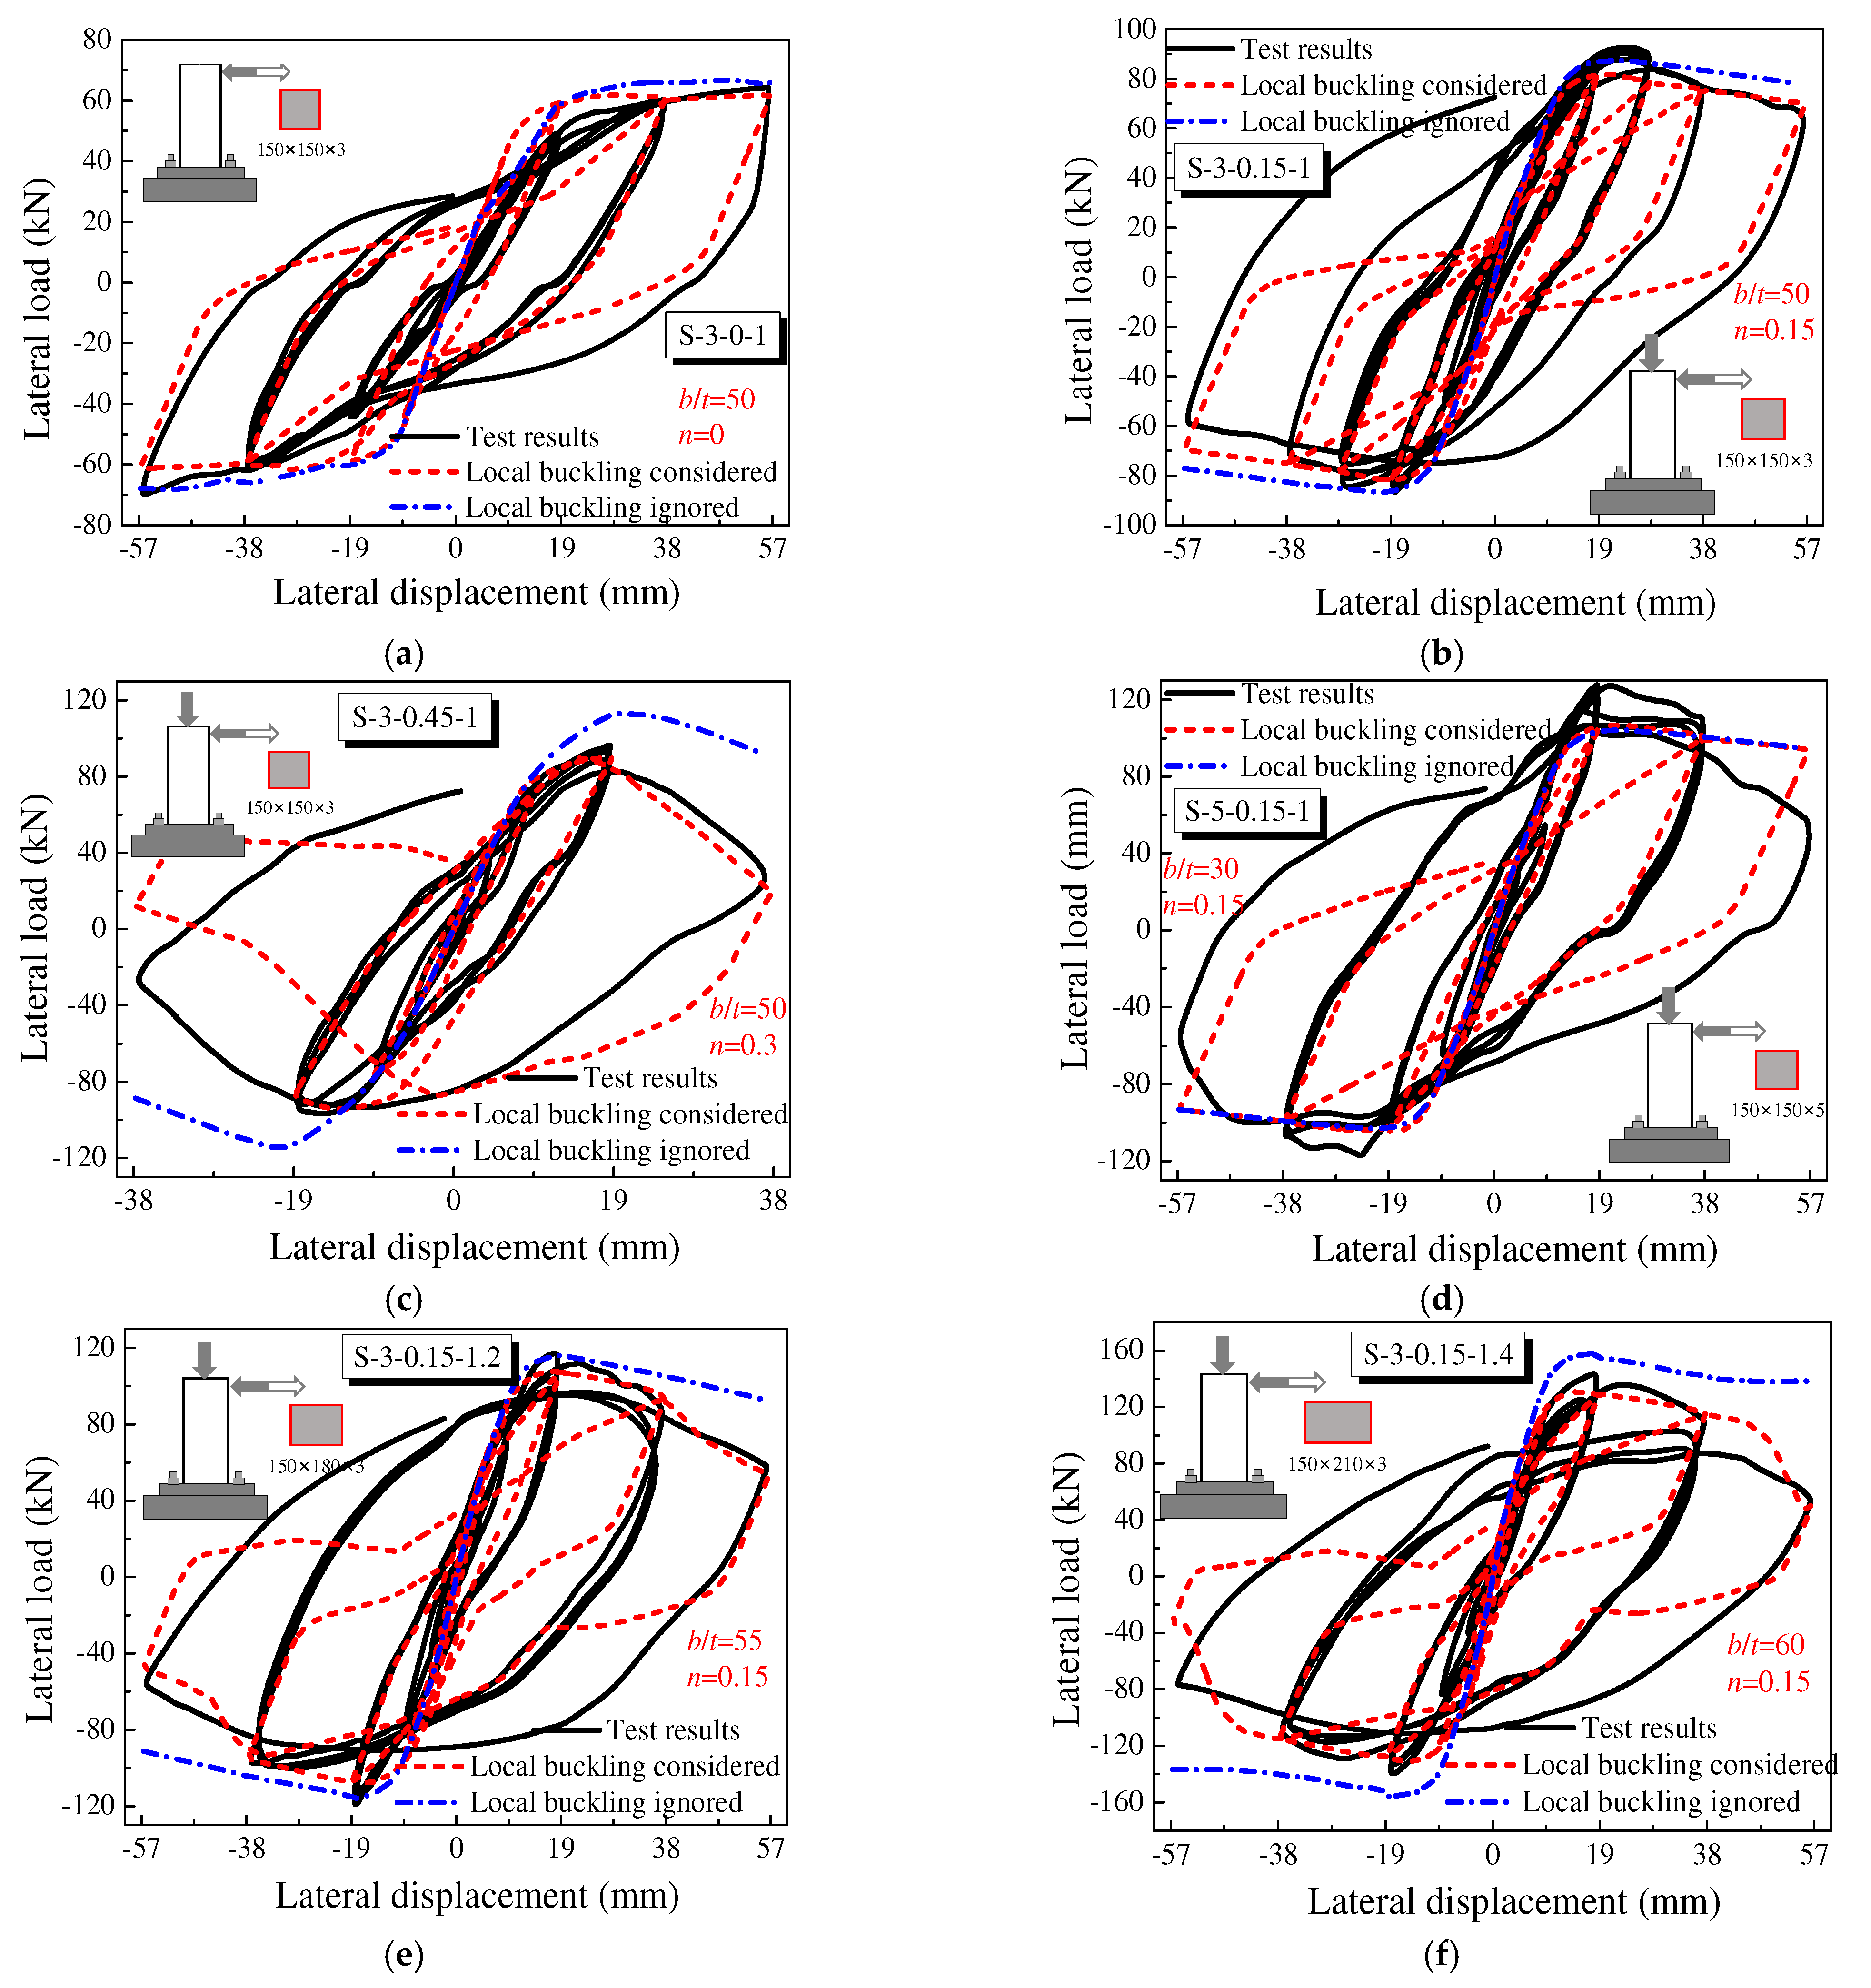
The pseudo-static test is an effective method to evaluate the cyclic behavior of UHPCFST beam–columns because the bearing capacity, ductility, stiffness, and dissipated energy are reflected in hysteretic curves. In this work, the lateral load–displacement (P-Δ) hysteretic curves of UHPCFST columns were computed and compared with the experimental results by Cai [38], as shown in Figure 11. The skeleton curves with local buckling ignored are also plotted in Figure 11.
As shown in Figure 11a–c, the b/t remained at a constant value of 50. It was observed that the influence of local buckling on specimen S-3-0-1 with zero axial compression ratio was very small. However, as n increased to 0.15 and 0.45, neglecting the local buckling of the steel tubes obviously overestimated the peak load and post-peak ductility of the UHPCFST columns. For specimen S-3-0.45-1, the calculated peak load with local buckling ignored was 113.4 kN; the error was up to 17% compared with the tested value of 96.9 kN. This is attributed to the fact that the partial cross-section areas of steel tubes were out of work after local bucking, which weakened the bending resistance and the confinement effect on the core UHPC.
As shown in Figure 11d–f, n remained at a constant value of 0.15. It was found that for specimen S-5-0.15-1 with a width-to-thickness ratio of 30, local buckling had no significant effects. However, as b/t increased to 55 and 60, neglecting the local buckling also overestimated the peak load and post-peak ductility of the UHPCFST columns, which led to insecurity in the seismic design of structures. It was noted that there were some deviations in the unloading and reloading branches between the predicted results and test results, which were closely related to the pinched characteristics of the Clough model.
On the whole, the axial compression ratio (n) and width-to-thickness ratio (b/t) are the most important factors affecting the local buckling of members. On the one hand, the increase in the axial load significantly increased the stress levels; on the other hand, the critical stress for local buckling was significantly reduced with the increase in the width-to-thickness ratio.

4. Proposed Practical Method for Moment Bearing Capacity

According to the authors’ survey, 40 rectangular UHPCFST specimens under combined axial compression and bending were collected to evaluate the current design codes and propose a new calculation method. The experimental database is listed in Table 3.

4.1. Comparisons with Current Provisions Codes

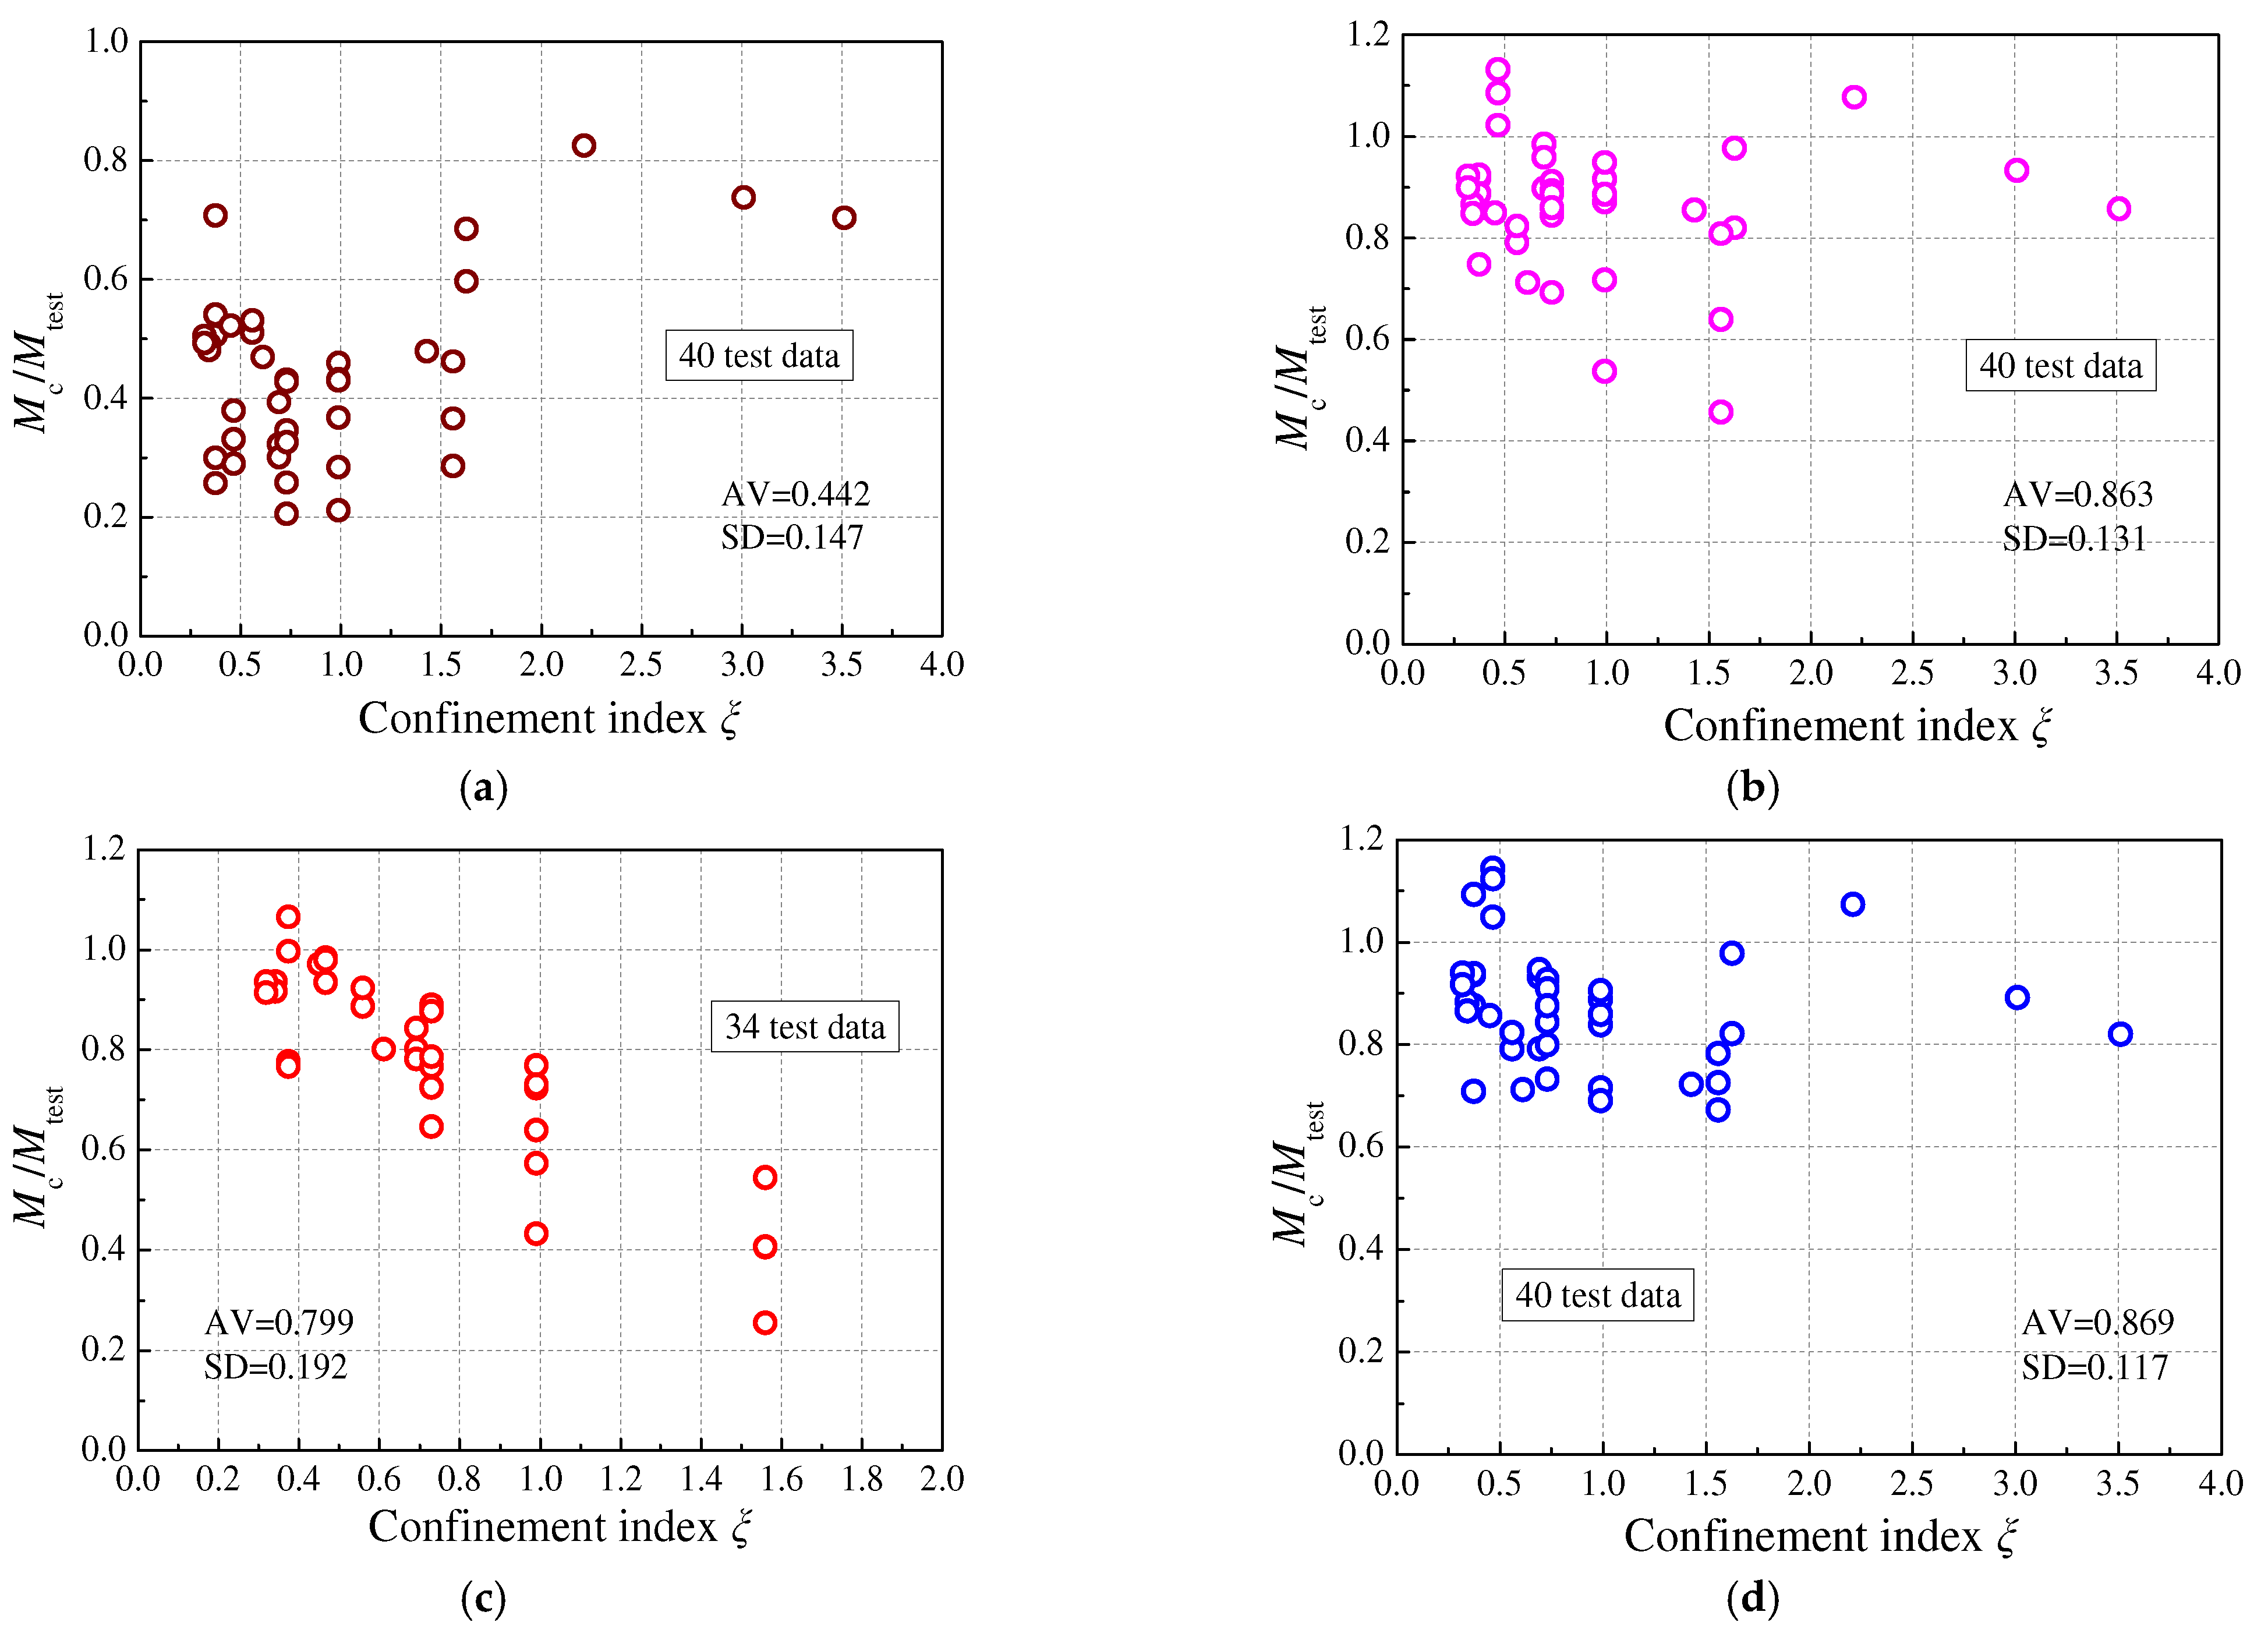
Currently, there are several design codes to calculate the bending moment capacities of CFSTs, such as AISC-LRFD [40], EC4 [10], GB50936 [11], and AIJ [12]. In the present work, the bending moment capacities of the specimens in Table 3 calculated by different design codes were compared with test results, as shown in Figure 12; the average value (AV) and standard deviation (SD) were also computed and are shown in each figure.
It was observed that these design codes underestimate the bending moment capacities of UHPCFST columns to some extent, especially AISC, whose AV value was only 0.442. This is mainly because AISC neglects the contribution of the infilled concrete to the moment of the composite section, although it considers the stability of slender columns. EC4 and AIJ, based on plastic distribution, predicted relatively accurate results but were also inclined to be conservative in predicting the bending moment capacities of UHPCFST columns. The calculated AV values were 0.863 and 0.869, respectively. In addition, they also ignore the confinement effect of square steel tubes on the core concrete. On the basis of unified theory, GB50936 specifies that the confinement index (ξ) is within the range of 0.5~2.0, and once ξ exceeds this range, the composite strength fsc shows a large deviation, as shown in Figure 12c.

4.2. Proposed Calculation Method

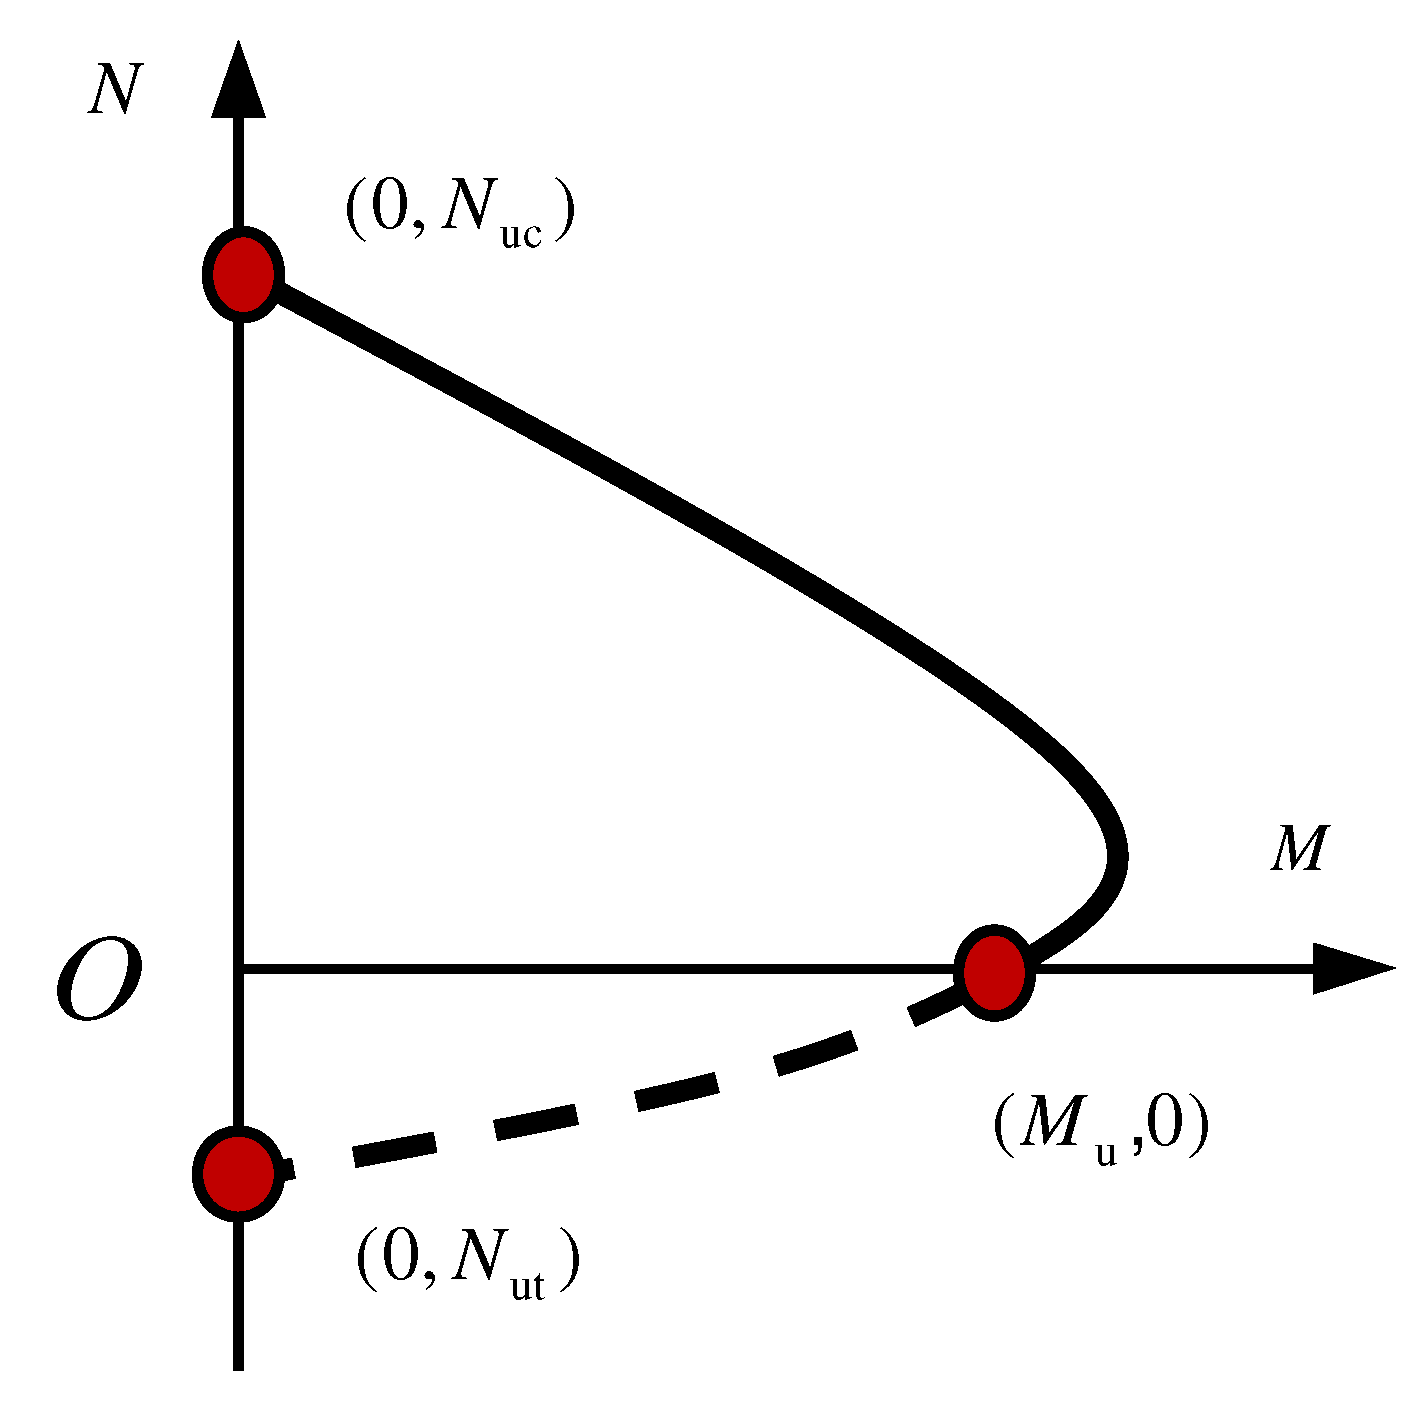
Through the analysis above, a practical method for predicting the bending moment capacities of UHPCFSTs needs to be proposed. In the present work, the N-M interaction curve of the UHPCFST beam–column was established by constructing a quadratic parabola, as shown in Figure 13. The expression is shown in Equation (10):
M M u = ( 1 N N uc ) ( 1 N N ut )
where Mu is the pure bending bearing capacity, Nuc is the axial compression bearing capacity, and Nut is the axial tensile bearing capacity. It can be seen in Equation (10) that once Mu, Nuc, and Nut are determined, the N-M interaction curve can be uniquely determined.
(1)
Axial compression bearing capacity Nuc
Similarly, the current design codes are also not appropriate for predicting the axial compression bearing capacity of UHPCFST columns [33,39]. In this work, the test data of 37 rectangular UHPCFST columns subjected to axial compression were collected; the experimental database is listed in Table 4.
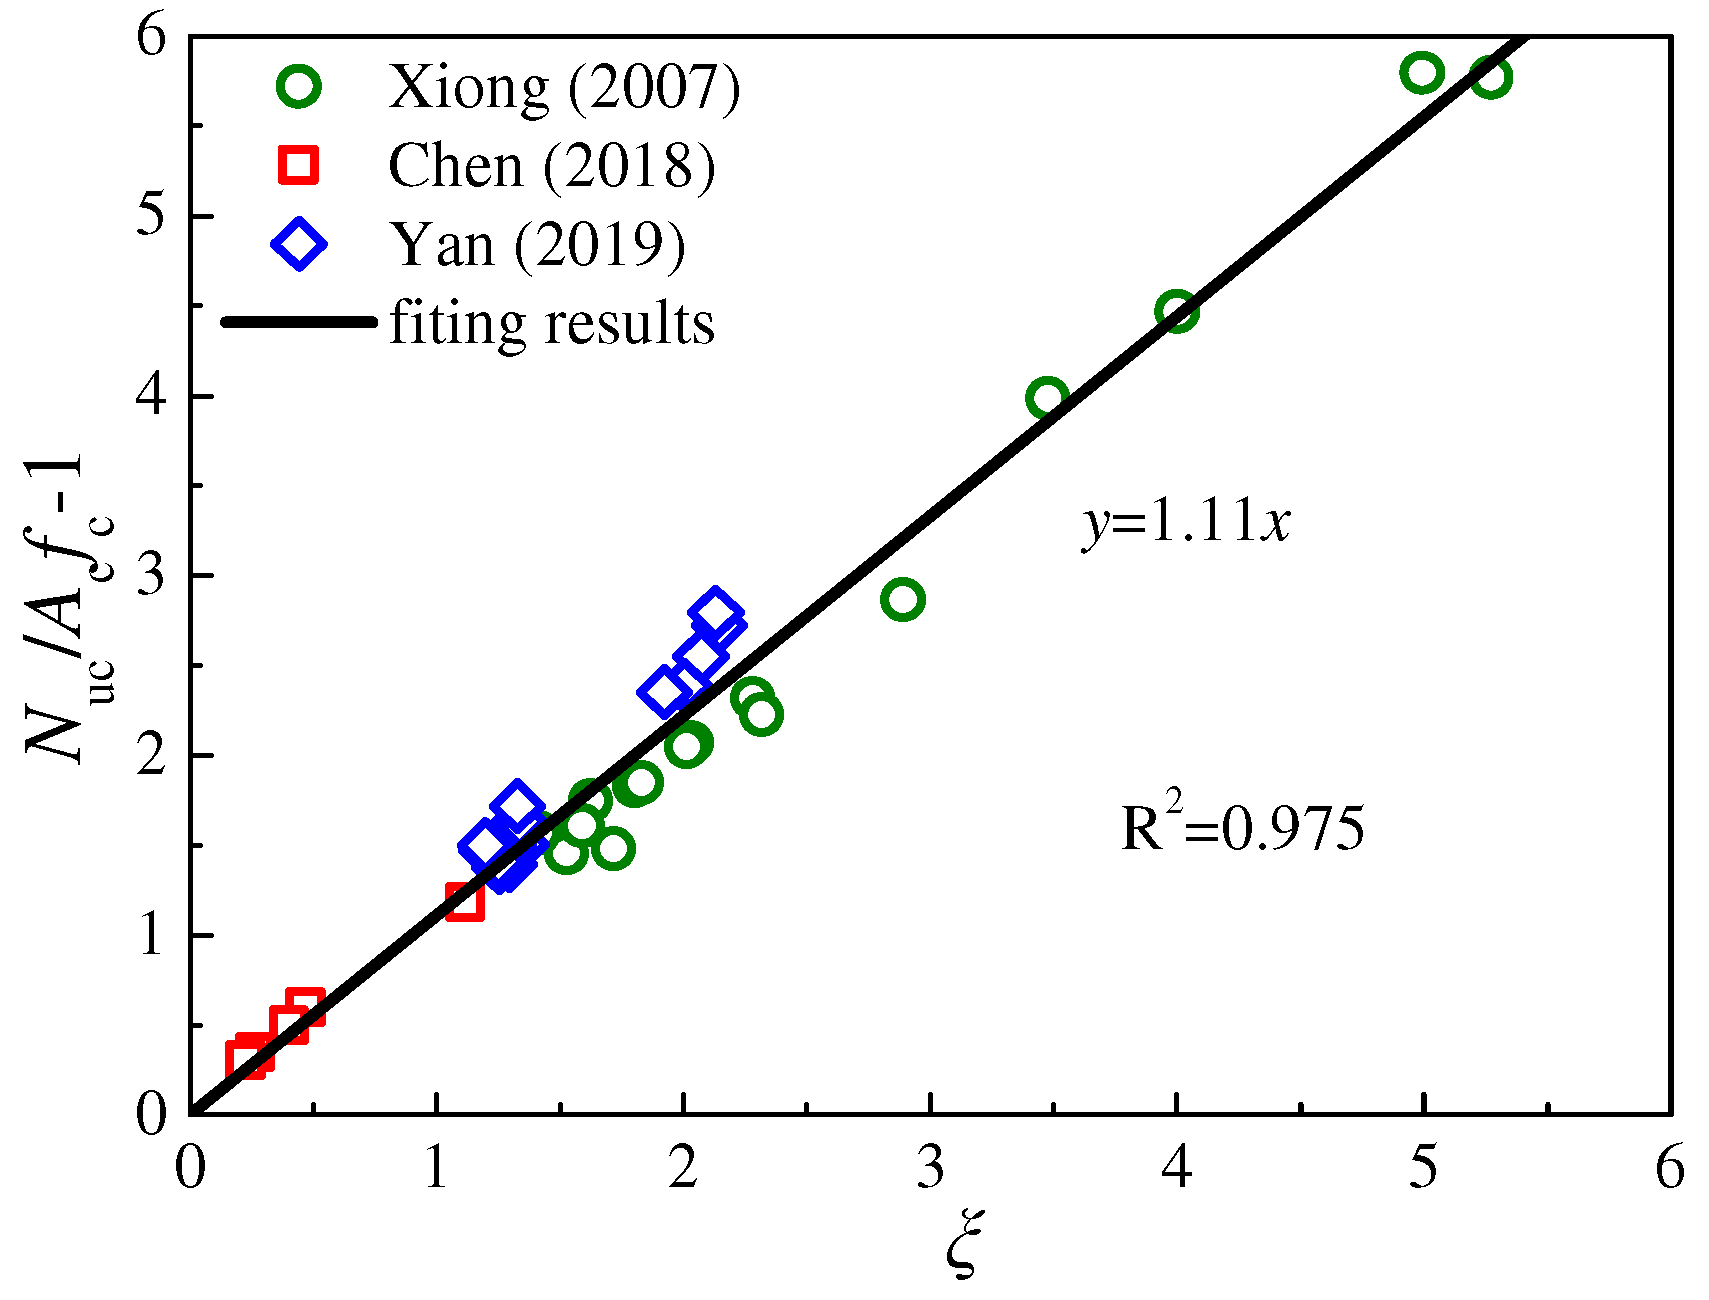
According to the ultimate equilibrium theory and considering the confinement effect of rectangular steel tubes, Nuc was established by regression analysis (Figure 14), and the expression is shown in Equation (11):
N u c = f c A c ( 1 + 1.11 ξ )
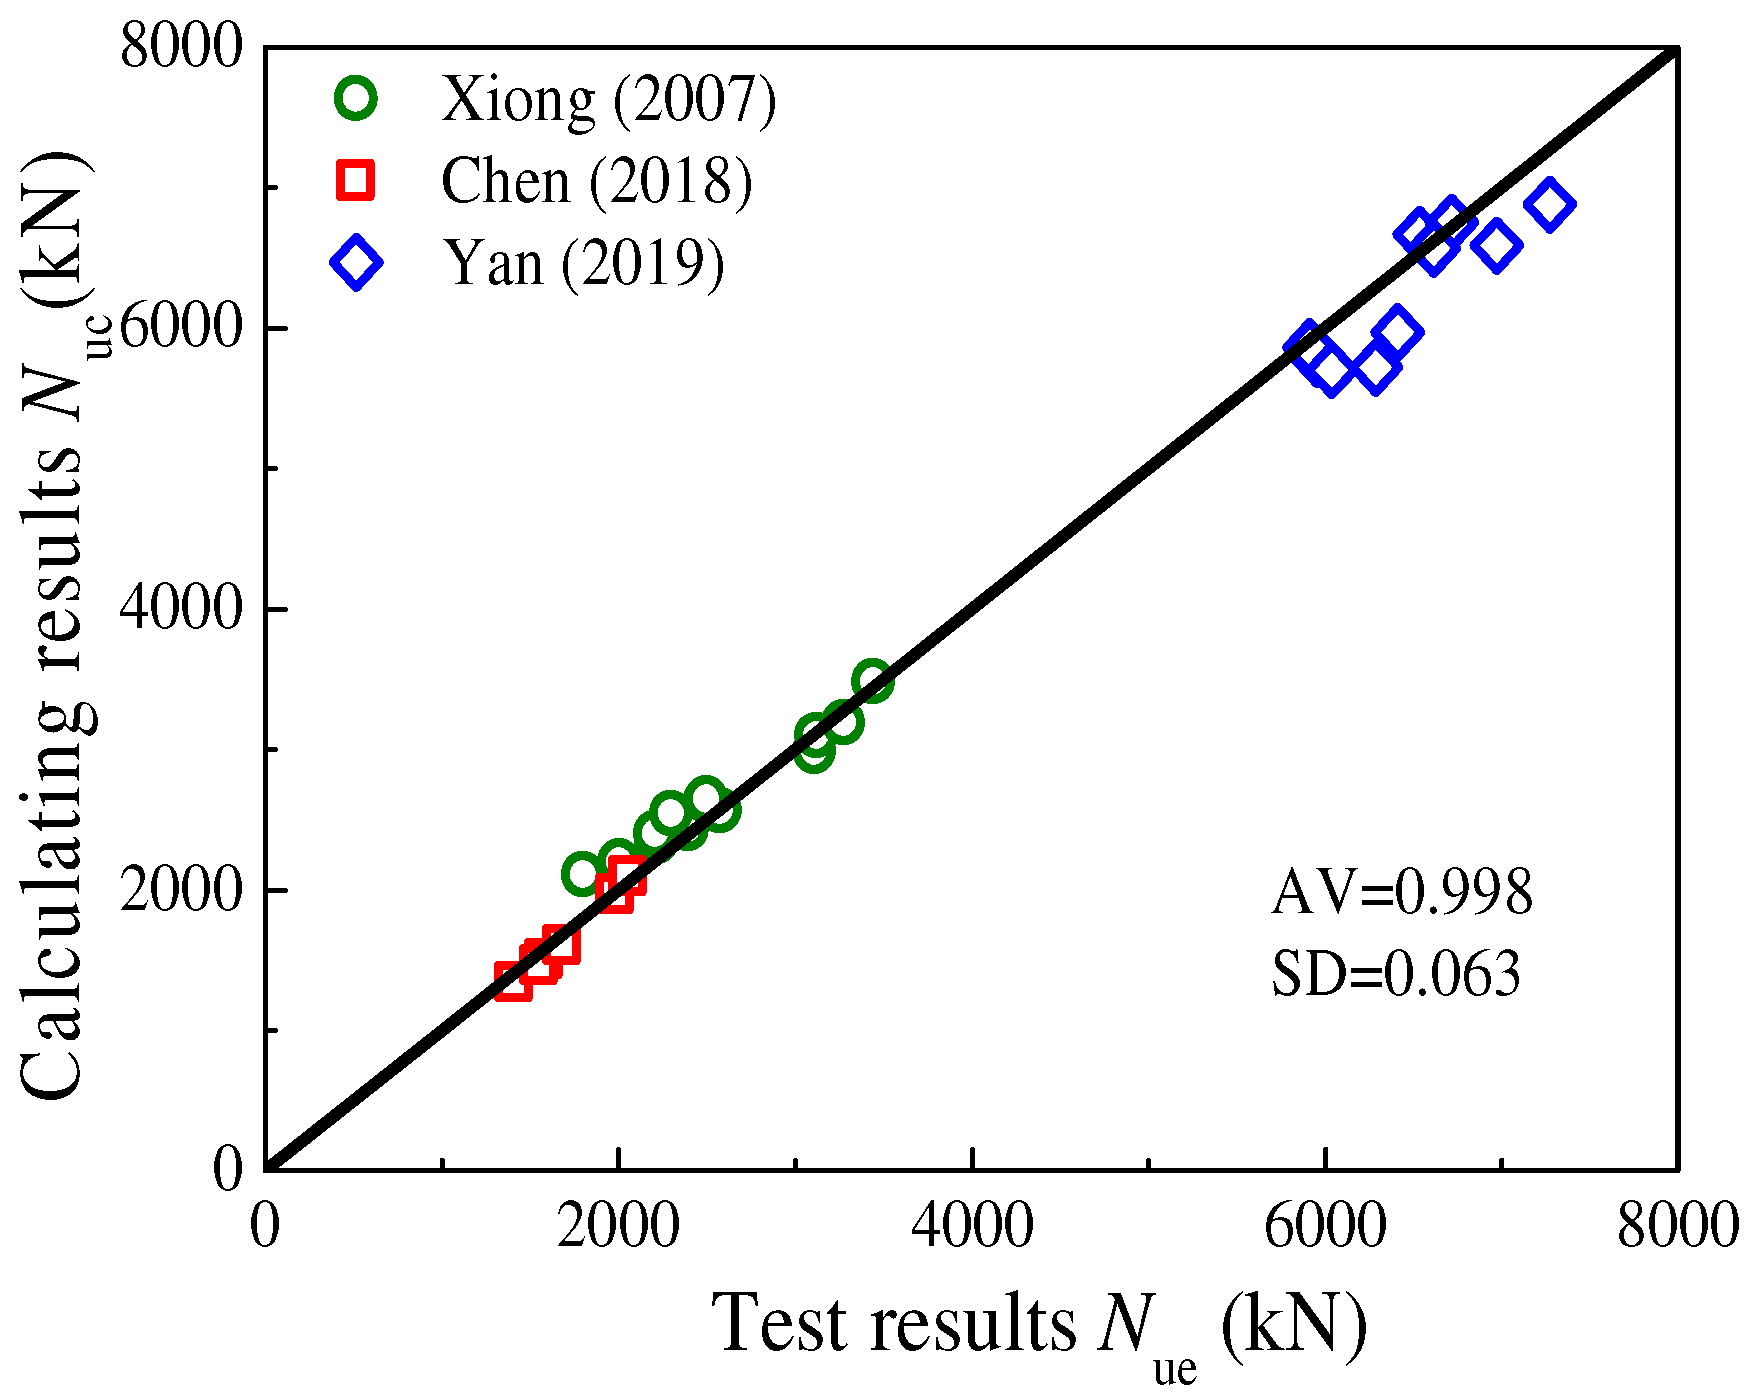
The calculated results of axial compression bearing capacities using Equation (11) were compared with the experimental values, as shown in Figure 15. It was observed that Equation (11) possesses high precision, with an AV value of 0.998.
(2)
Pure bending bearing capacity Mu
Similarly, 17 rectangular UHPCFST beams under pure bending were collected; the experimental database is listed in Table 5.
On the based of unified theory, the expression of Mu is given by:
M u = γ m f sc W sc
where fsc is the strength of the composite section, fsc = Nuc/Asc, and Asc is the total section area. Wsc is the sectional bending modulus; γm is the plastic coefficient of the cross-section, which is obtained by regression analysis (Figure 16). The expression is given by:
γ m = 1.2 + 0.45 ln ( ξ + 0.1 )
The predicted results of pure bending bearing capacities using Equation (12) were compared with the experimental values, as shown in Figure 17. It can be seen that the errors were almost within the range of 15%.
(3)
Axial tensile bearing capacity Nut
Lai et al. [44] experimentally researched the axial tensile behavior of RPC-filled steel tube columns and established the axial tensile bearing capacity Nut; the expression is shown as follows:
N ut = ( 1.1 + 0.4 α s ) A s f y + 0.9 A c f t
where αs is the steel ratio, as = As/Asc, and ft is the tensile strength of UHPC.
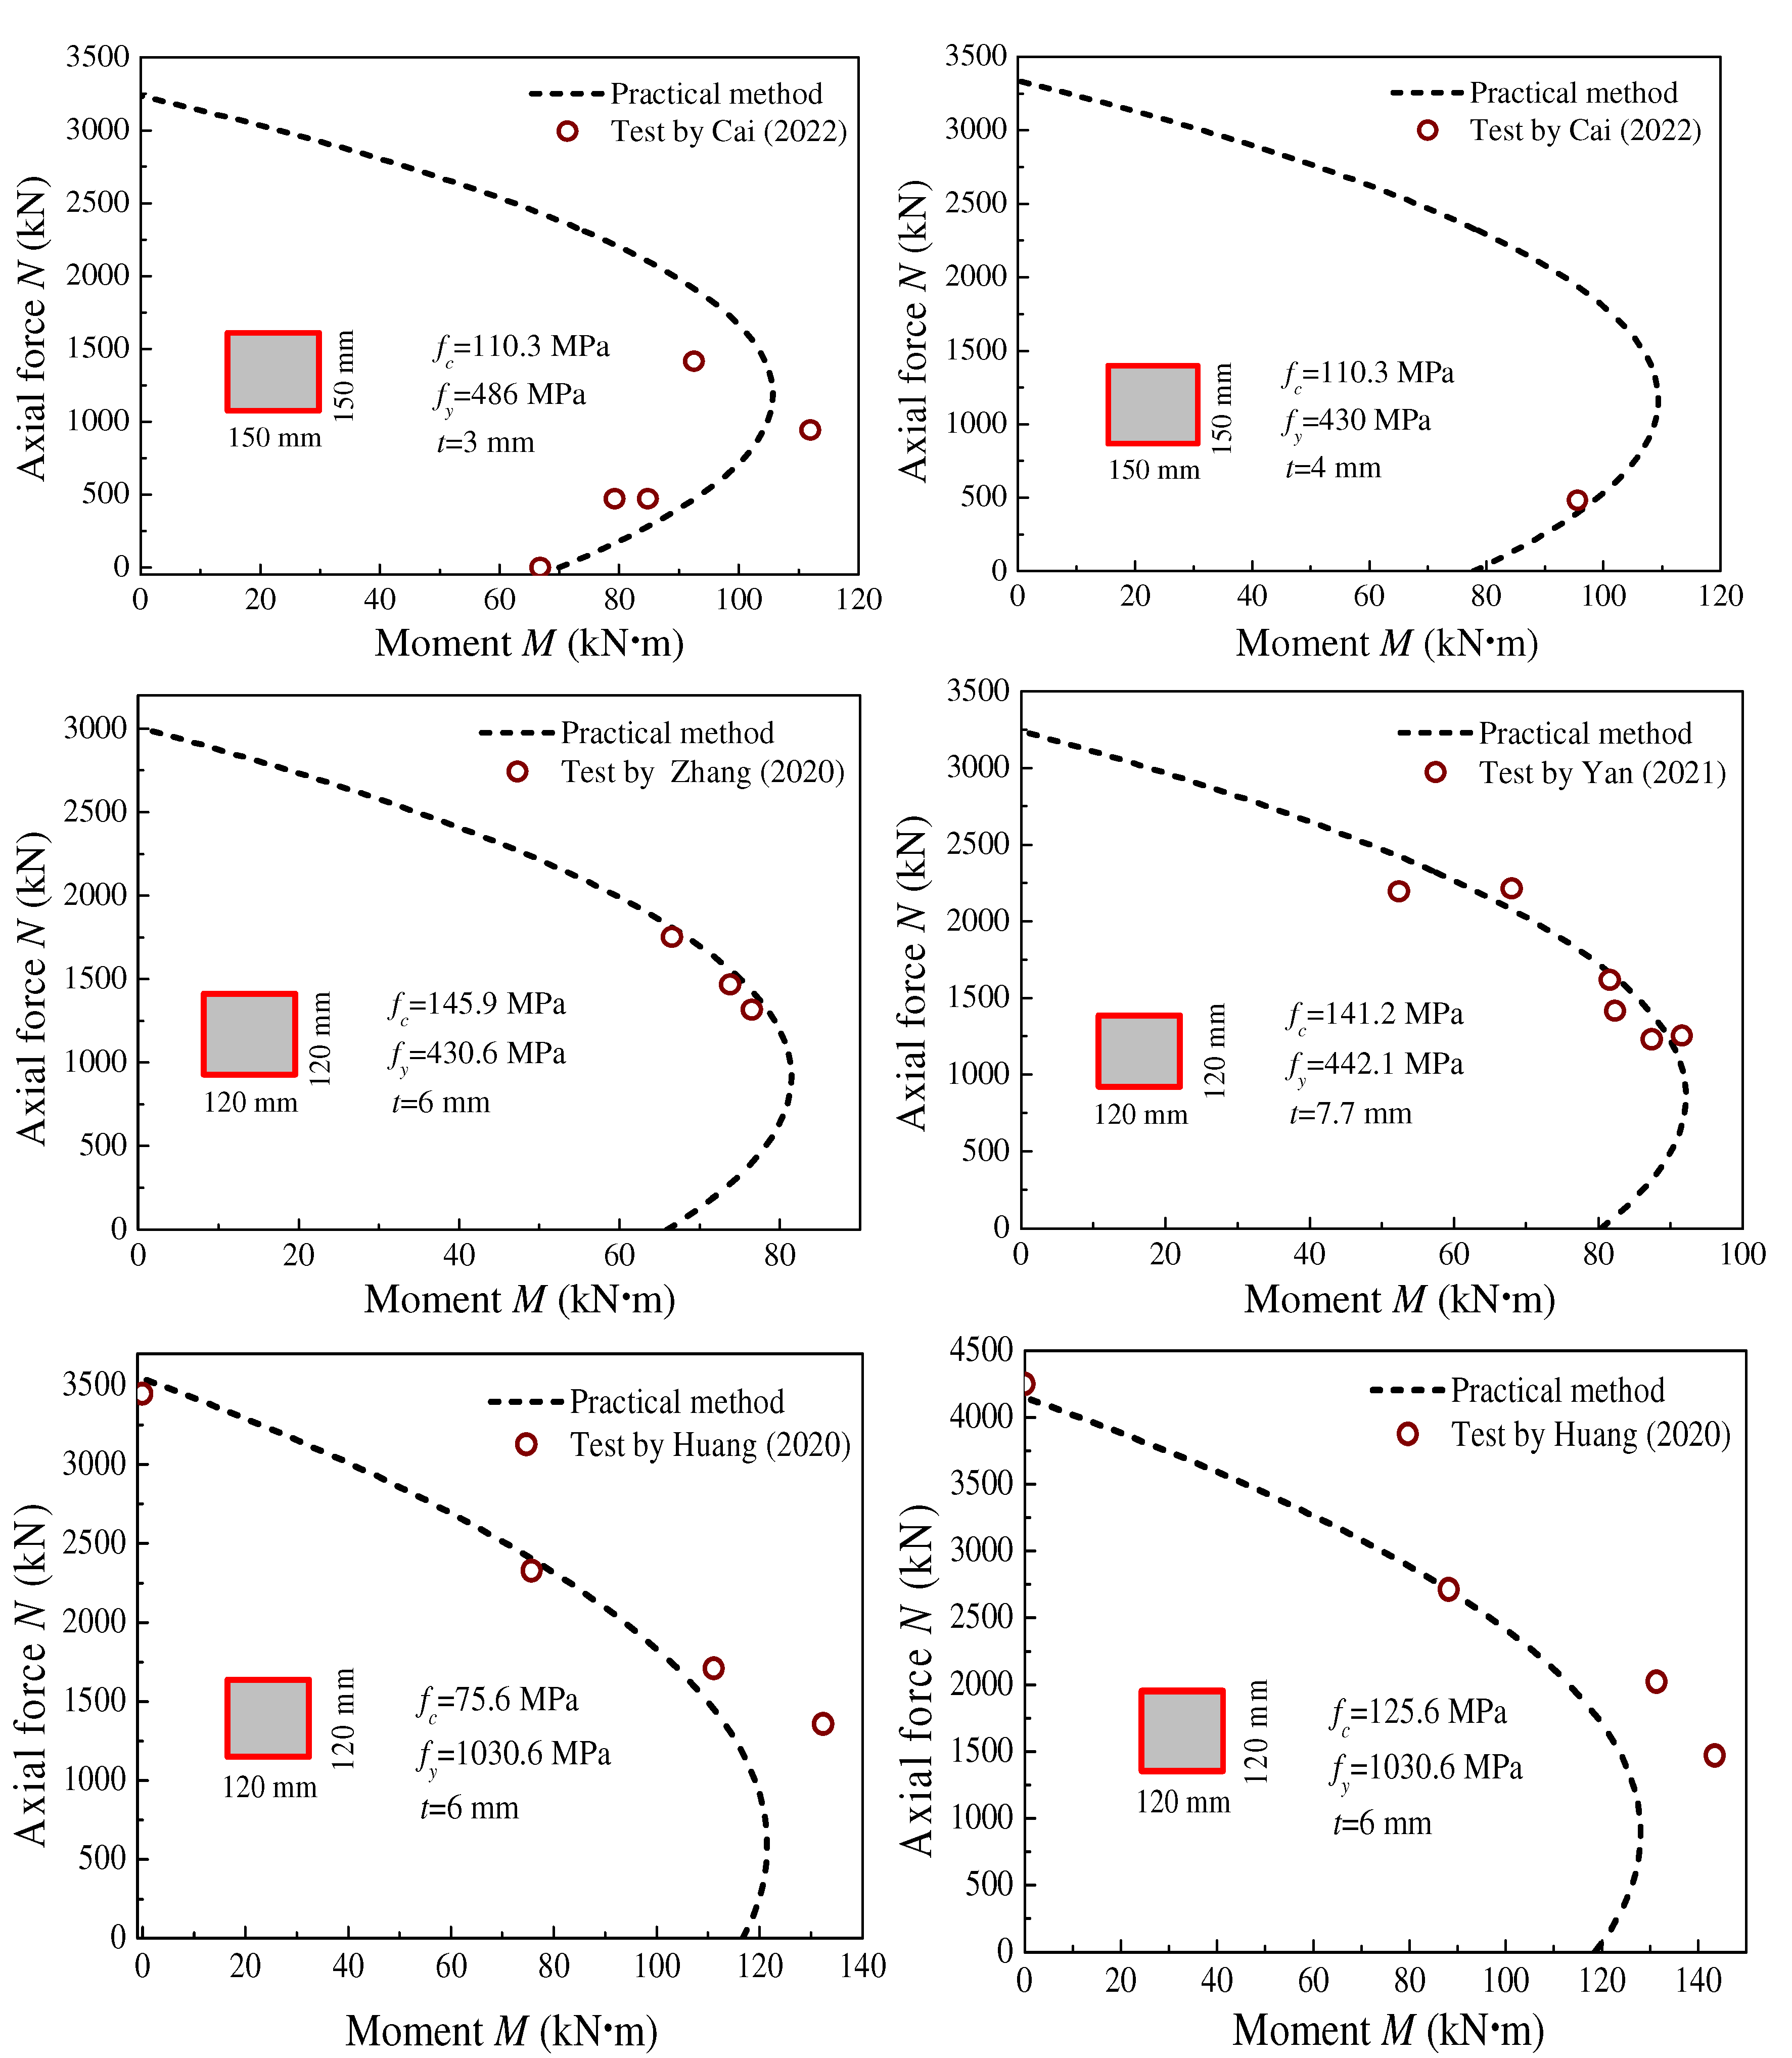
The bending moment capacities of UHPCFST columns in the reported literature (Table 3) were predicted using Equation (10) and compared with the test results, as shown in Figure 18 and Figure 19. It can be seen that the predicted values agree well with the test results, and the proposed practical method presents high precision, with an AV value of 1.04.

5. Conclusions

In the present work, the modified stress–strain models of steel were integrated into the fiber model to consider the local buckling of steel tubes. The nonlinear behaviors of UHPCFST beam–columns under complex actions were comprehensively analyzed and discussed using the fiber model. The correctness and robustness of the fiber model were verified on the basis of many experiments in the reported literature. Then, the current design codes, such as AISC, EC4, GB50936, and AIJ, were evaluated on the basis of a large amount of available experimental data. Finally, a practical method was proposed to predict the bending moment capacities of UHPCFST beam–columns. According to the analysis and discussions presented in this work, the following conclusions can be drawn:
1.
The axial compression ratio (n) and width-to-thickness ratio (b/t) are two significant factors that affect the local buckling of steel tubes. Neglecting the local buckling of thin-walled steel tubes overestimates the post-peak ductility of the UHPCFST beam–column; the overestimation of the peak load is up to 17%. However, when b/t is less than 30, the local buckling can be neglected.
2.
EC4 and AIJ design codes predict relatively accurate bending capacities of UHPCFSTs with AV values of 0.863 and 0.869; even ξ is within the suitable range of 0.5~2.0, and the AV value provided by the GB50936 is only 0.799.
3.
A practical method was proposed in this work to calculate the bending moment capacities of UHPCFSTs by constructing a quadratic parabola. Compared with the experimental results in the published literature, the proposed method possesses high precision with an AV value of 1.04.
The static and cyclic behaviors of UHPCFSTs were analyzed in this work. Considering that UHPCFSTs are subjected to complex actions, fire and impact resistance need to be further investigated using the fiber model, and the corresponding formulas to calculate bearing capacity need to be established in future work.

Author Contributions

H.C., Investigation, Data curation, Formal analysis, Validation, Writing—original draft; Y.Y., Methodology, Conceptualization, Writing—review & editing. All authors have read and agreed to the published version of the manuscript.

Funding

Key program of the National Natural Science Foundation of China (Grant Nos. 51738011), Natural Science Foundation of Xiaogan City Hubei Province (Grant Nos. XGKJ2022010099).

Data Availability Statement

Data will be made available on request.

Acknowledgments

The present work was supported by the Key Program of the National Natural Science Foundation of China (Grant Nos. 51738011) and Natural Science Foundation of Xiaogan City Hubei Province (Grant Nos. XGKJ2022010099).

Conflicts of Interest

The authors declare no conflict of interest.

References

  1. Han, L.H. Concrete Filled Steel Tubular Structures: From Theory to Practices; Science Press: Beijing, China, 2016. [Google Scholar]
  2. Hassan, A.M.T.; Jones, S.W.; Mahmud, G.H. Experimental test methods to determine the uniaxial tensile and compressive behaviour of ultra high performance fibre reinforced concrete (UHPFRC). Constr. Build. Mater. 2012, 37, 874–882. [Google Scholar] [CrossRef]
  3. Xu, L.H.; Wu, F.H.; Chi, Y. Effects of coarse aggregate and steel fibre contents on mechanical properties of high performance concrete. Constr. Build. Mater. 2019, 206, 97–110. [Google Scholar] [CrossRef]
  4. Hannawi, K.; Bian, H.; Prince-Agbodjan, W. Effect of different types of fibers on the microstructure and the mechanical behavior of ultra-high performance fiber-reinforced concretes. Compos. Part B Eng. 2016, 86, 214–220. [Google Scholar] [CrossRef] [Green Version]
  5. Zohrevand, P.; Mirmiran, A. Behavior of ultrahighperformance concrete confined by fiber reinforced polymers. J. Mater. Civil Eng. 2011, 23, 1727–1734. [Google Scholar] [CrossRef]
  6. Temsah, Y.; Jahami, A.; Aouad, C. Silos structural response to blast loading. Eng. Struct. 2021, 243, 112671. [Google Scholar] [CrossRef]
  7. Cai, H.; Xu, L.H.; Chi, Y. Seismic performance of rectangular ultra-high performance concrete filled steel tube (UHPCFST) columns. Compos. Struct. 2021, 259, 113242. [Google Scholar] [CrossRef]
  8. Xu, L.H.; Lu, Q.R.; Chi, Y. Axial compressive performance of UHPC filled steel tube stub columns containing steel-polypropylene hybrid fiber. Constr. Build. Mater. 2019, 204, 754–767. [Google Scholar] [CrossRef]
  9. AISC 360-10; Specification for Structural Steel Buildings. American Institute of Steel Construction: Chicago, IL, USA, 2010.
  10. EC4; Design of Composite Steel and Concrete Structures. European Committee for Standardization: Brussels, Belgium, 2004.
  11. GB50936-2014; Technical Code for Concrete Filled Steel Tubular Structures. China Architecture & Building Press: Beijing, China, 2014.
  12. AIJ; Recommendations for Design and Construction of Concrete Filled Steel Tubular Structures. Architectural Institute of Japan: Tokyo, Japan, 2001.
  13. Lai, Z.C.; Varma, A.H. Effective stress-strain relationships for analysis of noncompact and slender filled composite (CFT) members. Eng Struct. 2016, 124, 457–472. [Google Scholar] [CrossRef]
  14. Lai, Z.C.; Varma, A.H.; Griffis, L.G. Analysis and design of noncompact and slender CFT beam-columns. J. Struct. Eng. 2016, 142, 04015097. [Google Scholar] [CrossRef]
  15. Cai, H.; Deng, F.Q.; Yan, Y.X. Nonlinear analysis on the static and cyclic behaviors of UHPC filled rectangular steel tube columns. KSCE J. Civ. Eng. 2022, 26, 1316–1328. [Google Scholar] [CrossRef]
  16. Valipour, H.R.; Foster, S.J. Nonlinear static and cyclic analysis of concrete-filled steel columns. J. Constr. Steel. Res. 2010, 66, 793–802. [Google Scholar] [CrossRef]
  17. Liang, Q.Q.; Uy, B.; Liew, J.Y.R. Local buckling of steel plates in concrete filled thin-walled steel tubular beam-columns. J. Constr. Steel Res. 2007, 63, 396–405. [Google Scholar] [CrossRef] [Green Version]
  18. Ahmed, M.; Liang, Q.Q.; Patel, V.I. Nonlinear analysis of rectangular concrete-filled double steel tubular short columns incorporating local buckling. Eng. Struct. 2012, 175, 13–26. [Google Scholar] [CrossRef]
  19. Ahmed, M.; Liang, Q.Q.; Patel, V.I. Nonlinear analysis of square concrete-filled double steel tubular slender columns incorporating preload effects. Eng. Struct. 2020, 207, 110272. [Google Scholar] [CrossRef]
  20. Vrcelj, Z.; Uy, B. Strength of slender concrete-filled steel box columns incorporating local buckling. J. Constr. Steel Res. 2002, 58, 275–300. [Google Scholar] [CrossRef]
  21. Uy, B. Strength of concrete filled steel box columns incorporating local buckling. J. Struct. Eng. 2000, 126, 341–352. [Google Scholar] [CrossRef]
  22. An, L.H.; Ekkehard, F.; Thai, D.K. Simplified stress-strain model for circular steel tube confined UHPC and UHPFRC columns. Steel Compos. Struct. 2018, 29, 125–138. [Google Scholar]
  23. Susantha, K.A.S.; Ge, H.; Usami, T. Uniaxial stress strain relationship of concrete confined by various shaped steel tubes. Eng. Struct. 2001, 23, 1331–1347. [Google Scholar] [CrossRef]
  24. Yu, M.; Zha, X.X.; Ye, J.Q. A unified formulation for circle and polygon concrete-filled steel tube columns under axial compression. Eng. Struct. 2013, 49, 1–10. [Google Scholar] [CrossRef] [Green Version]
  25. Liu, D.L.; Gho, W. Axial load behavior of high-strength rectangular concrete-filled steel tubular stub columns. Thin-Walled Struct. 2005, 43, 1131–1142. [Google Scholar]
  26. An, L.H.; Fehling, E. Assessment of stress-strain model for UHPC confined by steel tube stub columns. Struct. Eng. Mech. 2017, 63, 371–384. [Google Scholar]
  27. Hu, A.X.; Liang, X.W.; Yu, J. Experimental study of uniaxial tensile characteristics of ultra-high performance concrete. J. Hunan Univ. 2018, 45, 30–37. [Google Scholar]
  28. Mander, J.B.; Priestly, M.N.J.; Park, R. Theoretical stress–strain model for confined concrete. J. Struct. Eng. 1988, 114, 1804–1826. [Google Scholar] [CrossRef] [Green Version]
  29. Sakino, K.; Nakahara, H.; Morino, S. Behavior of centrally loaded concrete-filled steel-tube short columns. J. Struct. Eng. 2004, 130, 180–188. [Google Scholar] [CrossRef]
  30. Monti, G.; Nuti, C. Nonlinear cyclic behavior of reinforcing bars including buckling. J. Struct. Eng. 1992, 118, 3268–3284. [Google Scholar] [CrossRef]
  31. Dhakal, R.P.; Maekawa, K. Path-dependent cyclic stress-strain relationship of reinforcing bar including buckling. Eng. Struct. 2002, 24, 1383–1396. [Google Scholar] [CrossRef]
  32. Dodd, L.L.; Restrepo-Posada, J.I. Model for predicting cyclic behavior of reinforcing steel. J. Struct. Eng. 1995, 121, 433–445. [Google Scholar] [CrossRef]
  33. Chen, S.M.; Zhang, R.; Jia, L.J. Structural behavior of UHPC filled steel tube columns under axial loading. Thin Walled Struct. 2018, 130, 550–563. [Google Scholar] [CrossRef]
  34. Xiong, M.X.; Xiong, D.L.; Richard, J.Y.R. Axial performance of short concrete filled steel tubes with high-and ultra-high- strength materials. Eng. Struct. 2007, 136, 494–510. [Google Scholar] [CrossRef]
  35. Zhang, R.; Chen, S.M.; Gu, P. Structural behavior of UHPC filled steel tubular columns under eccentric loading. Thin Walled Struct. 2020, 156, 106959. [Google Scholar] [CrossRef]
  36. Huang, Z.C.; Uy, B.; Li, D.X. Behavior and design of ultra-high-strength CFST members subjected to compression and bending. J. Constr. Steel Res. 2020, 175, 106351. [Google Scholar] [CrossRef]
  37. Guler, S.; Copur, A.; Aydogan, M. Flexural behavior of square UHPC-filled hollow steel section beams. Struct. Eng. Mech. 2012, 43, 225–237. [Google Scholar] [CrossRef]
  38. Cai, H. Seismic Behavior and Hysteretic Model Research on the Ultra-High Performance Concrete Filled Rectangular Steel Tube Columns; Wuhan University: Wuhan, China, 2022. [Google Scholar]
  39. Yan, J.B.; Chen, A.Z.; Zhu, J.S. Behaviours of square UHPFRC-filled steel tubular stub columns under eccentric compression. Thin Walled Struct. 2021, 159, 107222. [Google Scholar] [CrossRef]
  40. AISC-LRFD; Load and Resistance Factor Design Specification for Structural Steel Buildings. American Institute of Steel Construction: Chicago, IL, USA, 1999.
  41. Yan, Y.X.; Xu, L.H.; Li, B. Axial behavior of ultra-high performance concrete (UHPC) filled stocky steel tubes with square sections. J. Constr. Steel Res. 2019, 158, 417–428. [Google Scholar] [CrossRef]
  42. Li, J.Y.; Deng, Z.C.; Sun, T. Flexural behavior of ultra-high performance concrete filled high-strength steel tube. Struct. Concrete. 2022, 22, 1688–1707. [Google Scholar] [CrossRef]
  43. Xiong, M.X.; Xiong, D.L.; Richard, L.J.Y. Flexural performance of concrete filled tubes with high tensile steel and ultra-high strength concrete. J. Constr. Steel Res. 2007, 132, 191–202. [Google Scholar] [CrossRef]
  44. Lai, Z.C.; Yao, P.Y.; Huang, W.J. Reactive powder concrete-filled steel tube (RPCFT) members subjected to axial tension: Experimental study and design. Structures 2020, 28, 933–942. [Google Scholar] [CrossRef]
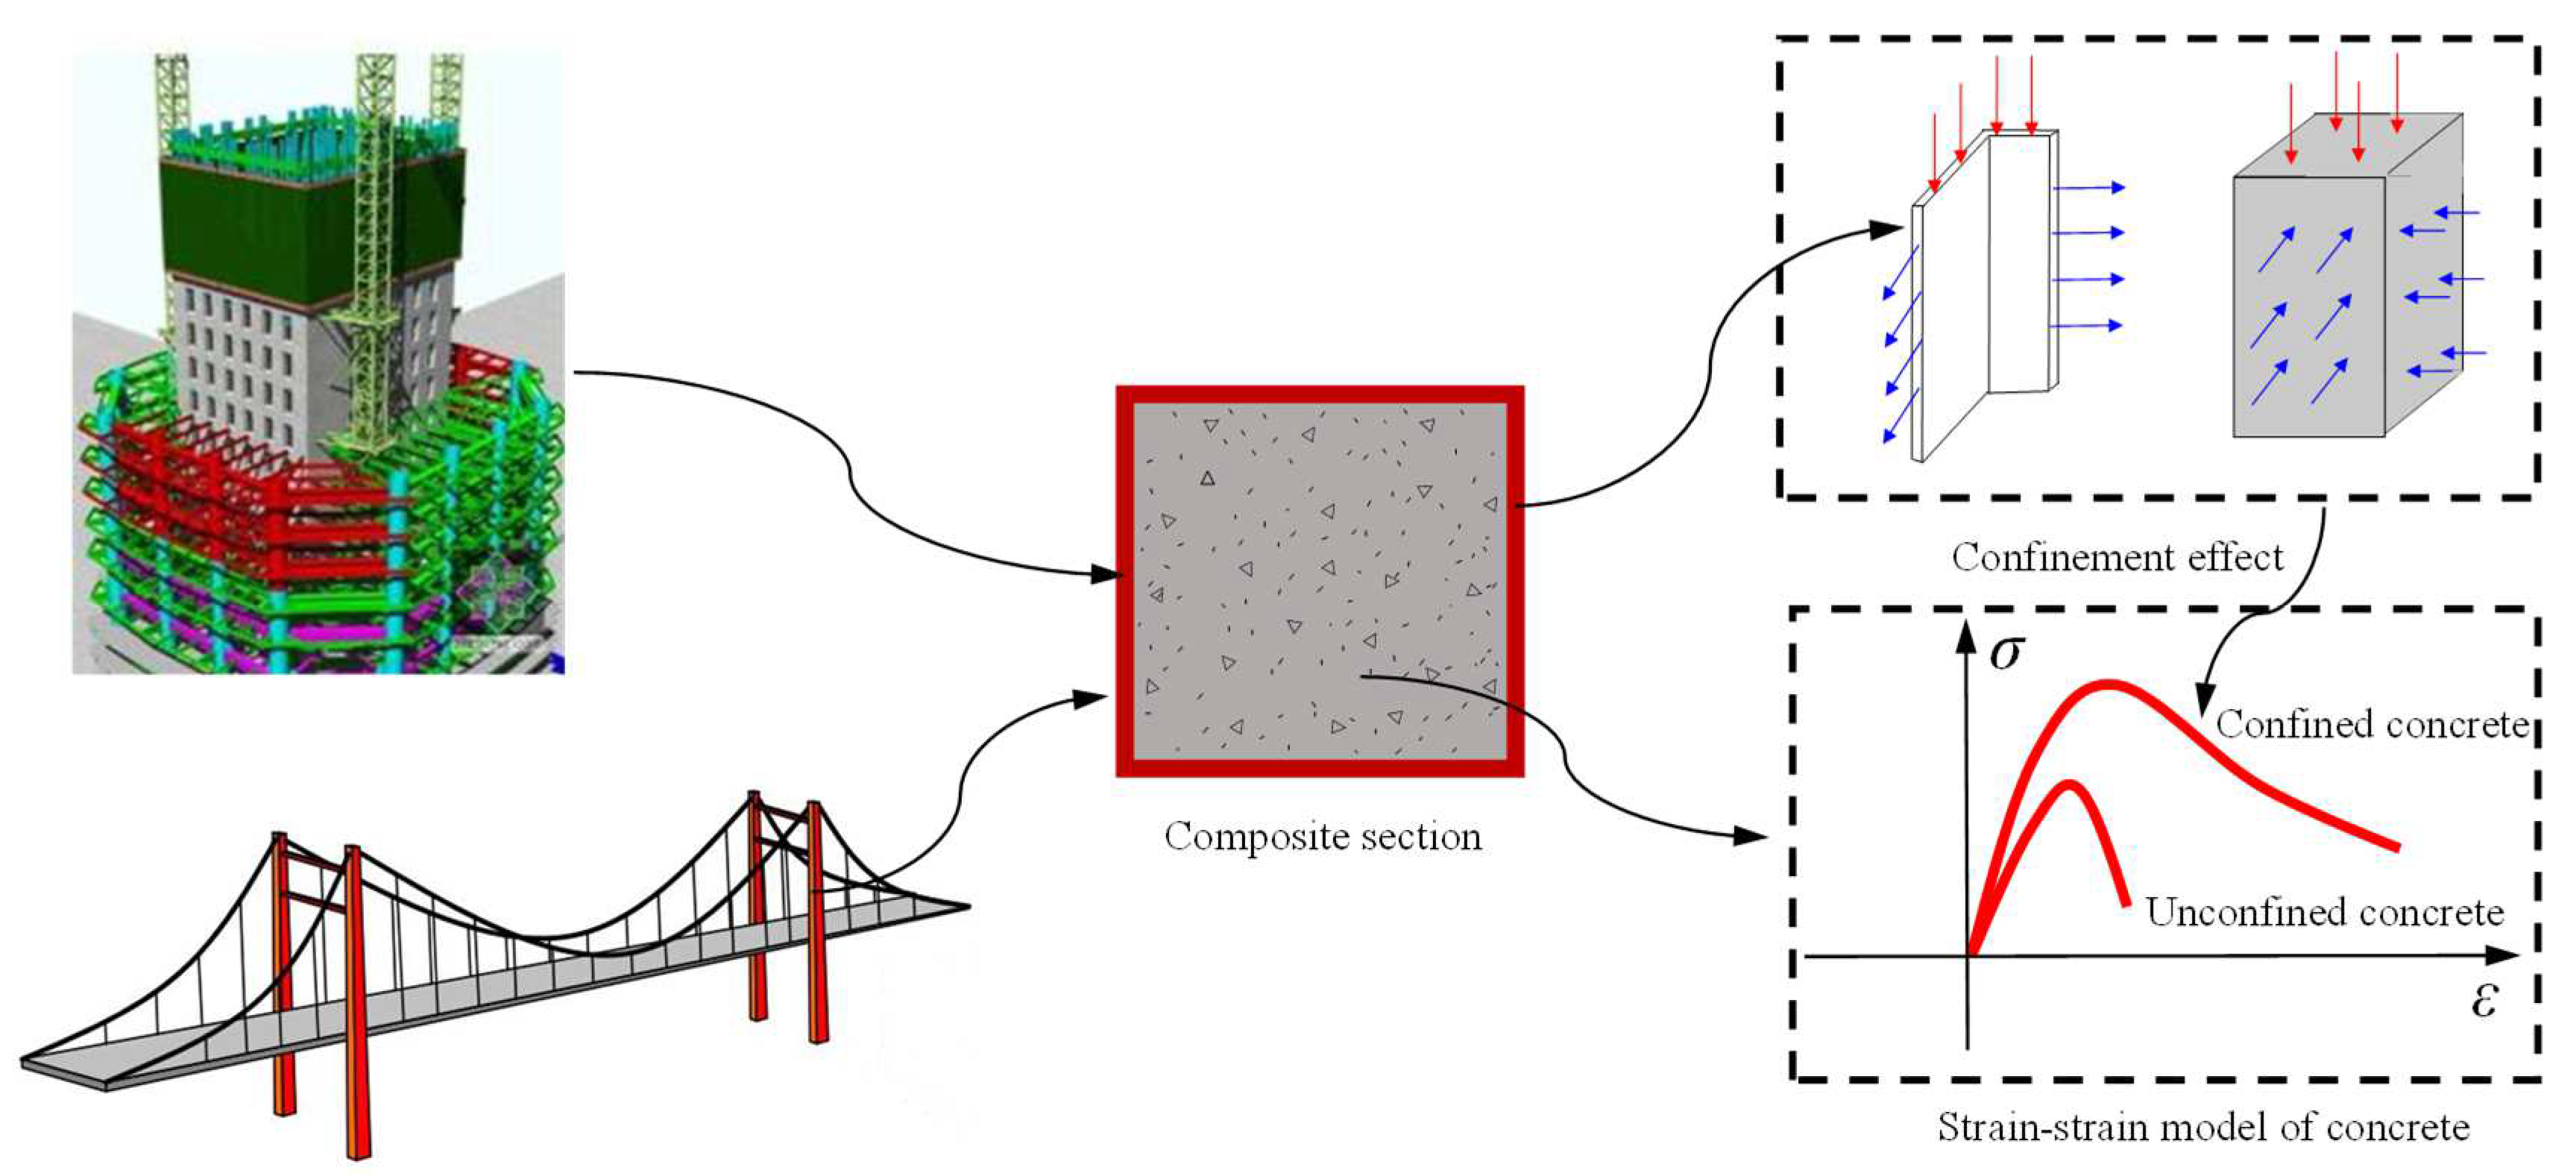
Figure 1. Applications of CFSTs in structural engineering.
Buildings 12 01882 g001
Figure 2. The schematic diagram of local buckling under complex actions.
Buildings 12 01882 g002
Figure 3. The fiber model considering local buckling. (a) Small b/t (b) Medium b/t (c) Large b/t.
Buildings 12 01882 g003
Figure 4. The compressive stress–strain model of steel. (a) Small width-to-thickness ratio (b) Medium width-to-thickness ratio (c) Large width-to-thickness ratio.
Buildings 12 01882 g004
Figure 5. The flow diagram of calculation.
Buildings 12 01882 g005
Figure 6. The comparisons of predicted N-ε curves with test results (Chen et al. [33]). (a) SS1-2 (b) SS1-3.
Buildings 12 01882 g006
Figure 7. The comparisons of predicted N-ε curves with test results (Xiong et al. [34]). (a) S2 (b) S3.
Buildings 12 01882 g007
Figure 8. The comparisons of predicted N-Δ curves with test results (Zhang et al. [35]). (a) SS4-S-30 (b) SS4-S-50.
Buildings 12 01882 g008
Figure 9. The comparisons of predicted F-Δ curves with test results (Huang et al. [36]).
Buildings 12 01882 g009
Figure 10. The comparisons of predicted M-φ curves with test results (Guler et al. [37]).
Buildings 12 01882 g010
Figure 11. The comparisons of predicted P-Δ hysteretic curves with test results (Cai [38]). (a) S−3−0−1 (b) S−3−0.15−1 (c) S−3−0.45−1 (d) S−5−0.15−1 (e) S−3−0.15−1.2 (f) S−3−0.15−1.4.
Buildings 12 01882 g011
Figure 12. The comparisons of moment bearing capacities calculated by different design codes with test results. (a) AISC-LRFD (b) EC4 (c) GB50936 (d) AIJ.
Buildings 12 01882 g012
Figure 13. The typical N-M curve.
Buildings 12 01882 g013
Figure 14. The relationship of Nuc/Acfc-1 and ξ. (Chen et al. [33], Xiong et al. [34], Yan et al. [41]).
Buildings 12 01882 g014
Figure 15. The comparison of predicted Nuc in this work with test results. (Chen et al. [33], Xiong et al. [34], Yan et al. [41]).
Buildings 12 01882 g015
Figure 16. The relationship of γm and ξ. (Guler et al. [37], Cai [38], Li et al. [42], Xiong et al. [43]).
Buildings 12 01882 g016
Figure 17. The comparison of predicted Mu in this work with test results. (Guler et al. [37], Cai [38], Li et al. [42], Xiong et al. [43]).
Buildings 12 01882 g017
Figure 18. The comparison of N-M interaction curves calculated by practical method with test values. (Zhang et al. [35], Huang et al. [36], Cai [38], Yan et al. [39]).
Buildings 12 01882 g018
Figure 19. The comparison of predicted moment-bearing capacities with test results. (Zhang et al. [35], Huang et al. [36], Cai [38], Yan et al. [39]).
Buildings 12 01882 g019
Table 1. The limitations of width-to-thickness ratio in current design codes.
CFST ShapeDesign Codes
AISC 360 [9]EC4 [10]GB 50936 [11]AIJ [12]
Circle (D/t)λp = 0.15Es/fy, λr = 0.19Es/fy, λmax = 0.31Es/fy90 × 235/fy135 × 235/fy 1.5 × 240 F / 98
Square (b/t) λ p = 2.26 E s / f y , λ p = 3 E s / f y ,
λ p = 5 E s / f y
52 235 / f y 60 235 / f y 1.5 × 74 F / 98
Note: F = min (fy, 0.7fu); λp, λr, λmax are the limit width-to-thickness ratios for compact, noncompact, and slender sections, respectively.
Table 2. The parameters of equivalent compressive stress–strain model of steel (Sakino et al. [29]).
Key Points w s 1.54 1.54 < w s < 2.03 2.03 w s
B σ B f y / ( 0.698 + 0.128 w s ) f y f y / ( 0.698 + 0.07 w s )
ε B ( 6.06 / w s 2 0.801 / w s + 1.1 ) ε y ε y σ B / E s
T σ T ( 1.19 0.207 w s ) σ B ( 1.19 0.207 w s ) σ B ( 1.19 0.207 w s ) σ B
ε T ε B + 3.59 ε y 4.59 ε y 4.59 σ B / E s
Note: B and T are peak and residual stress points, ws is the coefficient of width-to-thickness ratio, ws = (b/t)2εy.
Table 3. Database of UHPCFSTs subjected to combined axial compression and bending.
Sourceb (mm)L (mm)t (mm)fc (MPa)fy (MPa)ξNumbers
Zhang [35]120600~12004~6145.9430~4600.47~0.696
Yan [39]1206006.6~7141.2435.6~442.10.73~0.9912
Huang [36]1205005125.61030.61.563
Cai [38]100~210700~10003~18110.3~128.1371~4860.37~3.5119
Table 4. The database of rectangular UHPCFST columns subjected to axial compression.
Sourceb (mm)L (mm)t (mm)fc (MPa)fy (MPa)ξNumbers
Xiong [34]1504508~12.5147~164565~8461.2~2.1515
Chen [33]1504502~7.6113~131307~3720.23~1.286
Yan [41]1504504.9~18.589.2~128.1444.6~668.81.41~5.2716
Table 5. The database of rectangular UHPCFST members subjected to pure bending.
Sourceb (mm)L (mm)t (mm)fc (MPa)fy (MPa)ξNumbers
Li [42]15016004~8101.3~102.8350~5350.39~1.214
Xiong [43]200240012~12.5180–183465~7560.79~1.223
Guler [37]8012002.51~4130.7–134.1268~2880.31~0.479
Cai [38]1509503110.34860.3751
Publisher’s Note: MDPI stays neutral with regard to jurisdictional claims in published maps and institutional affiliations.