Abstract
Frame structures with exterior verandahs, which are mostly built in densely populated areas such as teaching buildings and dormitories in southern China, are a special form of frame structure that must continue to be developed. However, compared with other frame structures in many post-earthquake fields, this type of building designed following the Chinese code has demonstrated poor seismic performance, leading to a significant number of casualties and property losses. Therefore, to complement the design requirements of this structural type in the present Chinese code, the seismic performance of this structural type needs to be improved and optimized. A typical double-span RC frame structure with an exterior verandah in the Lushan Earthquake as the structure prototype was selected in this paper. PKPM software is used to obtain design information for the structure prototype, and the finite element model is established by utilizing ABAQUS software for simulation and analysis. A series of various optimal conditions are created at the base of the structure prototype’s simulation results, and a thorough investigation of the structural seismic performance under each condition is performed. Eventually, suggestions and proposals for future Chinese codes concerning the structurally optimum design of this structural type are provided.
1. Introduction
According to the sixth national census statistics, RC frame structures are second only to masonry structures, which account for most of the existing buildings in China, with a proportion of 23%. Meanwhile, because the RC frame structures have both seismic resistance and economic effectiveness, they have become more popularly used by most designers and professionals over the decades. With the rising ratio of frame structures in the existing and under-construction buildings, this structure type has a great tendency to become a vast part of Chinese buildings. Although frame structures have a certain level of seismic resistance, the frame structures still reveal serious damage in the earthquake site from the past decades [1,2].
Frame structures with exterior verandahs are a special form of frame structure that exhibit worse seismic performance than other forms of frame structures in several earthquakes. Frame structures with exterior verandahs refer to those buildings with additional free space in front of the structural exterior walls, which are shown in Figure 1 and Figure 2. Frame structures with exterior verandahs, which can be divided into single-span and double-span, are predominately built in southern China. Because of the lack of structural redundancy and only one seismic protection line, a large number of single-span frame structures with exterior verandahs collapsed in the Wenchuan Earthquake on 12 May 2008 [3]. This resulted in the national code banning the construction of single-span frame structures with exterior verandahs for education facilities after 2008, now only double-span frame structures with exterior verandahs are permitted. However, in the subsequent Yushu (2010) and Lushan (2013) earthquakes, double-span frame structures with exterior verandahs still showed serious earthquake damage [4]. In hot and humid Southeast Asia and Southern China, frame buildings with exterior verandahs can be utilized for shade, air circulation, and increased inside illumination. Meanwhile, the structures are well-liked by the community due to their significant contribution to environmental control and their ability to reduce environmental harm [5]. Ruggieri presents a numerical model for eliciting simplified reduced-order models, which is capable of predicting the seismic response of frame buildings characterized by plan irregularities [6].
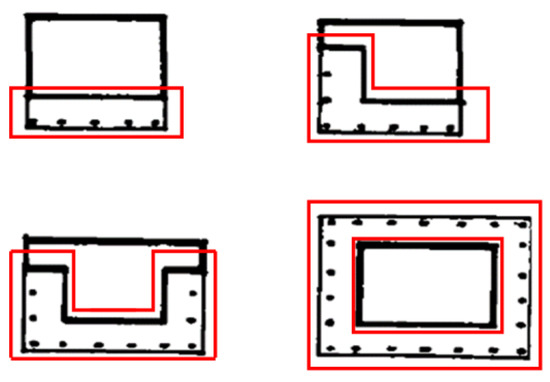
Figure 1.
Common layout of frame structures with exterior verandahs.
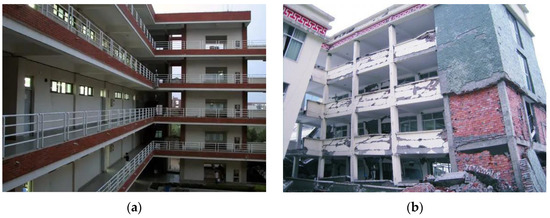
Figure 2.
Frame structures with exterior verandahs constructed in modern China. (a) Frame structures with exterior verandahs in a school in southern China. (b) Frame structures with exterior verandahs after the Wenchuan earthquake in Xuankou Middle School.
The exterior verandahs are seen from above to be both essential living spaces and a component of interior functions. Although frame structures with exterior verandahs have unique significance and are still being erected, they nonetheless perform poorly during earthquakes when designed under the current code. Li et al. [7] compare the similarities and differences in seismic performance between the frame structures with exterior and interior verandahs by using SAP software, and the results indicate that the drift ratio under the same seismic action of the latter is significantly lower than the former. A.M. Yousef, et al. [8] point out that the irregular structural layouts would lead to structures more easily collapsing, and the placement of the columns would have a stronger impact on this. Meanwhile, in the last decade, frame structures with exterior verandahs have mostly been constructed in school buildings, dormitories, and so on. These buildings are mostly concentrated in citizen-dense areas; once an earthquake occurs, the collapse of such buildings will result in catastrophic mortality and property loss. Therefore, further research on frame structures with exterior verandahs is necessary and meaningful.
Given the problems above, this paper firstly summarizes the prevalent seismic damage phenomena of double-span frame structures with exterior verandahs and analyzes the causes. Secondly, a typical double-span frame structure with an exterior verandah is selected for finite element model analysis, and working conditions are set up for research after assessing the poor seismic performance part of the results. Eventually, comments and proposals for optimized structural design to supply the criteria of the code for this structure type are produced by comparing the damage states under the working conditions of the structure in multiple sets.
2. Prevalent Damage Phenomena and Analysis in Frame Structures with Exterior Verandahs
This section investigates the seismic damage phenomena in the Wenchuan Earthquake (2008), Yushu Earthquake (2010), and Lushan Earthquake (2013), as well as the sources of damage in several frame structures with exterior verandahs.
2.1. Damage Phenomena and Analysis of Infill Walls
The following damaging phenomena of infill walls in frame structures with exterior verandahs are mentioned and illustrated in Figure 3. Spalling will be visible on the surface of the walls in the lighter state, with cross-slope fractures being the most common in the earthquake site. Horizontal cracks go through the walls, and blocks spall or walls collapse will appear in severe situations. Damage to the infill walls is caused by doors and windows installed in the infill walls without the use of ring beams and constriction columns, as well as high shear forces [9].
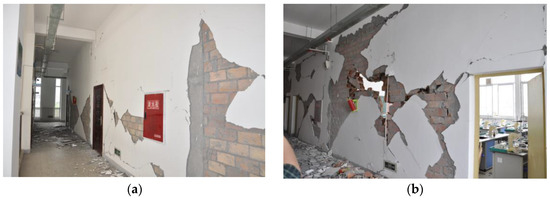
Figure 3.
Damage on the infill walls. (a) Cracks and cross-slope cracks in the surface of the infill wall. (b) Blocks of the infill wall spall.
2.2. Damage Phenomena and Analysis of Beams and Columns
Damage to frame columns is far more serious than frame beams in frame structures with exterior verandahs, known as the ‘strong beams and weak columns’ phenomenon [10]. Lighter damage phenomena including cracks or disconnections will appear in the connections between infill walls and beam-column joints, concrete may be spalled and lead to shear cracks in the top of the columns, columns may appear to be damaged by compressive bending, and cross-cracks may be produced in the middle of the columns. In severe states, beam and column joints will be damaged, and frame columns may be fractured. Figure 4 depicts these damage phenomena. The cracks or disconnections are due to different materials and stiffnesses causing incompatible displacement under seismic actions in infill walls, beams, and columns. The earthquake damage is the result of the large shear forces acting on the lower floors, as well as the insufficient load capacity of the frame columns and beam-column joints. Moreover, the damage phenomena are influenced by the irregular layout and nonuniformity loads of frame structures with exterior verandahs [4,9].
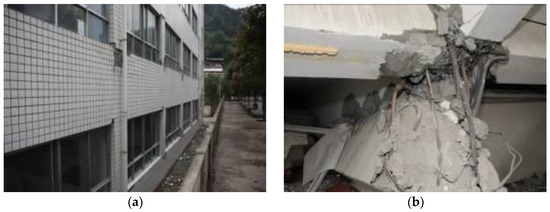
Figure 4.
Damage to frame beams and columns. (a) Damage on the beam-column joints. (b) Damage on the top of the column.
Damage to the beam-column joints is mainly due to using the same cross-section of columns in unequal spans, which will lead to nonuniformity forces in different span’s columns. In addition, the insufficient bearing capacity of the beam-column joints is caused by the hoops in the area. A detailed analysis of situations will be set in the following paper.
2.3. Damage Phenomena and Analysis of the Whole Structures
Studies concluded that the crowded and large openings on the large span side resulted in different stiffness distributions and stiffness in the bottom verandah is low, causing the collapse direction of the whole structure. The collapse direction is shown in Figure 5 [11,12].
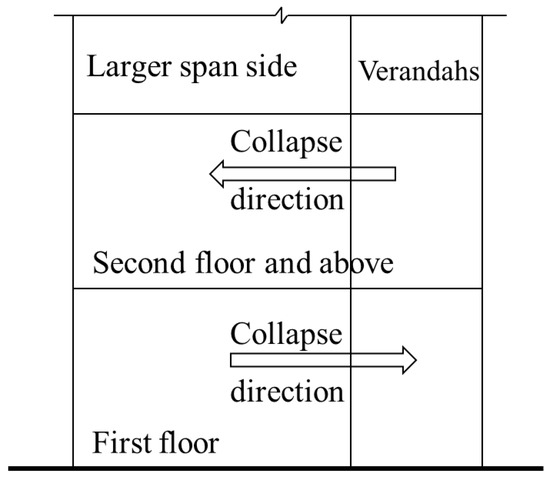
Figure 5.
Collapse direction of the frame structure with an exterior verandah.
3. Selection of the Structure Prototype and Establishment of Its Finite Element Model
A typical two-span frame structure with an exterior verandah designed and built based on the current Chinese code is selected as the structure prototype in this section, and Finite Element Models (FEM) are established. Due to the insufficient design information provided of the buildings, the detailed structural reinforcement information is firstly obtained by PKPM (a popular structural design software in China) according to the current design code, and ABAQUS is utilized for further analysis.
3.1. Structure Prototype and Structural Reinforcement Information
The Teaching Building of Taiping Town Central School in Lushan County is selected to be the structure prototype. The building is located in Lushan County, Ya’an City, Sichuan Province. According to the provisions in Appendix A of the Code for Seismic Design of Buildings (GB50011-2010) (hereafter referred to as the Code), the seismic intensity of the region is 7 degrees, the fundamental seismic acceleration is 0.15 g, and the seismic group is Group II. The building, which has 4 stories with a height of 3.5 m each and a total height of 14 m, is built in 2009. The building is 45 m long and 9 m wide. Figure 6 depicts the appearance of the structure. The cast-in-place structure is a typical double-span RC frame structure with an exterior verandah. The span length is 7 m and 2 m, respectively, except for the distance between the two frames in the middle being 6 m, and the remaining distance is 6.5 m. The structural layout is displayed in Figure 7.
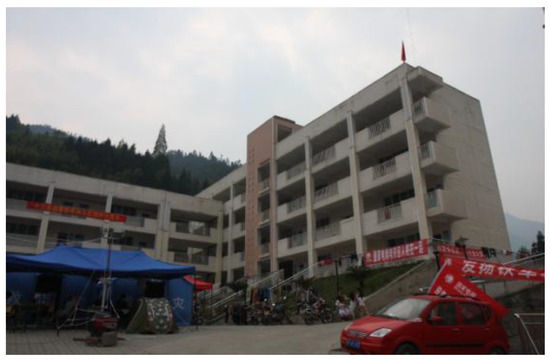
Figure 6.
The structure prototype.
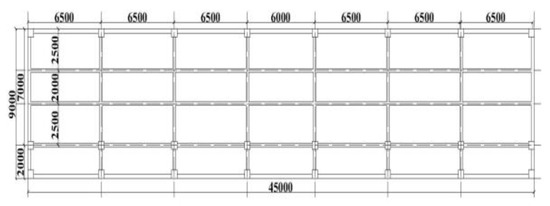
Figure 7.
Plan of the structure.
The sizes of structural components are listed in Table 1.

Table 1.
Sizes of the components (mm).
The concrete of the building is C30, while the rebars are HPB235 and HRB335, respectively. The PKPM model is displayed in Figure 8, and the reinforcement information of the components is obtained.
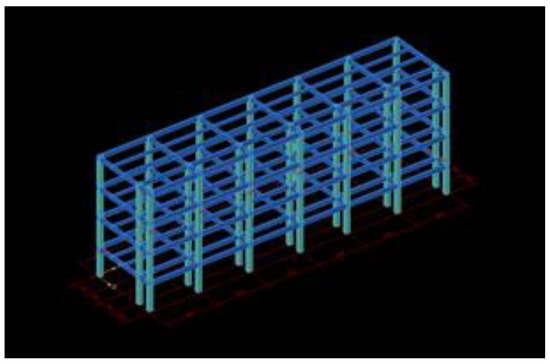
Figure 8.
PKPM modeling.
3.2. Establishment of ABAQUS Models
After building the structure prototype in AutoCAD, the igs files of components are imported into ABAQUS, as shown in Figure 9. Units of the ABAQUS model are mm, t, s and N. The C3D8R Solid units are utilized for the concrete beams and columns due to them easily converging. In addition, the T3D2 Truss units are used for rebar to increase the computation efficiency, while the SR4 Shell units are utilized for the floors aiming to reduce the number of solid units. The units and connecting parts are indicated in Table 2. The joint areas of the beams and columns are locally encrypted mesh with a size of 150 (mm), while the remaining mesh has a size of 700 (mm), as shown in Figure 10. Constitutive relations of the materials are shown in Figure 11, and the CDP model is used in the C30 [13,14,15]. Self-weight of the materials was considered, and associated gravity loads are applied in the columns with 0.35 axial compression ratios, which were calculated by PKPM.
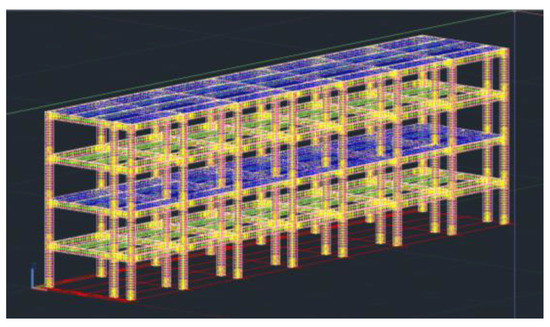
Figure 9.
Modeling in AutoCAD.
Table 2.
Connections of the Components.
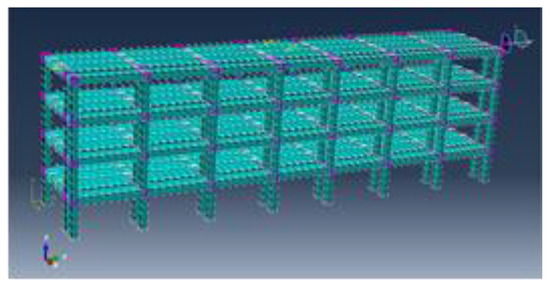
Figure 10.
Mesh of the structure prototype.
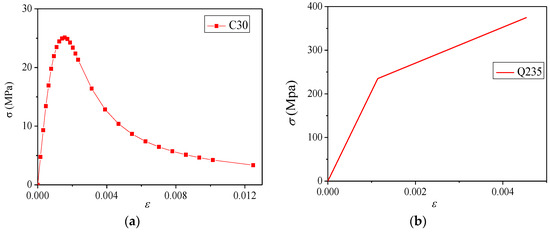
Figure 11.
Constitutive relations of the materials. (a) Constitutive relation of C30. (b) Constitutive relation of Q235.
4. Results and Analysis of Each Working Condition
Each working condition of the model is input with the corresponding ground vibration based on the different site categories and protection levels. Eight spots evenly distributed on each floor are chosen to extract the displacement, as illustrated in Figure 12.
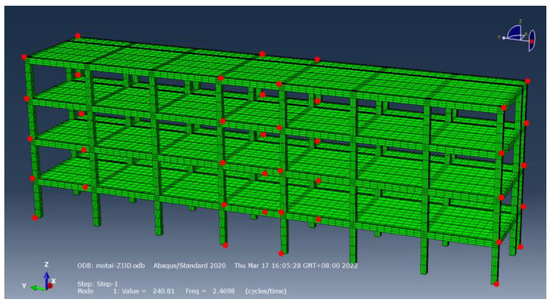
Figure 12.
Displacement observing points.
4.1. Selection of Ground Motions and Index of Structural Damage States
We considered the site effects, including Sites II, III, and IV, and choose the response spectrum in the code (later referred to as the code spectrum) as the input target spectrum to the PEER’s NGA-west2 database for picking relevant ground motion recordings. After matching, three representative ground motions were chosen, and the selected processes of Sites II and III under rare seismic protection are depicted in Figure 13 and Figure 14. Meanwhile, the rest of the process will not be expanded. The ground motion recordings are truncated, and the response spectra are compared to validate the correctness of the truncation lengths, as shown in Figure 15 and Figure 16 [16,17,18,19]. The peak acceleration of the code spectrum under each protection level is 0.12 g, 0.34 g, and 0.72 g, respectively.
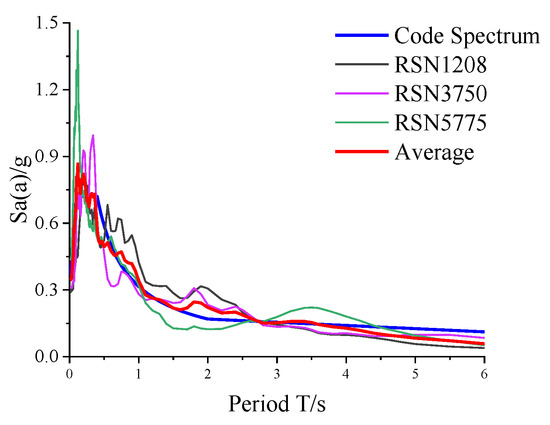
Figure 13.
The selected ground motion of Site II after matching.
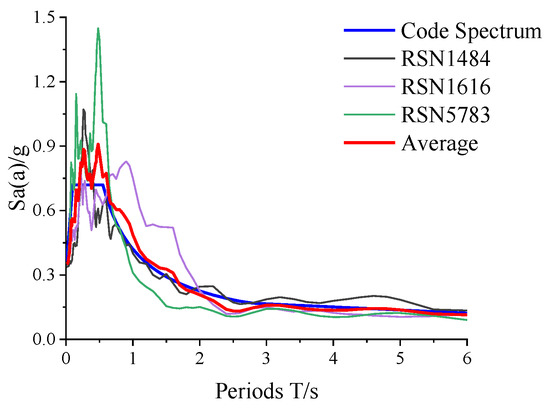
Figure 14.
The selected ground motion of Site III after matching.
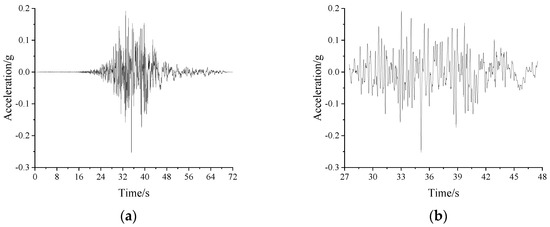
Figure 15.
Time history diagram before and after truncating of RSN1484-E. (a) Time history diagrams before truncating of RSN1484-E. (b) Time history diagrams after truncating of RSN1484-E.
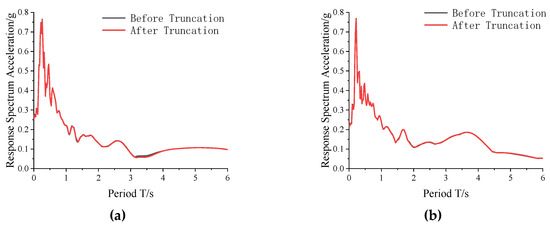
Figure 16.
Response spectrum of RSN1484 before and after truncation. (a) The response spectrum of RSN1484-E before and after truncation. (b) The response spectrum of RSN1484-N before and after truncation.
The index of structural damage states is listed in Table 3, including damage states and drift ratios [20,21].
Table 3.
Index of structural damage states.
4.2. Results and Analysis of the Structure Prototype
There are 27 simulation models for the structure prototype. Taking the results of RSN1208 as an instance, the distribution of structural stress reveals the magnitude phenomena of the corner columns of long-span are greater than the corner columns of short-span, the side columns of long-span and the side columns of short-span and center columns, which means the magnitude of stress in corner columns is greater than side columns and center columns. From Figure 17, which is the principal plastic tensile strain, the strains of the beams and columns on the structural short-span side are greater than those on the long-span side, and the strains of corner columns are significantly larger than those of the center and side columns. Moreover, strains on top of the columns are greatly larger than those on the bottom.
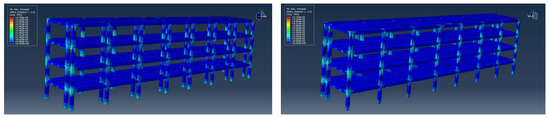
Figure 17.
Cloud maps of the principal plastic tensile strain in concrete.
The stress in the structure is mainly concentrated in the columns. The stress in the bottom of the columns on the first floor is concentrated on the verandah side, while the stress in the columns of other floors is concentrated on the long-span side. The results shown in Figure 18a reveal the ‘strong beam and weak column’ phenomenon which is consistent with the seismic damage. Meanwhile, the maximum displacement in the X direction appears in the top column of the first and second floors, showing the unreasonable displacement distribution of the whole structure in Figure 18d.
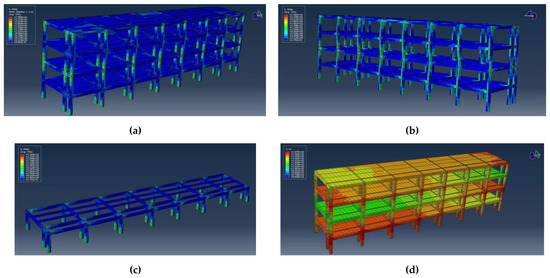
Figure 18.
Stress and displacement cloud maps of the concrete. (a) ‘Strong beam and weak column’ phenomenon. (b) Stress cloud map of the whole frame. (c) Stress cloud map of the bottom columns. (d) Displacement in the X direction of the structure.
Stress in longitudinal rebar is mainly concentrated in the columns and part of joints, while longitudinal rebar in the beam is less stressed. The reason is that the columns are mainly subjected to horizontal ground motion during the earthquake, while the rebar of beams is subjected to the floor load, as shown in Figure 19. The hoops in the joints of beams and columns are under great stress, suggesting that those parts are subjected to large horizontal shear forces. Furthermore, the stress of the hoops on the structural short-span side is significantly higher than that of the long-span side, implying the short-span side is subjected to greater shear force, as illustrated in Figure 20.
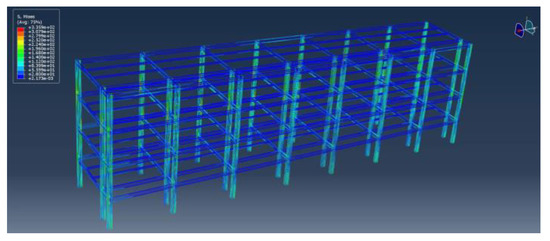
Figure 19.
Stress cloud map of longitudinal rebar.
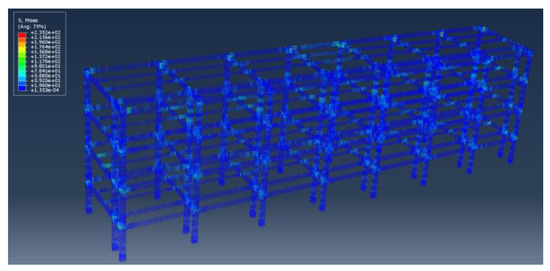
Figure 20.
Stress cloud map of hoops.
Because the same cross-section size of columns is selected in the different structural spans, and the ratio of steels and hoops is not increased in the weak parts, this leads to unreasonable stress, displacement, and poor seismic performance for the structure prototype.
Taking the structure prototype at Site II with different seismic protection as example, the drift ratio analysis is shown in Figure 21. The subsequent analysis is identical to Figure 21 and are not repeated.
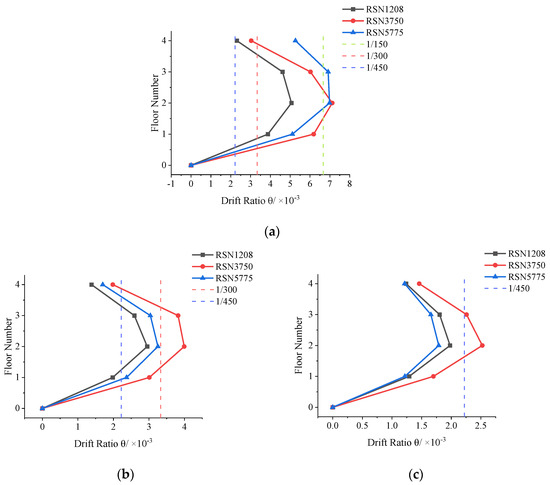
Figure 21.
Drift ratio in site II under different protection levels of the structure. (a) Rare earthquakes. (b) Fortification earthquakes. (c) Frequent earthquakes.
The maximum drift ratio and damage state of the structure is shown in Table 4.
Table 4.
Maximum drift ratio and damage state in the structure.
After analyzing, under rare earthquakes, the structure prototypes are all moderately damaged, and 67% are severely damaged. Under fortification earthquakes, the structure prototypes are all slightly damaged, and 56% are moderately damaged. Under frequent earthquakes, the structure prototypes 56% are intact, and 44% are slightly damaged.
4.3. Working Conditions Setting
For the problems mentioned above in the structure prototype, this paper sets up four different working conditions for analysis. Working Condition II increases the cross-section of the columns on the long-span side from 500 mm × 500 mm to 550 mm × 550 mm, and Working Condition III increases the hoop’s space of frame joints by rising from 100 mm to 75 mm. Working Condition IV increases the diameter of the longitudinal rebar from 20 and 22 mm to 22 and 25 mm, respectively, while Working Condition V combines Working Condition III and Working Condition IV. The details of each working condition are shown in Table 5. Each working condition has 27 simulation models, with 9 models under each site and 3 models under each protection level.
Table 5.
Details of working conditions.
4.4. Analysis of Results against Working Conditions
In this part, the outcomes of the structure under the action of RSN1208 and rare seismic protection are used as examples and are not repeated.
4.4.1. Results of the Working Condition II (Increasing the Cross-Section of the Side Columns)
The overall stress of the structure remained steady, with the majority of the stress concentration in the joints, the top of the columns, and the short-span side. The overall stress at the bottom of the columns is reduced, and the structural displacement distribution is more reasonable, which can be seen in Figure 22. The principal plastic tensile strains are mainly concentrated in the center columns, the columns at the long part of the short-span side, and the joints of beams and columns, typically in the beam end, as shown in Figure 23.
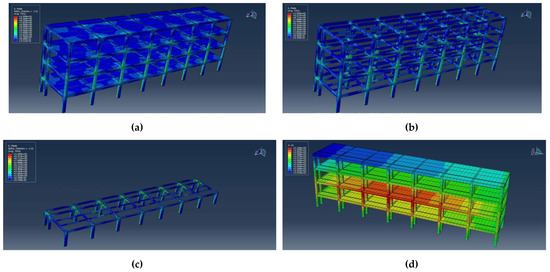
Figure 22.
Concrete cloud map of the stress and displacement. (a) Stress cloud map of the whole structure. (b) Stress cloud map of the whole frame. (c) Stress cloud map of the bottom columns. (d) Displacement cloud map of the structure.
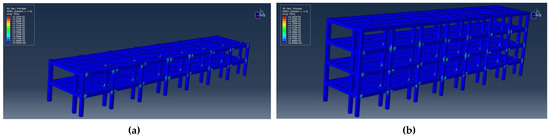
Figure 23.
Principal plastic tensile strains. (a) Principal plastic tensile strains of the columns in the first second-floor. (b) Principal plastic tensile strains of the structure.
The stress in the longitudinal rebar is mainly concentrated in the bottom of the columns, with that obviously in the beams of short-span. Stress declines in the joints of the longitudinal rebar, which is shown in Figure 24. The stress in the hoops is mainly concentrated at the top of the columns on the short-span side, with obvious stress in the columns. The stress in the beams is decreased, as shown in Figure 25.
Figure 24.
Stress cloud map of longitudinal rebar.
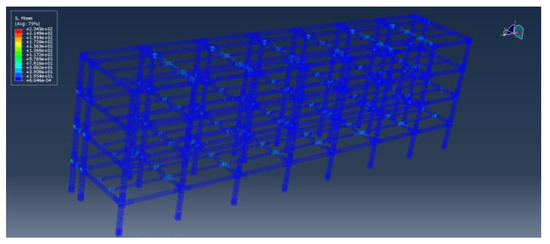
Figure 25.
Stress cloud map of hoops.
Under rare earthquakes, the structures are all moderately damaged, and 11% are severely damaged. Under fortification earthquakes, the structures (33%) are intact, 56% are slightly damaged, and 11% are moderately damaged. Under frequent earthquakes, the structures are all intact. As shown in Table 6.
Table 6.
Maximum drift ratio and damage state in the structure.
4.4.2. Results of the Working Condition III (Narrowed the Distance of the Hoops in the Beam-Column Joints)
The stress in the concrete columns is mainly concentrated on the bottom columns on the first and second floors and the top columns on the first and top floors. In addition, the stress of bottom columns is greater than that of top columns, which is shown in Figure 26. The principal plastic tensile strains of concrete mainly occur in the beam-column joints, bottom and top columns on the top floor, and the corner columns on the short-span side. The damage situation in the corner columns is greater than the long-span side columns, the center columns, the short-span side columns, and large principal plastic tensile strains appeared in the top corner columns of the top floor, as shown in Figure 27.
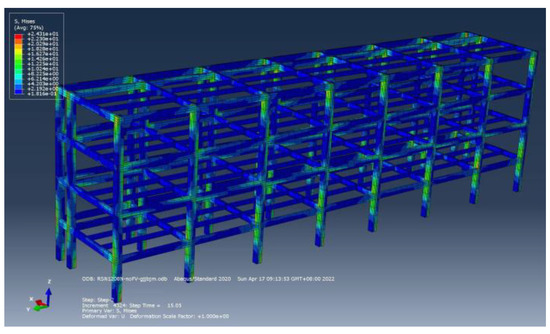
Figure 26.
Stress cloud map of the structure.
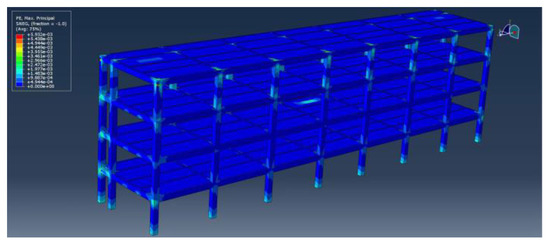
Figure 27.
Principal plastic tensile strains cloud map of the structure.
Furthermore, the main stress direction of the structure in Figure 27 shifts from the weaker X direction to the Y direction, and the stress gap between the bottom and top columns on each floor decreased. The shear performance of the structure in the X direction improved due to the space narrowing in the hoops of beams and columns, causing the stress direction changes in the Y direction. The stress in the longitudinal rebar is mainly concentrated on the first and top floor of the structure, and the longitudinal rebar in the beam-column joints and part of beams is obviously stressed, as shown in Figure 28 and Figure 29.
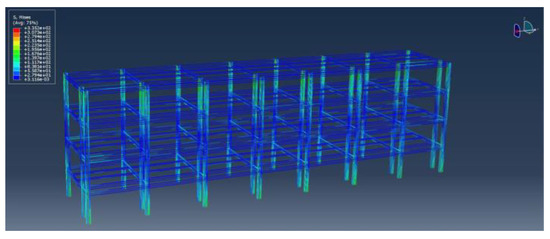
Figure 28.
Stress cloud map of longitudinal rebar.
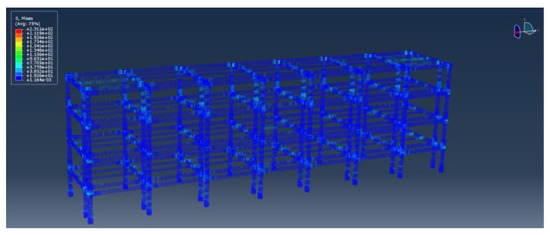
Figure 29.
Stress cloud map of hoops.
Under rare earthquakes, the structures are all moderately damaged, and 44% are severely damaged. Under fortification earthquakes, the structures (22%) are intact, 45% are slightly damaged, and 33% are moderately damaged. Under frequent earthquakes, the structures are all intact. As shown in Table 7.
Table 7.
Maximum drift ratio and damage state in the structure.
4.4.3. Results of the Working Condition IV (Increasing the Cross-Section in Longitudinal Rebar)
The stress in the corner columns is greater than in the columns on the short-span side, in the center columns and in the columns on the long-span side. The principal plastic tensile strains are mainly concentrated in the bottom columns on the first floor, top columns on the top floor, and the beam-column joints on the short-span side, especially in the beam end. Meanwhile, the concrete of the corner columns on the top floor was also damaged, which is shown in Figure 30 and Figure 31.
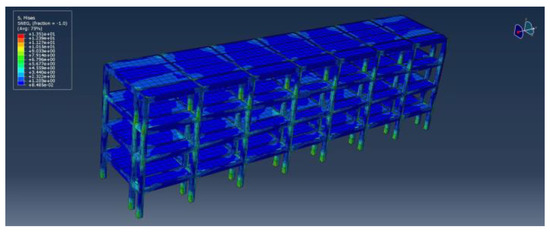
Figure 30.
Stress cloud map of the structure.
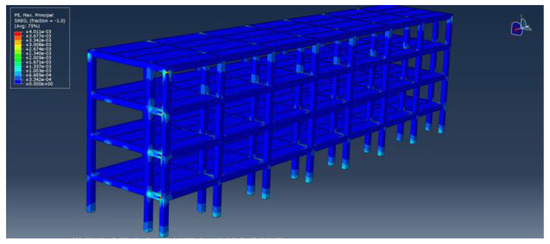
Figure 31.
Principal plastic tensile strains cloud map of the structure.
The stress in the longitudinal rebar is mainly concentrated in the bottom and top of the structure, part of the frame beams, and the short-span side, which is shown in Figure 32. The stress in the hoops is mainly concentrated in the corner columns and part of the beam-column joints. The hoops’ stress of the beam-column joints in the two corner columns on the verandahs and short-span sides is significantly higher than that of the long-span side, as shown in Figure 33.
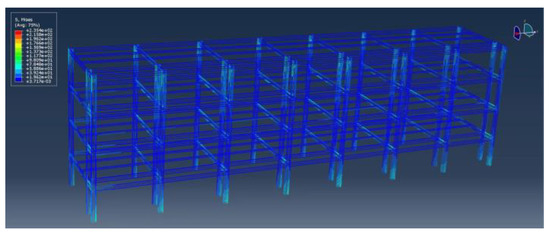
Figure 32.
Stress cloud map of longitudinal rebar.
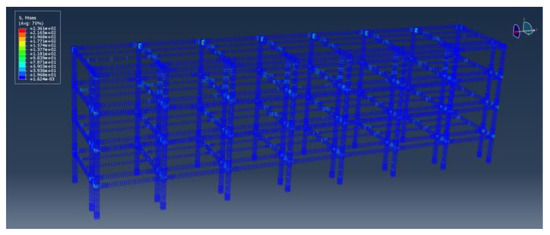
Figure 33.
Stress cloud map of hoops.
Under rare earthquakes, the structures are all moderately damaged, and 44% are severely damaged. Under fortification earthquakes, the structures (33%) are intact, 34% are slightly damaged, and 33% are moderately damaged. Under frequent earthquakes, the structures (89%) are intact, and 11% are slightly damaged. As shown in Table 8.
Table 8.
Maximum drift ratio and damage state in the structure.
4.4.4. Results of the Working Condition V (Narrowed the Distance of the Hoops in the Beam-Column joints and Increased the Cross-Section in Longitudinal Rebar)
The structural concrete stress is mainly concentrated in the bottom columns and a small part of the top center columns. The principal plastic tensile strains of concrete are mainly concentrated in the beam-column joints on the short-span side, and damage to the top columns is greater than that of the bottom columns on the top floor. Principal plastic tensile strains in the corner columns are greater than in the side columns of short-span side, in the side columns of long-span side and in the center columns, which are shown in Figure 34 and Figure 35.
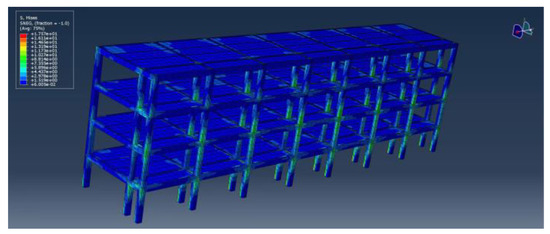
Figure 34.
Stress cloud map of the structure.
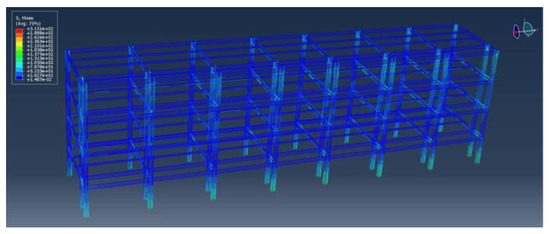
Figure 35.
Principal plastic tensile strains cloud map of the structure.
The stress of the longitudinal rebar is mainly concentrated in the bottom and top of the structure, and the stress of the structure’s bottom is greater than that of the top. The stress in the beam-column joints of the short-span side is obvious. The stress of the hoops is mainly concentrated in the beam-column joints. The hoops’ stress of the beam-column joints in the two corner columns on the verandah and short-span sides is significantly higher than that of the long-span side, as shown in Figure 36 and Figure 37.
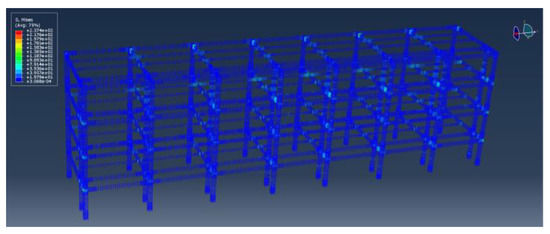
Figure 36.
Stress cloud map of longitudinal rebar.
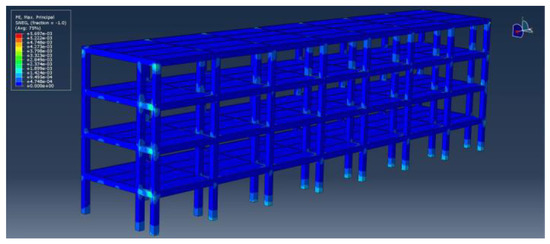
Figure 37.
Stress cloud map of hoops.
Under rare earthquakes, the structures are all moderately damaged, and 22% are severely damaged. Under fortification earthquakes, the structures (33%) are intact, 34% are slightly damaged, and 33% are moderately damaged. Under frequent earthquakes, the structures are all intact. As shown in Table 9.
Table 9.
Maximum drift ratio and damage state in the structure.
5. Analysis of Seismic Performance in Each Working Condition
5.1. Damage State of Each Working Condition
After obtaining a total of 135 simulation models, the structural damage states accounted for the highest level in each site, and working conditions are selected for comparison, as shown in Table 10.
Table 10.
Comparison of the Structural Damage state.
The structural cumulated proportion of damage states under different protection levels is shown in Figure 38.
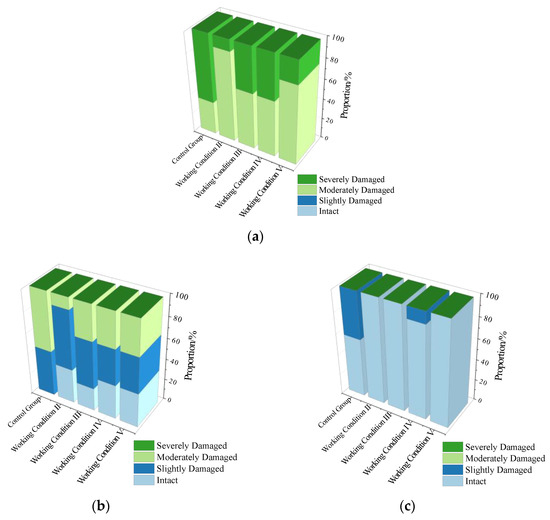
Figure 38.
The structural cumulated proportion of damage states under different protection levels. (a) Rarely earthquake. (b) Fortification earthquakes. (c) Frequently earthquakes.
The selected structural damage state shown above indicates that the Working Conditions II to V were reduced by one level.
Damage to the structure prototype is mainly concentrated in the columns, and the damage degree in the corner columns on the long-span side is greater than in the corner columns on the short-span side, in the side columns on the long-span side, in the side columns on the short-span side, in the center columns. Meanwhile, damage on the long-span side is greater than that on the short-span side, and damage in the top columns, is also greater than that on the bottom.
Damage to the structure in Working Condition II decreases significantly, especially in the corner columns. The damage is mainly concentrated in the side columns, center columns, and the beam ends on the short-span side.
Damage to the structure in Working Condition III is mainly concentrated in the beam ends on the short-span side and part of the top columns. The damage degree in the corner columns is greater than the inside columns on the long-span side, in the center columns, and in the side columns on the short-span columns. The damage degree declines compared with the structure prototype.
Damage to the structure in Working Condition IV is mainly concentrated in the beam ends in the short-span side and top corner columns. The damage degree in the corner columns is greater than the inside columns on the short-span columns, in the center columns, and in the side columns on the long-span side. The damage degree decreases compared with the structure prototype.
Damage to the structure in Working Condition V is mainly concentrated in the beam ends in the short-span side and bottom corner columns. The damage degree in the corner columns is greater than the inside columns on the short-span columns, in the side columns on the long-span side, and in the center columns. The damage degree drops dramatically compared with the structure prototype.
The analysis above obviously shows that the columns on the short-span side experience large shear forces, while the columns on the long-span side experience large bending moments. Furthermore, damage to the corner columns can effectively be reduced by increasing the cross-section area, but cannot be reduced by changing the steel and hoop ratio.
5.2. Analysis of the Drift Ratio in Each Working Condition
Take the rare earthquake as an instance for analyzing the structure under each protection level; the comparison of the maximum drift ratio on each floor under different sites is shown in Figure 39.
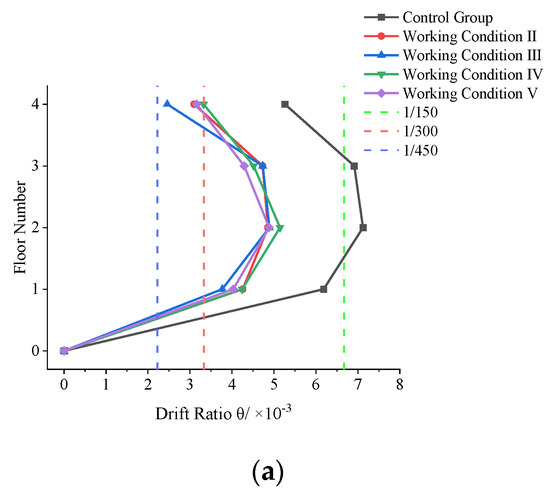
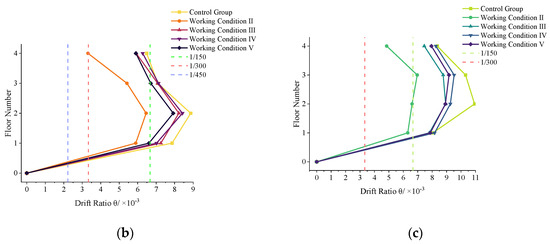
Figure 39.
Comparison of maximum drift ratios under rarely earthquakes. (a) Site II. (b) Site III. (c) Site IV.
As shown in the above figure, the maximum drift ratio of each floor in site II under four working conditions is much smaller than that of the structure prototype, and the working condition II in site III and IV is significantly smaller than that of the remaining working conditions. The improvement effects of the remaining three working conditions are all greater than those of the structure prototype. After comparison, the maximum drift ratio, drop proportion, and damage state of the structure in different sites are shown in Table 11.
Table 11.
Maximum drift ratio, drop proportion, and damage state of the structure under rarely earthquakes.
It can be seen that the structural seismic performance in Working Condition II is greater than in Working Condition V, in Working Condition III, and in Working Condition IV, and in the Structure Prototype.
5.3. Suggestions on Structural Optimal Design
To summarize, structural seismic performance in Working Condition II is greater than in Working Condition V, in Working Condition III, and in Working Condition IV after analysis.
For the optimal design of future double-span RC frame structures with exterior verandahs, the preferred solution is to increase the column cross-sectional size on the large-span side. The column cross-sectional dimensions in the currently designed or constructed buildings are generally the same, which leads to poor seismic performance. Increasing the column cross-sectional size on the large span side can significantly decrease the inter-story drift ratio of the structure under different levels of protection, which can effectively improve the structural seismic performance.
If the optimal design cannot be used due to the functional requirements of buildings or economic benefits, the cross-section of the longitudinal rebar can be increased, and the distance between hoops in the beam-column joints can be narrowed. The seismic performance of the structure by using this method can also be increased, and the inter-story drift ratio can be effectively reduced.
If the cross-section of the longitudinal rebar and the distance between hoops in the beam-column joints cannot be increased or narrowed at the same time, only the hoop’s distance can be narrowed. This type of method can effectively reduce the inter-story drift ratio.
Finally, the cross-section of the longitudinal rebar can be increased. Although this optimal method is slightly worse than the above three optimal methods, it can also effectively reduce the structural inter-story drift ratio.
In a word, for the future design of double-span RC frame structures with exterior verandahs, it is proposed that the cross-section area of columns on the long-span side can be increased initially. Secondly, the cross-section area of the longitudinal rebar can be increased, and the distance between hoops in the beam-column joints can be narrowed. Thirdly, the distance between hoops in the beam-column joints can be narrowed. Finally, the cross-section area of the longitudinal rebar can be enlarged.
6. Conclusions
In this paper, numerical simulations of the selected double-span RC frame structure with an exterior verandah structure prototype are conducted, and working conditions are established to compare the structural seismic performance after optimized design. Conclusions are obtained as follows:
- (1)
- Prevalent seismic damage phenomena are summarized and analyzed in the double-span RC frame structures with exterior verandahs. Seismic damage to such buildings is thought to be caused by the unreasonable distribution of structural spans and loads. Meanwhile, the large shear forces the ground floor is subjected to lead to damage to the infill walls and columns in the structural bottom.
- (2)
- After obtaining the weak part of the structure prototype, four sets of different working conditions after optimizing the design are set up for analysis. The results indicate that compared with the structure prototype, the drift ratio was reduced significantly after the optimized design, and certain optimization effects are achieved.
- (3)
- The selected structure prototype has significant seismic damage under each protection level, whereas the structural damage and drift ratio decreased to different degrees after the optimized design. In other words, the structural seismic performance improved significantly after optimized designs.
- (4)
- We recommend the following proposal for the design of double-span RC frame structures with exterior verandahs in the future. First of all, the cross-section area of columns on the long-span side can be increased. Secondly, if the cross-section area cannot be changed due to the functional requirements and economic budget, the distance between hoops in the beam-column joints can be narrowed, while increasing the cross-section area of the longitudinal rebar. Thirdly, the distance between hoops in the beam-column joints can be narrowed. Finally, the cross-section area of the longitudinal rebar can be increased.
- (5)
- There are limitations to this study. The results and suggestions of this research are only suitable for double-span RC frame structures with exterior verandahs and are not applicable to other structures including regular frame structures. Meanwhile, due to the limited seismic records used in the analysis, more ground motions should be selected for further study in the future.
Author Contributions
Z.T.: conceptualization, software, data analysis, writing. Z.P.: software, investigation, reviewing, editing. X.L.: methodology, supervision, guidance. All authors have read and agreed to the published version of the manuscript.
Funding
This research received no external funding.
Data Availability Statement
Not applicable.
Acknowledgments
The authors would like to acknowledge the help and support from friends and family.
Conflicts of Interest
The authors declare no conflict of interest. The funders had no role in the design of the study; in the collection, analyses, or interpretation of data; in the writing of the manuscript; or in the decision to publish the results.
References
- Sococol, I.; Mihai, P.; Petrescu, T.-C.; Nedeff, F.; Nedeff, V.; Agop, M.; Luca, B.-I. Numerical Study Regarding the Seismic Response of a Moment-Resisting (MR) Reinforced Concrete (RC) Frame Structure with Reduced Cross-Sections of the RC Slabs. Buildings 2022, 12, 1525. [Google Scholar] [CrossRef]
- Park, Y.J.; Ang, A.H.-S.; Wen, Y.K. Seismic Damage Analysis of Reinforced Concrete Buildings. J. Struct. Eng. 1985, 111, 740–757. [Google Scholar] [CrossRef]
- Civil and Structural Groups of Tsinghua University; Xinan Jiaotong University; Beijing Jiaotong University. Analysis on Seismic Damage of Buildings in the Wenchuan Earthquake. J. Build. Struct. 2008, 4, 1–9. (In Chinese) [Google Scholar]
- Huang, S.; Guo, X.; Sun, D.; Guan, Y.; Tarasenko, A.A. Shaking Table Test on Failure Mechanism of RC Frame with Exterior Corridor. Eng. Mech. 2016, 33, 63–71+85. (In Chinese) [Google Scholar]
- Zin, M.H.M.; Ibrahim, N.L.N.; Zain, M.F.M.; Jamil, M. The Social and Environmental Roles of Verandah in Tropical Houses. World Acad. Sci. Eng. Technol. 2012, 68, 1702–1704. [Google Scholar]
- Ruggieri, S.; Chatzidaki, A.; Vamvatsikos, D.; Uva, G. Reduced-order Models for the Seismic Assessment of Plan-irregular Low-rise Frame Buildings. Earthq. Engng. Struct. Dyn. 2022, 51, 3327–3346. [Google Scholar] [CrossRef]
- Li, J.; Li, F.; Li, D.; Han, F. Seismic Performance Analysis of Exterior-Corridor Type and Middle-Corridor Type Architecture. J. Phys. Conf. Ser. 2020, 1578, 012242. [Google Scholar] [CrossRef]
- Yousef, A.M.; El-Mandouh, M.A. Dynamic Analysis of High-Strength Concrete Frame Buildings for Progressive Collapse. Case Stud. Constr. Mater. 2020, 13, e00470. [Google Scholar] [CrossRef]
- Sun, B.; Yan, P.; Hu, C.; Zhang, M. Overview on Seismic Damage to Different Structures in Yingxiu Town during Wenchuan Earthquake. J. Earthq. Eng. Eng. Vib. 2008, 28, 1–9. [Google Scholar]
- Damcı, E.; Temur, R.; Bekdaş, G.; Sayin, B. Damages and Causes on the Structures during the October 23, 2011 Van Earthquake in Turkey. Case Stud. Constr. Mater. 2015, 3, 112–131. [Google Scholar] [CrossRef]
- Ma, Y.; Lu, X.; Ye, L.; Tang, D.; Li, Y. Seismic Damage Simulation and Analysis of Typical RC Frames of Xuankou School. Eng. Mech. 2011, 28, 71–77. [Google Scholar]
- Ye, L.; Li, Y.; Pan, P. Seismic Damages of Building Structures of Xuankou Middle School in Yingxiu Town. Build. Struct. 2009, 39, 29+54–57. (In Chinese) [Google Scholar]
- ABAQUS Version 5.8 User’s Manual; Abaqus, Inc.: Pawtucket, RI, USA, 2005.
- Sidoroff, F. Description of Anisotropic Damage Application to Elasticity; Springer: Berlin/Heidelberg, Germany, 1981. [Google Scholar]
- Legeron, F.; Paultre, P.; Mazar, J. Damage Mechanics Modeling of Nonlinear Seismic Behavior of Concrete Structures. J. Struct. Eng. 2005, 131, 946–954. [Google Scholar] [CrossRef]
- Hamburger, R.O. FEMA P-58 Seismic Performance Assessment of Buildings; Simpson Gumpertz & Heger Inc.: Redwood City, CA, USA, 2012. [Google Scholar]
- Chopra, A.K. Dynamics of Structures: Theory and Applications to Earthquake Engineering, 4th ed.; Pearson Education, Inc.: New York, NY, USA, 2012. [Google Scholar]
- Vamvatsikos, D.; Cornell, C.A. Direct Estimation of the Seismic Demand and Capacity of Oscillators with Multi-Linear Static Pushovers through IDA. J. Int. Assoc. Earthq. Eng. 2006, 35, 1097–1117. [Google Scholar] [CrossRef]
- Vamvatsikos, D.; Cornell, C.A. Incremental Dynamic Analysis. Earthq. Eng. Struct. Dyn. 2002, 21, 491–514. [Google Scholar] [CrossRef]
- Panagiotakos, T.B.; Fardis, M.N. Deformation-Controlled Earthquake-Resistant Design of RC Buildings. J. Earthq. Eng. 1999, 3, 498–518. [Google Scholar] [CrossRef]
- Ministry of Housing and Urban-Rural Development of the People’s Republic of China. Code for Seismic Design of Buildings (GB 50011-2012); China Architecture & Building Press: Beijing, China, 2016.


Publisher’s Note: MDPI stays neutral with regard to jurisdictional claims in published maps and institutional affiliations. |
© 2022 by the authors. Licensee MDPI, Basel, Switzerland. This article is an open access article distributed under the terms and conditions of the Creative Commons Attribution (CC BY) license (https://creativecommons.org/licenses/by/4.0/).