Article

Evolution of the Fracture Characteristics in a Rockburst under Different Stress Gradients

1
Pearl River Water Resources Research Institute, Guangzhou 510611, China
2
Guangdong South China Hydroelectric High-Tech Development Co., Ltd., Guangzhou 510611, China
3
Key Laboratory of Geotechnical and Structural Engineering Safety of Hubei Province, School of Civil Engineering, Wuhan University, Wuhan 430070, China
4
School of Civil Engineering and Architecture, Wuhan University of Technology, Wuhan 430070, China
5
School of Civil Engineering, Shaoxing University, Shaoxing 312000, China
*
Author to whom correspondence should be addressed.
Buildings 2022, 12(11), 1927; https://doi.org/10.3390/buildings12111927
Submission received: 25 August 2022 / Revised: 20 October 2022 / Accepted: 27 October 2022 / Published: 8 November 2022
(This article belongs to the Special Issue Materials Engineering in Construction)

Abstract

:
The variation in principal stress ratio and principal stress direction deflection caused by the stress gradient distribution of surrounding rock is one of the reasons leading to different types of strain rockbursts. Two typical rockburst failure modes of brittle gypsum debris are discussed based on the study of the macroscopic and microscopic appearance morphologies under different stress gradients. Based on the acoustic emission characteristic parameter analysis of the Gaussian mixture model (GMM), the evolution of internal crack propagation and the fracture mechanism during the rockburst under different stress gradients were explored. The results are as follows: (1) The generation and intensity of rockburst are related to the loading stress gradient. The larger the stress gradient, the more significant the dynamic phenomenon during the rockburst process. (2) There are obvious differences in the morphology and arrangement of crystals on the fracture surface of rockburst debris under different stress loading paths. The brittle fracture of debris can be divided into flake debris dominated by intergranular tensile fracture and massive debris dominated by transgranular shear fracture. (3) The AE characteristic parameter classification method based on the GMM has good applicability in crack classification. With an increase in the loading stress gradient, the proportion of the shear crack increases gradually, which is the main reason for the enhancement of the rockburst intensity.

1. Introduction

To promote the energy revolution and build a clean, low-carbon, safe and efficient energy system, the national “14th Five-Year Plan” and the goal for 2035 focus on accelerating the construction of the southwest hydropower base, emphasizing the disaster-causing mechanism, disaster warning and risk assessment of engineering activities and other core scientific issues [1,2,3]. Many deep tunnel excavation projects are involved in the construction of hydropower projects. In such an environment, the rock surrounding a tunnel is prone to storage of significant strain energy leading to large-volume rockburst disasters [4]. When a rockburst occurs, the surrounding rock will burst, loosen, and may even be ejected. How to predict and avoid rockburst disasters has become one of the “bottleneck” problems restricting the development of deep underground spaces [5].
When a rockburst occurs, the stress on the surrounding rock mass reaches its ultimate strength, which is essentially a rock-mass fracture problem; however, due to the complex geological conditions on site, it is difficult to study the fracture behavior in a rockburst in the surrounding rock at full scale. Current research methods mainly focus on laboratory uniaxial [6], biaxial [7], and true triaxial simulation tests [8,9,10,11,12,13]. Uniaxial tests are suitable for simulation of pillar rockbursts. Triaxial and true triaxial tests are performed to study rockburst behaviors in the unloading and stress concentration process of surrounding rock. In addition, some scholars also conducted biaxial and true triaxial rockburst tests that were more consistent with the stress regime in the rock surrounding a rock tunnel [14,15,16], but the loading methods used in these tests were different from the path of the radial stress reduction and the tangential stress concentration of the surrounding rock caused by the excavation of the rock mass. Based on the changes in the stress state of the surrounding rock elements before and after the rock-mass excavation, scholars simulated the unloading and stress concentration process of tunnel excavation with the aid of single-side unloadable true triaxial tests and elaborated the mechanism behind a rockburst from the aspects of the model failure process, fracture characteristics, and energy evolution [17].
The aforementioned research is of great theoretical significance to rockbursts, but the influence of the tangential stress gradient distribution of the surrounding rock in a stress field on the rockburst disaster mechanism is mostly ignored therein. After excavation of a rock mass, the tangential stress on the surrounding rock is larger at the tunnel wall and decreases to the interior of the surrounding rock with a certain gradient. Different stress gradients will change the stress state and principal stress orientation in the surrounding rock, thereby affecting the failure mechanism in a rockburst. Therefore, it is necessary to consider the influences of the different tangential stress gradients on the mechanism of rockbursts surrounding rock fractures.

2. Materials and Methods

2.1. Tested Material

The physical and mechanical properties of the selected specimen materials should meet the brittleness and rockburst tendency indicators. In the experiment, α-hemihydrate gypsum was selected as a similar material. Mechanical parameters of the material were determined through the uniaxial tests with different water–gypsum ratios, and the ratio that meets the conditions of the rockburst test was selected. The relevant parameters are shown in Table 1

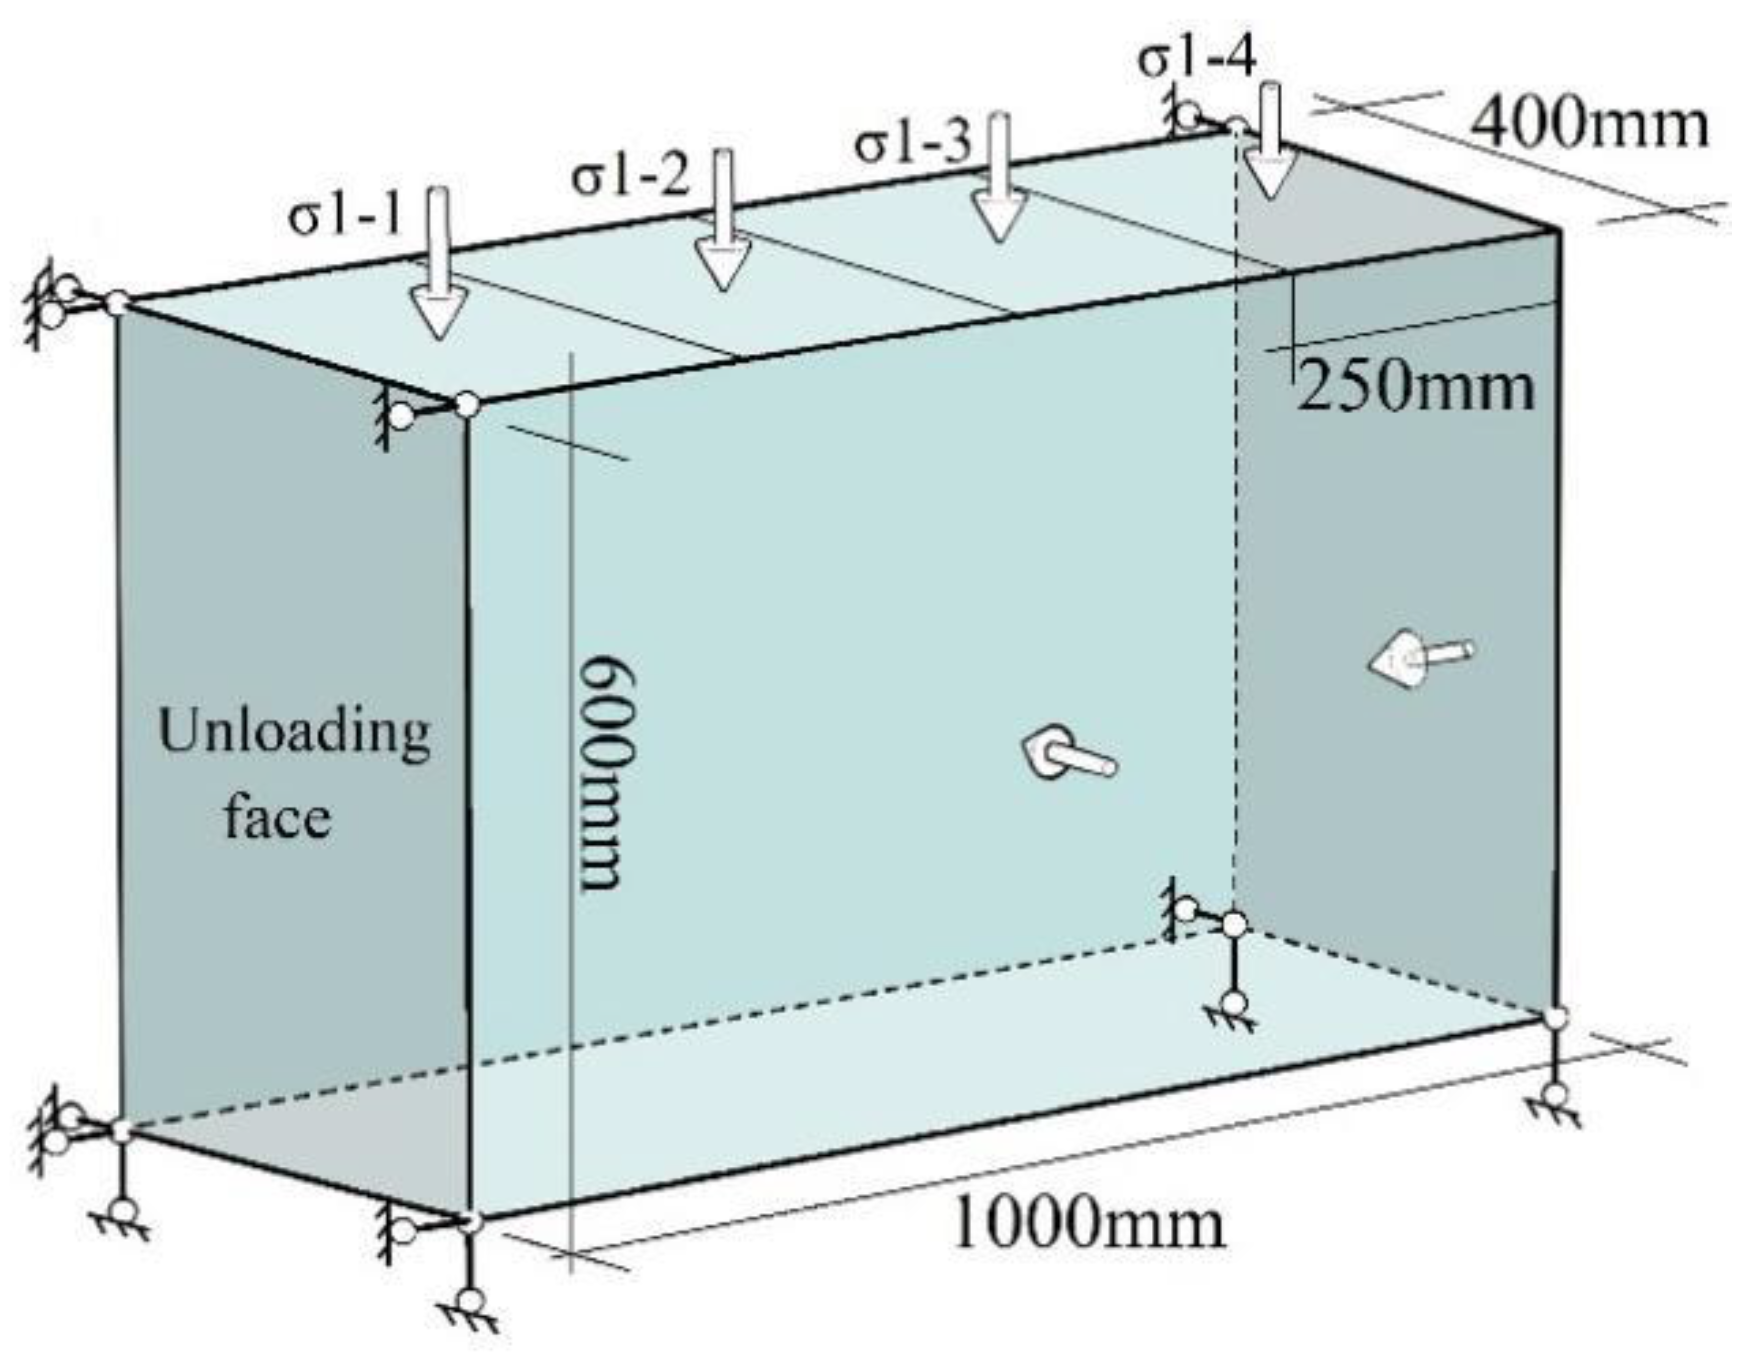
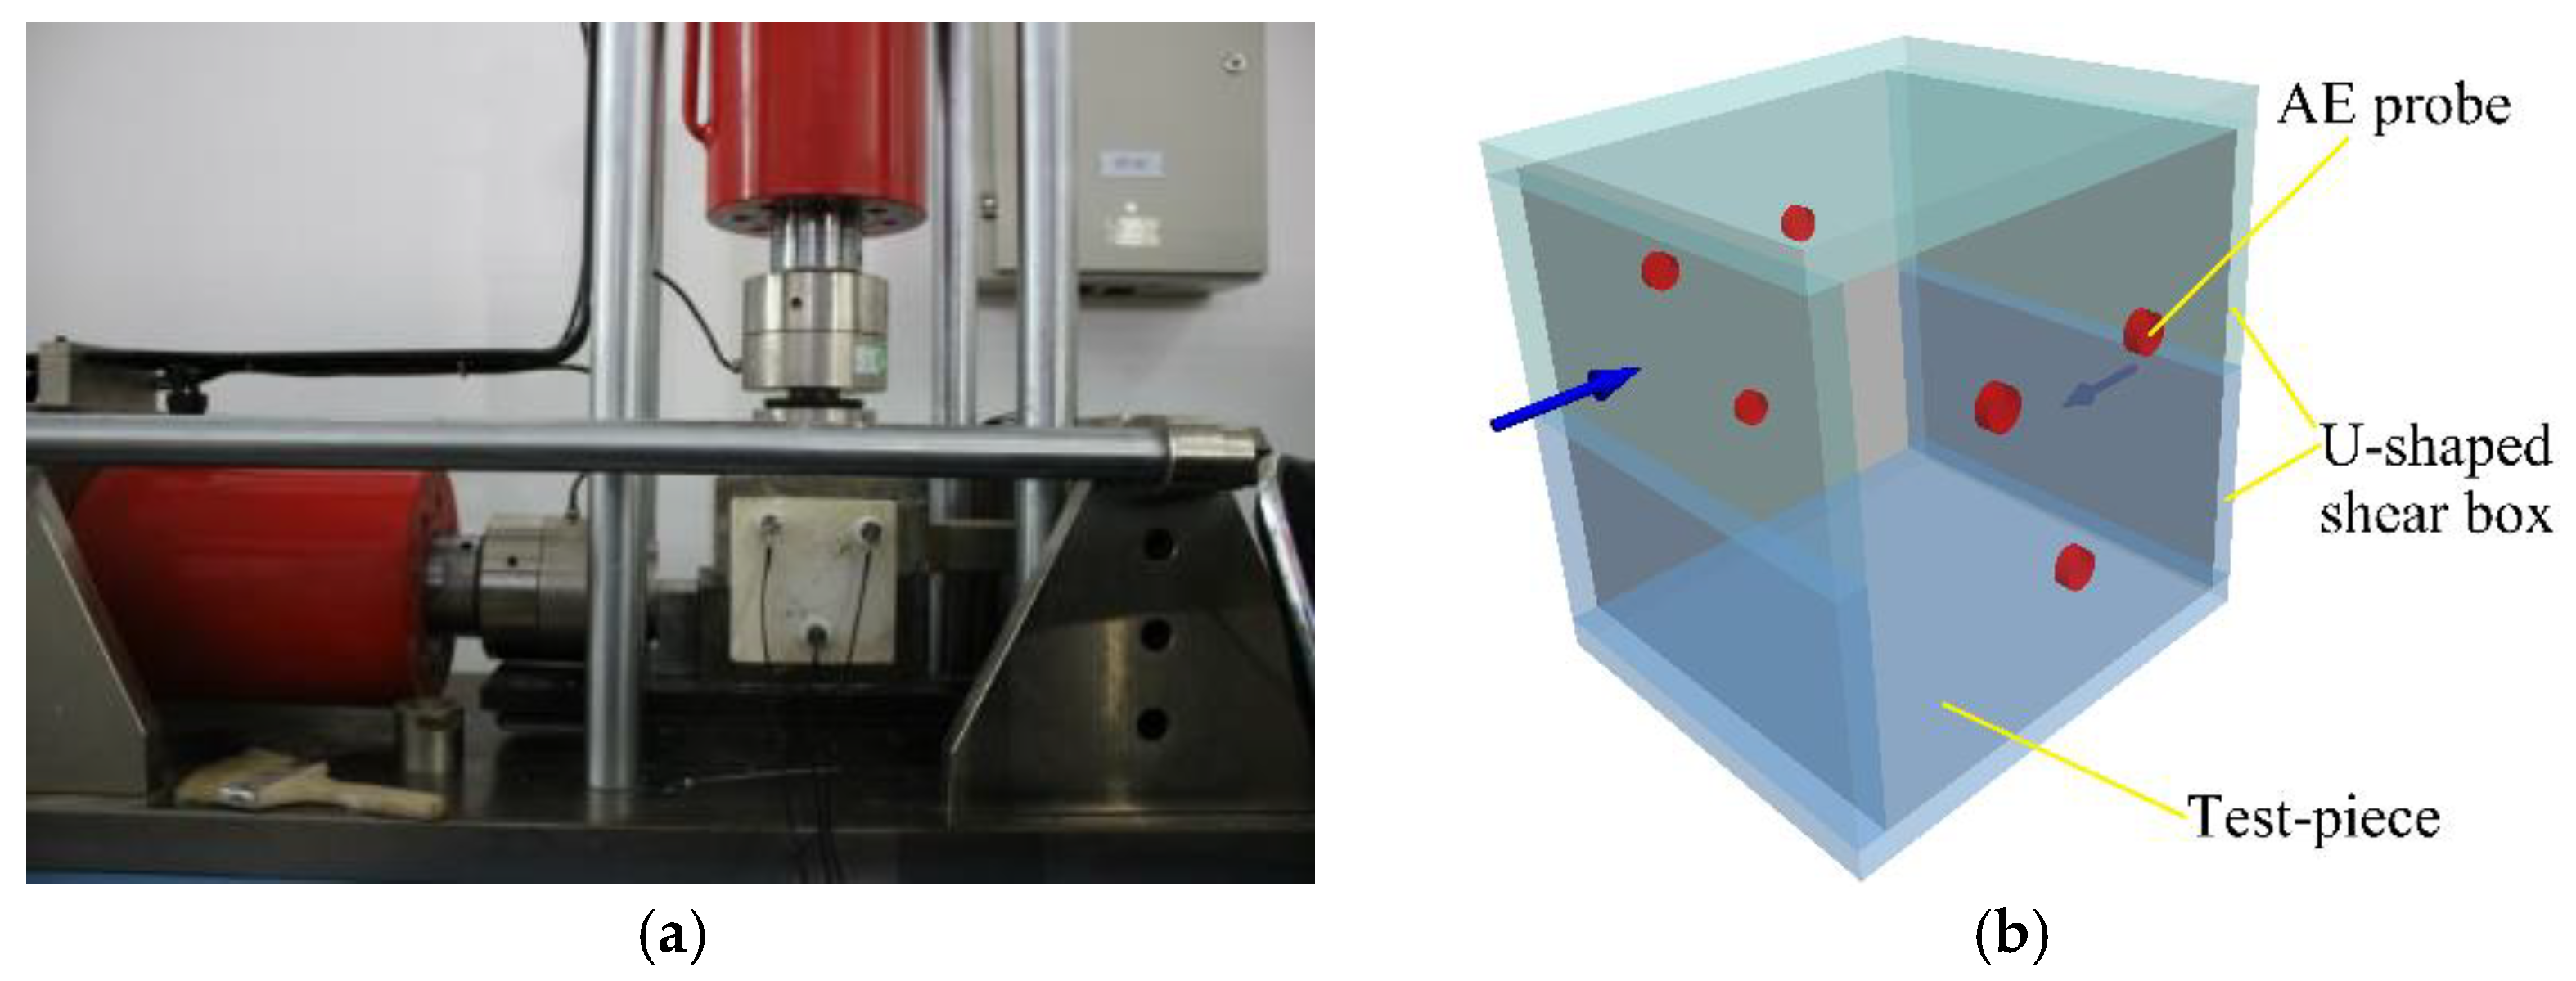
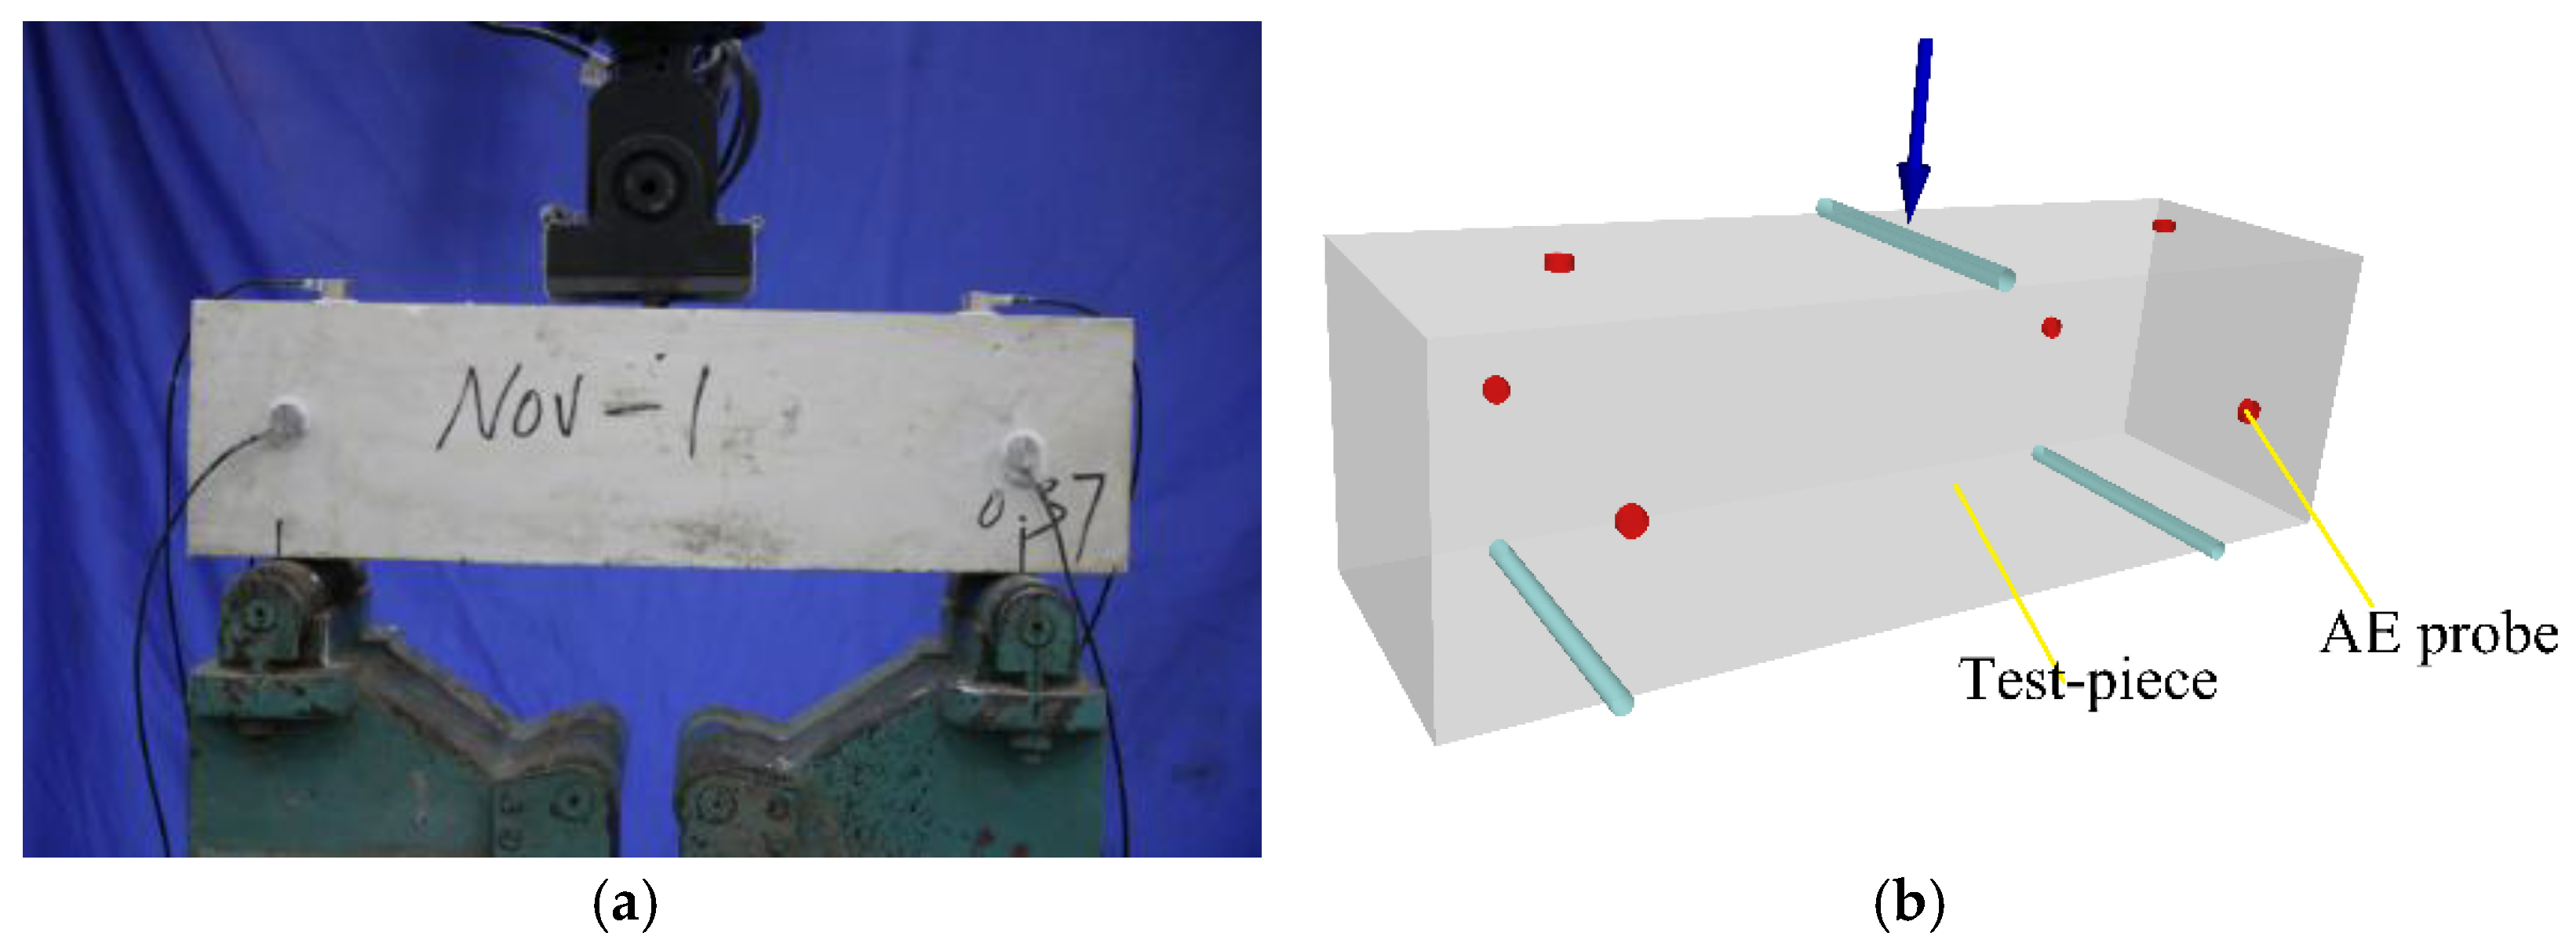
2.2. Experimental Design

To figure out the influence of the tangential stress gradients on a rockburst, the simplified Equation (1) [12] can be used to simulate the tangential stress:
y = nae−mx + c
where y is the tangential stress of a certain point in the surrounding rock, x is the distance from a certain point in the surrounding rock to the excavation boundary, c is the vertical stress of initial rock, and m is the tangential stress gradient coefficient.
The ratio of vertical ground stress σV to horizontal ground stress σH is set as follows: σV/σH = 2 (σ1 = σV = c > σ2 = σ3 = σH). First, the specimen was loaded in three principal directions (σ1 = c = 2 MPa, σ2 = σ3 = 1 MPa), as shown in Figure 1. Afterwards, the movable door plate was leading to an abrupt release of stress from this plate to simulate the tunnel excavation. Simultaneously, the vertical load was applied step-by-step. σ1–1 increased in n steps with the stride of a = 0.5 MPa, and the other tangential gradient stress was applied synchronously through y = naemx + c calculation. In this paper, four different top gradient loading paths (m = 0, 2, 4, 6) were used in the rockburst test.

3. Results and Discussion

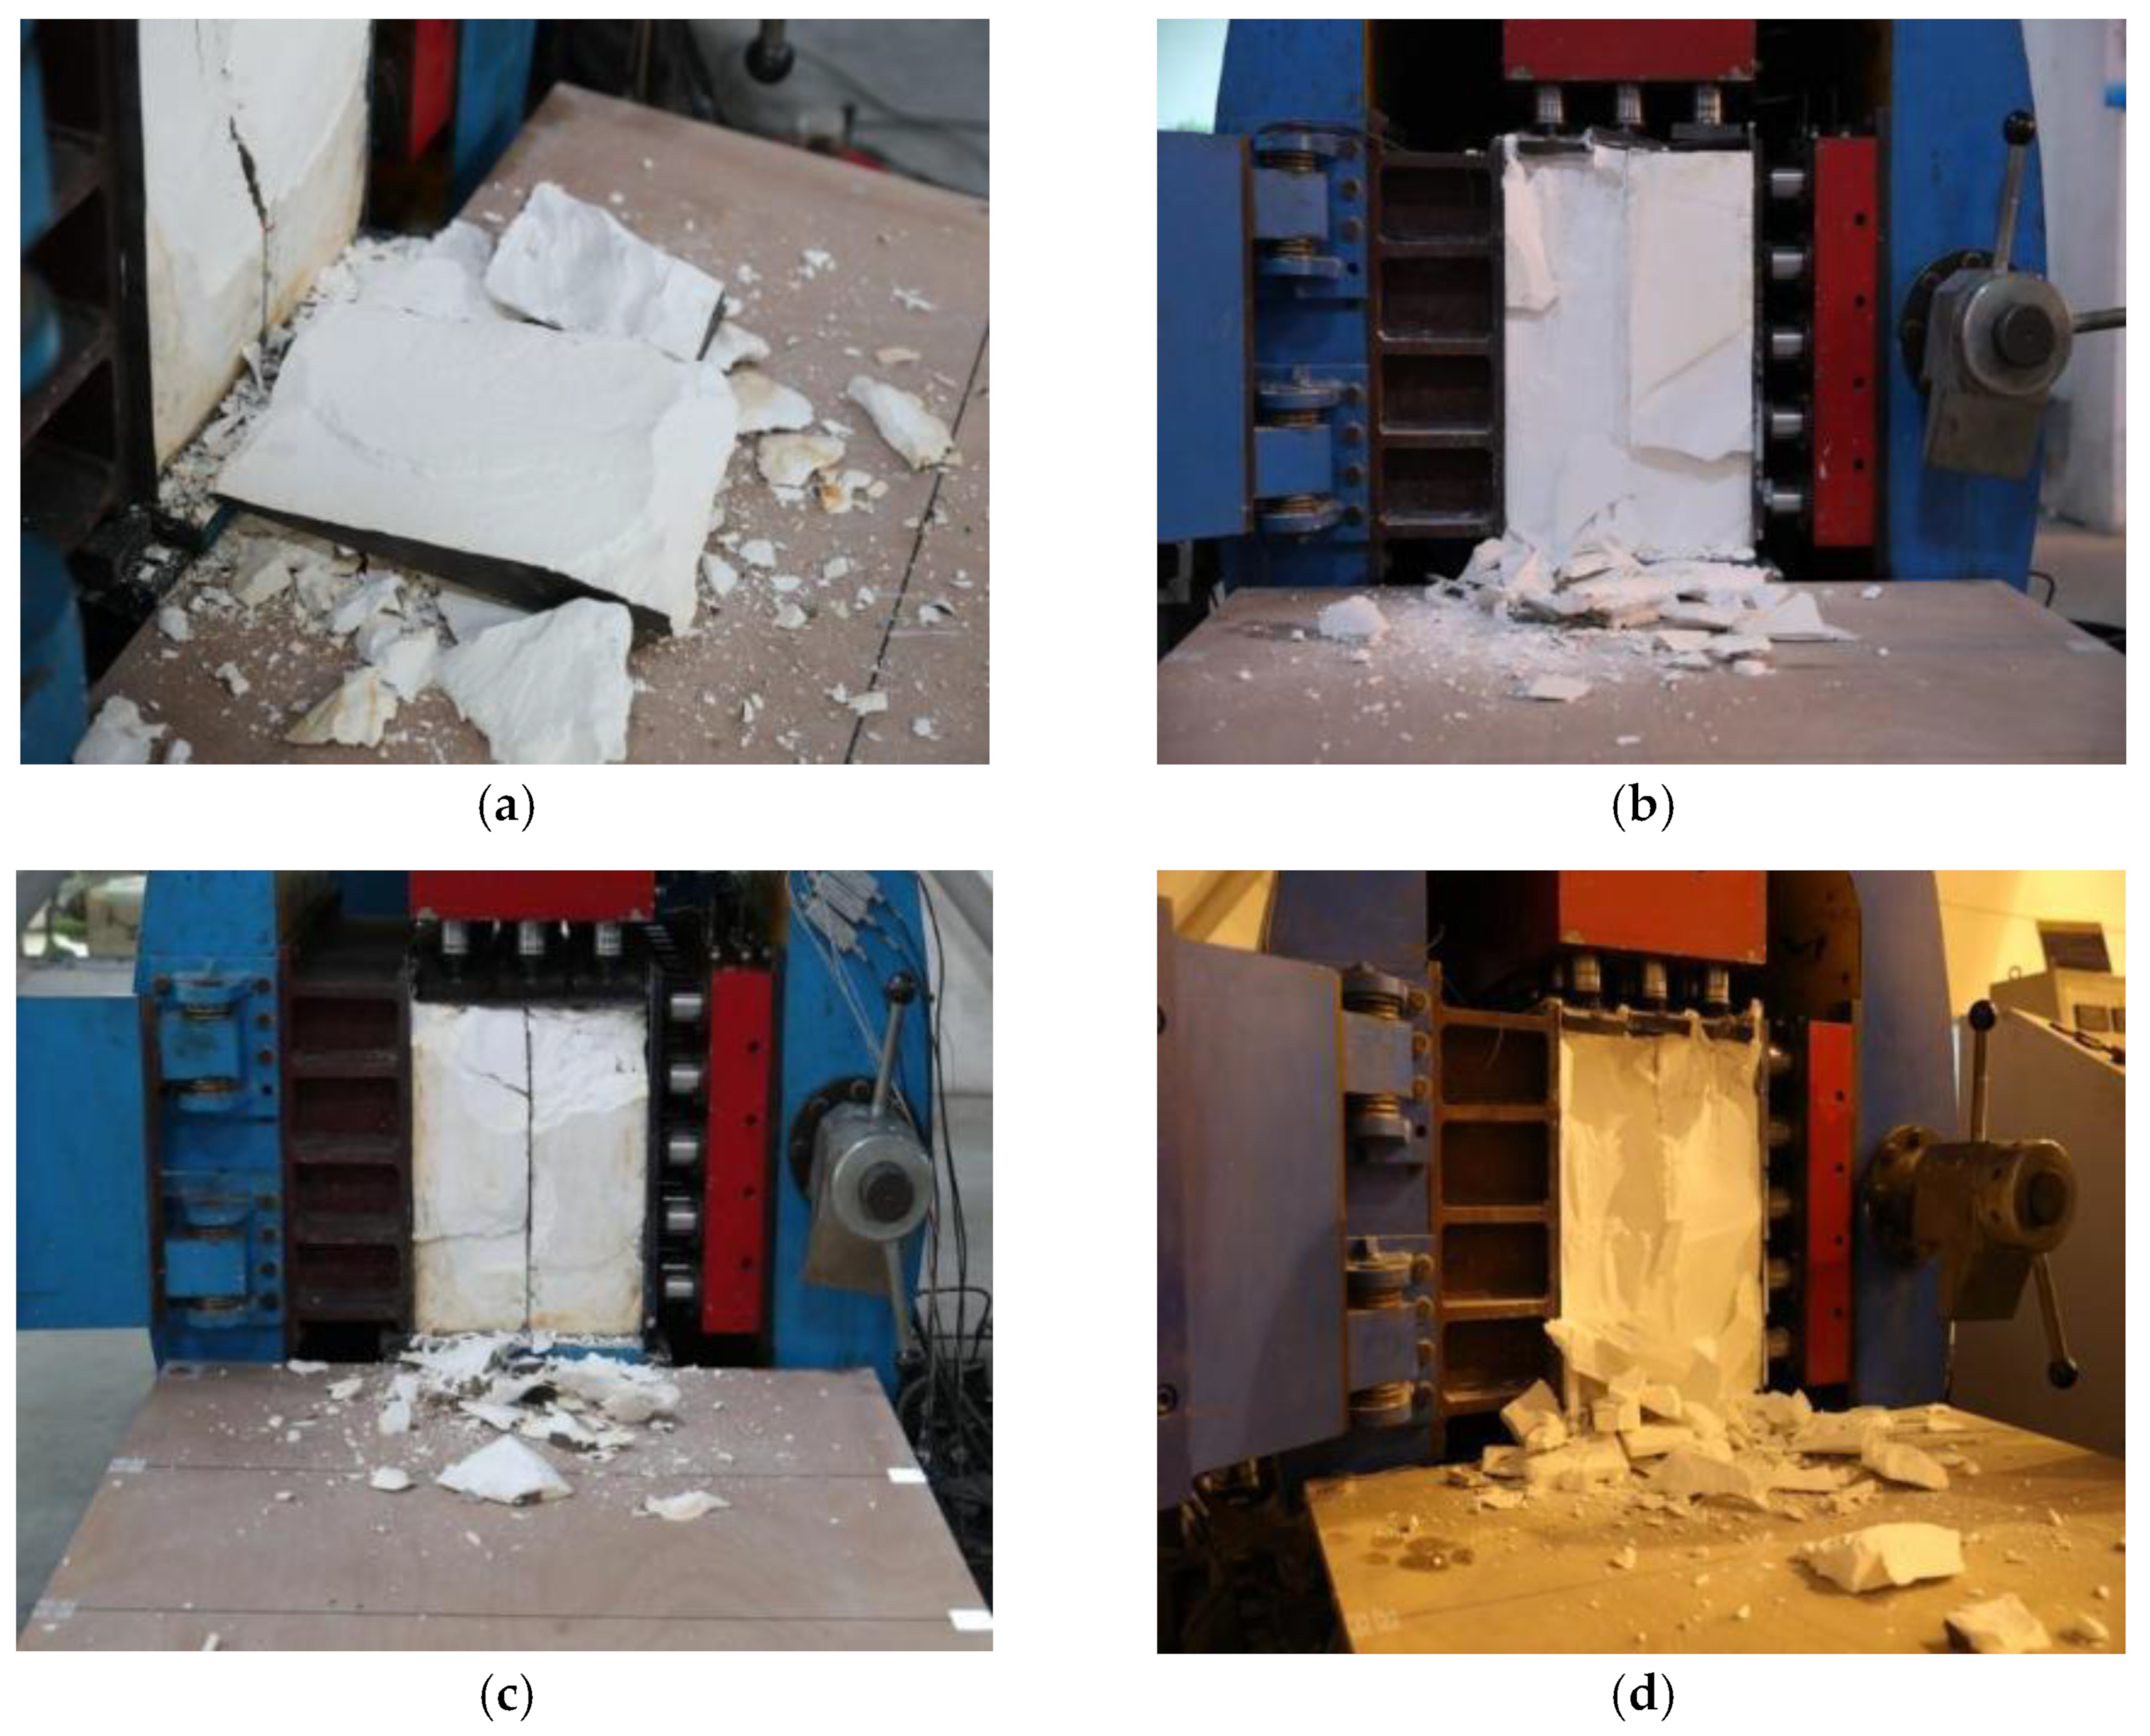
3.1. Rockburst Process Analysis

Previous research [12] has explored the influences of the stress gradient distribution of tunnels surrounding rock on the failure mechanism of a model rockburst. Based on the distribution characteristics of the tangential concentrated stress of the surrounding rock after a rock-mass excavation in deep underground space, the rockburst phenomenon of the model under different stress gradients was studied (Figure 2).
Figure 2 and Table 2 display the laboratory model test that reproduced the in situ rockburst failure process. It can be seen from the occurrence of a rockburst that, when the stress gradient is small (m ≤ 2), the failure takes longer and is a progressive process. When the stress gradient is large (m ≥ 4), failure is rapid, and when m = 6, the failure is almost instantaneous. As can be seen from the ejection distance of rockburst debris, as the stress gradient coefficient under test loading increases, the ejection distance of the rockburst debris increases gradually from 0.5 m to 2.0 m during the model rockburst, indicating that the dynamic characteristics of the model rockburst are gradually intensified, reflecting the trend of rockburst intensity to increase with the increase in stress gradient. When the stress gradient m = 0, static brittle failure occurs. With the increase in the stress gradient, the rockburst intensity tends to increase. When the stress gradient m ≥ 4, the model rock bursts all show debris ejection at failure, and the larger the stress gradient, the more significant the dynamic phenomenon. These results indicate that the formation and intensity of the rockburst model are related to the loading stress gradient.

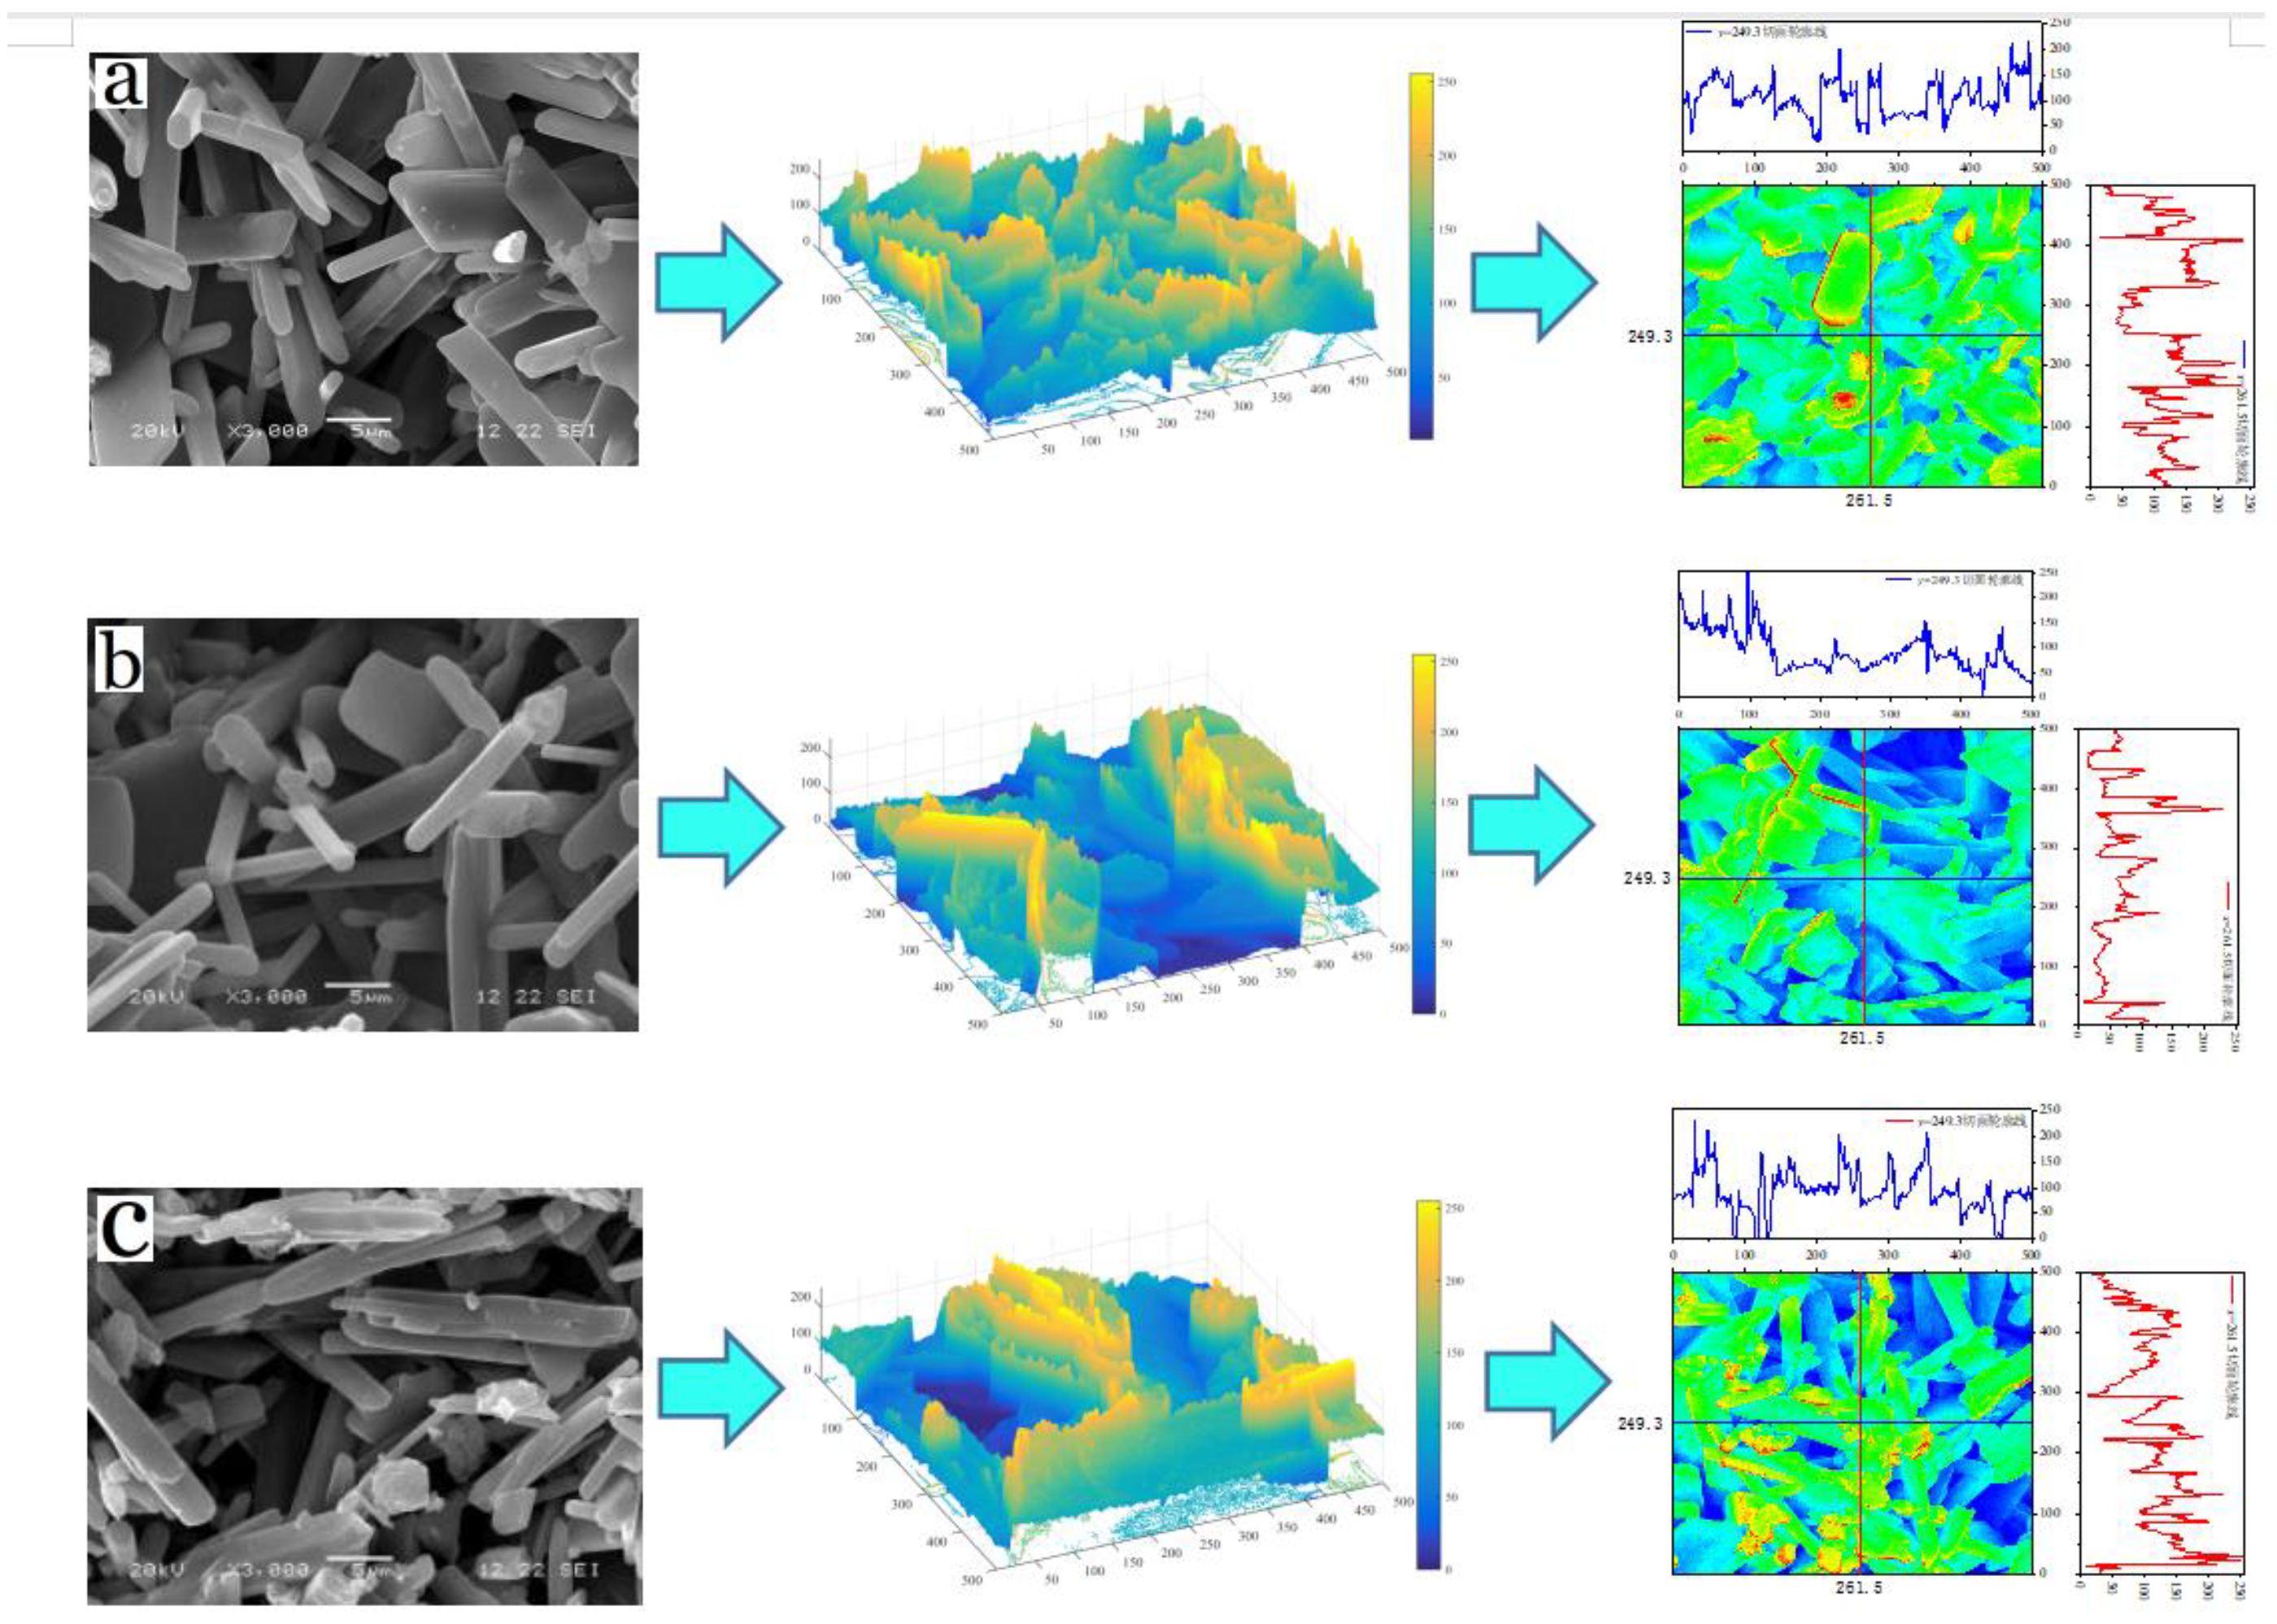
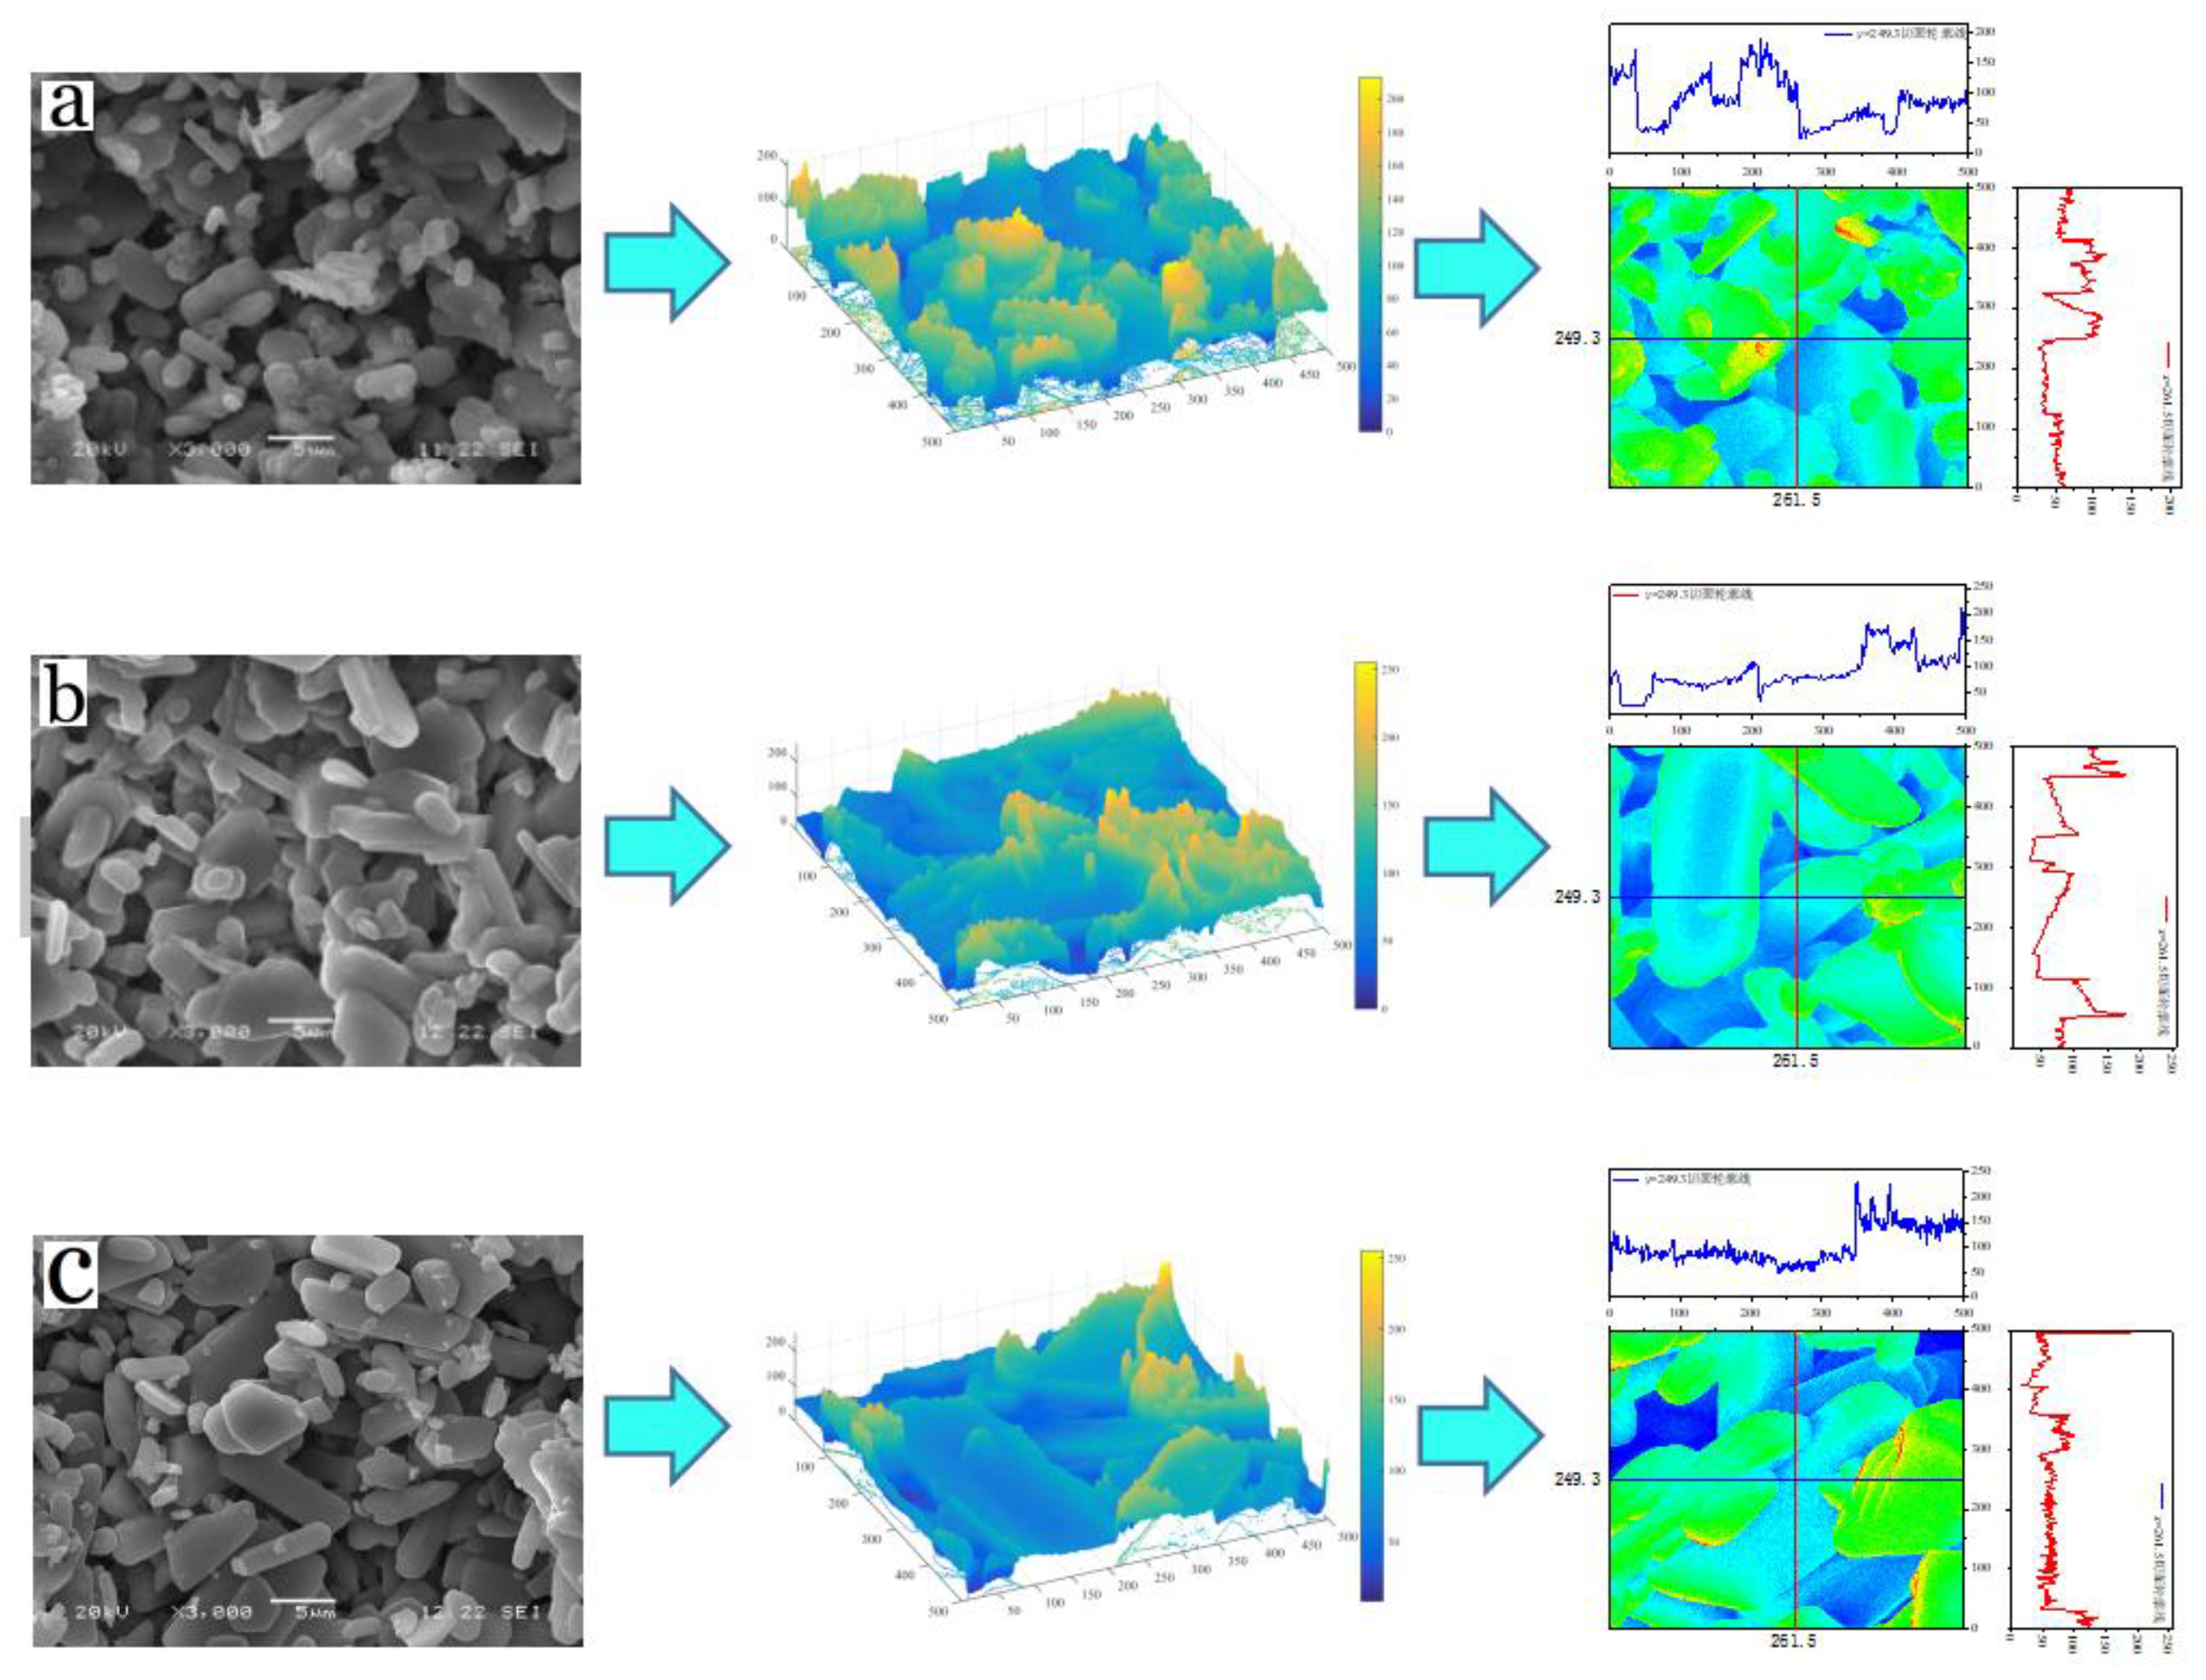
3.2. Analysis of Typical Rockburst Debris Fracture Surface Topography and Failure Mode

The morphology of rockburst debris fracture surface is an important feature of any rockburst failure mechanism. The rockburst incubation mechanism refers to the evolution of the mechanism (tensile failure, shear failure) related to the rockburst incubation process. In the process of rockburst failure under different loading stress gradients, the rockburst debris mainly showed two types of fracture surface morphology.
Figure 3 and Figure 4 show the typical macroscopic surface morphological characteristics of the debris in the rockburst model test. Plate-like debris refers to a type of debris with length–thickness ratio >3; bulk debris refers to a type of debris with a length–thickness ratio ≤3. Slabs and blocks contain several different subclasses, respectively. In the rockburst tests under different stress gradients, the two types of typical debris, plate-like debris and massive debris, are found to have consistent morphological characteristics.
According to the macroscopic cross-sectional morphology of the rockburst debris in Figure 3 and Figure 4, the macroscopic surface morphologies of the rockburst debris with different morphological characteristics (plate-like or massive) are different. Accordingly, the fracture surfaces can be roughly divided into ribbed or fluvial fracture surfaces. As shown in Figure 2, the section of the plate and flake rockburst debris is relatively straight, and the crack pattern is small and compact, but the details are rougher. Obvious comb and ribbed lines are observed on the surface of the debris. From the side of the debris in Figure 2a, a lamellar tensile structure can still be clearly seen. As illustrated in Figure 3, in the massive and lenticular debris, the fracture surface has a more complex pattern than that of the plate-like debris, and the surface morphology shows great waviness, presenting a fluvial distribution. Although the overall waviness of the fracture surface is large and not as straight as the plate and flake debris, the fracture surface is relatively smooth at the local scale. In addition, the trend of the fluvial pattern extends along the direction of the debris fracture, which can reflect the direction of relative movement of the debris at failure.

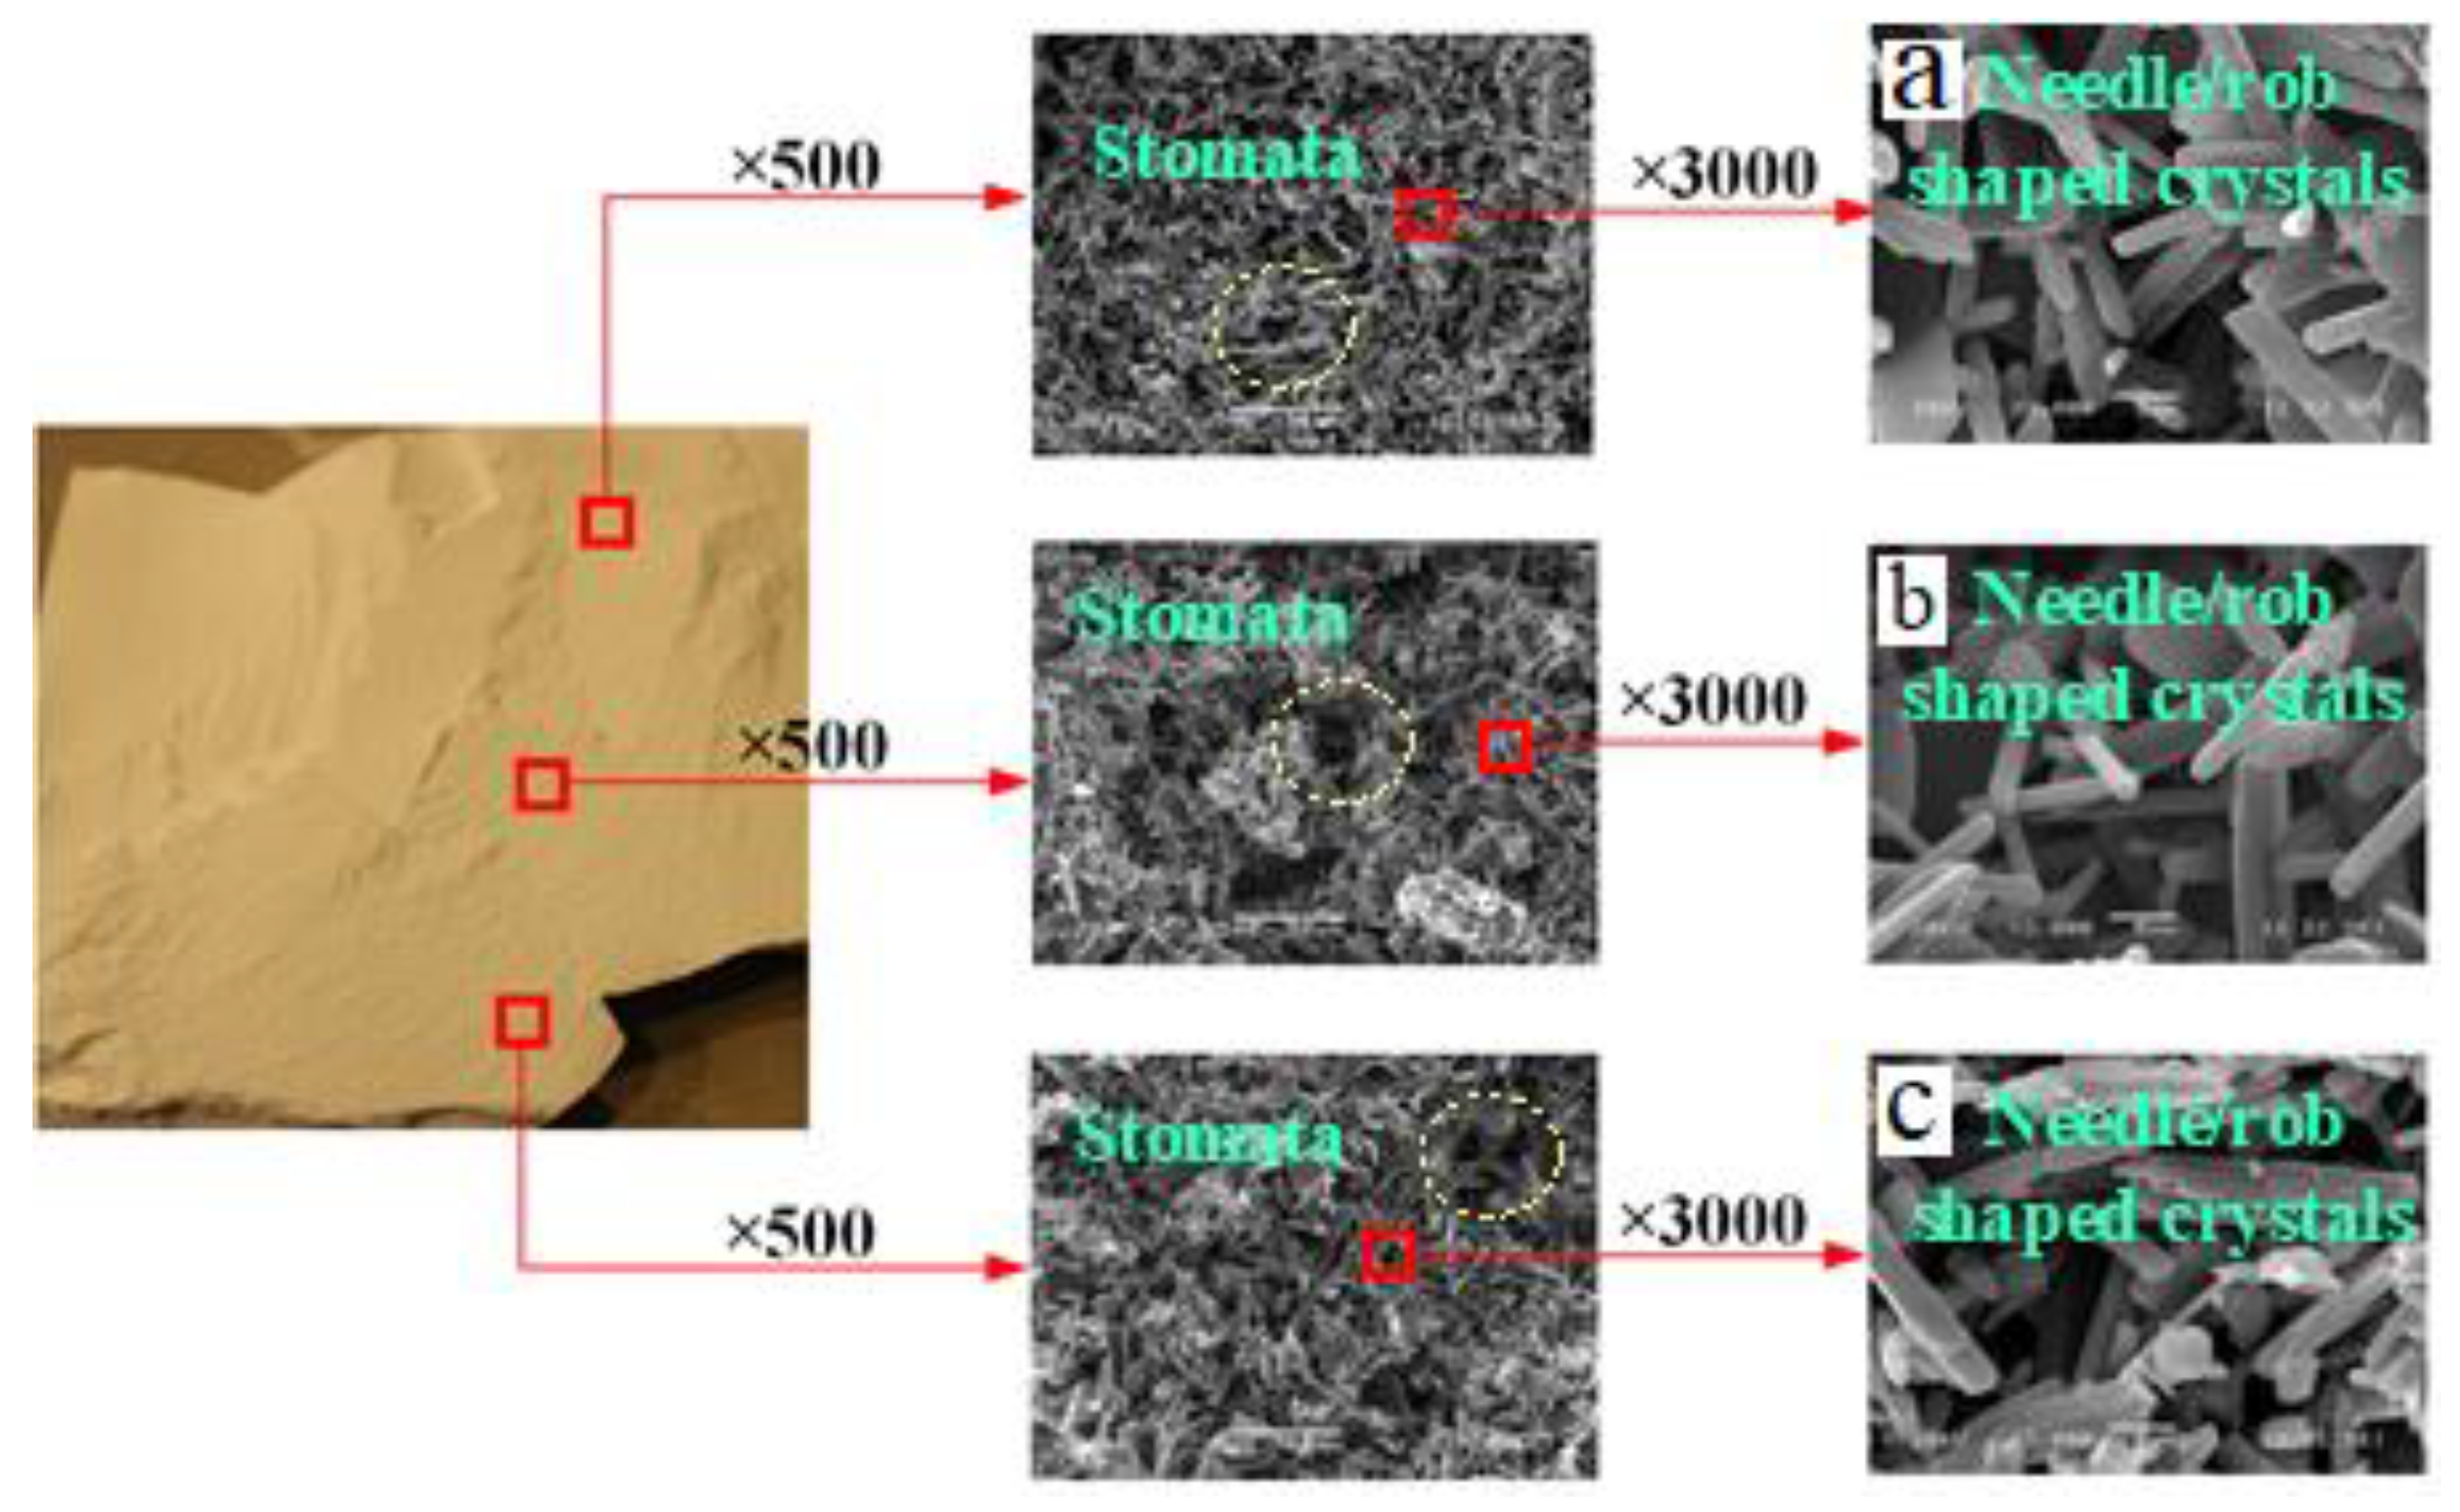
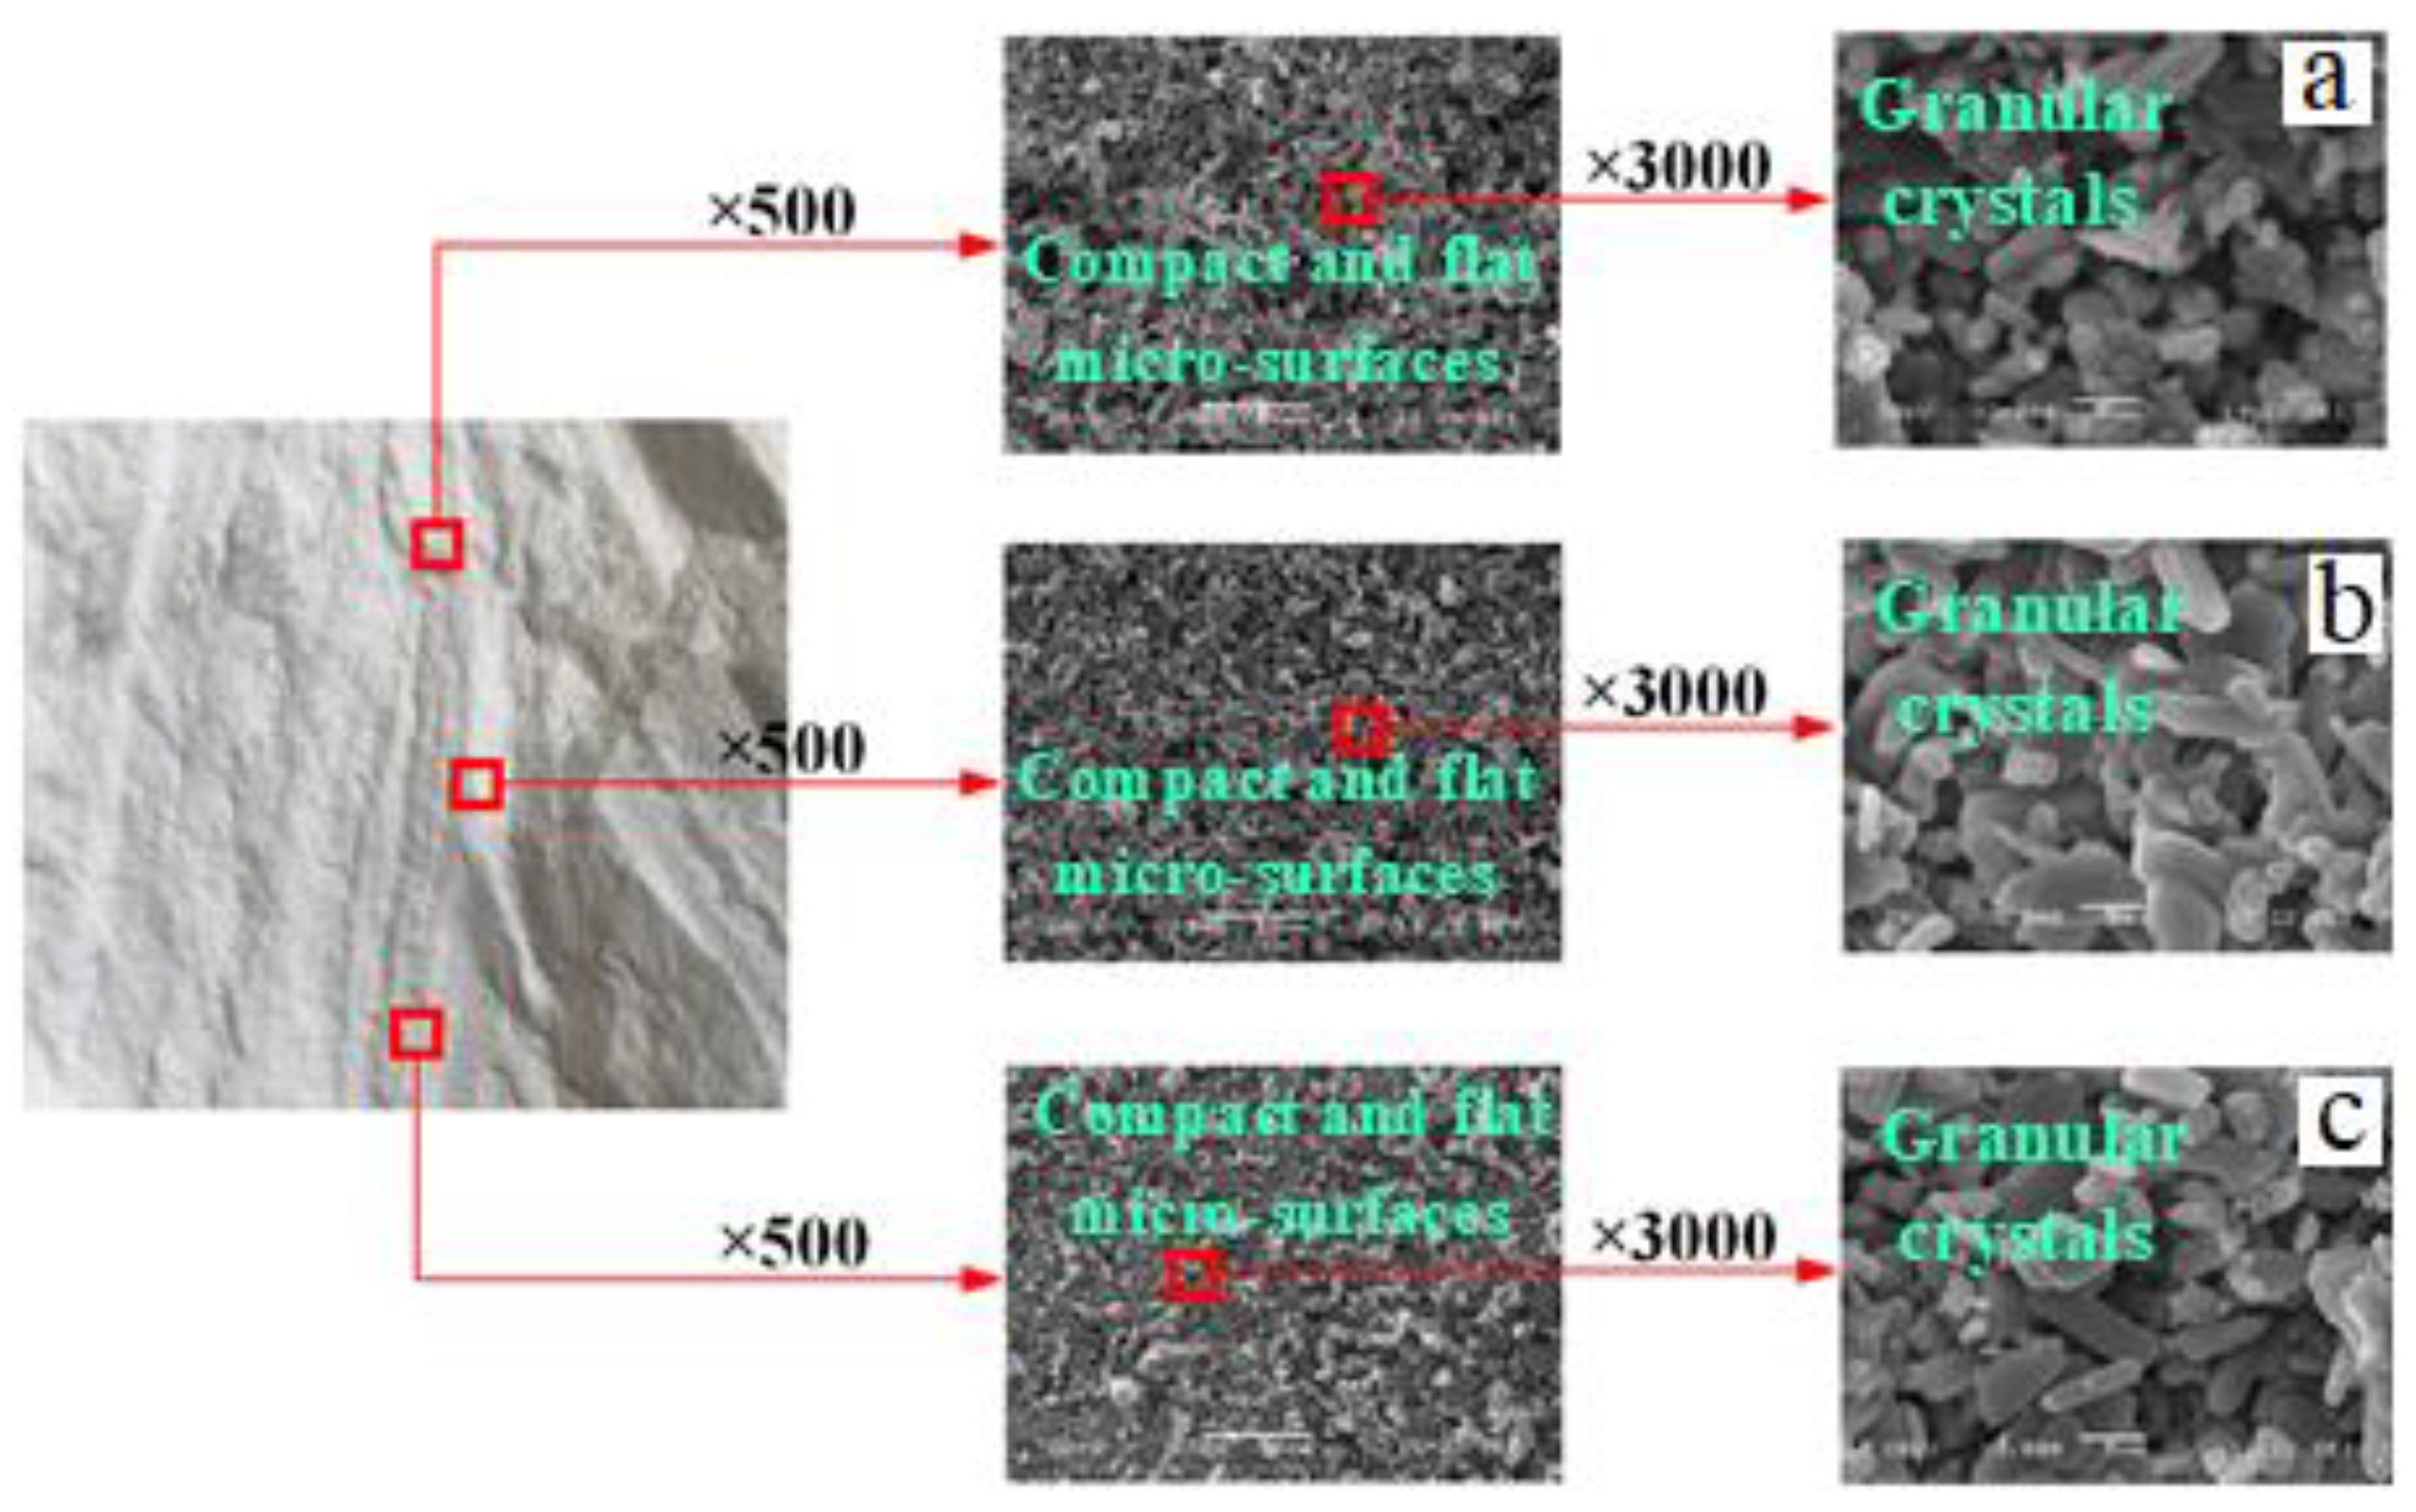
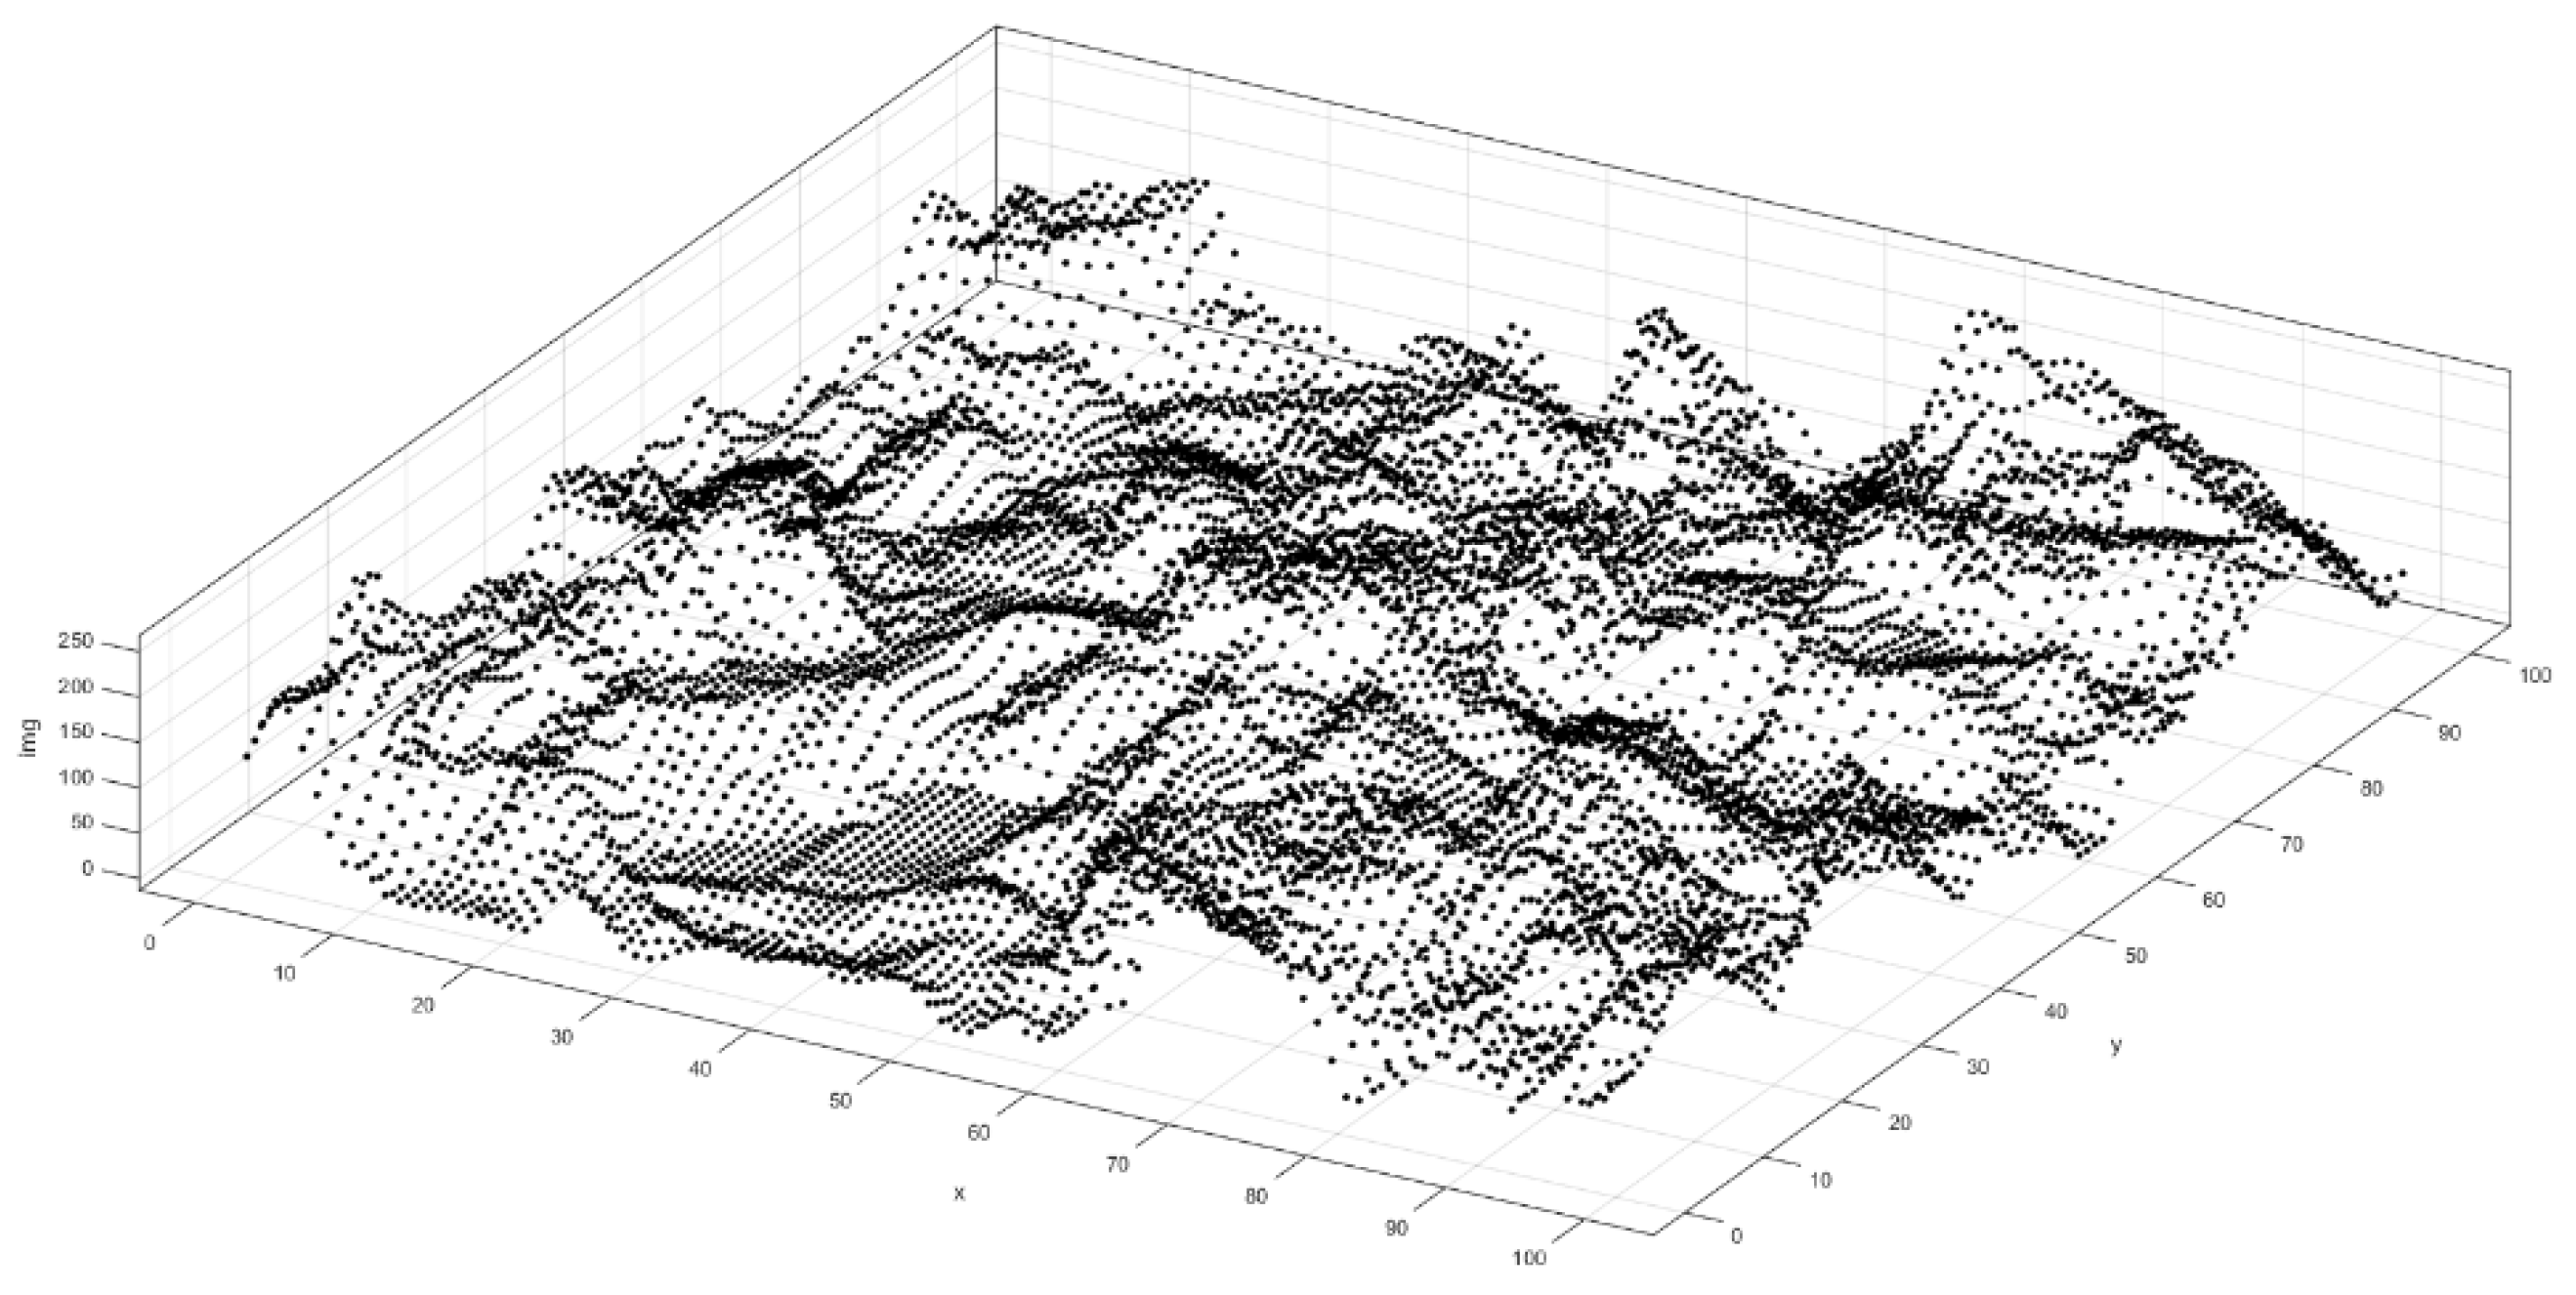
3.3. Analysis of Microscopic Surface Morphology and Failure Mode of Typical Rockburst Debris

The macroscopic destruction of materials is the comprehensive manifestation of many microscopic cracks [18]. To observe the crystal fracture characteristics of the different macroscopic sections of the rockburst debris from a microscopic perspective and explore the failure modes and macroscopic rockburst characteristics of model rockburst, a Zeiss GeminiSEM 300 field emission scanning electron microscope (SEM) was used in this chapter to observe and investigate the microstructure of several groups of debris with different macroscopic morphologies. Due to the loose structure of gypsum, low magnifications (×500, ×3000) were selected when observing the surface microscopic morphological characteristics of the model rockburst debris. The debris fracture surface should be cut to an approximately rectangular form first. Before the SEM image acquisition, the surface of the fracture needs to be gilded and then observed under the microscope to collect secondary electronic images. Figure 5 and Figure 6 show micrographs of debris on two typical fracture surfaces.
Compared with Figure 5 and Figure 6, at ×500 magnification of the rockburst debris fracture surface, porous structures are found on the surface of the plate and sheet-like psoriasis-type micro-fracture in Figure 5, which are natural stomata formed by water dispersion and displacement in the model maintenance process. When the fracture surface of the plate and flake debris is magnified 3000 times, the complete interlacing of acicular and rod gypsum crystals can be seen on the surface, and the crystal surface is relatively loose. However, when the massive and lenticular debris is magnified 500 times, the surface of the massive and lenticular debris does not have its original porous structure, the surface is compact and smooth, and there are tiny crystalline debris seen, indicating that the original crystal arrangement structure of the microscopic surface of debris is destroyed. When magnified 3000 times, the crystal shape of the psoriasis-type micro-fracture surfaces becomes granular, and the crystals are closely arranged and interlaced. This analysis of the micro-morphology of the different fracture surfaces indicates that the fracture of the plate and flake debris corresponds to the shear failure and tensile failure evolution mechanisms, respectively.
SEM images are greyscale images, in which the greyscale value of black is 0 and that of white is 255. In the SEM micro-fracture images of the gypsum materials herein, the light-colored part near the white usually represents high crystalline undulations, while the darker part is a pore or area with low waviness. The irregularity of the fracture surface can be quantitatively described by the fractal dimension; therefore, the more we can elucidate the mechanism of the formation of the two psoriatic micro-fracture structures, according to different grey values, the more we can establish the microscopic three-dimensional structures of the typical micro-fracture surfaces by MATLAB™ and point-cloud data pertaining to each microcrack micro-surface space (Figure 7). Based on the numerical simulation of the rough shape of the micro-fracture surface of the debris, the surface rough shape was numerically expressed by extracting the profile lines from the micro-fracture surface of the model to determine the failure mode of the micro-fracture surface (Figure 8 and Figure 9).
In this section, the roughness of the micro-fracture surface is characterized by referring to the main description method of the two-dimensional roughness line of the joint surface (JCR method). For the joint surface roughness coefficient (JRC) method, Li et al. [19] obtained the relationship between JRC and the root-mean square Z2 of the first derivative of the joint surface contour by measuring and calculating Barton 10’s standard curve:
J R C = 32.2 + 32.47 lg ( Z 2 ) ,
Z 2 = 1 L x = 0 x = L d y d x 2 = 1 M ( Δ x ) 2 i = 1 M ( y i + 1 y i ) 2 1 / 2 ,
where L denotes the joint section line projected onto the x-direction, Δx is the sampling interval along the x-direction, yi, yi+1 are the rupture points i, i + 1 in the y-direction (undulation value), and M represents the total number of sampling spacings. Here, the rupture surface roughness for a stochastic analysis was investigated by taking a microcosmic surface area of 50 μm × 50 μm and setting the sampling interval to 5 μm.
Therefore, the point-cloud data were obtained from the three-dimensional surface reconstruction of the different psoriatic micro-cracked surfaces by SEM (Figure 7), and the micro-fracture surfaces were cut at equal intervals to obtain two-dimensional roughness profiles. The contoured point-cloud data were substituted into Formula (3) to obtain the root-mean square Z2 of the relative waviness height of the crack, and then Z2 was substituted into Formula (2) to obtain the surface roughness coefficient JRC of the micro-fracture surface. Finally, the average value of the two-dimensional roughness of the multiple contour lines in the x and y-directions was used to approximate replace the three-dimensional roughness. The three-dimensional surface roughness of the different micro-fracture surfaces could be calculated (Table 3).
The complete crystal morphology of α-hemihydrate gypsum is acicular; as seen from Figure 8 and Figure 9, the surface of the macroscopic ribbed fracture structure is formed by the overlapping of needle-like and rod-like crystals, and the crystal structure is relatively complete. The surface roughness JRC is greater than 19, showing that the micro-fracture surface has a larger waviness, the crack surface is rough, indicating that the crack is caused by the stretching of the two sides of the fracture surface, and the microscopic crystals are pulled away from each other. Micro-fracture surfaces develop along the grain boundaries, corresponding to intergranular failure. At the same time, the appearance of the intergranular fracture surfaces is the reason why the macroscopic fine fracture surface becomes coarser. The structure of the macroscopic fluvial micro-fracture surface contains mainly spherical, or cake-shaped crystals, and the surface roughness JRC value is less than 17.5. The fracture surface of the micro-fracture debris is relatively smooth (corresponding to the macroscopic fracture surface of debris with localized smooth areas), and there are obvious crystal fracture traces. It indicates that the two sides of the fracture surface are relatively staggered during the crack formation, which corresponds to the transgranular failure in the process of shear-crack formation. Analyzing the results of the above model, when a rockburst failure occurs, the typical debris fracture surface under the different stress loading paths is generated according to the analysis of the debris brittle failure model, and the overall fracture mechanism in a rockburst involves plate-like tensile rupture and block shear failure.
The above results indicate that the macroscopic and microscopic morphologies of the two typical rockburst debris correspond to each other. The fracture surface of the plate and flake debris should be generated by tensile failure, while the fracture surface of the massive debris is generated by shear failure. The fracture surface roughness of the debris is determined by the failure mode or the failure mechanism. According to the morphological analysis of rockburst debris under different stress gradient loading regimes in Section 3, the model is dominated by the plate and flake debris under small gradient stress loading. With the increase in the loading stress gradient, the massive debris increases. This finding implies that with the increase in the loading stress gradient, the model gradually transitions from tensile failure to shear failure.

3.4. Fracture Classification under Gradient Loading

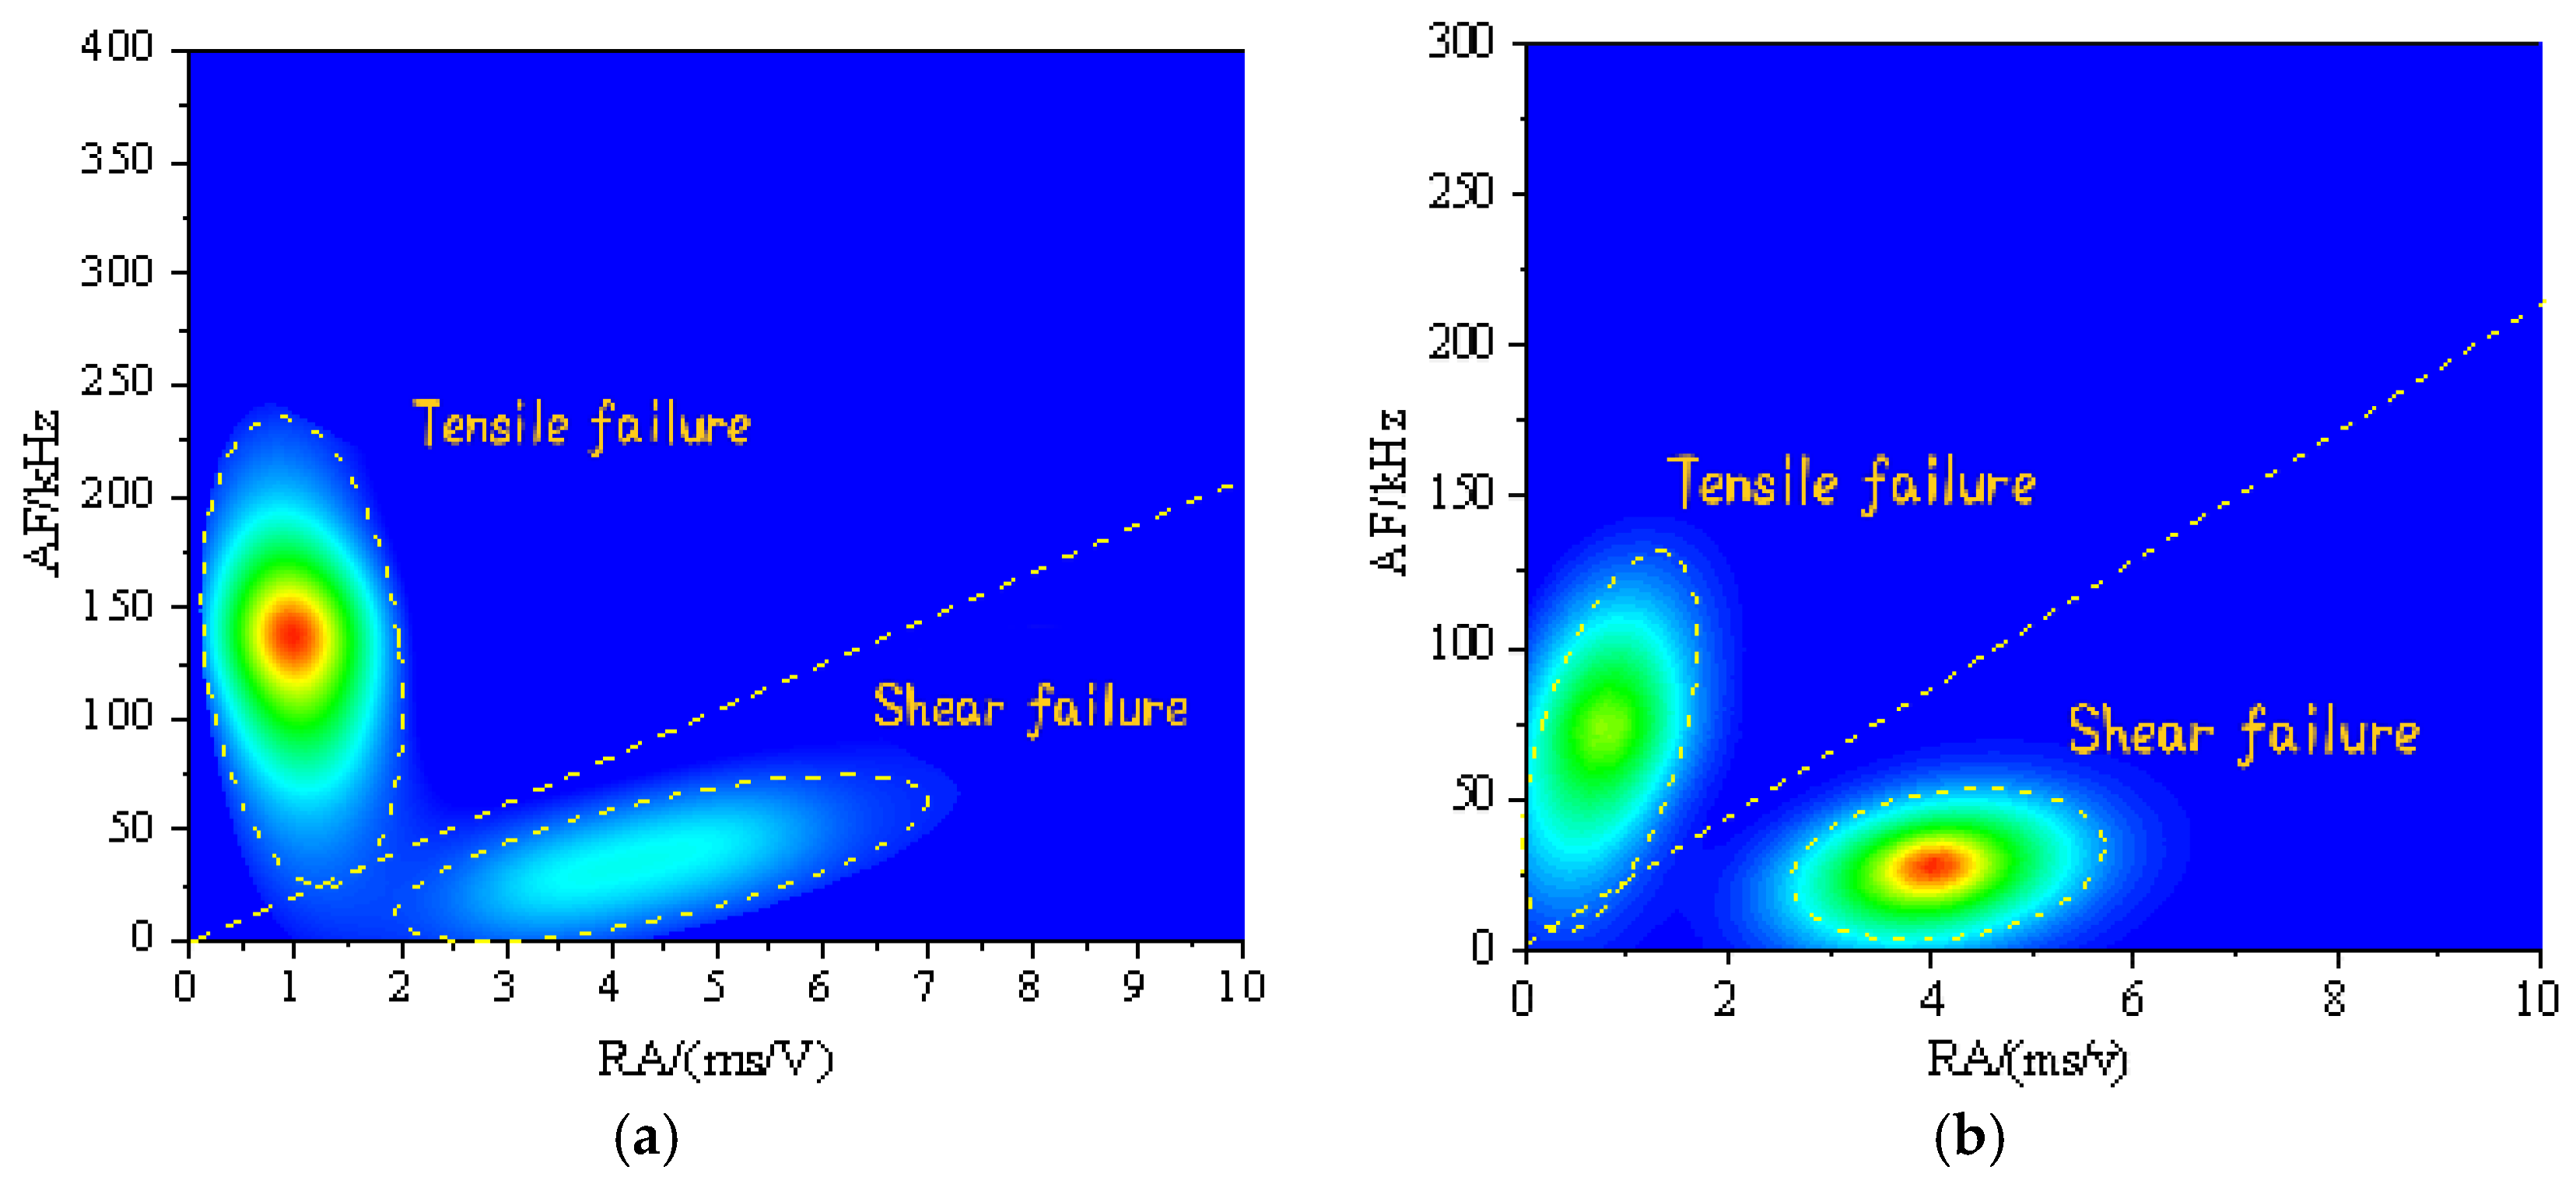
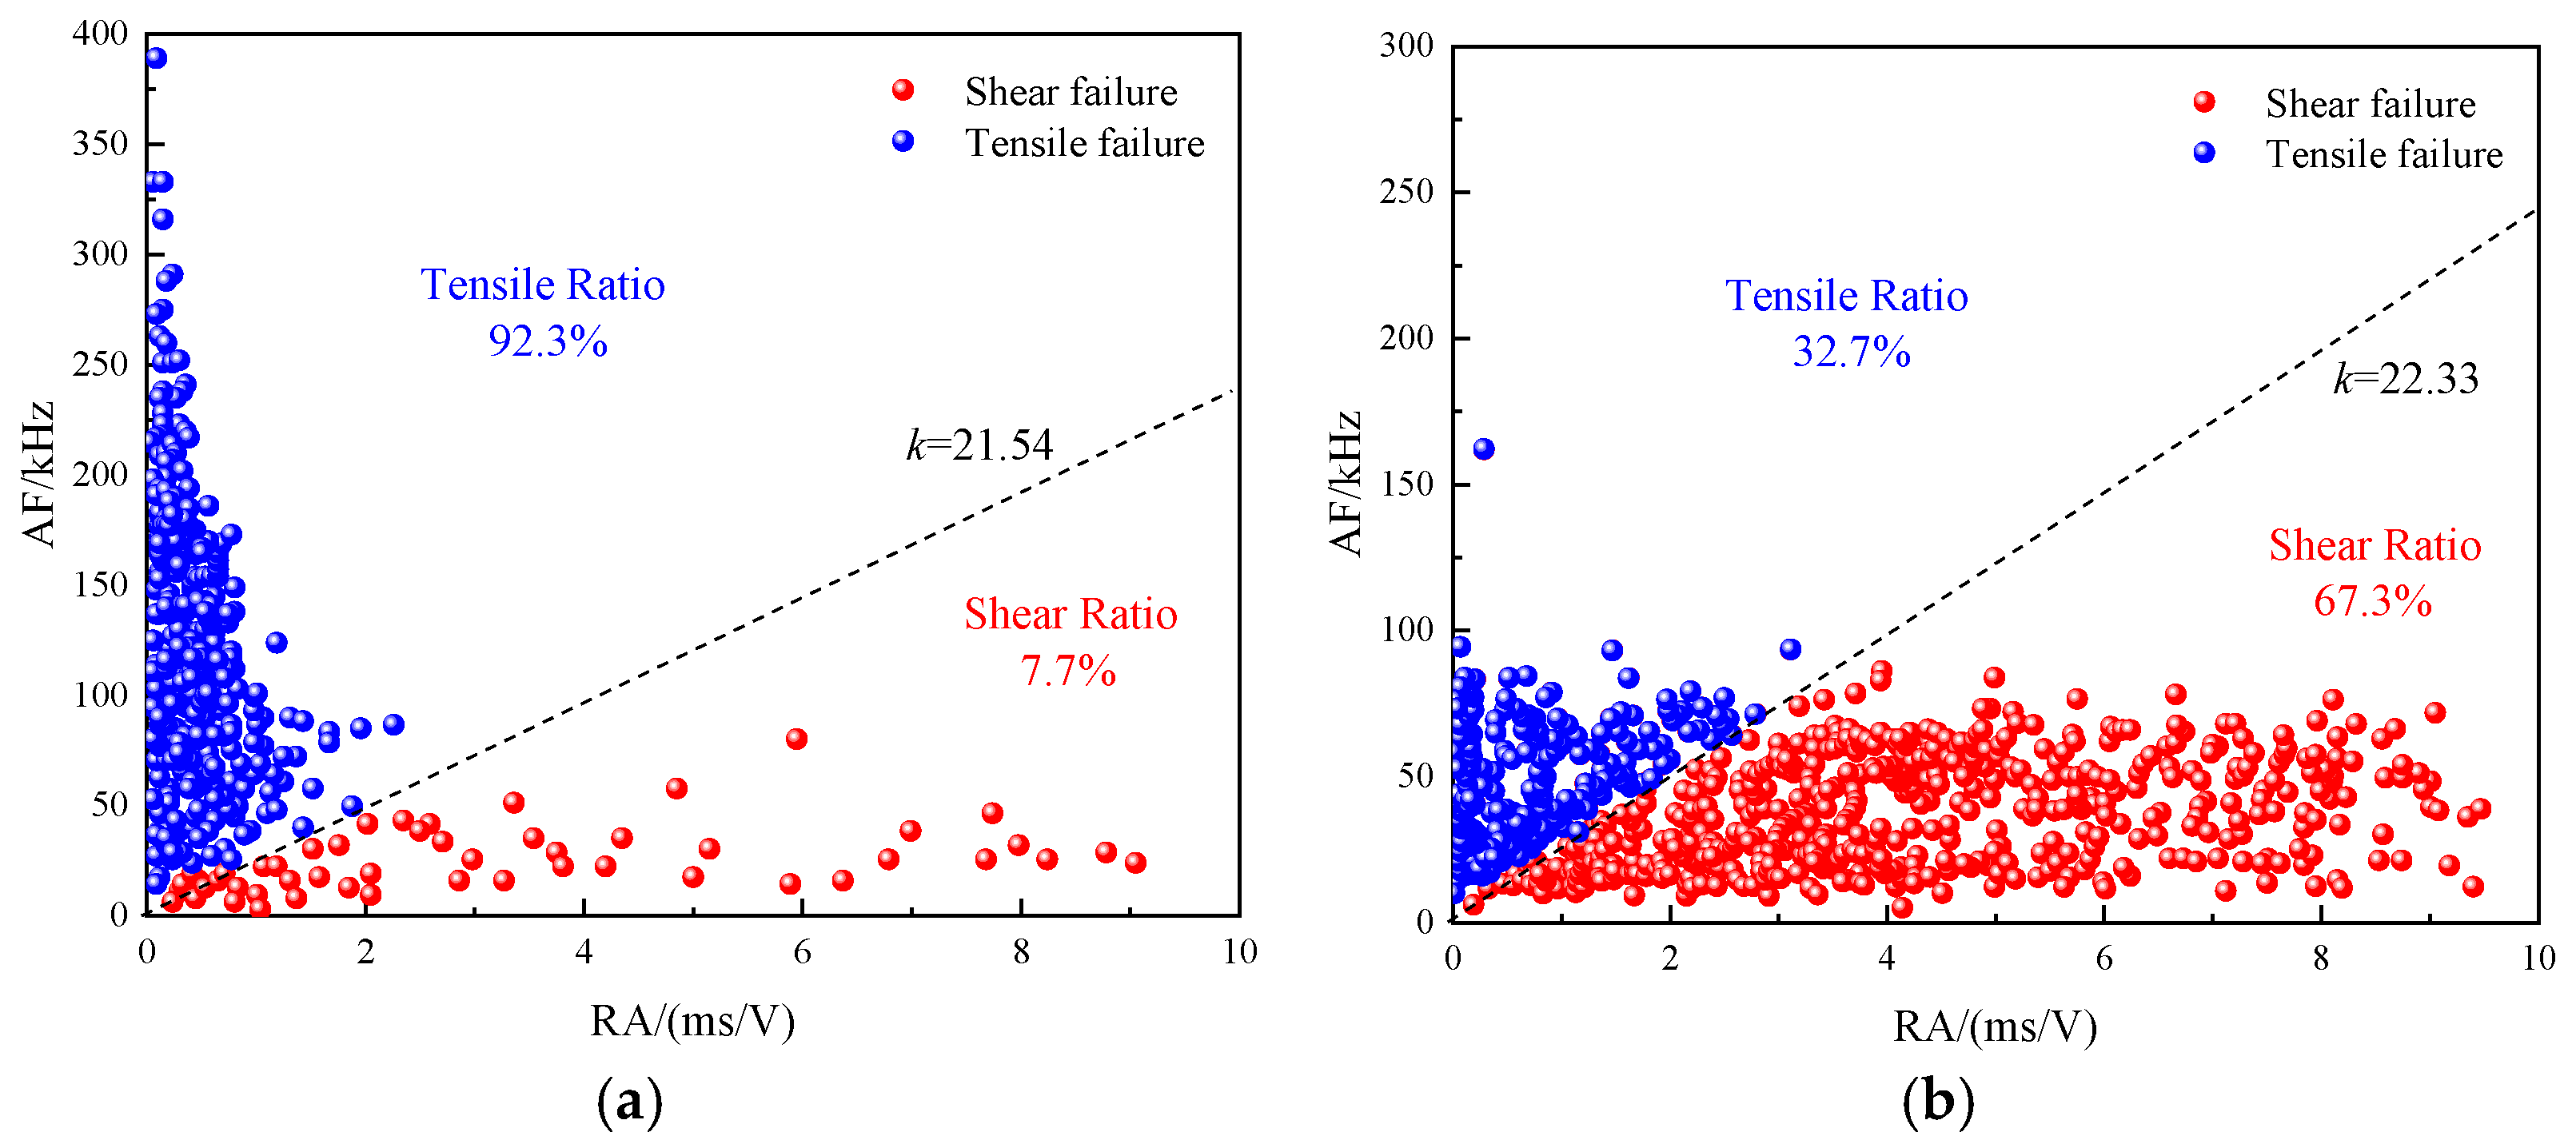
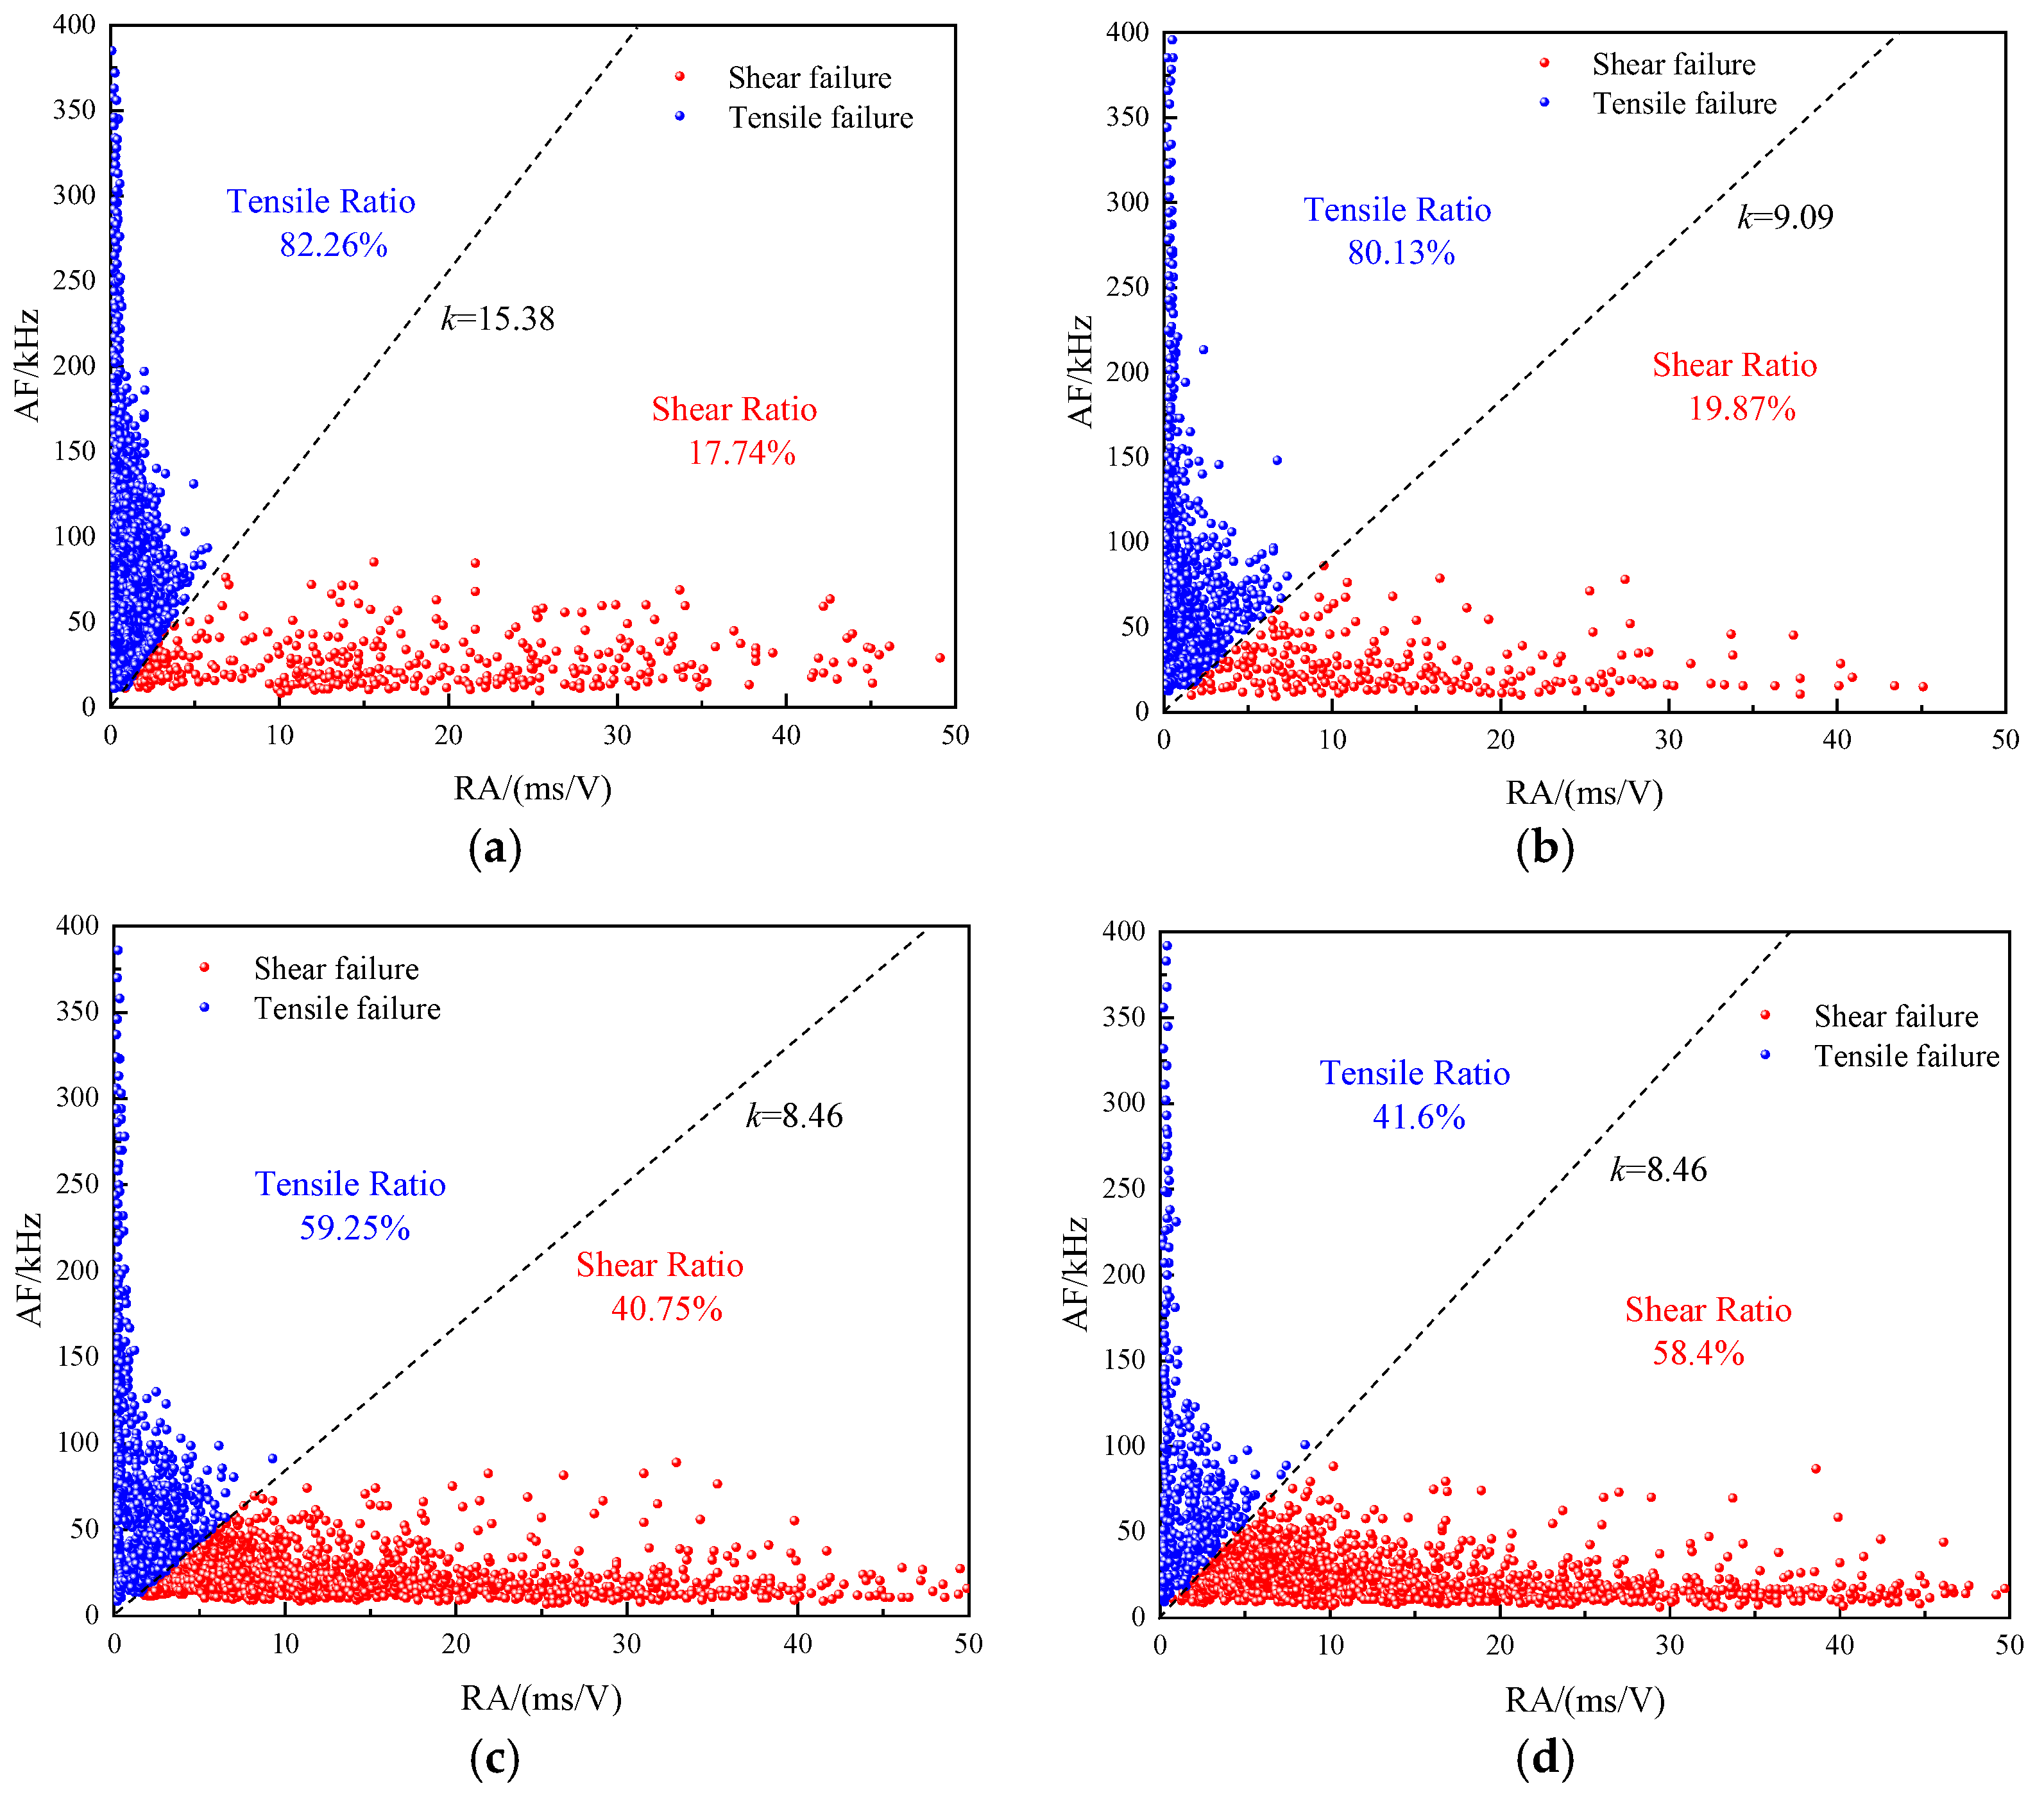
3.4.1. Determination of the K-Value in the Acoustic Emission Characteristic Parameter Method Based on a Gaussian Mixture Model (GMM)

To determine the K-value of the acoustic emission characteristic parameters of the rock fracture classification [20], a GMM-based probabilistic method was adopted [21] to determine the distribution characteristics of the acoustic emission characteristic parameters, and the acoustic emission sources in the loading process of the specimens were divided into two significant clusters: tensile failure and shear failure.
The GMM can smoothly approximate the density distribution of any shape, and the probability density function of the GMM is defined as follows [22]:
p ( x | δ ) = i = 1 M ω i N i ( x | μ i , Σ i ) i = 1 , M ,
where M denotes the mixed number of the model; ωi is the weight on the model; N i ( x | μ i , Σ i ) is the single-mode state Gaussian density; x stands for the eigenvector; δ is the optimization parameter; ∑i is the covariance.
δ is parameterized by weighting x eigenvectors, ∑i covariance matrix, and the mixed numbers of all components M as expressed by Formula (5):
δ = [ ω i , u i , Σ i ] , i = 1 , 2 , , M ,
For the classification system based on the GMM, the goal of model training is to estimate the value of δ of each GMM parameter, so that the Gaussian mixture density matches the distribution of eigenvectors, and the maximum J(δ) (optimal parameter) is achieved. The GMM clustering parameter estimation usually relies on the expectation maximization algorithm for training [23]. To reduce the scale of the likelihood estimate J(δ) of the event probability density, the logarithm of J(δ) is presented:
ln J ( δ ) = ln i = 1 M p ( x i ) = i = 1 M ln p ( x i ) ,
Therefore, the structures with two types of crack patterns, such as rock, can be classified according to the GMM, that is, tension and shear-crack classification (M = 2). To classify these two crack patterns, the eigenvector x is regarded as a two-dimensional vector x = R A , A F according to the model rockburst acoustic emission data, where the RA and AF values are the values detected by multiple channels simultaneously, and matching the parameters of the GMM and the eigenvector x are estimated given the training data X = { x 1 , , x n } .
To solve the maximum likelihood estimation, the expectation maximization (EM) algorithm is used to estimate the parameters of the Gaussian mixture model. Firstly, the parameters of δ (eigenvector x , covariance matrix ∑I and mixture number of all components M) are initialized, and the parameters ωi, ui, and ∑i of the Gaussian mixture under state correlation are preliminarily determined by using vector quantization, allowing the calculation of the a priori probability of each component in each Gaussian model.
Pr ( i | x t , δ k ) = ω i N ( x t | μ i k , Σ i k ) Σ j = 1 M ω i N ( x t | μ j k , Σ j k ) ,
Formula (7) is used to iterate until the convergence condition is satisfied (the convergence domain in this paper is 10−5).
To verify the applicability of the GMM acoustic emission characteristic parameter crack classification method, the GMM acoustic emission characteristic parameter crack classification method through direct shear tests (specimen size: 150 mm × 150 mm × 150 mm) and three-point bending tests (specimen size: 150 mm × 150 mm × 800 mm) on the model material (gypsum) specimens was verified. The acoustic emission threshold value is set to 45 dB, the sampling frequency is set to 1 MHz, and the preamplifier gain is set to 40 dB. The acoustic emission monitoring system is always synchronized in real-time during loading. The test and acoustic emission probe arrangement are shown in Figure 10 and Figure 11, where the adhesive acoustic emission probe is used, and a U-shaped shear box is used for the shear tests.
As shown in Figure 12, the types of fracture points are divided according to JCMS-IIIB5706(2003). As can be seen from Figure 12a, the ellipses of the tensile failure clusters are relatively round, and the points around the center point are evenly dispersed. In contrast, the elliptical estimates of the shear failure clustering have a low probability distribution with a flat bar shape and very light color, indicating that the eigenvectors in the three-point bending test are concentrated around the average of the tensile failure cracks. However, in the direct shear test in Figure 12b, the shear clustering area is no longer a flat strip shape but is elliptical, and the color of the shear area is slightly darker than that of the tensile area, indicating that the high-probability area is clustered in the shear failure area, but the two types of rupture points remain segmented.
The AE signal characteristics of direct shear and three-point bending samples can be divided into two large clusters (Type-I tensile and Type-II shear) and the distribution of data is considered in each GMM eigenvector. The crack classification results of the acoustic emission characteristic parameters based on the GMM are shown in Figure 13.
As can be seen from Figure 13, based on the three-point bending and direct shear test crack classification method for the GMM emission characteristic parameters, the three-point bending test of the rock-like gypsum material in this section obtained K = 21.54, a tensile crack ratio of 92.3%, and a shear-crack ratio of 7.7%. In the direct shear tests, K = 22.33, the tensile crack ratio was 32.7%, and the shear-crack ratio was 67.3%. It is reasonable that the tensile cracks dominate in the three-point bending tests and the shear cracks dominate in the direct shear tests, which is consistent with reality [24,25,26,27]. This finding shows that the acoustic emission characteristic parameter classification method based on the adopted GMM has good applicability in crack classification.

3.4.2. Failure Evolution Analysis of Rockburst Process in Test Model under Different Stress Gradients

The acoustic emission time series parameters of the model rockbursts loaded with four different stress gradients were studied based on the acoustic emission characteristics and the GMM, and the acoustic emission classification K and the proportion of different types of cracks under each gradient are listed in Table 4. The distribution of data points from the RA and AF, typical debris and rockburst craters from the model rockbursts, the macro-morphological characteristics of the lateral cracks, and the micro-morphological characteristics of the area of relevance are shown in Figure 14.
As can be seen from Table 3, Figure 14, the acoustic emission fracture classification K-values are different under the different stress gradient loading conditions. With the increase in the loading stress gradient, the proportion of shear failure increases gradually, and the shear failure corresponds to the higher energy release characteristics, which is in line with the increase in the dynamic characteristics of a rockburst with increasing loading stress gradients.
The analysis results of the acoustic emission event parameters and the fracture characteristics of the model after a rockburst in Figure 12 and Figure 13 indicate that the proportion of each type of failure in a sample of rockbursts is closely related to the gradient stress loading path. Rockburst failure occurred in the model as a combined tensile-shear failure. With the increase in the stress loading gradient, the proportion of the shear failure increases. Tensile failure is manifest as brittle failure under lower stresses, while compressive shear failure causes intense failure under higher stresses. The higher the proportion of shear cracks, the more intense the rockburst ejection phenomenon. Therefore, with the increase in the loading stress gradient, the proportion of shear failure increases gradually, which is the main reason for the enhancement of rockburst intensity during rockburst failure.

4. Conclusions

The macro–micro failure morphologies of typical rockburst debris under four groups of different gradient loads were investigated. Then the acoustic emission parameter method based on a Gaussian model was used to explore the failure characteristics and evolution process of a model rockburst under different stress gradients. The main conclusions can be drawn as follows:
(1) The generation and intensity of rockbursts are related to the loading stress gradient. The larger the stress gradient, the more significant the dynamic phenomenon during the rockburst process.
(2) There are obvious differences in the morphology and arrangement of crystals on the fracture surface of rockburst debris under the different stress loading paths. The brittle fracture of debris can be divided into flake debris dominated by intergranular tensile fracture and massive debris dominated by transgranular shear fracture.
(3) The AE characteristic parameter classification method based on the GMM has good applicability in crack classification. With an increase in the loading stress gradient, the proportion of shear crack increases gradually, which is the main reason for the enhancement of rockburst intensity.

Author Contributions

S.Y.: formal analysis, investigation, visualization; Y.G.: conceptualization, methodology; X.L.: writing—review and editing, supervision, funding acquisition; G.W.: writing—original draft, funding acquisition; L.S.: writing—review and editing, funding acquisition; C.B.: writing—review and editing. All authors have read and agreed to the published version of the manuscript.

Funding

The study was supported the financial supports from the National Natural Science Foundation of China (No. 42002275), the National Natural Science Foundation of Zhejiang Province (No. LQ21D020001), the Collaborative Innovation Center for Prevention and Control of Mountain Geological Hazards of Zhejiang Province (No. PCMGH-2021-03), the Hubei Key Laboratory of Roadway Bridge and Structure Engineering (Wuhan University of Technology) (No. DQJJ202104).

Institutional Review Board Statement

Not applicable.

Informed Consent Statement

Not applicable.

Data Availability Statement

Some or all data, models, or code that support the findings of this study are available from the corresponding author upon reasonable request.

Conflicts of Interest

The authors declare no conflict of interest.

References

  1. Ghorbani, M.; Shahriar, K.; Sharifzadeh, M.; Masoudi, R. A critical review on the developments of rock support systems in high stress ground conditions. Int. J. Rock Mech. Min. 2020, 30, 6–23. [Google Scholar] [CrossRef]
  2. Kim, J.S.; Lee, K.S.; Cho, W.J.; Choi, H.J.; Cho, G.C. A comparative evaluation of stress–strain and acoustic emission methods for quantitative damage assessments of brittle rock. Rock Mech. Rock Eng. 2015, 48, 495–508. [Google Scholar] [CrossRef]
  3. Adoko, A.C.; Gokceoglu, C.; Li, W.; Qing, J.Z. Knowledge-based and data-driven fuzzy modeling for rockburst prediction. Int. J. Rock Mech. Min. 2013, 61, 86–95. [Google Scholar] [CrossRef]
  4. Li, C.C.; Mikula, P.; Simser, B.; Hebblewhite, B.; Joughin, W.; Feng, X.; Xu, N. Discussions on rockburst and dynamic ground support in deep mines. J. Rock Mech. Geotech. 2019, 11, 1110–1118. [Google Scholar] [CrossRef]
  5. Borg, A.; Bjelland, H.; Nj, O. Reflections on Bayesian Network models for road tunnel safety design: A case study from Norway. Tunn. Undergr. Sp. Technol. 2014, 43, 300–314. [Google Scholar] [CrossRef]
  6. Afraei, S.; Shahriar, K.; Madani, S.H. Statistical assessment of rock burst potential and contributions of considered predictor variables in the task. Tunn. Undergr. Sp. Technol. 2018, 72, 250–271. [Google Scholar] [CrossRef]
  7. Yun, X.; Mitri, H.S.; Yang, X.L.; Wang, Y.K. Experimental investigation into biaxial compressive strength of granite. Int. J. Rock Mech. Min. 2010, 47, 334–341. [Google Scholar] [CrossRef]
  8. He, M.; Zhao, F.; Zhang, Y.; Du, S.; Guan, L. Feature evolution of dominant frequency components in acoustic emissions of instantaneous strain-type granitic rockburst simulation tests. Rock Soil Mech. 2015, 36, 1–8. [Google Scholar] [CrossRef]
  9. Akdag, S.; Karakus, M.; Taheri, A.; Nguyen, G.; Manchao, H. Effects of thermal damage on strain burst mechanism for brittle rocks under true-triaxial loading conditions. Rock Mech. Rock Eng. 2018, 56, 1657–1682. [Google Scholar] [CrossRef]
  10. Cheon, D.S.; Jeon, S.; Ryu, C. An experimental study on the brittle failure under true triaxial conditions. Tunn. Undergr. Sp. Technol. 2006, 21, 448–449. [Google Scholar] [CrossRef]
  11. Liu, X.; Xia, Y.; Lin, M.; Benzerzour, M. Experimental study of rockburst under true-triaxial gradient loading conditions. Geomech. Eng. 2019, 18, 481–492. [Google Scholar] [CrossRef]
  12. Liu, X.; Xia, Y.; Lin, M.; Wang, G.; Wang, D. Experimental study on the influence of tangential stress gradient on the energy evolution of strainburst. B. Eng. Geol. Environ. 2021, 80, 4515–4528. [Google Scholar] [CrossRef]
  13. Lin, M.; Zhang, L.; Liu, X.; Xia, Y.; Zhang, D.; Peng, Y. Microscopic analysis of rockburst failure on specimens under gradient stress. Rock Soil Mech. 2020, 41, 2984–2992. [Google Scholar] [CrossRef]
  14. Feng, S.; Gong, F.; Luo, Y.; Li, X.B. Experimental simulation on rockburst process of deep three-dimensional circular cavern. Rock Soil Mech. 2018, 39, 621–634. [Google Scholar] [CrossRef]
  15. Tao, M.; Ma, A.; Cao, W.; Li, X.; Gong, F. Dynamic response of pre-stressed rock with a circular cavity subject to transient loading. Int. J. Rock Mech. Min. 2017, 99, 1–8. [Google Scholar] [CrossRef]
  16. Roohollah, S.F.; Abbas, T. Long-term prediction of rockburst hazard in deep underground openings using three robust data mining techniques. Eng. Comput. 2019, 35, 659–675. [Google Scholar] [CrossRef]
  17. Zhou, Y.; Sun, Z.; Wang, L.; Ding, Y. Meso research on mechanical properties and slab failure mechanism of pre-fractured rock mass under the condition of one side restriction loading. Rock Soil Mech. 2018, 39, 4385–4394. [Google Scholar] [CrossRef]
  18. He, M.; Nie, W.; Han, L.; Ling, L. Microcrack analysis of Sanya grantite fragments from rockburst tests. Min. Sci. Technol. 2010, 20, 238–243. [Google Scholar] [CrossRef]
  19. Li, H.; Huang, R. Method of quantitative determination of joint roughness coefficient. Chin. J. Rock Mech. Eng. 2014, 33, 3489–3497. [Google Scholar] [CrossRef]
  20. Shiotani, T.; Shigeishi, M.; Ohtsu, M. Acoustic emission characteristics of concrete-piles. Constr. Build. Mater. 1999, 13, 73–85. [Google Scholar] [CrossRef]
  21. Yoon, S.J.; Chen, D.; Han, S.W.; Choi, N.S.; Arakawa, K. AE analysis of delamination crack propagation in carbon fiber-reinforced polymer materials. J. Mech. Sci. Technol. 2015, 29, 17–21. [Google Scholar] [CrossRef]
  22. Ichenihi, A.; Li, W.; Gao, Y.; Yao, Y. Feature selection and clustering of damage for pseudo-ductile unidirectional carbon/glass hybrid composite using acoustic emission. Appl. Acoust. 2021, 182, 108184. [Google Scholar] [CrossRef]
  23. Kittel, M.; Hobbie, H.; Dierstein, C.; Lund, H.; Kaiser, M.J. Temporal aggregation of time series to identify typical hourly electricity system states: A systematic assessment of relevant cluster algorithms. Energy 2022, 247, 123458. [Google Scholar] [CrossRef]
  24. Ohno, K.; Ohtsu, M. Crack classification in concrete based on acoustic emission. Constr. Build. Mater. 2010, 24, 2339–2346. [Google Scholar] [CrossRef]
  25. Wang, G.; Song, L.; Liu, X.; Bao, C.Y.; Lin, M.Q.; Liu, G.J. Shear fracture mechanical properties and acoustic emission characteristics of discontinuous jointed granite. Rock Soil Mech. 2022, 43, 1533–1545. [Google Scholar] [CrossRef]
  26. Shiotani, T.; Ohtsu, M.; Ikeda, K. Detection and evaluation of AE waves due to rock deformation. Constr. Build. Mater. 2001, 15, 235–246. [Google Scholar] [CrossRef]
  27. Song, L.; Wang, G.; Wang, X.; Huang, M.; Xu, K.; Han, G.; Liu, G. The influence of joint inclination and opening width on fracture characteristics of granite under triaxial compression. Int. J. Geomech. 2022, 22, 04022031. [Google Scholar] [CrossRef]
Figure 1. Model loading mechanism.
Buildings 12 01927 g001
Figure 2. Failure phenomenon of the model under different stress gradients [12]. (a) m = 0; (b) m = 2; (c) m = 4; (d) m = 6.
Buildings 12 01927 g002
Figure 3. Macroscopic surface morphology of plate and flake debris. (a) Plate debris; (b) Lamellar debris; (c) Flaky debris.
Buildings 12 01927 g003
Figure 4. Macroscopic surface morphology of massive and lenticular debris. (a) Ribbed block debris; (b) Massive debris; (c) Lenticular debris.
Buildings 12 01927 g004
Figure 5. Microscopic surface morphology of lamellar debris. (a) Upper part of the fracture surface; (b) Middle part of the fracture surface; (c) Lower part of the fracture surface.
Buildings 12 01927 g005
Figure 6. Microscopic surface morphology of massive and lenticular debris. (a) Upper part of the fracture surface; (b) Middle part of the fracture surface; (c) Lower part of the fracture surface.
Buildings 12 01927 g006
Figure 7. Point-cloud representation of a micro-cracked surface.
Buildings 12 01927 g007
Figure 8. Microscopic three-dimensional morphology and contour cloud of plate and flake debris fracture surface. (a) Upper part of the fracture surface; (b) Middle part of the fracture surface; (c) Lower part of the fracture surface.
Buildings 12 01927 g008
Figure 9. Microscopic three-dimensional morphology and contour cloud map of massive and lenticular debris fracture surface. (a) Upper part of the fracture surface; (b) Middle part of the fracture surface; (c) Lower part of the fracture surface.
Buildings 12 01927 g009
Figure 10. Direct shear test and acoustic emission probe arrangement. (a) Direct shear test of specimens; (b) Acoustic emission probe arrangement.
Buildings 12 01927 g010
Figure 11. Three-point bending test and three-point bending test acoustic emission probe arrangement. (a) Three-point bending test of specimen; (b) Acoustic emission probe arrangement.
Buildings 12 01927 g011
Figure 12. GMM acoustic emission eigenvector and classification of fracture point types. (a) Three-point bending GMM eigenvector diagram; (b) Direct shear GMM eigenvector diagram.
Buildings 12 01927 g012
Figure 13. GMM emission characteristic parameters three-point bending and direct shear test crack classification. (a) Three-point bending test; (b) Direct shear test.
Buildings 12 01927 g013
Figure 14. Classification of rockburst failure types under different stress gradients. (a) m = 0; (b) m = 2; (c) m = 4; (d) m = 6.
Buildings 12 01927 g014
Table 1. Parameters of the specimen and the index of rockburst trend.
MaterialWater/Gypsum RatioPoisson’s RatioElastic Modulus/GPaσc/MPaWet
Gypsum0.70.251.2689.210.15
Table 2. Failure phenomena of rockburst under different gradient stress loading.
Stress GradientRockburst Failure Phenomenon DescriptionDebris Morphology and Maximum Throw Distance
m = 0Before the failure of the model, small particles were catapulted, followed by a large noise, and huge plate-like debris on the unloading surface was released, stripped and broken, and then fell off. Thick plate-like and sheet-like debris distributed within 0.5 m of the unloading surface.
m = 2Two obvious fine particles ejected from the top of the model, followed by flake debris peeling and popping out. The peeling phenomenon was serious, and a small amount of ejection occurred. The debris was scaly and exfoliated.Flake and block debris distributed within 0.7 m of the unloading surface.
m = 4A large amount of debris on the top of the model was continuously catapulted, and finally a large flake bending and ejection failure occurred on the upper part, accompanied by violent sound, and a large amount of ejection or dynamic falling.Bulk and lenticular debris, debris up to 1.5 m thrown distance.
m = 6In the absence of obvious precursor failure, an “explosive” rockburst occurred in the middle and lower part of the model, and a large volume of wedge-shaped debris flew out at a high speed, forming a cave-shaped rockburst pit.Wedge-shaped, block-shaped debris with a maximum throw distance of 2.0 m.
Table 3. Roughness JCR of micro-fracture surface with different debris morphologies.
Debris MorphologyMeasurement AreaJRC (x-Direction)JRC (y-Direction)
Plate and flake debris Micro-fracture surfacea19.319.7
b19.519.2
c19.519.8
Massive and lenticular debris micro-fracture surfacea16.517.1
b16.817.3
c17.516.3
Table 4. Classification of rockburst failure types under different stress gradients.
Loading Stress Gradient CoefficientFracture Classification K-ValuesProportion of Tensile FailuresProportion of Shear Failures
m = 015.3882.26%17.74%
m = 29.0980.13%19.87%
m = 48.4659.25%40.75%
m = 611.0341.6%58.4%
Publisher’s Note: MDPI stays neutral with regard to jurisdictional claims in published maps and institutional affiliations.

