Article

Optimization of Graphene Oxide Incorporated in Fly Ash-Based Self-Compacting Concrete

1
Department of Civil Engineering, KLE Technological University’s Dr. M.S. Sheshgiri College of Engineering & Technology, Udyambag, Belagavi 590008, Karnataka, India
2
Koneru Lakshmaiah Educational Foundation, Vaddeswaram, Guntur 522502, Andhra Pradesh, India
3
Engineering Management Department, College of Engineering, Prince Sultan University, Riyadh 11586, Saudi Arabia
4
College of Engineering and Technology, American University of the Middle East, Egaila 54200, Kuwait
5
Department of Physics, Umm Al-Qura University, Makkah 24231, Saudi Arabia
6
Structural Engineering and Construction Management Department, Future University in Egypt, New Cairo 11835, Egypt
*
Author to whom correspondence should be addressed.
Buildings 2022, 12(11), 2002; https://doi.org/10.3390/buildings12112002
Submission received: 29 September 2022 / Revised: 4 November 2022 / Accepted: 11 November 2022 / Published: 17 November 2022

Abstract

:
Self-compacting concrete (SCC) was developed to overcome the challenges of concrete placement in dense or congested reinforcement structure, where the concrete can flow under its own weight to fill the densely reinforced structure. However, production of SCC mostly involves the use of high cement to achieve the desired strength. Therefore, to reduce the needed amount of cement, pozzolanic materials such as fly ash can be used to partially replace cement. However, fly ash has been reported to decrease the strengths of concrete especially at early ages. In this study, a self-compacting concrete (SCC) was developed with fly ash as a basic replacement material considering the efficiency of fly ash and incorporating graphene oxide (GO) as a cement additive to counteract the negative effect of fly ash. Response surface methodology (RSM) was utilized for designing the experiments, investigating the effects of fly ash and GO on SCC properties, and developing mathematical models for predicting mechanical properties of SCC. The ranges of fly ash and graphene oxide were 16.67 to 35% and zero to 0.05%, respectively. Statistical analysis was performed by using Design Expert software (version 11.0, Stat Ease Inc., Minneapolis, MS, USA). The results showed that fly ash had a positive effect while GO had a negative effect on the workability of SCC. The incorporation of fly ash alone decreased the compressive strength (CS), splitting tensile strength (STS) and flexural strength (FS), and additionally, increased the porosity of SCC. The addition of GO to fly ash-based SCC reduced its porosity and enhanced its mechanical strengths which was more pronounced at early ages. The developed models for predicting the mechanical strengths of fly ash-based SCC containing GO have a very high degree of correlation. Therefore, the models can predicts the strengths of SCC using fly ash and GO as the variables with a high level of accuracy. The findings show that based on the EFNARC guidelines, up to 35% of fly ash can be used to replace cement in SCC to achieve a mix with satisfactory flowability and deformability properties

1. Introduction

The fast development of urbanisation and tight deadlines for construction projects motivated concrete researcher to develop a self-compacting concrete (SCC) which has the advantage to flow, thereby reducing many challenges on site such as congested reinforcement, and placement to high structures and sub aquatics [1]. SCC was first developed in Japan to attain good quality concrete and durable structures without depending on consolidation equipment and skilled laborers. When SCC is used, there is a reduction in workmanship required, with no external vibration needed [2,3,4]. In other words, no external vibration is required. However, the main challenge in the production of SCC is achieving the required workability or flowability. Therefore, to improve the workability and strength of SCC, a special type of superplasticizer, a polycarboxylate ether base, is normally used. This type of superplasticizer provides optimum performance in terms of achieving the self-compacting properties [5,6]. Despite the book’s attempts on self-compacting concrete, it lacks accuracy on mix design of SCC. A close look at the literature on mix design of SCC reveals several gaps and shortcomings. This question has previously never been addressed because mix design of SCC is purely based on the experience and knowledge of past projects besides site conditions. It is necessary to point out those specific ingredients of SCC. According to EFNARC regulations, fine and coarse aggregate, powder content, cement, silica fume, and fly ash were used as the constituent materials for SCC production [7]. The other names for SCC in the literatures are super workable concrete, non-vibrating concrete, highly flowable concrete, self-leveling concrete, etc. [8]. The intention behind the development of SCC was the concern on the compaction and homogeneity of cast in place within densely reinforced structures and improvement of durability quality of concrete. For the construction of two anchorages of Akashi Straits Bridge, Japan in 1988, SCC was introduced practically in the construction field [9]. To produce the proper self-compacting concrete, it should satisfy the following two points. Firstly, SCC should achieve the high aggregate resistance by diminishing the water powder ratio; limitations of coarse aggregates up to 28% and restricted size up to 12.5 mm, and incorporation of mineral admixtures such as fly ash and silica fume were considered. To attain the high deformability, use of PCE based super plasticizers and viscosity modifying agents (VMA) were added [8,9]. Previous research can only be considered a first step towards a more profound understanding of SCC. Previous studies reveal that basalt fibers and nano particles such as (silica, alumina) were added for strength development, whereas nano particles were incorporated for good bonding between fibers and the concrete matrix [10]. A connection can be made between the viscosity of SCC with the interfacial bond of steel and concrete. The view presented in this paper is that homogeneity of pores could be attained by optimal viscosity which imparts the best bonding between steel and concrete [3] Even curing temperature effects the robustness of concrete besides the age of concrete [4]. QSI is most promising method to find out the quantity of pores in SCC. Furthermore, pores influence the surface finish of SCC [11] A new approach is therefore needed for filling the pores in SCC. Over time, an extensive body of literature has developed on fly ash-based SCC using marble cutting slurry waste (MCSW) as a cement’s partial substitutebesides fly ash and silica fume due to the temperament of MCSW containing the calcite and dolomite minerals which makes a favorable condition for the configuration of calcium hydroxide [12] The substitution of ultra-fine natural Steatite powder with cement decreases the workability of SCC and furthermore, gradually increases the strength [13]. The substitution of fly ash content with cement content up to 30% is favorable with slight defects. One of the possible solutions to this problem is using graphene oxide (GO) as additive.
Before introducing the GO into the construction industry, it was used in other engineering and medical fields such as in electronics as bio sensors, in the bio medical field to cure cancer by use in the drug delivery system, in the coating industry, and to improve the shell life by packing the medicines with GOcoated films. It can be used for hydrogen storage applications [14,15]. The utilization of nanomaterials such as carbon nano tubes, GO, and nano silica to cement based materials is one of the emerging technologies [16]. Graphene materials can enhance some properties of cement composite. The main advantage of adding graphene materials to cement composite is improvement in strength and then producing a sustainable and environmentally friendly concrete. Graphene has also found to enhance the bending strength and resistance of cement composite [16,17]. Graphene materials were also found to densify the microstructure of cement composites and reduce porosity [18,19].
Apart from the applications of other industries, GO has a great impact in construction technology. Recently, GO usage came to existence as it contains some wonderful properties when reacted with cement. Configuration of GO has its effect on the mechanical properties of concrete because densification occurs with the minuscule size of GO [20]. Incorporation of GO in concrete could result a change in morphology and microstructure of hydrated product [5]. GO acts as protection for steel in concrete against corrosion in the marine environment [6]. GO makes a durable product with more dense nature as voids are filled [21]. The incorporation of GO could lead to the formation of hydrated product in the shape of flower-type crystals, whereas normal concrete produces the bar type crystals [22]. Ma [23] found that by incorporating the GO at different dosages in cement at 0.3% water/binder ratio, there was a gradual increase in mechanical properties of up to 0.03% of GO. The fineness of GO material being dispersed with cement produces the hydrated product in the form of flower-type crystals. Horszczaruk [24] studied the incorporation of GO at 3% into the cement content. It was also found that the morphology of GO cementitious composites does not change compared to normal traditional cement composite. This is due to the form of GO content influencing the internal morphology, whereas, it has given increasing results in hardened properties. Mohammed [25] reported on the incorporation of GO into the cement as nano additive under elevated temperatures up to 800 °C, which increased the gel porosity and aids the concrete in the prevention of a spalling effect and deformations caused due to elevated temperature conditions. Babak [26] stated that an increase in tensile strength into the GO-incorporated cement matrix due to the consumption of less water for mixing as GO surface area is greater. Chuah [27] reported that the strain capacity of GO-incorporated cement composites delays the formation of micro cracks. Lu [28] studied the Bond behavior between the PVA fibre and GO-incorporated cementitious matrix. It was been found that GO strengthens the bond between the PVA fibre and cement composites.
Though the fly ash gives good workability, it delays the early strength of concrete [29]. To attain the workability, not only fly ash but superplasticizer is added. To balance the strength and workability factors, nanomaterials were added. This research constitutes a relatively new area which has emerged from nanomaterials and technology in SCC: nanomaterial was obtained as the GO, where flower-type crystals were formed. As a result, the concrete becomes densified in the pore volume which increases the strength in SCC. Based on the literature survey, it has been proven that 0.03% incorporation of GO and 35% of fly ash replacement to cement is recommendable to achieve the best results in SCC. From the literature survey, it has been proven that Design Expert software helps to find out the experimental runs in response surface methodology [17,30,31]. Response surface methodology gives the correlation between the variable factors and responses. It can also easily provide the analysis for variance for complex conditions [32].
Graphene based materials such as nanomaterials in cementitious composites including concrete and mortar arestill at the elementary stage, even though graphene materials such as GO have been reported to enhance the properties of concrete and mortar. Additionally, most of the available studies have focused on the use of GO in conventional concrete and mortar, thus there are few studies on utilizing GO in other types of special concretes such as SCC, high performance concrete, roller compacted concrete, self-healing concrete, and foam concrete. Furthermore, the use of fly ash as pozzolanic material has been reported to decrease the mechanical strengths and durability performance of concrete, especially at early ages. That is why fly ash is normally used together with other highly reactive materials such as silica fume and nano silica to instigate its pozzolanic reactivity of fly ash and improve the properties of the fly ash concrete, especially at early ages. With GO being a highly reactive carbon-based nanomaterial, it is expected to enhance the mechanical properties of concrete containing fly ash through instigating the pozzolanic reaction of the fly ash and filling the pores in the concrete due to its finer sizes. However, there are limited studies that have utilized GO to enhance the SCC’s mechanical properties made with fly as as substitute to cement, Therefore GO was used to improve the fly ash pozzolanic reaction in order to to improve its strengthsin SCC, especially at early ages in this study. Moreover, this study involves the use of two different materials, and to optimise the number of experiments needed for testing, response surface methodology (RSM) was employed to design the experimental mix and develop mathematical model equations for prediciting the mechanical strengths of the SCC. This will contribute to the existing knowledge scanty literature are available that have utilized RSM to develop model equations for predicting the mechanical properties of SCC under high temperatures using fly ash and GO as the input variables. Therefore, in this study the effect of fly ash as a partial replacement to cement and GO as the additive by weight of cement on the fresh and hardened properties of fly ash-based SCC was investigated using RSM. The effect of high temperature on the mechanical strengths of fly ash-based SCC containing GO as the additive was also investigated.

2. Materials and Methods

2.1. Materials

Through this research, a Type I cement (OPC 53) having a specific gravity of 3.15 g/cm3 was used. The property of the cement is presented in Table 1. For SCC, it requires a greater amount of paste content, therefore some part of the cement was constantly replaced with silica fume, fly ash, and powder content. The GO used was produced by modified hummer’s method; it was employed as an additive by weight of binder. The GO was an oxidized form of graphene, laced with oxygen-containing groups. It was electrically insulating because of a disruptive SP2 bonding network but it can be converted by conducting via restoring the community. The property of the GO is presented in Table 2. Class F fly ash was used as the supplementary cementitious material. The shape of the fly ash was spherical in shape which has a high surface area that can instantly react with calcium hydroxide. The fly ash characteristics are also shown in Table 1. Silica fume used in this research was obtained from the ferro silicon industry. The silica fume was added at a fixed proportion (4% as partial replacement to cement) in all the SCC mixes to achieve the desired strength and flowability. The properties of the silica fume are also given in Table 1. Manufactured sand from limestone was used as fine aggregate. The M-sand used was in very fine sizes, i.e., the particles passing 150 µm sieve to meet the requirement for SCC for filler materials to achieve the desired or possible flowability. The specific gravity and fineness modulus of the M-sand were 2.83 and 2.82, respectively. The M-sand has a powdered content of 8%. Coarse aggregate with a size of 12.5 mm aggregates was used, as smaller aggregate size has a major impact on flow ability and large aggregate sizes causes segregation. The coarse aggregate was obtained from crushed granite and has a specific gravity of 2.66. To attain the high strength and higher workability of fresh SCC, a commercially accessible poly carboxylic-based superplasticizer was used. To maintain the required flowability of SCC, viscosity modifying agent (VMA) was used; 1–2% of SP is recommended.

2.2. Mix Proportioning

Several trails were conducted in the laboratory to find out the basic mix proportion of the fly ash-based SCC. After a series of trials, a mix proportion presented in Table 3 was obtained. This mix was used as the control or conventional fly ash-based SCC mix. The mix proportioning was designed using RSM from Design Expert software version 11. The central composite design method was selected for proportioning the mixes and analyzing the results. The variables used were fly ash as the partial replacement to cement, and graphene oxide (GO) as the additive by binder weight. Table 4 provides the exact limits of variables that are used in the experimental work.

2.3. Mix Proportioning and Construction of RSM Model

RSM was employed to analyze the factors contributing to the change in responses. RSM is used to analyze and examine the effect of one or more variables on the response, and to produce model equations for predicting the responses using input variables. RSM also designs experiments and analyzes the results producing statistical responses. The RSM is also used to conduct multi-objective optimization [17,33]. In the study, Design Expert_10 software was utilized for RSM analysis. For the scientific models between the autonomous factors, responses may either show a linear or higher-degree polynomials relationship. A reasonable model was chosen with the goal that the response surface can be depicted all around. Thirteen (13) experimental runs were obtained from the RSM using various combinations of the two variables (fly ash and GO). Design Expert software (version 11.0) was utilized to perform our statistical analysis was performed by using. Reliability was calculated using response surface methodology. This yields increasingly an good relationship among the factors and responses. Overall, our method was the one that obtained the most robust results. The developed experimental mixes are represented in Table 5. The mixes were then prepared in the laboratory and tested for the various properties under consideration. As shown in Table 5, the mixes were names M1, M2, M3 … M13, where each of the mixes has different combinations of the variables. For instance, mix M7 contains 16.67% of fly ash, 4% of silica fume, and 8% of powdered content. The major component for each mix is presented in Table 6. Mixes M2, M8, M10, M11, and M12 have the same proportions of fly ash and GO (repetitive mixes), as they are used to measure the lack of fit comparative to the pure errors in the model’s analysis of variance [19,31]

2.4. Sample Preparations and Casting

To avoid complications regarding the workability of the SCC mix, the ingredients are subjected to drying before adding them in the mix. To attain the proper dispersion of GO, the GO was firstly mixed with the superplasticizers (PCE and VMA) and calculated amount of water. The SCC was mixed in a 100 L capacity pan-type mixer, continuously for about 5 to 6 min to achieve self-compacting properties. After mixing, SCC’s fresh characteristics were determined using slump flow, the V-funnel test, and the L-Box test as displayed in Figure 1. The specimens are casted in steel molds of robust construction, generally 150 mm cubes for testing the compressive strength, 100 × 100 × 500 mm prisms for testing the flexural strength, and cylinders of 150 mm diameter and 300 mm height for testing the tensile strength. Steel molds were clamped tightly to avoid the leakage of slurry concrete. A small amount of grease was applied to the inside surface of steel molds before placing the concrete to avoid the uneven setting of concrete with molds. After 24 h, the specimens were taken out ofthe molds and inserted in the curing tank for 28 days at the room temperature. For each test, three replicate samples were prepared and tested after 7- and 28-days curing. The cubical specimens after curing were placed in the oven for 4 h at temperatures of 100 °C, 150 °C and 200 °C to estimate the CS at elevated temperatures. After heating the specimens, they were kept until after they cooled and then tested for CS.

2.5. Test Methods

The compressive strength test was perfomed according to the standard procedure outlined in IS 516 [34]. Cube samples of 150 mm sizes were produced and cured in water for 7 and 28 days prior to testing. The CS test was carried out using a 2000 kN capacity universal testing machine (UTM). For every mix, three replicated samples were tested and their average value were reported. The splitting tensile strength test was done in reference with IS 5816 specifications [35] using cylinders of 150 mm diameter and 300 mm height. The test was carried out using a 2000 kN capacity UTM. Each of the samples was cured for a 7- and 28-day period prior to testing. Triplicate samples were prepared and tested for each mix and each curing period, and the average result was recorded. The flexural strength (FS) test was performed using 100 × 100 × 500 mm prisms in accordance with the guidelines outlined in IS 516 [36] using beam with third point loading. Similar to previous tests, three samples were tested and the mean results were reported. For the elevated temperature test, cubes of 150 mm were produced, and then cured for 28 days in water. After 28 days, the samples were kept to dry completely and then weighed before placing them into an electric furnace for heating. The samples were heated at temperatures of 100 °C, 150 °C, and 200 °C for 2 h. After heating, the samples were allowed to cool in the furnace and then tested for CS in accordance with IS 516 specifications

3. Results and Discussions

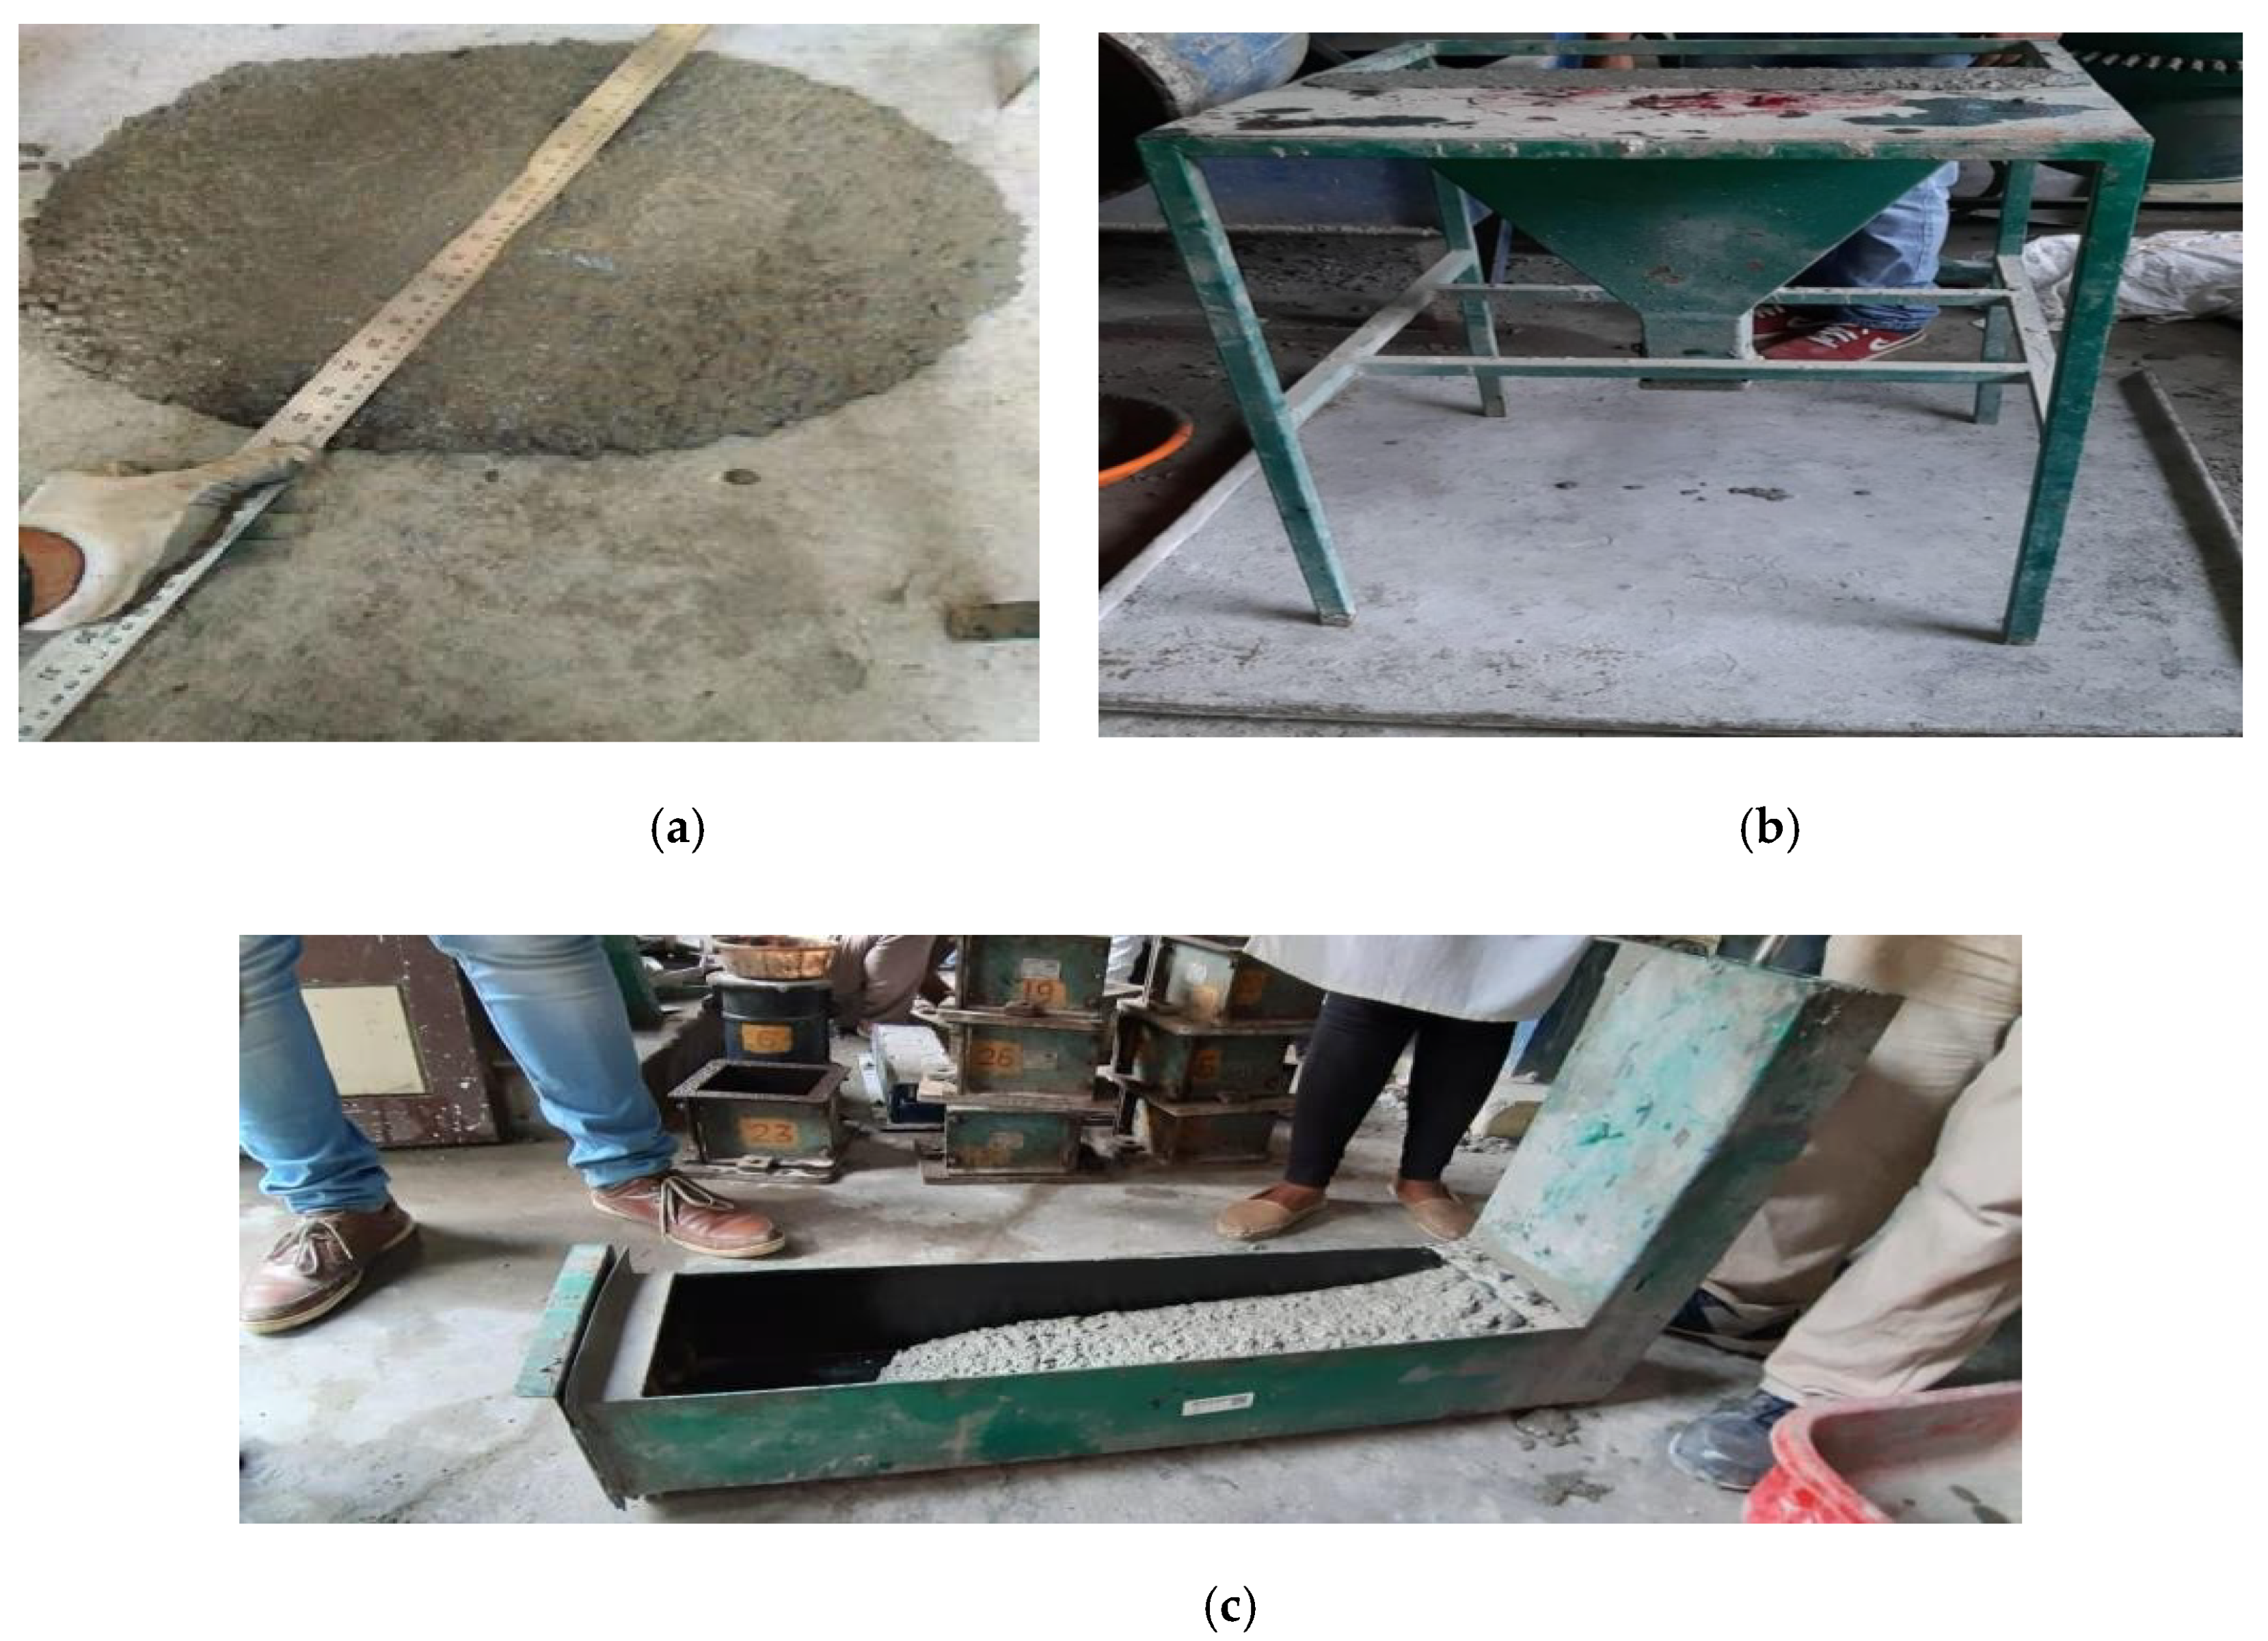
3.1. Fresh Properties of Self-Compacting Concrete

Fly ash-based fresh self-compacting concrete (FSCC) mixes properties are represented in Table 7. Each mix performed in this experiment followed the SCC requirements as per EFNARC guidelines [37]. The slump values of the above mixes are in range of 650–800 mm which confines to SCC specifications. The time used for formation of 500 mm diameter slump is recorded. The noted time (T500) is in the range of 2–5 s. The V-funnel test was performed to find the flow time of SCC. It confines to be in range of 6–12 s, the ratio for L box (H1/H2) is in the range from 0.8 to 1.0. Table 7 shows the better results were obtained at M9 combination. The dispersion of graphene oxide is good with the use of superplasticizer and silica fume where VMA helps to maintain the viscosity of the concrete [38]. It has been reported that the increase in graphene oxide content could have more surface area that leads to the consumption of more water which affects the workability of concrete [39]. Even at high graphene oxide content of SCC, improvement in workable properties was examined with usage of the viscosity modifying agent [38].

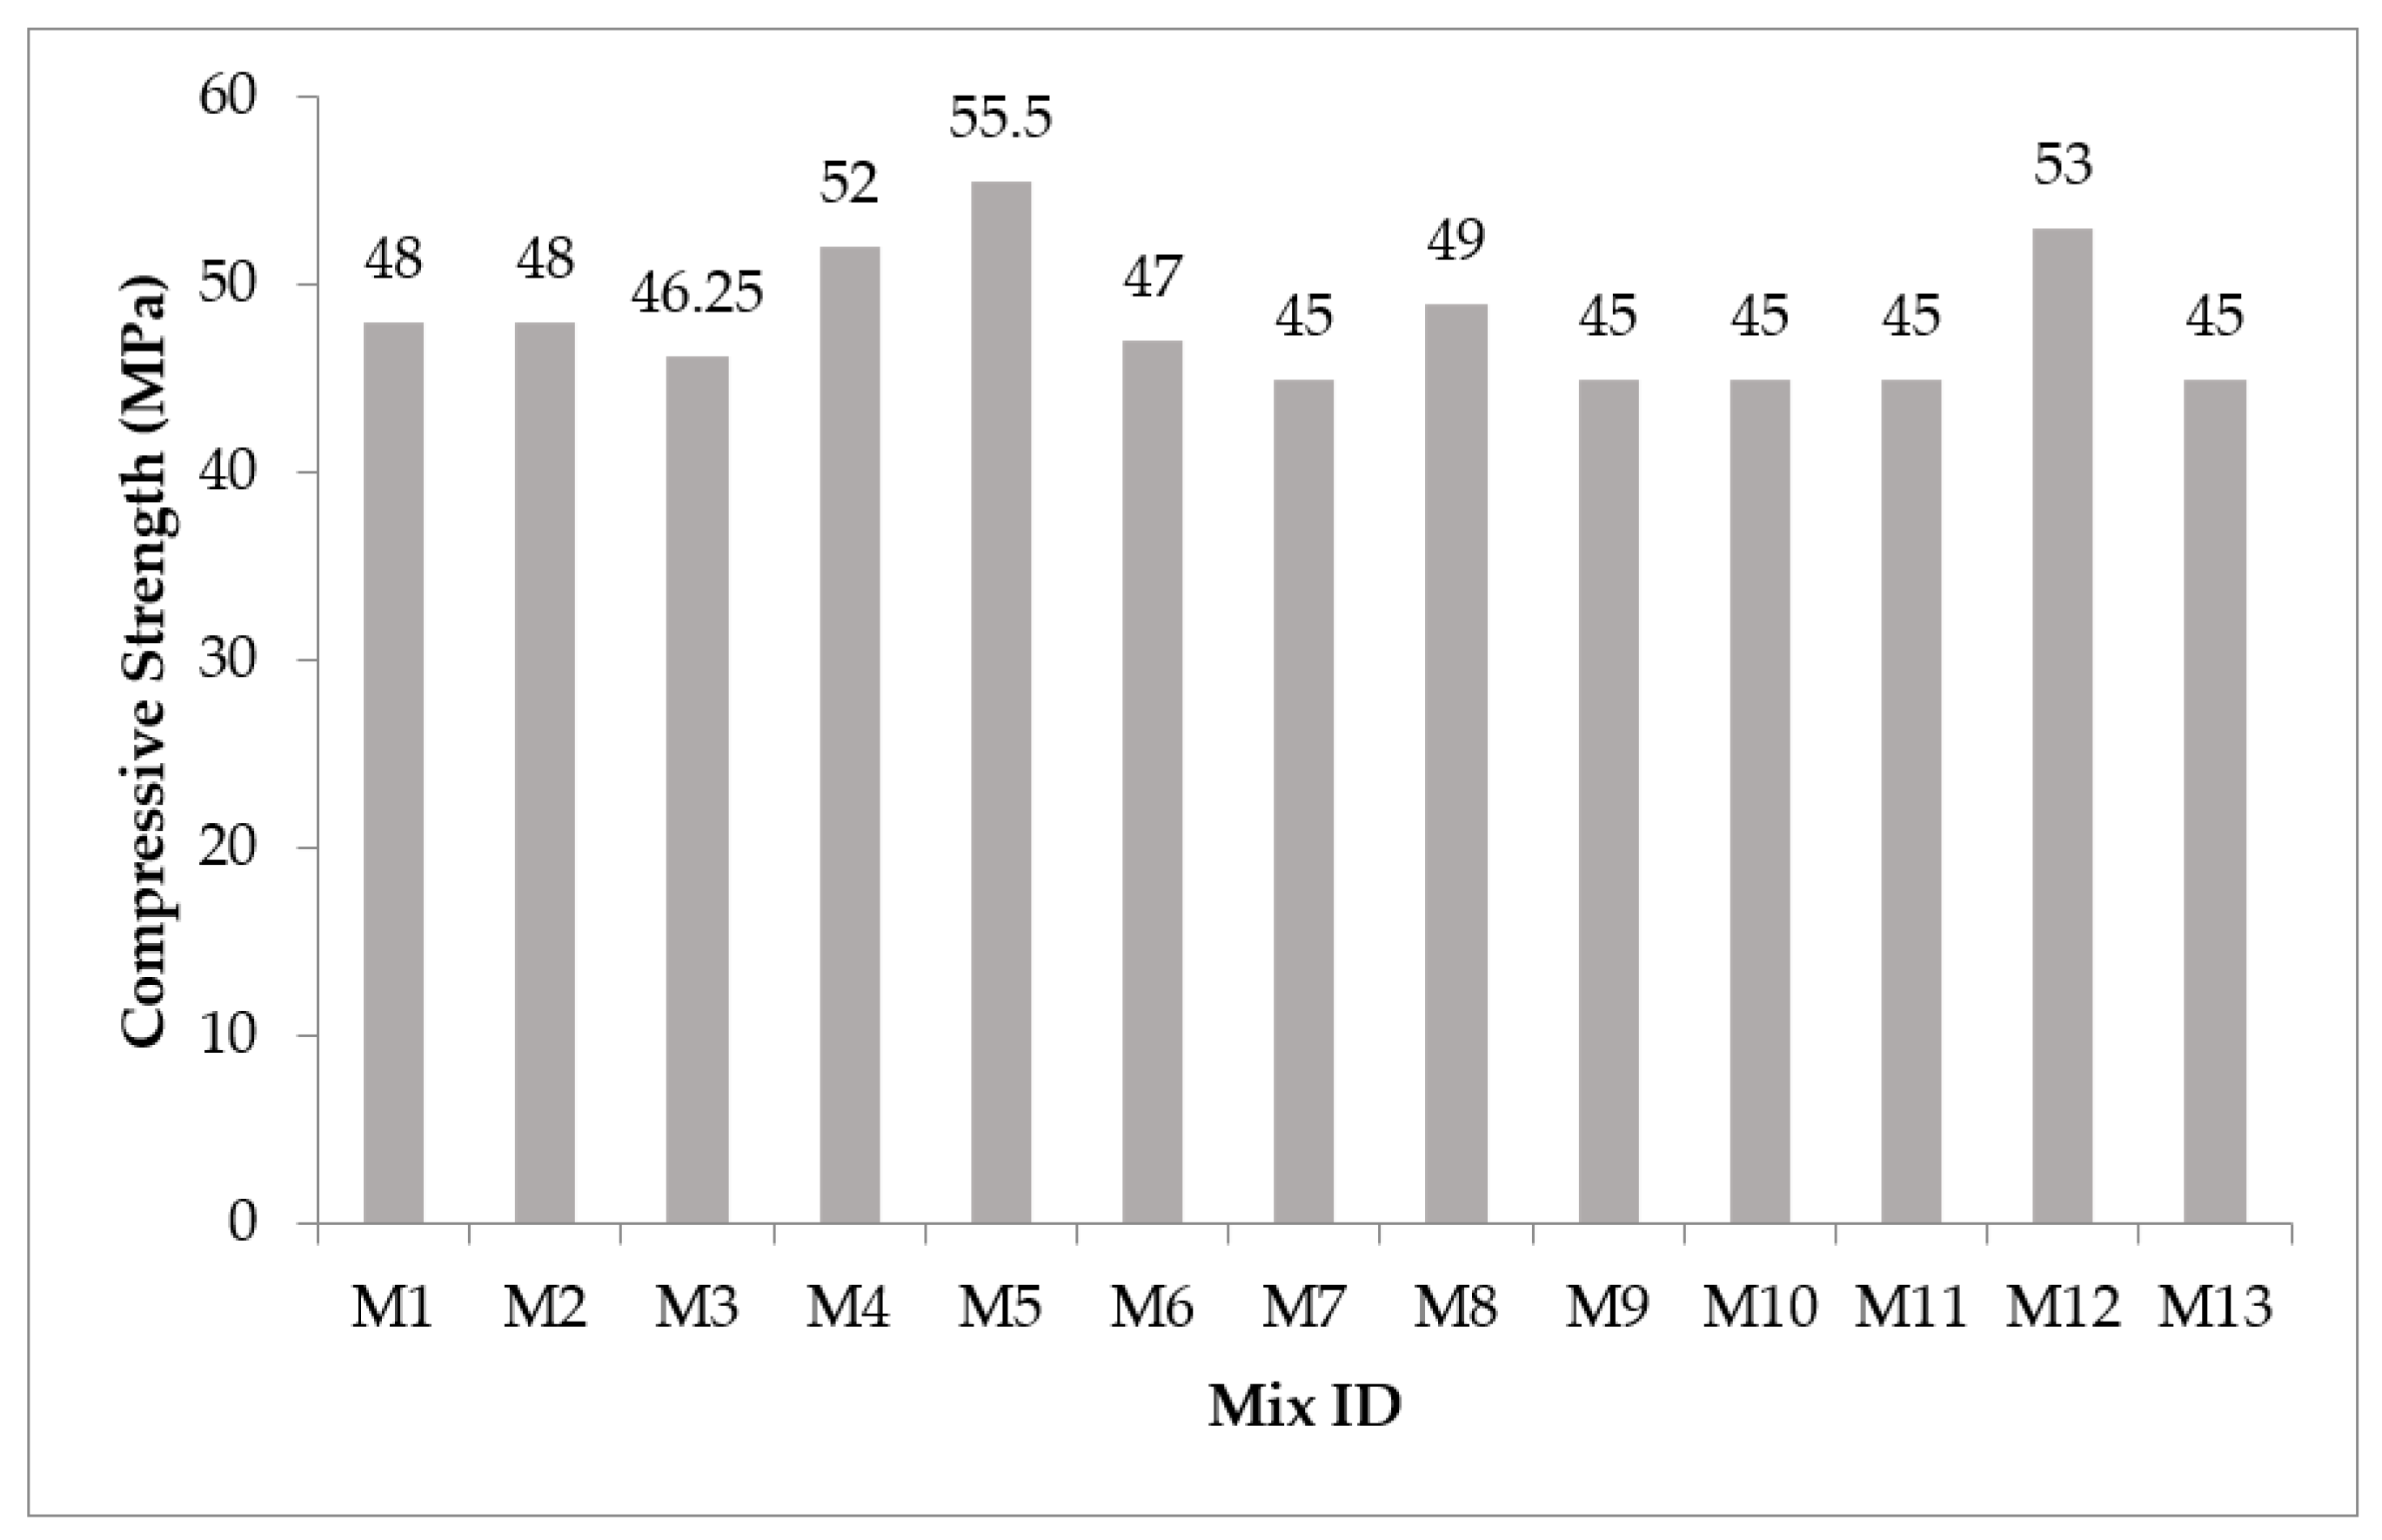
3.2. Compressive Strength

The compressive strength (CS) results are presented in Figure 2. At 28 days, the CS of the tested specimens ranges from 45 to 55 MPa depending on the fly ash and graphene oxide combination. The CS of the tested specimens ranged from 41.25 to 50.22 MPa, 33.44 to 48.889 MPa, and 36.44 to 55.11 MPa at 100 °C, 150 °C, and 200 °C temperatures respectively at 28 days. The CS could be optimum at the elevated temperatures by considering the maximum fly ash content with a gradual increase in graphene oxide percent. This is due to the pozzolanic activity accelerating at high temperatures and graphene oxide reducing the porosity caused due to the SCC mix; consequently, the strength also improves. So, by the incorporation of GO to SCC, the CS increases because it initiates the hydration fast and helps in the formation of flower type of crystals that densifies the SCC. Along with the addition of superplasticizer, it is easy to obtain the balance between CS and workability of SCC. Even at 7 days, the CS was evaluated, and the results ranged from 25.778 to 46.9 MPa. Initially, both the factors influenced a linear decrease in the strength values [39]. Better results were obtained at the experimental combination of 12.837% fly ash and 0.064% GO combination at 28 days of curing period. From Figure 3, we can observe an improvement inthe CS when the graphene oxide content increased by up to 0.03% and had a stable behavior after the reach of optimum level. The increase can be ascribed to the electronegativity of the GO, thereby acting as a medium for attracting electropositive ions like Ca2+, Na+, and K+. These cations will react with S, Si, and Al to form excess hydration products such as calcium silicate hydrate, calcium aluminate silicate hydrates, and ettringites which densify the concrete microstructure and enhance its strength. It has been observed that at maximum fly ash content, gradual increase in graphene oxide could decrease the strength at normal room temperature.However, the strength increased at the elevated temperatures, as shown in Figure 3, which might be attributed to the increase in the Vander Waals forces between the gels with rise in tempeature. RSM was utilized to develop model equation for predicting the 28-day CS of the concrete using fly ash and GO as the variables. The developed model is shown as Equation (1).
F S T = 4.8264 0.0563 × A 40.138 × B + 0.371 × A × B + 0.000071 × A 2 + 220.762   ×   B 2
where FC represents the 28-day CS in MPa, A and B represent the amount of fly ash and graphene oxide, respectively, in percentage (%).

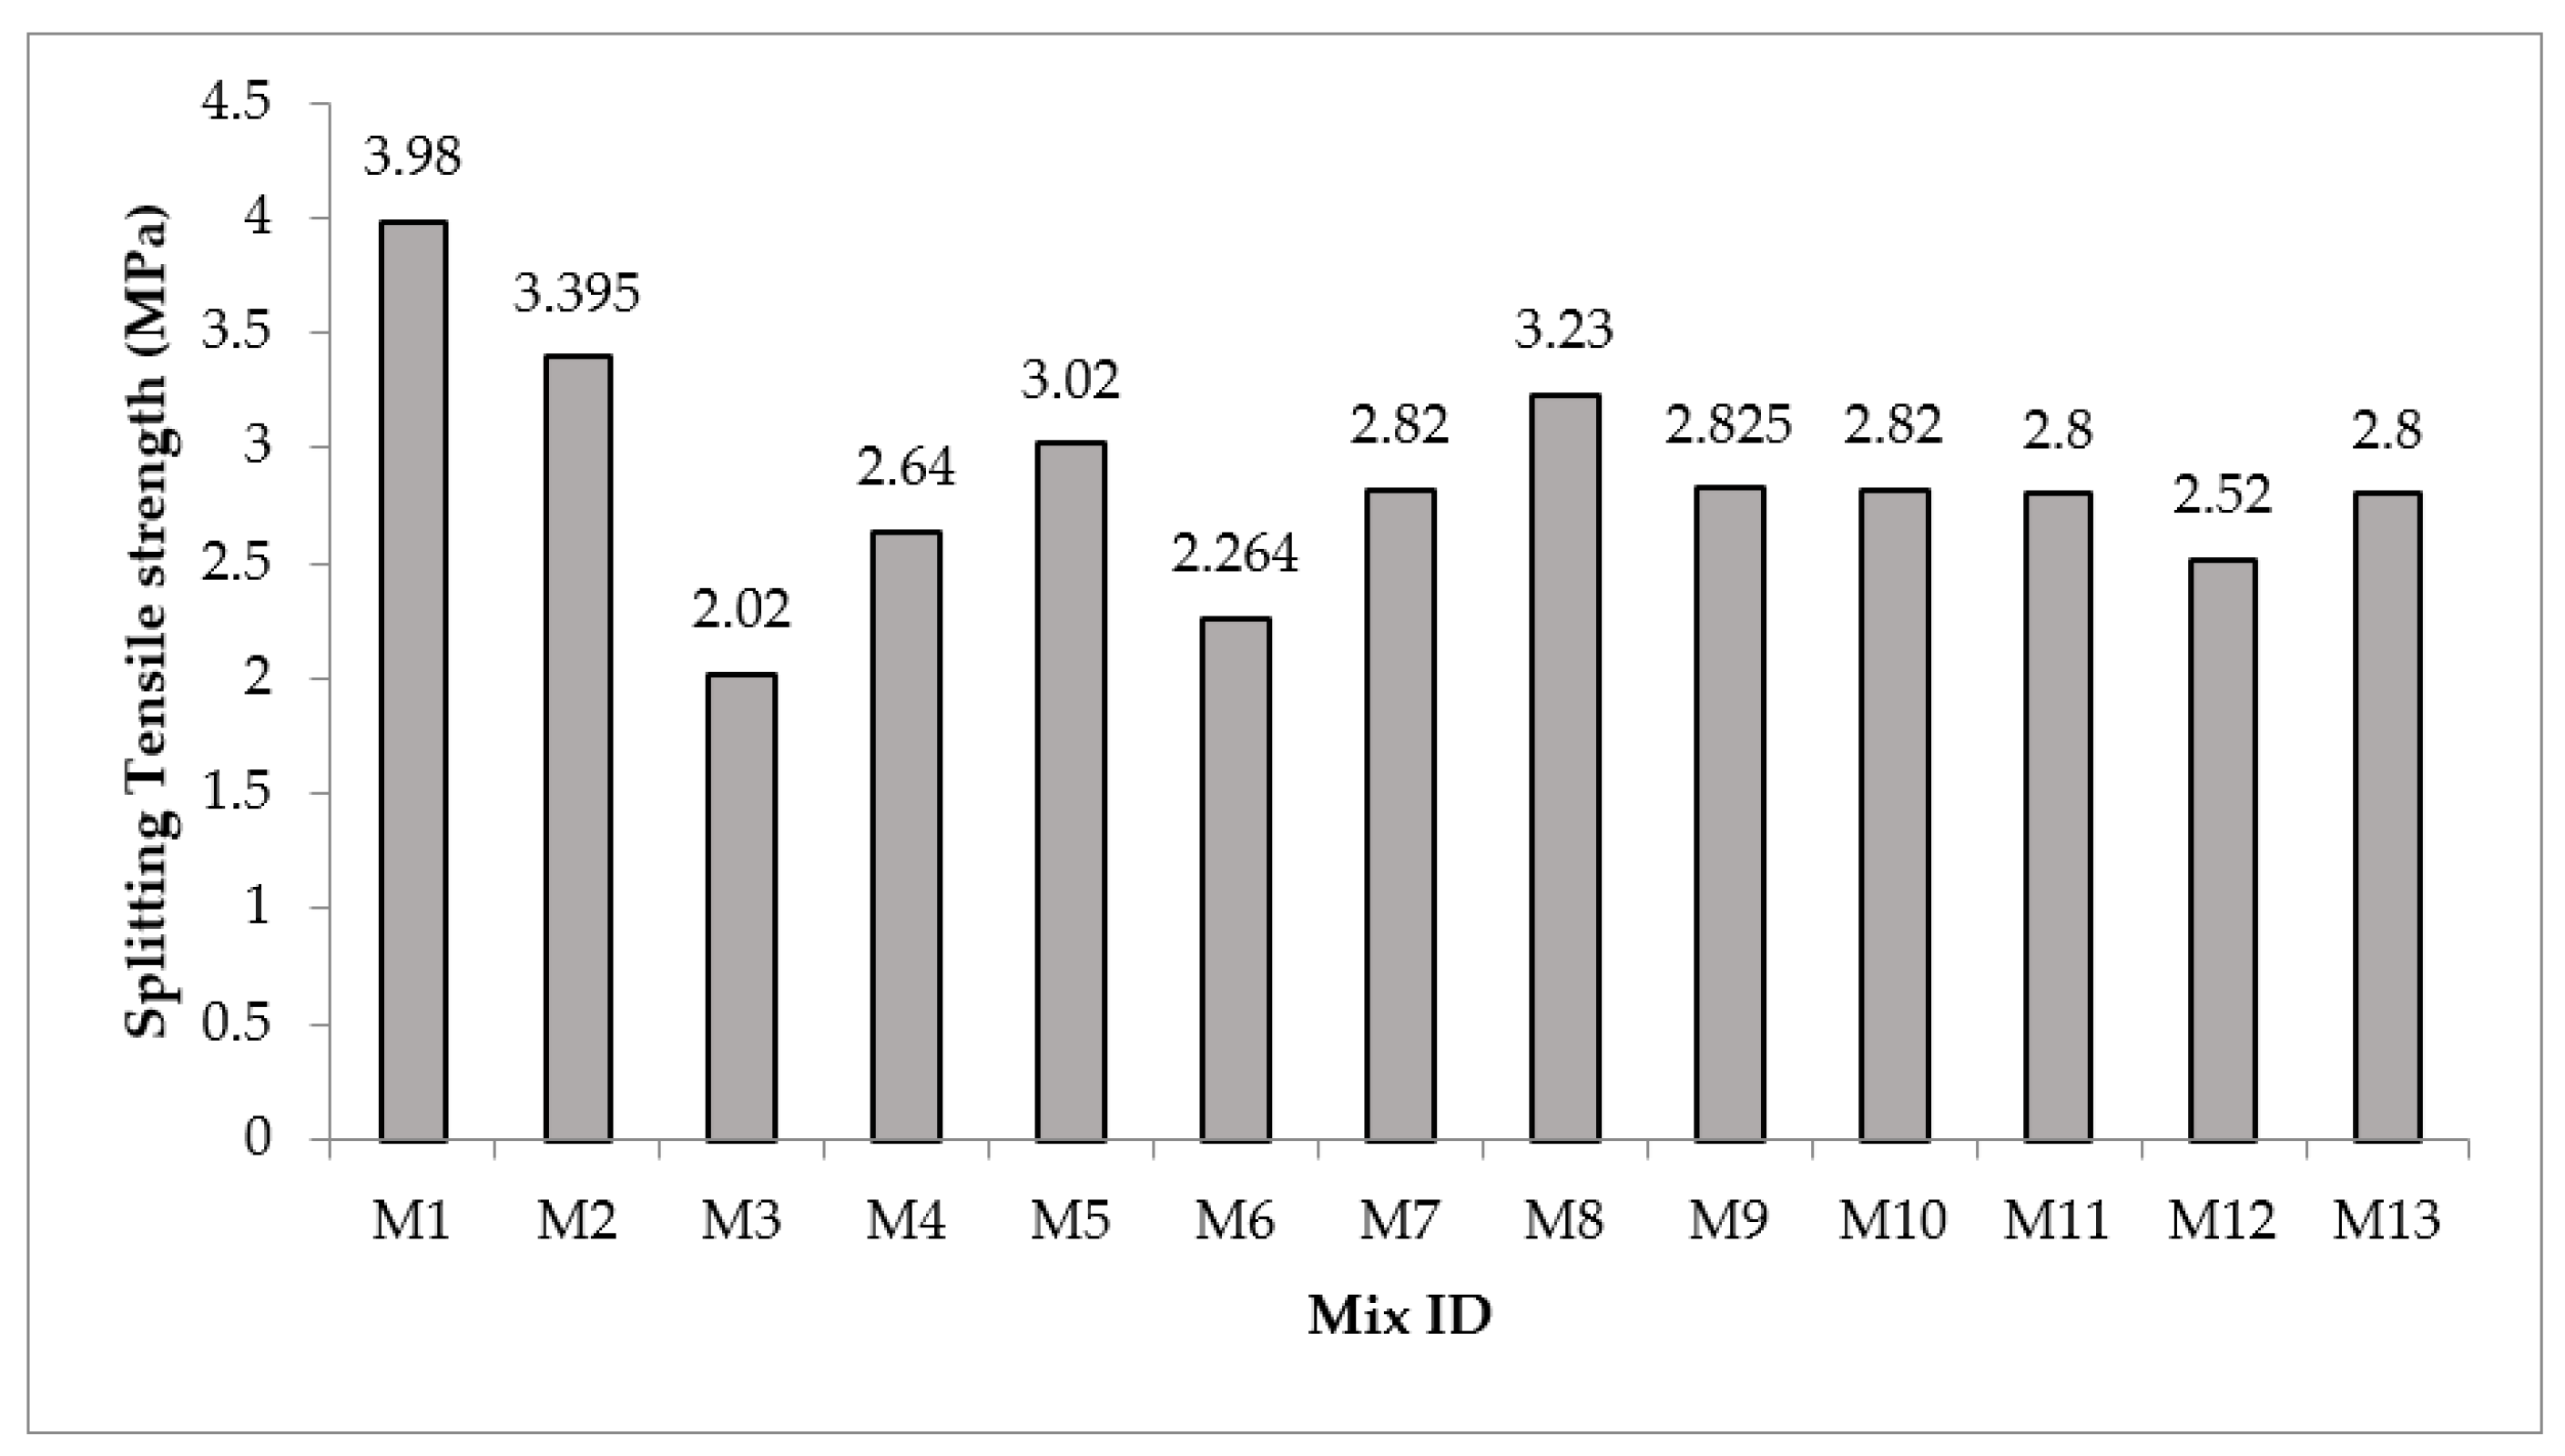
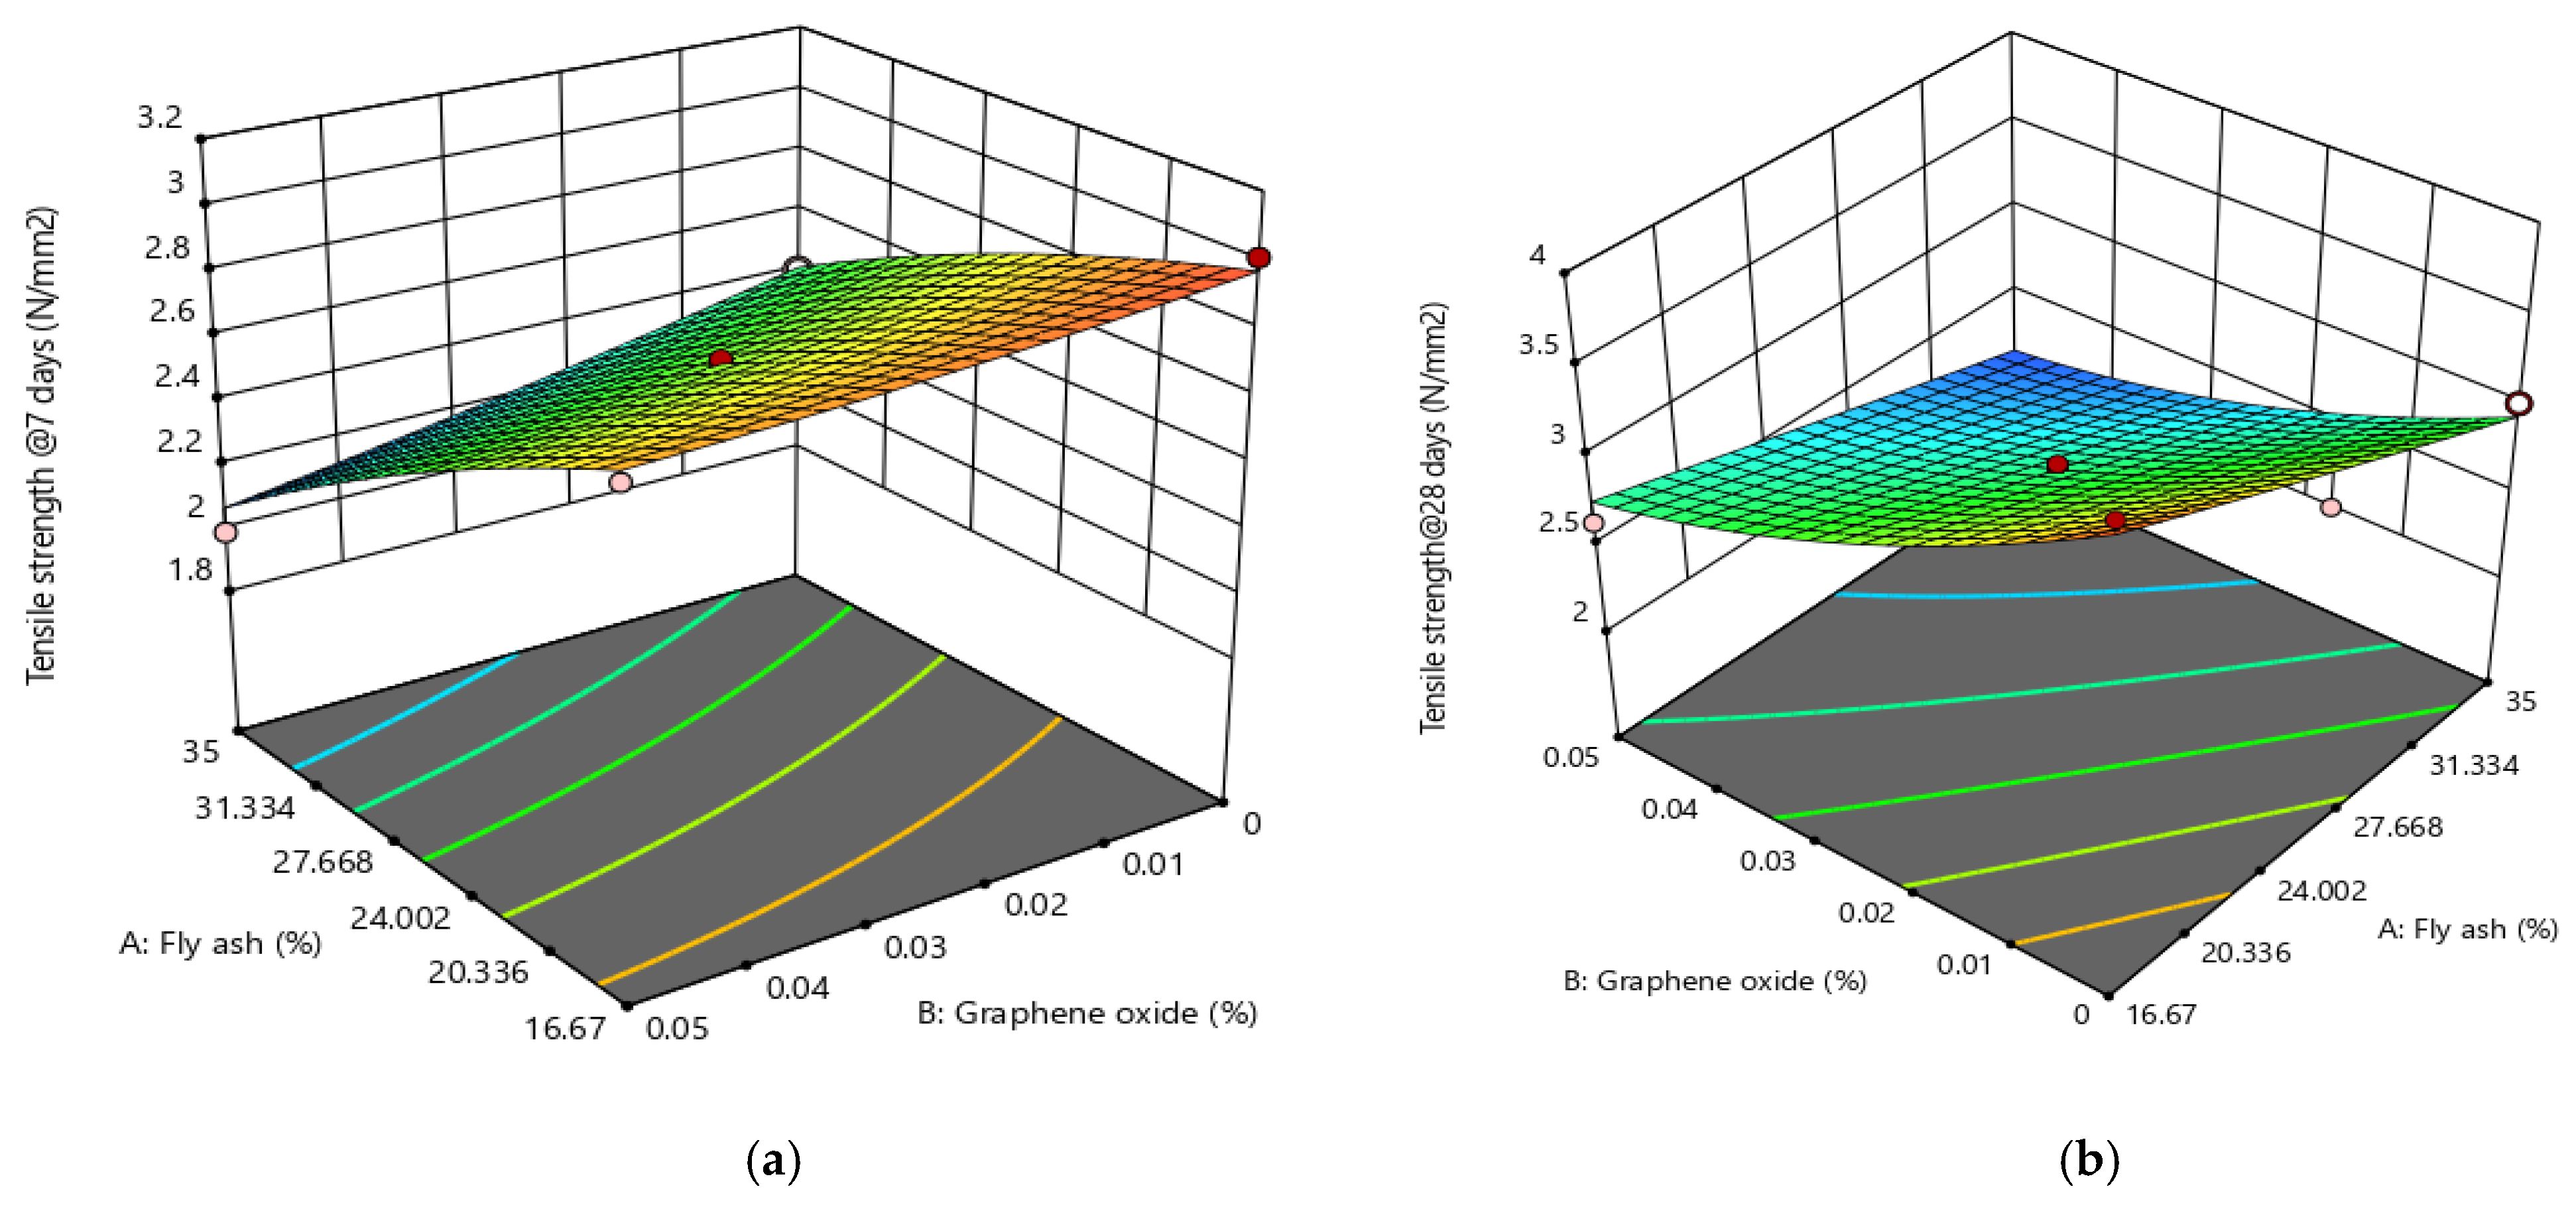
3.3. Splitting Tensile Strength

Figure 4 represents the split tensile strength (STS) of all the experimental combinations at 28 days in a bar chart. The tensile strength of the tested specimens ranged from 1.99 to 3.01 MPa and 2.02 to 3.98 MPa for 7 and 28 days respectively. Better results were obtained at the experimental combination of 12.837% fly ash and 0% GO combination at 28 days of curing period. The split tensile strength enhanced with partial substitution of cement using fly ash and GO addition, and the water molecule action of GO ends in the fast hydration process therefore improved the reduction of pore volumes in SCC by forming dense hydrated products. Additionally, GO due to its fine size can fill the excess pores in the matrix due to its pore-filling ability and improve the concrete’s tensile strength. Adding silica fume helps in the formation of more CSH gel in hydration that improves the tensile strength of GO-incorporated SCC. This leads to increment of hydrated product thickness that fills the pores which occurred due to the addition of more superplasticizer in SCC.
By RSM ANOVA, the actual equation for estimating the 28-day STS of the concrete with the interaction of two variables, i.e., fly ash and GO, are presented as Equation (2). The effect of fly ash and GO on the STS of the SCC is plotted in the form of 3-dimensional response surface plot as presented in Figure 5.
F F = 10.658 0.2414 × A + 196.669 × B 6.669 × A × B + 0.00639 × A 2 1014.369 × B 2
In above equation, FST represents the 28-day splitting tensile strength in MPa, and A and B represent the amount of fly ash and graphene oxide, respectively, in percentage (%).

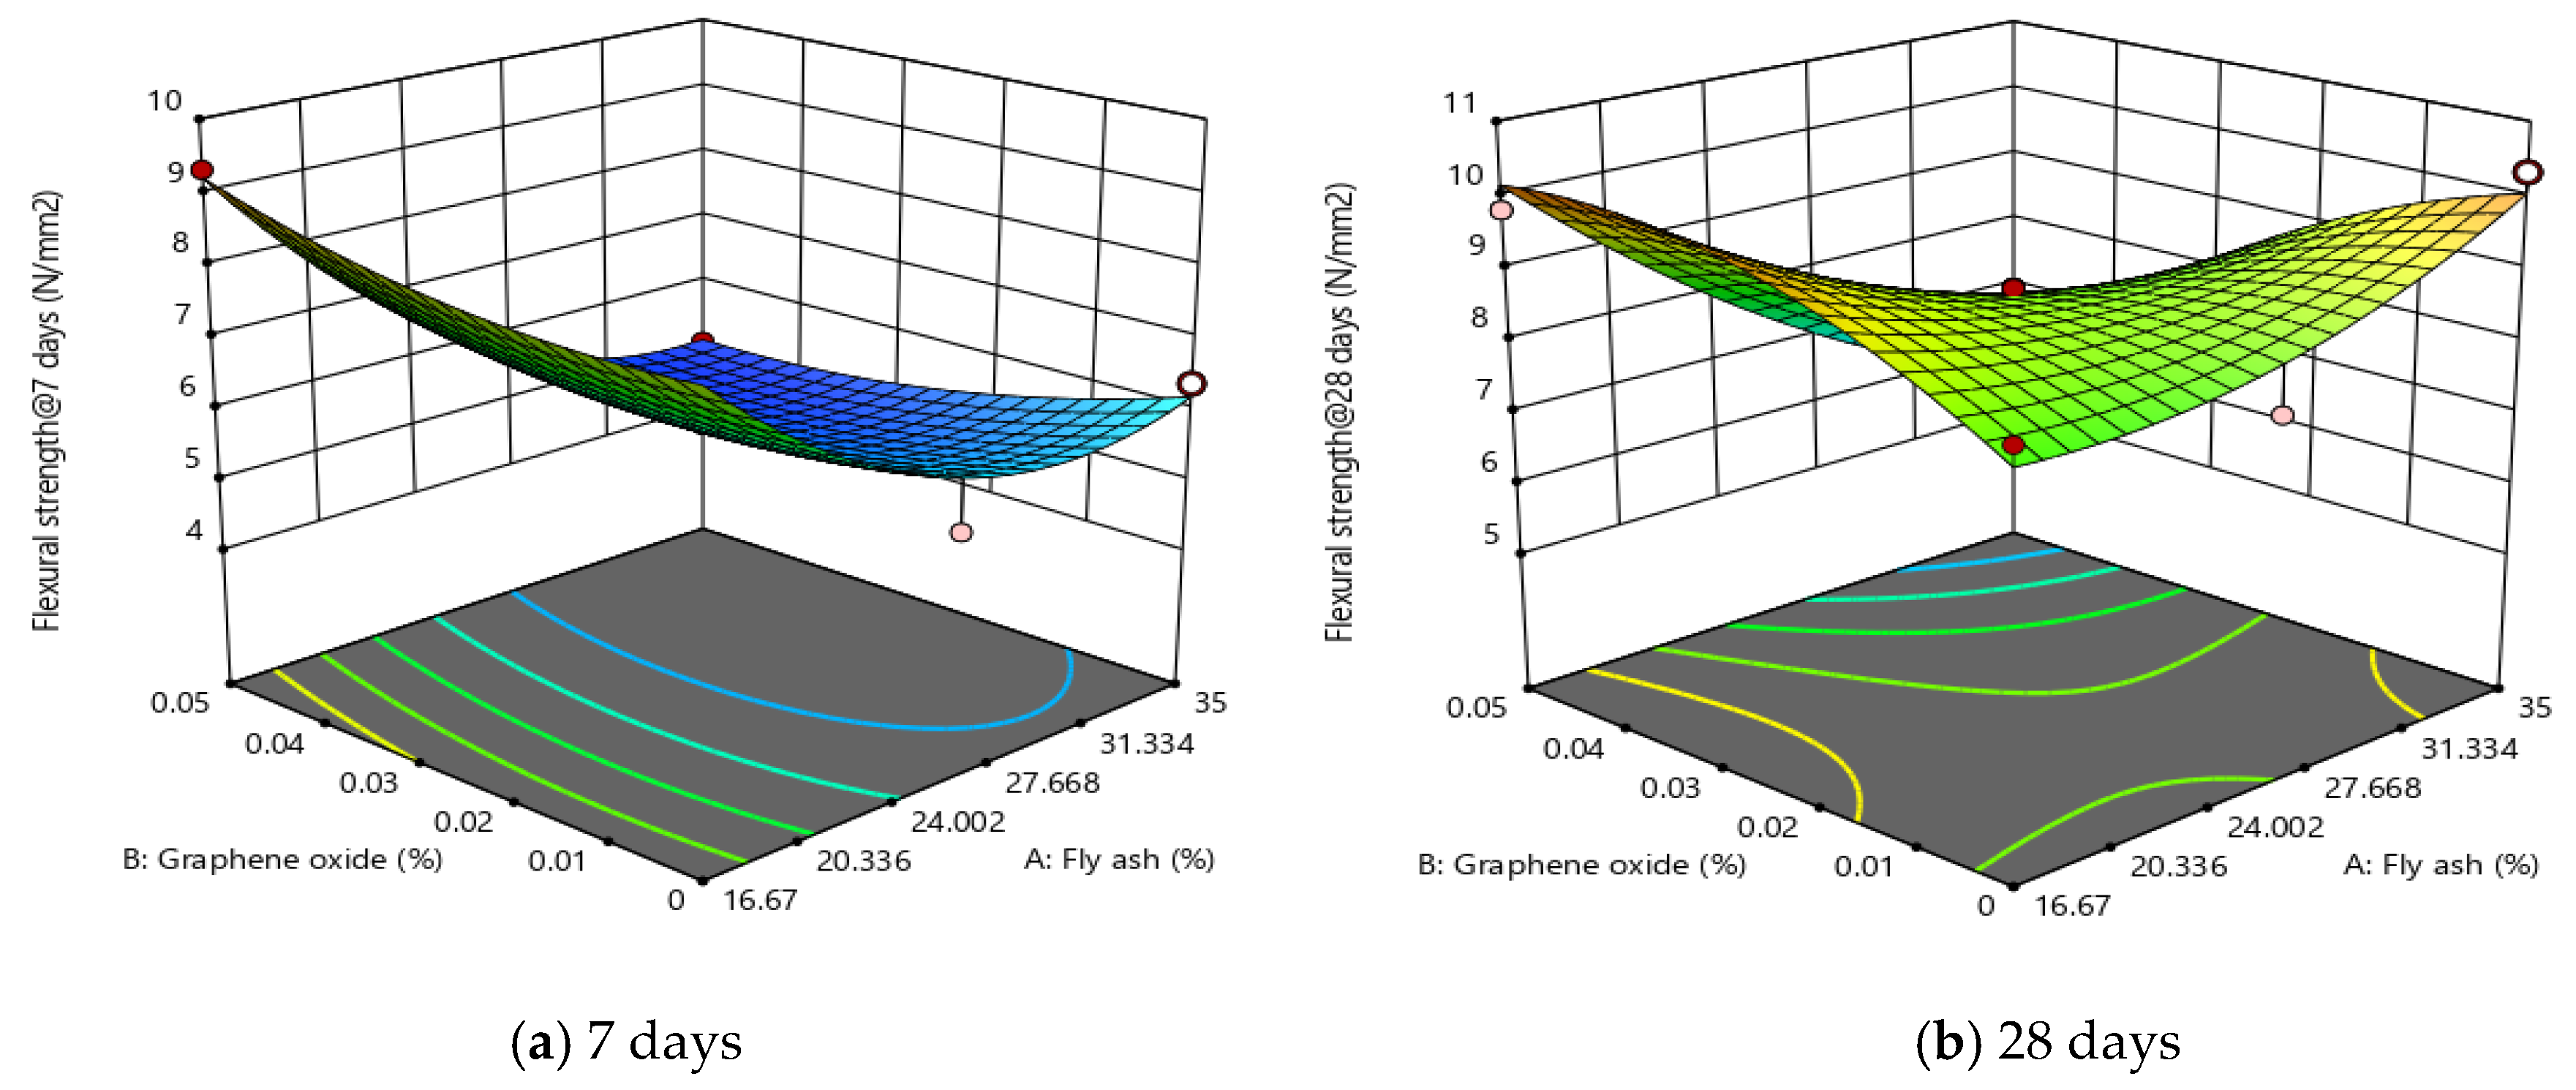
3.4. Flexural Strength

Figure 6 represents the flexural strength (FS) of all the experimental combinations at 28 days. The flexure strength of GO-incorporated FSCC ranges from 4.84 to 9.89 MPa and 5.338 to 10.791 MPa for 7 and 28 days, respectively. Proper dispersion of graphene oxide could reduce the formation of lumps which causes the voids. Thus, it could influence the porosity of structure. The internal phase of the hydrated product is much denser than in normal SCC which reduced the porosity of the concrete. It could have high early strength of concrete and a slight change in flexure strength at the age of 28 days for the curing period. Thus, it can be used for the construction of pavements [39]. Additionally, carbon-based materials such as GO due to their sheet-like microstructural configurations help in the prevention and inhibition of microcrack formation and propagation in the concrete, thereby enhancing its FS [17,40]. An improved FS was obtained by partially replacing 12.83% cement with fly ash and adding 0.05% GO by weight of cementitious materials at 28 days. However, with the increase in GO content to 0.064%, the FS slightly decreased.
Determined from ANOVA using RSM, the model for estimating the 28-day FS of the SCC using two variables which are fly ash and GO is presented as Equation (3). The effect of fly ash and GO on the FS of the SCC is plotted in form of 3-dimensional response surface plot as shown in Figure 7.
F F = 10.658 0.2414 × A + 196.669 × B 6.669 × A × B + 0.00639 × A 2 1014.369 × B 2
In the above equation, FF represents the 28-day flexural strength in MPa, and A and B represents the amount of fly ash and graphene oxide, respectively, in percentage (%).

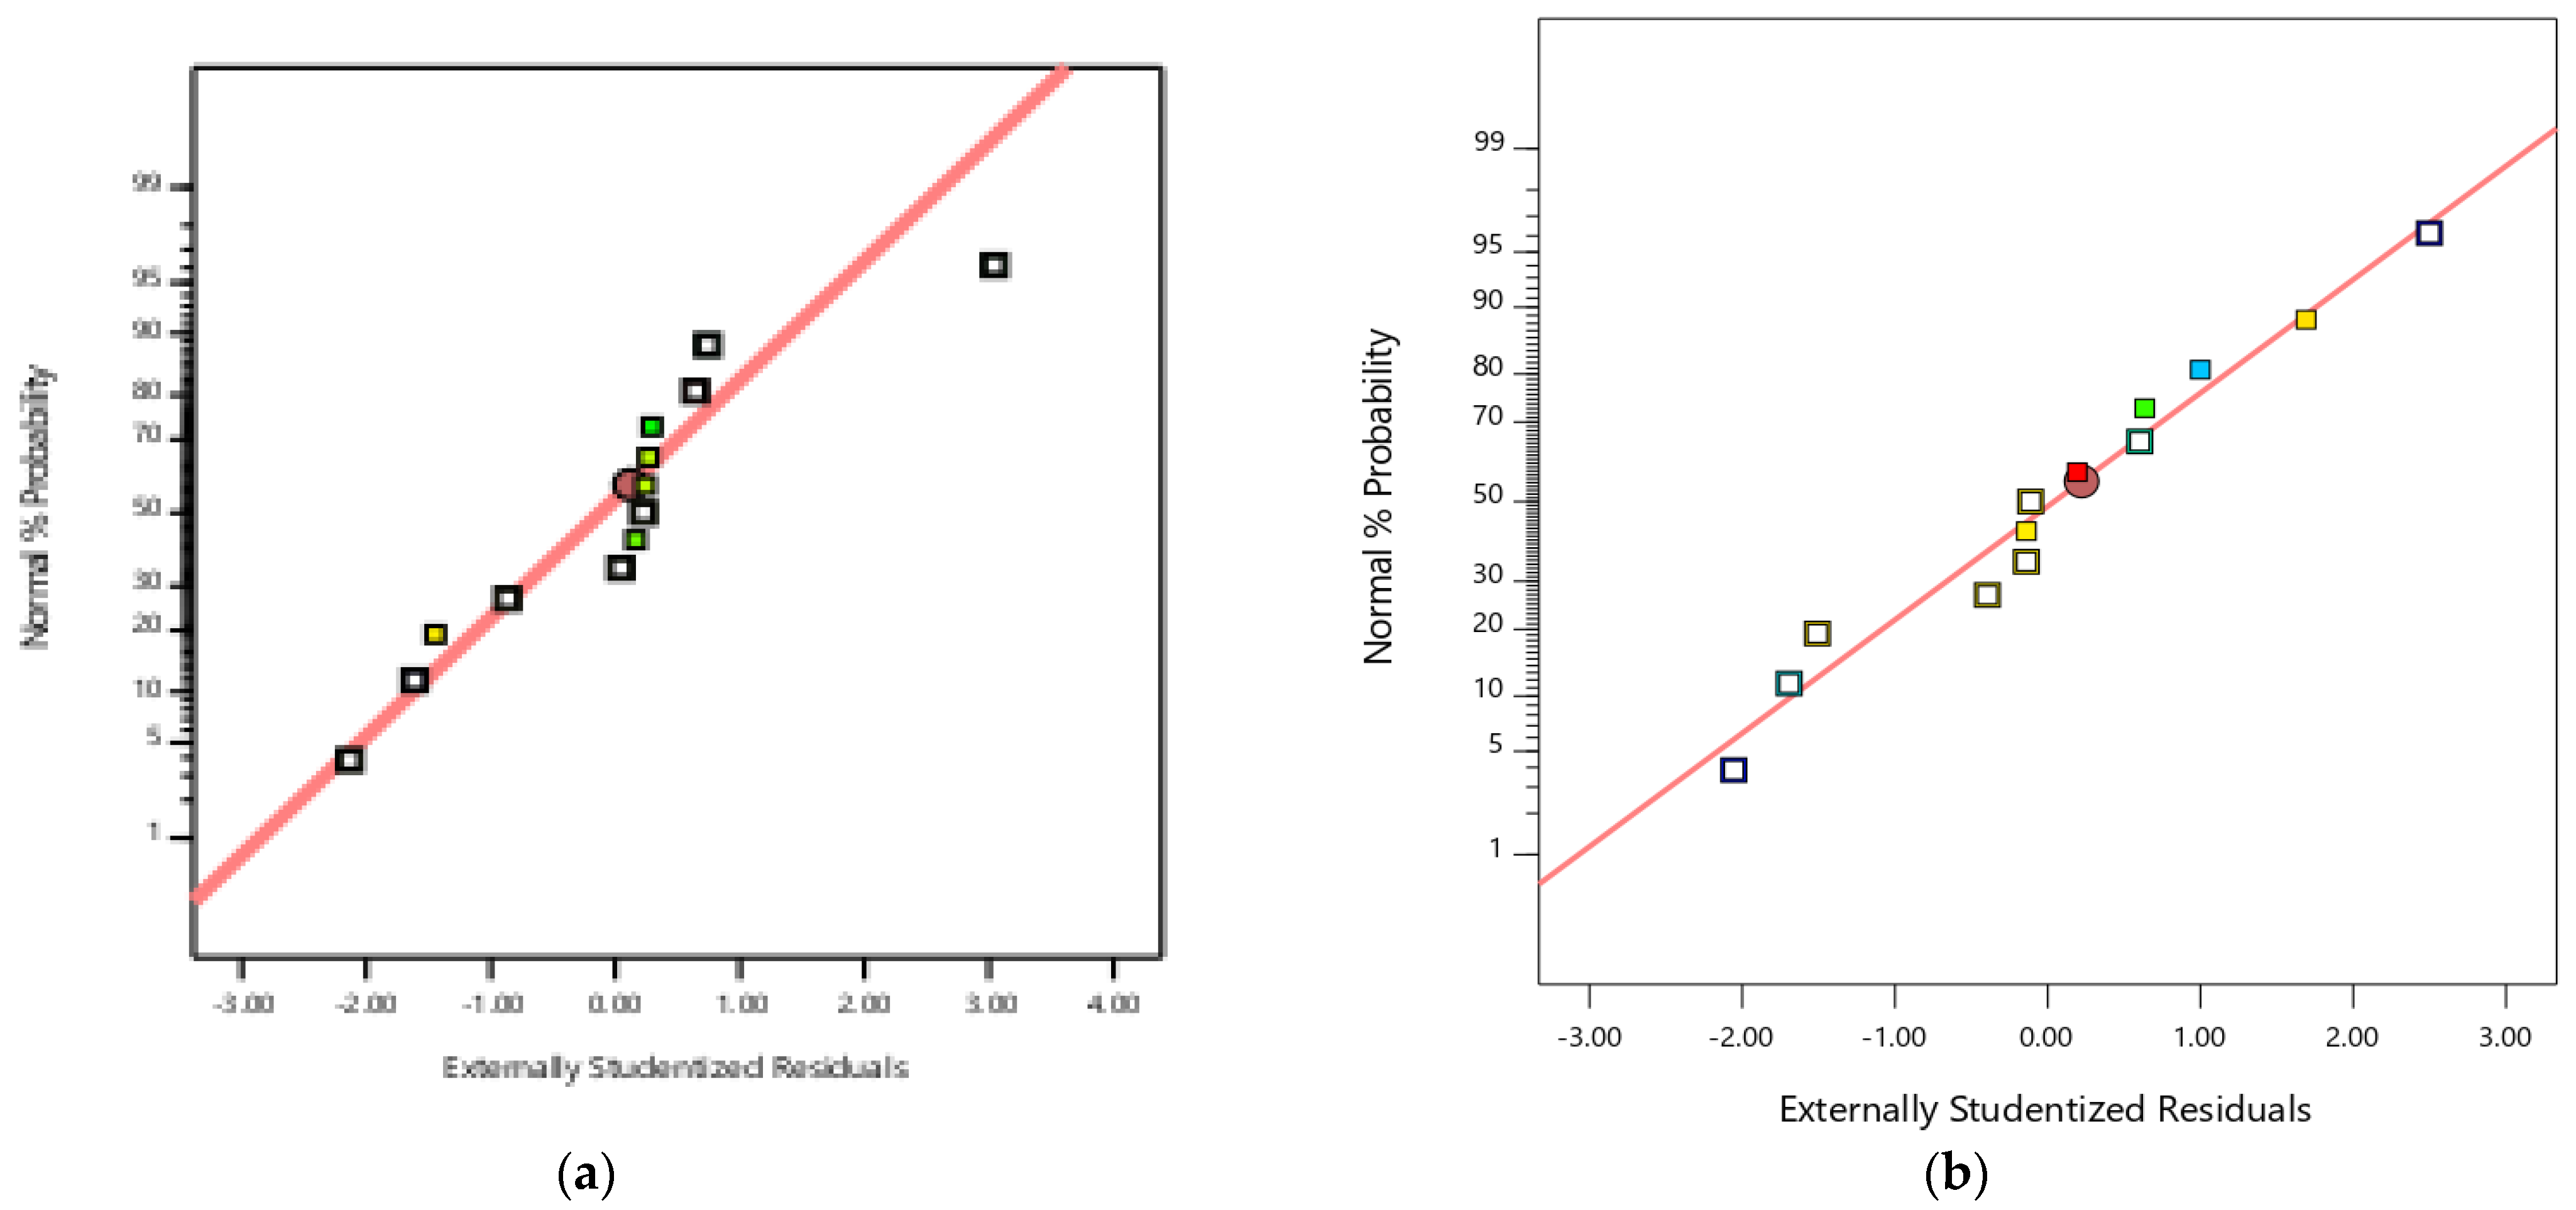
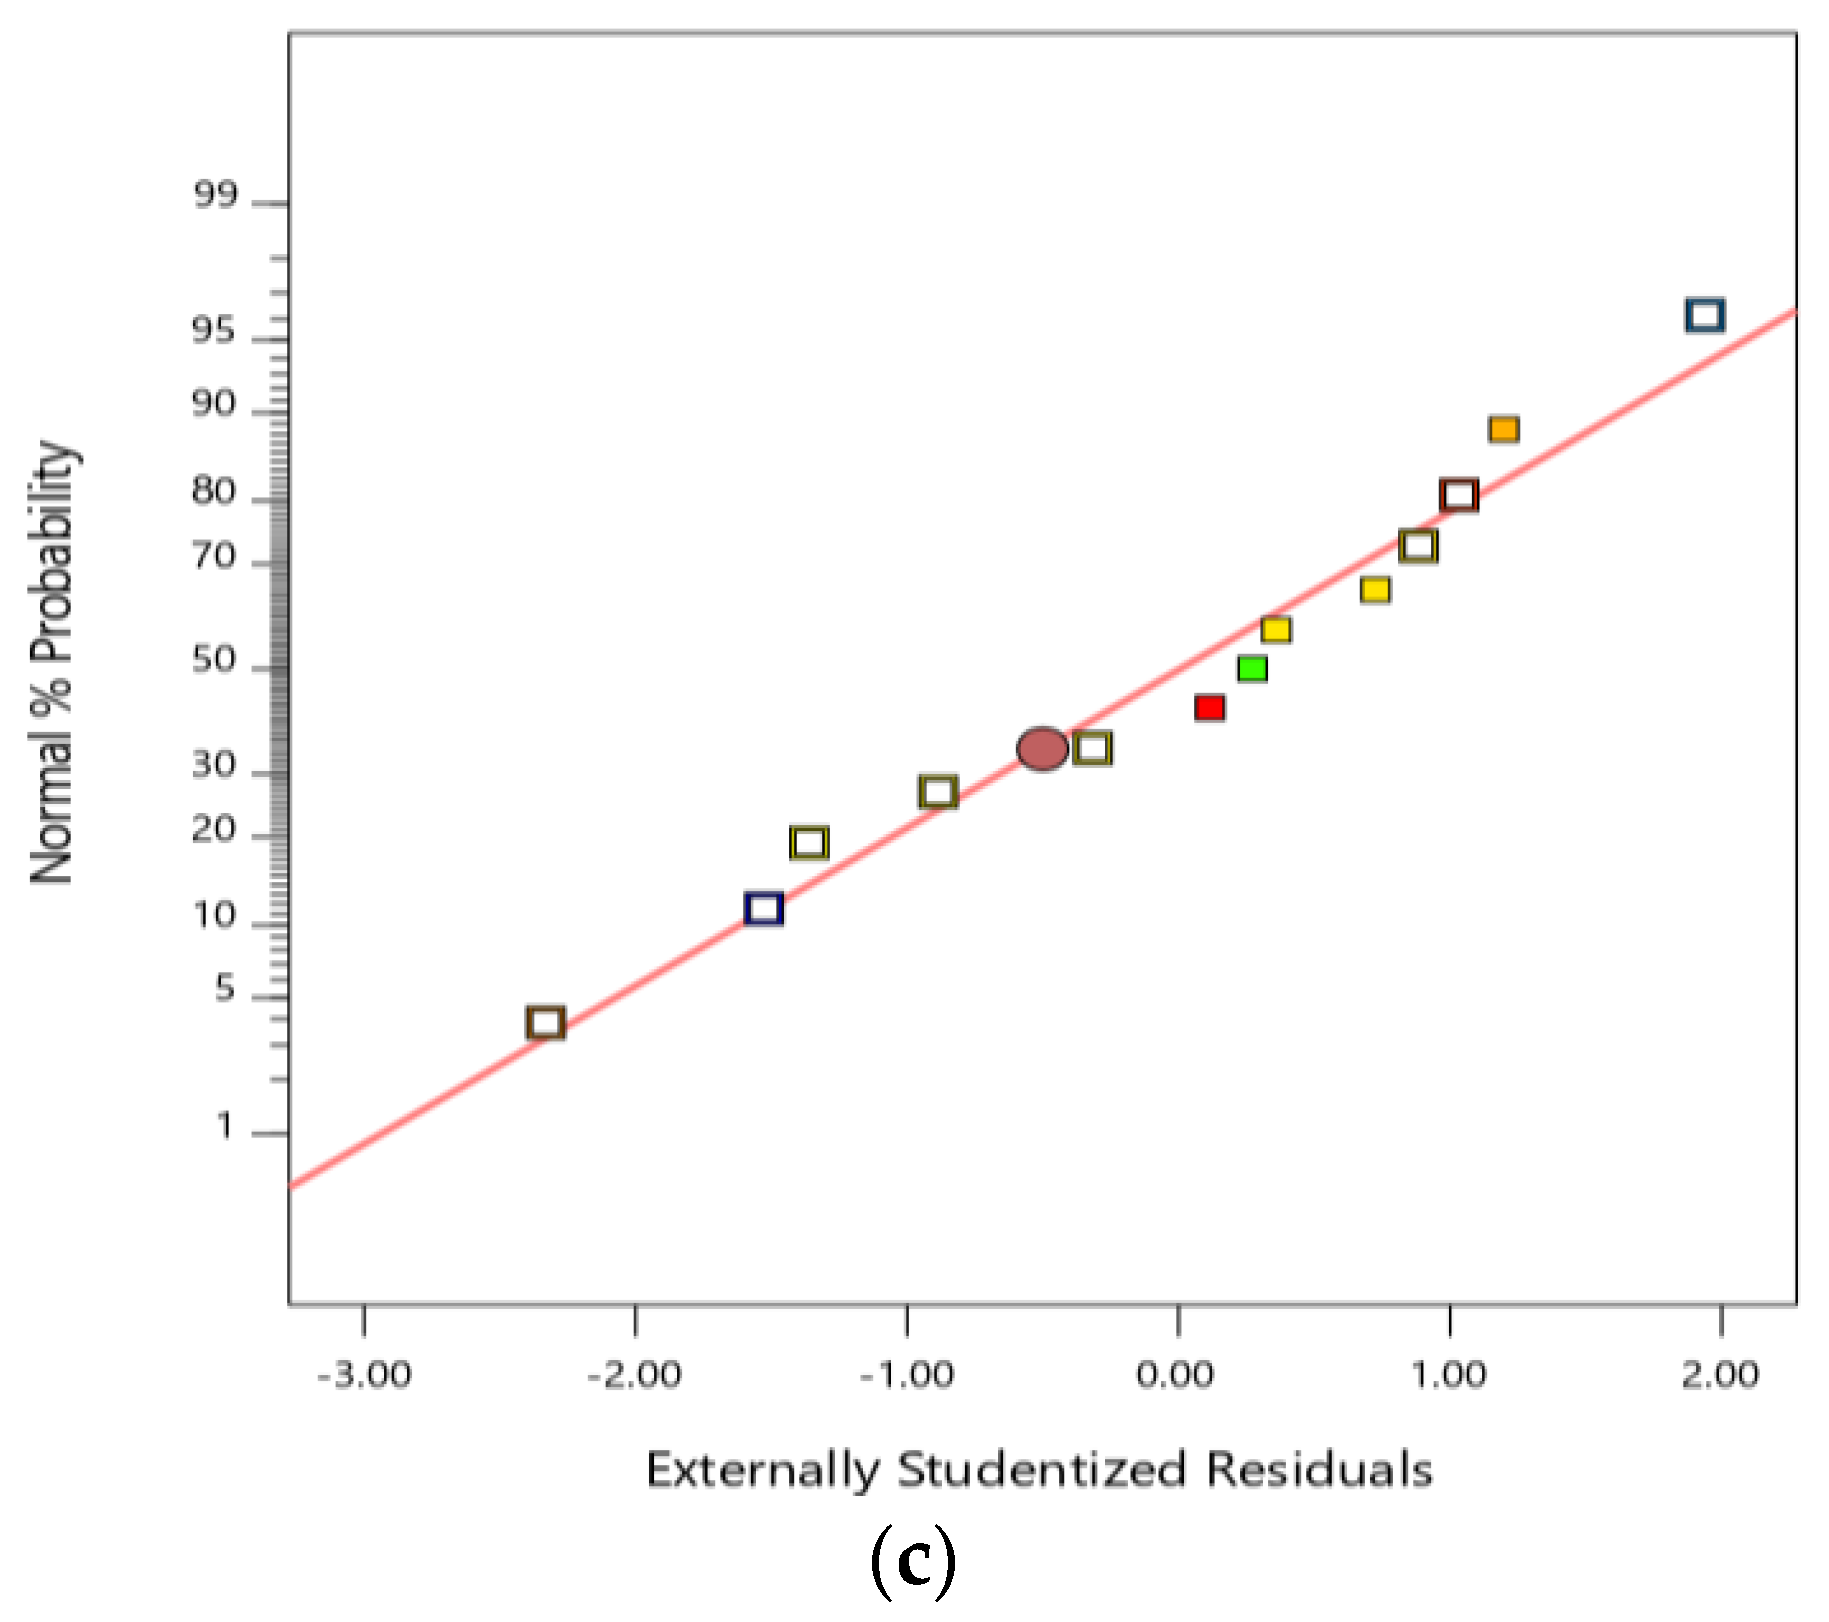
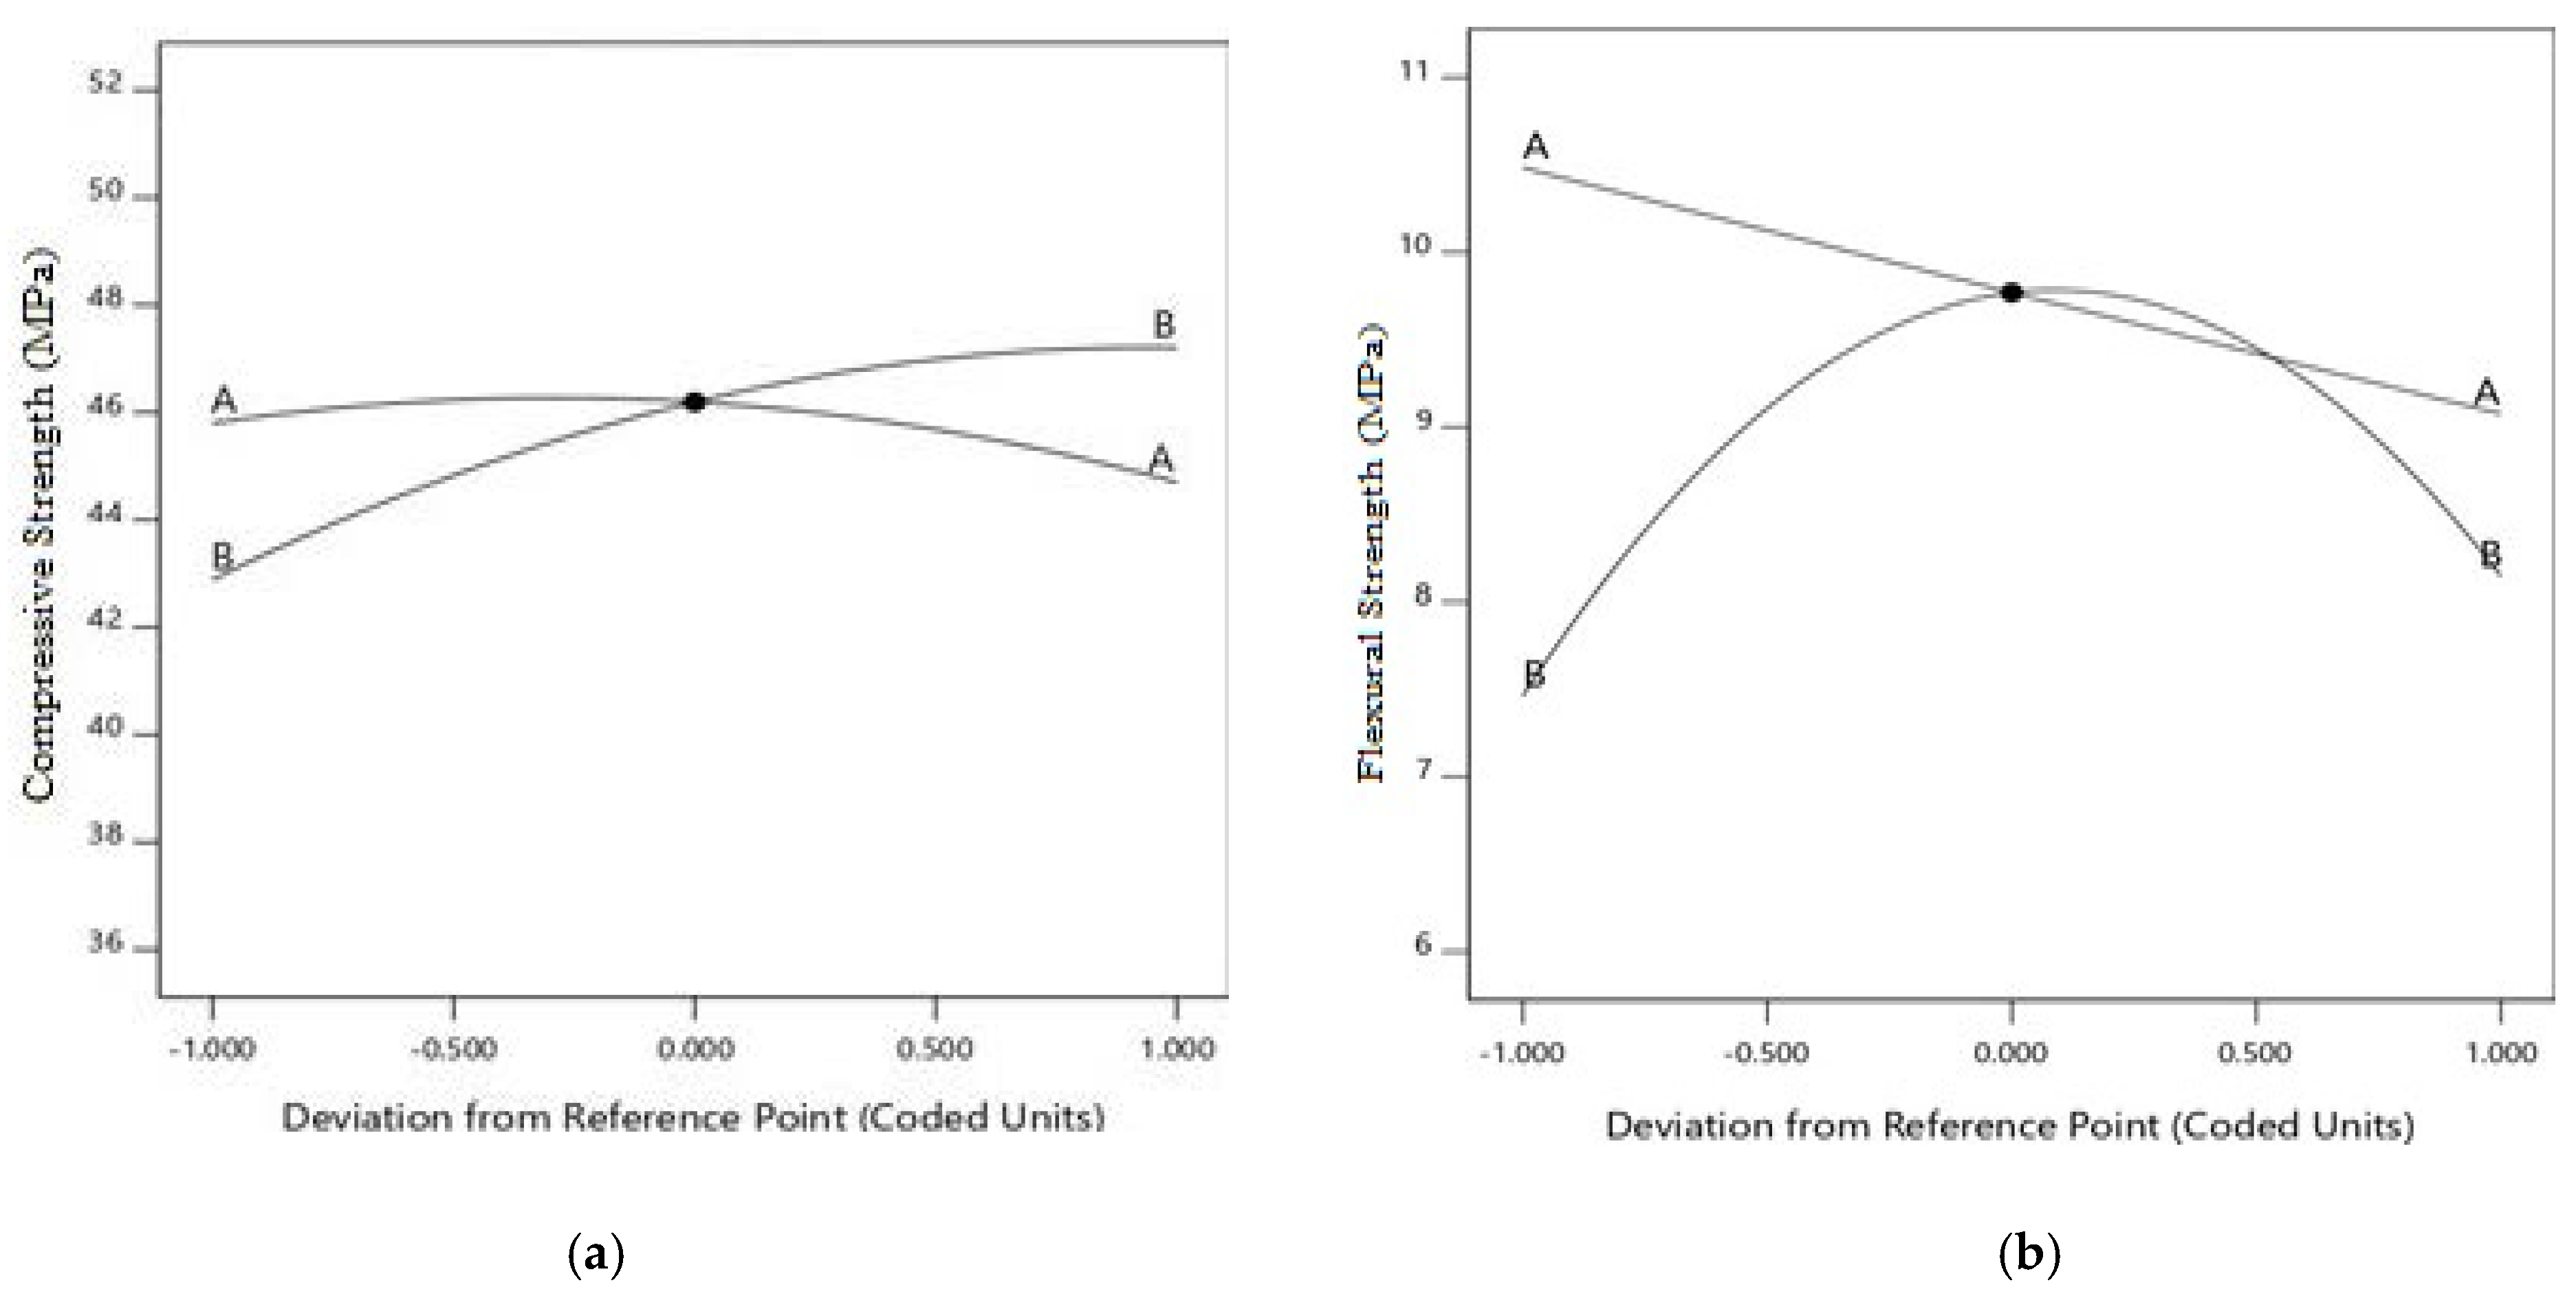
3.5. Analysis of Variance for RSM Models

The established model developed for estimating the strengths of the SCC using fly ash and graphene oxide (GO) contents as the variables were statistically validated using the ANOVA summary as presented in Table 8. Each model was checked for statistical significance using the confidence interval, i.e., Prob > F less than 0.05 or (p < 0.05). All the models have p-values less than 0.05 and are therefore significant. Each of the model terms were also checked for significance in the model using p < 0.05. For the 28-day CS and 28-day FS models, all the terms were signifant as the probability of their F-values are less than 0.05. While for the 28-day STS model, all the terms were significant except A2 which represents the square of fly ash content as its p-value is equal to 0.5. Further validation of the model with regards to lack of fit was carried out. The lack of fit is simply defined as the measure of predicted models missing the observation [33,41]. The lack of fit is verified for statistical significance using the confidence interval. From Table 8, the lack of fit for all the models have p-values greater than 0.05 and therefore are not significant in relation to their pure errors. This implied that the models have a good fitness with the experimental data and have high prediction accuracy.
A summary of the the coefficient of regression (R2) used for for validating the employed tests can be found in Table 9. The R2 was used to validate and justify the fitness accuracy and degree of correlation of the models. In RSM statistical analysis, R2 value ranges between 0 to 1, with 0 indicating a lack of correlation and 1 indicating a perfect match between the developed models and experimental data [17,42]. All the models have reasonable very high degree of regressions superior than 0.9. Only about 2.14%, 3.37%, and 4.31% of the experimental data for CS, STS, and FS respectively of the experimental data cannot fully fit into the model. The variation between the adjusted and predicted R2 was also evaluated to check for possible problems with the models or experimental data, and presence of large block effects in the models. For the model, a close agreement between adjusted and predicted R2 values were found since difference is less than 0.2. Therefore, the developed models can be employed for estimation without any issue or significant block effect. Furthermore, all the models yield low standard deviation compared to their respective mean values which prove that they can be employed with high accuracy.
Normal probability plots are diagnostic plots obtained from the RSM solution which are used to explain and validate the appropriateness and adequacy of the model in terms of normal distribution. Initially, when planning the analysis, it is assumed that the data are normally distributed. The normal probability plots for the CS, flexural strength, and STS models are presented as Figure 8a–c. For all the models, their data points were lined up around the trend line. That shows shows our model and data were normally distributed.
The perturbation plot is used to compare the effects of fly ash and GO at a particular design point, i.e., at the central design point, and to check whether the responses are sensitive to the variables [43,44]. Figure 9 presents the perturbation plots for the compressive, flexural, and STS model. From Figure 9a, the CS has little sensitivity to both fly ash (A) and GO (B) as the slopes of A and B have little steepness, i.e., they are gentler. From Figure 9b, the FS is insensitive to change in fly ash content as the slope of A is flat in nature. The slope of B is very steep and hence the FS has much sensitivity to change in GO content. As seen in Figure 9c, the STS is not sensitive to change in fly ash due to the flat line of A, while it has less sensitivity to change in GO as the slope of B is not perfectly straight, i.e., it has less steepness.

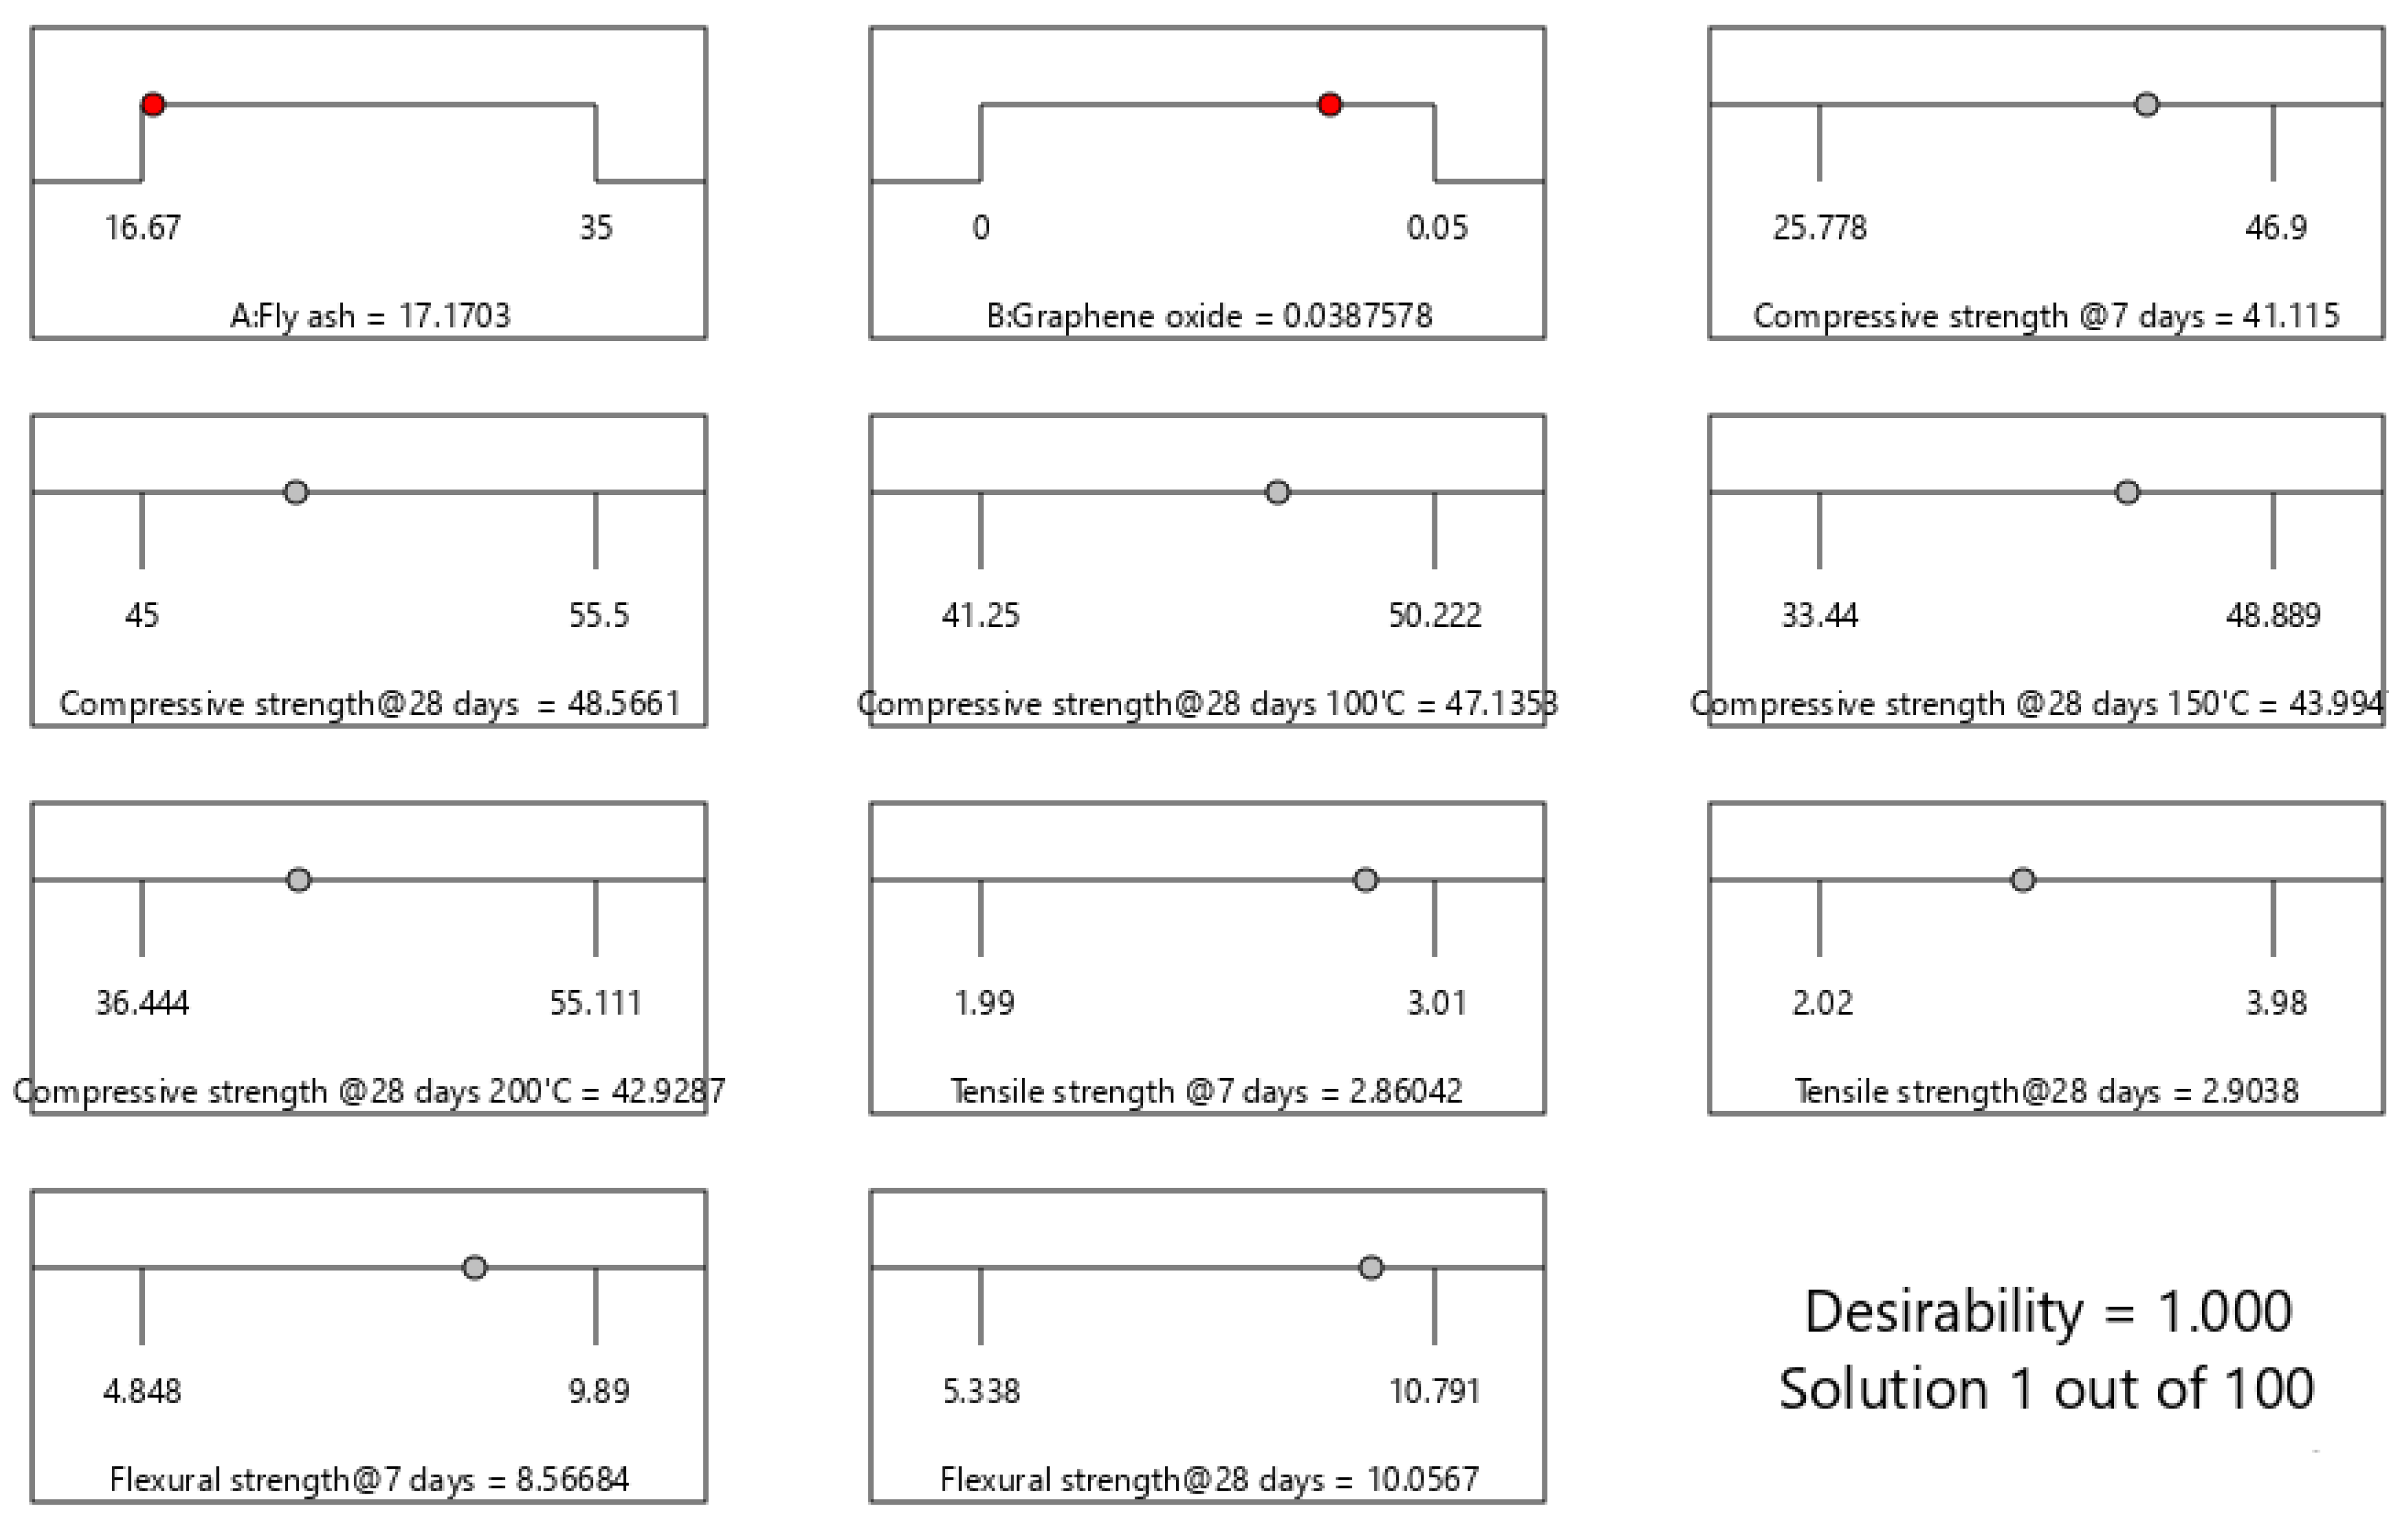
3.6. Optimization and Experimental Validation

After analyzing the correlation among the variables and responses, an optimization procedure was done with RSM to find out the best results for the experimental combinations. The optimization was carried out by setting out some criteria for the variables and responses, as presented in Table 10. For the current work, eleven responses were obtained for all the experimental combinations, as shown in Figure 10. Each response optimum value was obtained based on the variable proportions mentioned in the experimental combination. All the responses cannot end up with an optimum value at the same possible combination. It is difficult to evaluate the two variables as their influences in the experiment would be a different kind. From the ramp view of optimization presented in Figure 10, it can be observed that the desirability factor is 1, i.e., the response is desirable, and the optimization results are accurate. From Table 9, it was observed that the variable ranges are specified along the optimum values for the three main responses in the experiment. Based on the multi-objective optimization, the best SCC mix in terms of performance was accomplished by partially replacing 17.17% cement with fly ash and adding 0.039% GO by weight of cementitious materials to achieve the following optimum properties at normal temperature: 7-day CS of 41.12 MPa, 28-day CS of 48.57 MPa, 7-day STS of 2.86 MPa, 28-day STS of 2.90 MPa, 7-day FS of 8.57 MPa, and 28-day FS of 10.06 MPa. Under elevated temperature, the optimum compressive strengths achieved were 47.14 MPa, 43.99 MPa, and 42.93 MPa at 100 °C, 150 °C, and 200 °C, respectively. The multi-objective optimization result was validated using the desirability. As shown in Figure 10, the desirability is 1. This means that the best optimal combinations of the multiple set-up objectives for optimization were accomplished with little or no substantial error, implying that the projected values are the desired ones [41,45].

4. Conclusions

Based on our results and experimental data analysed with RSM, the following conclusions were drawn:
  • GO reduced the fresh properties of SCC such as slump, flowability, and compaction. Therefore, for GO to be used effectively in SCC, more superplasticizer is required.
  • GO improved the mechanical strengths of fly ash-based SCC, where for CS of the optimum GO content was 0.03%, while for FS and STS, the optimum GO content was 0.05%.
  • The optimum content of fly ash was 35%, that satisfies the both flowability and deformabilty property of self-compacting concrete.
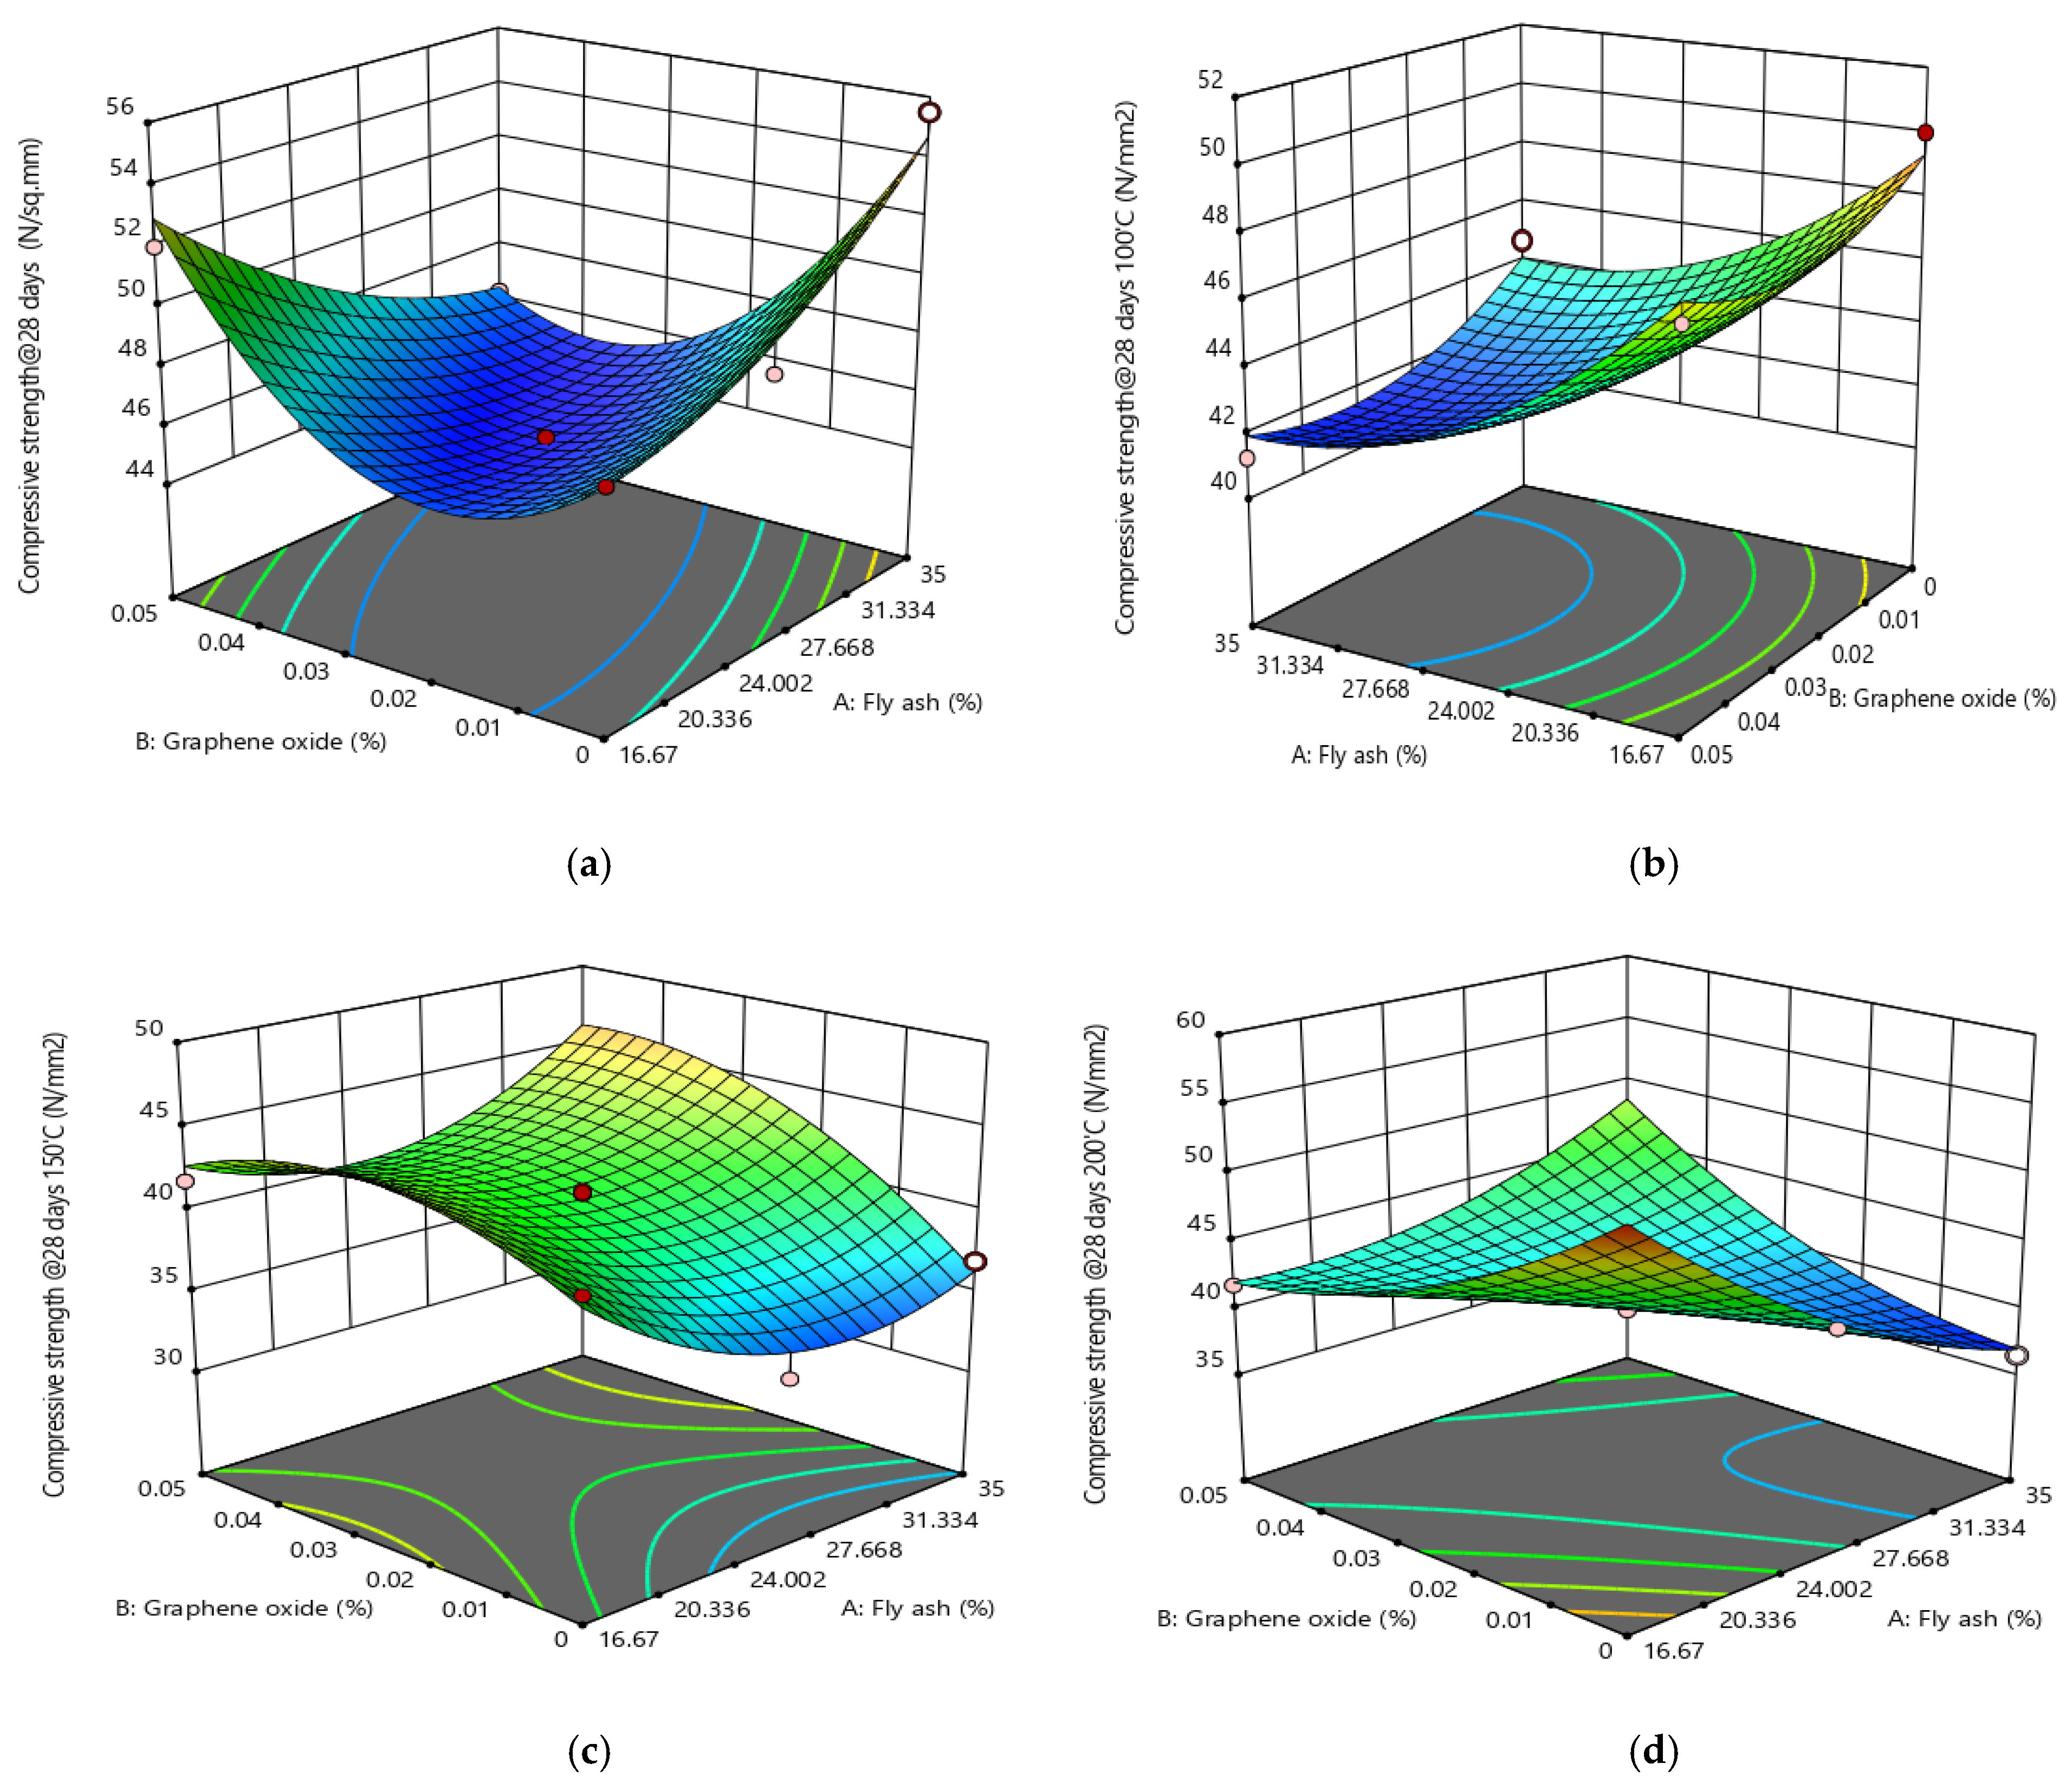
  • The addition of GO enhances the heat resistance of fly ash-based SCC, where the reduction in CS of the SCC when subjected to even higher temperature is almost due to the inclusion of grapheme oxide.
  • The FS of fly ash-based SCC improved significantly at an early age with the addition of GO; this gives the SCC an advantage to be used in pavement applications.
  • The developed models for estimating the 28-day CS, flexural strength, and STS using RSM were statistically significant with very high accuracy.
  • Multi-objective optimization results showed that the optimum combinations of fly ash (as cement replacement material) and GO (as additive) were 17.17% and 0.039%, respectively, to reach optimal performance of the SCC mix as both normal and elevated temperature, with a desirability of 100%.

Author Contributions

Conceptualization, V.C.K., V.P., M.A. (Musa Adamu) and M.A.K.R.; methodology, V.C.K., V.P. and M.A.K.R.; software, V.C.K., M.A. (Musa Adamu), M.A. (Marc Azab) and A.H.; validation, M.A. (Musa Adamu), M.A. (Marc Azab), M.A.K.R. and A.F.D.; formal analysis, V.C.K., V.P., M.A. (Musa Adamu) and M.A.K.R.; investigation, V.C.K., V.P., M.A. (Musa Adamu) and M.A.K.R.; resources, M.A. (Marc Azab), A.H. and A.F.D.; data curation, V.C.K., V.P. and M.A.K.R.; writing—original draft preparation, V.C.K., V.P., M.A. (Musa Adamu) and A.F.D.; review and editing, Y.E.I., M.A. (Marc Azab) and A.H.; visualization, M.A. (Musa Adamu), Y.E.I. and M.A. (Marc Azab); supervision, Y.E.I. and A.F.D.; project administration, M.A. (Marc Azab), A.H. and A.F.D.; funding acquisition, M.A. (Marc Azab), A.H. and A.F.D. All authors have read and agreed to the published version of the manuscript.

Funding

The authors would like to thank the Deanship of Scientific Research at Umm Al-Qura University for supporting this work by Grant Code: (22UQU4250045DSR14).

Data Availability Statement

Not applicable.

Conflicts of Interest

The authors declare no conflict of interest.

References

  1. Sobuz, M.H.R.; Saha, A.; Anamika, J.F.; Houda, M.; Azab, M.; Akid, A.S.M.; Rana, M.J. Development of Self-Compacting Concrete Incorporating Rice Husk Ash with Waste Galvanized Copper Wire Fiber. Buildings 2022, 12, 1024. [Google Scholar] [CrossRef]
  2. Gokulnath, V.; Ramesh, B.; Reddy, S.S. Addition of reinforcing materials in self compacting concrete. Mater. Today Proc. 2020, 22, 722–725. [Google Scholar] [CrossRef]
  3. Kanellopoulos, A.; Savva, P.; Petrou, M.F.; Ioannou, I.; Pantazopoulou, S. Assessing the quality of concrete–reinforcement interface in Self Compacting Concrete. Constr. Build. Mater. 2020, 240, 117933. [Google Scholar] [CrossRef]
  4. Turuallo, G.; Soutsos, M.N. Supplementary cementitious materials: Strength development of self-compacting concrete under different curing temperature. Procedia Eng. 2015, 125, 699–704. [Google Scholar] [CrossRef] [Green Version]
  5. Peng, H.; Ge, Y.; Cai, C.; Zhang, Y.; Liu, Z. Mechanical properties and microstructure of graphene oxide cement-based composites. Constr. Build. Mater. 2019, 194, 102–109. [Google Scholar] [CrossRef]
  6. Chuah, S.; Li, W.; Chen, S.J.; Sanjayan, J.G.; Duan, W.H. Investigation on dispersion of graphene oxide in cement composite using different surfactant treatments. Constr. Build. Mater. 2018, 161, 519–527. [Google Scholar] [CrossRef]
  7. Concrete, S.-C. The European guidelines for self-compacting concrete. BIBM 2005, 22, 1040. [Google Scholar]
  8. De Schutter, G.; Bartos, P.J.; Domone, P.; Gibbs, J. Self-Compacting Concrete; Whittles Publishing Caithness: Dunbeath, UK, 2008; Volume 288. [Google Scholar]
  9. Okamura, H.; Ozawa, K.; Ouchi, M. Self-compacting concrete. Struct. Concr. 2000, 1, 3–17. [Google Scholar] [CrossRef] [Green Version]
  10. Wang, Y.; Hughes, P.; Niu, H.; Fan, Y. A new method to improve the properties of recycled aggregate concrete: Composite addition of basalt fiber and nano-silica. J. Clean. Prod. 2019, 236, 117602. [Google Scholar] [CrossRef]
  11. Saorin, F.J.B.; Belmonte, I.M.; Costa, C.P.; Lopez, C.R.; Paya, M.V. QSI methods for determining the quality of the surface finish of concrete. Sustainability 2018, 10, 931. [Google Scholar] [CrossRef] [Green Version]
  12. Choudhary, R.; Gupta, R.; Nagar, R. Impact on fresh, mechanical, and microstructural properties of high strength self-compacting concrete by marble cutting slurry waste, fly ash, and silica fume. Constr. Build. Mater. 2020, 239, 117888. [Google Scholar] [CrossRef]
  13. Kumar, P.; Sudalaimani, K.; Shanmugasundaram, M. An investigation on self-compacting concrete using ultrafine natural steatite powder as replacement to cement. Adv. Mater. Sci. Eng. 2017, 2017, 8949041. [Google Scholar] [CrossRef] [Green Version]
  14. Zhao, L.; Guo, X.; Song, L.; Song, Y.; Dai, G.; Liu, J. An intensive review on the role of graphene oxide in cement-based materials. Constr. Build. Mater. 2020, 241, 117939. [Google Scholar] [CrossRef]
  15. Jing, G.; Wu, J.; Lei, T.; Wang, S.; Strokova, V.; Nelyubova, V.; Wang, M.; Ye, Z. From graphene oxide to reduced graphene oxide: Enhanced hydration and compressive strength of cement composites. Constr. Build. Mater. 2020, 248, 118699. [Google Scholar] [CrossRef]
  16. Chen, Z.; Xu, Y.; Hua, J.; Wang, X.; Huang, L.; Zhou, X. Mechanical properties and shrinkage behavior of concrete-containing graphene-oxide nanosheets. Materials 2020, 13, 590. [Google Scholar] [CrossRef] [Green Version]
  17. Adamu, M.; Trabanpruek, P.; Jongvivatsakul, P.; Likitlersuang, S.; Iwanami, M. Mechanical performance and optimization of high-volume fly ash concrete containing plastic wastes and graphene nanoplatelets using response surface methodology. Constr. Build. Mater. 2021, 308, 125085. [Google Scholar] [CrossRef]
  18. Devi, S.; Khan, R. Effect of graphene oxide on mechanical and durability performance of concrete. J. Build. Eng. 2020, 27, 101007. [Google Scholar] [CrossRef]
  19. Adamu, M.; Trabanpruek, P.; Limwibul, V.; Jongvivatsakul, P.; Iwanami, M.; Likitlersuang, S. Compressive Behavior and Durability Performance of High-Volume Fly-Ash Concrete with Plastic Waste and Graphene Nanoplatelets by Using Response-Surface Methodology. J. Mater. Civ. Eng. 2022, 34, 04022222. [Google Scholar] [CrossRef]
  20. Lu, Z.; Chen, B.; Leung, C.Y.; Li, Z.; Sun, G. Aggregation size effect of graphene oxide on its reinforcing efficiency to cement-based materials. Cem. Concr. Compos. 2019, 100, 85–91. [Google Scholar] [CrossRef]
  21. Nandhini, S.; Padmanaban, I. Experimental investigation on graphene oxide composites with fly ash concrete. Int. J. Earth Sci. Eng. 2016, 9, 515–519. [Google Scholar]
  22. Lv, S.; Ma, Y.; Qiu, C.; Zhou, Q. Regulation of GO on cement hydration crystals and its toughening effect. Mag. Concr. Res. 2013, 65, 1246–1254. [Google Scholar] [CrossRef]
  23. Lv, S.; Ma, Y.; Qiu, C.; Sun, T.; Liu, J.; Zhou, Q. Effect of graphene oxide nanosheets of microstructure and mechanical properties of cement composites. Constr. Build. Mater. 2013, 49, 121–127. [Google Scholar] [CrossRef]
  24. Horszczaruk, E.; Mijowska, E.; Kalenczuk, R.J.; Aleksandrzak, M.; Mijowska, S. Nanocomposite of cement/graphene oxide–Impact on hydration kinetics and Young’s modulus. Constr. Build. Mater. 2015, 78, 234–242. [Google Scholar] [CrossRef]
  25. Mohammed, A.; Sanjayan, J.; Nazari, A.; Al-Saadi, N. Effects of graphene oxide in enhancing the performance of concrete exposed to high-temperature. Aust. J. Civ. Eng. 2017, 15, 61–71. [Google Scholar] [CrossRef]
  26. Babak, F.; Abolfazl, H.; Alimorad, R.; Parviz, G. Preparation and Mechanical Properties of Graphene Oxide: Cement Nanocomposites. Sci. World J. 2014, 2014, 276323. [Google Scholar] [CrossRef] [PubMed] [Green Version]
  27. Chuah, S.; Pan, Z.; Sanjayan, J.G.; Wang, C.M.; Duan, W.H. Nano reinforced cement and concrete composites and new perspective from graphene oxide. Constr. Build. Mater. 2014, 73, 113–124. [Google Scholar] [CrossRef]
  28. Lu, Z.; Yao, J.; Leung, C.K. Using graphene oxide to strengthen the bond between PE fiber and matrix to improve the strain hardening behavior of SHCC. Cem. Concr. Res. 2019, 126, 105899. [Google Scholar] [CrossRef]
  29. Tariq, H.; Siddique, R.M.A.; Shah, S.A.R.; Azab, M.; Qadeer, R.; Ullah, M.K.; Iqbal, F. Mechanical Performance of Polymeric ARGF-Based Fly Ash-Concrete Composites: A Study for Eco-Friendly Circular Economy Application. Polymers 2022, 14, 1774. [Google Scholar] [CrossRef]
  30. Adamu, M.; Ayeni, K.O.; Haruna, S.I.; Mansour, Y.E.-H.I.; Haruna, S. Durability performance of pervious concrete containing rice husk ash and calcium carbide: A response surface methodology approach. Case Stud. Constr. Mater. 2021, 14, e00547. [Google Scholar]
  31. Montgomery, D.C. Design and Analysis of Experiments; John Wiley & Sons: Hoboken, NJ, USA, 2017. [Google Scholar]
  32. Khed, V.C.; Mohammed, B.S.; Liew, M.; Zawawi, N.A.W.A. Development of response surface models for self-compacting hybrid fibre reinforced rubberized cementitious composite. Constr. Build. Mater. 2020, 232, 117191. [Google Scholar] [CrossRef]
  33. Adamu, M.; Haruna, S.I.; Ibrahim, Y.E.; Alanazi, H. Evaluation of the mechanical performance of concrete containing calcium carbide residue and nano silica using response surface methodology. Environ. Sci. Pollut. Res. 2022, 29, 67076–67102. [Google Scholar] [CrossRef] [PubMed]
  34. IS 516; Methods of Tests for Strength of Concrete. Tests for Compressive Strength of Concrete Specimen. Bureau of Indian Standards: Delhi, India, 2006.
  35. BIS, I. 5816; Indian Standard Splitting Tensile Strength of Concrete-Method of Test. Bureau of Indian Standards: New Delhi, India, 1999.
  36. IS 516; Methods of Tests for Strength of Concrete. Test for Flexural Strength of Moulded Flexure Test Specimens. Bureau of Indian Standards: Delhi, India, 2006.
  37. Efnarc, S. EFNARC Guidelines for Self-Compacting Concrete; EFNARC: Farnham, UK, 2002; pp. 1–32. Available online: www.Efnarc.org (accessed on 24 August 2022).
  38. Pesaralanka, V.; Khed, V.C. Flowability and compressive strength test on self compacting mortar using graphene oxide. Mater. Today Proc. 2020, 33, 491–495. [Google Scholar] [CrossRef]
  39. Akarsh, P.; Marathe, S.; Bhat, A.K. Influence of graphene oxide on properties of concrete in the presence of silica fumes and M-sand. Constr. Build. Mater. 2021, 268, 121093. [Google Scholar] [CrossRef]
  40. Guo, L.; Wu, J.; Wang, H. Mechanical and perceptual characterization of ultra-high-performance cement-based composites with silane-treated graphene nano-platelets. Constr. Build. Mater. 2020, 240, 117926. [Google Scholar] [CrossRef]
  41. Myers, R.H.; Montgomery, D.C.; Anderson-Cook, C.M. Response Surface Methodology: Process and Product Optimization Using Designed Experiments; John Wiley & Sons: Hoboken, NJ, USA, 2016. [Google Scholar]
  42. Adamu, M.; Mohammed, B.S.; Liew, M.S. Mechanical properties and performance of high volume fly ash roller compacted concrete containing crumb rubber and nano silica. Constr. Build. Mater. 2018, 171, 521–538. [Google Scholar] [CrossRef]
  43. Mohammed, B.S.; Khed, V.C.; Liew, M.S. Optimization of hybrid fibres in engineered cementitious composites. Constr. Build. Mater. 2018, 190, 24–37. [Google Scholar] [CrossRef]
  44. Myers, R.H.; Khuri, A.I.; Carter, W.H. Response surface methodology: 1966–l988. Technometrics 1989, 31, 137–157. [Google Scholar] [CrossRef]
  45. Achara, B.E.; Mohammed, B.S.; Liew, M. Bond behaviour of nano-silica-modified self-compacting engineered cementitious composite using response surface methodology. Constr. Build. Mater. 2019, 224, 796–814. [Google Scholar] [CrossRef]
Figure 1. SCC o properties measurement: (a) slump flow test; (b) V-funnel test apparatus; (c) L-Box test apparatus.
Buildings 12 02002 g001
Figure 2. CS at 28 days.
Buildings 12 02002 g002
Figure 3. Response surface plots for 28-day CS: (a) 24 °C; (b) 100 °C; (c) 150 °C; (d) 200 °C.
Buildings 12 02002 g003
Figure 4. Splitting tensile strength at 28 days.
Buildings 12 02002 g004
Figure 5. Response surface plots for tensile strength: (a) 7 days; (b) 28 days.
Buildings 12 02002 g005
Figure 6. Flexural strength of SCC at 28 days.
Buildings 12 02002 g006
Figure 7. Response surface plots for flexure strength: (a) 7 days, (b) 28 days.
Buildings 12 02002 g007
Figure 8. Normal plot versus externally studentized residuals: (a) 28−day compressive strength; (b) 28−day flexural strength; (c) 28−day splitting tensile strength.
Buildings 12 02002 g008aBuildings 12 02002 g008b
Figure 9. Perturbation plots: (a) 28−day compressive strength; (b) 28−day flexural strength; (c) 28−day splitting tensile strength.
Buildings 12 02002 g009aBuildings 12 02002 g009b
Figure 10. Ramp view for optimization.
Buildings 12 02002 g010
Table 1. Binder materials properties.
Oxide/PropertyCementFly AshSilica Fume
SiO221.7758.2695.85
Fe2O34.145.760.05
Al2O36.5631.740.26
CaO60.131.960.21
MgO2.090.150.45
Na2O0.380.78-
K2O0.430.73-
SO32.170.171.00
LOI2.390.312.80
Specific gravity3.162.252.07
Consistency (%)33--
Fineness (m2/Kg)307350-
Table 2. Properties of graphene oxide.
PropertiesValues
Surface area110–250 m2/g
Bulk density0.121 g/cm3
Physical formFluffy, very light powder
OdourOdour less
ColourBlack powder
Thickness0.8–2 nm
Carbon content60–80%
Table 3. Finalized mix design for Fly ash=based self-compacting concrete (FSCC).
Mixes Cement
(Kg/m3)
Fly Ash
(Kg/m3)
Graphene Oxide (Kg/m3) Silica Fume
(Kg/m3)
Powder Content
(Kg/m3)
M Sand
(Kg/m3)
Coarse Aggregate
(Kg/m3)
Super Plasticizer
(VMA)
(Kg/m3)
Super
Plasticizer
(PCE)
(Kg/m3)
Water
(Kg/m3)
SSC mix425100025508756751.641.56160
Table 4. Proportioning of powdered materials in SCC.
FactorsUnitsMinimum Level (−1)Maximum Level (+1)
CementKg/m3210425
Graphene oxide%00.05
Fly ash%16.6735
Silica powderKg/m32525
Powder contentKg/m35050
Table 5. Experimental combinations obtained by Design Expert software.
Mix IDMix DetailsRun in RSMFly Ash (%)Graphene Oxide (%)
M135 FA + 0.05 GO Mix1350.05
M225.835 FA + 0.025 GO Mix225.8350.025
M335 FA + 0 GO Mix3350
M416.67 FA + 0.05 GO Mix416.670.05
M525.835FA + 0 GO Mix525.8350
M638.7963 FA + 0.025 GO Mix638.79630.025
M716.67 FA + 0 GO Mix716.670
M825.835 FA + 0.025 GO Mix825.8350.025
M912.8737 FA + 0.025 GO Mix912.87370.025
M1025.835 FA + 0.025 GO Mix1025.8350.025
M1125.835 FA + 0.025 GO Mix1125.8350.025
M1225.835 FA + 0.025 GO Mix1225.8350.025
M1325.835 FA + 0.0604 GO Mix1325.8350.0604
Table 6. Constituent materials for each mix.
MixesQuantities of Materials per Kg/m3 (Kg/m3)
CementFly AshGOSilica FumePowder ContentM-SandCoarse AggSuper Plasticizer (VMA)Super Plasticizer (PCE)Water
M13152100.325508756751.641.56160
M23701550.1525508756751.641.56160
M3405210025508756751.641.56160
M44251000.325508756751.641.56160
M5370155025508756751.641.56160
M62932320.1525508756751.641.56160
M7425100025508756751.641.56160
M83701550.1525508756751.641.56160
M9448770.1525508756751.641.56160
M103701550.1525508756751.641.56160
M113701550.1525508756751.641.56160
M123701550.1525508756751.641.56160
M133701550.38425508756751.641.56160
Table 7. Fresh properties of SCC.
Mix IDSlumpV-Funnel (s)L-Box
d1d1sT500 H1H2H1/H2
M17507557533975700.93
M27307357333874690.92
M37407357402775741
M46706726702775710.94
M57357337352675741
M675875575641075741
M77307257282675720.96
M87006956983874680.92
M97857827832672650.90
M107437457443873670.92
M127457487463872660.92
M1364065064551275670.89
Table 8. ANOVA fit summary for mechanical strength models.
ResponsesSourceSum of SquaresMean SquareF-Valuep-ValueSignificance
28-day Compressive Strength (MPa)Model136.5527.311589.50<0.0001significant
A-Fly ash2.402.40139.94<0.0001significant
B-GO30.3130.311764.22<0.0001significant
AB95.9695.965585.01<0.0001significant
6.266.26364.17<0.0001significant
6.386.38371.44<0.0001significant
Residual0.12030.0172
Lack of Fit0.07780.02592.440.2039not significant
Pure Error0.04240.0106
28-day Flexural Strength (MPa)Model22.404.4831.090.0001significant
A-Fly ash4.124.1228.560.0011significant
B-GO2.812.8119.530.0031significant
AB9.349.3464.80<0.0001significant
A22.042.0414.140.0071significant
B21.951.9513.560.0078significant
Residual1.010.1441
Lack of Fit0.00690.00233.470.1304not significant
Pure Error0.00270.0007
28-day Splitting Tensile Strength (MPa)Model6.691.341452.54<0.0001significant
A-Fly ash1.291.291395.83<0.0001significant
B-GO2.582.582803.38<0.0001significant
AB1.221.221327.72<0.0001significant
0.00050.00050.50410.5006significant
0.61930.6193672.20<0.0001significant
Residual0.00640.0009
Lack of Fit0.00470.00163.660.1209not significant
Pure Error0.00170.0004
Table 9. Validation of model terms for responses.
ResponseR2Adj. R2Pred. R2SDAdeq. PreMean
Compressive strength (MPa)0.97860.96330.85380.917228.237543.51
Tensile strength (MPa)0.96630.94230.78800.118921.91032.86
Flexural strength (MPa)0.95690.92310.73870.379619.75928.63
Table 10. Criteria settings for multi- objective optimization.
Variables/ResponsesGoalLower LimitUpper Limit
Fly ash (%)In range16.6735
Graphene oxide (%)In range00.05
Temperature (°C)In range23200
Compressive strength (MPa)Maximize4555.5
Tensile strength (MPa)Maximize2.023.98
Flexural strength (MPa)Maximize5.33810.791
Publisher’s Note: MDPI stays neutral with regard to jurisdictional claims in published maps and institutional affiliations.

