Article

Shaking Table Testing of a Low-Rise Reinforced Concrete Intermediate Moment Resisting Frame

1
Department of Civil Engineering, UET Peshawar, Peshawar 25000, Khyber Pakhtunkhwa, Pakistan
2
Department of Civil Engineering, SUIT Peshawar, Peshawar 25000, Khyber Pakhtunkhwa, Pakistan
3
Department of Civil and Environmental Engineering, Stanford University, Stanford, CA 94305, USA
*
Author to whom correspondence should be addressed.
Buildings 2022, 12(12), 2104; https://doi.org/10.3390/buildings12122104
Submission received: 21 October 2022 / Revised: 28 November 2022 / Accepted: 29 November 2022 / Published: 1 December 2022
(This article belongs to the Special Issue Advanced Research and Prospect of Buildings Seismic Performance)

Abstract

:
Multi-level shaking table tests were performed on a 1:3 reduced scale two-story reinforced concrete (RC) intermediate moment resisting frame (IMRF) conforming to the requirements given in the ACI-318-19. The exterior joints lacked shear reinforcement to assess the viability of the ACI model recommended for determining the design shear strength of the beam–column joint panel. One of the horizontal components of the 1994 Northridge earthquake accelerogram (090 CDMG Station 24278, Source: PEER strong motion database) was input to the frame for multi-level shaking table testing. Plastic hinges developed in beams under base input motion with a maximum acceleration equal to 0.40 g. The exterior joints incurred extensive damage under base input motion with a maximum acceleration equal to 0.70 g. The frame achieved displacement ductility and overstrength factors (determined as the ratio of the maximum resistance of the frame to the design base share force) equal to 2.40 and 2.50, respectively. This gives a response modification factor equal to 6. The satisfactory performance of the frame is attributed to the high efficiency of the beam–column joint, which was confined by spandrel beams on two faces and the high strength of the concrete. The inherent minimal confinement is sufficient to ensure satisfactory seismic behavior. The analysis confirmed overstrength equal to 1.58 for joint shear strength in comparison to the design strength determined using the ACI model. The data might serve as a reference for calibrating and validating numerical modeling techniques for performance evaluation, which are crucial in the context of performance-based engineering.

Graphical Abstract

1. Introduction

A ductile frame exhibits reduced lateral stiffness and increased energy dissipation that tends to reduce seismic forces relative to forces that would occur in a linearly elastic frame [1,2,3]. Therefore, such a frame can be designed for the lower seismic force given in seismic code ASCE/SEI-7-22 [4]. It is achievable if frames are properly detailed to attain such ductile behaviour. Therefore, the IBC-2021 [5] relies primarily on the ACI-318-19 [6] code that lists design procedures and minimum requirements for ductile detailing. The structural frame members are intended to resist design basis earthquake motion through ductile response but without critical deterioration of strength.
The ASCE/SEI-7-22 permits the use of an intermediate moment-resisting frame (IMRF) as a lateral load-resisting system for frames assigned to the seismic design category (SDC) B and C. The code suggests it may also be permitted as part of dual systems for frames assigned to SDC D, E, and F. In the later, the IMRF is designed for a portion of a lateral load (e.g., 25% of total base shear) but intended to deform in congruence with the dual system. The SDC assigned to a frame depends on the intended use and occupancy of the building and the ground motions at the site. The IBC-2021 suggests the building should be assigned to the more severe SDC.
Based on the observations from past experimental tests performed on interior and exterior beam–column sub-assemblages [7], the ACI-318-19 recommends transverse reinforcement in beam–column joints unless the joint is restrained on all four sides by beams. The joint transverse reinforcement is intended to confine the joint concrete and preclude longitudinal column bar buckling. This requirement is relieved when the beam framing into the joint extends from the opposite face of the joint up to a length at least equal to the beam depth [8], ensuring the extending beam/column members are properly dimensioned and reinforced to provide effective restraints to the joint. This research discusses a field practice in which lateral ties are not provided in the joint panel due to installation challenges, which is common in most underdeveloped countries. This research proposes to improve the behavior of such frames by employing high-strength concrete and spandrel beams to confine joints, and to confirm this through dynamic shaking table tests. The ACI model that was used in the design is also examined for application to a similar problem for structural design and verification.
The present research confirms through a series of shake-table tests performed on a two-story IMRF that if the exterior beam–column joint is confined by appropriately detailed spandrel beams on two faces and the joint concrete has compressive strength equal to/greater than 28 MPa, the joint efficiency will improve. The frame achieved strength and toughness sufficient to resist design basis earthquake ground motions without deterioration of strength. One of the horizontal components of the 1994 Northridge earthquake accelerogram (090 CDMG Station 24278, Source: PEER strong motion database) was selected as input motion to the frame. The selected frame was tested progressively (using a single input motion linearly scaled to multiple hazard levels) until the joint capacity was fully exhausted and the frame was found to be in a near collapse state. The joint efficiency was quantified and compared with the joint shear strength obtained using the ACI model given in the ACI-318-19 to assess the efficacy of the design strength model for the considered frame.
The ACI-318-19 suggests the exterior beam–column joints of the intermediate moment-resisting frame should have transverse reinforcements that are distributed within the column height equal to the beam depth. This shear reinforcement is based on the requirements of ACI-352R [9] and intends to prevent deterioration due to shear cracking and buckling of longitudinal column reinforcement. The present research confirms through shake-table tests that such stringent requirements may be relaxed especially for low-rise intermediate moment-resisting frames when the exterior joints are confined by beams on three faces and concrete has compressive strength equal to or more than 28 MPa. The inherent minimal joint confinement is sufficient to ensure satisfactory seismic behavior.

2. Design of Selected Moment-Resisting Frame

2.1. Lateral Seismic Forces

The selected frame is a two-story one-bay moment-resisting frame (Figure 1). The preliminary member sizes chosen and material properties considered for the frame are reported in Table 1. The seismic base shear force V for the frame was computed in accordance with the equivalent lateral force procedure given in the ASCE/SEI-7-22:
V = C S W .
The value of seismic response coefficient CS depends on a number of geotechnical parameters and seismicity of the site and the type of structural system used to resist lateral seismic forces. Table 2 reports the values considered for the selected frame. The value of CS was determined in accordance with the procedure given in the ASCE/SEI-7-22 (12.8.1.1). The response modification coefficient R needs attention, as this accounts for reduction of the design spectral response acceleration for ductile frames capable of dissipating seismic energy through inelastic deformation in the hinging regions of members. The ASCE/SEI-7-22 recommends taking R = 5.0 for an intermediate moment-resisting frame. Moreover, the selected frame was assigned to SDC C and earthquake importance factor Ie was taken as equal to 1.25. The Rayleigh method and eigenvalue analysis of the elastic frame model provide accurate estimates of the fundamental vibration period of frames [10]; however, the fundamental vibration period of frame T = 0.42 s was computed in accordance with the empirical equation suggested in the ASCE/SEI-7-22 (12.8.2.1), which is based on the earlier work of Goel and Chopra [11,12], which provides a conservative estimate of the seismic response coefficient. The upper limit coefficient Cu was taken as 1.5 in accordance with the ASCE/SEI-7-22 for the selected design spectral response acceleration parameter. This results in a seismic response coefficient CS equal to 0.118, which was increased by 30 percent (i.e., CS = 1.3 × 0.118 ≈ 0.15) in accordance with the orthogonal seismic loads combination procedure proposed in the ASCE/SEI-7-22 (C12.5.3) based on the earlier work of Veletsos and Newmark [13]. The design base shear force V is equal to 42.42 kN. The lateral seismic forces Fx = [28 kN, 14 kN] for roof and first floor, respectively, were computed in accordance with the vertical distribution factor Cvx given in ASCE/SEI (12.8.3).

2.2. Design of Beams

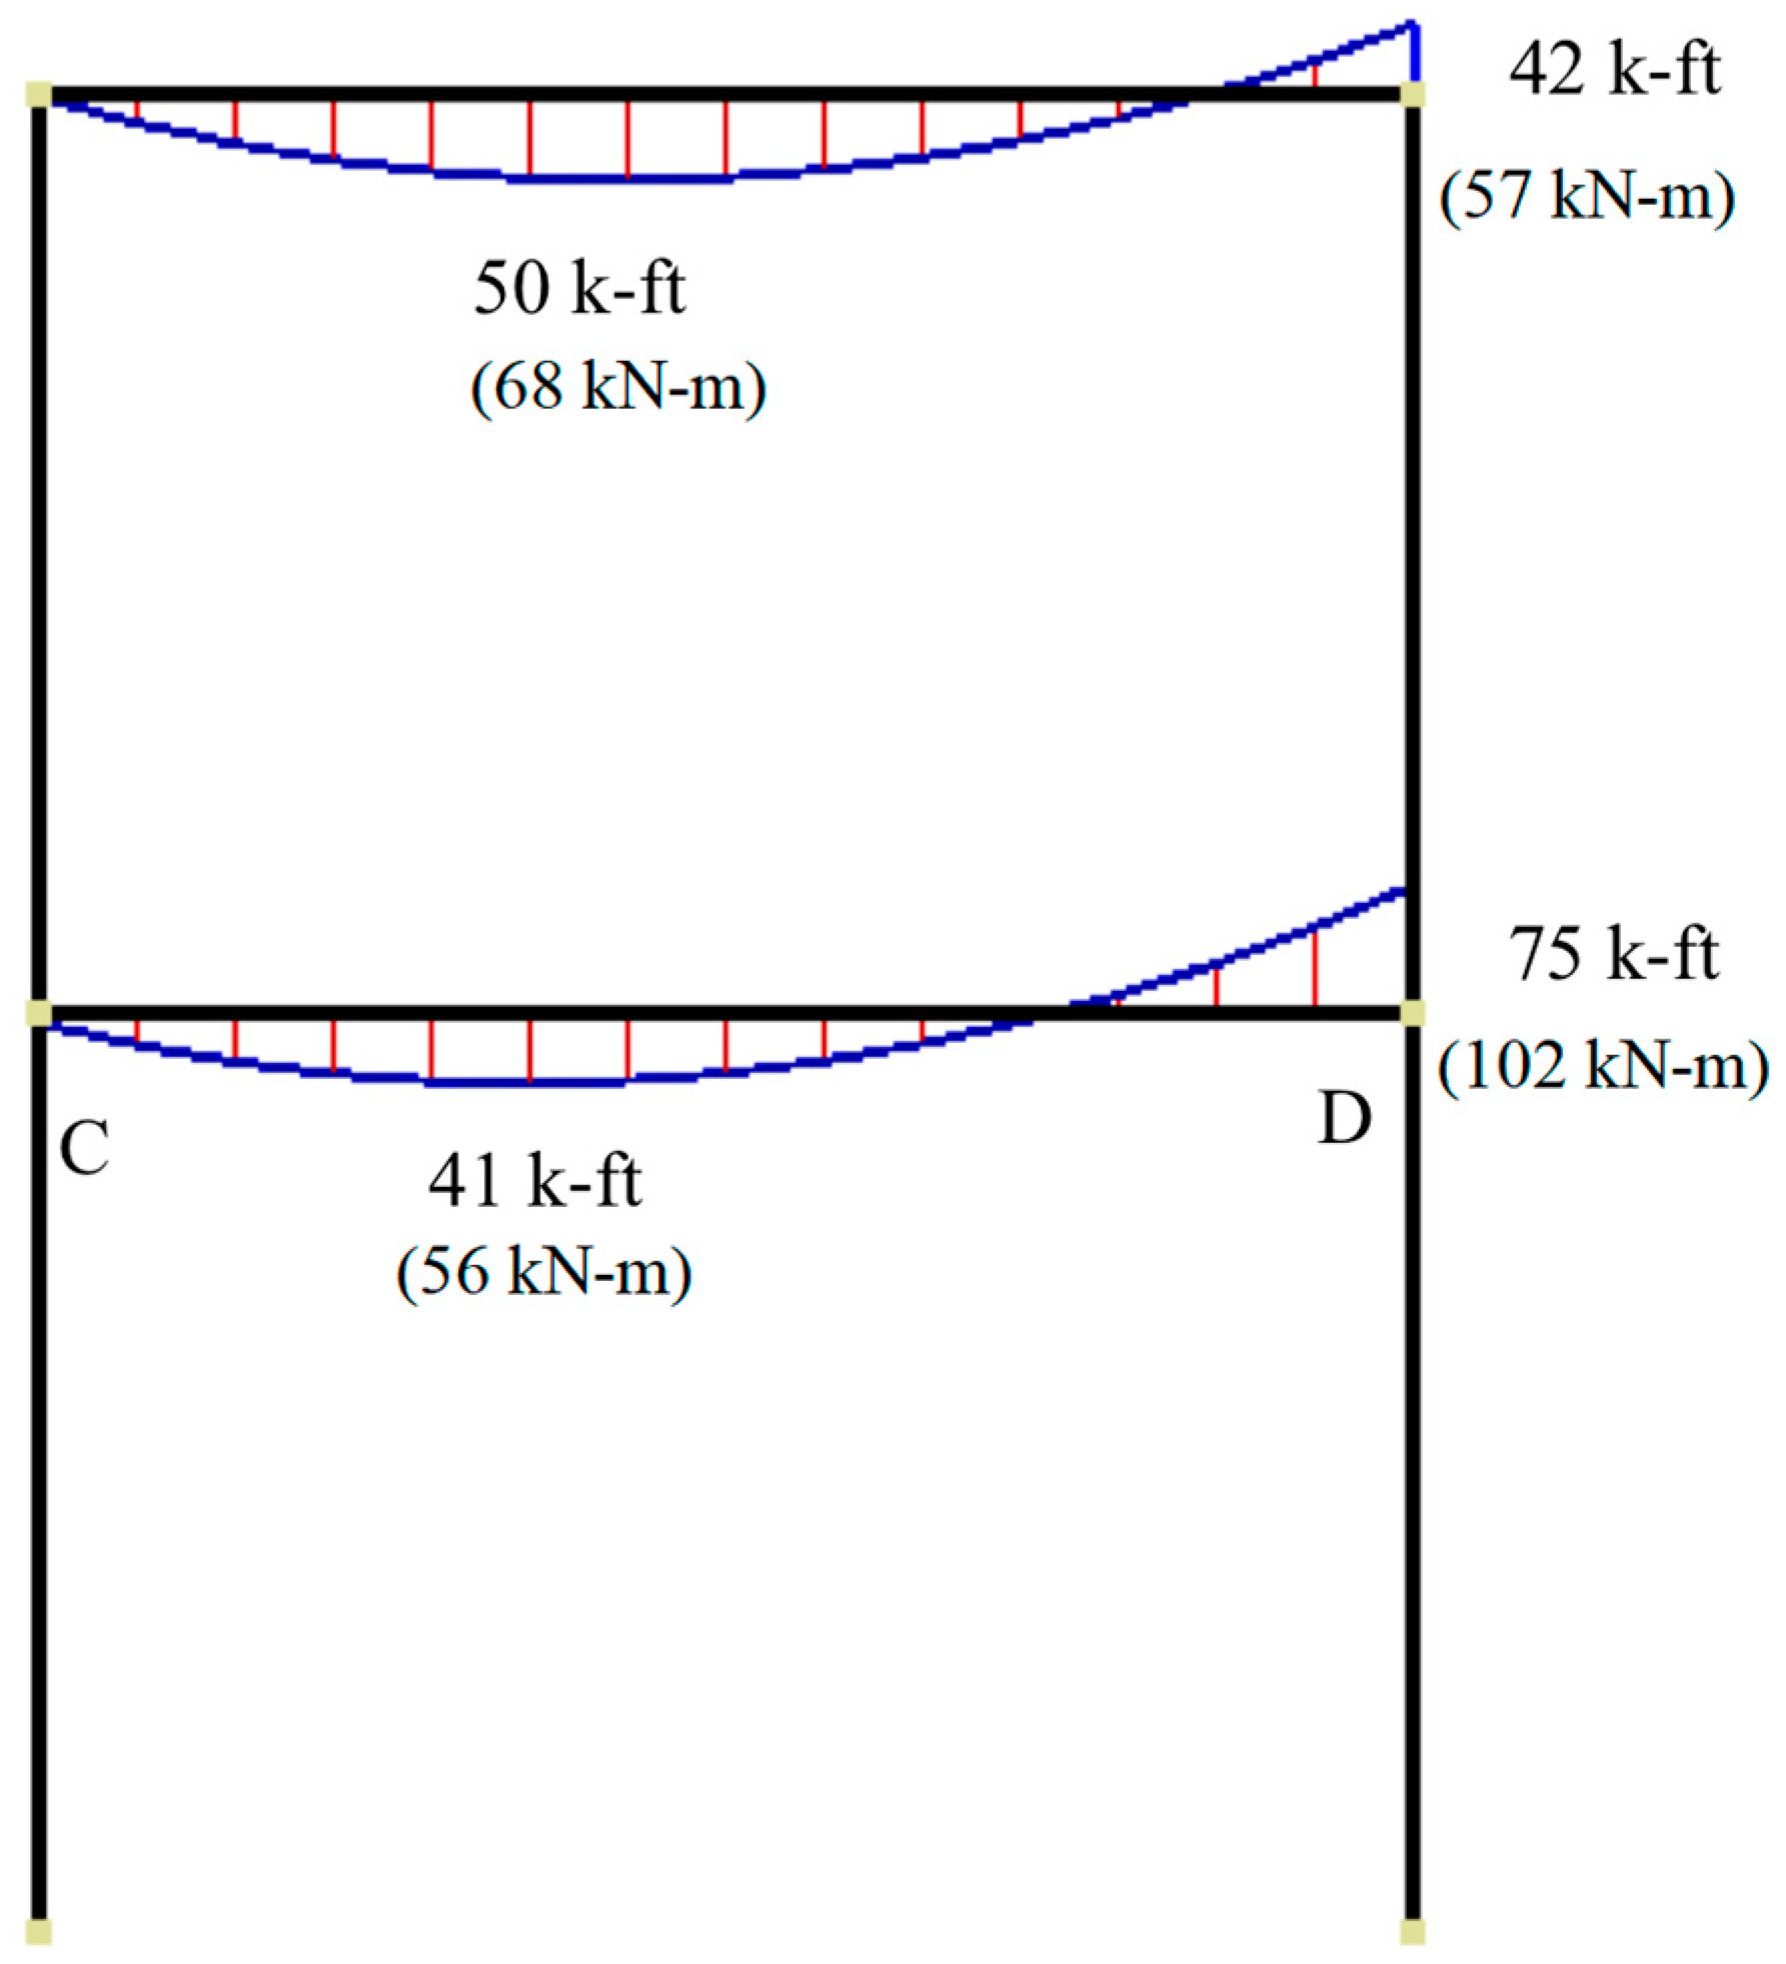
The beams were designed for flexure and shear actions in accordance with ACI-318 (18.4.2). The design of the beams was based on the demands for beam member CD, since it will be subjected to higher bending and shear actions. Figure 2 shows the factored design moment Mub for combined gravity and lateral seismic forces. Positive bending moments are plotted below the beam centroid and negative moments are plotted above the centroid. The ACI-318-19 mention the beam should have at least two continuous longitudinal bars at both top and bottom faces. For this reason, and to simplify the construction of the test frame, three longitudinal steel bars of 19 mm were selected for both top/bottom faces of the beam. The nominal moment strength Mnb of the selected doubly reinforced beam section was calculated through an iterative procedure as described by Wight [14]. For the properties of the material given in Table 1, a value of Mnb = 133 kN·m and the reduced nominal moment strength ϕMnb equal to 120 kN·m were determined. The demand-to-capacity ratio of the selected beam is 0.85 which gives a flexural overstrength equal to 1.17. This indicates the appropriateness of the selected tension reinforcement for the top face of the beam. Under lateral seismic load reversal, the reinforcement in the bottom face of the beam will develop similar flexural strength in tension.
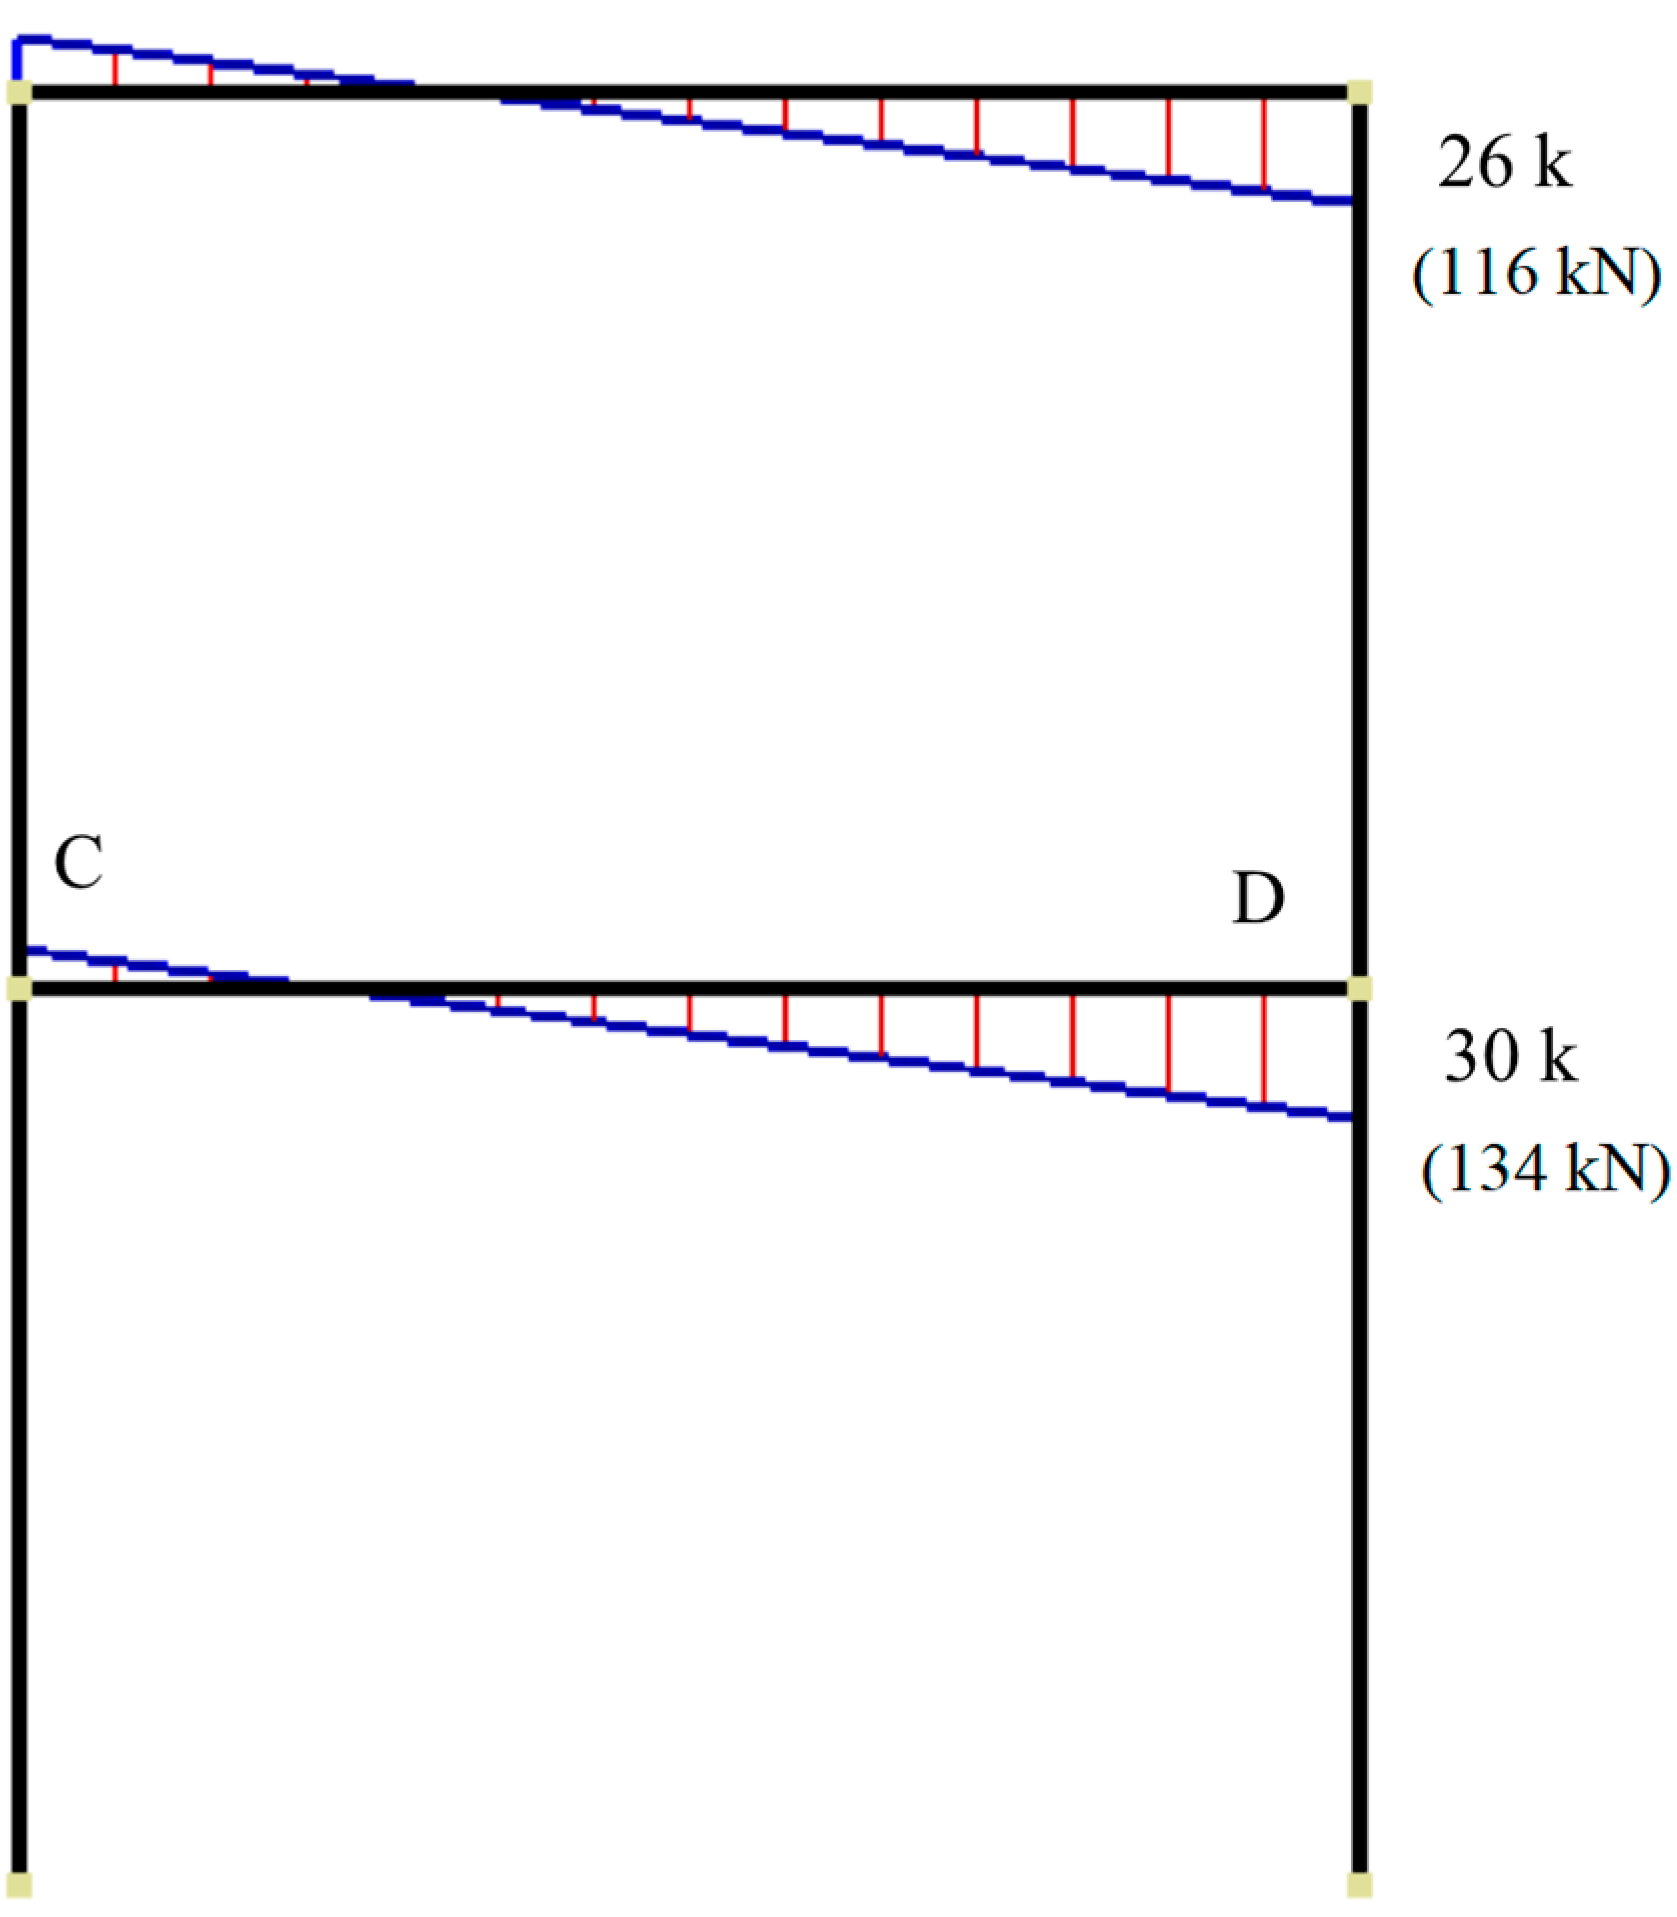
The factored shear force was computed in accordance with the ACI-318-19 (18.4.2.3) which suggests two procedures for determining shear: a) based on the free body diagram and assuming that nominal moment strengths (taking ϕ = 1) are developed at both ends of the beam, and (b) analyzing the frame for lateral seismic forces including the earthquake effects doubled, i.e., 2E. For the present case, procedure (a) gives value 7% higher than procedure (b). Figure 3 shows the considered factored design shear Vub for combined gravity and lateral seismic forces.
The nominal shear strength Vnb was calculated in accordance with the ACI-318-19 (22.5.1) for one-way shear. In comparison with the classical model for the shear strength of concrete Vcb [15], the updated models now include the effects of member depth and the longitudinal reinforcement ratio on shear strength [16,17]. This is due to the fact that the beams with increased depth and reduced area of longitudinal reinforcement exhibit lower shear stress at failure [18,19,20,21]. The updated model gives a value equal to 48.26 kN for reduced nominal shear strength of concrete ϕVcb. This is 31% less than the previous simple model [16]. The shear reinforcement was computed in accordance with the ACI-318-19 (22.5.8.5.3). In present case, 9.53 mm double-leg stirrups were used as shear reinforcement, taking the longitudinal spacing s of the shear reinforcement as equal to 76 mm. The demand-to-capacity ratio computed for shear reinforcement is 0.55. The section still maintains a demand-to-capacity ratio equal to 0.72, even if the concrete component is ignored. This gives shear overstrength equal to 1.40. Moreover, the appropriateness of the selected cross-sectional dimensions was also checked in accordance with the ACI-318-19 (22.5.1.2), which gives a demand-to-capacity ratio of 0.42, indicating the efficacy of the selected sizes of beam cross-sections. The designed shear reinforcement also conforms to the provisions of the ACI-318-19 (18.4.2.4).

2.3. Design of Columns

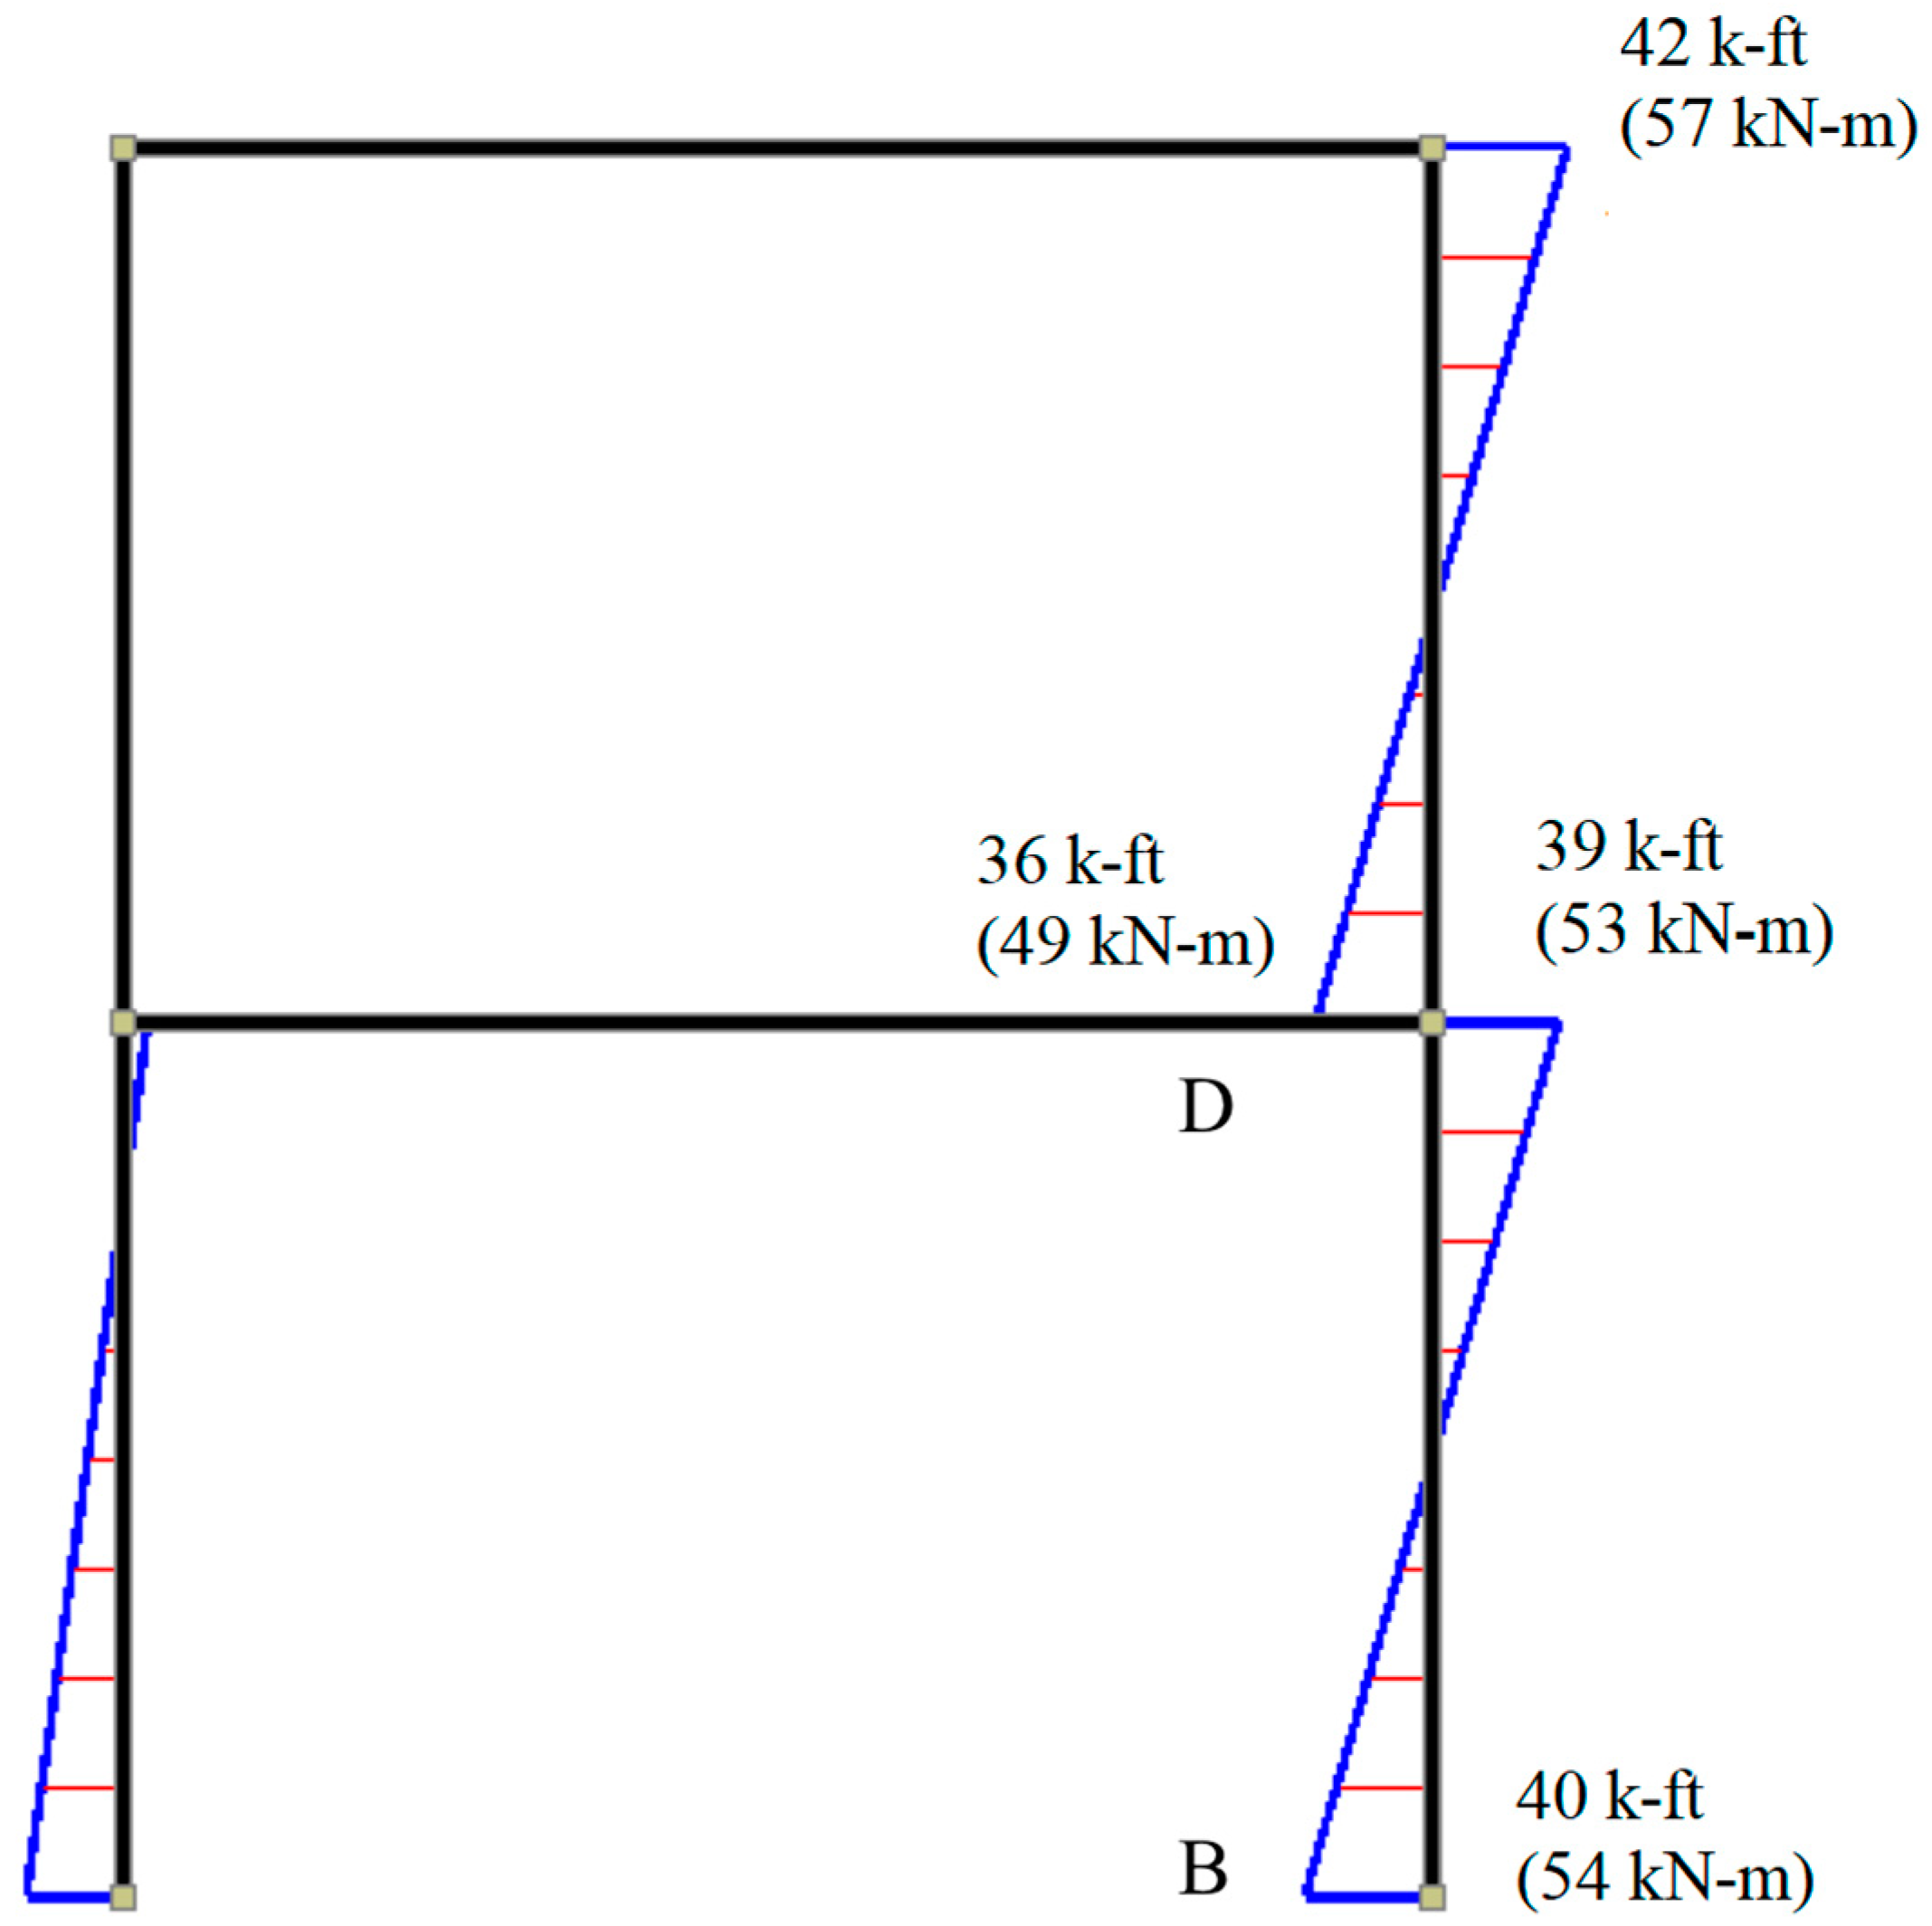
The beams of the frame are designed as yielding members while columns and beam–column joints are capacity-protected through appropriate dimensions and detailing. This is intended to ensure a strong-column and weak-beam lateral load-resisting frame for seismic energy dissipation without compromising the stability of the frame [22]. However, the additional requirement of the ACI-318-19 (18.7.3.2) that recommends flexural strengths of the special moment resisting columns should satisfy the criteria M n c 6 / 5 M n b is compromised for intermediate moment-resisting frames; the factor (6/5) is equal to 1. Therefore, factored moments Muc for columns were computed for the combined gravity and lateral seismic forces (Figure 4). The design of the columns was based on the member BD, since ground story columns are subjected to higher combined actions (moment, axial, shear, and story-drift). The column design moments were further increased to take into account the flexural overstrength of the beam (i.e., 1.17). Values of 64 kN·m and 196 kN were obtained for design moment Muc and the corresponding axial force Puc, respectively.
The selected columns were assumed as having eight 19 mm longitudinal bars. Likewise, the nominal moment strength Mnc of the selected column section was calculated through an iterative procedure as described by Wight [14]. For the properties of the material given in Table 1, values of Mnc = 81 kN·m and the reduced nominal moment strength ϕMnc equal to 73 kN·m were determined for the tension-controlled section with pre-compression Puc. The demand-to-capacity ratio of the selected column is 0.87 which gives a flexural overstrength equal to 1.15. This indicates the appropriateness of the selected reinforcement for the column section.
The factored shear force for the column was computed in accordance with the ACI-318-19 (18.4.3.1) which suggests procedures given in the ACI-318-19 (18.4.2.3) for beam shear. However, the earthquake effect E is increased by an overstrength factor Ωo equal to 3.0. Figure 5 shows the factored design shear force for columns. Likewise, the nominal shear strength Vnc was calculated in accordance with the ACI-318-19 (22.5.1). Similarly, 9.53 mm double-leg stirrups were used as shear reinforcement of columns taking the longitudinal spacing s equal to 76 mm. The demand-to-capacity ratio computed for shear reinforcement is equal to 0.33, and it is equal to 0.40 if the concrete component is ignored. This gives shear overstrength equal to 2.50 and confirms the appropriateness of the selected shear reinforcement.

2.4. Design of Beam–column Joints

The beam–column joints of the test frame were confined on all three faces: a main beam resisting in-plane loads and two transverse beams of similar sizes and reinforcement. The design of joint C is discussed. The joint shear Vu,joint was computed in accordance with the ACI-318-19 (18.4.4.7.1). This requires horizontal shear force on a plane at mid-height of the joint Vu,joint to be calculated using Equations (2) and (3), as described by Wight [14]:
V u , j o i n t = T p r V c o l
T p r = α A S f y .
Moreover, the ACI-318-19 suggests using tensile and compressive beam forces and column shear consistent with beam nominal moment strength Mnb. Therefore, parameter α is equal to 1.0. The tensile force Tpr is equal to 356 kN. For Mnb = 9133 kN-m, Vcol is equal to 311 kN. The nominal joint shear strength Vn,joint was computed in accordance with the ACI-318-19 (18.8.4.3) using Equation (4):
V n , j o i n t = 15 λ f c A j .
The modification factor λ is equal to 1.0 for normal concrete. The joint area Aj is taken as equal to 92,903 mm2. The value of Vn,joint is found equal to 610 kN. This gives nominal joint shear strength ϕVn,joint equal to 366 kN. The demand-to-capacity ratio was found equal to 0.86, indicating joint shear overstrength equal to 1.17 for design base actions. This shows the efficacy of the considered joint laterally supported by beams on three faces and the high compressive strength of concrete. In the present research, the shake-table tests will also confirm the efficiency of the considered joint. Figure 6 shows the reinforcement details of the selected beam/column members and beam–column joint panels for test frames.

3. Shake-Table Tests on Selected Frame

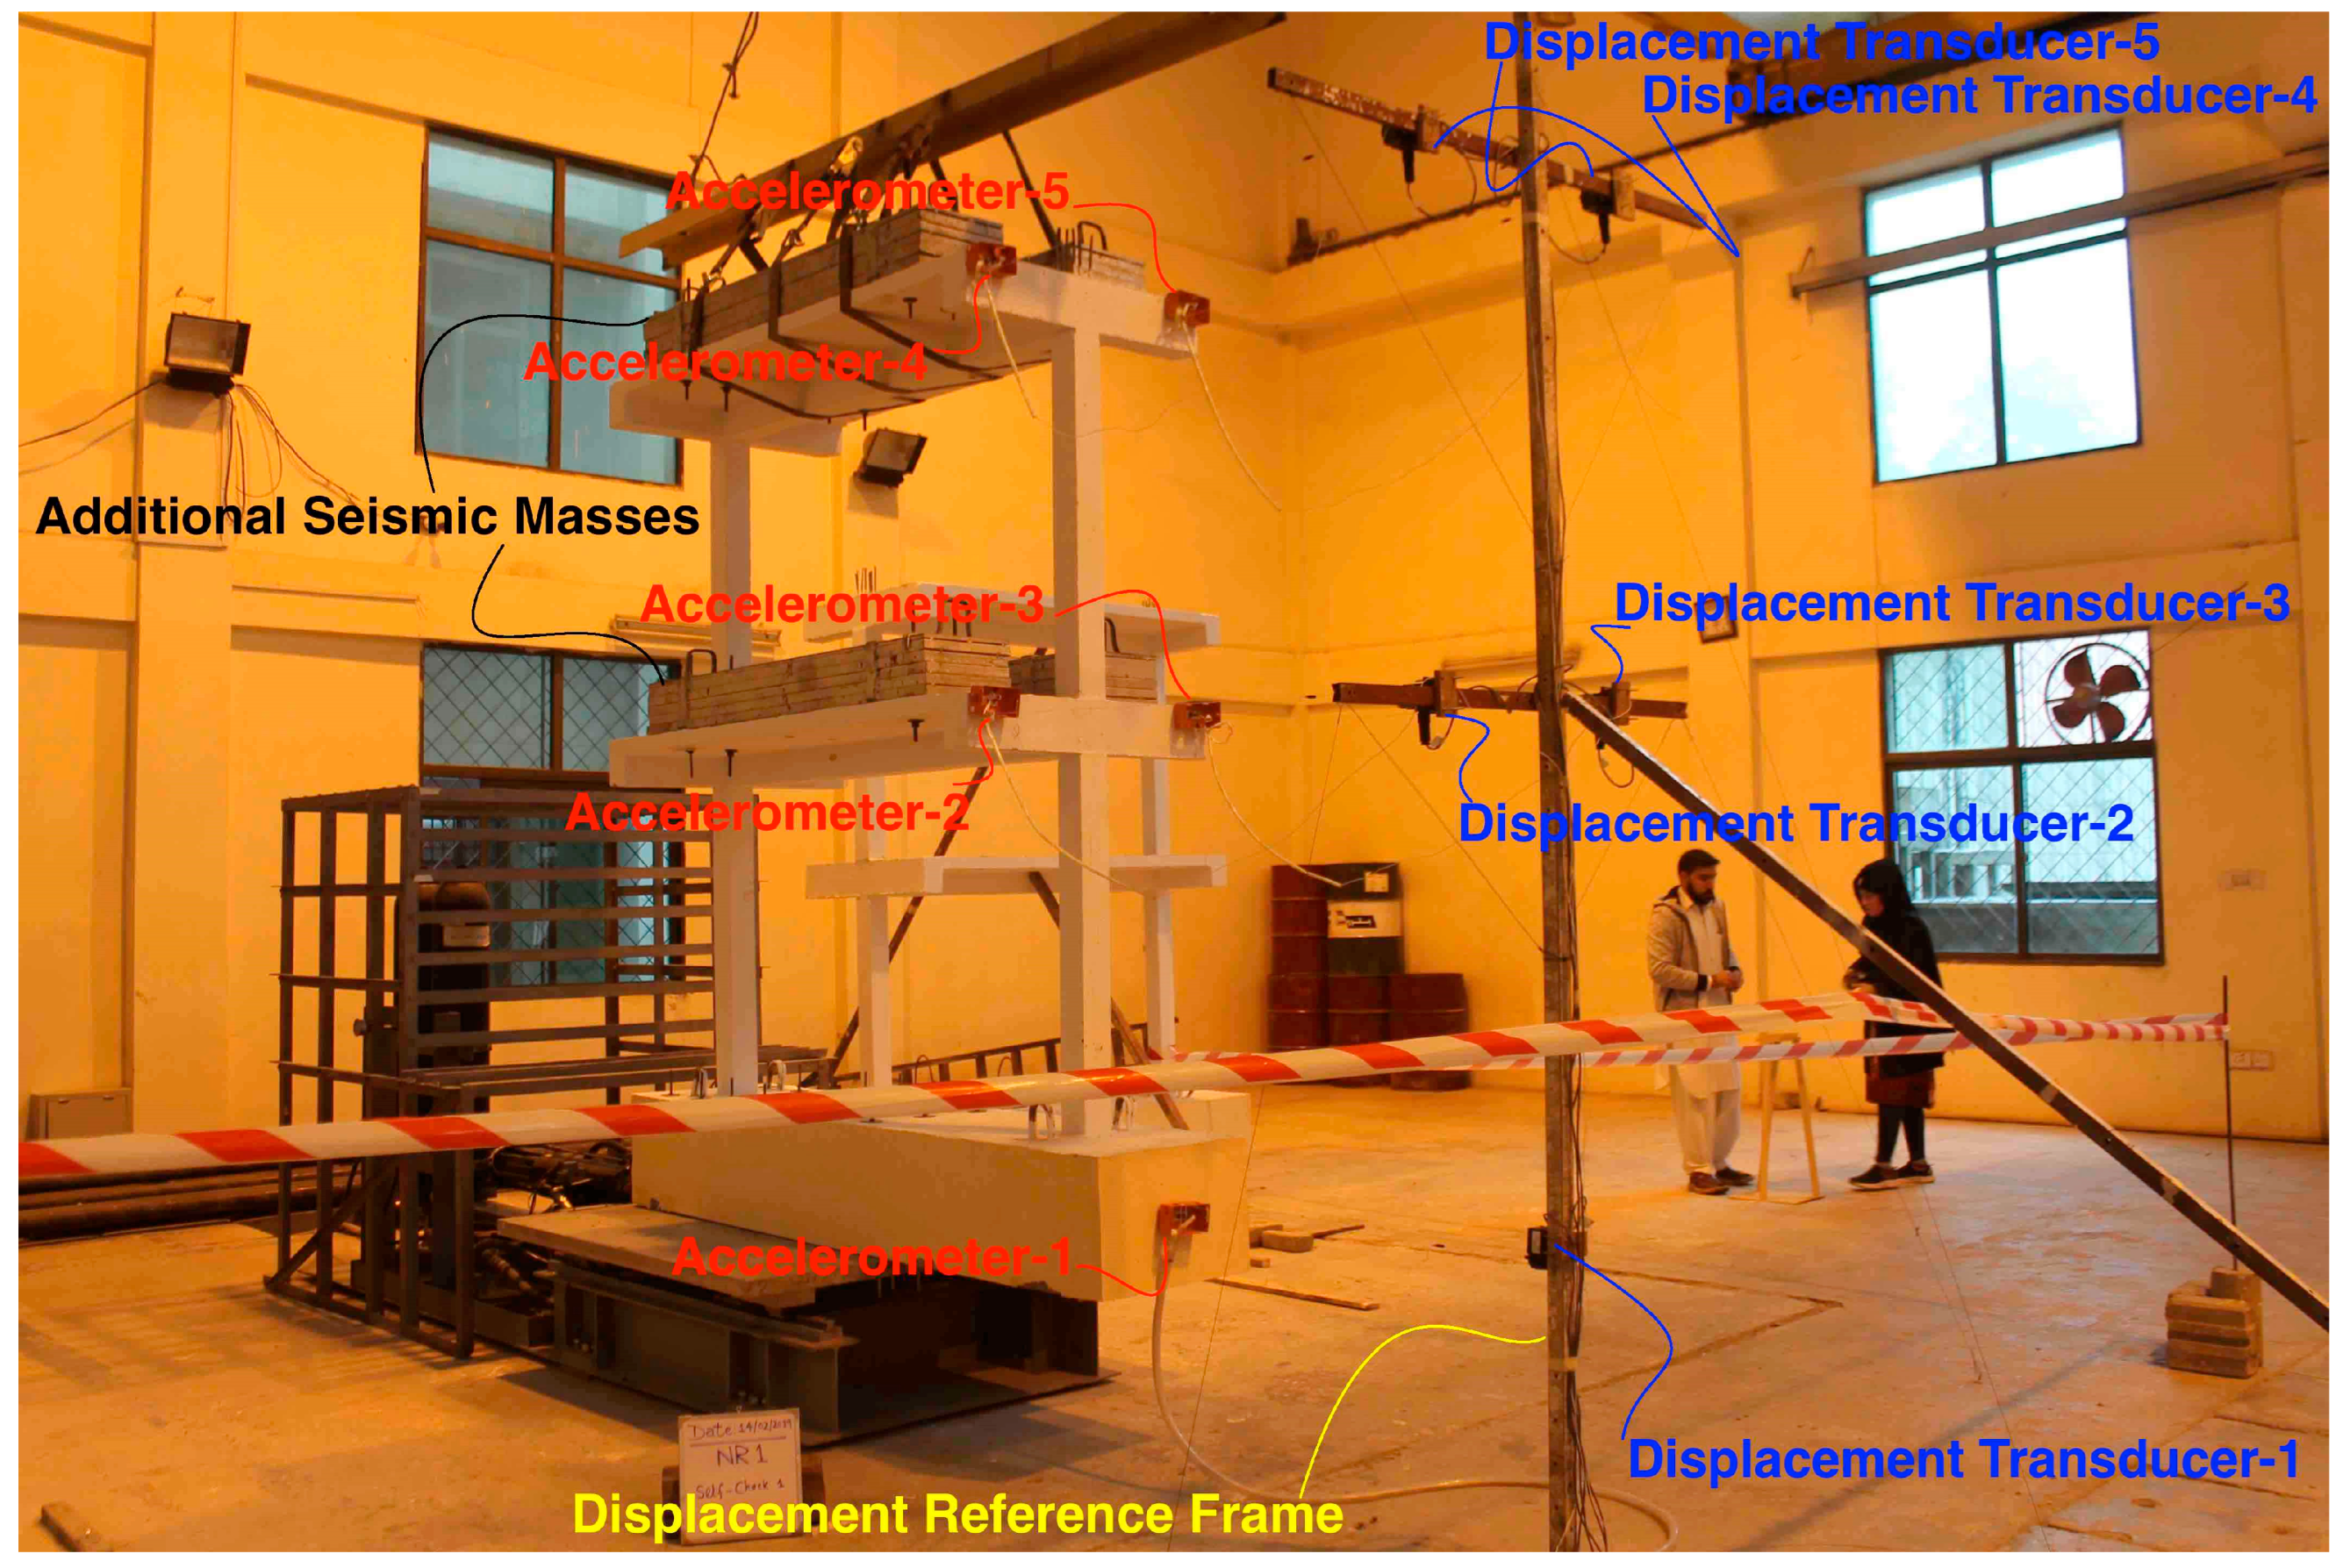
Figure 7 shows the 1:3 reduced-scale test frame prepared using the similitude requirements for a simple model. The linear dimensions of beam/column members, slab, and diameter of reinforcement were reduced by a scale factor SL = 3. The concrete used constituents in a mix proportion as 1:1.68:1.72 (cement: sand: aggregate) with water-to-cement weight equal to 0.48, in order to achieve the required compressive strength of concrete. The test frame model was also provisioned with additional floor mass Mmf in accordance with the similitude requirements for dynamic seismic analysis of the model, as described in Moncarz and Krawinkler [23]:
M r = M p M m = S L 2
M m f = M p 1 S L 2 M m 0 .
An additional floor mass equal to 5.90 kN was applied on each floor using steel blocks of 300 kg on each side of the main beam. The weights were placed outside the effective width of beam. Two displacement string pots and two accelerometers were mounted at the mid-height of the slab at each floor level on transverse beams, in order to measure response histories of floor displacements and floor accelerations. One string pot and accelerometer were also mounted at the base of the model to measure the actual input base motions.
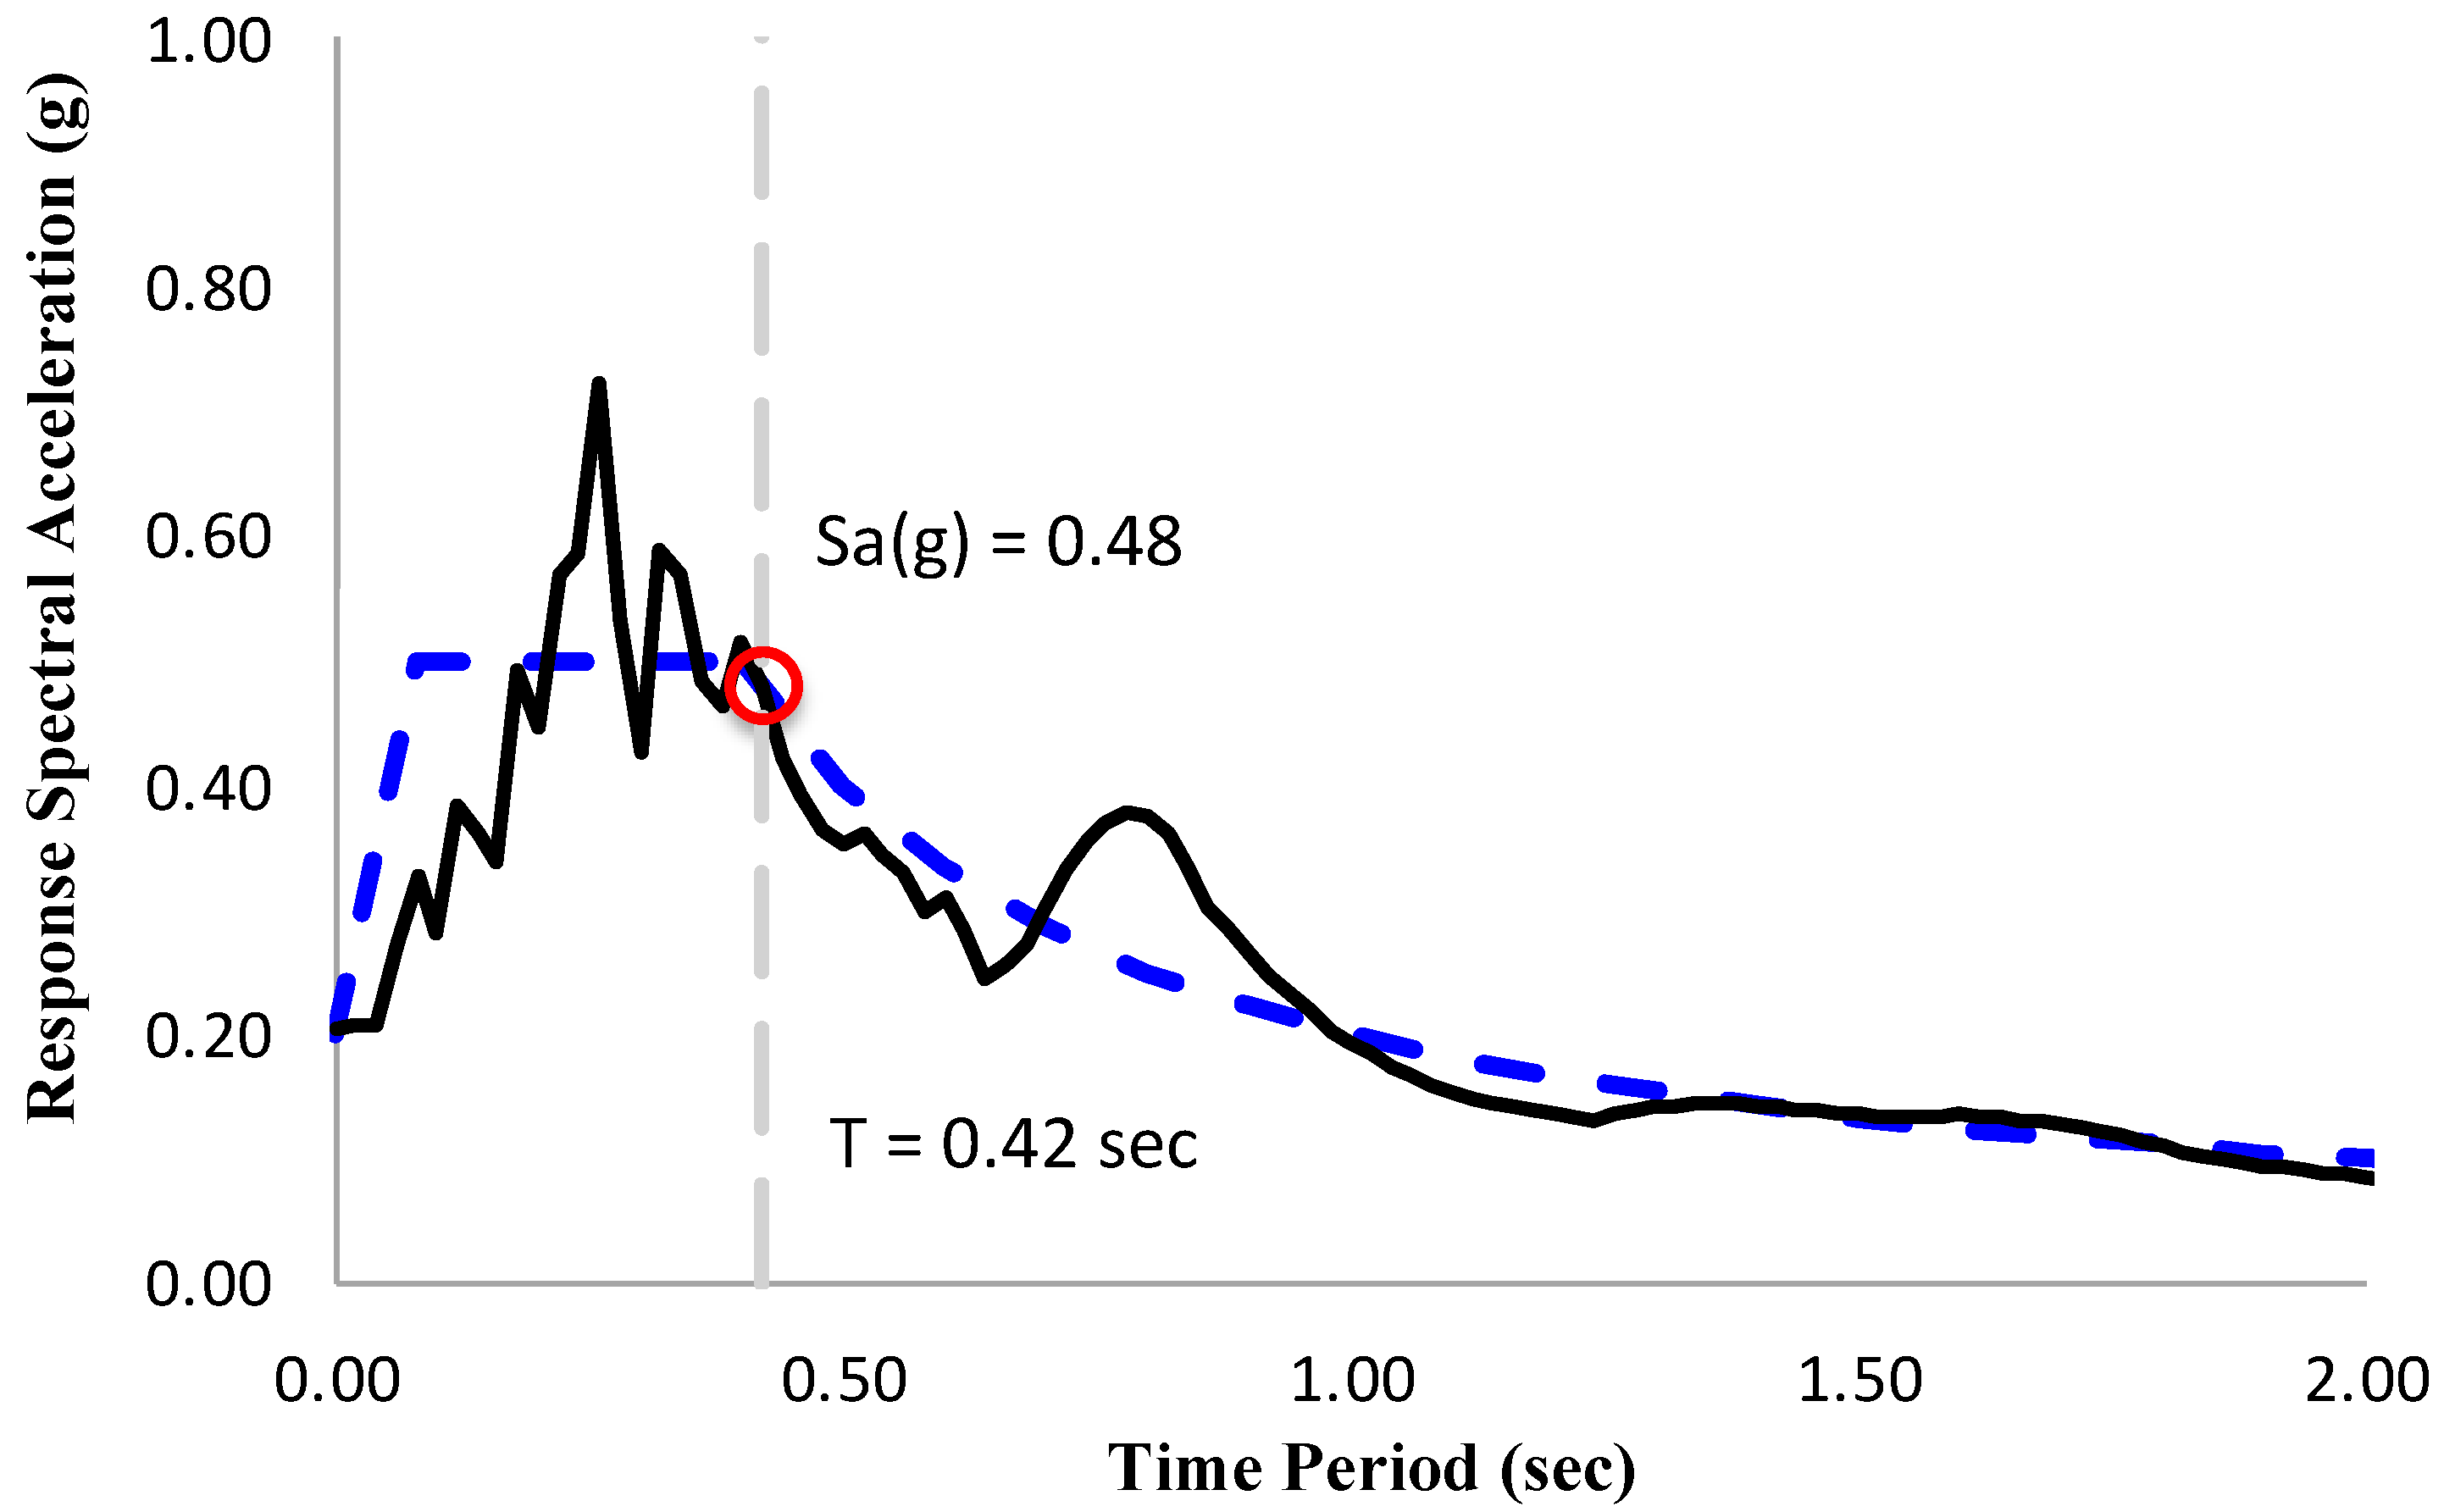
The acceleration time history of 1994 Northridge Mw 6.7 earthquake was selected for input base motion. This was recorded at the Castaic Old Ridge RT, 090 CDMG Station 24278, having the closest distance of 22.60 km to fault rupture. Figure 8 shows the design response spectrum for parameters given in Table 2 and the scaled acceleration response spectrum of the selected accelerogram. The scaling is performed by linearly matching the spectral accelerations of accelerogram and the design spectrum at the fundamental time period of frame (T = 0.42 s). Moreover, the accelerogram was time-compressed by a factor of SL1/2 = 31/2 to satisfy the similitude requirement [24] for the base input motion of 1:3 reduced scale test frame.
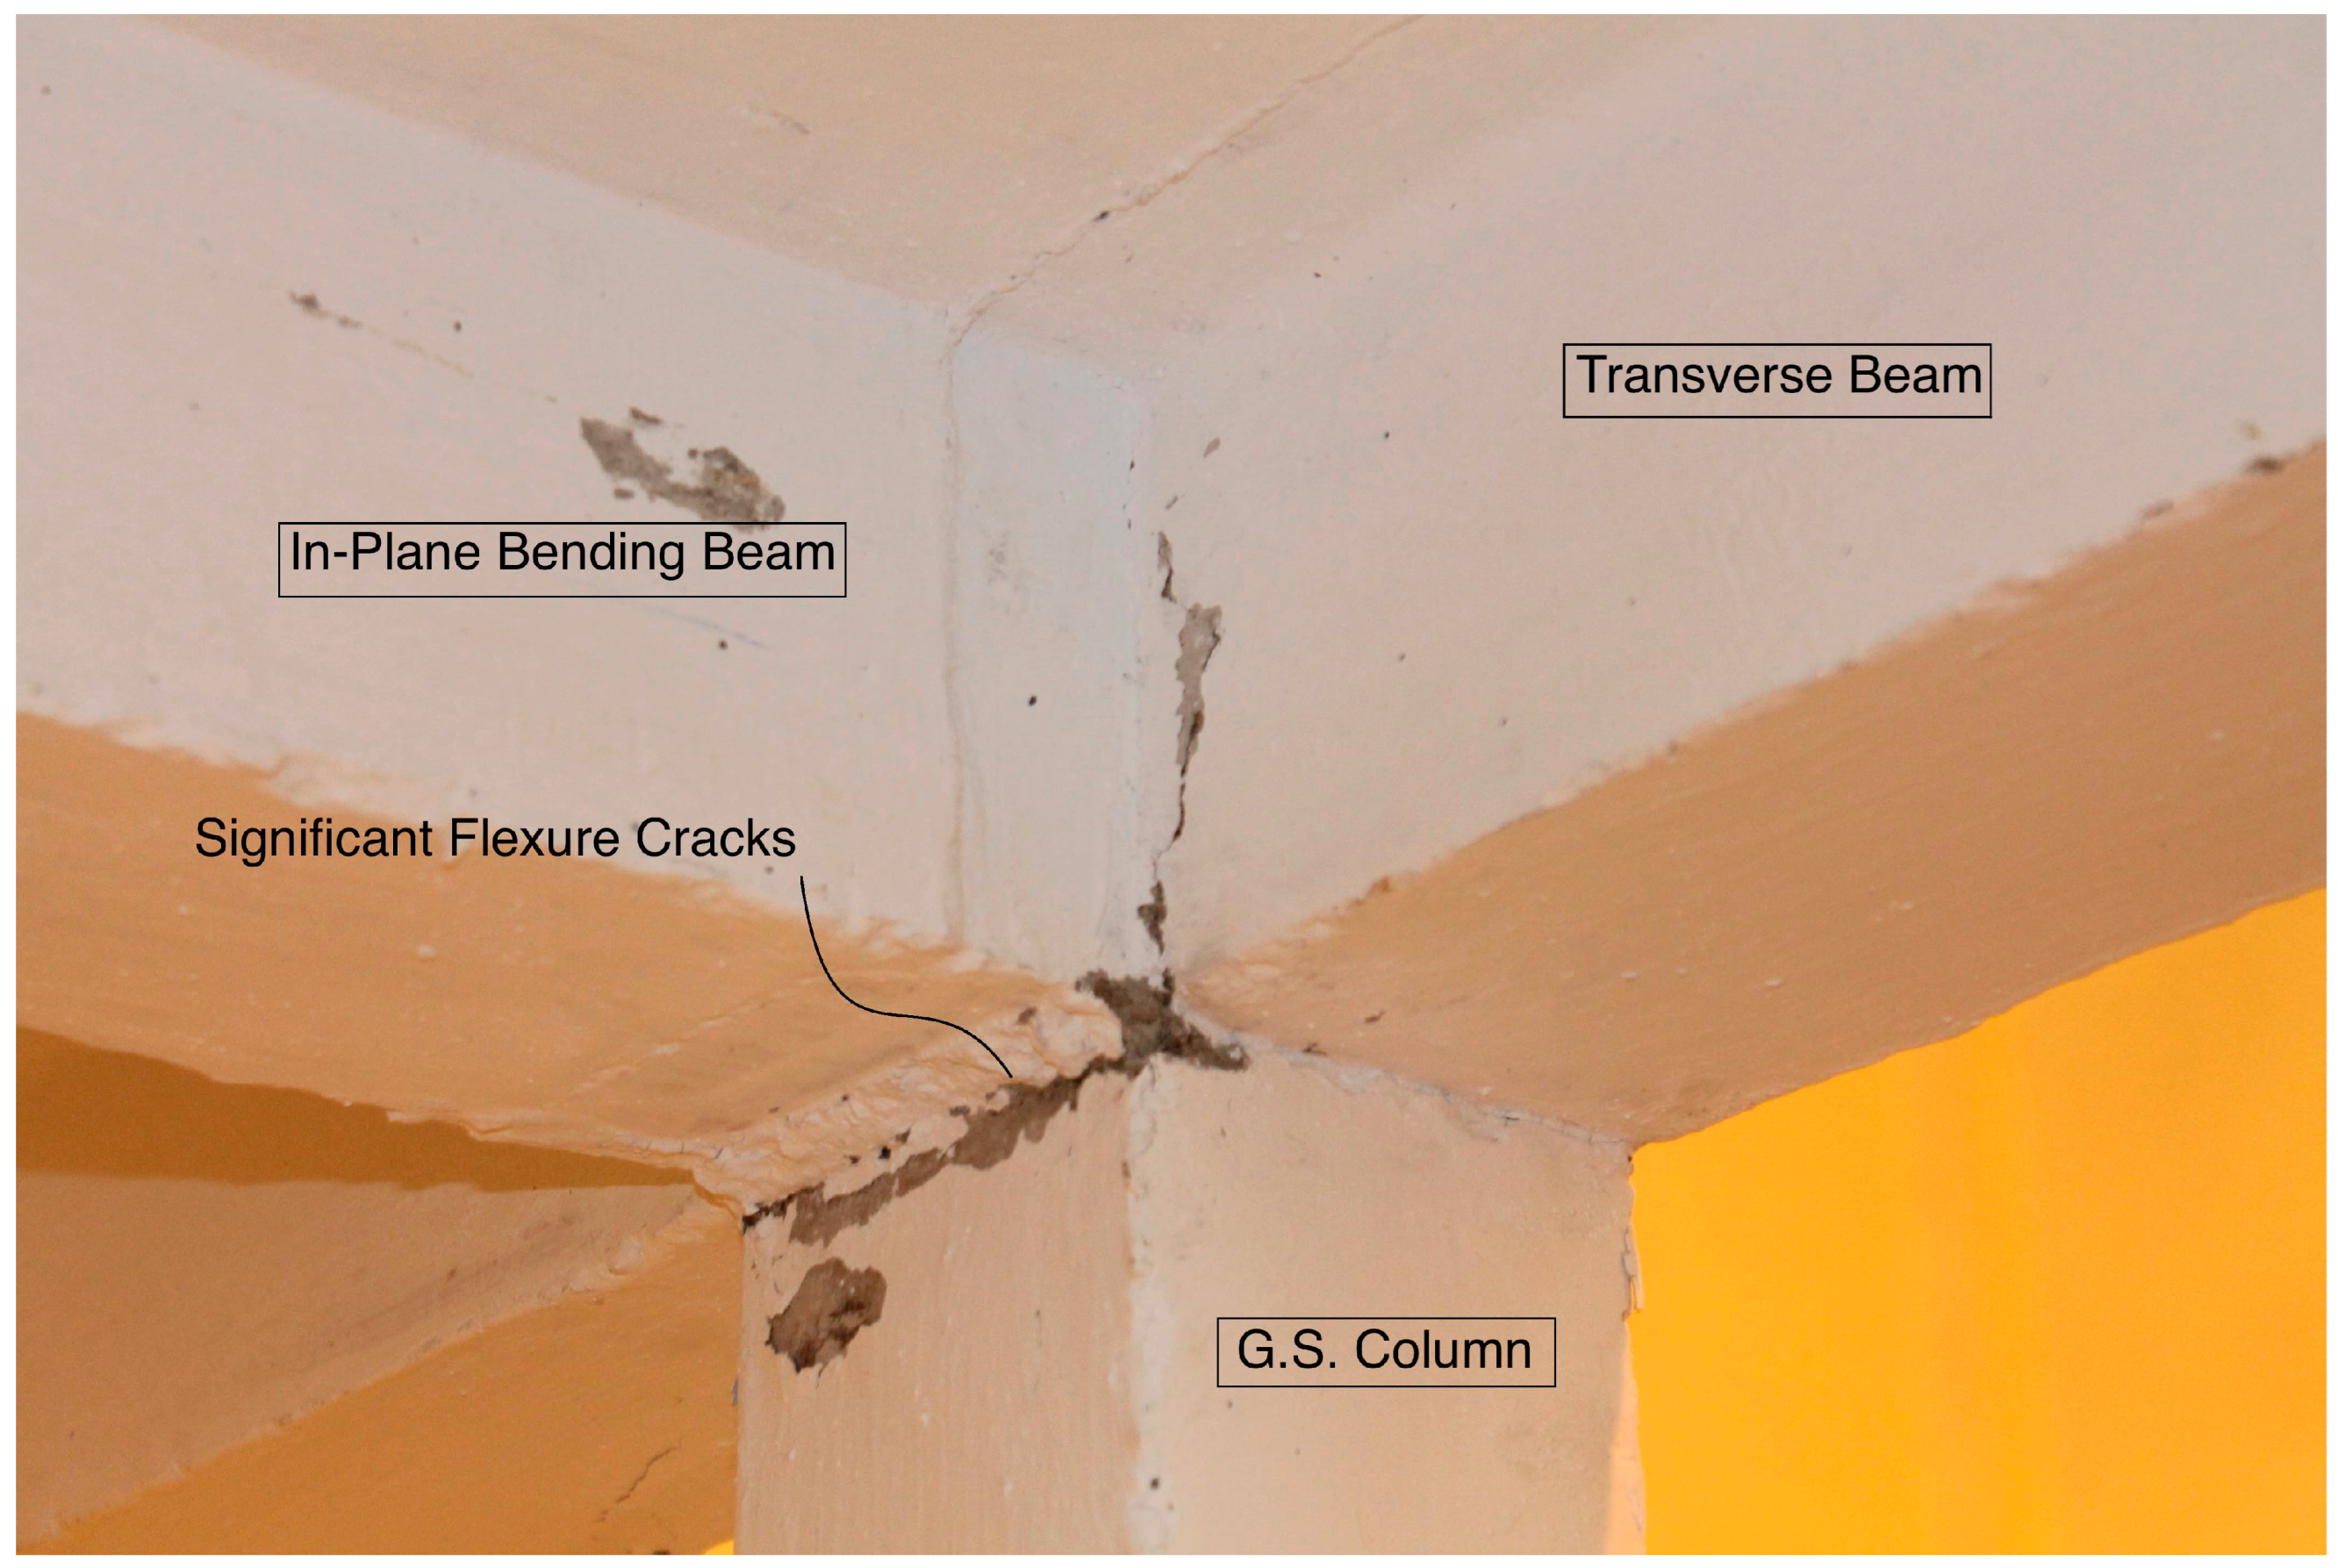
Table 3 reports the values of measured sustained maximum accelerations (the value of the acceleration which is reached or exceeded at least three times) at the base of models for a series of test runs. The observed damages in each test are also reported in Table 3 and shown in Figure 9, Figure 10 and Figure 11. The test frame exhibited horizontal and vertical flexural cracks at the beam–joint interface, which were aggravated with the increasing amplitude of base motions. The beam–column joint panels incurred extensive damages under base motions with a sustained maximum acceleration equal to 0.70 g.

4. Seismic Design Factors for Selected Frame

4.1. Overstrength Factor

The beam/column members of the selected frame were designed with capacities greater than the design forces. It is most likely the actual material strength is higher than the nominal strength specified in the design. Moreover, the test frame also comprised the slab that acts monolithically with the beam. These sources are likely to increase the actual maximum lateral strength (Vmax) of the frame in comparison to the design lateral strength (V). The ratio of the Vmax to V is referred to as the overstrength factor Ωo. The ASCE/SEI-7-22 suggests Ωo equal to 3 for IMRF.
The measured response histories of floor accelerations and displacements for all test runs were processed to compute the relative displacement of the roof and the corresponding base shear force for the prototype of the test frame. The first three runs were analyzed to develop a force-displacement capacity curve for the prototype of the tested frame (Figure 12). The capacity curve exhibits a hardening response in the post-yield state. The ASCE/SEI 7-22(12.12) suggests the allowable story drift of 0.020 hsx for the selected frame that was considered as the maximum drift for computing the peak base shear force. A value equal to 106 kN is obtained. This gives an overstrength factor equal to 2.50, which is 20% less than the value suggested by the ASCE/SEI-7-22 for the selected frame.
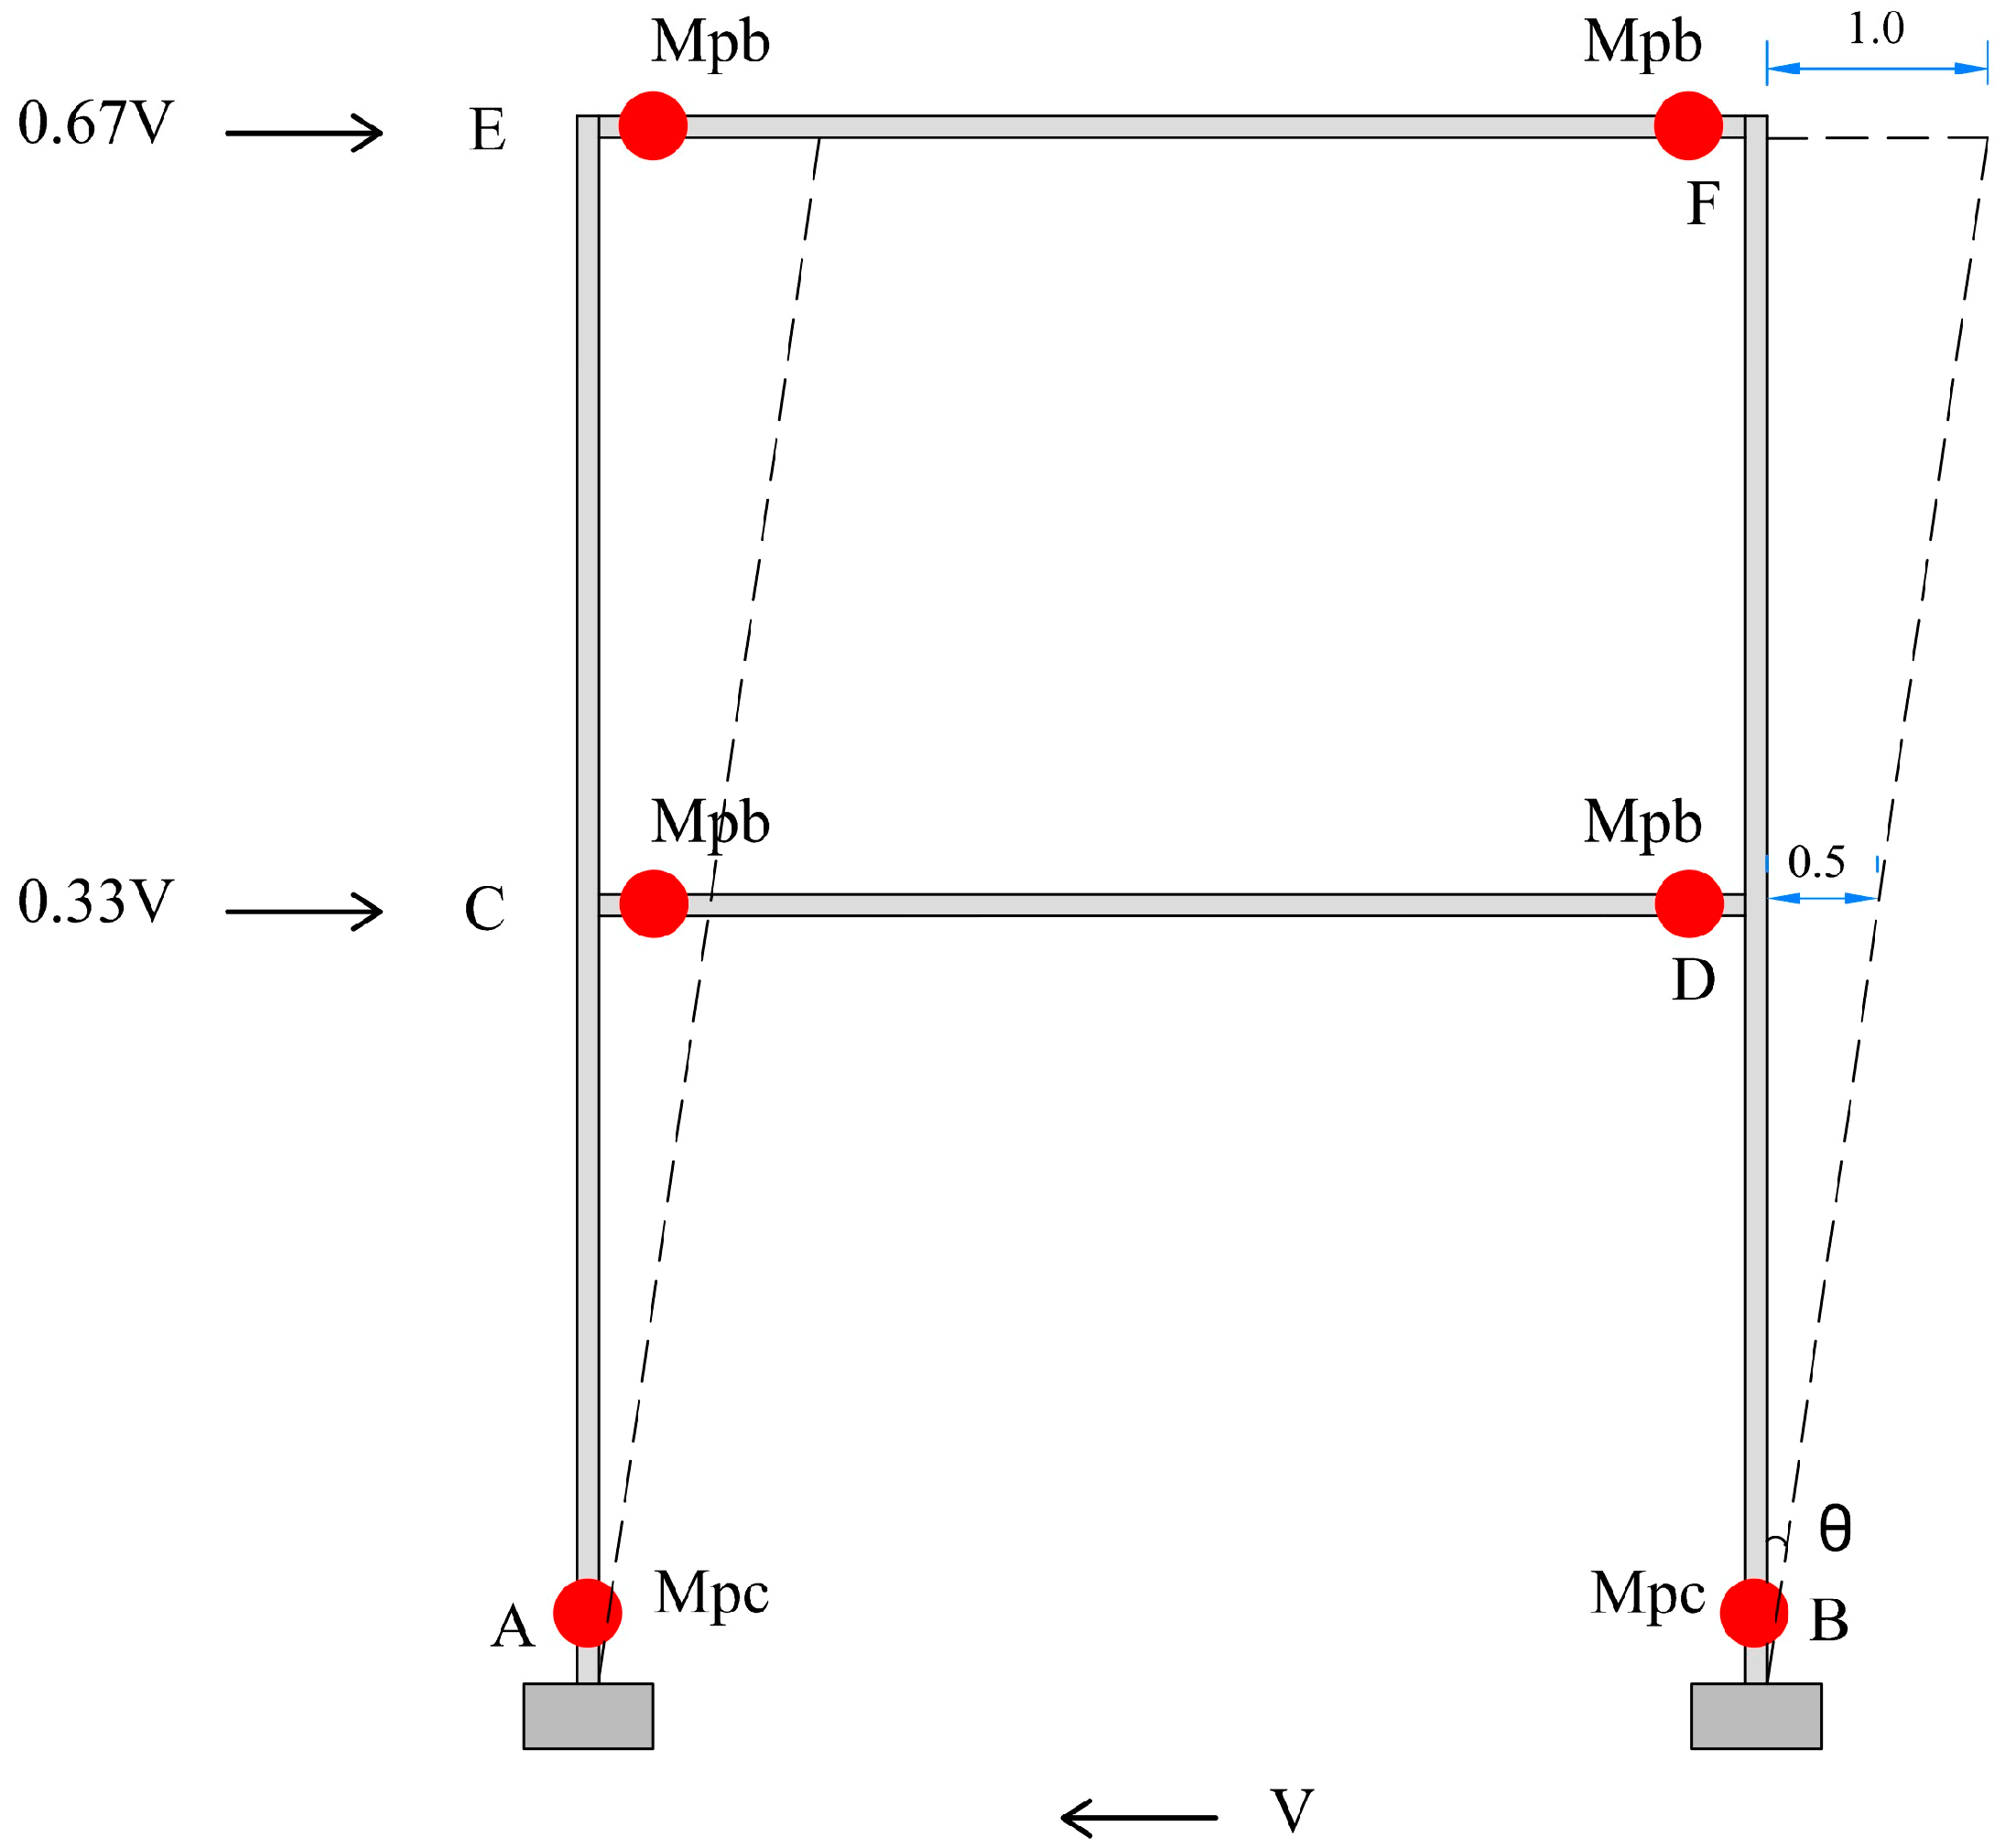
Figure 13 shows the considered plastic mechanism of the selected frame for the analytical prediction of peak base shear force. The virtual work method was used to compute Vmax using Equations (7) and (8):
W v e = W v i
0.835 V max = θ 4 M p b + 2 M p c
For Mpb = 133 kN·m, Mpc = 81 kN·m, θ = 1/24 rad (1/7.315 rad) and Vmax equal to 113.62 kN is obtained. This gives an overstrength factor equal to 2.68, which is approximately 11% less than the value suggested by the ASCE/SEI-7-22 and 7.20% higher than the value obtained using the experimental force-displacement curve. This confirms the efficacy of the simplified analytical method for computing the peak base shear force at the maximum permissible drift.

4.2. Ductility Factor

The ductility factor of a frame is a measure of its global nonlinear response, which is related to the global displacement ductility of the frame [25]. The global effective yield displacement y was obtained using the FEMA-P695 procedure [26]. Considering the allowable story drift of 0.020 hsx as the maximum permissible drift, the displacement ductility ratio μ was found equal to 2.40 (μ = max/y ≈ 2.40). The bi-linearized capacity curve gives a yield vibration period Ty of frame equal to 0.72 s for the first mode of vibration assuming linear deflected shape, which is greater than 0.50 s. Thus, the ductility factor Rμ is taken as equal to the displacement ductility ratio, i.e., = μ = 2.40 in accordance with the suggestion of Newmark and Hall [25].
Alternatively, the effective yield displacement was computed in accordance with the suggestion of Priestley et al. [27] in order to assess the efficacy of the simplified analytical prediction. The yield drift of a story for the reinforced concrete frame is computed using Equation (9):
θ y = 0.5 ε y L b h b .
For εy = 0.0021, Lb = 5486 mm and hb = 457 mm, the yield drift is equal to 1.24. It is sufficiently accurate to approximate the global effective yield drift of the frame equal to story drift for a linear deflected frame shape under lateral seismic forces. This gives a displacement ductility ratio equal to 1.61, which is 33% less than the ductility ratio obtained based on the experimental global nonlinear response curve. This significant difference is due to the fact that the analytical model given in Equation (9) is based on the response of beam–column connection sub-assemblages that did not include the slab. Nevertheless, this analytical model is conservative for design purposes.

4.3. Response Modification Coefficient

This factor is used to calculate the seismic response coefficient required for the determination of seismic base shear using the equivalent lateral force procedure given in the ASCE 7-16 for seismic design of frame. For a frame, the response modification coefficient R is described as the product of the overstrength factor Ωo and the ductility factor Rμ, i.e., R = Ωo × Rμ. The experimental data gives R equal to 6.0 (R = 2.50 × 2.40 = 6.0), which is 20% higher than the value suggested in the ASCE 7-22 for the selected frame (i.e., R = 5). This increase is due to the higher ductility capacity of the tested frame.
The analytical predictions based on the virtual work method for computation of peak base shear and the empirical formula suggested by Priestley et al. for computation of effective yield displacement gives R equal to 4.31 (R = 2.68 × 1.61 = 4.31), which is 28% less in comparison to the R factor obtained using the experimental data. The analytically computed R factor (i.e., 4.31) is approximately 14% less than the value suggested in the ASCE 7-22. This confirms that simplified analytical models give a conservative value for the response modification coefficient.

5. Assessment of Beam–Column Joint

5.1. Efficiency of Beam–Column Joint

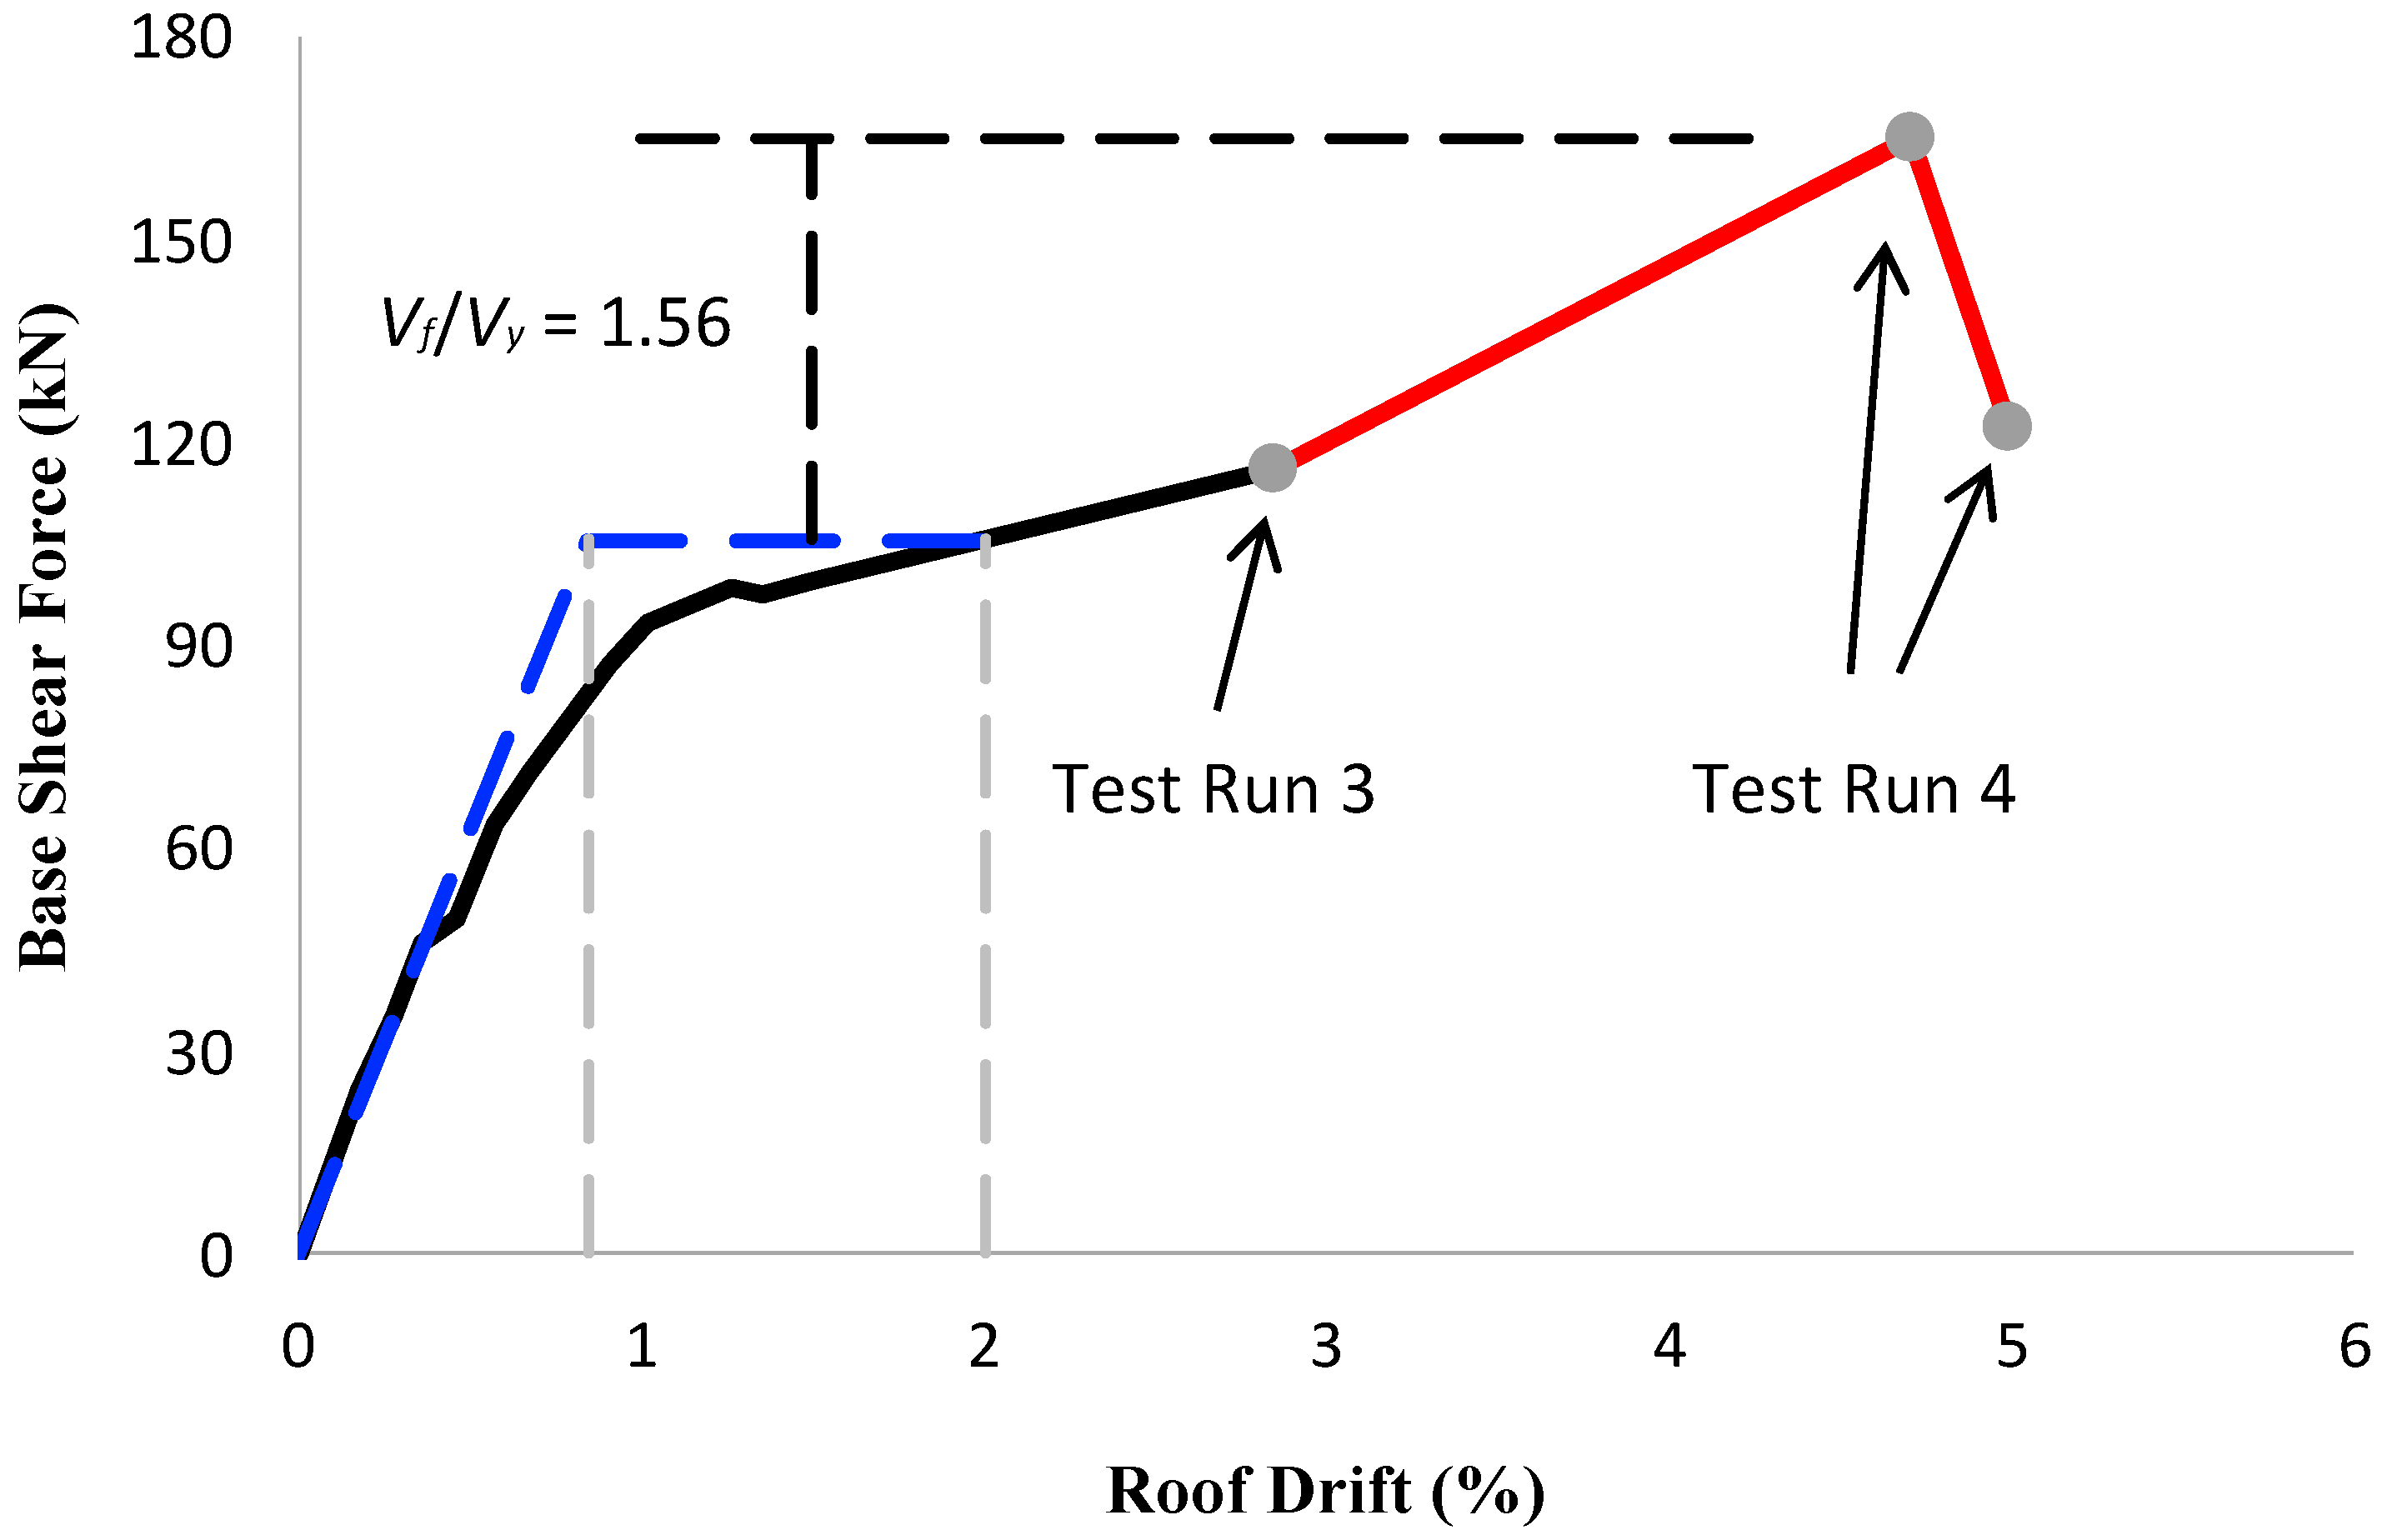
The efficiency of a joint is the measure of its reserve strength. For a connection, this is computed as the ratio of the force causing the failure of the joint to the force corresponding to the moment capacity of the yielding beam entering the joint. For a global frame, the efficiency of the considered beam–column joint, which is laterally supported by beams on three faces, was determined by computing the ratio of the base shear force causing failure of the joint Vf to the base shear force (Vmax) developed at the maximum permissible drift under design base earthquake (Figure 14). The efficiency of joint is equal to 1.56 or 156%. The measured efficiency is significantly higher than the values reported for typical corner joints subjected to bending causing the opening of the joint [28,29]. This is due to the fact that the considered beam–column joint was laterally supported by beams on two faces in addition to the in-plane beam entering the joint. Moreover, the corresponding roof deflection capacity determined is equal to 4.70%, which is 135% higher than the maximum permissible drift under design base earthquake. Considering the maximum considered earthquake (MCE) ground motions equal to 3/2 times of the design base earthquake (DBE) ground motions, the measured roof drift capacity is 57% higher than the permissible drift under MCE ground motions. This confirms the sufficient reserve strength and high efficiency of the beam–column joint confined by beams on three faces (Figure 6), despite it lacks shear reinforcement.

5.2. Shear Strength of Beam–Column Joint

Joint C of the frame was analyzed for determination of joint shear strength. For test run 4, from the forces [108 kN, 54 kN] for roof and first floor, respectively, the corresponding story shear forces VS = [54 kN, 81 kN] were obtained for column CE and AC, respectively. This gives bending moments at the joint Mc = [98 kN-m, 147 kN-m] for column CE (at the base end) and column AC (at the top end), respectively. The point of contraflexure is assumed as the mid-height of the column for computing moments at the column end. The equilibrium of bending moments at the joint will require the bending moment in the beam equal to 246 kN-m. This gives flexural overstrength of beam equal to 1.85 in comparison to nominal bending moment capacity of beam. This increase is attributed to the material overstrength and slab contribution to flexural strength of beam, as suggested earlier by French and Moehle [30], and recently reported [31]. This develops a maximum tension force Tpr,max in the joint equal to 658 kN. The corresponding maximum joint shear force Vu,joint,max was found equal to 577 kN using Equation (2) and the experimentally obtained story shear and joint tensile force. This gives overstrength equal to 1.58 for joint shear strength in comparison to nominal shear strength determined in accordance with the ACI-318-19 (18.8.4.3). This confirms the efficacy of the considered beam–column joint (Figure 6) of the selected frame despite its lack of shear reinforcement. However, concrete must have a compressive strength equal to or more than 28 MPa for such satisfactory behavior.

6. Discussions

The damages observed in reinforced concrete frames reported following earthquakes [32] highlight the urgent need for seismic performance evaluations of current structures and infrastructures, as well as the development of some cost-effective upgrade strategies for future designs. To aid in joint shear transfer, current seismic standards require significant amounts of transverse reinforcement to be provided in beam–column joints of reinforced concrete frames. However, the standards do not offer the necessary information to determine the strength and deformation capacity of frames lacking transverse reinforcement in beam–column joints. Because frame constructions in developing countries are almost typically built without special joint reinforcement, there is an urgent need for viable techniques to improve seismic resistance of RC frames, particularly low-rise when the axial load on the column is less.
The use of spandrel beams to confine the beam–column joint and the use of high-strength concrete (compressive strength ≥ 28 MPa) allow for improved construction of the IMRF with weaker beam–column joints. The present ACI strength model, which is dependent on the connection’s configuration and the compressive strength of joint core concrete, served as an inspiration for the envisaged improvement strategy. This was validated for a low-rise two-story frame that was designed using the analytical force-based seismic procedure given in the code and conforms to the earthquake-resistant design concept described in the recent standards. The frame’s satisfactory seismic performance is verified through a series of dynamic shaking table tests performed on a 1:3 reduced scale frame. The results indicated that the joint shear capacity has a sufficient overstrength, which is ascribed to the geometry of the connection (joint confined on all three faces) and material overstrength.
To assist practicing engineers, simplified analytical methods are employed to determine the force-deformation response of the selected IMRF, which is critically compared to the experimental response. The formulae and procedures are judged to be promising; however, where adjustments to the formulae are required, they are emphasized. Suggestions are presented for analytical approaches to estimating available seismic force-deformation capacity. Based on the results of the experimental program, analytical approaches for analyzing frame resistance are validated, giving better predictions of performance than the ACI model.
Because the design ensured a beam-sway mechanism under the design level input motions, a caution for numerical modeling technique [33] is to consider material/section overstrength for beam/column members, as the beam provided enough hardening to cause significant damage to the joint panel at large deformation demand. The development of severe damage in the joint core confirms hardening in the joint force-deformation behavior, which is critical for joint nonlinear modeling [34].

7. Conclusions

Based on the preliminary design of the selected frame, the following conclusions are drawn:
  • The analysis of the beam indicates overstrength equal to 1.17 for flexural strength and 1.40 for shear strength. The corresponding flexural and shear overstrength obtained for columns are 1.15 and 2.50, respectively;
  • The factored shear force computed in accordance with the ACI-318-19 provisions 18.4.2.3 (a) and 18.4.2.3 (b) gives roughly similar shear force, with the procedure (a) giving relatively high shear force by 7% in comparison to procedure (b);
  • The updated model for the shear strength of concrete included in ACI-318-19 gives a strength 31% less than the previous simple model;
  • The analytical model gives overstrength equal to 1.17 for the shear capacity of the joint for design base action. This confirms the efficacy of the joint laterally supported by beams on three faces despite its lack of shear reinforcement. However, it must be ensured that the concrete has compressive strength equal to or more than 28 MPa.
Based on the observed seismic performance of the selected moment-resisting frame under series of shake-table tests, the following conclusions are drawn:
  • The selected frame exhibited flexural mechanism in beams under base motions with sustained maximum acceleration up to 0.40 g. Only a few slight cracks were developed in beam–column joints under base motions with a sustained maximum acceleration equal to 0.45 g. The joints incurred extensive damage under base motion with sustained maximum acceleration of 0.70 g;
  • The selected frame achieved an overstrength factor equal to 2.50, which is 20% less than the value suggested by the ASCE/SEI-7-22. The ductility factor determined is equal to 2.40, which is 44% higher than the ductility factor inherently available in the response modification coefficient suggested by the ASCE/SEI-7-22 for the selected frame. This gives a response modification coefficient equal to 6.0, which is 20% higher than the value suggested by the ASCE/SEI-7-22;
  • The available analytical model for yield drifts provided an estimate of the ductility factor 33% less than the experimental value. This is due to the fact that such models are based on the response of beam–column connection sub-assemblages lacking slab effects;
  • The virtual work method based on the presumed beam-sway plastic mechanism predicted the peak base shear of the selected frame at roof drift of 2% with sufficient accuracy; it was slightly overestimated by 7%. However, this method underestimated the maximum resistance of the frame at the roof drift of 4.20% by 31%. This is due to the fact that the method ignored the material overstrength and slab contribution to flexural strength. Re-calculating Vmax using Equation (8) and amplifying the bending moment capacity of the beam by flexural overstrength of 1.85 gives Vmax equal to 188 kN. This is approximately 14% higher than the experimentally observed maximum resistance of 165 kN;
  • The efficiency of joint that defines the ratio of force causing failure of the joint to the force developed in the frame at the maximum permissible drift is equal to 1.56 (or 156%). This measured efficiency is significantly higher than the values reported previously [28,29]. This increase is attributed to the material overstrength and the fact that the joint was confined by beams on three faces and the concrete strength is 28 MPa;
  • Analysis of beam–column joints based on the experimental response at the roof drift equal to 4.70% gives overstrength equal to 1.58 for joint shear strength in comparison to nominal shear strength determined in accordance with the ACI-318-19 (18.8.4.3). The measured high overstrength confirms the efficacy of the beam–column joint confined by beams on three faces despite the fact it lacks shear reinforcement. However, it is a must to use concrete that has compressive strength equal to or more than 28 MPa. The inherent minimal confinement is sufficient to ensure satisfactory seismic behavior.

Author Contributions

Conceptualization, N.A. and S.H.; methodology, N.A., S.H. and M.R.; software, N.A., S.H. and H.S.; validation, AA. and M.R.; formal analysis, N.A. and S.H.; investigation, N.A. and S.H.; resources, N.A., S.H., H.S., A.A. and M.R.; data curation, N.A. and S.H.; writing—original draft preparation, N.A. and S.H.; writing—review and editing, H.S., A.A. and M.R.; visualization, N.A. and S.H.; supervision, N.A. and M.R.; project administration, N.A. and M.R.; funding acquisition, S.H. All authors have read and agreed to the published version of the manuscript.

Funding

This research received no external funding.

Data Availability Statement

All data sets, models, codes, and programs relevant to the study can be requested from the authors by sending a request to [email protected].

Acknowledgments

The authors are grateful to the Board of Advanced Studies and Research (BOASAR) of UET Peshawar for financing the experimental part of the present research work and similar ongoing research projects of postgraduate students.

Conflicts of Interest

The authors declare that they have no known financial conflicts of interest or close personal relationships that may have seemed to have influenced the research described in this study.

Notation

A j joint area
A S area of longitudinal steel reinforcement in tension
C d deflection amplification factor
C S seismic response coefficient
C u coefficient for upper limit on fundamental time period, 1.5 for SD1 equal to 0.20
C v x Vertical distribution factor
E effect of earthquake-induced forces
E c Young’s modulus of concrete
E s Young’s modulus of steel
F x lateral seismic design forces at level x
F x , f lateral seismic forces at level x at lateral force causing failure of the joint
f c compressive strength of concrete
f y yield strength of steel
g acceleration due to gravity equal to 32.17 ft/s2 (9.81 m/s2)
h b depth of beam
h s x story height below level x
I e earthquake importance factor based on the use and occupancy of the frame
L b length of beam
M m 0 floor mass of test model
M m f additional floor mass for test model
M n nominal moment strength
Mnbthe sum of the nominal flexural strengths of the beams that framing into the joint and measured at the faces of the joint
Mncthe sum of the nominal flexural strengths of the columns that framing into the joint and measured at the faces of the joint
M p 1 floor mass of prototype of test model
M p b plastic moment of beam section
M p c plastic moment of column section
M r prototype-to-model mass ratio
M u factored design moment
P u factored axial load
R response modification coefficient
R μ ductility factor
S D S design spectral response acceleration parameter in the short period range
S D 1 design spectral response acceleration parameter for structural period equal to 1.0 s
S L scale factor
scenter-to-center spacing of transverse reinforcements (ties)
T fundamental period of the frame
T p r tensile force in longitudinal reinforcement of beam in tension
V design lateral strength, design base shear force
V c shear strength of concrete
V c o l column shear force
V f peak lateral force causing failure of the joint
V m a x maximum lateral strength, up to permissible maximum design drift
V n nominal shear strength
V S story shear force
V u factored shear force
V n , j o i n t nominal shear strength of joint
V u , j o i n t factored shear strength of joint
W effective seismic weight of frame
W v e virtual external work
W v i virtual internal work
Δ y effective yield displacement
Δ max maximum displacement corresponding to maximum permissible design drift
ε y strain of steel corresponding to yield stress
μ displacement ductility ratio
Ω o overstrength factor
ϕ strength reduction factor
θ story drift
θ y effective yield drift

References

  1. Gulkan, P.; Sozen, M.A. Inelastic response of reinforced concrete structures to earthquake motions. ACI Struct. J. 1974, 89, 89–98. [Google Scholar] [CrossRef] [Green Version]
  2. Blume, J.A.; Newmark, N.M.; Corning, L.H. Design of Multistory Reinforced Concrete Buildings for Earthquake Motions; Portland Cement Association: Skokie, IL, USA, 1961; 318p. [Google Scholar]
  3. Park, R.; Paulay, T. Reinforced Concrete Structures; John Wiley & Sons, Inc.: New York, NY, USA, 1975; 768p. [Google Scholar]
  4. American Society of Civil Engineers. Minimum Design Loads and Associated Criteria for Buildings and Other Structures; ASCE/SEI 7-22; American Society of Civil Engineers: Reston, VA, USA, 2021; 1046p. [Google Scholar]
  5. IBC-2021—International Building Code; International Code Council: Washington, DC, USA, 2020.
  6. Building Code Requirements for Structural Concrete; ACI-318-19; American Concrete Institute: Farmington Hills, MI, USA, 2019; 822p.
  7. Hanson, N.W.; Connor, H.W. Seismic resistance of reinforced concrete beam-column joints. J. Struct. Div. ASCE 1967, 93, 533–560. [Google Scholar] [CrossRef]
  8. Meinheit, D.F.; Jirsa, J.O. Shear Strength of Reinforced Concrete Beam-Column Joints; Report No. 77-1; Department of Civil Engineering, Structures Research Laboratory, University of Texas at Austin: Austin, TX, USA, 1977; 291p. [Google Scholar]
  9. Recommendation for Design of Beam-Column Connections in Monolithic Reinforced Concrete Structures—ACI-ASCE Committee 352; ACI 352R-02; American Concrete Institute: Farmington Hills, MI, USA, 2019; 822p.
  10. Chopra, K.A. Dynamics of Structures, Theory and Applications to Earthquake Engineering, 5th ed.; Prentice Hall: Upper Saddle River, NJ, USA, 2016; 992p. [Google Scholar]
  11. Goel, R.K.; Chopra, A.K. Period formulas for moment-resisting frame buildings. J. Struct. Eng. ASCE 1997, 123, 1454–1461. [Google Scholar] [CrossRef] [Green Version]
  12. Goel, R.K.; Chopra, A.K. Period formulas for concrete shear wall buildings. J. Struct. Eng. ASCE 1998, 124, 426–433. [Google Scholar] [CrossRef] [Green Version]
  13. Rosenblueth, E.; Contreras, H. Approximate design for multicomponent earthquakes. J. Eng. Mech. Div. ASCE 1977, 103, 881–893. [Google Scholar] [CrossRef]
  14. Wight, J.K. Reinforced Concrete: Mechanics and Design, 7th ed.; Pearson Education Inc.: Hoboken, NJ, USA, 2016; 1144p. [Google Scholar]
  15. MacGregor, J.G.; Hanson, J.M. Proposed changes in shear provisions for reinforced and pre-stressed concrete beams. ACI J. Proc. 1969, 66, 276–288. [Google Scholar] [CrossRef]
  16. Kuchma, D.; Wei, S.; Sanders, D.; Belarbi, A.; Novak, L. Development of the one-way shear design provisions of ACI 318-19. ACI Struct. J. 2019, 116, 285–295. [Google Scholar] [CrossRef]
  17. Sneed, L.H.; Ramirez, J. Influence of effective depth on the shear strength of concrete beams—Experimental study. ACI Struct. J. 2010, 107, 554–562. [Google Scholar] [CrossRef]
  18. Bazant, Z.P.; Yu, Q.; Gerstle, W.; Hanson, J.; Ju, J. Justification of ACI 446 code provisions for shear design of reinforced concrete beams. ACI Struct. J. 2007, 104, 601–610. [Google Scholar] [CrossRef]
  19. Angelakos, D.; Bentz, E.C.; Collins, M.D. Shear strength of large members. ACI Struct. J. 2001, 98, 290–300. [Google Scholar]
  20. Lubell, A.S.; Sherwood, E.G.; Bentz, E.C.; Collins, M.P. Safe shear design of large wide beams. Concr. Int. 2004, 26, 66–78. [Google Scholar]
  21. Brown, M.D.; Bayrak, O.; Jirsa, J.O. Design for shear based on loading conditions. ACI Struct. J. 2006, 103, 541–550. [Google Scholar] [CrossRef]
  22. Sozen, M.A. Seismic behavior of reinforced concrete buildings. In Earthquake Engineering; Bozorgnia, Y., Bertero, V.V., Eds.; CRC Press: New York, NY, USA, 2004; pp. 601–642. [Google Scholar]
  23. Moncarz, P.; Krawinkler, H. Theory and Application of Experimental Model Analysis in Earthquake Engineering; Report No. 50; Department of Civil and Environmental Engineering, John Blume Earthquake Engineering Center, Stanford University: Stanford, CA, USA, 1981; 263p. [Google Scholar]
  24. El-Attar, A.-G.; White, R.N.; Gergely, P. Shake Table Test of a 1/6 Scale Two-Story Lightly Reinforced Concrete Building; Report No. 50; Department of Civil and Environmental Engineering, National Center for Earthquake Engineering Research, State University of New York: Buffalo, NY, USA, 1991; 263p. [Google Scholar]
  25. Newmark, N.M.; Hall, W.J. Earthquake Spectra and Design; Earthquake Engineering Research Institute: Oakland, CA, USA, 1982; 103p. [Google Scholar]
  26. Federal Emergency Management Agency (FEMA). Quantification of Building Seismic Performance Factors; FEMA-P-695; FEMA: Washington, DC, USA, 2009; 421p. [Google Scholar]
  27. Priestley, M.J.N.; Calvi, G.M.; Kowalsky, M.J. Displacement Based Seismic Design of Structures; IUSS Press: Pavia, Italy, 2007; 721p. [Google Scholar]
  28. Nilsson, I.H.E.; Losberg, A. Reinforced concrete corners and joints subjected to bending moment. J. Struct. Div. ASCE 1976, 102, 1229–1254. [Google Scholar] [CrossRef]
  29. Balint, P.S.; Taylor, H.P.J. Reinforcement Detailing of Frame Corner Joints with Particular Reference to Opening Corners; Technical Report; Cement and Concrete Association: London, UK, 1972; 16p. [Google Scholar]
  30. French, C.W.; Moehle, J.P. Effect of foor slab on behavior of slab-beam-column connections. ACI Symp. Pap. 1991, 123, 225–258. [Google Scholar] [CrossRef]
  31. Masoudi, M.; Khajevand, S. Revisiting flexural overstrength in RC beam-and-slab floor systems for seismic design and evaluation. Bull. Earthq. Eng. 2020, 18, 5309–5341. [Google Scholar] [CrossRef]
  32. Kassem, M.M.; Nazri, F.M.; Farsangi, E.N.; Ozturk, B. Improved vulnerability index methodology to quantify seismic risk and loss assessment in reinforced concrete buildings. J. Earthq. Eng. 2022, 26, 6172–6207. [Google Scholar] [CrossRef]
  33. Tariq, H.; Jampole, E.A.; Bandelt, M.J. Development and application of spring hinge models to simulate reinforced ductile concrete structural components under cyclic loading. ASCE J. Struct. Eng. 2021, 147, 04020322-1–04020322-20. [Google Scholar] [CrossRef]
  34. Ahmad, N.; Rizwan, M.; Ilyas, B.; Hussain, S.; Khan, M.U.; Shakeel, H.; Ahmad, M.E. Nonlinear Modeling of RC Substandard Beam–Column Joints for Building Response Analysis in Support of Seismic Risk Assessment and Loss Estimation. Buildings 2022, 12, 1758. [Google Scholar] [CrossRef]
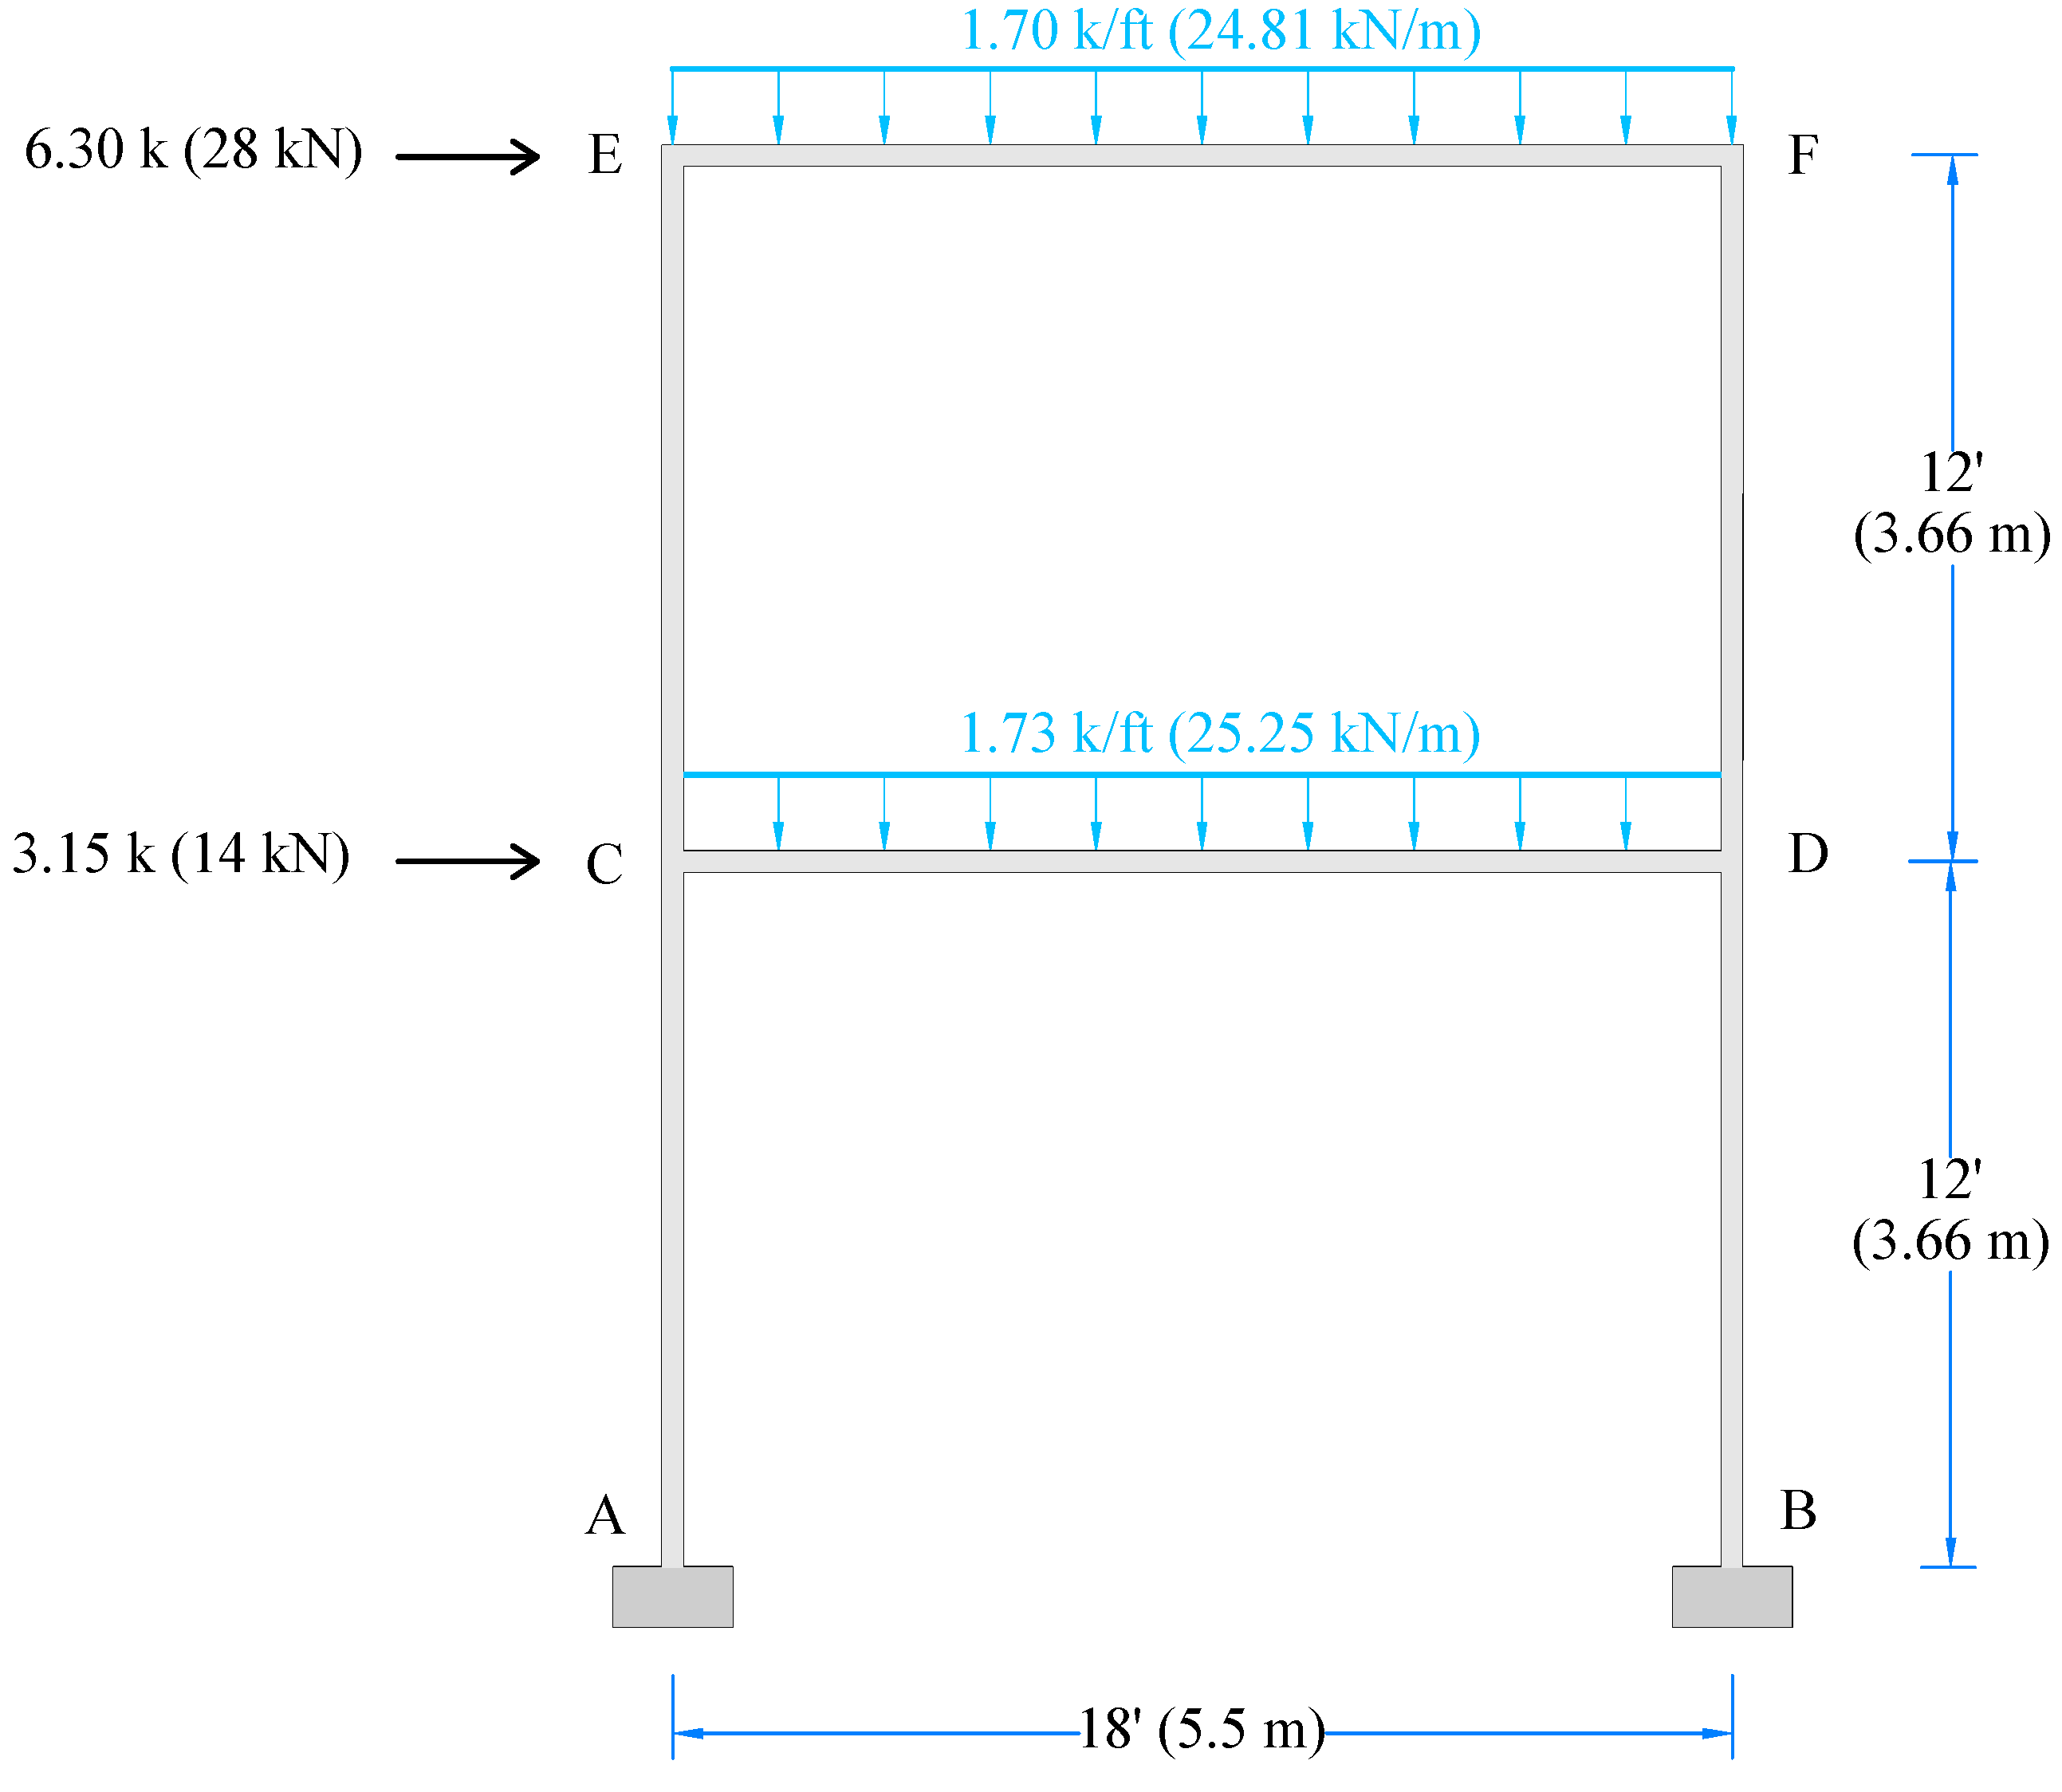
Figure 1. Selected moment-resisting reinforced concrete frame.
Buildings 12 02104 g001
Figure 2. Factored design moment Mub for beams for combined gravity and lateral seismic forces.
Buildings 12 02104 g002
Figure 3. Factored design shear Vub for beams in accordance with ASCE/SEI-7-16 (18.4.2.3).
Buildings 12 02104 g003
Figure 4. Factored design moment Muc for columns for combined gravity and lateral seismic forces.
Buildings 12 02104 g004
Figure 5. Factored design shear Vuc for columns for combined gravity and lateral seismic forces.
Buildings 12 02104 g005
Figure 6. Geometric and reinforcement details of the beam/column members and panel.
Buildings 12 02104 g006
Figure 7. A 1:3 reduced scale test frame.
Buildings 12 02104 g007
Figure 8. Scaled acceleration response spectrum of Northridge-1994 for base motions.
Buildings 12 02104 g008
Figure 9. Horizontal and vertical flexural cracks at the beam–joint interface under test run 2 (ref. Table 3). G.S. column refers to the ground story column.
Buildings 12 02104 g009
Figure 10. Aggravation of horizontal flexural cracks at the beam ends under test run 3 (ref. Table 3). G.S. column refers to the ground story column.
Buildings 12 02104 g010
Figure 11. Extensive damage occurred at beam–column joint panel under test run 4 (ref. Table 3).
Buildings 12 02104 g011
Figure 12. Force-displacement capacity curve for a prototype of tested frame.
Buildings 12 02104 g012
Figure 13. Considered plastic mechanism of the selected frame.
Buildings 12 02104 g013
Figure 14. Complete capacity curve for prototype of tested frame till beam–column joints were extensively damaged.
Buildings 12 02104 g014
Table 1. Preliminary chosen sizes of beams and columns and basic material properties.
MemberDepth
in. (mm)
Width
in. (mm)
Clear Span
in. (mm)
fc
ksi (MPa)
Ec
ksi (GPa)
fy
ksi (MPa)
Es
ksi (GPa)
Beams:18 (457)12 (305)204 (5182)4 (28)3605 (24.86)60 (414)29,000 (200)
Columns:12 (305)12 (305)138 (3505)4 (28)3605 (24.86)60 (414)29,000 (200)
Table 2. Geotechnical, seismic and structural parameters considered for the design of frame.
SDCSDSSD1SoilIeRΩoCd
C0.50.2B1.255.034.5
Table 3. Measured sustained maximum acceleration of base motions of the test frame.
Test RunsPHA * (g)Remarks
10.20-
20.40Horizontal and vertical flexural cracks at the beam–joint interface.
30.45Aggravation of horizontal flexural cracks at the beam ends. Occurrence of slight cracks in beam–column joints
40.70Extensive damages occurred at the beam–column joint panels on both floor levels.
* Peak horizontal acceleration.
Publisher’s Note: MDPI stays neutral with regard to jurisdictional claims in published maps and institutional affiliations.