
Utilization of Solar Energy for Water Heating Application to Improve Building Energy Efficiency: An Experimental Study


Abstract
:1. Introduction
1.1. Global Scenario
1.2. Energy Crisis
1.3. Causes of Energy Crisis
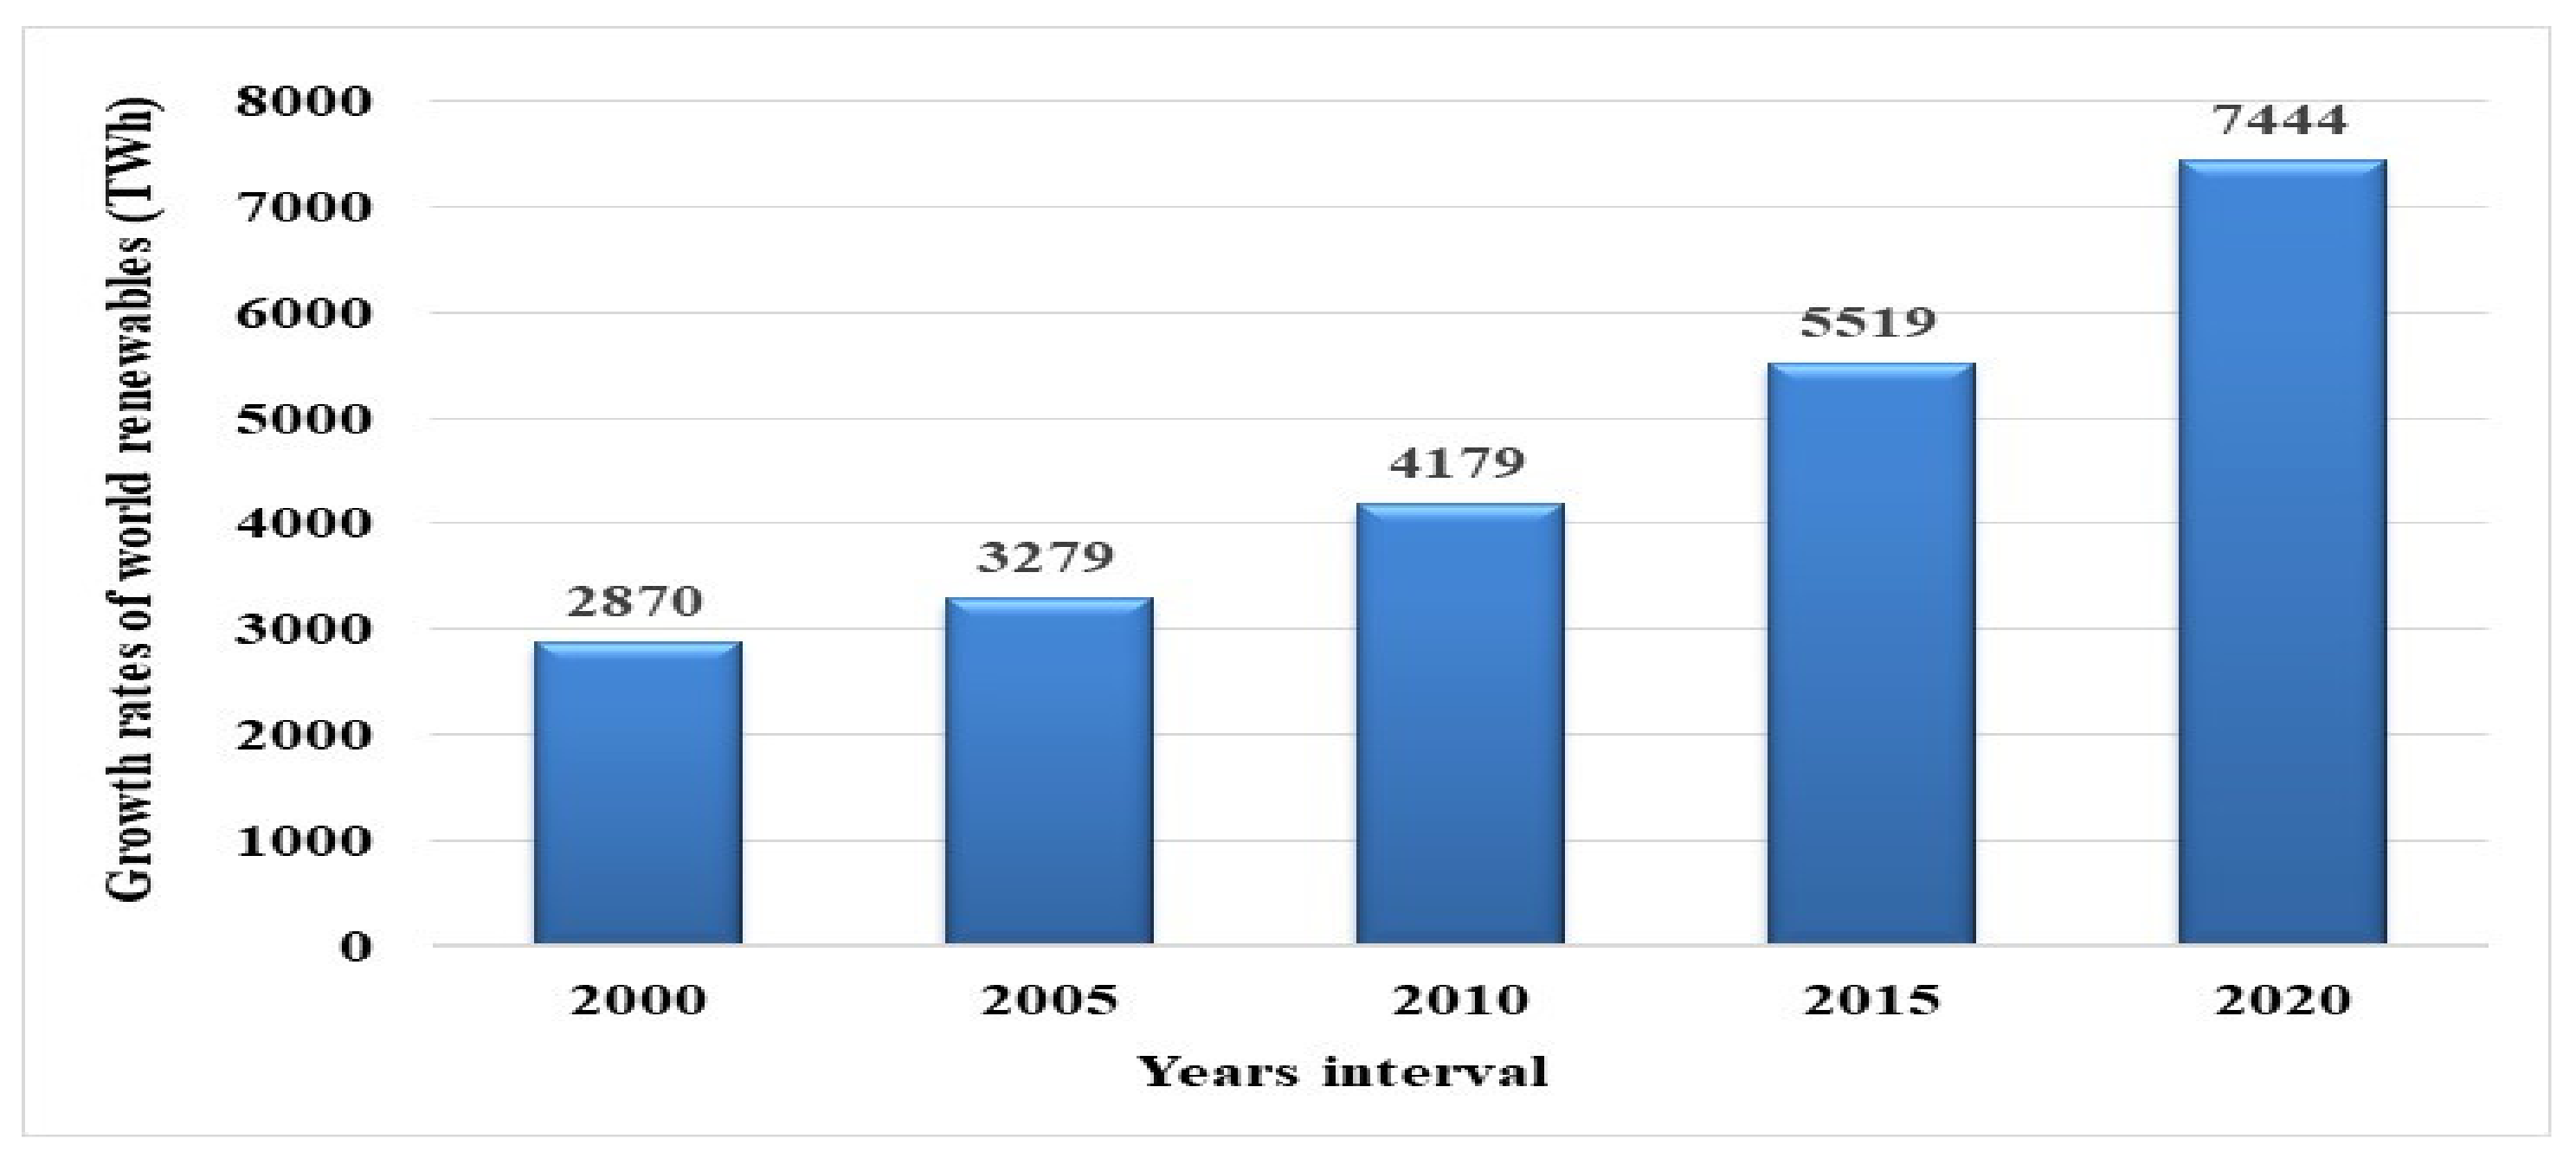
1.4. Indian Renewable Energy Scenario
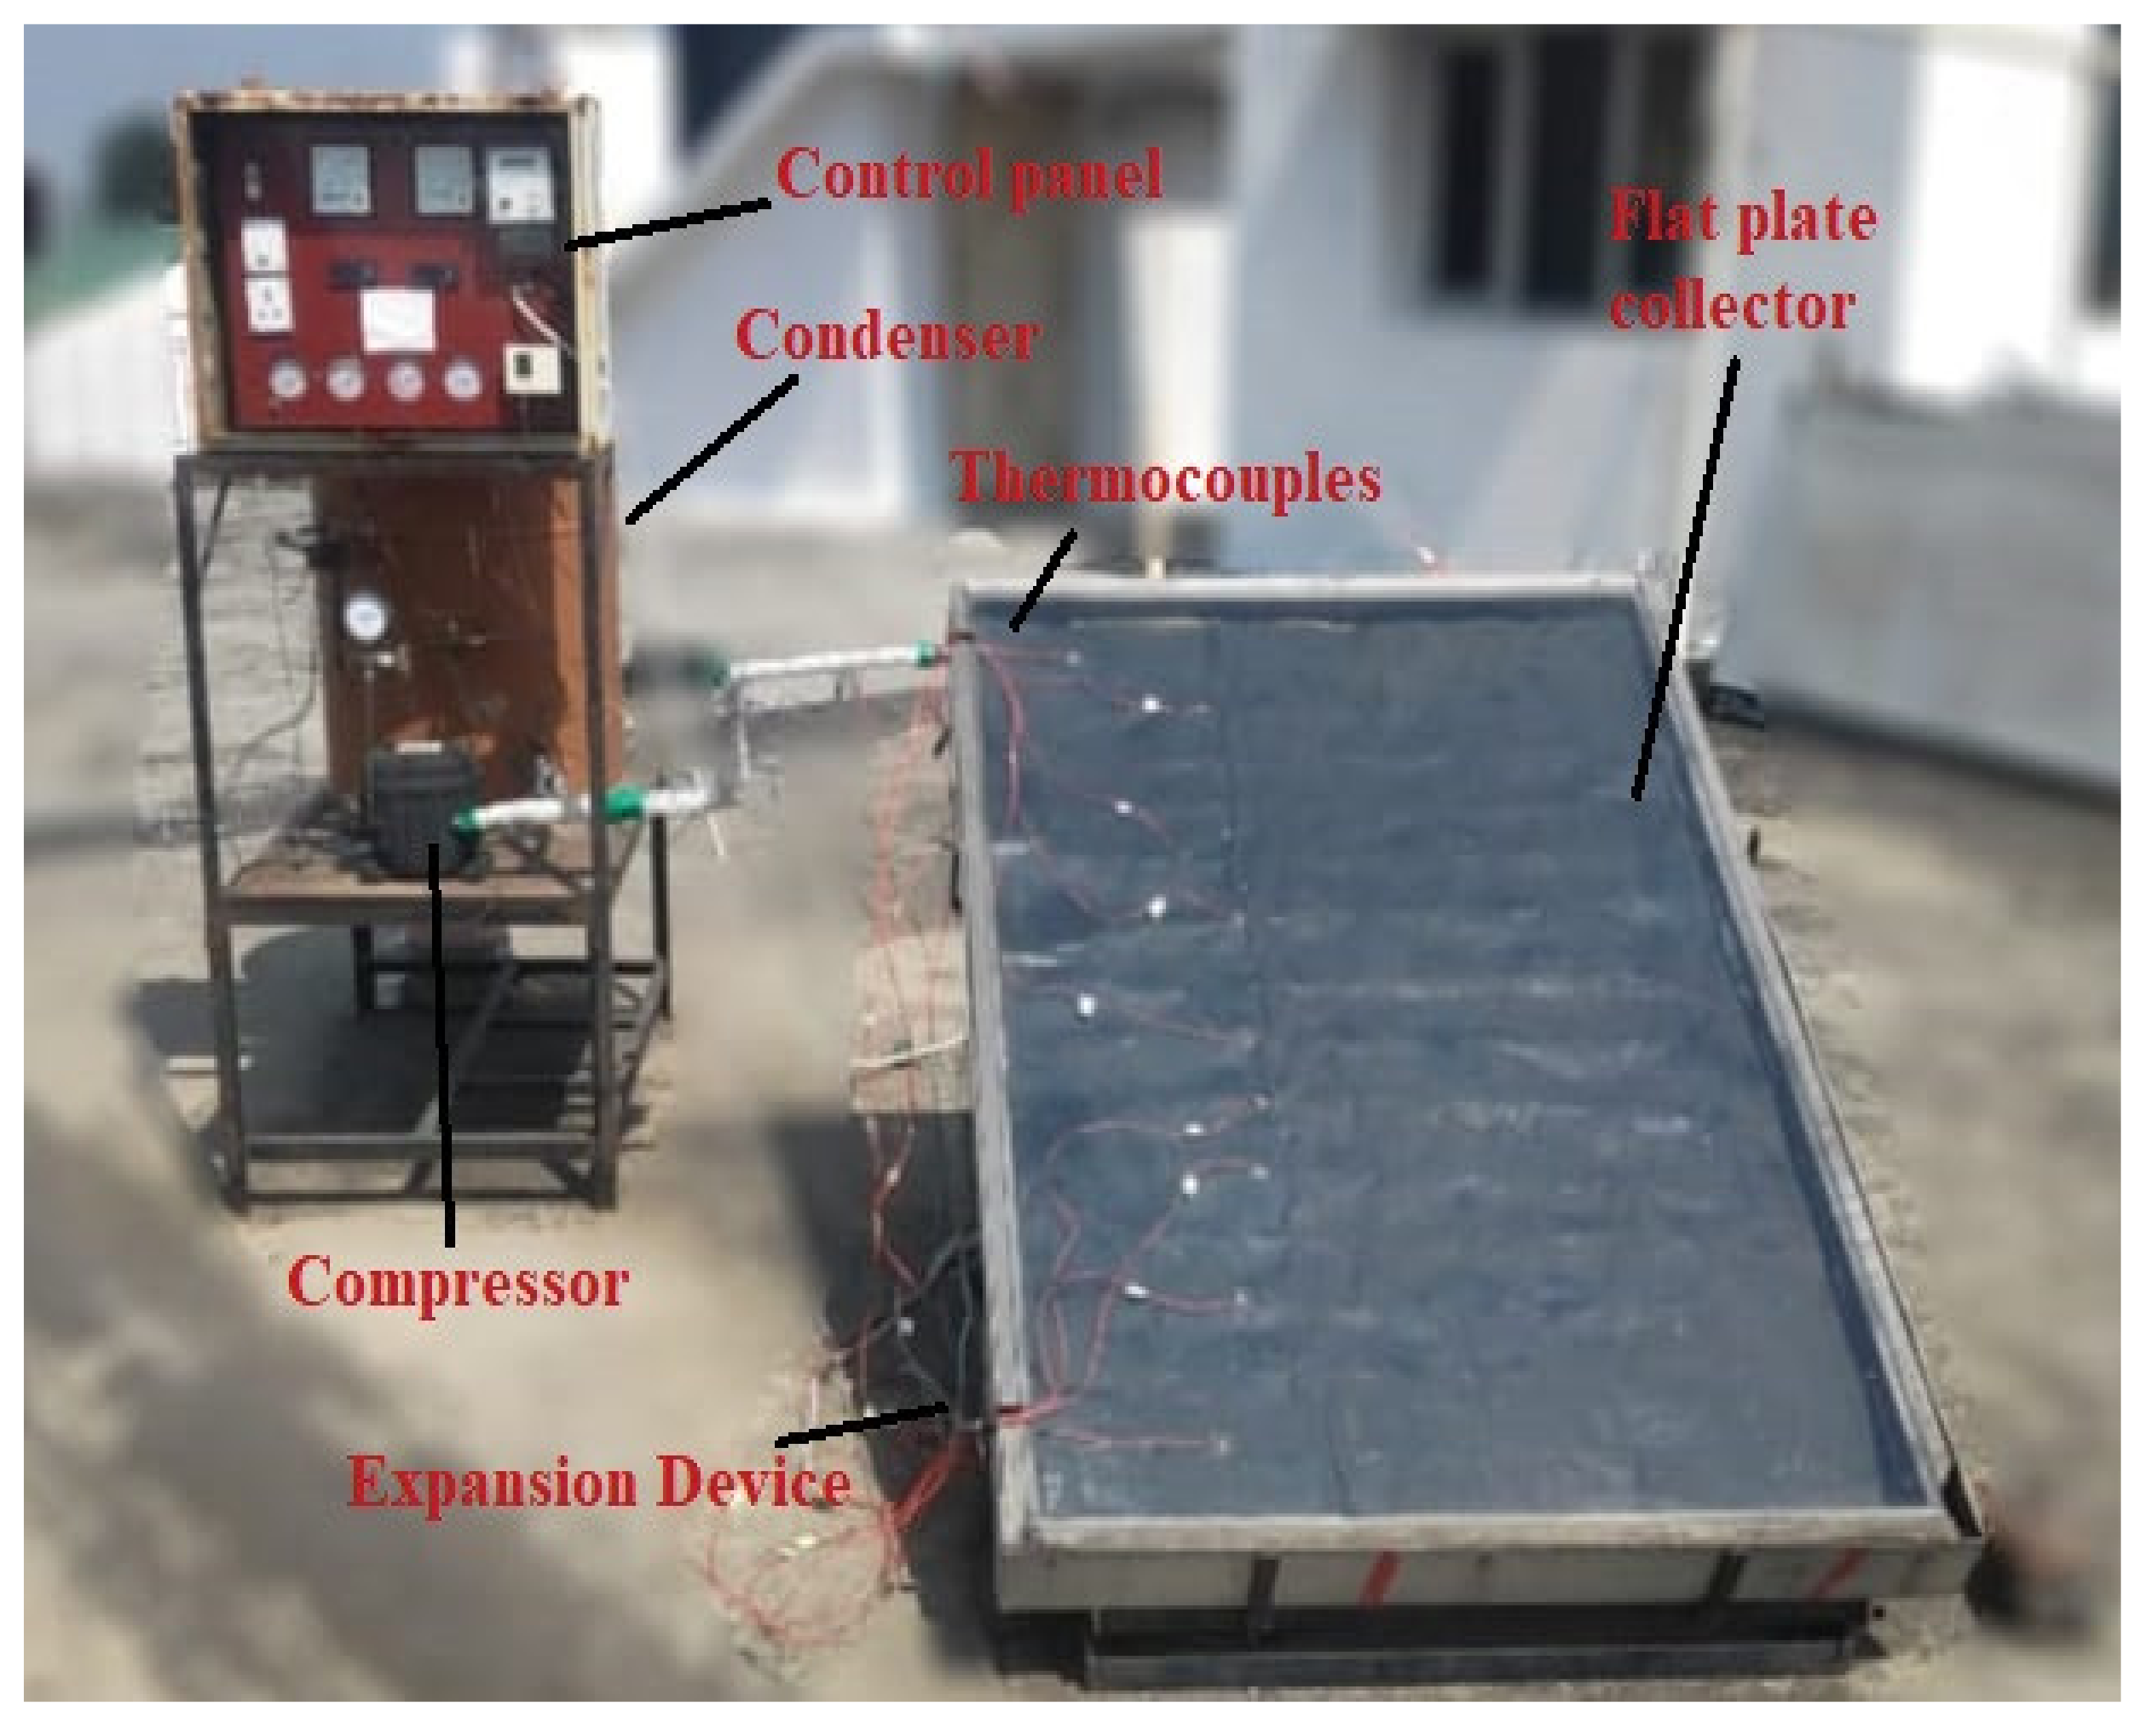
2. Experimental Setup, Components and Mathematical Modeling
- Evaporator or Flat Plate Collector
- Compressor
- Condenser
- Expansion Device
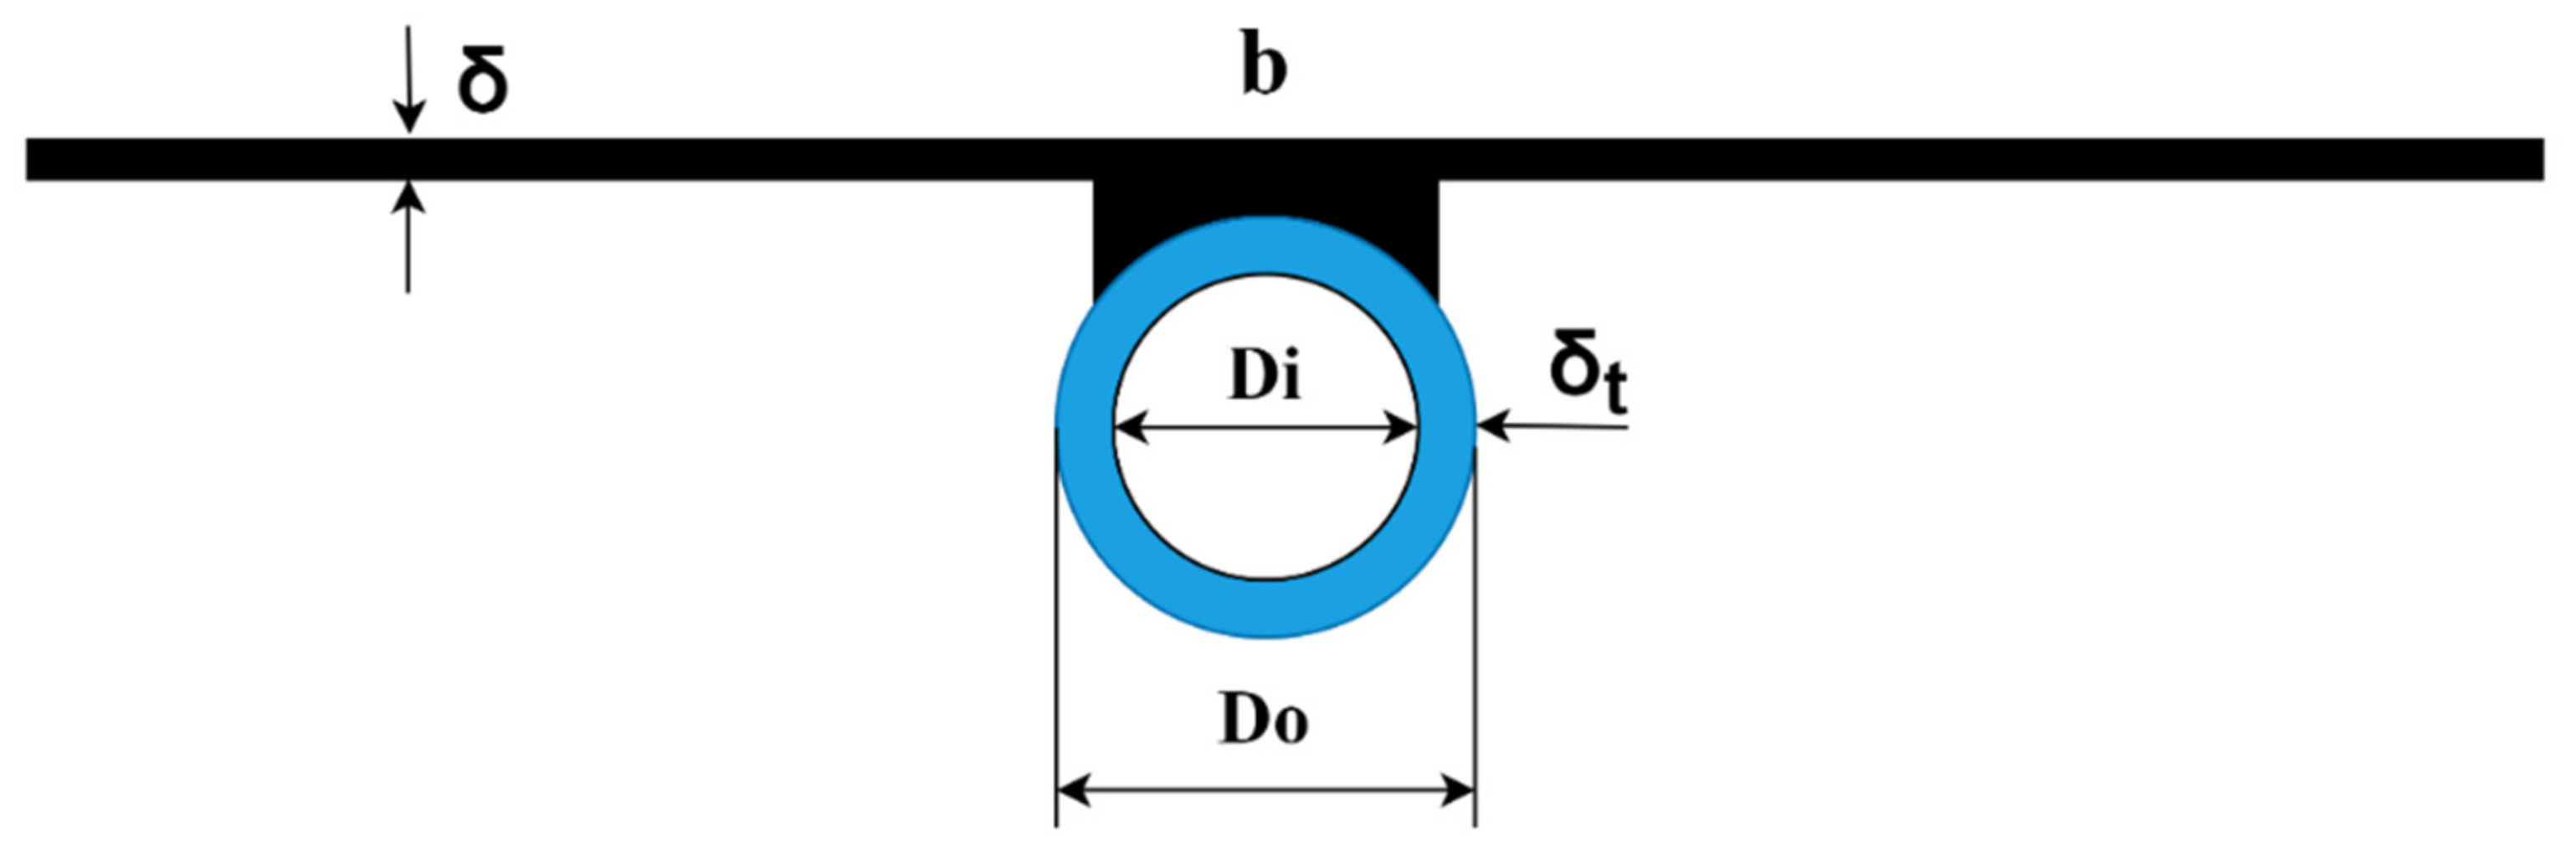
- Collector: In study, we use a flat plate collector having dimensions 1830 mm (L) × 1220 mm (W) × 100 mm (T) made with an aluminum frame. Use transparent glazing on the to the head of the collectors to minimise heat loss from the thin copper plate of dimensions 1405 mm (L) × 975 mm (W) × 0.5 mm (T). This copper plate is coated with just a matt black color to absorb maximum radiation. A copper tube of outer and inner diameters 10 mm and 9 mm is brazed with this absorber plate (Figure 8). The amount of heat collected by this absorber plate is passed on to the refrigerant R134a flowing in copper tube.
- Compressor: Hermetically locked reciprocating compressor with a 245 W input power and a rate of flow of 5.79 cm3/rev propellant were once installed and operated according to a simple principle. To increase by lowering the volume of liquid, the force of the refrigerant is reduced. The compressor raises the pressure of the refrigerant, which contributes importantly to increasing refrigerant temperature.
- Capillary: The refrigerant’s temperature and pressure had to be normalized before it could re-enter the evaporator. Thus, an optimized copper capillary with a radius of 0.455 mm and a length of 3048 m. used in construction. Therefore, the pressure decreases after the loss of latent heat. This can be achieved through diffusion inside the capillary, thus raising the volume. Due to the liquid refrigerant, the pressure between the refrigerants decreases.
- Condenser: The condenser is used as a heat exchanger because it extracts heat from the refrigerant as well as transfers that energy to the tank’s water After the heat is removed from the refrigerant, the refrigerant cools and turns into a liquid form Copper tubes with an outer diameter of 10 mm and a length of 9.75 m made up the condenser. It was assumed that the storage tank was not stratified; therefore losses could be ignored when calculating the coefficient of performance.
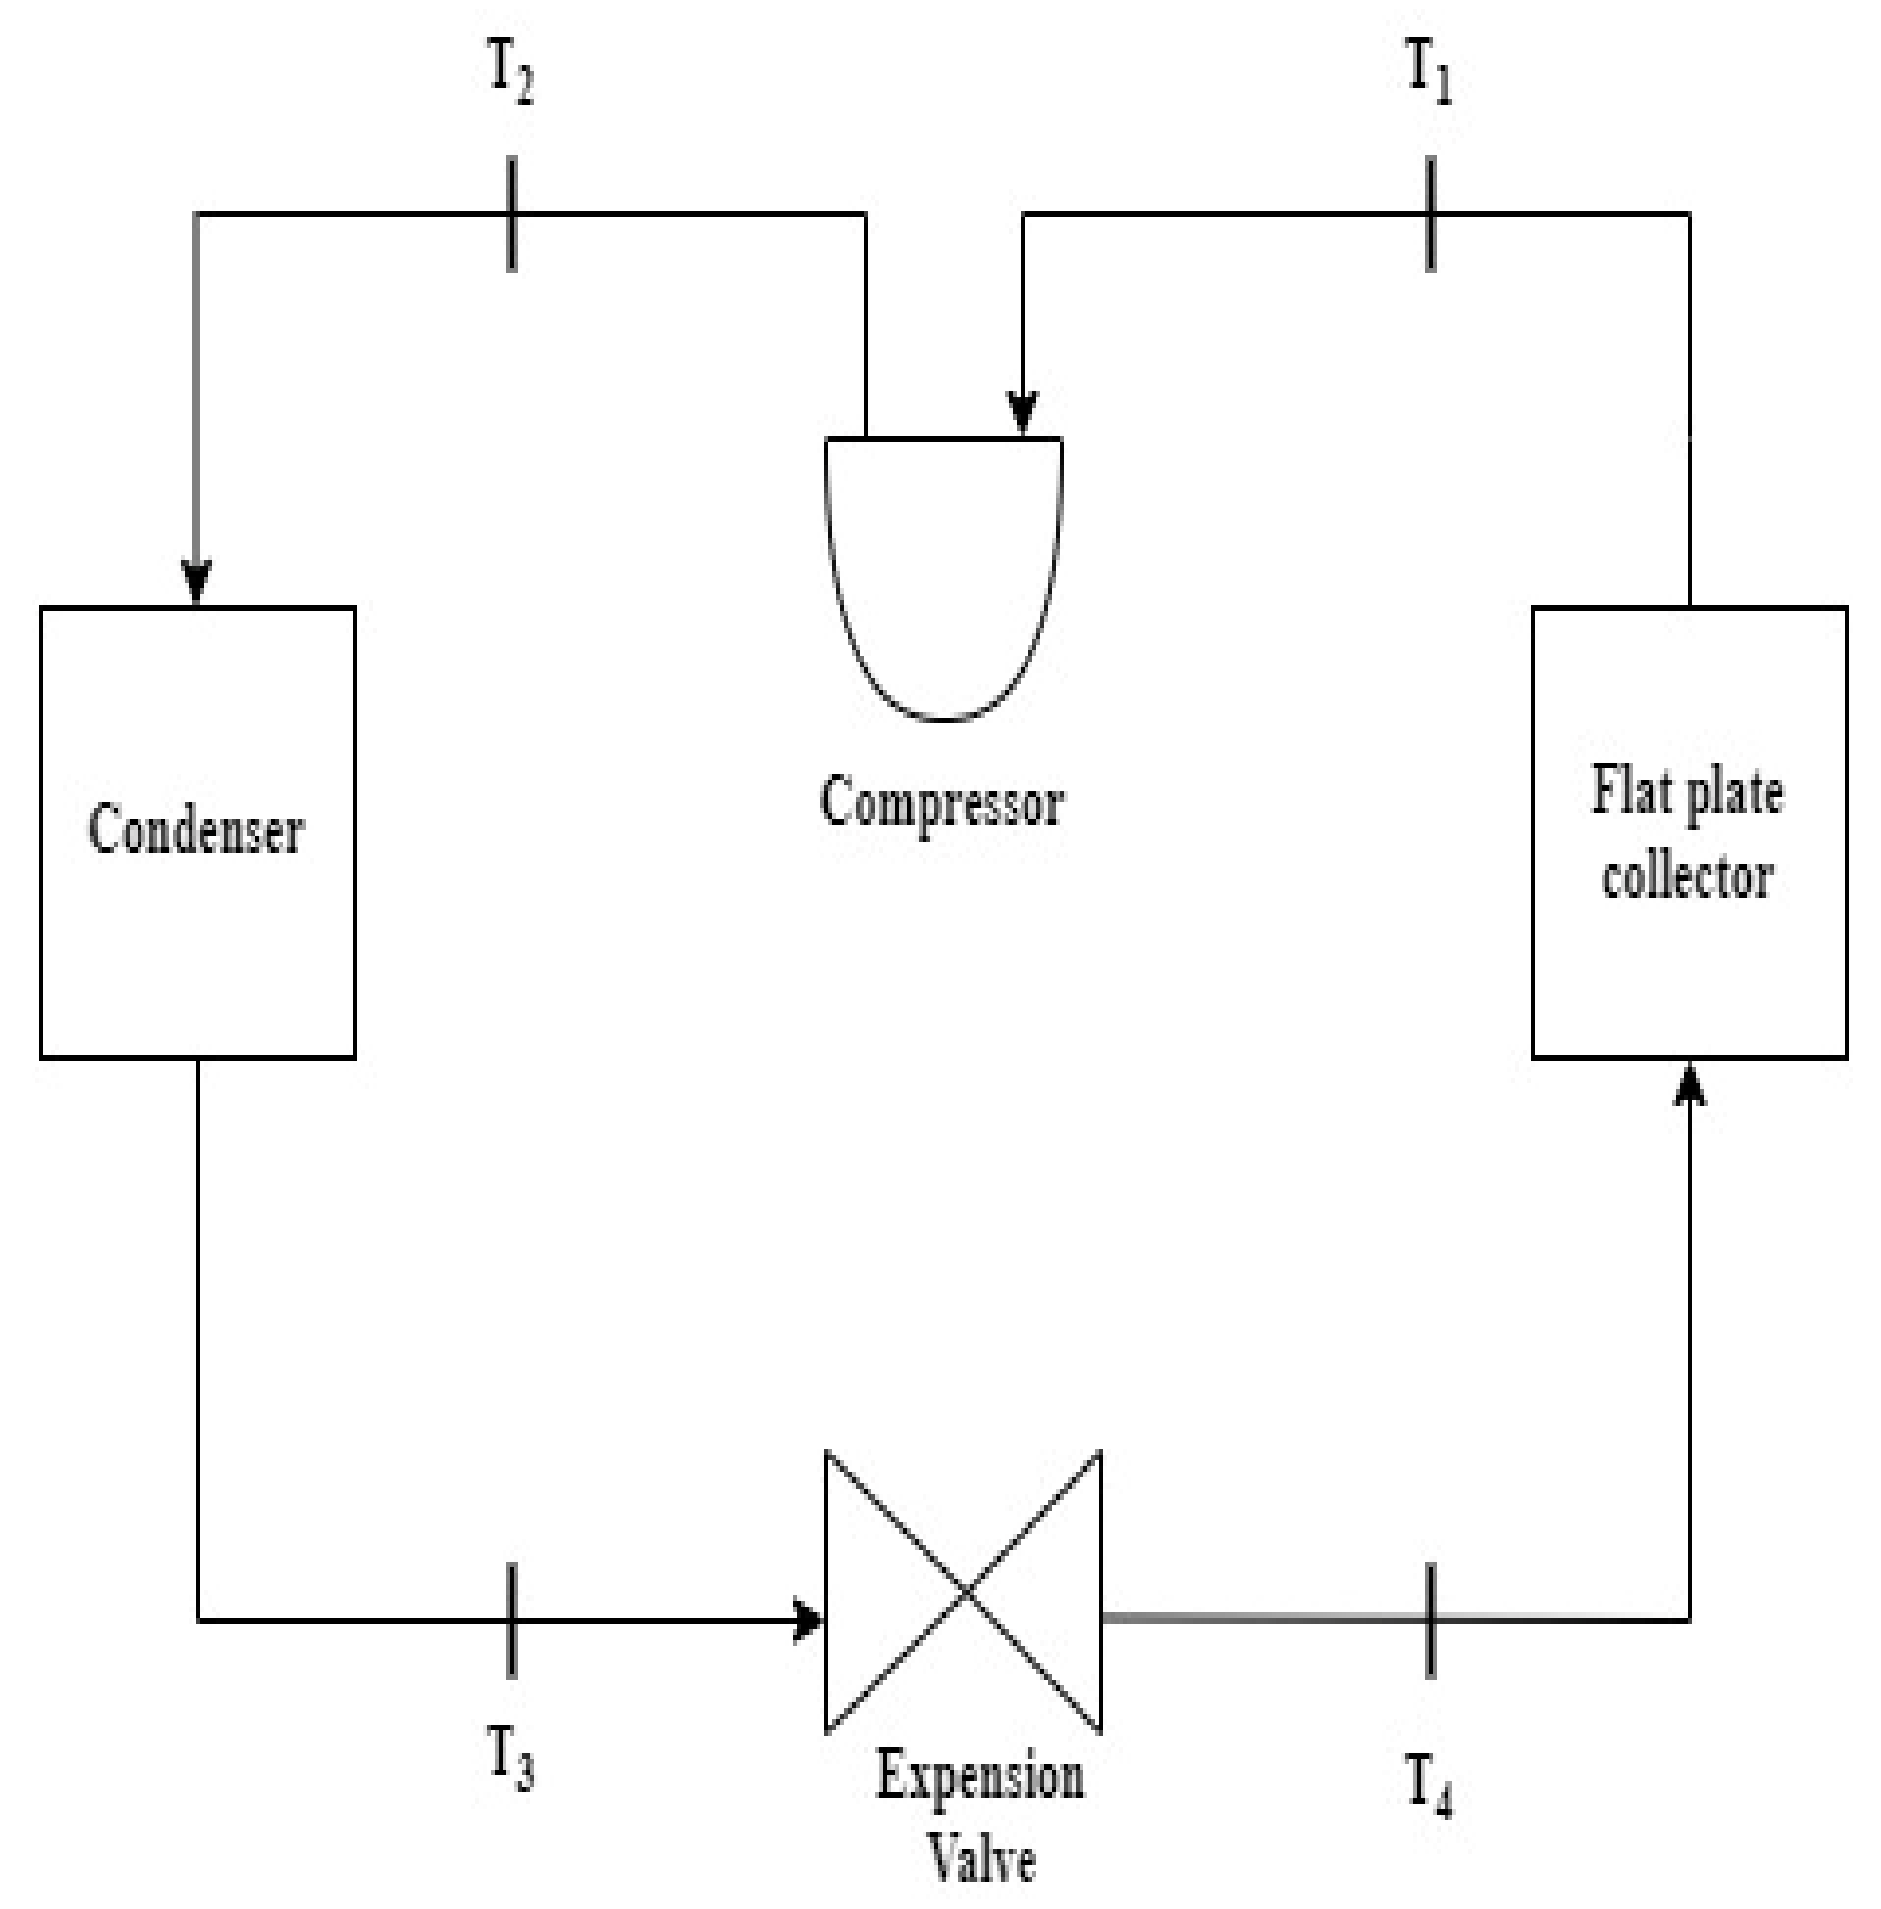
2.1. Working of Experimental Setup
2.2. Mathematical Modelling
- Within the selected time interval, the system is in a semi-steady condition;
- In evaporator, condenser, and pipe, the pressure decrease is insignificant;
- At both the evaporator and condenser exits, the refrigerant is deemed saturate;
- It is hypothesised that the compression of refrigerant increases is a polytropic process;
- The expansion of the coolant fluid is regarded as isenthalpic;
- The coverings are resistant to infrared radiation;
- There is negligible temperature drop through a cover;
- Temperature gradients around the tubes could be neglected;
- The properties are temperature independent;
- The losses via the front and back are to the same ambient temperature;
- Effect of dust and dirt on the collector are negligible;
- The storage of hot water tank is considered to be non-stratified [13].
2.3. Collector
- F′ = Collector efficiency factor
- FR = Heat removal factor
- UL = Overall loss coefficient
- = Effective transmittance-absorptance product of the cover glazing material (0.9)
- IT = Solar radiation falling on the collector
2.3.1. The Overall Heat Loss Coefficient
2.3.2. When Tubes Are Soldered below the Absorber Plate
2.3.3. COP of Direct Expansion Solar Assisted Heat Pump System [22]
2.4. Condenser
2.5. Compressor
- The distribution of temperature inside the storage tank is uniform
- Pressure is constant in evaporator, condenser and pipes used for connection
- In Expansion Valve the Throttling Process is Isenthalpic Process
- Resistance during thermal contact is negligible
- Insulation used for water storage tank is adiabatic [33]
2.6. Throttling
- No heat transfers
- No work transfers
- Constant enthalpy
- Irreversible process
- So, we can say that:
- Enthalpy at inlet (h1) = Enthalpy at outlet (h2)
2.7. Selection of Refrigerant
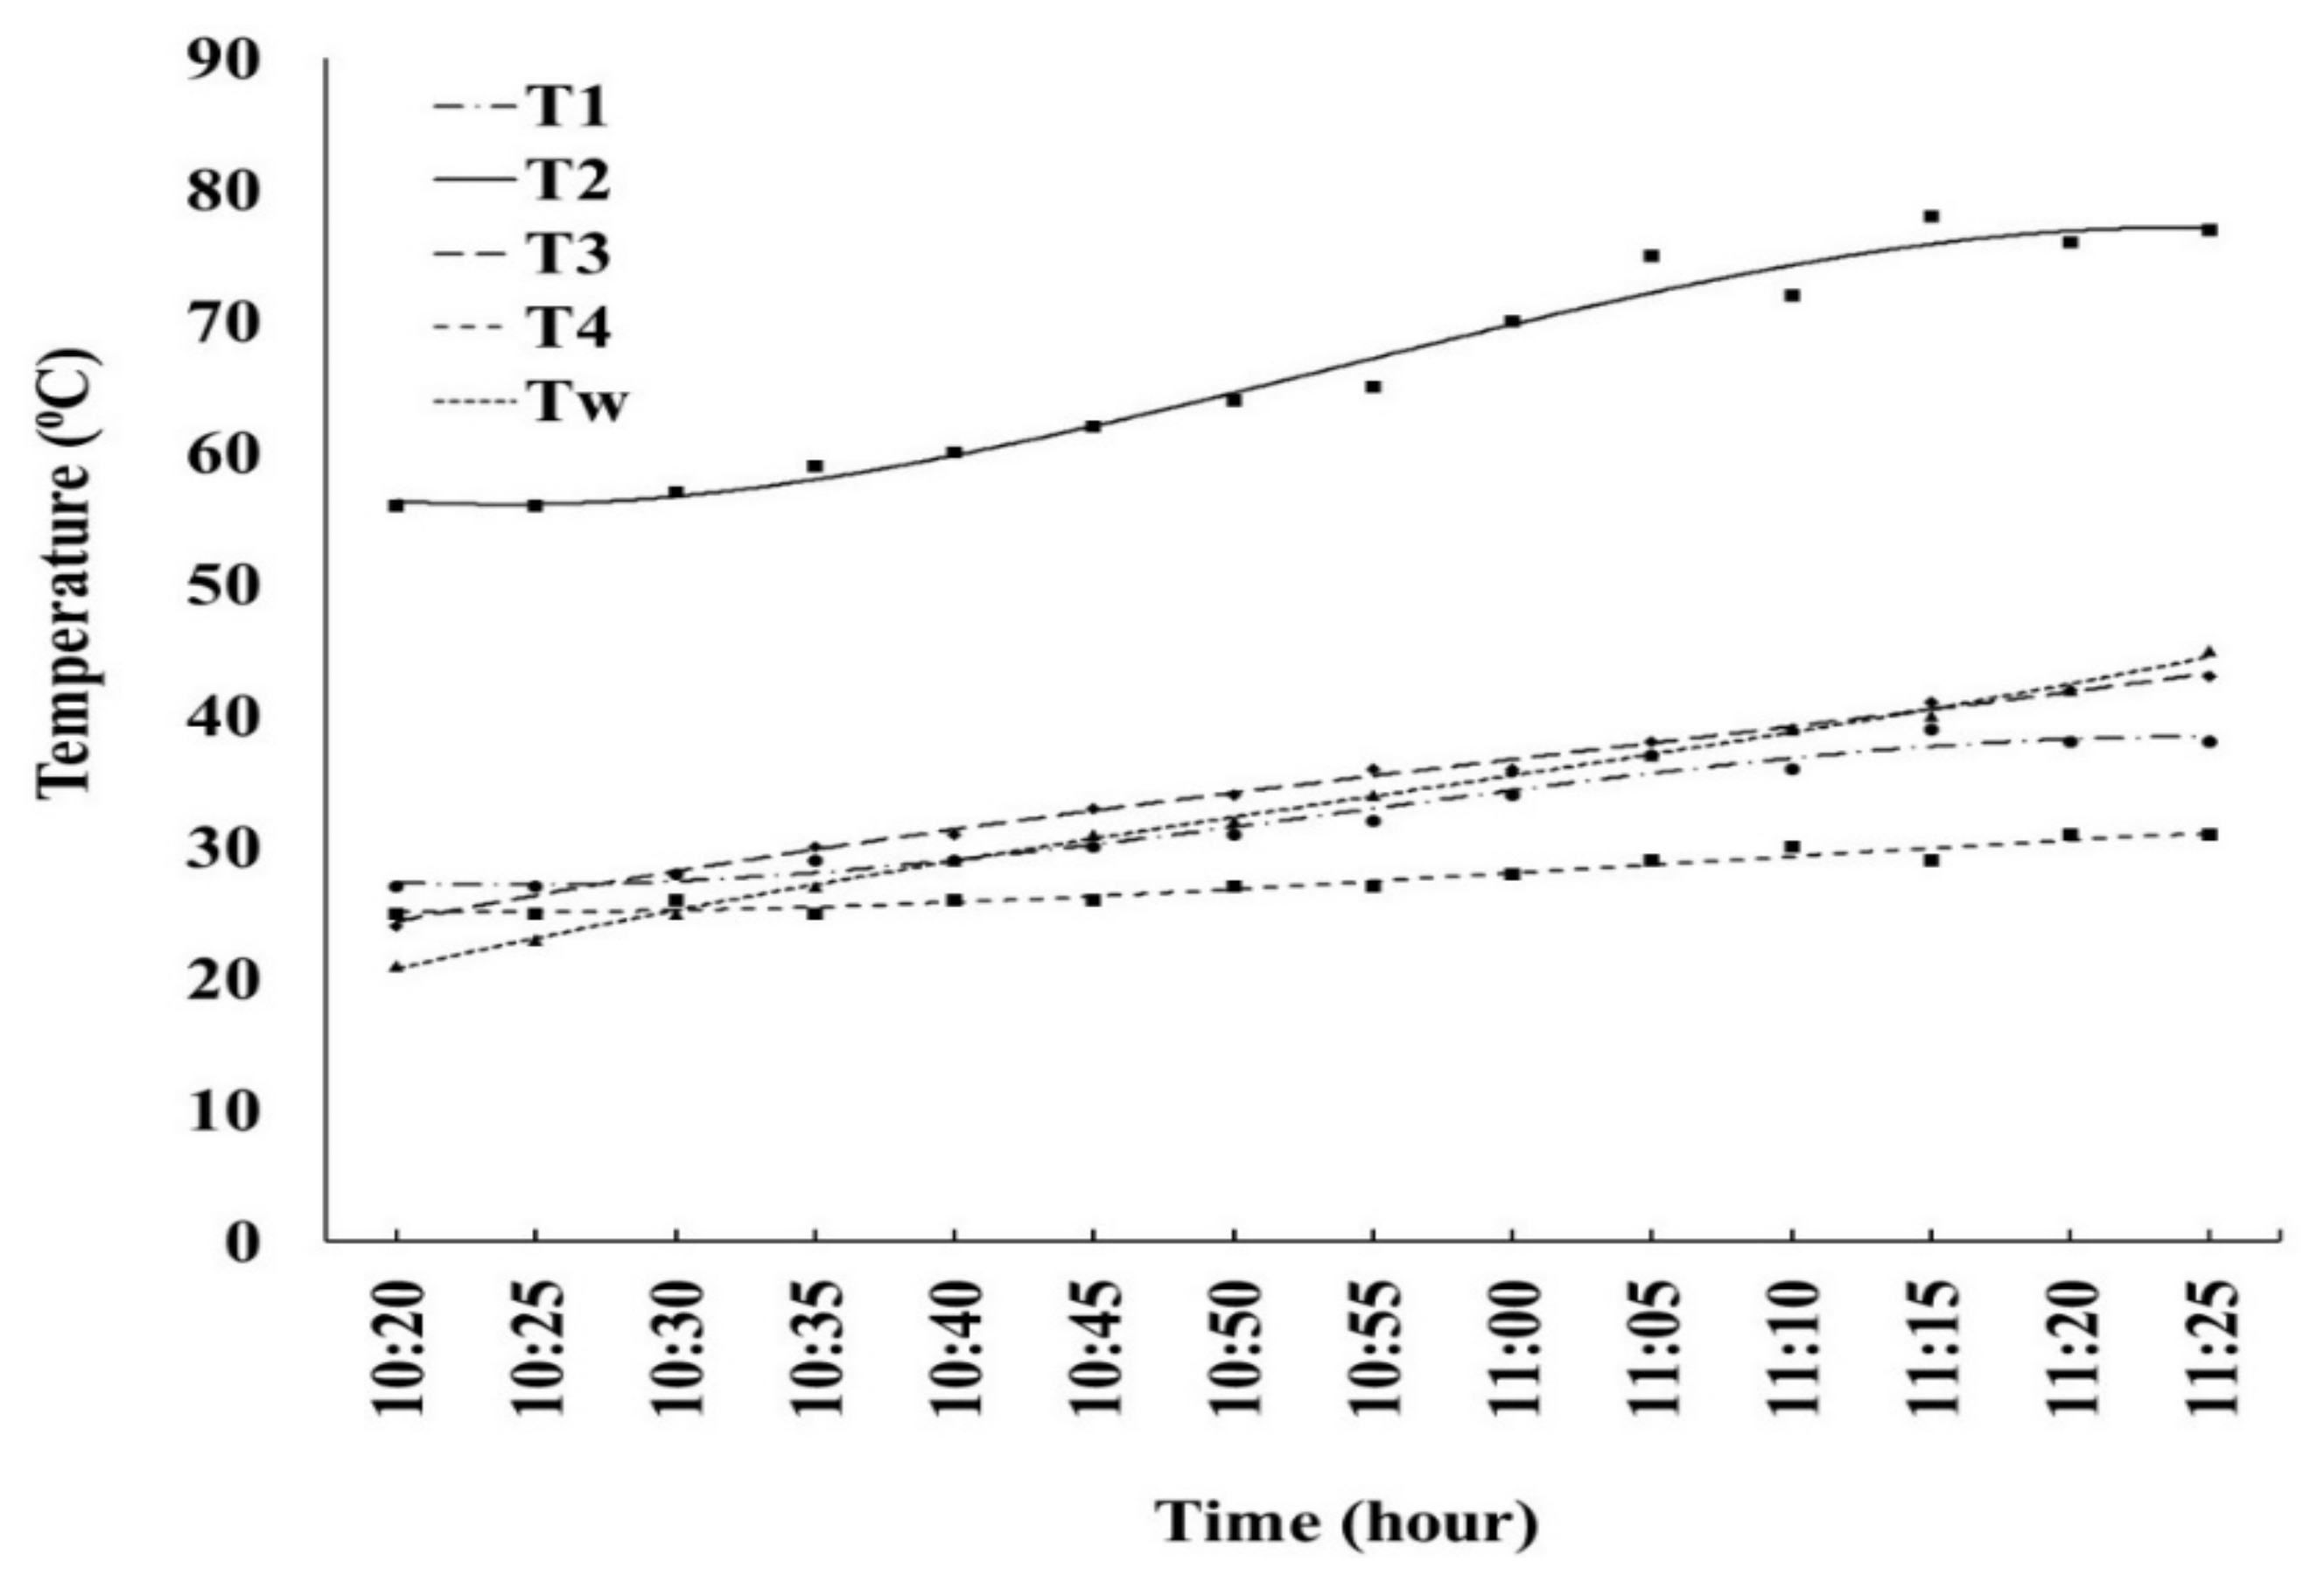
3. Result and Discussion
- T2 = Inlet temperature of Compressor
- T2 = Inlet temperature of Condenser
- T3 = Inlet temperature of Expansion Valve
- T4 = Inlet temperature of Evaporator/FPC (flat plate collector)
- Tw = Consumable water temperature
4. Cost Analysis for SAHP
For SAHP Materials
- P = Rs.25,000
- S = Rs.4000
- Assuming n = 15 years, r = 12% and maintenance cost = 10% of total cost,
- The cost calculation can be done as follows
- CRF = 0.1467
- SFF = 0.0268
- The Final annual cost of system = CRF × P = 0.1467 × 25,000 = Rs.3667.5
- Annual salvage value = SFF × S = 0.0268 × 4000 = Rs.107.2
- Annual maintenance cost = 10% = 0.10 × 3374.1 = Rs.366.75
- Annual cost = 3667.5 + 366.75 − 107.2= Rs.3927.05
5. Experimental Error
- Percentage measurement inaccuracy in intensity = 2%
- Percentage temperature measurement error = 0.3%
- Percentage inaccuracy in measuring water amount = 0.025 %
- Total percentage error for the SAHP = 1 × 2 + 4 × 0.3 + 1 × 0.025 = 3.225%
6. Conclusions
Author Contributions
Funding
Institutional Review Board Statement
Informed Consent Statement
Data Availability Statement
Acknowledgments
Conflicts of Interest
Disclosure
References
- Purohit, I.; Purohit, P. Techno-economic evaluation of concentrating solar power generation in India. Energy Policy 2010, 38, 3015–3029. [Google Scholar] [CrossRef]
- Tiwari, G.N. Solar Energy: Fundamentals, Design, Modelling and Applications; Narosa Publishing House: Delhi, India, 2012; pp. 94–95. [Google Scholar]
- Gielen, D.; Boshell, F.; Saygin, D.; Bazilian, M.D.; Wagner, N.; Gorini, R. The role of renewable energy in the global energy transformation. Energy Strategy Rev. 2019, 24, 38–50. [Google Scholar] [CrossRef]
- Kuo, W.; Pan, C. A Reliability Look at Energy Development. Joule 2018, 2, 5–9. [Google Scholar] [CrossRef] [Green Version]
- Ritchie, H.; Roser, M.; Rosado, P. Renewable Energy; Our World Data: Oxford, UK, 2020. [Google Scholar]
- Raj, B.; Meena, C.; Agarwal, N.; Saini, L.; Khahro, S.H.; Subramaniam, U.; Ghosh, A. A Review on Numerical Approach to Achieve Building Energy Efficiency for Energy, Economy and Environment (3E) Benefit. Energies 2021, 14, 4487. [Google Scholar] [CrossRef]
- Saini, L.; Meena, C.S.; Raj, B.P.; Agarwal, N.; Kumar, A. Net Zero Energy Consumption building in India: An overview and initiative toward sustainable future. Int. J. Green Energy 2021, 19, 544–561. [Google Scholar] [CrossRef]
- Xu, J.; Akhtar, M.; Haris, M.; Muhammad, S.; Abban, O.J.; Taghizadeh-Hesary, F. Energy crisis, firm profitability, and productivity: An emerging economy perspective. Energy Strat. Rev. 2022, 41, 100849. [Google Scholar] [CrossRef]
- Poudyal, R.; Loskot, P.; Nepal, R.; Parajuli, R.; Khadka, S.K. Mitigating the current energy crisis in Nepal with renewable energy sources. Renew. Sustain. Energy Rev. 2019, 116, 109388. [Google Scholar] [CrossRef]
- Das Gupta, S. Using real options to value capacity additions and investment expenditures in renewable energies in India. Energy Policy 2021, 148, 111916. [Google Scholar] [CrossRef]
- Kumar, B.S.; Sudhakar, K. Performance evaluation of 10 MW grid connected solar photovoltaic power plant in India. Energy Rep. 2015, 1, 184–192. [Google Scholar] [CrossRef] [Green Version]
- Azad, R.; Chakraborty, S. Green Growth and the Right to Energy in India. Energy Policy 2020, 141, 111456. [Google Scholar] [CrossRef]
- Patil, P.; Sharma, S.C.; Paliwal, V.; Kumar, A. ANN modeling of Cu type omega vibration based mass flow sensor. Procedia Technology 2014, 14, 260–265. [Google Scholar] [CrossRef] [Green Version]
- Mohanraj, M.; Belyayev, Y.; Jayaraj, S.; Kaltayev, A. Research and developments on solar assisted compression heat pump systems—A comprehensive review (Part A: Modeling and modifications). Renew. Sustain. Energy Rev. 2018, 83, 90–123. [Google Scholar] [CrossRef]
- Meena, C.S.; Meena, S.; Bajpai, V. Correlation between Absorber Plate Thickness δ and Collector Efficiency Factor Fˈ of Solar Flat-Plate Collector. Appl. Mech. Mater. 2014, 592–594, 2341–2344. [Google Scholar] [CrossRef]
- Meena, C.S.; Das, A.K. Boiling Heat Transfer on Cylindrical Surface: An Experimental Study. Heat Transf. Eng. 2022, 1–13. [Google Scholar] [CrossRef]
- Meena, C.S.; Deep, A.; Das, A.K. Understanding of Interactions for Bubbles Generated at Neighboring Nucleation Sites. Heat Transf. Eng. 2017, 39, 885–900. [Google Scholar] [CrossRef]
- Meena, S.; Meena, C.S.; Bajpai, V.K. Thermal Performance of Flat-Plate Collector: An Experimental Study. Int. J. Eng. Res. Appl. 2014, 1–4. [Google Scholar]
- Klein, S.A. Calculation of flat-plate collector loss coefficients. SoEn 1975, 17, 79. [Google Scholar] [CrossRef]
- Meena, C.; Raj, B.; Saini, L.; Agarwal, N.; Ghosh, A. Performance Optimization of Solar-Assisted Heat Pump System for Water Heating Applications. Energies 2021, 14, 3534. [Google Scholar] [CrossRef]
- Meena, S.; Meena, C.S.; Bajpai, V. Relation between Collector Efficiency Factor and the Centre to Centre Distance of Absorber Tubes of Solar Flat-Plate Collector. Appl. Mech. Mater. 2014, 592–594, 2404–2408. [Google Scholar] [CrossRef]
- Mohanraj, M.; Belyayev, Y.; Jayaraj, S.; Kaltayev, A. Research and developments on solar assisted compression heat pump systems—A comprehensive review (Part-B: Applications). Renew. Sustain. Energy Rev. 2018, 83, 124–155. [Google Scholar] [CrossRef]
- Patil, P.; Sharma, S.C.; Jaiswal, H.; Kumar, A. Modeling influence of tube material on vibration based EMMFS using ANFIS. Procedia Material Science 2014, 6, 1097–1103. [Google Scholar] [CrossRef]
- Wang, S.; He, Y.; Tuo, H.; Cao, F.; Xing, Z. Effect of heat transfer area and refrigerant mass flux in a gas cooler on heating performance of air-source transcritical CO2 heat pump water heater system. Energy Build. 2013, 67, 1–10. [Google Scholar] [CrossRef]
- Nawaz, K.; Shen, B.; Elatar, A.; Baxter, V.; Abdelaziz, O. Performance optimization of CO2 heat pump water heater. Int. J. Refrig. 2018, 85, 213–228. [Google Scholar] [CrossRef]
- Ghoubali, R.; Byrne, P.; Bazantay, F. Refrigerant charge optimisation for propane heat pump water heaters. Int. J. Refrig. 2017, 76, 230–244. [Google Scholar] [CrossRef]
- Nawaz, K.; Shen, B.; Elatar, A.; Baxter, V.; Abdelaziz, O. R1234yf and R1234ze(E) as low-GWP refrigerants for residential heat pump water heaters. Int. J. Refrig. 2017, 82, 348–365. [Google Scholar] [CrossRef]
- Nawaz, K.; Shen, B.; Elatar, A.; Baxter, V.; Abdelaziz, O. R290 (propane) and R600a (isobutane) as natural refrigerants for residential heat pump water heaters. Appl. Therm. Eng. 2017, 127, 870–883. [Google Scholar] [CrossRef]
- Ortega, I.; Sieres, J.; Cerdeira, F.; Álvarez, E.; Rodríguez, J. Performance analysis of a R407C liquid-to-water heat pump: Effect of a liquid–vapor heat exchanger and domestic hot water production. Int. J. Refrig. 2019, 101, 125–135. [Google Scholar] [CrossRef]
- Frątczak, M.; Czeczot, J.; Nowak, P.; Metzger, M. Practical validation of the effective control of liquid–liquid heat exchangers by distributed parameter balance-based adaptive controller. Appl. Therm. Eng. 2018, 129, 549–556. [Google Scholar] [CrossRef]
- Yerdesh, Y.; Abdulina, Z.; Aliuly, A.; Belyayev, Y.; Mohanraj, M.; Kaltayev, A. Numerical simulation on solar collector and cascade heat pump combi water heating systems in Kazakhstan climates. Renew. Energy 2020, 145, 1222–1234. [Google Scholar] [CrossRef]
- Dai, N.; Li, S. Simulation and performance analysis on condenser coil in household heat pump water heater. Sustain. Cities Soc. 2018, 36, 176–184. [Google Scholar] [CrossRef]
- Kong, X.; Wang, B.; Shang, Y.; Li, J.; Li, Y. Influence of different regulation modes of compressor speed on the performance of direct-expansion solar-assisted heat pump water heater. Appl. Therm. Eng. 2020, 169, 115007. [Google Scholar] [CrossRef]
- Staley, D.M.; Bullard, C.W.; Crawford, R.R. Steady-State Performance of a Domestic Refrigerator/Freezer Using R12 and R134a; Air Conditioning and Refrigeration Center: Urbana, IL, USA, 1992. [Google Scholar]
- Kong, X.; Jiang, K.; Dong, S.; Li, Y.; Li, J. Control strategy and experimental analysis of a direct-expansion solar-assisted heat pump water heater with R134a. Energy 2018, 145, 17–24. [Google Scholar] [CrossRef]
- Kong, X.; Sun, P.; Li, Y.; Jiang, K.; Dong, S. Experimental studies of a variable capacity direct-expansion solar-assisted heat pump water heater in autumn and winter conditions. Sol. Energy 2018, 170, 352–357. [Google Scholar] [CrossRef]
- Wu, X.; Xing, Z.; He, Z.; Wang, X.; Chen, W. Effects of lubricating oil on the performance of a semi-hermetic twin screw refrigeration compressor. Appl. Therm. Eng. 2017, 112, 340–351. [Google Scholar] [CrossRef]
- Rabelo, S.N.; Paulino, T.F.; Duarte, W.M.; Maia, A.A.T.; Machado, L. Experimental analysis of the influence of the expansion valve opening on the performance of the small size CO2 solar assisted heat pump. Sol. Energy 2019, 190, 255–263. [Google Scholar] [CrossRef]
- Kumar, A.; Patil, P. FEA simulation based performance study of multi speed transmission gearbox. Int. J. Manuf. Mater. Mech. Eng. 2016, 6, 57–67. [Google Scholar] [CrossRef]
- Harby, K. Hydrocarbons and their mixtures as alternatives to environmental unfriendly halogenated refrigerants: An updated overview. Renew. Sustain. Energy Rev. 2017, 73, 1247–1264. [Google Scholar] [CrossRef]
- Shi, G.-H.; Aye, L.; Li, D.; Du, X.-J. Recent advances in direct expansion solar assisted heat pump systems: A review. Renew. Sustain. Energy Rev. 2019, 109, 349–366. [Google Scholar] [CrossRef]
- Li, Y.W.; Wang, R.Z.; Wu, J.Y.; Xu, Y.X. Experimental performance analysis and optimization of a direct expansion solar-assisted heat pump water heater. Energy 2007, 32, 1361–1374. [Google Scholar] [CrossRef]
- Chyng, J.P.; Lee, C.P.; Huang, B.J. Performance analysis of a solar-assisted heat pump water heater. Sol. Energy 2003, 74, 33–44. [Google Scholar] [CrossRef]
- Moreno-Rodriguez, A.; Garcia-Hernando, N.; González-Gil, A.; Izquierdo, M. Experimental validation of a theoretical model for a direct-expansion solar-assisted heat pump applied to heating. Energy 2013, 60, 242–253. [Google Scholar] [CrossRef]
- Kong, X.Q.; Li, Y.; Lin, L.; Yang, Y.G. Modeling evaluation of a direct-expansion solar-assisted heat pump water heater using R410A. Int. J. Refrig. 2017, 76, 136–146. [Google Scholar] [CrossRef]
- Kurian, R.; Kulkarni, K.S.; Ramani, P.V.; Meena, C.S.; Kumar, A.; Cozzolino, R. Estimation of Carbon Footprint of Residential Building in Warm Humid Climate of India through BIM. Energies 2021, 14, 4237. [Google Scholar] [CrossRef]
- Singh, V.P.; Jain, S.; Karn, A.; Kumar, A.; Dwivedi, G.; Meena, C.S.; Dutt, N.; Ghosh, A. Recent Developments and Advancements in Solar Air Heaters: A Detailed Review. Sustainability 2022, 14, 12149. [Google Scholar] [CrossRef]
- Abou-Ziyan, H.Z.; Ahmed, M.F.; Metwally, M.N.; El-Hameed, H.M.A. Solar-assisted R22 and R134a heat pump systems for low-temperature applications. Appl. Therm. Eng. 1997, 17, 455–469. [Google Scholar] [CrossRef]
- Bitzer. Refrigerant Data (Overview). Available online: https://www.bitzer.de/shared_media/html/a-500-501/en-GB/index.html (accessed on 7 October 2022).
- Kim, W.; Choi, J.; Cho, H. Performance analysis of hybrid solar-geothermal CO2 heat pump system for residential heating. Renew. Energy 2013, 50, 596–604. [Google Scholar] [CrossRef]
- Choi, J.; Kang, B.; Cho, H. Performance comparison between R22 and R744 solar-geothermal hybrid heat pumps according to heat source conditions. Renew. Energy 2014, 71, 414–424. [Google Scholar] [CrossRef]
- Mohanraj, M.; Jayaraj, S.; Muraleedharan, C. Exergy Assessment of a Direct Expansion Solar-Assisted Heat Pump Working with R22 and R407C/LPG Mixture. Int. J. Green Energy 2010, 7, 65–83. [Google Scholar] [CrossRef]
- Li, S.; Li, S.; Zhang, X. Comparison analysis of different refrigerants in solar-air hybrid heat source heat pump water heater. Int. J. Refrig. 2015, 57, 138–146. [Google Scholar] [CrossRef]
- Fan, Y.; Zhao, X.; Han, Z.; Li, J.; Badiei, A.; Akhlaghi, Y.G.; Liu, Z. Scientific and technological progress and future perspectives of the solar assisted heat pump (SAHP) system. Energy 2021, 229, 120719. [Google Scholar] [CrossRef]
- Alam, T.; Balam, N.B.; Kulkarni, K.S.; Siddiqui, I.H.; Kapoor, N.R.; Meena, C.S.; Kumar, A.; Cozzolino, R. Performance Augmentation of the Flat Plate Solar Thermal Collector: A Review. Energies 2021, 14, 6203. [Google Scholar] [CrossRef]
- Govind; Tiwari, G.N. Economic analysis of some solar energy systems. Energy Convers. Manag. 1984, 24, 131–135. [Google Scholar] [CrossRef]
- Meena, C.S.; Kumar, A.; Roy, S.; Cannavale, A.; Ghosh, A. Review on Boiling Heat Transfer Enhancement Techniques. Energies 2022, 15, 5759. [Google Scholar] [CrossRef]
- Singh, V.P.; Jain, S.; Karn, A.; Kumar, A.; Dwivedi, G.; Meena, C.S.; Cozzolino, R. Mathematical Modeling of Efficiency Evaluation of Double-Pass Parallel Flow Solar Air Heater. Sustainability 2022, 14, 10535. [Google Scholar] [CrossRef]
- Singh, V.P.; Jain, S.; Kumar, A. Establishment of correlations for the thermo-hydraulic parameters due to perforation in a multi-V rib roughened single pass solar air heater. Exp. Heat Transf. 2022, 1–20. [Google Scholar] [CrossRef]
- Meena, C.S.; Kumar, A.; Jain, S.; Rehman, A.U.; Mishra, S.; Sharma, N.K.; Bajaj, M.; Shafiq, M.; Eldin, E.T. Innovation in Green Building Sector for Sustainable Future. Energies 2022, 15, 6631. [Google Scholar] [CrossRef]
- Singh, V.P.; Jain, S.; Karn, A.; Dwivedi, G.; Kumar, A.; Mishra, S.; Sharma, N.K.; Bajaj, M.; Zawbaa, H.M.; Kamel, S. Heat transfer and friction factor correlations development for double pass solar air heater artificially roughened with perforated multi-V ribs. Case Stud. Therm. Eng. 2022, 39, 102461. [Google Scholar] [CrossRef]
- Dutt, N.; Binjola, A.; Hedau, A.J.; Kumar, A.; Singh, V.P.; Meena, C.S. Comparison of CFD Results of Smooth Air Duct with Experimental and Available Equations in Literature. Int. J. Energy Resour. Appl. 2022, 1, 40–47. [Google Scholar] [CrossRef]
- Patil, P.; Kumar, A.; Gori, Y. FEA design and analysis of flow sensor. Materialstoday Proc. 2021, 46, 10563–10568. [Google Scholar] [CrossRef]
- Gori, Y.; Verma, R.P.; Kumar, A.; Patil, P. FEA Based Fatigue crack Growth Analysis. Materialstoday Proc. 2021, 46, 10575–10581. [Google Scholar] [CrossRef]
- Patil, P.P.; Kumar, A. Design and FEA Simulation of Omega Type Coriolis Mass Flow Sensor. Int. J. Control. Theory Appl. 2017, 9, 383–387. [Google Scholar]
- Paul, A.K.; Prasad, A.; Kumar, A. Review on artificial neural network and its application in the field of engineering. Journal of Mechanical Engineering: PRAKASH 2022, 1, 53–61. [Google Scholar] [CrossRef]
- Bhoi, S.; Kumar, A.; Prasad, A.; Meena, C.S.; Sarkar, R.B.; Mahto, B.; Ghosh, A. Performance Evaluation of Different Coating Materials in Delamination for Micro-Milling Applications on High-Speed Steel Substrate. Micromachines 2022, 13, 1277. [Google Scholar] [CrossRef] [PubMed]
- Rana, S.; Kumar, A.; Gori, Y.; Patil, P. Design and Analysis of Thermal Contact Conductance. J. Crit. Rev. 2019, 6, 363–370. [Google Scholar]
- Rana, S.; Kumar, A. FEA Based Design and Thermal Contact Conductance Analysis of Steel and Al Rough Surfaces. Int. J. Appl. Eng. Res. 2019, 13, 12715–12724. [Google Scholar]
- Kumar, A.; Rana, S.; Gori, Y.; Sharma, N.K. Thermal Contact Conductance prediction Using FEM Based computational Techniques. In Advanced Computational Methods in Mechanical and Materials Engineering; Kumar, A., Gori, Y., Dutt, N., Singla, Y.K., Maurya, A., Eds.; CRC Press: Boca Raton, FL, USA, 2022; Chapter 11; pp. 183–220. [Google Scholar] [CrossRef]
- Srivastava, S.; Verma, D.; Thusoo, S.; Kumar, A.; Singh, V.P.; Kumar, R. Nanomanufacturing for Energy Conversion and Storage Devices. In Nanomanufacturing and Nanomaterials Design: Principles and Applications; Singh, S., Behura, S.K., Kumar, A., Verma, K., Eds.; CRC Press: Boca Raton, FL, USA, 2022; Chapter 10; pp. 165–173. [Google Scholar] [CrossRef]
- Singh, V.P.; Dwivedi, A.; Karn, A.; Kumar, A.; Singh, S.; Srivastava, S.; Srivastava, K. Nanomanufacturing and Design of High-Performance Piezoelectric Nanogenerator for Energy Harvesting. In Nanomanufacturing and Nanomaterials Design: Principles and Applications; Singh, S., Behura, S.K., Kumar, A., Verma, K., Eds.; CRC Press: Boca Raton, FL, USA, 2022; Chapter 15; pp. 241–242. [Google Scholar] [CrossRef]


| Refrigerant | Chemical | Group | Name | Substitute for | Application Max Min |
|---|---|---|---|---|---|
| R134a | CF3CH2F | HFC | 1,1,1,2-tetra fluoroethane | R12, R22 | 25 °C–20 °C |
| Group | Refrigerants/Name | Refrigerant Properties |
|---|---|---|
| Chloroflurocarbons (CFCs) [50] | R11, R12 | High Ozone Depletion Potential High Global Warming Potential |
| Hydrochloroflurocarbons (HCFCs) [51] | R22, R123 | Low Ozone Depletion Potential High Global Warming Potential |
| Hydroflurocarbons (HFCs) [52] | R134a, R152a, R125, R32, R404A, R407C, R410A | Zero Ozone Depletion Potential Low Global Warming Potential |
| Natural refrigerants [53] | R290, R1270, R744, R431A, R43A, R433A | No risk of ozone depletion. Negligible Global Warming |
| Hydrofluroolefins (HFO) [14] | R1234ye, R1234yf | There is no risk of ozone depletion Negligible Global Warming |
| HFC/HC mixtures [54] | R417A, R422A, R430A | Zero Ozone Depletion Potential High Global Warming Potential |
| Time Interval | Temperature Raised | Energy Consumption (kWh) | Time (Min) | COP | |
|---|---|---|---|---|---|
| Initial (°C) | Final (°C) | ||||
| 08:00 to 09:45 | 20 °C | 45 °C | 0.4 | 105 | 4.359 |
| ΔT = 25 °C | |||||
| 10:20 to 11:25 | 20 °C | 45 °C | 0.3 | 65 | 5.628 |
| ΔT = 25 °C | |||||
| 16:40 to 19:00 | 25 °C | 45 °C | 0.7 | 140 | 1.993 |
| ΔT = 20 °C | |||||
| Time Interval | Average Irradiance (W/m2) | Wind Velocity (m/sec) | Ambient Temperature (°C) | Hot Water Flow Rate (Liters/min) | Total Water Consumption (Liters) | COP |
|---|---|---|---|---|---|---|
| 10:00 to 10:15 | 684 | 3.2 | 32.8 | 0.66 | 10 | 5.580 |
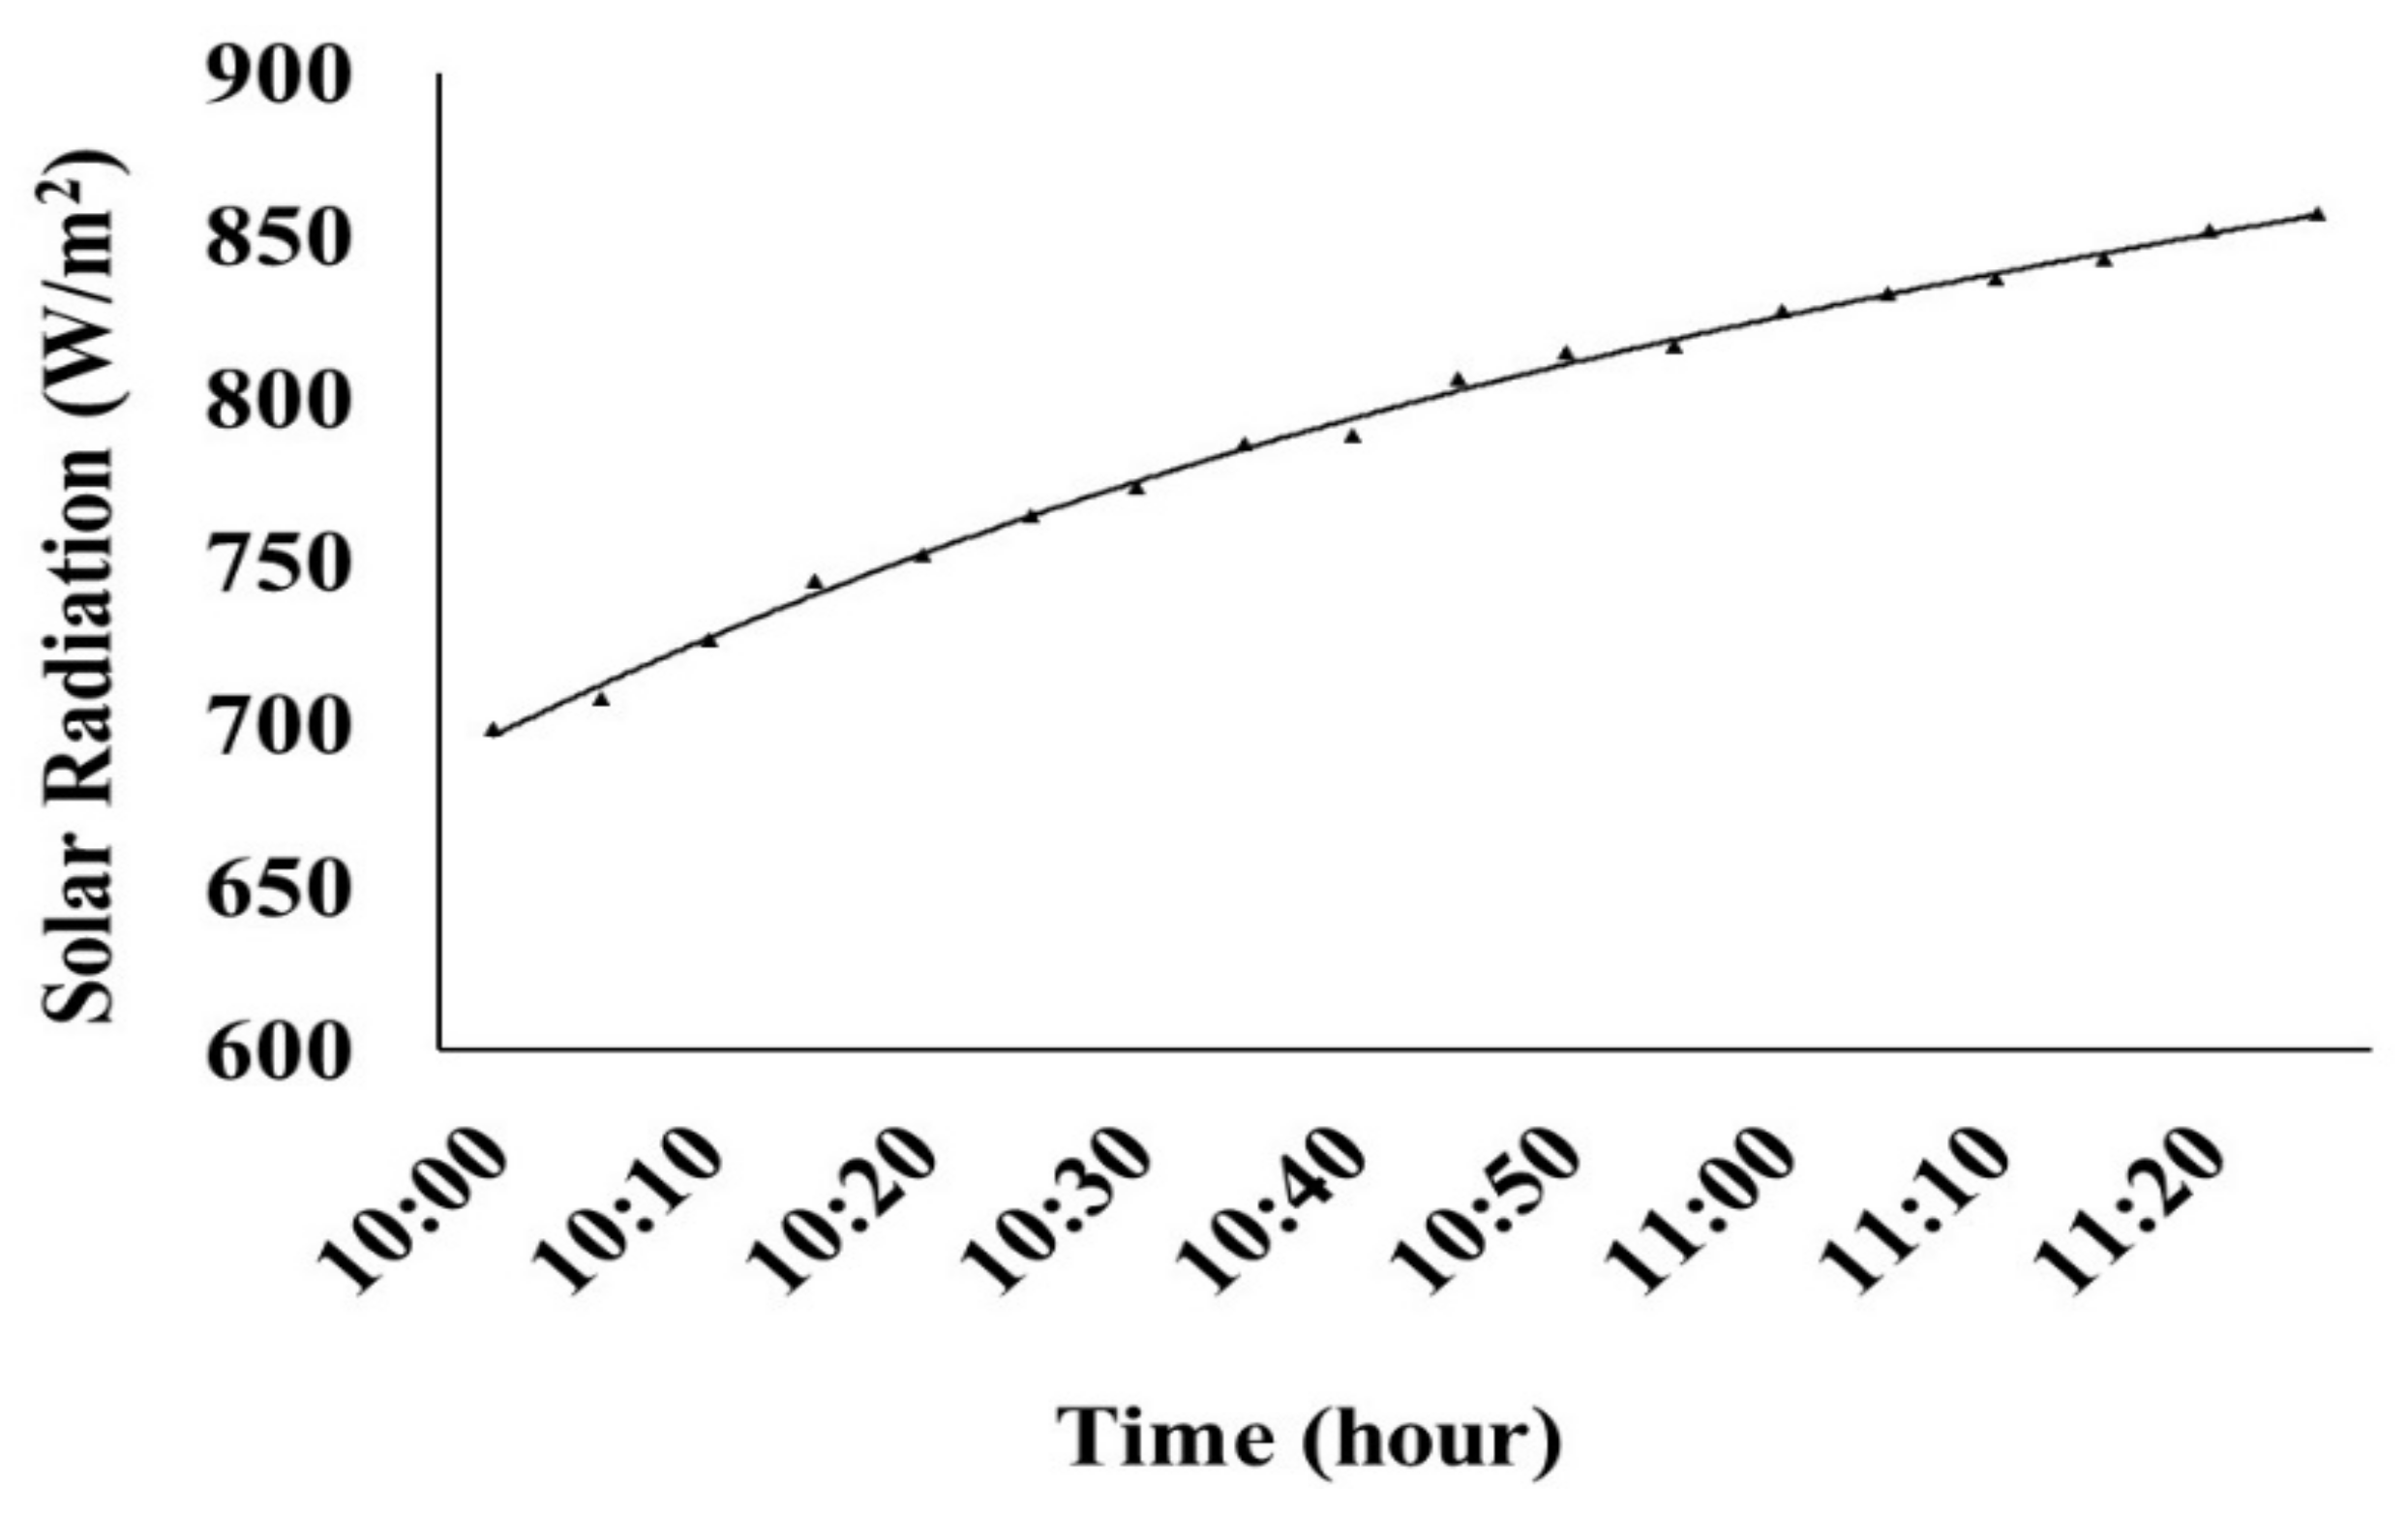
| 10:15 to 10:30 | 715 | 1.5 | 33.1 | 0.66 | 10 | 5.580 |
| 10:30 to 10:45 | 750 | 2.8 | 32.9 | 0.80 | 12 | 6.696 |
| 10:45 to 11:00 | 783 | 1.8 | 34.5 | 0.86 | 13 | 7.254 |
| Time Interval | Average Irradiance (W/m2) | Wind Velocity (m/sec) | Ambient Temperature (°C) | Hot Water Flow Rate (Liters/min) | Total Water Consumption (Liters) | COP |
|---|---|---|---|---|---|---|
| 15:00 to 15:15 | 635 | 1.4 | 39.4 | 0.66 | 12 | 8.371 |
| 15:15 to 15:30 | 580 | 1.9 | 39.2 | 0.66 | 10 | 6.975 |
| 15:30 to 15:45 | 532 | 0.7 | 39.2 | 0.80 | 08 | 5.580 |
| 15:45 to 16:00 | 468 | 2.1 | 38.9 | 0.86 | 05 | 3.487 |
| Time Interval | Average Irradiance (W/m2) | Wind Velocity (m/sec) | Ambient Temperature (°C) | Hot Water Flow Rate (Liters/min) | Total Water Consumption (Liters) | COP |
|---|---|---|---|---|---|---|
| 09:00 to 09:15 | 521 | 0 | 32.6 | 0.4 | 6 | 3.348 |
| 09:15 to 09:30 | 563 | 1.5 | 33.0 | 0.53 | 8 | 4.464 |
| 09:30 to 09:45 | 604 | 0 | 33.6 | 0.53 | 8 | 4.464 |
| 09:45 to 10:00 | 650 | 1.2 | 33.9 | 0.66 | 10 | 6.975 |
| Time Interval | Average Irradiance (W/m2) | Wind Velocity (m/sec) | Ambient Temperature (°C) | Hot Water Flow Rate (Liters/min) | Total Water Consumption (Liters) | COP |
|---|---|---|---|---|---|---|
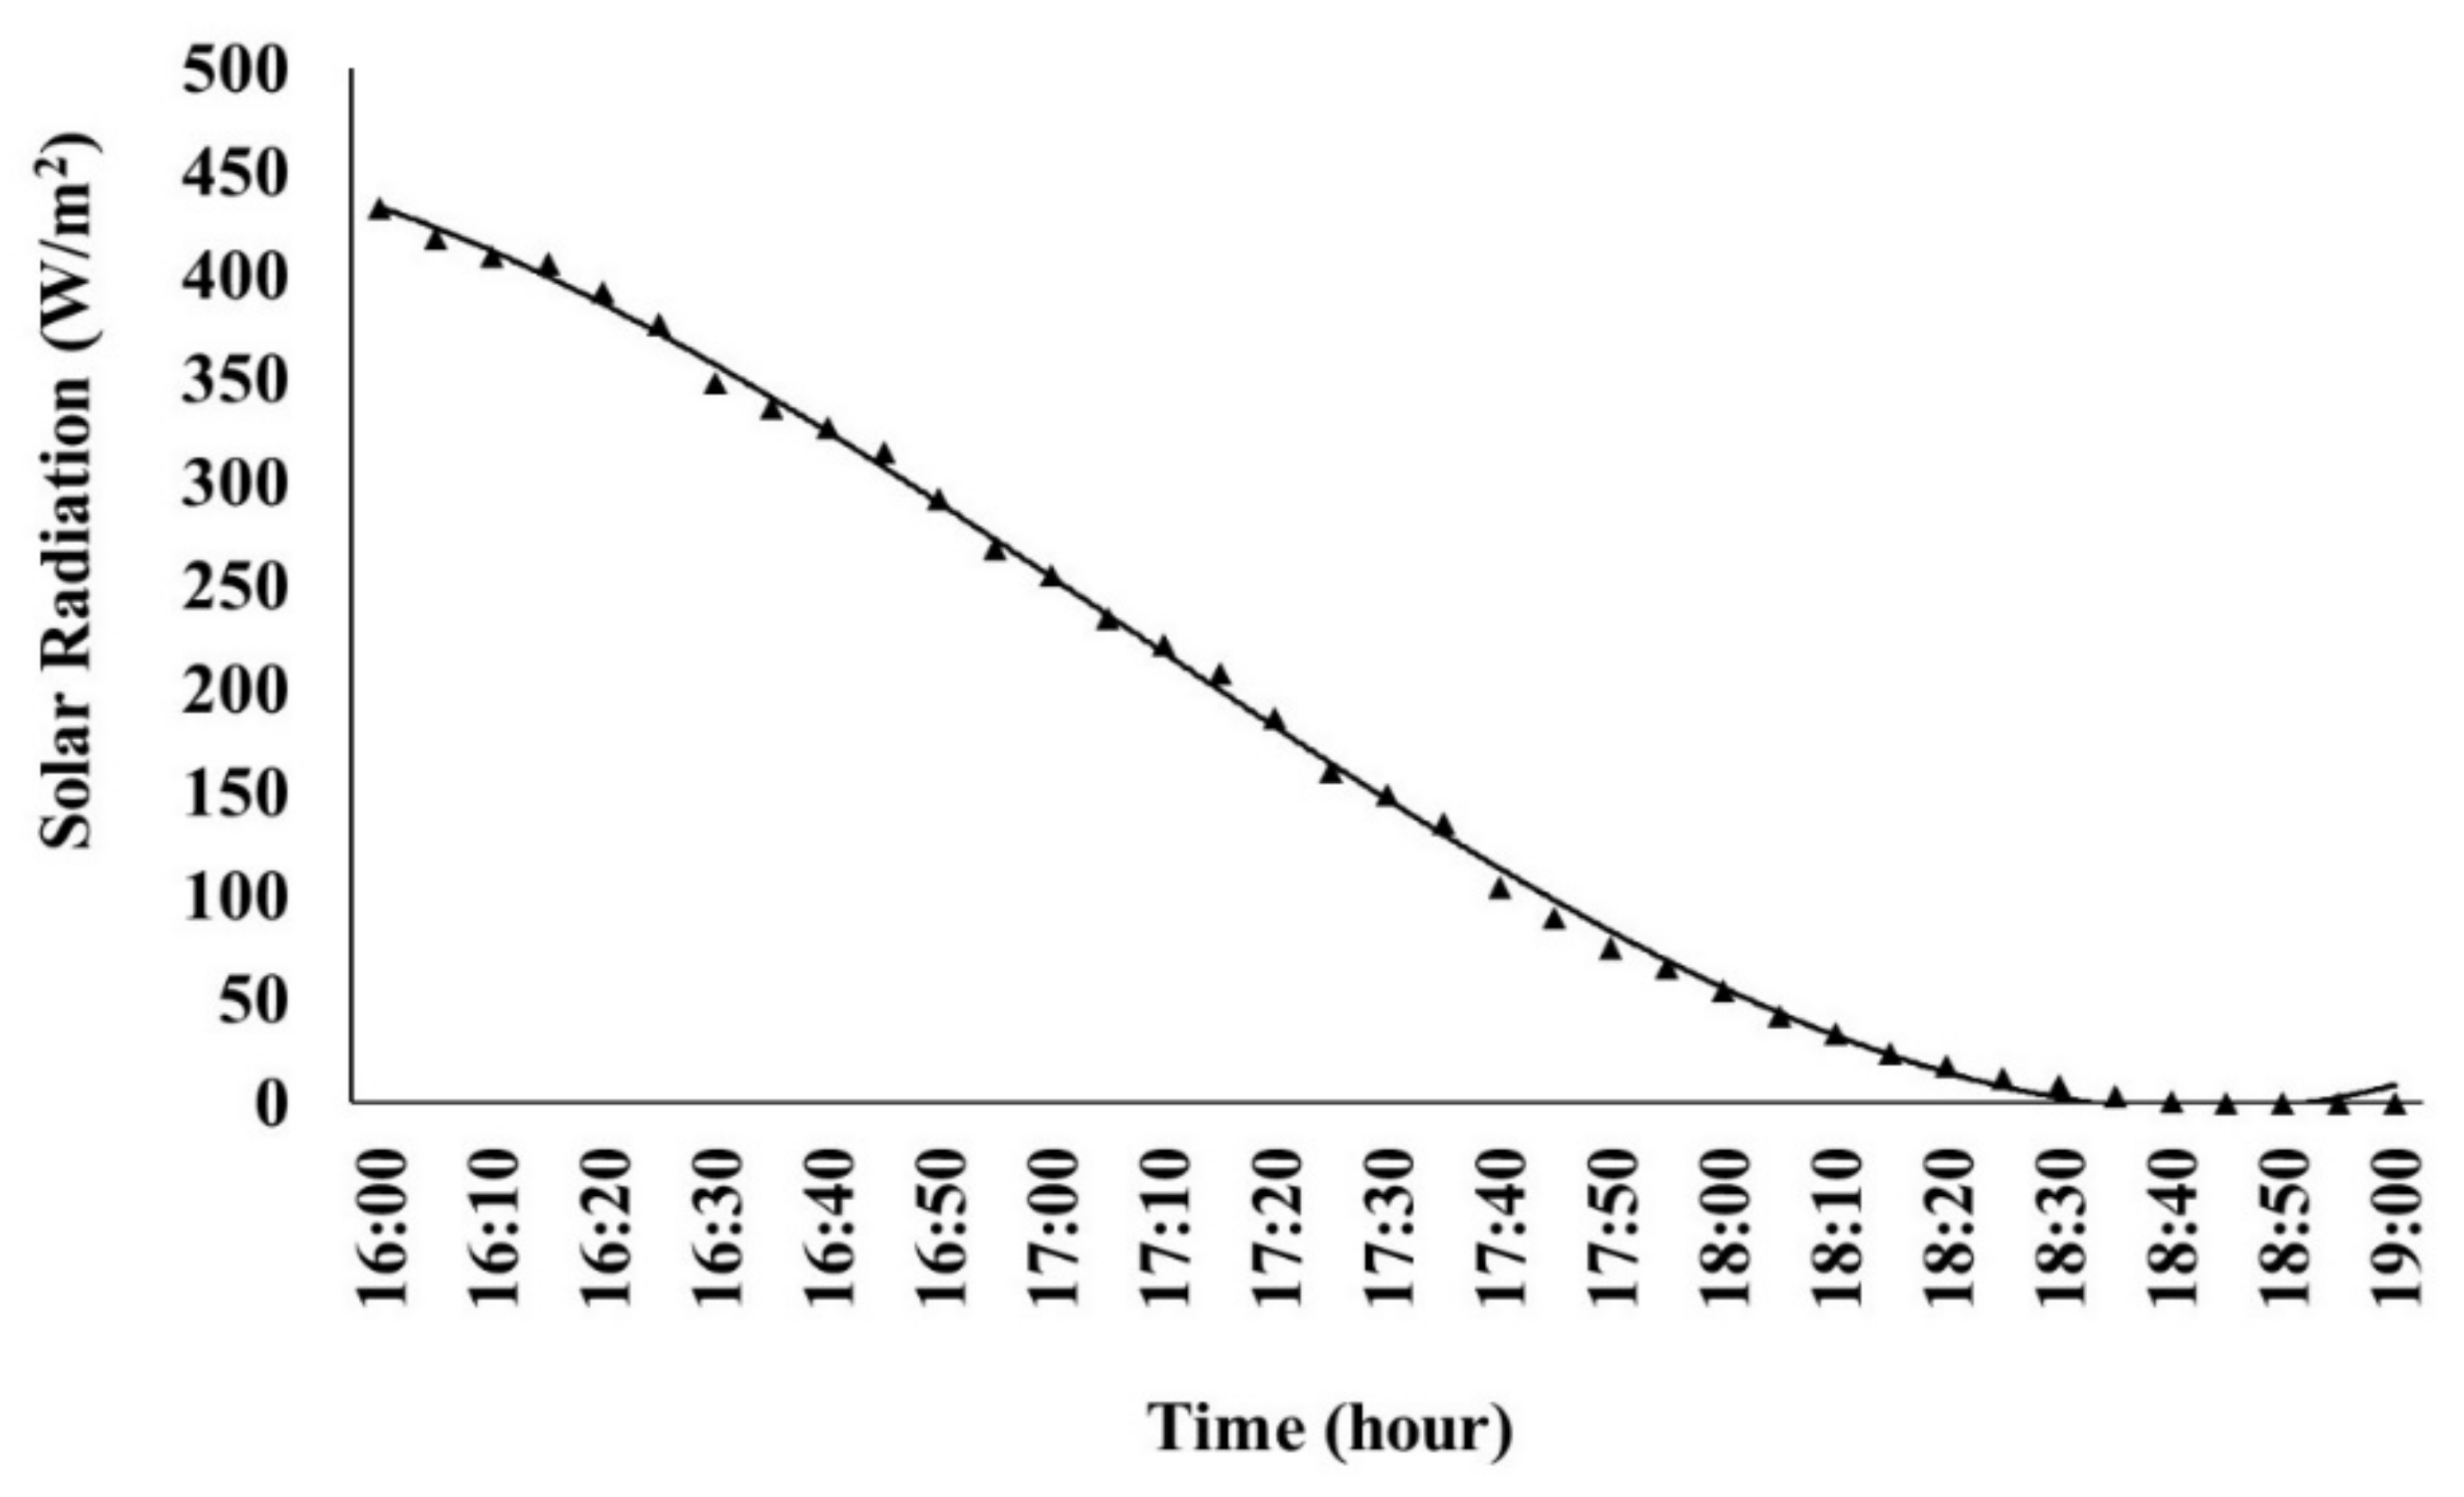
| 16:00 to 16:15 | 401 | 1.2 | 38.9 | 0.53 | 8 | 5.284 |
| 16:15 to 16:30 | 347 | 1.5 | 38.7 | 0.4 | 6 | 3.963 |
| 16:30 to 16:45 | 303 | 1.7 | 38.6 | 0.2 | 3 | 1.981 |
| 16:45 to 17:00 | 225 | 0.9 | 38.4 | 0.2 | 3 | 1.981 |
| Time Interval | Average Irradiance (W/m2) | Wind Velocity (m/sec) | Ambient Temperature (°C) | Hot Water Flow Rate (Liters/min) | Total Water Consumption (Liters) | COP |
|---|---|---|---|---|---|---|
| 17:00 to 17:15 | 144 | 1.9 | 38.4 | 0.33 | 5 | 1.937 |
| 17:15 to 17:30 | 90 | 1.3 | 36.7 | 0.26 | 4 | 1.550 |
| 17:30 to 17:45 | 48 | 0.6 | 34.8 | 0.13 | 2 | _ |
| 17:45 to 18:00 | 29 | 0.9 | 32.8 | 0.13 | 2 | _ |
| Materials | Cost in India Rs. | |
|---|---|---|
| (a) | SAHP parts (For 1.36 m2 collector area) | |
| Compressor (Hermetically sealed 1 unit) | 6000 | |
| Copper plate (1.3698 m2) | 1000 | |
| Copper tube (25 m) | 1400 | |
| Refrigerant (1.2 L) | 1200 | |
| Matt black paint (800 mL) | 400 | |
| Aluminum frame (1060 mm × 1510 mm) | 4000 | |
| Water tank | 3000 | |
| Insulation | 2000 | |
| Control panel | 1000 | |
| Brazing charge | 1000 | |
| Labor | 2000 | |
| Glass glazing (1000 mm × 1450 mm × 5 mm) | 2000 | |
| Total cost | 25,000 | |
| (b) | Salvage value | |
| Salvage value of SAHP | 4000 |
| S. No. | Volume of Water (Liters) | Change in Temperature (°C) | Solar Intensity (W/m2) | (a) Energy Consumption in SAHP System (kWh) | (b) Energy Consumption in Electric Heater (kWh) | (b − a) Save in Energy (kWh) |
|---|---|---|---|---|---|---|
| 1 | 60 | 25 | 244–683 | 0.4 | 1.75 | 1.35 |
| 2 | 60 | 25 | 699–857 | 0.3 | 1.75 | 1.45 |
| 3 | 60 | 20 | 432–0 | 0.7 | 1.4 | 0.7 |
| 4 | 45 | 25 | 635–740 | 0.3 | 1.31 | 1.01 |
Publisher’s Note: MDPI stays neutral with regard to jurisdictional claims in published maps and institutional affiliations. |
© 2022 by the authors. Licensee MDPI, Basel, Switzerland. This article is an open access article distributed under the terms and conditions of the Creative Commons Attribution (CC BY) license (https://creativecommons.org/licenses/by/4.0/).
Share and Cite
Meena, C.S.; Prajapati, A.N.; Kumar, A.; Kumar, M. Utilization of Solar Energy for Water Heating Application to Improve Building Energy Efficiency: An Experimental Study. Buildings 2022, 12, 2166. https://doi.org/10.3390/buildings12122166
Meena CS, Prajapati AN, Kumar A, Kumar M. Utilization of Solar Energy for Water Heating Application to Improve Building Energy Efficiency: An Experimental Study. Buildings. 2022; 12(12):2166. https://doi.org/10.3390/buildings12122166
Chicago/Turabian StyleMeena, Chandan Swaroop, Amit Nandan Prajapati, Ashwani Kumar, and Manoj Kumar. 2022. "Utilization of Solar Energy for Water Heating Application to Improve Building Energy Efficiency: An Experimental Study" Buildings 12, no. 12: 2166. https://doi.org/10.3390/buildings12122166