Article

Low Carbon Bacterial Self-Healing Concrete

by
João Miguel Peres Medeiros
* and
Luigi Di Sarno
Department of Civil Engineering and Industrial Design, School of Engineering, The University of Liverpool, Liverpool L69 3BX, UK
*
Author to whom correspondence should be addressed.
Buildings 2022, 12(12), 2226; https://doi.org/10.3390/buildings12122226
Submission received: 21 November 2022 / Revised: 6 December 2022 / Accepted: 12 December 2022 / Published: 14 December 2022

Abstract

:
A greener and more sustainable option is proposed to shift the construction paradigm of high embedded carbon values in concrete and the frequency of repairs when it cracks. Using low-carbon concrete with a bacterial self-healing agent can reduce the embedded carbon value while adding value to the structure. This paper aims to evaluate the interaction of a bacterial self-healing agent on the mechanical properties of low-carbon concrete, specifically 50% Ground Granulated Blast-furnace Slag (GGBS) as an Ordinary Portland Cement (OPC) replacement. A range of tests is conducted to test the evolution of mechanical properties throughout the early stages of curing for 7, 14, and 28 days. Such tests included the evaluation of compression, flexural, tensile splitting strength and dynamic elastic modulus. The results of the experiments demonstrate that early stages of GGBS mixes exhibit lower compressive capacity throughout the 28-day mark but also indicate their potential to increase sharply and surpass the control mix values after 28 days. The self-healing agent interacts slightly with the GGBS mixes, further reducing the mechanical properties in the early curing stages. However, GGBS mixes increase sharply after the 28-day mark, with the added benefit of further reducing carbon emissions by extending design life and durability. In theory, the newly developed concrete can seal cracks up to 0.3 mm (up to 0.8 mm if using the maximum dosage) but seal wider cracks from laboratory results. These changes imply that using GGBS as a replacement for OPC is viable for structures that do not require high compressive values in the early curing stages but after the 28-day mark while reducing the carbon emission values substantially, in this case, 40%, or up to 50% if using a self-healing agent. This low-carbon concrete is thus a sustainable and resilient material, especially for retrofitting existing reinforced concrete infrastructure.

1. Introduction

With the new awareness of carbon emissions, the scientific community is making an effort to reduce the use of most pollutant construction materials, including concrete, the most consumed material, with three tonnes per year used by every person in the world [1].
Ordinary Portland cement (OPC) has the highest embedded carbon value in a concrete mix. Hence, cementitious replacements with a low carbon embedded [2,3,4] are needed. Some materials such as fly ash (also called Pulverized Fly Ash, PFA) and Ground Granulated Blast-furnace Slag (GGBS) are currently being used for cement replacement. In the case of PFA, the material is being phased out since it is a sub-product of coal-burning industries; GGBS is a by-product of steel and iron industries, making it still available in the years to come. Based on the large quantities of the latter by-product, GGBS was the OPC replacement chosen for this study [5,6].
GGBS, like PFA, have low embedded carbon values with some cementitious properties, making these desirable materials to replace OPC. GGBS has been used as an OPC replacement in several ratios, from 5 to 95% [7]. Values between 5 to 20% grant concrete high values of early strength, but for a low-carbon concrete to be made, values higher than 50% are more appealing, allowing the branding of “green concrete”, with a sharp reduction of 50% of embedded carbon (e.g., [8,9]).
With GGBS ratios higher than 50% in the early stages, concrete compression appears to be lower than the control mix, but only for a time frame between 7 and 28 days. Above the 28-day mark, concrete high in GGBS will surpass the values of 100% OPC control mixes [6,8,10,11]. However, the existing studies do not account for the effects of self-healing concrete on mechanical properties.
Another approach being used to grant a lower embedded carbon is by extending the serviceability life of the concrete by adding, for example, a self-healing agent that allows micro-cracks to be healed [12,13,14,15,16]. The use of the latter agent is not just for aesthetic purposes but also for structural purposes, such as steel reinforcement protection in reinforced concrete (RC) structures and infrastructure. Several agents were tested, from organic (bacteria, fungi and enzymes) to inorganic (polyurethane-based polymers) [17,18], with different methods of application. One of the most promising results is obtained with bacterial agents. The latter is mixed with fresh concrete, ranging from a varied group of alkali-resistant bacteria in a spore form with a feed of calcium lactate that stays embedded in the concrete and only matures to fully developed bacteria when cracks are made and exposed to atmospheric air and moisture. As a result, this will allow bacteria to populate cracks and create calcium carbonate crystals, closing cracks and preventing further moisture damage into possible rebars in RC structures [19].
The Basilisk bacterial agent was patented in the Netherlands and sold in the UK as an additive capable of granting self-healing properties to concrete. Even though the bacteria are commonly present in the environment, and other studies point to the types of bacteria capable of self-healing, Basilisk was the first to make it commercially available.
Since this is a relatively innovative concept with concrete technology, there is a need to create new standards that allow the effective test of self-healing concrete [17,20,21,22,23,24].
Several test procedures are currently being used to quantify these novel concrete mixtures’ mechanical and chemical properties. Some include compressive, flexural, tensile resistance and resonant frequency to achieve the dynamic elastic modulus. Additionally, there is also a need to identify cracks and their evolution using X-ray tomography for 2D and 3D internal observation [25,26,27] and Digital Image Correlation (DIC) for surface displacements [28,29].
Specimens with internal cracks are subjected to water tightness tests to determine the efficiency of the bacterial self-healing agents, which will demonstrate if there is a progressive closure of cracks [18,22,30].
In the case of visible mineral precipitation sealing the cracks, it is possible to use Scanning Electron Microscopy (SEM) in combination with Energy Dispersive X-ray Spectrometer (EDX) and X-Ray Diffraction (XRD) to identify the chemical and elemental composition of the new crystalline formations [24,31,32,33,34].
This study will focus on the mechanical properties of three different concrete mixes, a control mix containing 100% OPC, a second mix that replaces 50% of OPC with GGBS, and a third mix similar to the second but adds a self-healing bacterial agent. The rationale of such an approach is to evaluate the mechanical properties of all mixes under the same materials and curing conditions. In the structural materials laboratory of the University of Liverpool, all the specimens were created, cured and tested for compression, flexural and splitting tensile strength. The dynamic elastic modulus was determined by resorting to a non-destructive test to determine the resonant frequency of prismatic specimens [35,36].
This research is significant for structural, environmental, economic, and aesthetic purposes where concrete plays the central role in RC structures and infrastructure, especially those that, throughout their service lifetime, tend to crack and spall from internal rebar oxidation, such as maritime constructions, flood-defence and motorways in extreme weather conditions. The self-healing agent considered in the present comprehensive experimental investigation will allow the slow autonomous closure of micro-cracks, which in normal circumstances would be unperceivable by the naked eye, allowing the diminishment of rebar exposure and the progressive worsening of cracks. This agent will lead to the extension of the existing ageing infrastructure’s service life whilst reducing concrete’s embedded carbon content with the partial usage of OPC replacements, in this case, GGBS.

2. Materials and Methods

The following concrete mixtures in Table 1 were created using the British method described in “BR 331 Design of normal concrete mixes. 2nd edition” [37], where a control mix was created with 100% OPC followed by the same mixture but with a replacement of 50% of the OPC with GGBS and finally by a mix that not only had 50% OPC replaced with GGBS but an added bacterial self-healing agent, creating three different mixes based on the control mix and maintaining the exact quantities of aggregate and water. The bacterial self-healing agent is commercially available in the UK and patented by Basilisk [38].
Several specimens were created for each mix and prepared according to BS EN 12390-1-2021 [39]. They include cubes (100 × 100 × 100 mm), prisms (100 × 100 × 500 mm) and cylinders (300 mm high by 100 mm diameter).
For compressive strength tests, the cubic specimens were used according to BS EN 12390-3-2019 [40], where a minimum of four cubes were used for each mix by the time of curing.
In the case of tensile splitting strength tests, the BS EN 12390-6-2009 [41] was used, where a minimum of three or more cylinders was used. Although some of the specimens were made invalid due to incorrect splitting fractures, the minimum of three specimens was still guaranteed.
The prismatic-shaped specimens were used to test flexural strength and determine the dynamic elastic modulus according to BS EN 12390-5-2019 [42] and BS EN 1881-209-1990 [43], respectively, where a minimum of three specimens per curing time was achieved.
Due to atmospheric conditions, every concrete mix had its water content adjusted while fresh and before casting into moulds to allow a slump test drop of 65 to 80 mm.
Several batches of each mix were created to allow testing of 7, 14 and 28-day curing.
The specimens were left curing in freshwater (15–20 °C) until the day of testing. Afterward, these were removed from the curing water bath and left to dry for 2 h (26–28 °C) to allow the specimen’s surface to air dry.
Compressive strength was tested using cubic specimens, tensile splitting with cylinder-shaped specimens, and flexural strength and dynamic modulus of elasticity with the prismatic-shaped specimens.
According to Eurocode 2 [44], the compressive strength values acquired from cubic specimens can be directly correlated to f c k , c u b e , which by interpolating values in Table 3.1 [44], or observing that the compressive strength of cylinders is approximately 80% of the cubic specimens of the BS EN 1992-1-1 [44], the value of f c k can be obtained, and correlated to tensile strength in the following manner:
f c t m = 0 , 30 · f c k 2 / 3   for   Concrete C 50 / 60 2 , 12 · ln 1 + 0 , 1 f c m   for   Concrete > C 50 / 60
where f c k relates to the characteristic compressive cylinder strength of concrete at 28 days, and f c t m (MPa) the mean value of axial tensile strength of concrete. The C50/60 parameter pertains to concrete with a compressive capacity of 50 Mpa for cylindrically shaped specimens or 60 MPa for cubic-shaped specimens.
The mean value of concrete cylinder compressive strength, f c m (MPa), can then be defined as [44]:
f c m = f c k + 8   MPa
The tensile splitting strength, also defined as fct,sp (MPa), is correlated to the axial tensile strength, in BS EN 1992-1-1:2004 [44], as:
fct = 0,9 fct,sp       (MPa)
This relates to fctm when fct is used as a mean of a range of values.
In the case of flexural tensile strength f c t m , f l , it can be related to the axial tensile strength as follows [44]:
f c t m , f l = m a x 1 , 6 h 1000 · f c t m f c t m                 ( MPa )
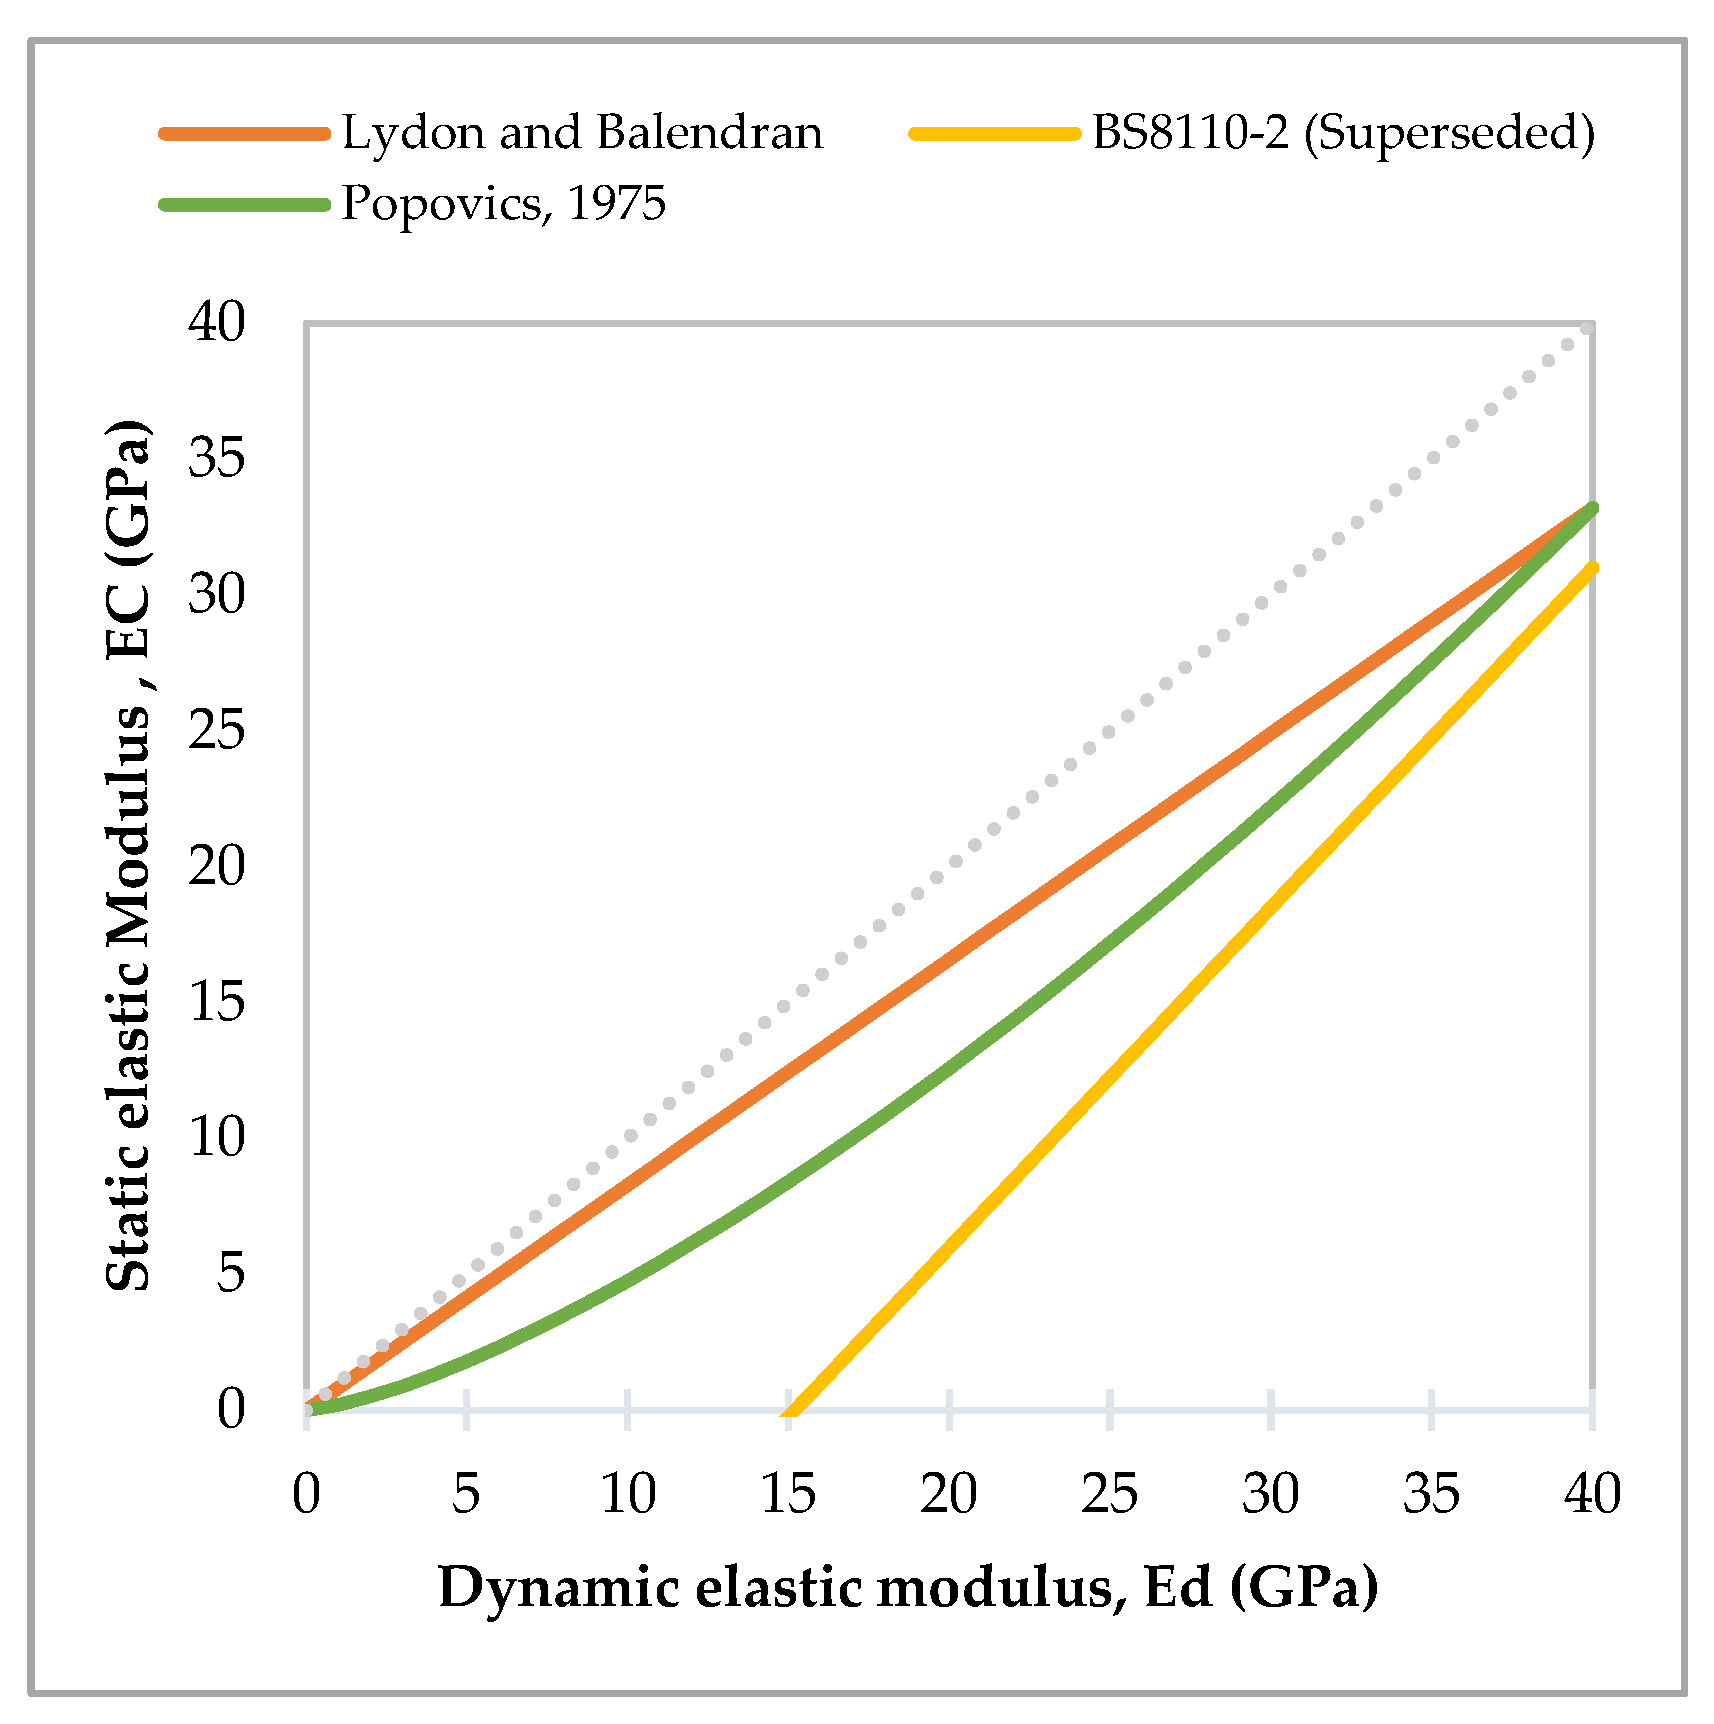
To determine the static elastic modulus E c , through the dynamic elastic modulus E d , several authors (Neville, 2011 [45]) proposed the following Table 2 and Figure 1:
Where the Young Modulus E is expressed in GPa and the hardened concrete density ρc in kg/m3.
The above figure shows that while the curves start by spreading apart, they tend to merge for higher-strength concrete.
There is also a discernible reduction between the dynamic elastic modulus and its static counterpart that, according to other authors [46], seems to happen due to the data acquisition method. More specifically, the static modulus of elasticity is obtained through the compression of a specimen and acquisition of the strain-stress slope (destructive testing). In contrast, a resonant frequency test obtains the dynamic modulus of elasticity, a way of wave propagation (non-destructive test), with little to no force applied. Other factors for these differences are the concrete composition, specimen size and shape, and testing method.
In the case of direct relationships between compressive strength ( f c ) and flexural strength ( f t ), a compilation of different authors can be observed in A. Neville [45,47] was taking the shape of the following equation:
f t = k × f c n
where the parameter k takes values up to 0.3 and n takes values ranging from 0.5 to 0.75.
Some authors propose the following parameters in Table 3 to reflect a relationship between compressive and direct tensile strength:
When plotting the above Table 3, a range of acceptable values is observed between the authors, as seen in Figure 2:
In Figure 2 above, Gardner and Poon have the highest direct tensile strength values, while other authors have conservative values with a reduction of up to 54% for high-strength concrete.
A more extensive collection of these formulas are given by Chamroeun et al. 2017 [47], Table 4 and Figure 3, where different authors tried their approach to flexural tensile strength for different concrete compositions:
Plotting Table 4, a range of admissible values is defined between authors, as seen in Figure 3:
Figure 3. Correlation between Flexural tensile strength and Compressive strength (Equations (12)–(16)) [47].
Buildings 12 02226 g003
The above Figure 3 shows that the difference between the upper and lower bounds for high-strength concrete is 83% (Mindess and Ahmed), while most curves tend to merge and be contained by the bounds given by Legeron and Paultre.
In Table 5, a relationship can be found for compressive strength ( f c ) and splitting tensile strength f sp [47,48]:
When plotting the above Table 5, another range of acceptable values is defined by several authors, as seen in the following Figure 4:
From Figure 4 above, the highest values of tensile splitting strength are given by the ACI Committee 318 as the upper bound differing by 71% concerning the lower bound provided by Selim, having diverging bounds for higher-strength concrete.
The following Table 6 and Figure 5 display the relationship between static modulus of elasticity and compressive strength that Neville et al. and Jurowski et al. [45,49] have compiled from different authors:
Where the value of the static modulus of elasticity Ec is given in GPa, the density of hardened concrete ρ is given in kg/m3, and the compressive strength of concrete fc in MPa.
By plotting the above Table 6, a range of admissible values is defined by several authors, as seen on the following Figure 5.
Figure 5. Correlation between Static modulus of elasticity and Compressive strength (Equations (25)–(30)) [49].
Buildings 12 02226 g005
The above figure shows the curves in a relatively similar progression, where the upper bound is always defined by the Eurocode 2 formula and the lower bound changes from ACI 363R-92 to Noguchi formulas, having a difference of 15% between bounds.
After the experimental values are obtained, these will be compared with the values obtained from the mechanical relationship that authors over the years came across, where a statistical approach will be made to determine how well some of the expressions match the results obtained and, if needed, to provide an equation that matches the characteristics of these concretes.
The statistical approach that views the quantification of an associated error with the values obtained and the ones expected are calculated using the Root Mean Square Error (RMSE) and the Mean Absolute Error (MAE), as follows:
( RMSE )       1 n i = 1 n ( E i P i ) 2
( MAE )           1 n i = 1 n P i E i
These expressions will quantify the error attributed to each equation, which allows for determining which equations are best adapted to this concrete and reducing the error of newly adopted ones.

3. Results of Experimental Tests

3.1. Compressive Strength

The evolution of compressive strength throughout the 7, 14, and 28 days for each mix is presented hereafter. The tests were performed by using cubic specimens of 100 × 100 × 100 mm according to BS EN 12390-3:2019 and BS EN 12390-1:2012 [40,50].
Figure 6 shows the compressive strength of all mixes as a function of curing time. Regarding the control mix, at the 7-day mark, a compression value of 37.2 MPa was found, and throughout the 28 days, it observed an evolution of almost 28% with 47.5 MPa at the 28-day mark. The statistical variation of the computed resistance, estimated through the coefficient of variation (CoV), is also limited, around 10%. This makes the control mix, according to BS EN 1992-1-4:2004 [44], in between a C35/45 or C40/50 concrete.
In the same Figure 6, the outcomes of the compressive strength from the 50% GGBS mix are summarised, where throughout the experiment it is observed a 54% gain in compression value, starting with 28.8 MPa at the 7-day mark and after 28 days with 44.4 MPa. For these test results, CoVs are smaller than the control mix. The latter values range between 2.4% (7 days) and 7.8% (28 days). With a value of 44.4 MPa at the 28-day mark, this concrete is defined as a C35/45 [44].
The evolution of compressive strength of the 50% GGBS mix with a self-healing agent has also observed an increase of almost 87% throughout the 28 days, where it starts at 24.5 MPa at 7 days and reaches 45.8 MPa at 28 days, displaying the highest increase so far in all mixes.
With a value of 45.8 MPa at the 28-day mark, this concrete is defined as a C35/45 [44].
Compared with the other mixtures, adding the self-healing agent further reduces the compressive strength of concrete at 7 days, and matches the 50% GGBS mixture on the 28th day, acting on the mixture like a concrete retarder.

3.2. Tensile Splitting Strength

The following sections discuss splitting tensile strength throughout each mix’s 7, 14, and 28 days. The experimental results were derived by cylindrical specimens of 150 mm diameter by 300 mm high, which comply with BS EN 12390-6:2009 and BS EN 12390-1:2012 [41,51].
Figure 7 illustrates the evolution of splitting tensile values for all mixes. From the 28-day experiment in the control mix, an increase of around 21% is observed, wherein for 7 days, there is 2.92 MPa, and at the end of 28 days, a value of 3.53 MPa is achieved.
A contraction of the control mix is noticeable from the 7 to 14 days where, within the range of the coefficient of variation, the mean tensile splitting strength value is seen to reduce from 2.92 MPa to 2.51 MPa. On a smaller scale, the same seems to happen in the same time frame but regarding the 50% GGBS mix. Since there was an expectation of constant increase throughout the timeframe, the experiment was repeated with similar results.
Regarding the 50% GGBS mix, an overall increase of around 13% from the 7-day mark to the 28 was observed.
As the above figure demonstrates, the progression of the tensile strength is visibly lower than the control mix throughout the 28 days.
Concerning the 50% GGBS mix with the self-healing agent, the same trend of reduced values is observed compared to the control mix. Throughout the 7 to 28 days, a positive evolution of 38% in tensile splitting strength is registered.
Once again, following the trend of Figure 6, it is seen that adding the self-healing agent further drops the mechanical properties of concrete, in the case of Figure 7, only surpassing the 50% GGBS mix at 28 days. Since there were no visible cracks on the exterior, it is assumed that some internal voids might have been filled with calcium carbonate, making the specimens slightly denser, or the bacterial feed containing calcium lactate might have changed the chemical or crystalline structure of the concrete, but overall acting like a concrete retarder.

3.3. Flexural Strength

The following Figure 8 displays the evolution and the variation of flexural strength at 7, 14 and 28 days.
The control mix is seen to only increase around 6% throughout the 7 to 28 days, displaying a relatively constant value in comparison to the other mixes.
The 50% GGBS mix shows an evolution of 31% in flexural strength from the seventh to the 28th-day mark, almost matching the 28th-day value of the control mix whilst staying lower than the latter throughout the 28 days.
The mixture containing 50% GGBS and the self-healing agent showed an evolution of 39% from the seventh to the 28th day of curing.
The values on the observed mix with a self-healing agent display an even lower flexural strength value compared to the 50%GGBS mix and the control mix.

3.4. Dynamic Modulus of Elasticity

The dynamic modulus of elasticity (DME) was obtained by means of a resonant frequency tester machine. The following Figure 9 displays the result comparison for all mixes.
From the control mix in the figure above, the evolution of the dynamic modulus of elasticity for the control mix is observed throughout the 28 days of curing, with an increase of 5% from the seventh to the 28th day.
Regarding the 50% GGBS mix in a 28-day curing time, an increase of 12% from the seventh to the 28th day is observed. While still lower than the control mix, it tends to match the same properties at the 28-day mark.
The mix containing 50% GGBS and the self-healing agent displays an increase of 13% from the seventh to the 28th day of curing while observing an even lower dynamic modulus of elasticity than the control mix but tending to match the previous two mixes after the 28 days.

4. Further Discussion of the Experimental Rest Results

4.1. Mix Comparison for Compressive Test

Figure 6 shows throughout the 28-day mark that the compressive values for the control mix are higher than all the mixes containing GGBS. It used a CEM I 52.5 R, which, in theory, should have compressive values higher than 30 MPa at 7 days, and 52.5 MPa at 28 days. At the 7-day mark, the mix containing only GGBS has a reduction of almost 23% of the compressive value meanwhile, the mixture containing the self-healing agent has a reduction of 34%. At the 14-day mark, the control mix is still higher than the other two mixes, the GGBS (50% GGBS) having a reduction of almost 16% and the self-healing mix (50%GGBS and Self-healing agent) having a reduction of almost 19%. At the 28-day mark, the control mix is still higher, but the difference in compression almost matches the self-healing mix, showing a tendency, according to its evolution, to match and go beyond the control mix after the 28-day mark [40].
Compared with a previous study with different ratios of GGBS [50] in the following Table 7, it is observed that the compressive strength of the mixes will decrease as higher values of GGBS are added, where 20 to 30 % seems to be where it reaches its peak under the 28 days. Increasing the replacement ratios will also drop the compressive strength values at the 7 and 14-day mark, where a reduction of 30% is visible at 7 days and 11% at 14 days.
Comparing results observed in this study (Figure 6), the higher values of compressive strength indicate that this could be due to the use of CEM I 52.5 R where, in Table 7, a grade 42.5 N cement was used, among other factors, while also displaying the retarding capacity of GGBS as higher values replace OPC.
Since GGBS has a retarding influence in concrete, smaller replacement values (20 to 30%) will allow a visible increase in under 28 days. In the case of 50% GGBS, this increase and capacity to go beyond the control mix will only be seen after 28 days (according to the trend).
In a similar study [8] in Table 8, different ratios of GGBS are tested, where it is observed that for concrete containing different quantities of OPC and replaced by 50% GGBS, a drop in compressive strength is visible throughout the 28 days. This also indicates that GGBS has a set retarder capacity that reduces the increment progression of compressive capacity during the 28 days.
From another study using a maximum value of 10% GGBS with a bacterial agent [51], please see the following Table 9, it is observed that OPC concrete with a bacterial agent allows a compressive gain of 13% at 7 days and 30% at 28 days, which indicates a beneficial effect from the bacterial healing mixture by itself. This study does not mention if the bacteria are in spore form or already in bacterial form. However, assuming it is in a spore form to survive the mechanical mixing of aggregates, the only reason for this increase might be due to the calcium and urea feed used in the mix for the bacteria to develop and precipitate calcium carbonate crystals. Alternatively, even lower quantities of the bacterial agent may increase the mechanical properties in the early days but will affect the final crack healing response.
In this study, shown in Table 9 above, it is noted that the concrete using GGBS and a bacterial agent has an increase in compressive strength of almost 27% at 60 days while using only 10% of the OPC replacement, thus far corroborating this study and the previous author’s results, where while there is an initial lower compressive strength, after 28 days it matches and overcomes the control mix.

4.2. Mix Comparison for Tensile Splitting Test

From Figure 7, both mixes containing GGBS tend to have lower values at the seventh and 28th-day marks when compared to the control mix, while at the 14th-day mark, there is a noticeable increase in the mixture containing the self-healing agent.
At the 7-day mark, it is observed that the mixture containing 50% GGBS has a reduction in splitting strength of 16%, and the mixture containing the self-healing agent has a reduction of around 27% when compared to the control mix.
At the 14-day time, the 50% GGBS mix matched the control mix, while the mix with the healing agent was 12% higher. When achieving 28 days, the control mix is now higher than the two other mixes with GGBS, with the 50% GGBS mix having around 22% less than the control mix and almost 17% in the case of the mix with the self-healing agent.
From this study in Table 10, it is noted that using a bacterial self-healing agent with 10% of GGBS replacement, a splitting tensile strength value at seven days is increased by 33%, and 23% and the 28-day mark, indicating the beneficial effect on the mechanical properties of concrete with this OPC replacement and bacterial agent.
Determining the tensile splitting strength as proposed from Equations (12) through (19), the following Table 11 is obtained:
Observing the RMSE and MAE of the values obtained in Table 11, Equation (22) seems to be more accurate than most. Therefore, a new tailored equation is proposed where the error margin is even lower:
f sp     o r     f c t , s p = 0.28 × f c 0.625

4.3. Mix Comparison for Flexural Strength

Throughout the 28-day mark, Figure 8, the control mix remains relatively constant, varying its value between 5.4 to 5.7 MPa. On the other hand, the mixes containing GGBS have a constant and progressive increase throughout the 28 days. At the 7-day mark, the 50% GGBS mix has a reduction of 22% and the self-healing agent mix has a 33% reduction in flexural strength. At the 14-day mark, the control mix remains stable at 5.5 MPa, and the GGBS mix has a reduction of 7% and the self-healing agent mix with 20% less. At the 28-day mark, it is observed that the mixtures containing GGBS have increased slightly, having a 4% reduction for the 50% GGBS mix and around 12% in the case of the self-healing agent.
Table 12 compares the results obtained in the experiment and the ones obtained from compressive strength according to several authors.
The table above shows that the tensile flexural strength values are within the range proposed by some authors, whereas Equations (8) and (9) from Table 4 seem closer to the values acquired. However, from the error values in RMSE and MAE, there is space for an adjusted equation. The following Equation (9) is proposed for the control and 50% GGBS mixtures:
  f c t , f l = 0.82 × f c 0.503
Regarding the mixture with the self-healing agent, an adjusted expression is preferable with a lower RMSE and MAE:
  f c t , f l = 0.7 × f c 0.505

4.4. Mix Comparison for Dynamic Modulus of Elasticity

Figure 9 shows that the control mix has a higher value throughout the 28 days, while the mixes containing GGBS remain the lowest. The 7-day mark for a mixture containing 50% GGBS has a reduction of 7%, and the mixture containing 50% GGBS and the self-healing agent has a reduction of 14% in dynamic modulus Elasticity. At the 14-day mark, a reduction of 5% on the 50% GGBS and 15% on the one with a self-healing is visible. At the 28-day mark, the mixture with only 50% GGBS matches the control mix having only a reduction of 1%, and the self-healing agent with 8%.
The following Table 13 will display the value of the static modulus of elasticity according to different authors:
As seen above, the static modulus of elasticity is always smaller than its dynamic counterpart. Even though several authors created their approach to calculate this value from dynamic and compressive values, a ratio seems to remain visible that the static modulus of elasticity is around 20% less than the dynamic.

5. Bacterial Self-Healing Agent—Observation of Surface Crack Healing Evolution

While using the control mix with the bacterial self-healing agent, some specimens were made to visualise the healing capacity of the agent throughout time, where several techniques of induced controlled cracking were created and deployed to observe the evolution of the sealing capacity throughout time.
The following table shows an extrinsic approach to using the agent, where control mix cubes were cracked, and the surface crack widths were measured with a crack width ruler. Afterward, the cracked specimens were doused in an aqueous solution with the bacterial agent dissolved, leaving it to cure for 25 days in an incubator.
Before visualising the specimens, these are dried and cleaned with pressurised air to remove excess water and debris, allowing to expose the new calcium carbonate formations tightly growing from the cracks.
The following tables, Table 14 and Table 15, display the specimen tags attributed to a specific cracked cube in the first column, followed by a measurement of the maximum crack width in a specific numbered point in the specimen. The following columns in the same row show the evolution of the cracks being sealed through time in days.
From Table 14, it is shown that several crack widths across several specimens were created, ranging from 0.2 to 1.5 mm. The agent was applied at time zero, and some changes started to appear after five days (N8). After 13 days, more changes are observed, and finally, at 25 days, a dramatic change in most specimens with a yellowish crystalline substance blooming from within the cracks.
In some cases, the healing process starts with a thin layer of calcium carbonate crystallisation, images from N10 at 13 days of incubation show that a thin layer of calcium carbonate populates the cracks like a membrane. After some exploratory probing, this initial membrane starts at 100 microns, thickening to formations higher than 4 mm.
The most extensive crack sealed with this extrinsic approach is 1.5 mm (T6-4).
From Table 15 above, an extrinsic approach was created, where the control mix was combined with the bacterial healing agent in the mixing process, cast into cubes and once hardened, cracked and left to heal in an incubator for 23 days.
Through this process, the healing agent embedded with hardened concrete started to heal the externally visible cracks from within, starting to show on the surface. At seven days of incubation, visible in a thick white-yellowish formation at W1-7, and as a membrane on W4 and S9 specimens. In S10 it is visible throughout the time the formation of a membrane (7 to 14 days) and the sealing, in-depth, by a denser mineral formation.
It is also observed that smudges of white crystalline substance come out of the cracks and initialise the healing process, which indicates the bacterial activity in said cracks, pointing to the possibility of internal cracks being sealed first.
The maximum crack width sealed is 1.5 mm, observed on the surface of S9 and W4 specimens, surpassing the values of 0.3 mm initially thought to achieve. These results can only be corroborated with further testing, such as permeability tests, to quantify the healing capacity of the agent on internal cracks and guarantee the correct sealing of concrete, not just at a surface level.
When using BS EN 1992 [44] and performing serviceability checks, maximum crack widths are recommended depending on the exposition class of the structure. These range from 0.2 mm to 0.4 mm, but the most common is 0.3 mm for reinforced members, which bodes positively for a structure that has a self-healing agent. Healing not only 0.3 mm cracks but also extending that capacity to 1.5 mm wide cracks will allow the possible reduction in nominal cover and the increase in rebar diameter and spacing, to mention some examples.

6. Insight of Embodied Carbon Value of Each Mix

According to the Inventory of Carbon and Energy [1], it is possible to determine the embodied carbon of each element used in a concrete mix, as shown in Table 16 and Figure 10.
Comparing the three concrete mixtures, one can observe that when using 100% OPC, there is the highest embodied carbon, and with GGBS, a reduction of around 40% is visible, while the self-healing agent can further reduce this value by an extra 13%. Providing a total reduction of 53% when using GGBS and the self-healing agent.
To quantify the reduction in embodied carbon with the use of the self-healing agent, a guideline provided by the supplier [52] states that the creation and usage of the self-healing agent in concrete increases the overall embodied carbon by a mean value of 20 kg CO2/m3, but throughout its service life it can reduce the usage of concrete in frequent repairs due to its self-healing capacity. Considering that the agent can increase the service life by 30%, equating to the reduction in new cast concrete in the same value, we have a flat reduction of 30% of the embodied carbon for the 50% GGBS mix (by 74.1 kg CO2/m3), or the Control mix (by 124.2 kg CO2/m3). Considering a reduction of 74.1 kg CO2/m3 offset by the positive gain of 20 kgCO2/m3, a final value of 54.1 kg CO2/m3 is obtained.
Although the benefits of using GGBS as a partial OPC replacement will decrease the embedded carbon substantially, the rising costs of acquiring this subproduct material have been increasing throughout the years, according to the US Geological Survey from the years 2015 to 2021 [53,54] prices were seen rising by 40% (from 19.50 $/ton to 27.50 $/ton), peaking to 500% increase depending on the import location (120 $/ton).
According to the insight provided by the UK government [55], the inland shortage started in 2016 and is predicted to increase after 2024. However, an oversupply worldwide is predicted to last beyond 2030.
The increasing prices from high demand and the efforts for waste reduction from the metallurgic industry [56,57] will make GGBS an unsustainable material for the long-term reduction of embedded carbon in concrete.

7. Conclusions

The initial objective of this research paper was to test a commercially available bacterial self-healing agent that, when added with low-carbon OPC replacements, would allow the reduction of the embedded carbon value of concrete while expanding the service life and the overall value of the structure. An insight into the changes in the mechanical properties of low-carbon concrete with a bacterial agent was showcased while observing the healing capacity of the agent when applied intrinsically and extrinsically to concrete. After defining the mechanical changes in this concrete, a new set of equations were proposed to reflect the variations observed. When determining the changes in embedded carbon, insight was given into the availability of GGBS in the future.
Comparing the control mix with CEM I 42.5 R as OPC, it is found that utilising 50% GGBS in a mix will reduce the initial mechanical properties, lowering these in a range of up to 25%, and if adding the bacterial self-healing agent, there is a further reduction of up to 35% at seven days of curing time. At the 28-day mark, both mixes containing GGBS tend to match the control mix, which is in line with other relevant studies. All this indicates that having GGBS by itself or with a self-healing agent is still very much viable, considering the low mechanical properties in the early days of curing, with the added benefit of offsetting the embedded carbon value up to 50%.
More research is required to determine why the healing agent reduces the mechanical properties in the early days, and the assumption so far is that there is a chemical reaction between the bacterial composition and respective feed, with the concrete working as a retarding agent.
These mixtures were made without admixtures to allow the capture of the mechanical properties without additives. In the industry, these are commonly used to reduce the water content and increase early mechanical properties, depending on the required effect for each occasion. For future experimental work, additives are suggested to allow the control and correction of the early mechanical properties to decrease.
Having this bacterial healing agent will reduce even further the embedded carbon value of a low-carbon concrete mix, in this case, up to 13%. This reduction is primarily due to the capacity to increase service life and reduce the number of repairs a structure undergoes throughout the years.
Observing cracked control specimens treated with a solution of the healing agent shows noticeable changes after five days in the incubator. However, the more dramatic changes are seen after 25 days, where cracks of up to 1.5 mm are entirely sealed, indicating the agent is sealing these cracks from the outside in, showing the capacity for this agent to be retrofitted into older structures.
When the agent is mixed in with fresh concrete, similar changes are observable after seven days, with the formation of a thin membrane on the surface and the pouring of white crystalline formations from the inside out, suggesting the sealing of internal cracks first and superficial ones last, having a maximum observable sealing capacity of 1.5 mm in 23 days.
To further confirm the expectation of service life increase, it suggested that the internal cracks are also tested under different environments and with different types of concrete composition, allowing optimisation of the dosage of the healing agent and the time it needs to heal under different scenarios, as well as efficacy.
Overall, adding a bacterial self-healing agent has a promising future in concrete structures, which grants the ability to heal itself from small cracks (structural damage) while lowering the embedded carbon value of a concrete mixture by reducing the frequency and extent of repairs.
While reducing the embedded carbon value of concrete dramatically when replacing OPC, GGBS as a waste subproduct from the metallurgic industry will inevitably fall into scarcity with the increased demand from the construction industry.
With new methods developed to reduce waste, the production of GGBS will eventually dwindle and added to increased demand, the gradually higher prices will make this product unsustainable in the long term.

Author Contributions

Conceptualization, J.M.P.M.; Methodology, J.M.P.M.; Formal analysis, J.M.P.M.; Investigation, J.M.P.M.; Data curation, J.M.P.M.; Writing—original draft, J.M.P.M.; Writing—review & editing, J.M.P.M.; Supervision, L.D.S. All authors have read and agreed to the published version of the manuscript.

Funding

Low Carbon Eco-innovatory fund (Ref.: UoL-LCEI-241).

Acknowledgments

JP Concrete (https://www.jpconcrete.co.uk/ (accessed on 13 November 2022)) for materials (Sand, Gravel, Cement), Basilisk (https://www.basiliskconcrete.com/ (accessed on 13 November 2022)) for the Self-healing agent.

Conflicts of Interest

The authors declare no conflict of interest.

References

  1. Hammond, G.; Jones, C. A BSRIA Guide. Embodied Carbon: The Inventory of Carbon and Energy (ICE); BSRIA: Bracknell, UK, 2011; p. 136. Available online: http://www.ihsti.com/tempimg/57c152b-ENVIRO2042201160372.pdf%0Awww.bath.ac.uk/mech-eng/sert/embodied%0A (accessed on 10 December 2022).
  2. Turu’allo, G. Early Age Strength Development of GGBS Concrete Cured under Different Temperatures. Ph.D. Thesis, University of Liverpool, Liverpool, UK, 2013; pp. 1–583. [Google Scholar]
  3. Habert, G. Environmental impact of Portland cement production. In Eco-Efficient Concrete; Woodhead Publishing: Sawston, UK, 2013; pp. 3–25. [Google Scholar] [CrossRef]
  4. MPA. Fact Sheet 18: Embodied CO2e of UK Cement, Additions and Cementitious Material; MPA: London, UK, 2011; Volume 2, pp. 1–8. Available online: https://www.concretecentre.com/TCC/media/TCCMediaLibrary/Products/Factsheet_18_2019_updateF.pdf (accessed on 10 December 2022).
  5. Shubbar, A.; Atherton, W.; Jafer, H.M.; Dulaimi, A.; Al-faluji, D. The Development of a New Cementitious Material Produced from Cement and GGBS. In Proceedings of the 3rd BUiD Doctoral Research Conference, Dubai, United Arab Emirates, 13 May 2017. [Google Scholar]
  6. Samad, S.; Shah, A.; Limbachiya, M.C. Strength development characteristics of concrete produced with blended cement using ground granulated blast furnace slag (GGBS) under various curing conditions. Sadhana-Acad. Proc. Eng. Sci. 2017, 42, 1203–1213. [Google Scholar] [CrossRef] [Green Version]
  7. Rajaram, M.; Ravichandran, A.; Muthadhi, A. Studies on Optimum Usage of GGBS in Concrete. J. Innov. Science Res. Technol. 2017, 2, 773–778. [Google Scholar]
  8. Raghavendra, Y.B.; Ramalinga Reddy, Y. Optimum usage of GGBS in ready M ix concrete industry. Int. J. Eng. Adv. Technol. 2019, 8, 4542–4553. [Google Scholar] [CrossRef]
  9. Acevedo-Martinez, E.; Gomez-Zamorano, L.Y.; Escalante-Garcia, J.I. Portland cement-blast furnace slag mortars activated using waterglass:—Part 1: Effect of slag replacement and alkali concentration. Constr. Build. Mater. 2012, 37, 462–469. [Google Scholar] [CrossRef]
  10. Michel, M.; Georgin, J.F.; Ambroise, J. Improving the mechanical performance of high-grade slag cement by the addition of Portland cement and sulfoaluminate cement. Constr. Build. Mater. 2012, 37, 291–300. [Google Scholar] [CrossRef]
  11. Dennis, H.D.; Evans, A.J.; Banner, A.J.; Moore, P.J. Reefcrete: Reducing the environmental footprint of concretes for eco-engineering marine structures. Ecol. Eng. 2018, 120, 668–678. [Google Scholar] [CrossRef] [Green Version]
  12. Van Tittelboom, K.; De Belie, N.; De Muynck, W.; Verstraete, W. Use of bacteria to repair cracks in concrete. Cem. Concr. Res. 2010, 40, 157–166. [Google Scholar] [CrossRef]
  13. Wiktor, V.; Jonkers, H.M. Quantification of crack-healing in novel bacteria-based self-healing concrete. Cem. Concr. Compos. 2011, 33, 763–770. [Google Scholar] [CrossRef]
  14. Anglani, G.; Van Mullem, T.; Zhu, X.; Wang, J.; Antonaci, P.; De Belie, N.; Tulliani, J.M.; Van Tittelboom, K. Sealing efficiency of cement-based materials containing extruded cementitious capsules. Constr. Build. Mater. 2020, 251, 119039. [Google Scholar] [CrossRef]
  15. Nguyen, T.H.; Ghorbel, E.; Fares, H.; Cousture, A. Bacterial self-healing of concrete and durability assessment. Cem. Concr. Compos. 2019, 104, 103340. [Google Scholar] [CrossRef]
  16. Jonkers, H.M. Bacteria-based self-healing concrete. Heron 2011, 56, 1–12. [Google Scholar]
  17. Van Tittelboom, K.; De Belie, N. Self-Healing in Cementitious Materials—A Review. Materials 2013, 6, 2182–2217. [Google Scholar] [CrossRef] [Green Version]
  18. Zhang, X.; Fan, X.; Li, M.; Samia, A.; Yu, X. (Bill) Study on the behaviors of fungi-concrete surface interactions and theoretical assessment of its potentials for durable concrete with fungal-mediated self-healing. J. Clean. Prod. 2021, 292, 125870. [Google Scholar] [CrossRef]
  19. Bras, A.; van der Bergh, J.M.; Mohammed, H.; Nakouti, I. Design service life of rc structures with self-healing behaviour to increase infrastructure carbon savings. Materials 2021, 14, 3154. [Google Scholar] [CrossRef] [PubMed]
  20. Başyiǧit, C.; Çomak, B.; Kilinçarslan, Ş.; Serkan Üncü, I. Assessment of concrete compressive strength by image processing technique. Constr. Build. Mater. 2012, 37, 526–532. [Google Scholar] [CrossRef]
  21. Pacheco-Torgal, F.; Labrincha, J.A. Biotechconcrete: An innovative approach for concrete with enhanced durability. In Eco-Efficient Concrete; Woodhead Publishing: Sawston, UK, 2013; pp. 565–576. [Google Scholar] [CrossRef]
  22. Tziviloglou, E.; Wiktor, V.; Jonkers, H.M.; Schlangen, E. Bacteria-based self-healing concrete to increase liquid tightness of cracks. Constr. Build. Mater. 2016, 122, 118–125. [Google Scholar] [CrossRef]
  23. Salmasi, F.; Mostofinejad, D. Investigating the effects of bacterial activity on compressive strength and durability of natural lightweight aggregate concrete reinforced with steel fibers. Constr. Build. Mater. 2020, 251, 119032. [Google Scholar] [CrossRef]
  24. Luo, M.; Qian, C.X.; Li, R.Y. Factors affecting crack repairing capacity of bacteria-based self-healing concrete. Constr. Build. Mater. 2015, 87, 1–7. [Google Scholar] [CrossRef]
  25. Fan, S.; Li, M. X-ray computed microtomography of threedimensional microcracks and self-healing in engineered cementitious composites. Smart Mater. Struct. 2015, 24, 015021. [Google Scholar] [CrossRef]
  26. Cao, S.; Yilmaz, E.; Yin, Z.; Xue, G.; Song, W.; Sun, L. CT scanning of internal crack mechanism and strength behavior of cement-fiber-tailings matrix composites. Cem. Concr. Compos. 2021, 116, 103865. [Google Scholar] [CrossRef]
  27. Van Tittelboom, K.; De Belie, N.; Van Loo, D.; Jacobs, P. Self-healing efficiency of cementitious materials containing tubular capsules filled with healing agent. Cem. Concr. Compos. 2011, 33, 497–505. [Google Scholar] [CrossRef]
  28. Liu, Y.; Yeoh, J.K.W. Automated crack pattern recognition from images for condition assessment of concrete structures. Autom. Constr. 2021, 128, 103765. [Google Scholar] [CrossRef]
  29. Liu, B.; Yue, F.; Chen, B.; Man, X.; Chen, L.; Jaisee, S. Study on bond performance, flexural and crack extension behavior of base concrete prisms strengthen with strain-hardening cementitious composites (SHCC) using DIC technology. Constr. Build. Mater. 2020, 251, 119035. [Google Scholar] [CrossRef]
  30. Van Tittelboom, K.; Tsangouri, E.; Van Hemelrijck, D.; De Belie, N. The efficiency of self-healing concrete using alternative manufacturing procedures and more realistic crack patterns. Cem. Concr. Compos. 2015, 57, 142–152. [Google Scholar] [CrossRef]
  31. Nemati, K.M.; Monteiro, P.J.M.; Scrivener, K.L. Analysis of Compressive Stress-Induced Cracks in Concrete. ACI Mater. J. 1998, 95, 617–630. [Google Scholar]
  32. Parashar, A.; Aggarwal, P.; Saini, B.; Aggarwal, Y.; Bishnoi, S. Study on performance enhancement of self-compacting concrete incorporating waste foundry sand. Constr. Build. Mater. 2020, 251, 118875. [Google Scholar] [CrossRef]
  33. Tomczak, K.; Jakubowski, J.; Kotwica, Ł. Enhanced autogenous self-healing of cement-based composites with mechanically activated fluidized-bed combustion fly ash. Constr. Build. Mater. 2021, 300, 124028. [Google Scholar] [CrossRef]
  34. Zhang, L.V.; Nehdi, M.L.; Suleiman, A.R.; Allaf, M.M.; Gan, M.; Marani, A.; Tuyan, M. Crack self-healing in bio-green concrete. Compos. Part B Eng. 2021, 227, 109397. [Google Scholar] [CrossRef]
  35. Vardai, V.; Doshi, T.; Patil, M.B. Strength and Durability Properties of Bacterial Concrete with Partial Replacement of GGBS: An Experimental Investigation. IUP J. Struct. Eng. 2019, 12, 46–55. [Google Scholar]
  36. Van Tittelboom, K.; Gruyaert, E.; Rahier, H.; De Belie, N. Influence of mix composition on the extent of autogenous crack healing by continued hydration or calcium carbonate formation. Constr. Build. Mater. 2012, 37, 349–359. [Google Scholar] [CrossRef]
  37. Teychenné, D.C.; Franklin, R.E.; Erntroy, H.C. Design of Normal Concrete Mixes; Building Research Establishment Ltd.: Garston, UK, 2010; p. 46. [Google Scholar]
  38. Basilisk-Contracting BV. Product Data Sheet: Basilisk Healing Agent (HA). 2019. Available online: www.basiliskconcrete.com (accessed on 10 May 2021).
  39. BS EN 12390-1:2021; Testing Hardened Concrete—Part 1: Shape, Dimensions and Other Requirements for Specimens and Moulds. British Standards Institution BSI: London, UK, 2021; pp. 1–18.
  40. BS EN 12390-3:2019; Testing Hardened Concrete—Part 3: Compressive Strength of Test Specimens. British Standards Institution BSI: London, UK, 2019.
  41. BS EN 12390-6:2009; Testing Hardened Concrete Part 6: Tensile Splitting Strength of Test Specimens. British Standards Institution BSI: London, UK, 2009.
  42. BS EN 12390-5:2019; Testing Hardened Concrete Part 5: Flexural Strength of Test Specimens. British Standards Institution BSI: London, UK, 2019; p. 18.
  43. BS 1881-209:1990; Testing Concrete—Part 209: Recommendations for the Measurement of Dynamic Modulus of Elasticity. British Standards Institution BSI: London, UK, 1990.
  44. BS EN 1992-1-1:2004; Design of Concrete Structures. General Rules and Rules for Buildings. British Standards Institution BSI: London, UK, 2004. Available online: http://shop.bsigroup.com/en/Browse-By-Subject/Eurocodes/Descriptions-of-Eurocodes/Eurocode-2/BS-EN-1992-1-12004/ (accessed on 2 May 2021).
  45. Neville, A.M. Properties of Concrete; Trans-Atlantic Publications, Inc.: Philadelphia, PA, USA, 2011. [Google Scholar]
  46. Trifone, L. A Study of the Correlation between Static and Dynamic Modulus of Elasticity on Different Concrete Mixes. Master’s Thesis, Benjamin M. Statler College of Engineering and Mineral Resources, West Virginia University, Morgantown, WV, USA, 2017. [Google Scholar]
  47. Chhorn, C.; Hong, S.J.; Lee, S.W. Relationship between compressive and tensile strengths of roller-compacted concrete. J. Traffic Transp. Eng. Engl. Ed. 2018, 5, 215–223. [Google Scholar] [CrossRef]
  48. Jaber, A.; Gorgis, I.; Hassan, M. Relationship between splitting tensile and compressive strengths for self-compacting concrete containing nano- and micro silica. MATEC Web Conf. 2018, 162, 02013. [Google Scholar] [CrossRef]
  49. Jurowski, K.; Grzeszczyk, S. Influence of selected factors on the relationship between the dynamic elastic modulus and compressive strength of concrete. Materials 2018, 11, 477. [Google Scholar] [CrossRef] [PubMed] [Green Version]
  50. Suseela, K.; Alisha, S. Investigation on Strength and Durability of Concrete by Partial Replacement of GGBS in Cement Investigation on Strength and Durability of Concrete by Partial Replacement of GGBS in Cement. Int. J. Sci. Res. Dev. 2020, 7, 482–486. [Google Scholar]
  51. Madhavi, E.; Divya Bhavana, T. Strength Properties of a Bacterial Concrete with Flyash and GGBS. Int. J. Eng. Res. 2016, 5, 546–548. [Google Scholar] [CrossRef]
  52. Basilisk. Available online: https://basiliskconcrete.com/wp-content/uploads/2020/04/Basilisk-info-7-CO2-Emission-EN.pdf (accessed on 10 December 2022).
  53. Ober, J.A. Iron and Steel Slag; U.S. Geological Survey: Reston, VA, USA, 2021. Available online: https://pubs.usgs.gov/periodicals/mcs2021/mcs2021-iron-steel-slag.pdf (accessed on 23 September 2022).
  54. Curry, K.C. Iron and Steel Slag; U.S. Geological Survey: Reston, VA, USA, 2020; pp. 86–87.
  55. Alberici, S.; de Beer, J.; van der Hoorn, I.; Staats, M. Fly Ash and Blast Furnace Slag for Cement Manufacturing; Department for Business, Energy & Industrial Strategy: London, UK, 2017; Volume 35, p. 35. Available online: https://assets.publishing.service.gov.uk/government/uploads/system/uploads/attachment_data/file/660888/fly-ash-blast-furnace-slag-cement-manufacturing.pdf (accessed on 23 September 2022).
  56. Dippenaar, R. Industrial uses of slag (the use and re-use of iron and steelmaking slags). Ironmak. Steelmak. 2005, 32, 35–46. [Google Scholar] [CrossRef]
  57. Hornby, S.; Brooks, G. Impact of Hydrogen DRI on EAF Steelmaking. In Direct from MIDREX; MIDREX: Charlotte, NC, USA, 2021; pp. 3–11. [Google Scholar]
Figure 1. Correlation between Static and Dynamic modulus (Equations (5)–(7)) [43].
Buildings 12 02226 g001
Figure 2. Correlation between Direct tensile strength and Compressive strength (Equations (9)–(11)) [43].
Buildings 12 02226 g002
Figure 4. Correlation between Splitting tensile strength and Compressive strength (Equations (17)–(24)) [47].
Buildings 12 02226 g004
Figure 6. Compressive test—mix comparison (Ultimate compression; Coefficient of variation).
Buildings 12 02226 g006
Figure 7. Mix comparison (Tensile Splitting Strength; Coefficient of variation).
Buildings 12 02226 g007
Figure 8. Mix comparison (Flexural Strength; Coefficient of variation).
Buildings 12 02226 g008
Figure 9. Mix comparison (Dynamic modulus of Elasticity; Coefficient of variation).
Buildings 12 02226 g009
Figure 10. Embodied carbon in concrete—Comparison between mixes.
Buildings 12 02226 g010
Table 1. Mix quantities—kg per cubic meter.
Material (kg/m3)Control Mix50% GGBS Mix50% GGBS + Self-Healing Mix
Sand (0/4 mm)990990990
Gravel (4/10 mm)878878878
Cement CEM I 52.5R380190190
Water152152152
GGBS0190190
SHA-Basilisk006
Table 2. Relationship between dynamic and static elastic modulus, adapted from Neville, 2011 [43].
References:EquationsNo.
Lydon and Balendran E c = 0.83 E d       GPa (5)
BS8110-2 (Superseded) E c = 1.25 E d 19     GPa (6)
Popovics, 1975 E c = 446.09 E d 1.4 ρ c                 GPa (7)
Table 3. Relationship between compressive and direct tensile strengths Neville, 2011 [43].
References:EquationsNo.
Gardner and Poon f t = 0.3 f c 2 3       MPa (9)
Raphael and Oluokun f t = 0.2   f c 0.7       MPa (10)
BS 8007: 1987 (Superseded) f t = 0.12   f c 0.7       MPa (11)
Table 4. Relationship between compressive and flexural tensile strength adapted from Chamroeun et al., 2017 [47].
References:EquationsNo.
Ahmed et al. (2008) 0.3 f c 0.5 f t f c 0.5 (12)
Legeron and Paultre (2000) f t m i n = 0.68 f c 0.5 f t a v g = 0.94 f c 0.5 f t m a x = 1.2 f c 0.5 (13)
ACI Committee 363 (1997) f t = 0.94 f c 0.5 (14)
Mindess et al. (2003) 0.11 f c f t 0.23 f c (15)
Selim (2008) f t = 0.034 f c 1.286 (16)
Table 5. Relationship between compressive and splitting tensile strength adapted from Chamroeun et al., 2017 [47].
References:EquationsNo.
ACI Committee 318 (1999) f sp = 0.56 f c 0.5 (17)
Carneiro and Barcellos (1953) f sp = 0.34 f c 0.735 (18)
Carino and Lew (1982) f sp = 0.272 f c 0.71 (19)
Oluokun et al. (1991) f sp = 0.294 f c 0.69 (20)
Selim (2008) f sp = 0.106 f c 0.948 (21)
CEB-FIP Model Code for Concrete Structure (1990) f sp = 0.3 f c 2 / 3 (22)
Raphael (1984) f sp = 0.313 f c 0.667 (23)
Gardner et al. (1988) f sp = 0.47 f c 0.59 (24)
Table 6. Relationship between the static modulus of elasticity and compressive strength, adapted from Jurowski et al. [49].
References:EquationsNo.
ACI 318-95 E c = 43 ρ 1.5 f c 0.5 · 10 6 (25)
Eurocode 2 E c = 22 f c 10 0.3 (26)
ACI 363R-92 E c = 3.32 f c 0.5 + 6.9 (27)
Noguchi et al. (2009) E c = 1.486 · f c 1 / 3 · ρ 2 · 10 6 (28)
BS8110-2:1985 E c = 1.7 · ρ 2 · f c 0.33 · 10 6 (29)
CSA A23.3-04 E c = 4.5 f c 0.5 (30)
Table 7. Compressive strength values for an OPC concrete, with different ratios of GGBS (adapted from [52]).
% Replacement of GGBSCompressive Strength
At 7 Days (MPa)At 14 Days (MPa)At 28 Days (MPa)
032.536.3242.3
1030.1435.5343.25
2034.239.1444.42
3027.236.2343.25
4023.3532.540.56
Table 8. Compressive strength with different GGBS and cement ratios (Adapted from [8]).
Cement Content of 350 kg/m3Cement Content of 400 kg/m3Cement Content of 450 kg/m3
Days of Curing0% GGBS50%GGBS0% GGBS50% GGBS0% GGBS50% GGBS
Avg. Compressive strength (MPa)7 days2922.64032.348.236.8
28 days40.532.449.24559.353.3
Table 9. Compressive strength values for concretes with different compositions (adapted from [53]).
Type of Concrete7 Days (MPa)14 Days (MPa)28 Days (MPa)60 Days (MPa)
OPC concrete32.1039.6045.5851.39
Concrete with bacteria36.4848.2659.1762.35
Concrete with bacteria using fly ash40.8851.8061.1564.35
Concrete with bacteria using GGBS42.1453.1661.8665.21
Concrete with bacteria using fly ash and GGBS36.2041.2046.1450.23
Table 10. Split tensile strength values for concretes with different compositions [53].
Type of Concrete7 Days (MPa)14 Days (MPa)28 Days (MPa)60 Days (MPa)
OPC concrete3.23.94.24.53
Concrete with bacteria4.04.24.54.64
Concrete with bacteria using fly ash4.24.54.95.1
Concrete with bacteria using GGBS4.264.545.25.3
Concrete with bacteria using fly ash and GGBS3.63.84.34.5
Table 11. Relationship between Compressive strength and tensile splitting strength.
MixCuring Time (Days)Mean Compressive Pressure, Fc (MPa)Mean Tensile Splitting Strength (MPa) fctTensile Splitting Strength fctm,sp (MPa)
Equations in Table 3Proposed:
Equation (8)
(12)(13)(14)(15)(16) (17)(18)(19)
Control 28.0047.503.5313.305.819.1711.424.123.934.114.593.13
14.0042.202.5111.825.328.1510.213.683.643.804.282.90
7.0037.202.9210.424.857.189.063.273.343.493.972.68
50% GGBS 28.0044.402.7612.435.528.5710.723.863.763.934.413.00
14.0035.502.449.944.696.868.673.133.243.383.862.61
7.0028.802.458.064.025.567.112.562.822.943.412.29
50% GGBS + Self-healing Agent 28.0045.802.9312.825.658.8411.043.983.844.014.493.06
14.0034.202.819.584.566.608.373.023.163.303.782.55
7.0024.502.136.863.574.736.102.202.532.643.102.07
Control Root Mean Square Error (RMSE)8.912.375.227.290.780.730.881.330.35
Mean Absolute Error (MAE)7.862.174.586.470.590.640.791.270.23
50% GGBS Root Mean Square Error (RMSE)7.772.254.586.420.750.770.911.370.19
Mean Absolute Error (MAE)7.602.194.456.280.630.720.871.340.19
50% GGBS + Self-healing Agent Root Mean Square Error (RMSE)7.442.044.336.120.620.610.751.200.17
Mean Absolute Error (MAE)7.131.974.105.880.440.550.701.170.15
Table 12. Relationship between Compressive strength and Tensile flexural strength.
MixCuring Time (Days)Mean Compressive Pressure, Fc (MPa)Mean Flexural Strength (MPa)Tensile Flexural Strength (MPa) fctm,fl
Equations in Table 4Proposed
(7) (8) (9) (10) (11)
MinMaxMinAvgMaxMinMaxEquation (9)Equation (10)
Control 2847.505.702.076.894.696.488.276.485.2310.934.875.724.92
1442.205.501.956.504.426.117.806.114.649.714.185.394.63
737.205.401.836.104.155.737.325.734.098.563.565.064.35
50% GGBS 2844.405.502.006.664.536.268.006.264.8810.214.475.534.75
1435.505.101.795.964.055.607.155.603.918.173.354.944.25
728.804.201.615.373.655.046.445.043.176.622.564.453.82
50% GGBS + Self-healing Agent 2845.805.002.036.774.606.368.126.365.0410.534.655.614.83
1434.204.401.755.853.985.507.025.503.767.873.194.854.17
724.503.601.484.953.374.655.944.652.705.642.084.103.52
Control Root Mean Square Error (RMSE)3.580.981.120.602.280.600.944.281.390.210.91
Mean Absolute Error (MAE)3.101.180.770.822.410.820.793.761.280.270.57
50% GGBS Root Mean Square Error (RMSE)3.161.070.880.722.270.720.983.531.510.170.69
Mean Absolute Error (MAE)3.131.060.860.702.260.700.953.401.470.140.66
50% GGBS + Self-healing Agent Root Mean Square Error (RMSE)2.601.530.361.182.711.180.643.951.140.520.17
Mean Absolute Error (MAE)0.873.231.362.884.402.881.215.390.722.231.55
Table 13. Static modulus of elasticity determined from the compressive strength and the dynamic modulus of elasticity.
MixCuring Time (Days)Mean Compressive Pressure, Fc (MPa)Mean Dynamic Modulus of Elasticity, Ed (GPa)Static Modulus of Elasticity, Ec (GPa)Observation
Equations in Table 6Equations in Table 2Mean
Ratio
(20) (21) (22) (23) (24) (25) (1) (2) (3)
Control2847.537.833.835.129.829.733.631.031.428.330.731.50.83
1442.237.131.833.928.528.632.329.230.827.429.930.30.82
737.236.129.932.627.127.431.027.430.026.128.828.90.80
50% GGBS2844.437.532.634.429.029.132.830.031.127.930.330.80.82
1435.535.429.232.226.727.030.526.829.425.328.028.30.80
728.833.526.330.224.725.228.524.127.822.925.926.20.78
50% GGBS + Self-healing Agent2845.834.833.234.729.429.433.230.528.924.527.330.10.87
1434.231.628.631.826.326.630.126.326.220.523.926.70.85
724.53124.228.823.323.827.022.325.719.823.224.20.78
Table 14. Image compilation for self-healing evaluation for extrinsic approach.
Time in Days
Specimen Name TagCrack Width (mm)051325
T60.2Buildings 12 02226 i001Buildings 12 02226 i002Buildings 12 02226 i003Buildings 12 02226 i004
0.2Buildings 12 02226 i005Buildings 12 02226 i006Buildings 12 02226 i007Buildings 12 02226 i008
0.2Buildings 12 02226 i009Buildings 12 02226 i010Buildings 12 02226 i011Buildings 12 02226 i012
1.5Buildings 12 02226 i013Buildings 12 02226 i014Buildings 12 02226 i015Buildings 12 02226 i016
T21.0Buildings 12 02226 i017Buildings 12 02226 i018Buildings 12 02226 i019Buildings 12 02226 i020
T30.8Buildings 12 02226 i021Buildings 12 02226 i022Buildings 12 02226 i023Buildings 12 02226 i024
T50.5Buildings 12 02226 i025Buildings 12 02226 i026Buildings 12 02226 i027Buildings 12 02226 i028
N80.4Buildings 12 02226 i029Buildings 12 02226 i030Buildings 12 02226 i031Buildings 12 02226 i032
N100.4Buildings 12 02226 i033Buildings 12 02226 i034Buildings 12 02226 i035Buildings 12 02226 i036
0.5Buildings 12 02226 i037Buildings 12 02226 i038Buildings 12 02226 i039Buildings 12 02226 i040
0.2Buildings 12 02226 i041Buildings 12 02226 i042Buildings 12 02226 i043Buildings 12 02226 i044
Table 15. Image compilation for self-healing evaluation for intrinsic approach.
Time in Days
Specimen Name TagCrack Width (mm)071423
W10.6Buildings 12 02226 i045Buildings 12 02226 i046Buildings 12 02226 i047Buildings 12 02226 i048
W30.2Buildings 12 02226 i049Buildings 12 02226 i050Buildings 12 02226 i051Buildings 12 02226 i052
W41.5Buildings 12 02226 i053Buildings 12 02226 i054Buildings 12 02226 i055Buildings 12 02226 i056
0.4Buildings 12 02226 i057Buildings 12 02226 i058Buildings 12 02226 i059Buildings 12 02226 i060
W60.3Buildings 12 02226 i061Buildings 12 02226 i062Buildings 12 02226 i063Buildings 12 02226 i064
S10.3Buildings 12 02226 i065Buildings 12 02226 i066Buildings 12 02226 i067Buildings 12 02226 i068
S20.3Buildings 12 02226 i069Buildings 12 02226 i070Buildings 12 02226 i071Buildings 12 02226 i072
S40.5Buildings 12 02226 i073Buildings 12 02226 i074Buildings 12 02226 i075Buildings 12 02226 i076
S60.05Buildings 12 02226 i077Buildings 12 02226 i078Buildings 12 02226 i079Buildings 12 02226 i080
S91.5Buildings 12 02226 i081Buildings 12 02226 i082Buildings 12 02226 i083Buildings 12 02226 i084
S100.7Buildings 12 02226 i085Buildings 12 02226 i086Buildings 12 02226 i087Buildings 12 02226 i088
Table 16. Embodied carbon comparison adapted from ICE (Inventory of Carbon and Energy) [1].
MaterialEmbodied Carbon Factor—kg CO2e/kg100% OPC50% GGBS50% GGBS + Healing Agent
Cement0.91346.6173.3173.3
GGBS0.04-7.97.9
Water0.0003440.10.10.1
Aggregates0.007141414
Transport of constituents0.00499132211.9811.9811.98
With mixing waste1.00%3.732.072.07
Precasting0.014234.0734.0734.07
Use of Self-healing agent(Reduction of 54 kgCO2/m3)---54
Transport to site0.10333.483.483.48
RESULTS:
kg CO2e/m3 concrete
414247193
Publisher’s Note: MDPI stays neutral with regard to jurisdictional claims in published maps and institutional affiliations.

