
Seismic Performance of H-Shaped Steel Column with Replaceable Slip Friction Joints

1
School of Urban Construction, Wuhan University of Science and Technology, No. 947 Heping Avenue, Wuhan 430081, China
2
Hubei Provincial Engineering Research Center of Urban Regeneration, Wuhan University of Science and Technology, No. 947 Heping Avenue, Wuhan 430081, China
3
School of Civil and Hydraulic Engineering, Huazhong University of Science and Technology, No. 1037 Luoyu Road, Wuhan 430074, China
*
Author to whom correspondence should be addressed.
Buildings 2022, 12(12), 2240; https://doi.org/10.3390/buildings12122240
Submission received: 28 November 2022
/
Revised: 12 December 2022
/
Accepted: 14 December 2022
/
Published: 16 December 2022
(This article belongs to the Special Issue Prefabricated and Modular Steel Structures)
Abstract
:Based on the concept of structural damage control, a beam-through steel frame system with continuous columns was constructed. Replaceable connectors were set at both ends of an H-shaped steel column to connect the beam with high-strength bolts. In this study, three specimens were designed and fabricated, that is, a standard H-shaped column, an H-shaped column with replaceable connectors at the bottom of the column, and an H-shaped column with replaceable connectors at both ends. Low-circumferential reciprocal loading tests were carried out to analyse the influence of the location of replaceable slip friction joints on the seismic performance of steel columns. Results showed that the H-shaped steel column with replaceable slip friction joints at both ends slipped during the loading process, as expected. The test hysteresis curve was full, and the skeleton curve did not drop significantly; thus, the column demonstrated satisfactory seismic performance. The steel column was not significantly damaged or deformed, and connectors could be reset and replaced after an earthquake to achieve post-earthquake repair. The effect of the thickness of the horizontal limbs of the connectors on the seismic performance of the H-shaped column with replaceable connectors at both ends was analysed using finite element simulation. The results revealed that the reasonable setting of the thickness of the horizontal limbs of the connectors can ensure the frictional energy dissipation capacity of the connectors and achieve the expected damage control.
1. Introduction
Modularized prefabricated steel structures have the advantages of short construction periods, less construction waste, low labor demand, and construction quality assurance [1,2,3]. In the modularized prefabricated steel structures, the use of beam-through type joints with the disconnection of the column at the floor can greatly improve the assembly efficiency of the structural system and the flexibility of spatial layout. At present, much research has been carried out on beam-through frame construction. Yao et al. [4] proposed a modified eccentrically braced frame system steel beam-through frames, aiming at improving energy dissipation capacity and seismic resistance. Du et al. [5] proposed a beam-through moment-resisting joint for H-section (wide-flange) beams and studied its seismic performance. Chen et al. [6] studied the tension-only concentrically braced beam-through frames.
In an ideal steel frame failure mode, seismic energy is typically dissipated by plastic hinges formed at the beam ends. However, owing to the randomness of seismic action and the uncertainty of the effect of the floor slab on a frame beam, the structure is difficult to completely avoid plastic hinges at the column ends, resulting in structural damage at a weak level [7]. Some researchers have shown that the vertical continuous stiffness contributes to the prevention of the formation of a weak layer failure mechanism. MacRae [8] introduced the concept of the continuous column, emphasising that continuous support stiffness at the column can prevent local collapse failure. Li et al. [9] proposed an energy-dissipative rocking column (EDRC) with beam-through configuration, which can reduce maximum inter-story drift and the drift concentration of low-rise buildings under earthquakes. Qu et al. [10] summarised several different forms of strong spine systems in steel buildings, showing that different forms of critical integral members can effectively distribute the lateral displacement of the structure under seismic action and avoid the weak layer damage in the structure.
Under earthquake action, the plastic hinge formed at the column end would lead to the axial shortening of the steel column, reduction of the bearing capacity, and failure of the weak layer of the structure, impacting the seismic stability of the structure [11,12,13]. Therefore, damage control should be conducted to contain the damage to repairable elements [14,15]. Frictional energy dissipation was widely used in damage control studies. Zhang et al. [16] proposed a new type of prefabricated cross-hinge column foot joint, for which the energy dissipation capacity is stable by the plastic deformation of LRECD and friction between plates. Liu [17,18] proposed a new type of site-bolted assembly joint and revealed that a slip of the bolts can significantly affect the node stiffness as well as the energy dissipation capacity of the joint. Zhang et al. [19] investigated the seismic performance of a steel rocking column-base joint equipped with an asymmetric friction connection (AFC). This joint can dissipate energy by frictional slipping instead of the yielding or buckling of the component and can be reused after a strong earthquake. Freddi et al. [20] conducted a study on an earthquake-resilient rocking damage-free steel column base, which uses friction devices to dissipate seismic energy. Chung et al. [21] proposed a special asymmetrical resistance friction damper (ARFD) for rocking column base.
Based on the theory of the column hinge energy dissipation mechanism, combined with the concepts of continuous column, slipping friction energy dissipation joints, and other new seismic design conceptions, the research team carried out a beam-through steel frame system with column ends slipping friction joints from the system level as shown in Figure 1. The plastic damage was transferred to the connectors and friction plates at the joints to achieve no or minimal damage to the main components. The joints are simple and easy to fabricate, assemble, and disassemble. The joints can be repaired quickly after an earthquake by replacing the connectors and friction plates. The seismic performance of H-shaped steel columns with replaceable slipping friction joints was tested and analysed.
2. Construction and Working Principle
The joint specimen consists of an H-shaped steel column, two internal connectors, two external connectors, two web brass friction plates, two external flange brass friction plates, four internal flange brass friction plates, and several friction-type high-strength bolts, as shown in Figure 2. Long slotted holes and large round holes were created on the flange and web of the H-shaped steel column to allow for rotation. A 10 mm gap was left between the bottom end of the brass friction plates and the base plate to reduce the prying effect of the column end on the joint. In a small earthquake, the joints will not rotate. In a large earthquake, the steel column will rotate around one side of the flange, and the relative slipping between the steel column and brass friction plate will dissipate the seismic energy via slipping friction. The H-shaped steel column will basically remain elastic to achieve the objective of no energy loss.
3. Overview of Experiment
3.1. Specimen Specification
Details of the specimen design are presented in Figure 3 and Figure 4. Specimen C-1 is an ordinary H-shaped column used as a standard specimen to compare with other specimens. Specimen C-2 is an H-shaped column with a replaceable connector slip friction joint at the bottom of the column. Specimen C-3 is an H-shaped column with replaceable connector slip friction joints at both ends of the column. The influence of the joint location on the seismic performance of the steel column was analysed.
The steel column cross-sectional dimensions are HW 175 mm × 175 mm × 7.5 mm × 11 mm, with a column height of 2000 mm. Specifically, the H-shaped column and connectors were selected from Q355B (nominal yield stress is 355 MPa) steel, and a 2-mm-thick brass friction plate was set between the steel column and connectors. The contact surface was sandblasted, the vertical legs of the connectors were attached to the column with high-strength bolts with a strength grade of 10.9 (with nominal ultimate strengths 1000 MPa and the yield ratio equals 0.9) and nominal diameter of 16 mm, and the connectors’ horizontal legs were attached to the base plate with bolts of the same strength but with a nominal diameter of 20 mm. Disc washers were used to prevent the bolts from loosening.
3.2. Material Property Tests
3.3. Test Set-Up
The test set-up is shown in Figure 5. The set-up was mainly composed of the reaction wall, a four-link rod, an actuator, a hydraulic jack, etc. The horizontal load of the specimen was provided by an actuator with a maximum limitation of 500 kN. The range of the actuator was 150 mm. The vertical load was provided by a hydraulic jack with maximum limitation of 200 ton. A horizontal slipping device was placed between the reaction frame and the hydraulic jack. The friction coefficient was 0.01 to meet the lateral displacement and ensure that the specimen always maintained the axial stress state during the loading process.
3.4. Loading Solutions
Test loading solutions referred to the provisions of the American AISC seismic code [23], and the loading was controlled by the inter-story displacement angle. The loading solutions are depicted in Figure 6. The actual loading was conducted using the displacement corresponding to each inter-story displacement angle. The first three levels of loading were cycled six times each, and the fourth level of loading was cycled four times. Next, each level was cycled twice, and the loading was stopped at the ninth level (0.05 rad). The vertical load was applied using the hydraulic jack, and the corresponding column axial pressure ratio was taken as 0.2 [23,24,25]. Before the formal test, the specimens were pre-loaded to check whether the test device and measuring equipment were working properly.
3.5. Strain Gauge and Displacement Metre Arrangement
The displacement and strain gauges are presented in Figure 7 and Figure 8, respectively. The strain gauges were arranged on the flange and web of the H-shaped steel columns, the horizontal and vertical legs of the connectors, and so on in order to measure the strain of the steel columns and connectors with high stress.
Displacement metre W1 was arranged at the loading position to measure the displacement of the end of the column. Displacement metres W2 and W3 were, respectively, arranged at the front and back of the midpoint of the column top to measure the axial shortening of the test piece. Displacement metres W4, W5, and W6 were arranged at the 1/3, 1/2, and 2/3 lengths of the test piece, respectively, in order to measure the displacement of the test piece along the horizontal loading direction.
4. Test Results and Analysis
4.1. Deformation Modes
The deformation modes of specimen C-1 are shown in Figure 9a–c. The steel column exhibited no obvious change under the first three levels of the loading. When the second cycle of the seventh level was 60 mm (0.03 rad), the top flange of the column showed slight buckling deformation. When the first cycle of the eighth stage was −80 mm (−0.04 rad), symmetric buckling deformation occurred on the left and right flanges of the column base, as shown in Figure 9c. When the load reached 80 mm (0.04 rad) in the second cycle of the eighth stage, buckling deformation was observed on the column base and column top web of the test specimen. It was loaded to the end of the first cycle of 100 mm (0.05 rad) at the ninth level, and then the test was stopped.
The deformation modes of specimen C-2 are shown in Figure 9d–f. The steel column exhibited no obvious change under the first two levels of the loading. When the horizontal displacement was loaded to 15 mm (0.0075 rad) in the first cycle of the third stage, slip rotation was observed on the column base joint. Loading was stopped until the second cycle of the ninth stage was −100 mm (−0.05 rad), and the tensile side of the column base flange was lifted approximately 11 mm, as shown in Figure 9f. After the test, the tensile side of the specimen was disassembled, as shown in Figure 10. Obvious bending deformation was observed between the column base flange and the vertical legs of the connectors, as shown in Figure 10a. The brass friction plates were obviously worn because the steel column was hard, yet the brass friction plates are soft. When the joint rotated owing to friction, the small bumps on the surface of the steel column were then embedded in the brass friction gaskets, ‘furrow-like’ scratches, which were finally manifested as abrasive wear [26], as shown in Figure 10b.
The deformation modes of specimen C-3 are shown in Figure 9g–i. The steel column exhibited no obvious change under the first two levels of the loading. When the second cycle of the third stage was loaded to −15 mm (−0.0075 rad), the column top and base joints began to slip and rotate. Loading was stopped until the second cycle of the ninth stage was −100 mm (−0.05 rad). A lifting of about 8 mm was observed on the tensile side of the column base flange, as shown in Figure 9i. A lifting of about 5 mm was seen on the tensile side of the column top flange, as shown in Figure 9h. The steel column demonstrated no obvious deformation, as shown in Figure 9g. After the test, the tensile side of the specimen was disassembled, as shown in Figure 11. It was clearly observed that the steel column exhibited no damage, as shown in Figure 11a. The wear on the brass friction plates is similar to that on the brass friction plates of specimen C-2, and the vertical legs of the connectors were bent and deformed, as shown in Figure 11a,b.
Figure 9 reveals that serious buckling deformation occurred at both ends of specimen C-1 at the end of the loading. The joint of specimen C-2 slipped and rotated, and the flange of the column base exhibited slight buckling. Specimen C-3 exhibited no damage, and the joints at both ends slipped and rotated, which indicates that the slipping friction joints at both ends can effectively prevent and postpone the buckling of the steel column.
4.2. Hysteresis Curves
The hysteresis curves of the three specimens are presented in Figure 12. Specimen C-1 was loaded to the eighth level (0.04 rad), and the horizontal bearing capacity reached the maximum value. At the same cyclic loading level, the bearing capacity of the steel column showed slight degradation. The buckling form of the column base and top was not exactly the same, which led to asymmetry in the positive and negative directions of the hysteresis curve. The positive and negative directions of the hysteresis curve of specimen C-2 showed satisfactory symmetry. Owing to the friction ‘vibration’ of the joints in the slipping process, a slight ‘jitter’ phenomenon was observed in some sections of the hysteresis curve. Until the end of the test loading, the ultimate horizontal bearing capacity rose slowly and tended to be stable. The hysteresis curve of specimen C-3 is similar to that of specimen C-2. The positive and negative bearing capacities reached the peak value when the load reached 100 mm (0.05 rad). Owing to the increase in the friction ‘vibration’ during the test, the ‘jitter’ phenomenon in the hysteresis curve of specimen C-3 was more obvious than that in specimen C-2. At the end of the test, the horizontal bearing capacity gradually stabilised. At the same cyclic load level, the bearing capacity did not deteriorate.
4.3. Skeleton Curves
Figure 13 shows the skeleton curves of the specimens. When specimen C-1 was loaded to 80 mm (0.04 rad), the peak load was reached. The positive peak load was 193.6 kN, and the negative peak load was −209.5 kN. The bearing capacity was reduced at the later phase of loading. After the slip rotation of the joint, the curve rising trend of specimen C-2 slowed gradually, and the bearing capacity tended to be stable in late loading. The positive load was stable at about 143.5 kN. The negative stability was 148.8 kN. After the slip rotation of specimen C-3, the rising trend of the curve slowed, and the subsequent horizontal bearing capacity tended to be stable. The positive load stabilised at about the load of 107.2 kN. The negative peak load stabilised at the load of 109.2 kN. The peak load value gradually increased in the sequence of specimen C-1, C-2, and C-3. This observation is related to the different mechanical behaviour observed at the top and bottom of steel column in these three specimens when the loading was completely finished. The top and bottom of the steel column in specimen C-1 entered the plastic phase. Part of the cross-section of the specimen C-2 entered the plastic phase at the end of the test. The two sides of steel column in specimen C-3 were still in the elastic domain at the end of loading.
4.4. Stiffness Degradation
The equivalent stiffness degradation factors for the three specimens during the loading are given in Figure 14. The stiffness degradation trend of the specimens was basically consistent. At the initial stage of the loading, specimen C-1 was in the elastic state, and the stiffness decreased linearly. When the specimen entered the elastic-plastic then plastic failure stages, the secant stiffness decline trend slowed gradually. Before the horizontal displacement of specimens C-2 and C-3 was loaded to 15 mm (0.0075 rad), the joints did not slip rotation, the steel column was in the elastic state, and the stiffness decline curve basically coincided. After the start of the slip rotation of the joints, friction energy consumption at the joints began, and the stiffness decline trend of the specimens increased. In the later test loading period, the friction energy consumption of the specimens stabilised gradually, and the slope of the secant stiffness curve decreased gradually.
4.5. Energy Consumption Performance
It can be seen from Figure 15 that the cumulative hysteretic energy of the three specimens increased as the loading displacement increased. In the first three stages of loading, the energy consumption of the three specimens was low and nearly the same. From the fourth stage of loading of 15 mm (0.0075 rad), the plastic energy consumption of specimen C-1 increased gradually and was much higher than that of specimens C-2 and C-3. Specimens C-2 and C-3 slipped and rotated from the joints at 15 mm (0.0075 rad) at the fourth level, and friction was involved in the energy consumption. Before loading to 40 mm (0.02 rad), the energy consumption of specimen C-3 was higher than that of specimen C-2 because specimen C-3 had more slipping friction joints than specimen C-2, which is conducive to friction energy consumption. When the load reached 60 mm (0.03 rad), the column base of specimen C-2 began to buckle, and the hysteretic energy consumption of specimen C-2 began to increase more than that of specimen C-3. As the loading continued, the energy consumption growth trend of the specimens accelerated.
4.6. Strain Analysis
The strain curves of each specimen are shown in Figure 16. The arrangement of the strain gauges is depicted in Figure 8. The yield strain of the steel columns and connectors was 1934 and 1961 , respectively. It can be seen from Figure 16a that, when specimen C-2 was loaded to 20 mm (0.01 rad), the strain gauges on the external connectors of the column base joint yielded. When the load reached 40 mm (0.02 rad), the strain gauge on the internal connector at the column top flange and column base joint yielded. When the load reached 60 mm (0.03 rad), the strain gauge on the column top web yielded. At the end of the loading, the strain gauges on the column top and connectors of specimen C-2 yielded. It can be seen from Figure 16b that when specimen C-3 was loaded to 20 mm (0.01 rad), the strain gauges on the external connectors of the column top joint yielded. When the displacement reached 30 mm (0.015 rad), the strain gauges on the external connectors of the column base joint and internal connector of the column top joint yielded. When the load reached 60 mm (0.03 rad), the internal connector of the column base joint yielded. At the end of the loading, all the connectors of specimen C-3 yielded, and the measured point value on the steel column did not exceed 1,934 , thereby indicating that the steel column was in the elastic state. In general, the strain distribution trend of the key components of each specimen was similar, and the position with a large amount of strain was located near the bottom plate of the vertical legs of both the internal and external connectors. Based on the comprehensive strain data, a reasonable design of the connector size can ensure that the steel column is in the elastic stage. This outcome shows that the slipping friction joints with replaceable connectors at both ends of the column play a satisfactory role in protecting the steel column and meet the requirements of structural function recovery after an earthquake.
5. Finite Element Analysis
The finite element software Abaqus was used to establish the finite element models of the specimens, as shown in Figure 17. In the models, C3D8I was used as the element type of all the components, and a structured grid technology was used for the joint model grid division. The mesh size for the plates with a large size, such as a column, was 30 mm, that for the replaceable connectors was 10 mm, and that for the high-strength bolts was 5 mm. At the same time, the grid of all the bolt hole areas was locally densified, and the number of elements on the circumference of each bolt hole was five. The welding part of the model adopted tie contact, and the other parts adopted face-to-face contact. A normal contact relationship is defined as hard contact, and the tangential contact relationship is defined as Coulomb friction contact. The friction coefficient obtained from the friction test was 0.45. The base plates were set as a rigid body to eliminate the influence of the deformation of the base plates on the performance of the joints during the loading process. The material constitutive model adopted the double broken line strengthening elastic–plastic model, and the material constitutive relationship was obtained from the material property test results. The boundary conditions of the finite element model were consistent with the test, and the sequence of the load application was consistent with that of the test. The bolt preload, vertical load, and horizontal load were applied to the model in turn.
5.1. Collapse Mode Comparison of Specimens C-2 and C-3
5.2. Comparison of the Hysteresis Curves
The results of the hysteresis curve comparison between the test and finite element simulation are shown in Figure 20. The finite element simulation results basically matched the test result curves, and the maximum error of the peak load was within 5%.
5.3. Comparison of the Axial Shortening
The axial shortening caused by the local buckling of the steel column base will have an extremely negative effect on the seismic stability of the structure. Figure 21 presents a comparison of the axial shortening of the specimens. As the number of loading stages increased, the axial shortening of the column end of the specimen C-1 accelerated and was approximately 4.84% of the column height at the end of the test. Specimens C-2 and C-3 demonstrated an axial shortening of approximately 2.6% and 0.018% of the total column height at the end of the test, respectively. It can be seen that the application of the slip friction joints at the end of the column can effectively suppress the axial shortening of the steel column.
5.4. Comparison of the Strain of the Specimen C-3
Figure 22 illustrates the strain results obtained from the calculation of the finite element model of specimen C-3. The plastic strain was distributed mainly near the base plate of the vertical legs of the connectors, where the plastic strain of the external connectors was higher than that of the internal connector. Plastic strain also appeared at the top and base of the column, but its maximum PEEQ value was significantly lower than the maximum PEEQ value of the connectors. This result shows that the plastic damage accumulation occurred mainly on the connectors, which indicates that the slipping friction joints with replaceable connectors can effectively reduce the damage on the steel column and protect the main components.
5.5. Parametric Analysis
To examine the influence of the thickness of the horizontal legs of the connectors on the seismic performance of H-shaped steel columns with replaceable slipping friction joints at the column ends, six models were designed based on specimen C-3, and the specific parameters of the models are listed in Table 2. The simulated material properties were consistent with the test.
5.5.1. Hysteresis Performance and Energy Consumption
The hysteresis curves are presented in Figure 23, which shows that the hysteresis curves were all relatively full, with a symmetrical distribution in the positive and negative directions. As the thickness of the connector horizontal limbs increased, the calculated ultimate load-carrying capacity increased. This outcome indicates that the change in the horizontal limbs of the connectors has an effect on the hysteresis curves of the H-shaped columns with replaceable slip friction joints at the column ends.
The skeleton curves are shown in Figure 24, and the main performance indicators are reported in Table 3. It can be seen that, as the thickness of the connector horizontal limbs increased, the specimen bearing capacity gradually increased. The highest ultimate bearing capacity was demonstrated by model C-3, with a value of 110.11 kN. Compared with model C-3, the ultimate bearing capacity of models C-4, C-7, and C-8 was reduced by 34.96%, 6.33%, and 2.86%, respectively. It can be seen that the thickness of the connector horizontal limbs had a considerable influence on the ultimate bearing capacity of the H-shaped steel columns with slip friction joints with replaceable connectors.
Figure 25 depicts the stiffness degradation curves of the models. The stiffness of the models increased as the thickness of the connector horizontal limbs increased. The stiffness degradation trend was generally the same for all models, with the stiffness degradation trend slowing as the thickness of the connector horizontal limbs increased in the later stages of the loading. This outcome indicates that the thickness of the connector horizontal limbs has an effect on the stiffness of the H-shaped columns with replaceable slip friction joints at the column ends.
Figure 26 and Table 3 demonstrate the cumulative frictional energy dissipation and total energy dissipation of the models at each loading level. As the thickness of the connector horizontal limbs increased, the energy consumption gradually increased, and the frictional energy consumption ratio gradually increased. Because reducing the thickness of the connector horizontal limbs makes the connector and the column first slip together, and at the end of loading to a certain displacement, the steel column starts to slip relatively, the frictional energy consumption decreases. This outcome indicates that increasing the thickness of the connector horizontal limbs is beneficial to slip frictional energy consumption.
5.5.2. The Calculated Axial Shortening
By normalising the axial shortening relative to the column height L, the relationship curve between the axial shortening and chord angle was drawn, as shown in Figure 27. The residual axial shortening of the models decreased gradually as the thickness of the connector horizontal limbs increased. The possible reason is that, under the same axial pressure ratio, decreasing the thickness of the connector horizontal limbs makes the connectors and column co-slip section longer, and the joints and column are not completely reset after the loading, thereby resulting in a large residual axial shortening.
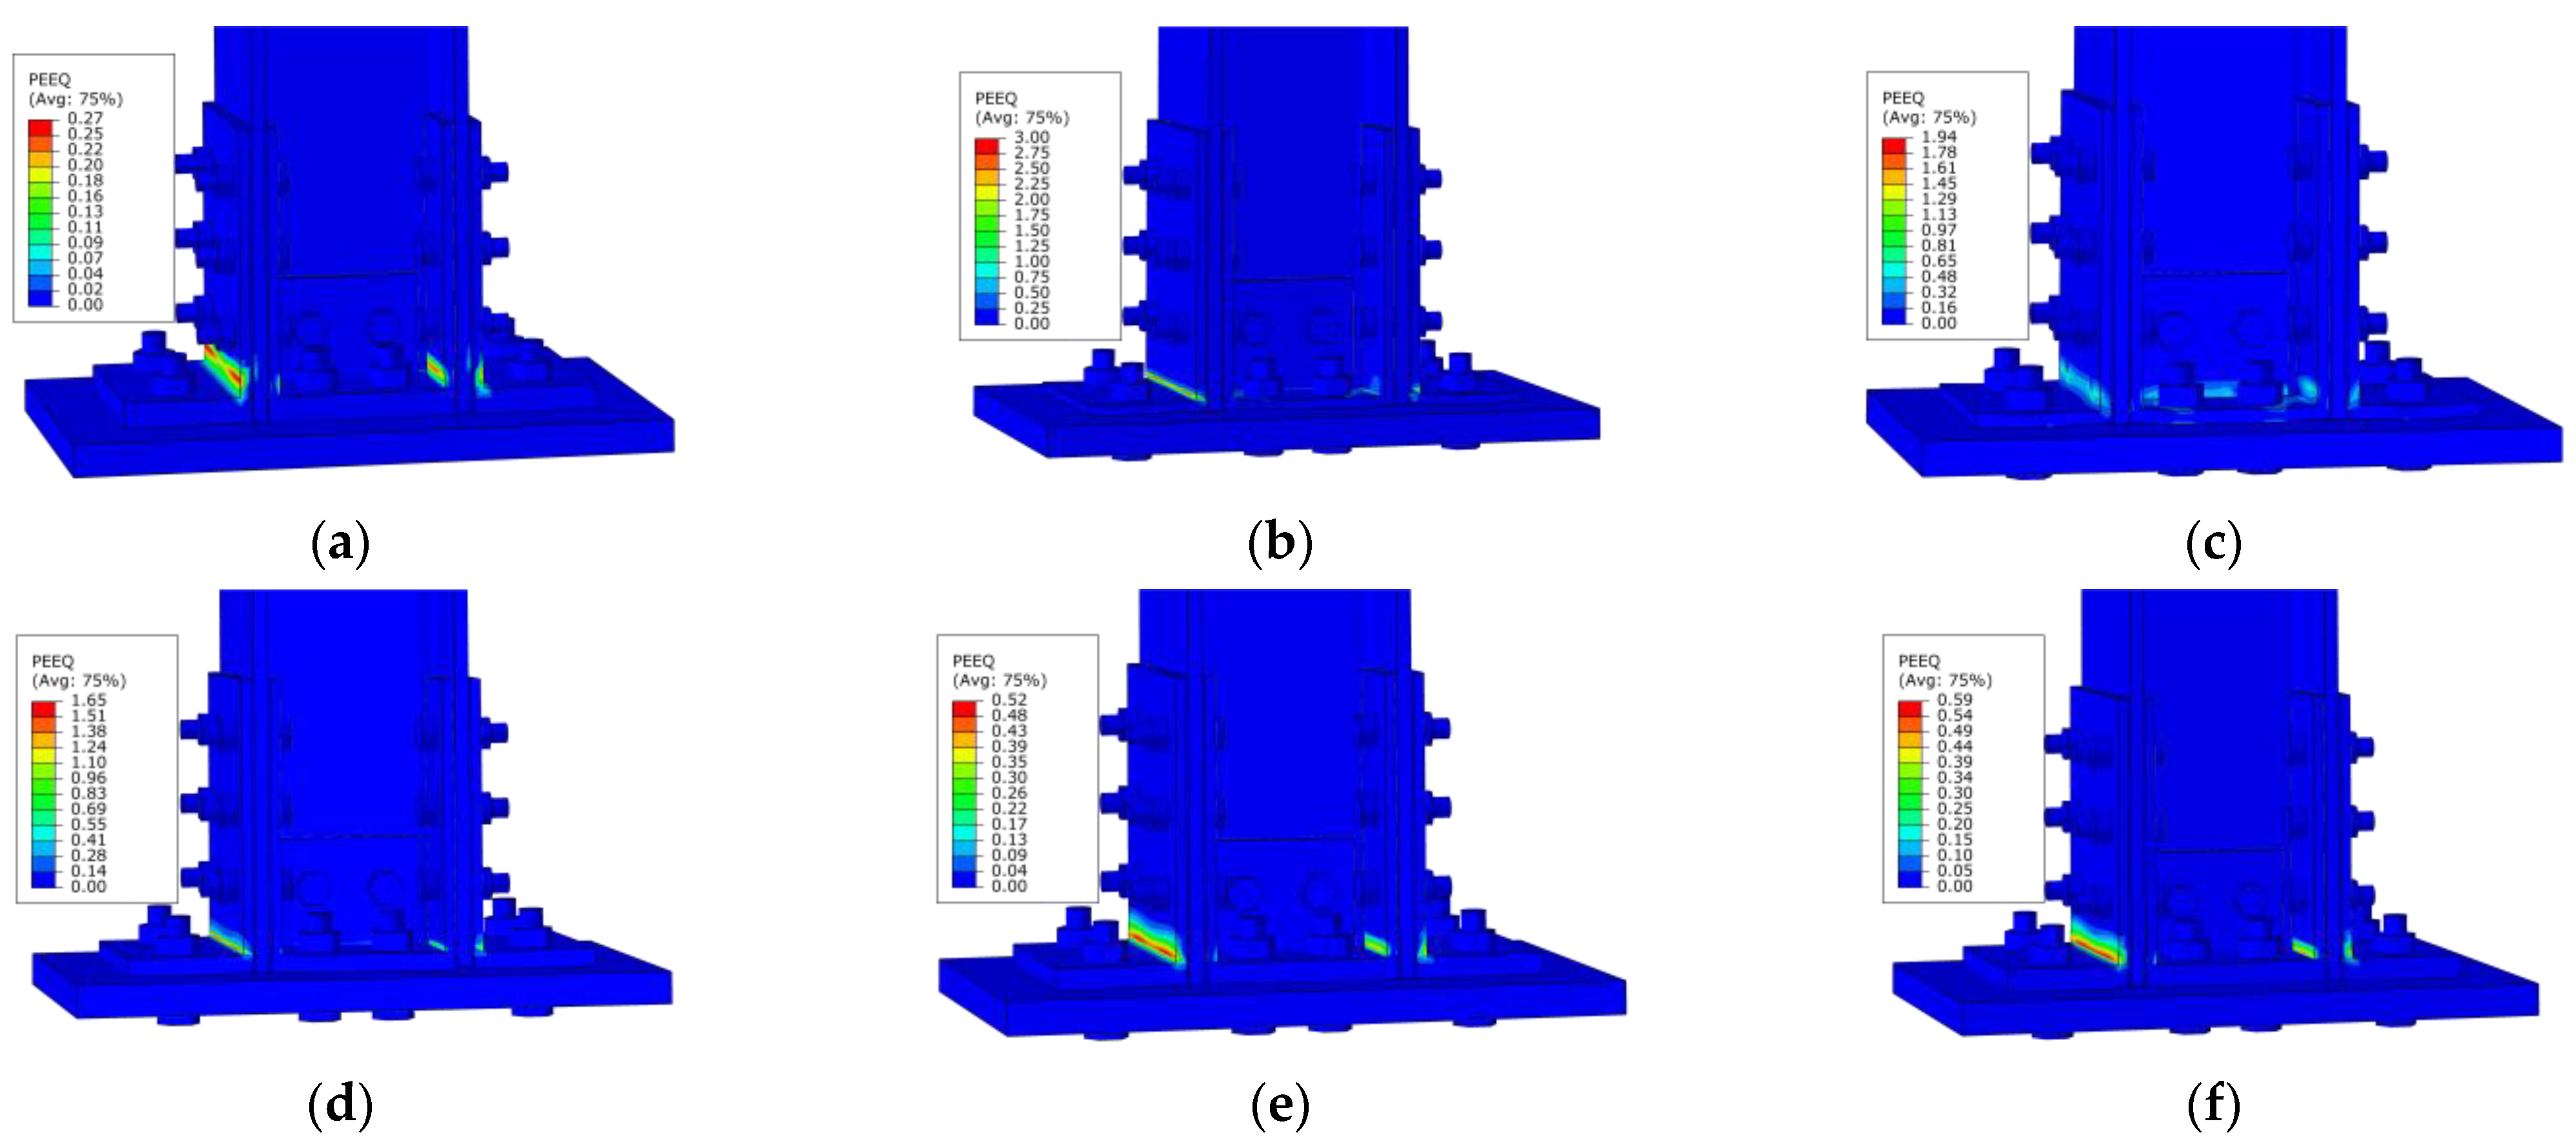
5.5.3. The Calculated Strain Analysis
Figure 28 presents the strain results obtained from the calculation of the finite element models. The strain was large near the base plate of the vertical legs of the connectors. The strain of the connectors increased gradually as the thickness of the connector horizontal limbs increased, but the strain of the column base flange of model C-3 was larger than that of the other models, as shown in Figure 28a, which indicates that the excessive thickness of the connector horizontal limbs causes damage to the main structure. The thickness of the connector horizontal limbs should be set reasonably to protect the main structure from damage.
The analysis of the hysteretic performance and energy dissipation capacity of the finite element models shows that, compared with model C-3 (20 mm), models C-7 (16 mm) and C-8 (18 mm) did not differ considerably in terms of their ultimate load-carrying capacity, stiffness degradation, and energy dissipation. By contrast, models C-4 (8 mm), C-5 (10 mm), and C-6 (14 mm) differed significantly from model C-3 in terms of their ultimate load-carrying capacity, initial stiffness, and cumulative frictional energy dissipation. The smaller thickness of the connector horizontal limbs caused the connectors and column co-slip section to become longer, which is not conducive to frictional energy dissipation. The excessive thickness of the connector horizontal limbs leads to damage transfer from the connectors to the steel column. For balance, the thickness of the connector horizontal limbs was set to 16 mm or 18 mm.
6. Conclusions
In this study, the seismic stability performance of an ordinary H-shaped steel column, a column with only one replaceable slip friction joint at the bottom, and a column with two replaceable joints at both ends were examined, and the following conclusions were obtained:
- (1)
- When the standard H-shaped column was subjected to horizontal loading, severe buckling deformation occurred at the top and base of the column. Slight buckling deformation of the base flange was observed in the H-shaped steel column with a replaceable slipping friction joint at the column base. For the H-shaped column with replaceable slip friction joints at both ends, damage was concentrated on the vertical of the internal and external connectors near the base plate, while the steel column remained elastic.
- (2)
- In comparison to the stable load bearing capacity of the H-shaped steel column with a replaceable slipping friction joint, significant degradation of the load bearing capacity of the standard H-shaped column was marked.
- (3)
- It was found that the H-shaped column with replaceable slip friction joints at both ends consumed less energy than the standard H-shaped column. However, this energy loss can be offset by additional energy-consuming elements.
- (4)
- The slip friction joints at the ends of the column can effectively reduce the axial shortening of the steel column and enhance the seismic stability of the structure.
- (5)
- The finite element analysis was conducted on H-shaped columns with replaceable slip friction joints by taking into account the thickness of the connector horizontal limbs. The results showed that the thickness of the connector horizontal limbs is suggested to be less than twice the thickness of the connector vertical limbs; in this case, the connector improved the load-bearing capacity of the steel column and ensured the frictional energy dissipation of the joints. Additionally, it protected the main structure from damage and achieved the goal damage control. The frictional energy consumption of the models reached 85–90% of the total energy consumption, indicating that the energy is mainly consumed by friction at the members of the slip friction joints with replaceable connectors.
7. Outlook
The next step of this research route is to analyse the application of replaceable slip friction joints at column ends to a floor-by-floor assembled steel frame system to investigate its seismic performance.
Author Contributions
Conceptualization, C.-Y.L. and A.-Z.Z.; methodology, C.-Y.L. and A.-Z.Z.; software, F.W.; validation, C.-Y.L. and F.W.; formal analysis, C.-Y.L.; investigation, C.-Y.L. and A.-Z.Z.; resources, C.-Y.L.; data curation, C.-Y.L. and F.W.; writing-original draft, F.W.; writing-review and editing, C.-Y.L.; visualization, C.-Y.L.; supervision, C.-Y.L. and A.-Z.Z.; project administration, C.-Y.L.; funding acquisition, C.-Y.L. All authors have read and agreed to the published version of the manuscript.
Funding
This work was financially supported by the National Natural Science Foundation of China (No. 51878522).
Data Availability Statement
Data collected from the questionnaire survey and the data analysis results presented in the paper are available from the corresponding author by request.
Conflicts of Interest
The author(s) declare no potential conflict of interest with respect to the research, authorship, and/or publication of this article.
References
- Thai, H.-T.; Ngo, T.; Uy, B. A review on modular construction for high-rise buildings. Structures 2020, 28, 1265–1290. [Google Scholar] [CrossRef]
- Wang, H.; Zhao, X.; Ma, G. Experimental study on seismic performance of column-column-beam joint in panelised steel-modular structure. J. Constr. Steel Res. 2022, 192, 107240. [Google Scholar] [CrossRef]
- Deng, E.-F.; Zong, L.; Ding, Y.; Zhang, Z.; Zhang, J.-F.; Shi, F.-W.; Cai, L.-M.; Gao, S.-C. Seismic performance of mid-to-high rise modular steel construction—A critical review. Thin-Walled Struct. 2020, 155, 106924. [Google Scholar] [CrossRef]
- Yao, Z.; Wang, W.; Fang, C.; Zhang, Z. An experimental study on eccentrically braced beam-through steel frames with replaceable shear links. Eng. Struct. 2020, 206, 110185. [Google Scholar] [CrossRef]
- Du, H.; Zhao, P.; Wang, Y.; Sun, W. Seismic experimental assessment of beam-through beam-column connections for modular prefabricated steel moment frames. J. Constr. Steel Res. 2022, 192, 107208. [Google Scholar] [CrossRef]
- Chen, Y.; Wang, W.; Chen, Y. Full-scale shake table tests of the tension-only concentrically braced steel beam-through frame. J. Constr. Steel Res. 2018, 148, 611–626. [Google Scholar] [CrossRef]
- Zaghi, A.E.; Soroushian, S.; Itani, A.; Maragakis, E.M.; Pekcan, G.; Mehrraoufi, M. Impact of column-to-beam strength ratio on the seismic response of steel MRFs. Bull. Earthq. Eng. 2015, 13, 635–652. [Google Scholar] [CrossRef]
- MacRae, G.A. The continuous column concept-development and use. In Proceedings of the Ninth Pacific Conference on Earthquake Engineering Building an Earthquake-Resilient Society, Auckland, New Zealand, 14–16 April 2011; pp. 14–16. [Google Scholar]
- Li, Y.W.; Wang, Y.Z.; Wang, Y.B. Experimental and numerical study of beam-through energy-dissipative rocking columns for mitigating seismic responses. J. Constr. Steel. Res. 2022, 189, 107097. [Google Scholar] [CrossRef]
- Qu, Z.; Gong, T.; Wang, X.; Li, Q.; Wang, T. Stiffness and strength demands for pin-supported walls in reinforced-concrete moment frames. J. Constr. Steel. Res. 2020, 9, 146. [Google Scholar] [CrossRef]
- Macrae, G.A.; Urmson, C.R.; Walpole, W.R.; Moss, P.; Hyde, K.; Clifton, G.C. Axial shortening of steel columns in buildings subjected to earthquakes. Bull. N. Z. Soc. Earthq. Eng. 2009, 42, 275–287. [Google Scholar] [CrossRef]
- Ibarra, L.F.; Medina, R.A.; Krawinkler, H. Hysteretic models that incorporate strength and stiffness deterioration. Earthq. Eng. Struct. Dyn. 2005, 34, 1489–1511. [Google Scholar] [CrossRef]
- Lignos, D.G.; Hikino, T.; Matsuoka, Y.; Nakashima, M. Collapse assessment of steel moment frames based on e-defense full-scale shake table collapse tests. J. Struct. Eng. 2013, 139, 120–132. [Google Scholar] [CrossRef]
- Lin, X.; Li, H.; He, L.; Zhang, L. Experimental study on seismic behavior of the damage-control steel plate fuses for beam-to-column connection. Eng. Struct. 2022, 270, 114862. [Google Scholar] [CrossRef]
- Lin, X.; Chen, Y.; Yan, J.-B.; Hu, Y. Seismic behavior of welded beam-to-column joints of high-strength steel-moment frame with replaceable damage-control fuses. J. Struct. Eng. 2020, 146, 04020143. [Google Scholar] [CrossRef]
- Zhang, A.-L.; Chen, X.; Jiang, Z.-Q.; Kang, Y.-T.; Yang, X.-F. Experiment on seismic behavior of earthquake-resilience prefabricated cross hinge column foot joint. J. Constr. Steel Res. 2022, 189, 107056. [Google Scholar] [CrossRef]
- Liu, X.C.; Cui, F.Y.; Zhan, X.X.; Yu, C.; Jiang, Z.Q. Seismic performance of bolted connection of H-beam to HSS-column with web end-plate. J. Constr. Steel Res. 2019, 156, 167–181. [Google Scholar] [CrossRef]
- Liu, X.; Yang, Z.; Wang, H.; Zhang, A.; Pu, S.; Chai, S.; Wu, L. Seismic performance of H-section beam to HSS column connection in prefabricated structures. J. Constr. Steel Res. 2017, 138, 1–16. [Google Scholar] [CrossRef]
- Zhang, R.; Xie, J.-Y.; Chouery, K.E.; Liu, J.; Jia, L.-J.; Xiang, P.; Zhao, X.; Macrae, G.A.; Clifton, G.C.; Dhakal, R.P.; et al. Strong axis low-damage performance of rocking column-base joints with asymmetric friction connections. J. Constr. Steel Res. 2022, 191, 107175. [Google Scholar] [CrossRef]
- Freddi, F.; Dimopoulos, C.A.; Karavasilis, T.L. Experimental evaluation of a rocking damage-free steel column base with friction devices. J. Struct. Eng. 2020, 146, 04020217. [Google Scholar] [CrossRef]
- Chung, Y.L.; Du, L.J.; Pan, H.H. Performance evaluation of a rocking steel column base equipped with asymmetrical resistance friction damper. Earthq. Struct. 2019, 17, 49–61. [Google Scholar] [CrossRef]
- GB/T 228.1-2021; Metallic Materials—Tensile Testing—Part 1: Method of Test at Room Temperature. National Standard of the People’s Republic of China: Beijing, China, 2021. (In Chinese)
- ANSI/AISC 341-16; Seismic Provisions for Structural Steel Buildings. American Institute of Steel Construction Inc.: Chicago, IL, USA, 2016.
- Borzouie, J.; MacRae, G.A.; Chase, J.G.; Rodgers, G.W.; Clifton, G.C. Experimental studies on cyclic performance of column base strong axis–aligned asymmetric friction connections. J. Struct. Eng. 2016, 142, 04015078. [Google Scholar] [CrossRef]
- Elettore, E.; Freddi, F.; Latour, M.; Rizzano, G. Design and analysis of a seismic resilient steel moment resisting frame equipped with damage-free self-centering column bases. J. Constr. Steel Res. 2021, 179, 106543. [Google Scholar] [CrossRef]
- Kim, E.C.; Fan, K.; Jia, L.J. State-of-the-art review of symmetric and asymmetric friction connections: Seismic behavior and design methods. Eng. Mech. 2021, 38, 22–37. (In Chinese) [Google Scholar] [CrossRef]
Figure 1.
Test specimen model. (a) Continuous column frame structural system; (b) H-shaped column with replaceable slipping friction joints at both ends.
Figure 1.
Test specimen model. (a) Continuous column frame structural system; (b) H-shaped column with replaceable slipping friction joints at both ends.
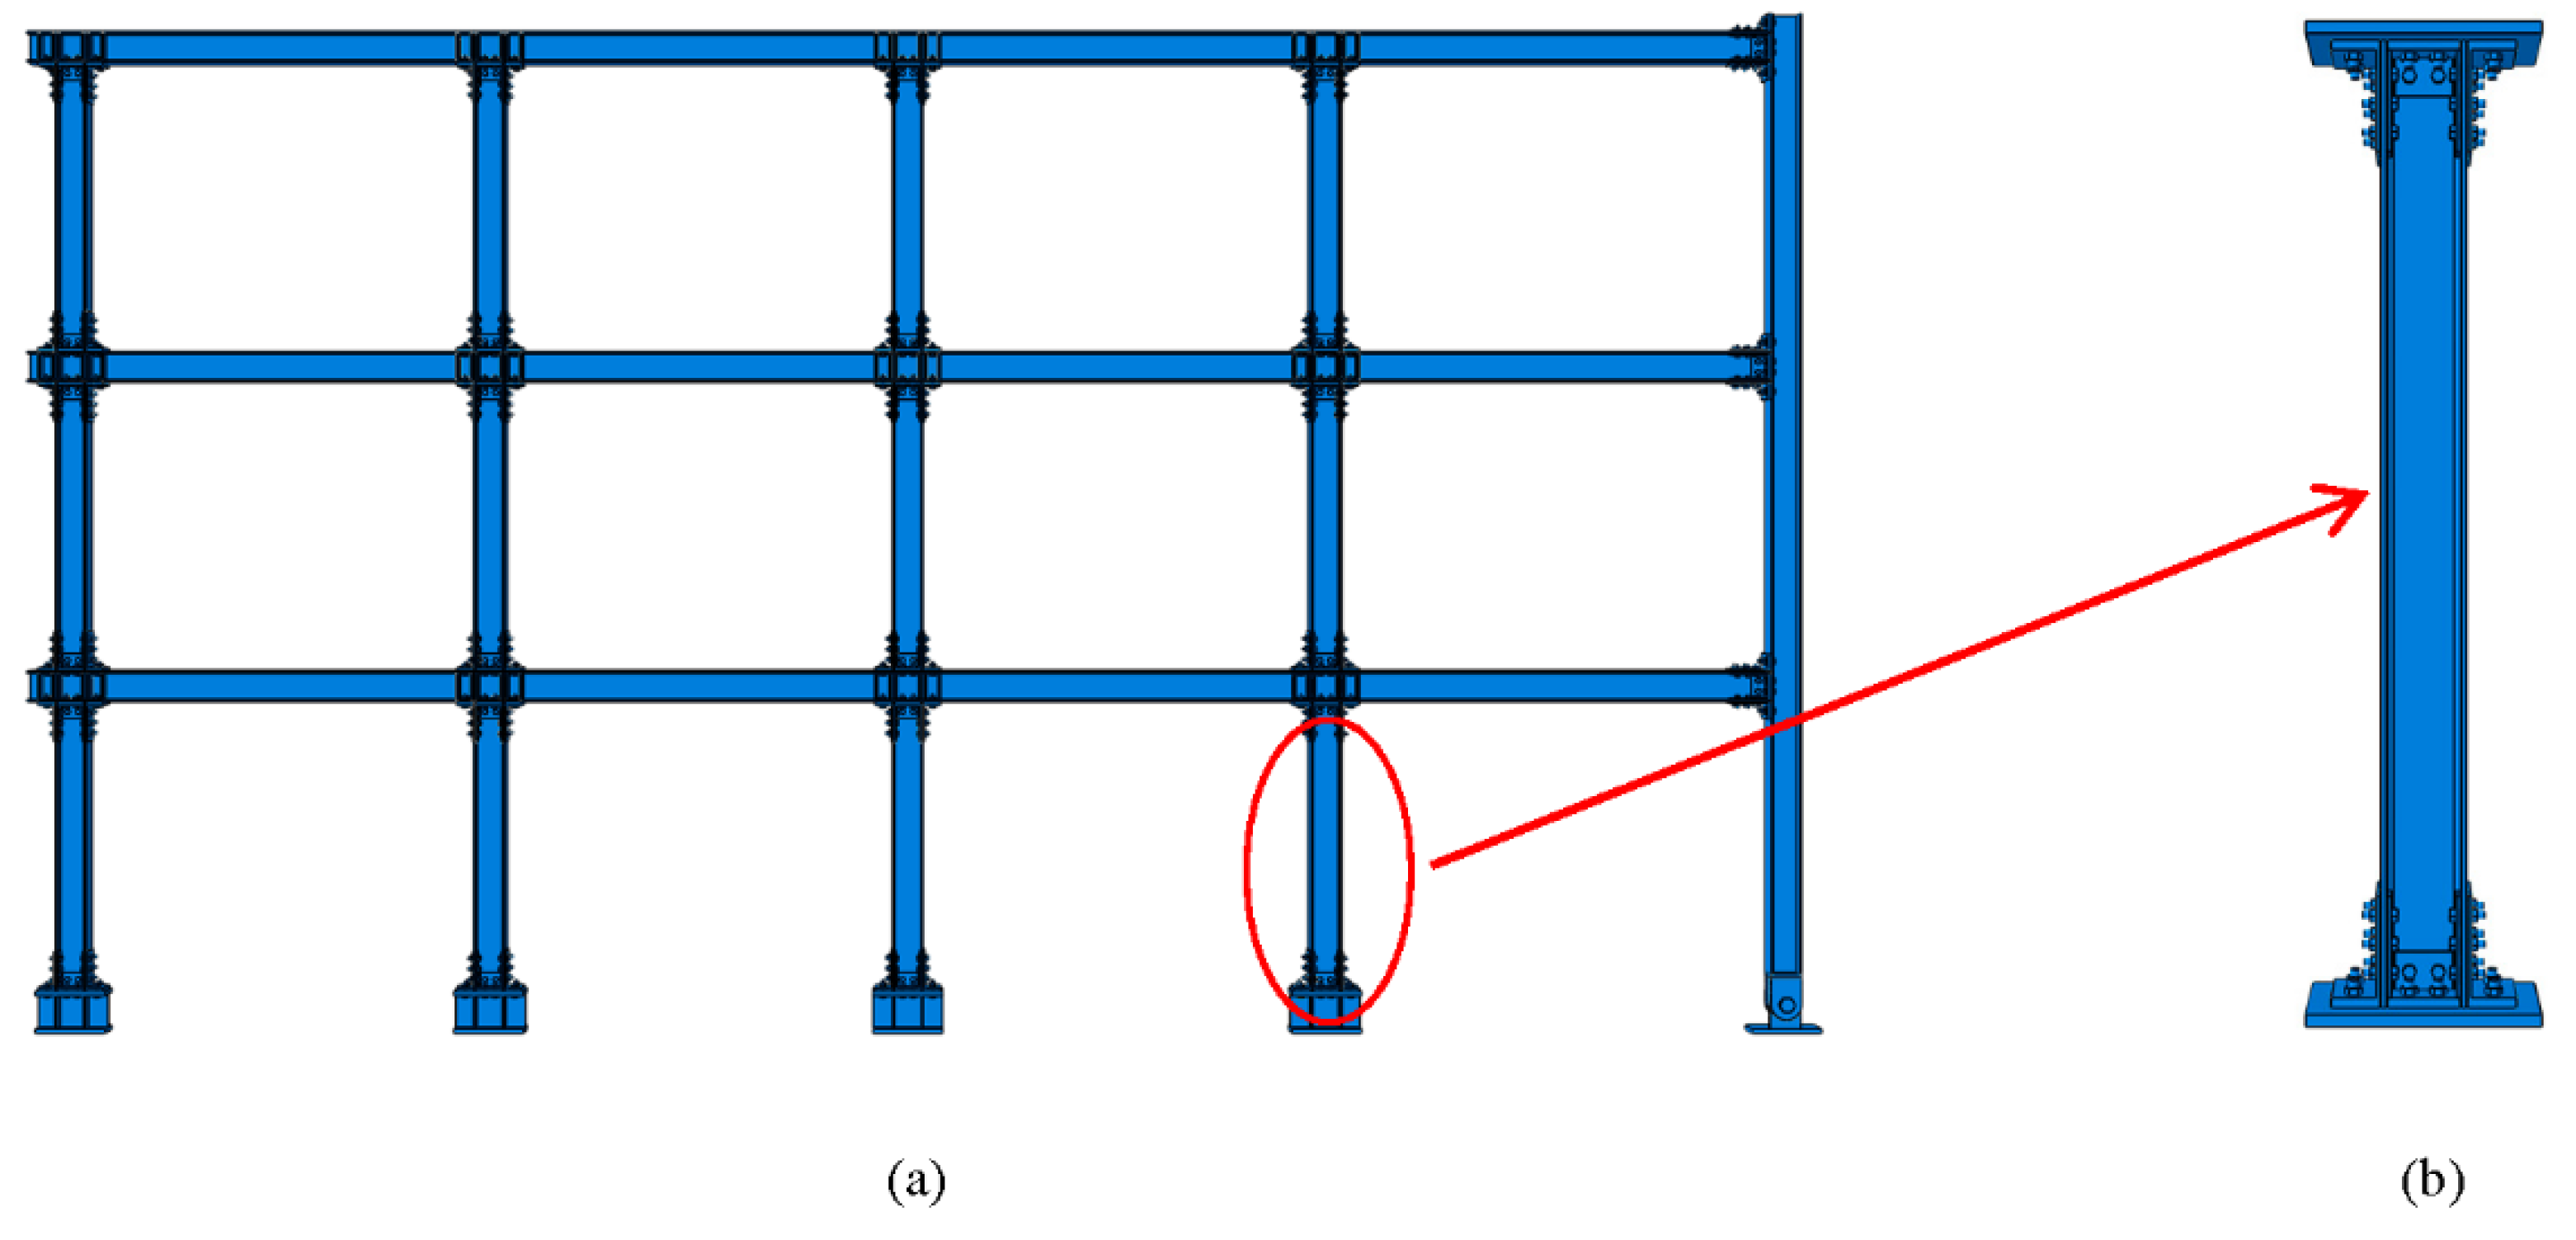
Figure 2.
Replaceable slip friction joint. (a) The assembly joint; (b) components of the joint.
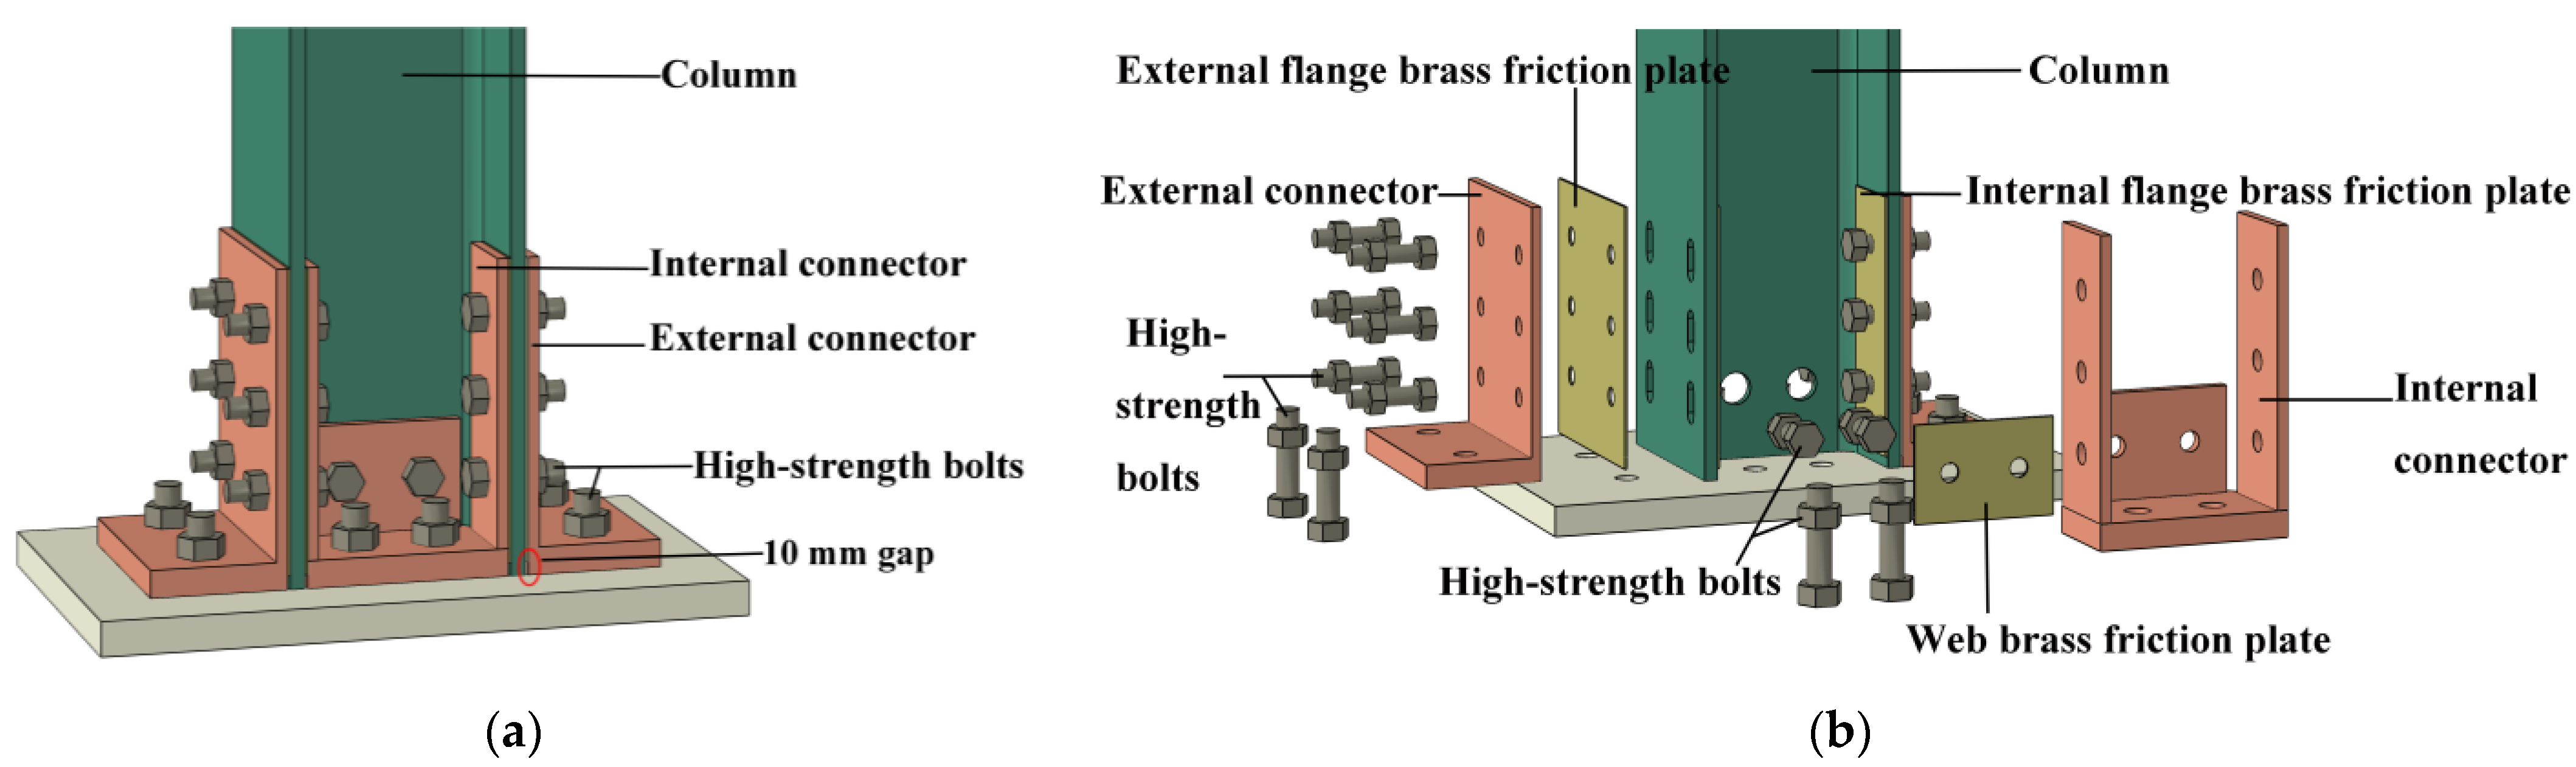
Figure 3.
Test specimens (mm): (a) dimensions of C-1; (b) dimensions of C-2; (c) dimensions of C-3.
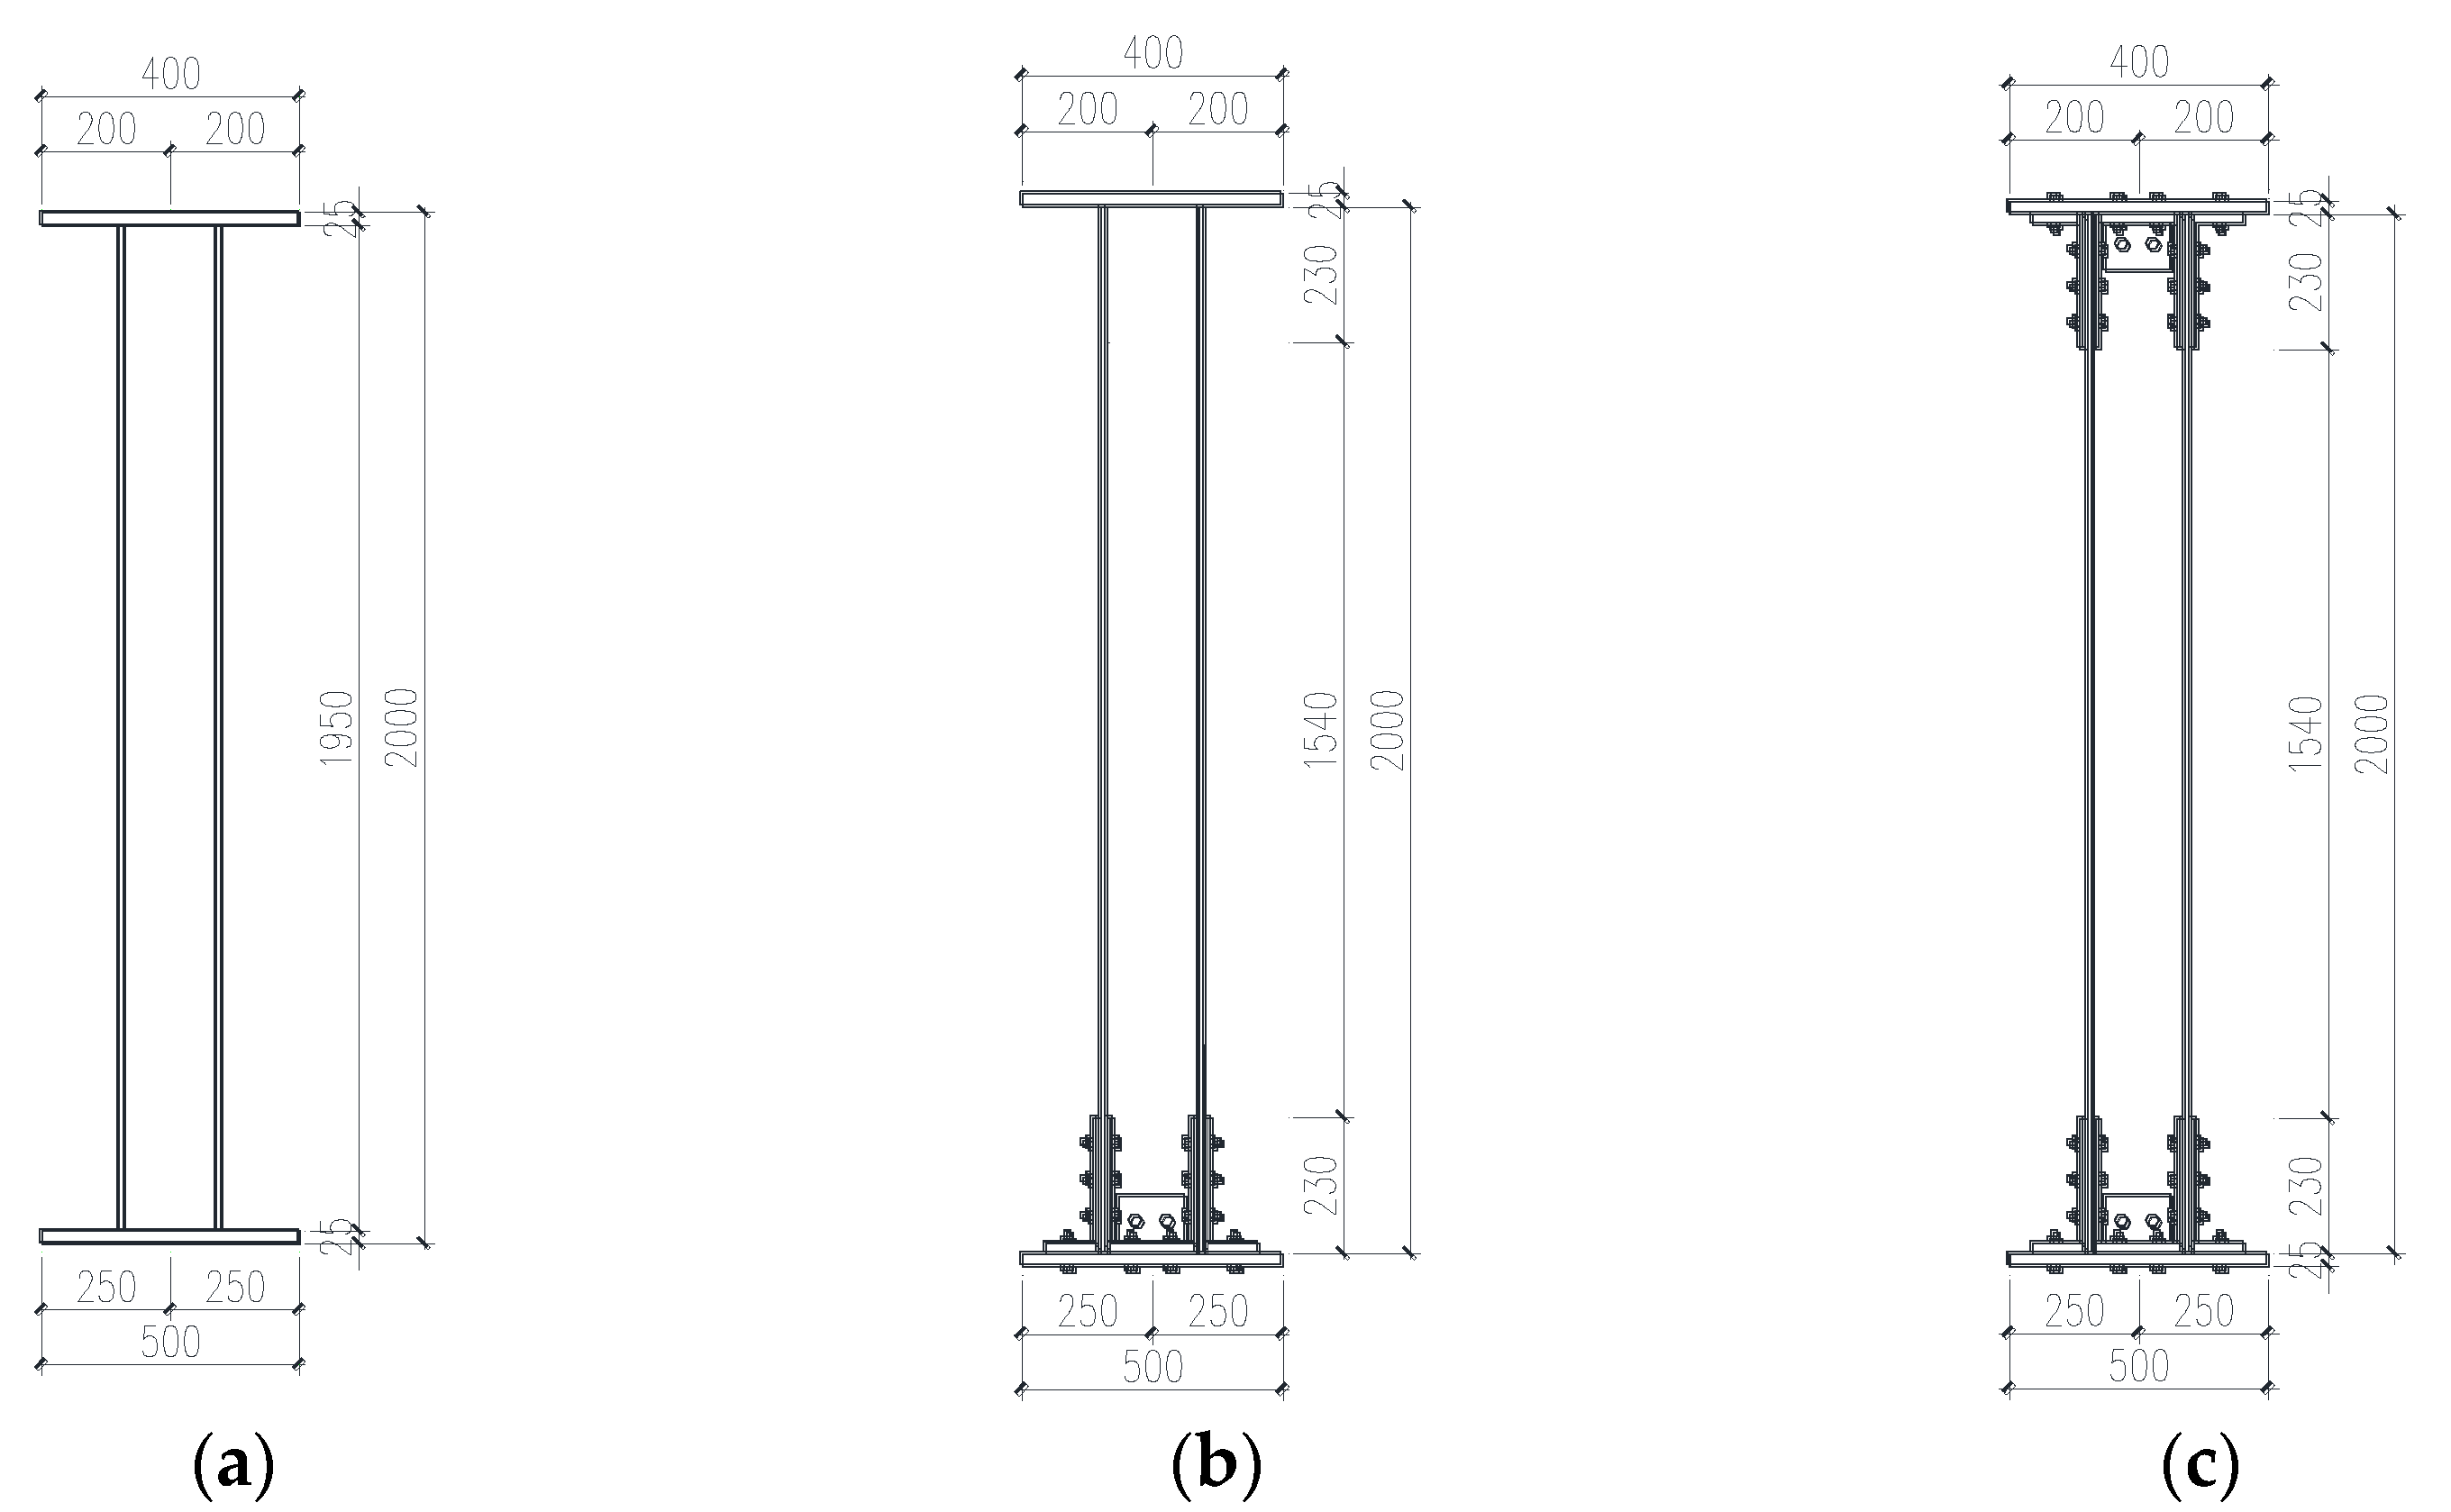
Figure 4.
Specifications of the joint members (mm): (a) hole design of the flange; (b) hole design of the web; (c) holes on the vertical limb of the external connector; (d) holes on the horizontal limb of the external connector; (e) design of the vertical limb of the internal connector; (f) design of the internal connector; (g) design of the internal connector.
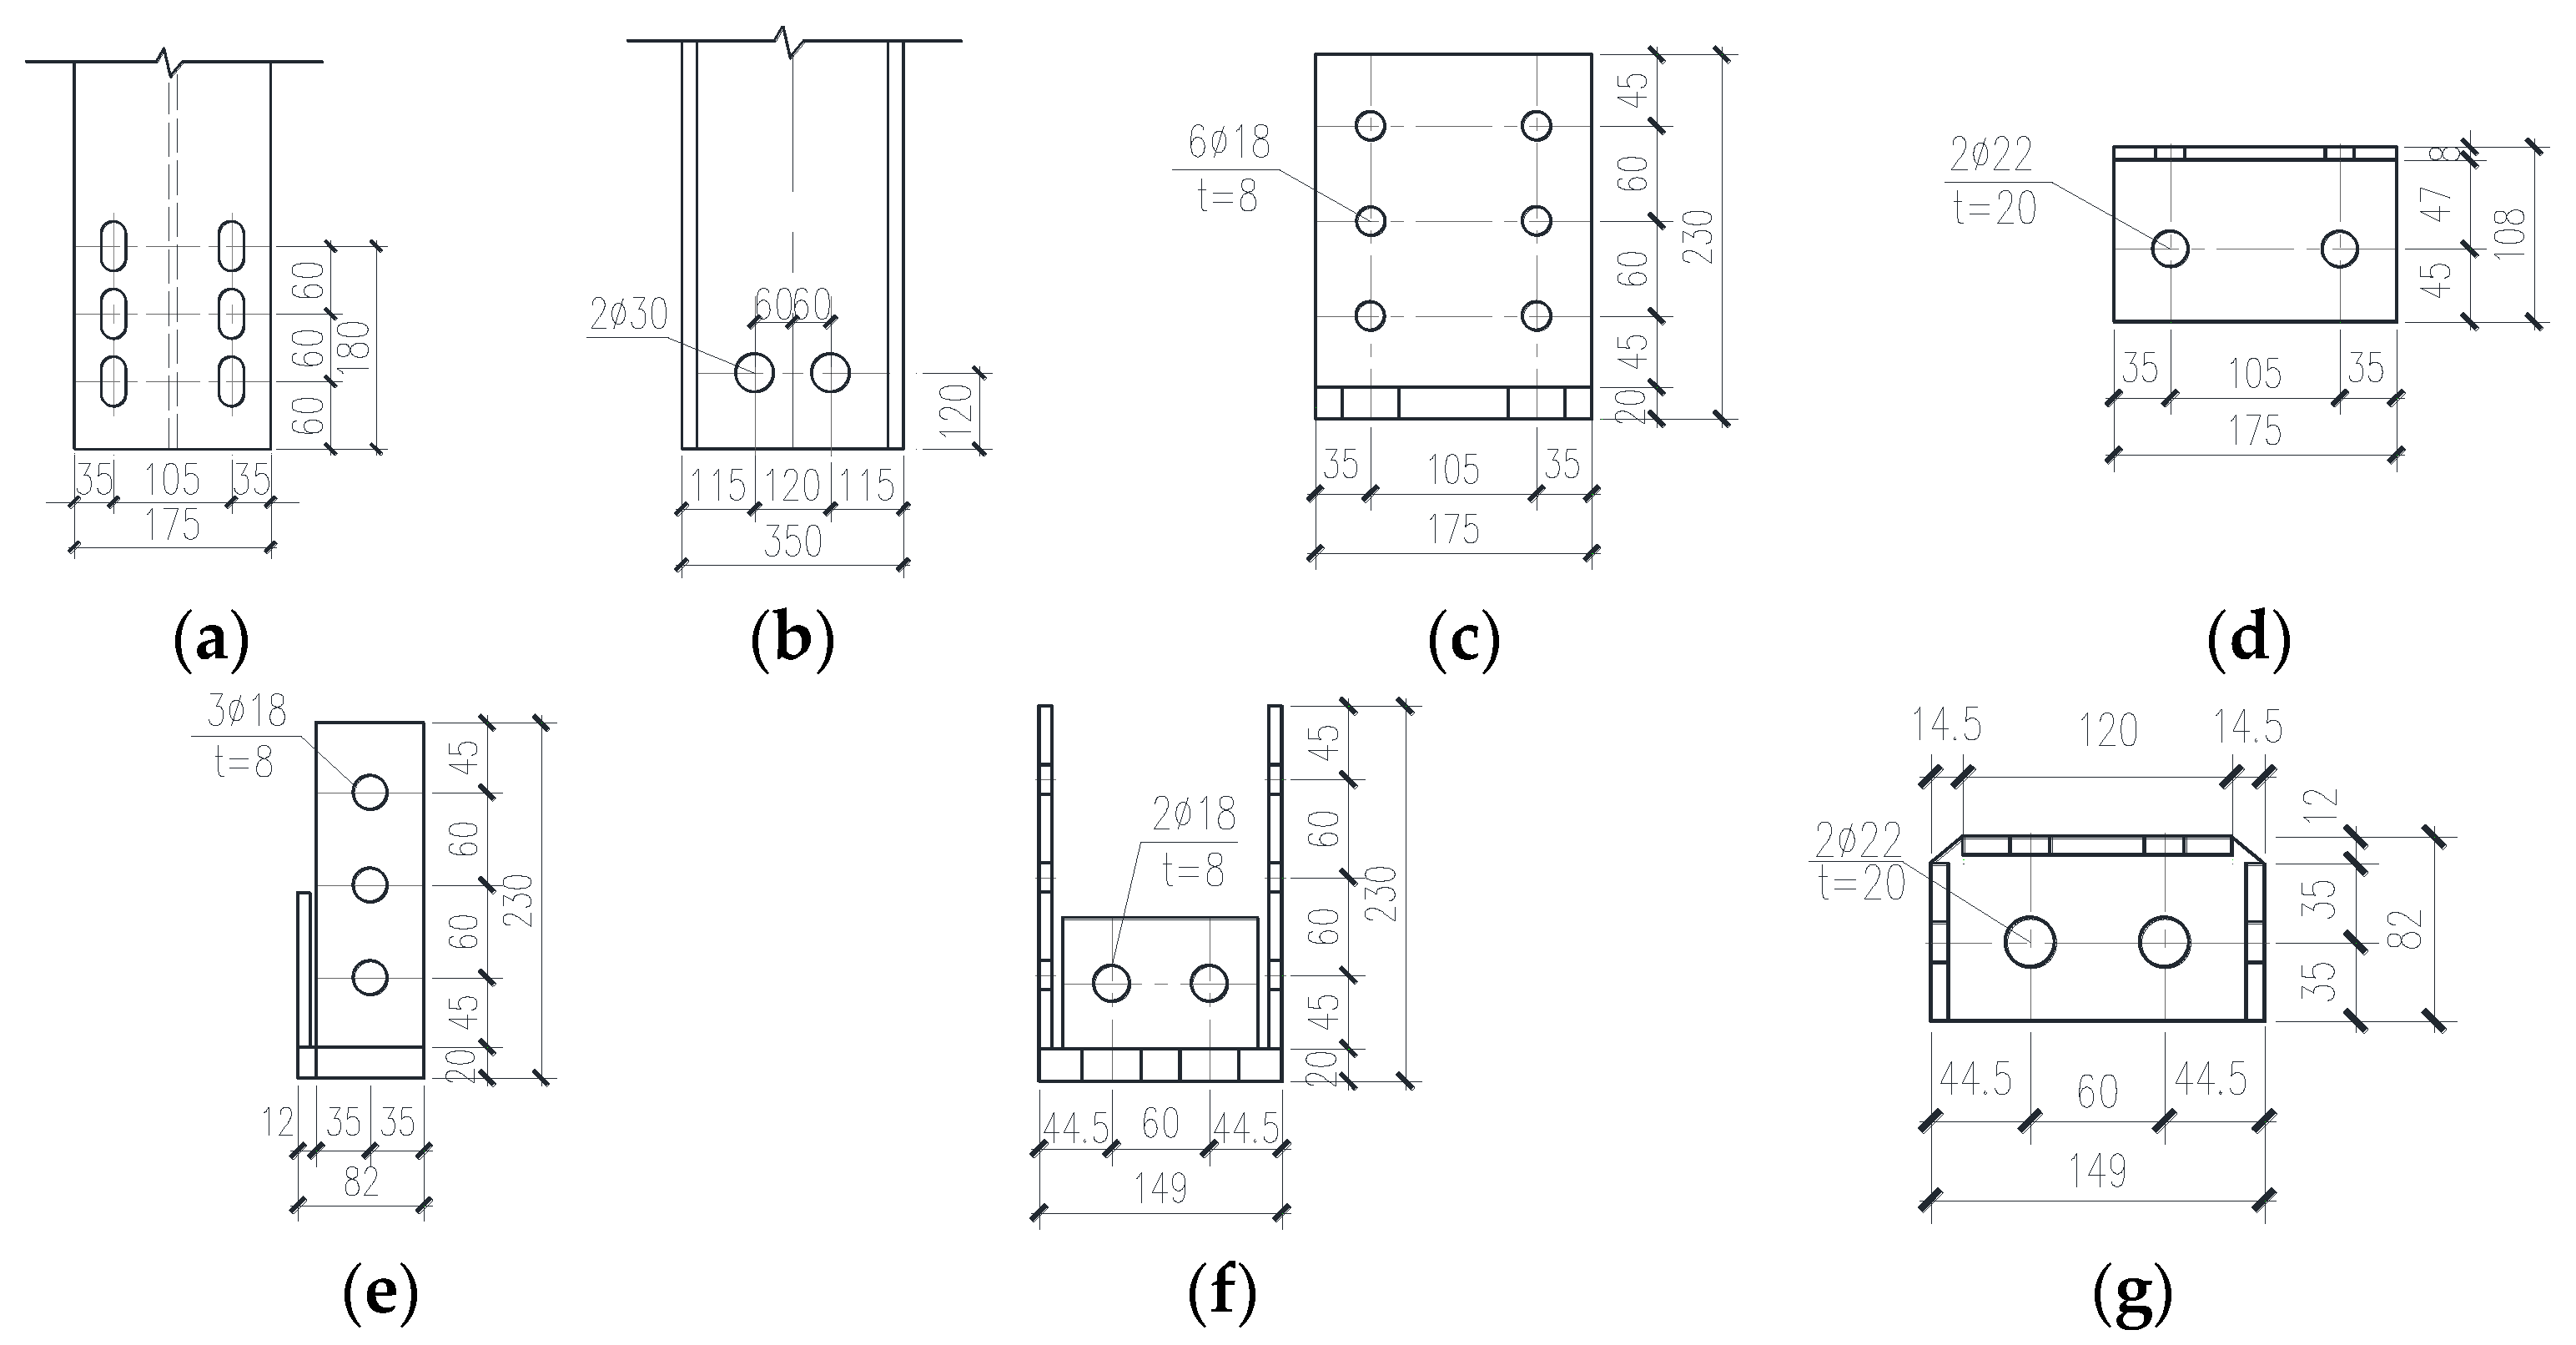
Figure 5.
Test set-up.

Figure 6.
Test loading solutions.
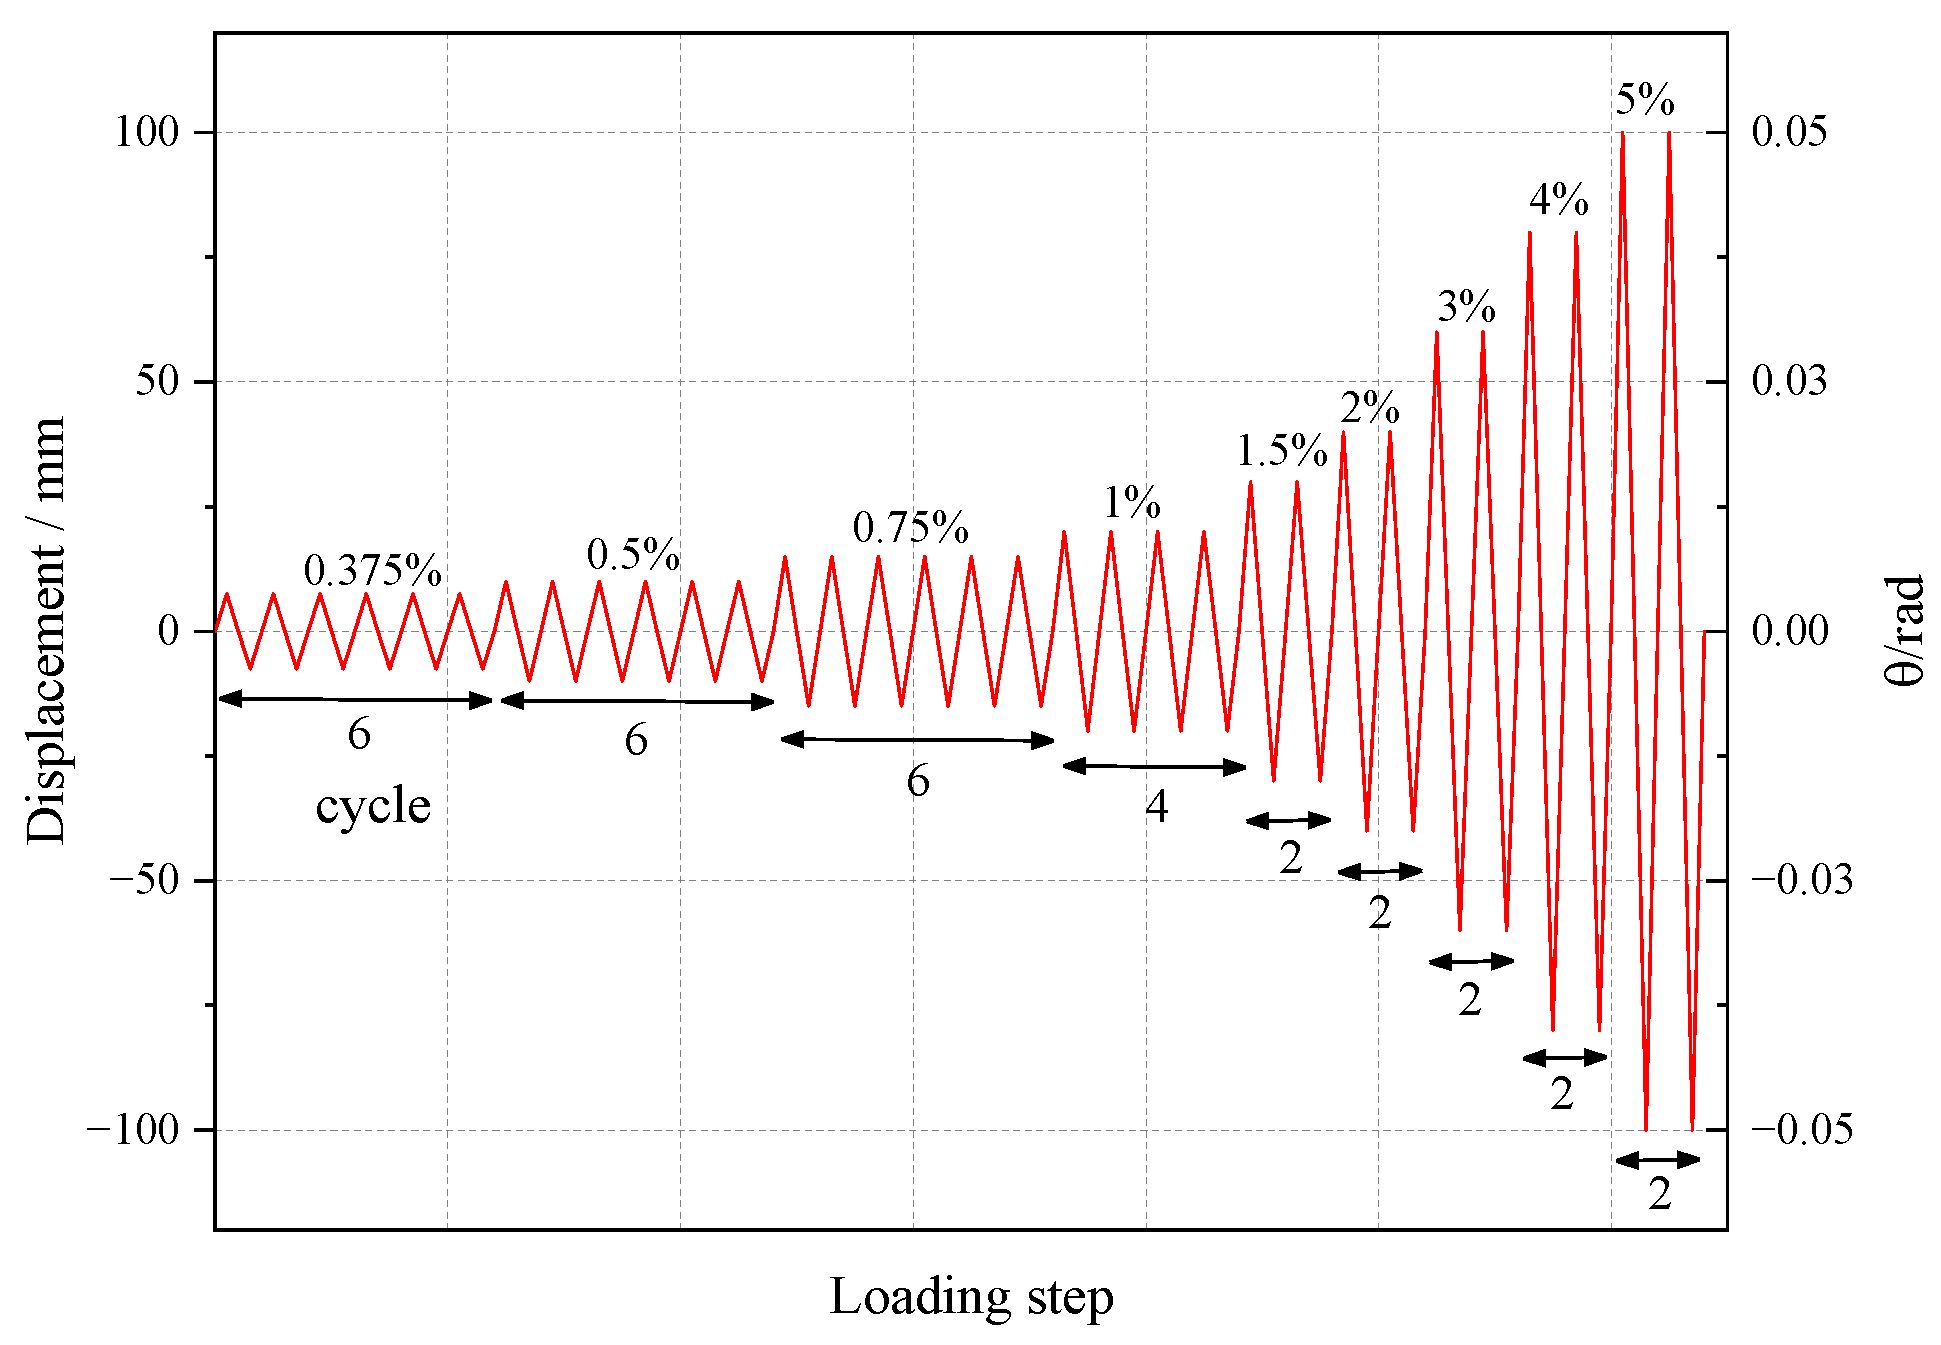
Figure 7.
Displacement metre arrangement.
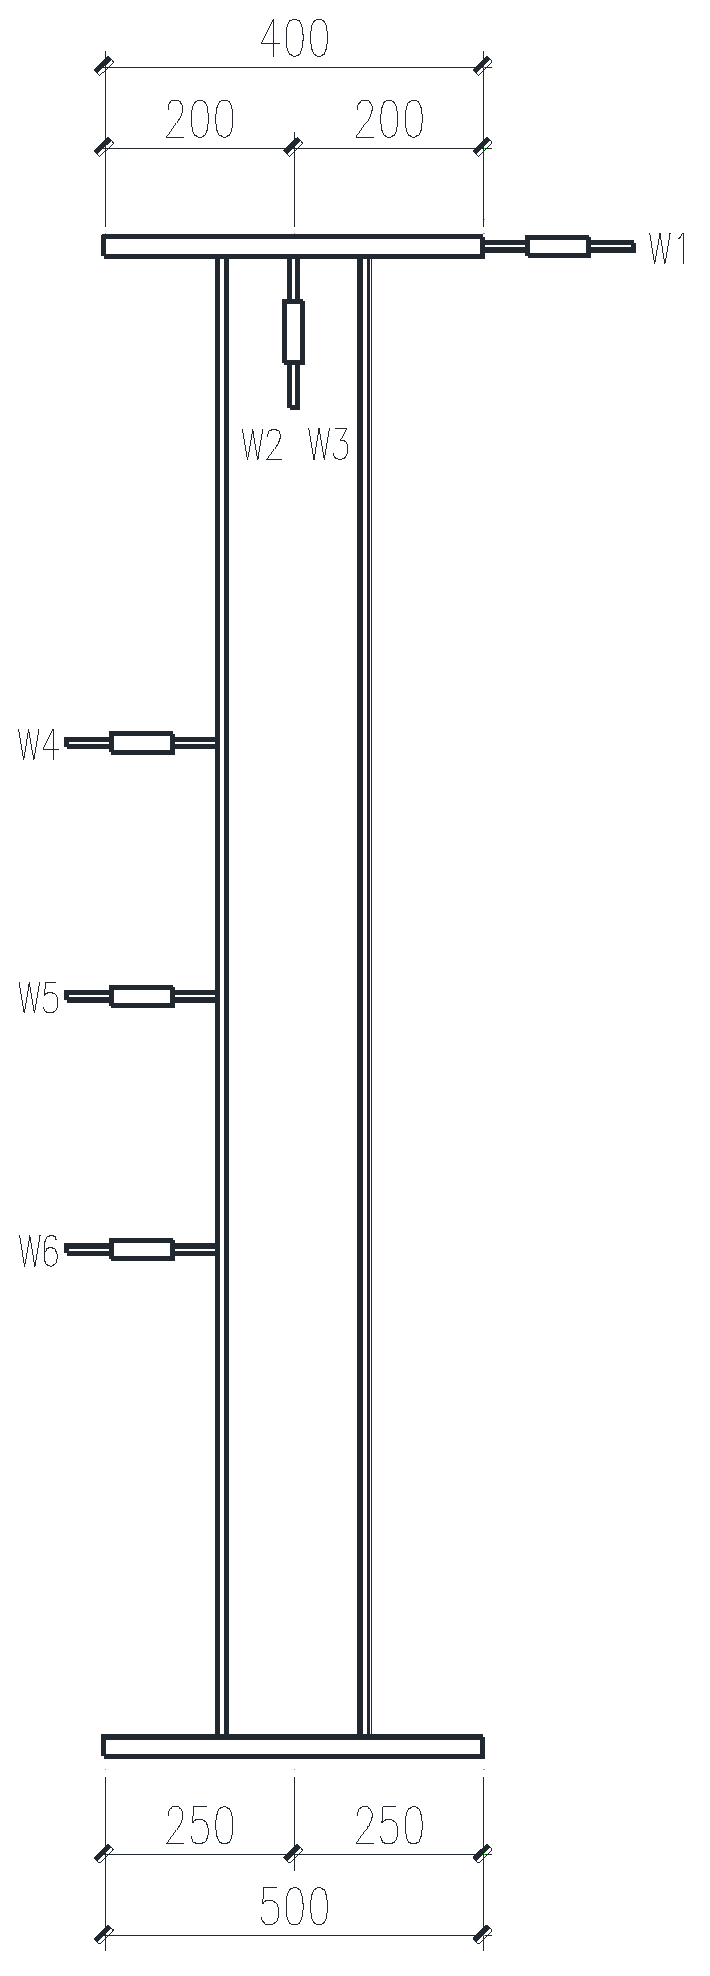
Figure 8.
Strain gauge arrangement: (a) C-1 winged edge; (b) C-1 and C-3 webs; (c) C-2 winged edge; (d) C-2 web; (e) C-3 winged edge; (f) external connector vertical limb; (g) external connector horizontal limb; (h) internal connector vertical limb.
Figure 8.
Strain gauge arrangement: (a) C-1 winged edge; (b) C-1 and C-3 webs; (c) C-2 winged edge; (d) C-2 web; (e) C-3 winged edge; (f) external connector vertical limb; (g) external connector horizontal limb; (h) internal connector vertical limb.
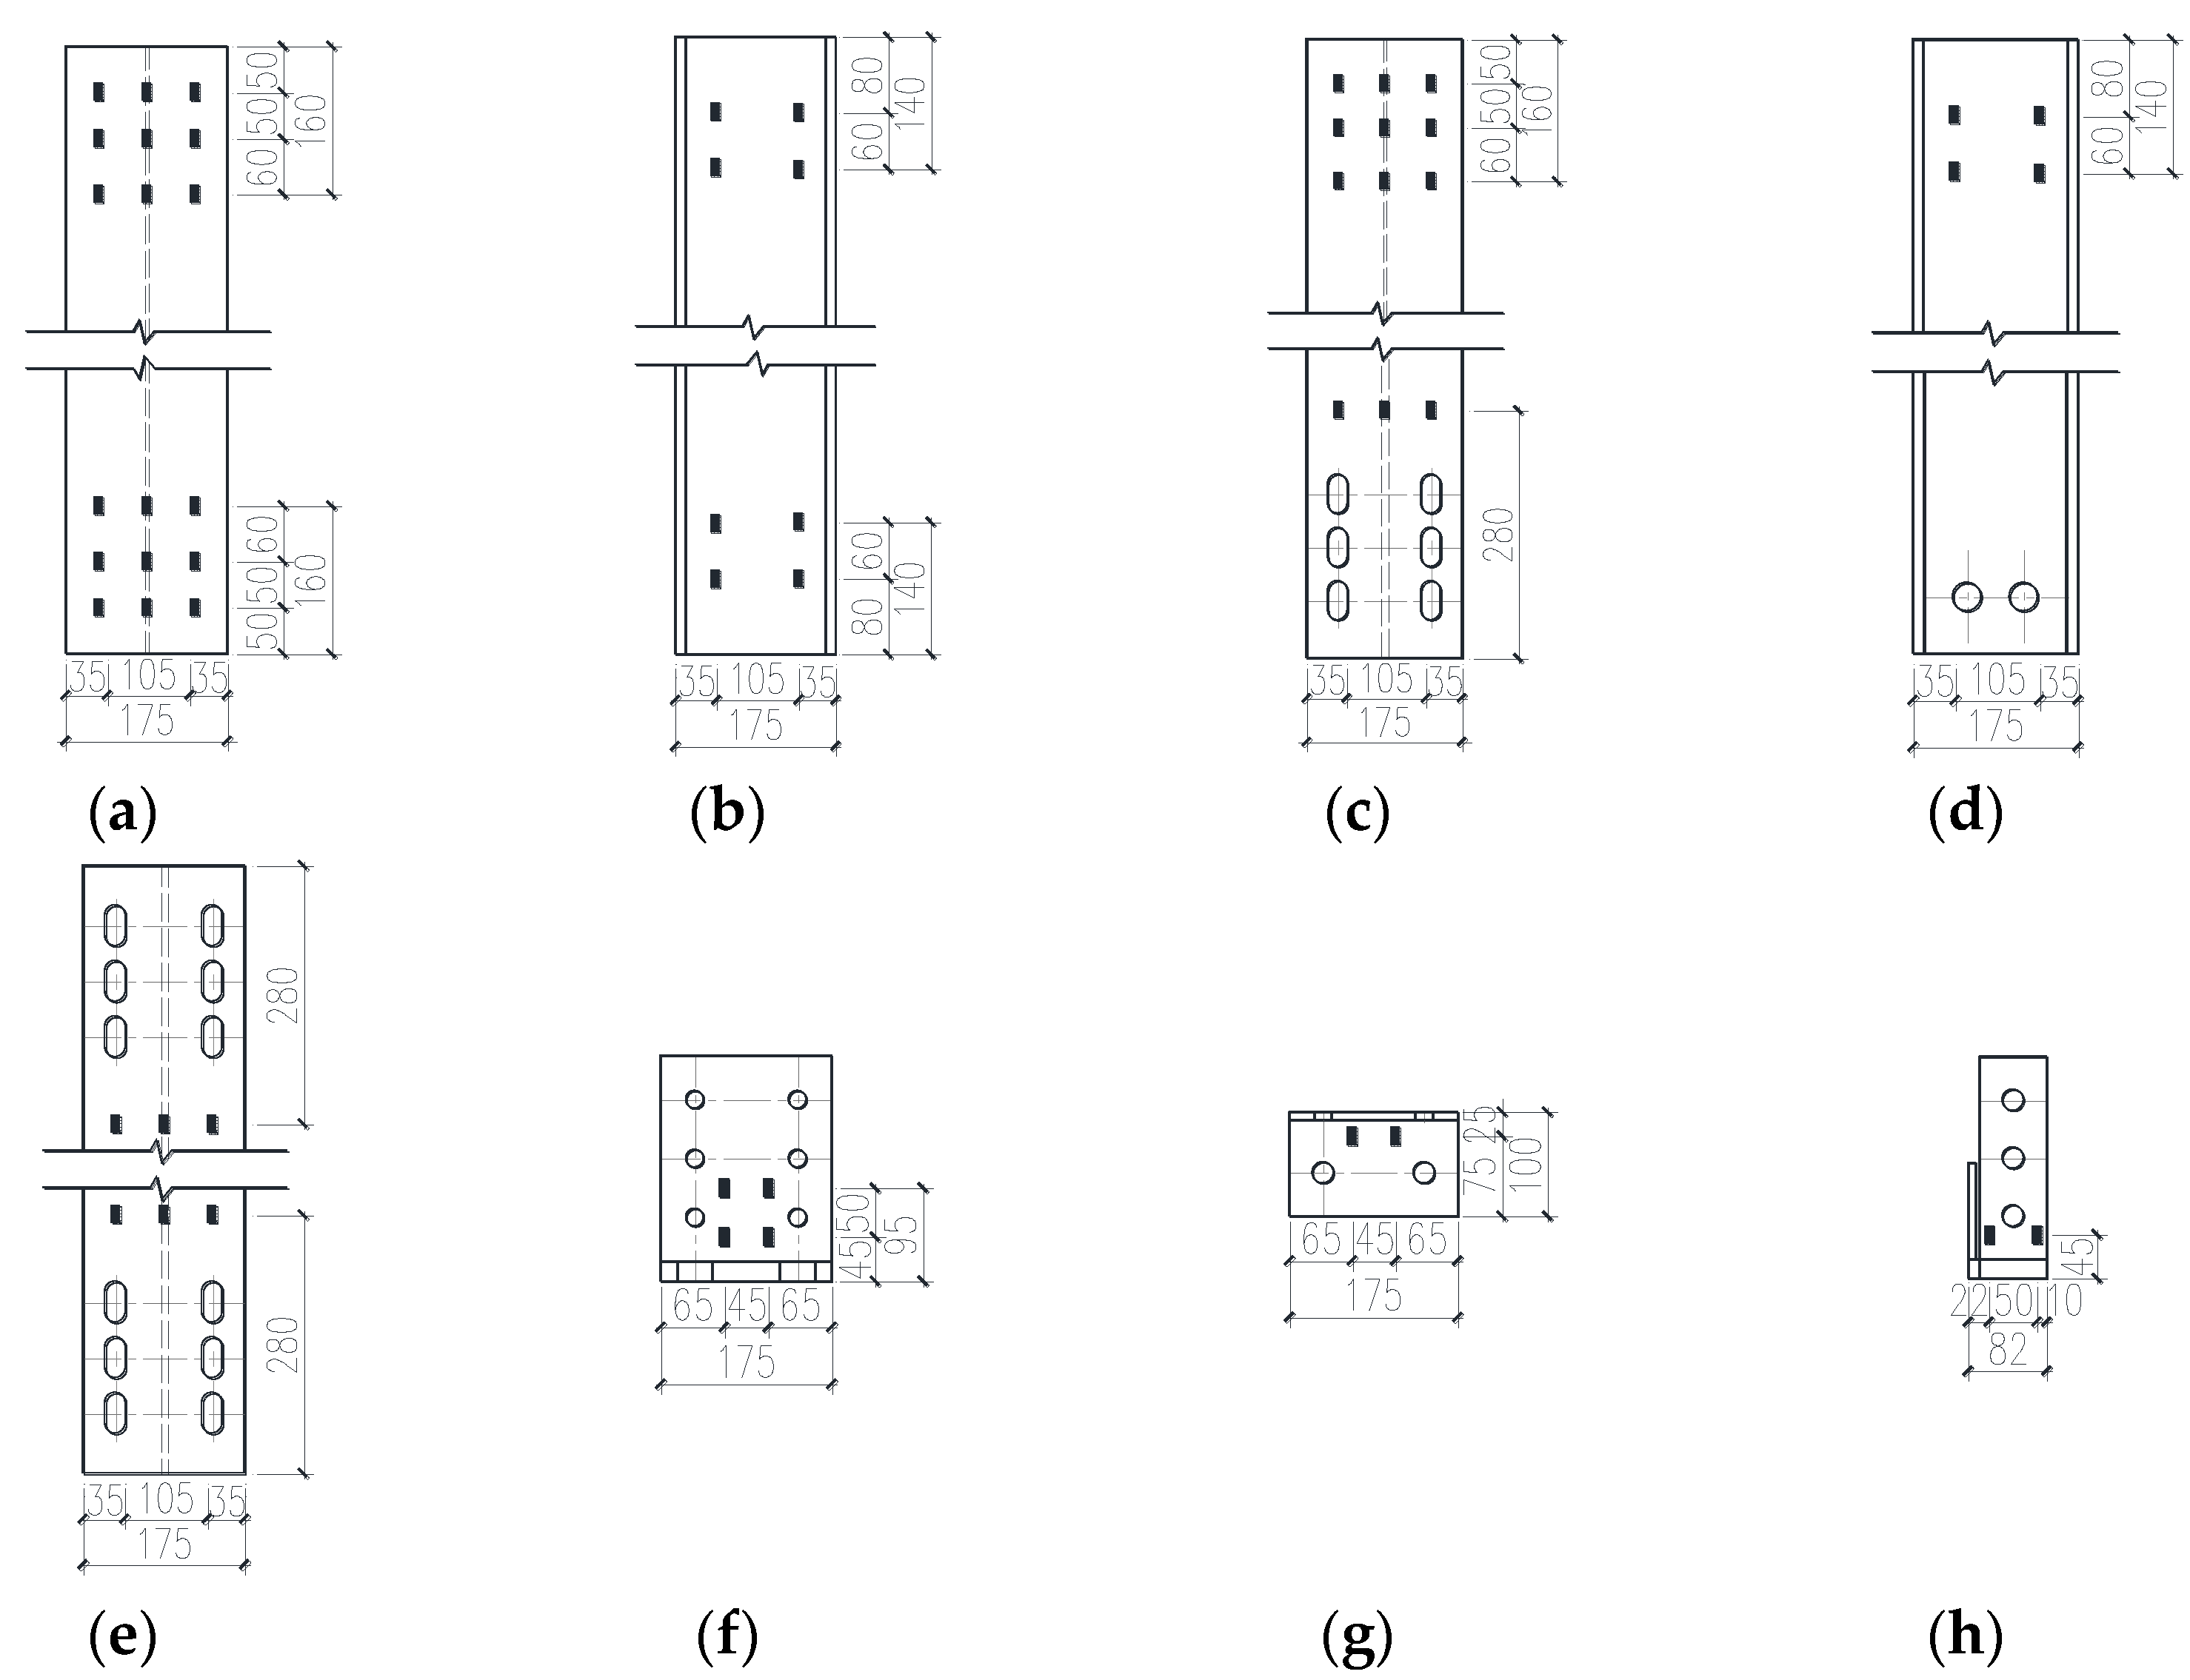
Figure 9.
Deformation modes of specimens: (a) C-1 overall; (b) C-1 column top; (c) C-1 column base; (d) C-2 overall; (e) C-2 column top; (f) C-2 column base; (g) C-3 overall; (h) C-3 column top; (i) C-3 column base.
Figure 9.
Deformation modes of specimens: (a) C-1 overall; (b) C-1 column top; (c) C-1 column base; (d) C-2 overall; (e) C-2 column top; (f) C-2 column base; (g) C-3 overall; (h) C-3 column top; (i) C-3 column base.
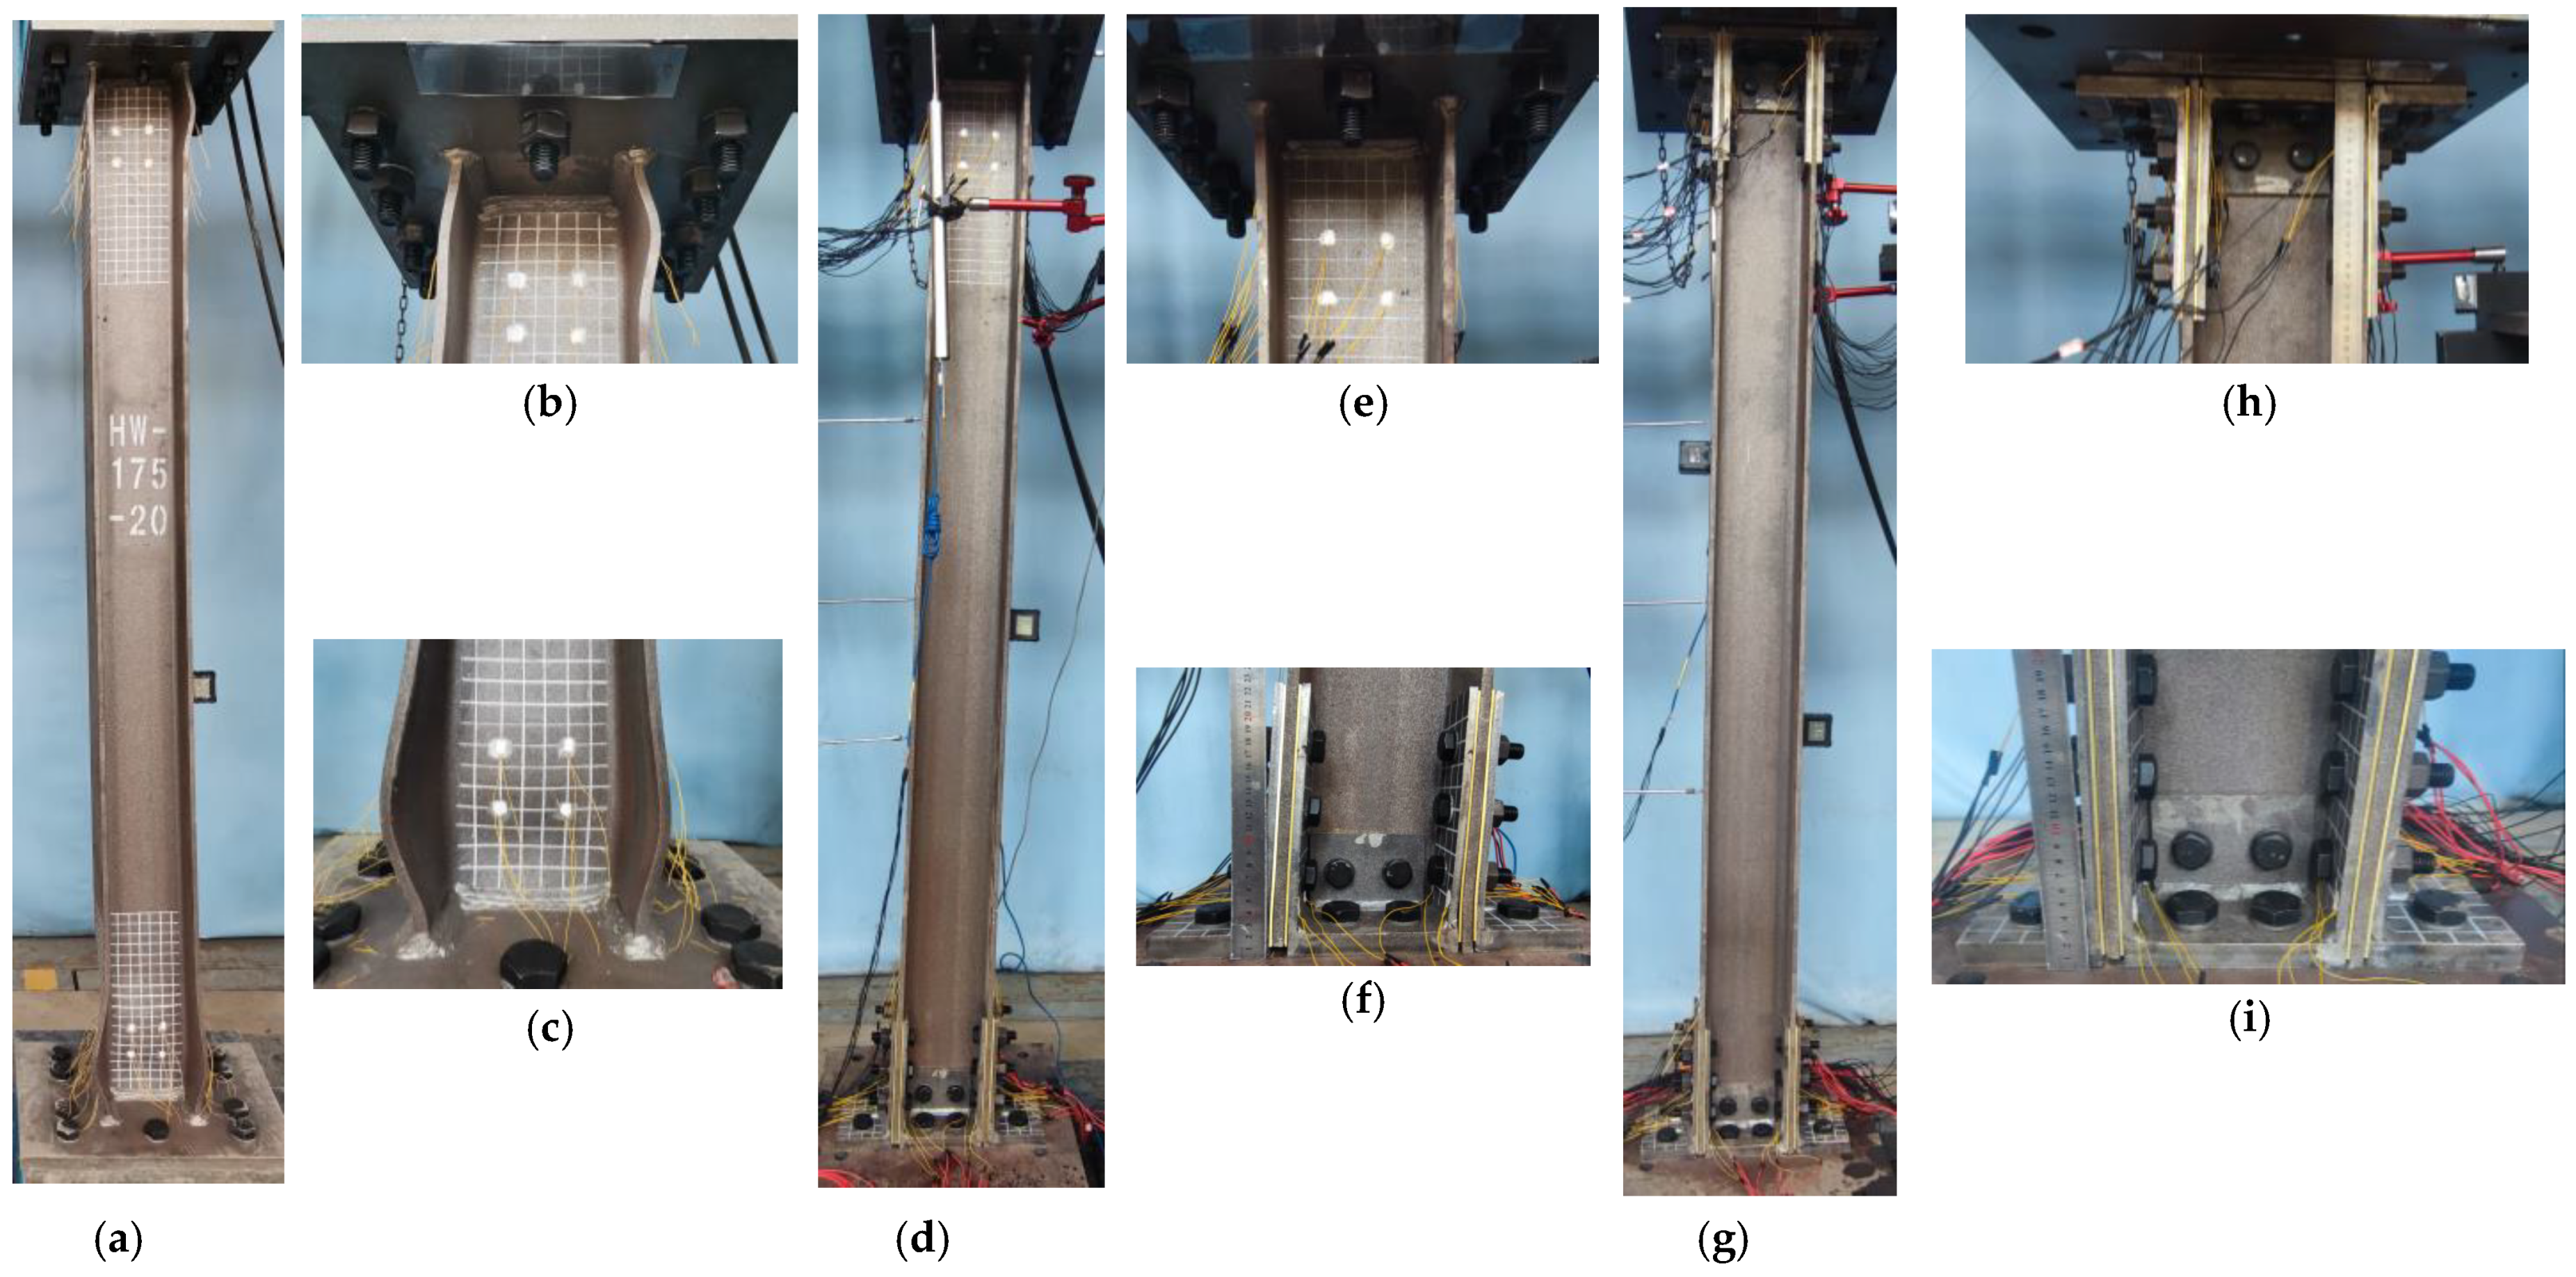
Figure 10.
C-2 test piece disassembly diagram: (a) column base; (b) friction plates; (c) external connector; (d) internal connector.
Figure 10.
C-2 test piece disassembly diagram: (a) column base; (b) friction plates; (c) external connector; (d) internal connector.

Figure 11.
C-3 test piece disassembly diagram: (a) column base; (b) friction plates; (c) external connector; (d) internal connector.
Figure 11.
C-3 test piece disassembly diagram: (a) column base; (b) friction plates; (c) external connector; (d) internal connector.

Figure 12.
Test hysteresis curves: (a) C-1; (b) C-2; (c) C-3.

Figure 13.
Skeleton curves.
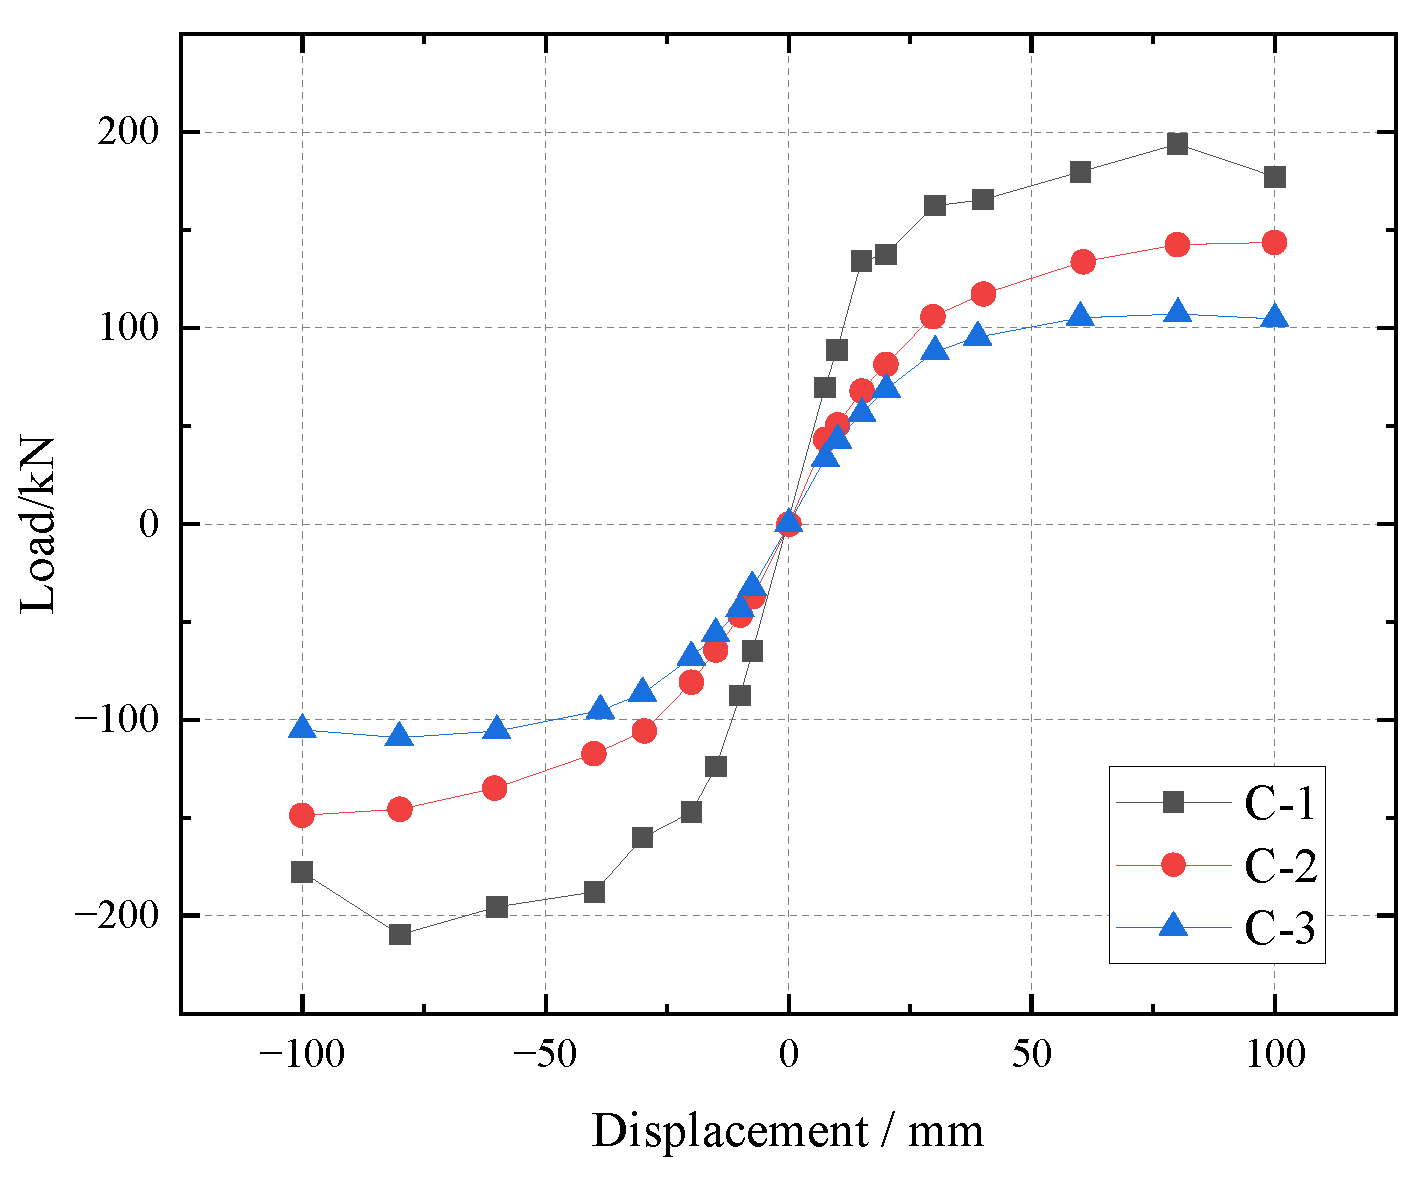
Figure 14.
Stiffness degeneration curves.
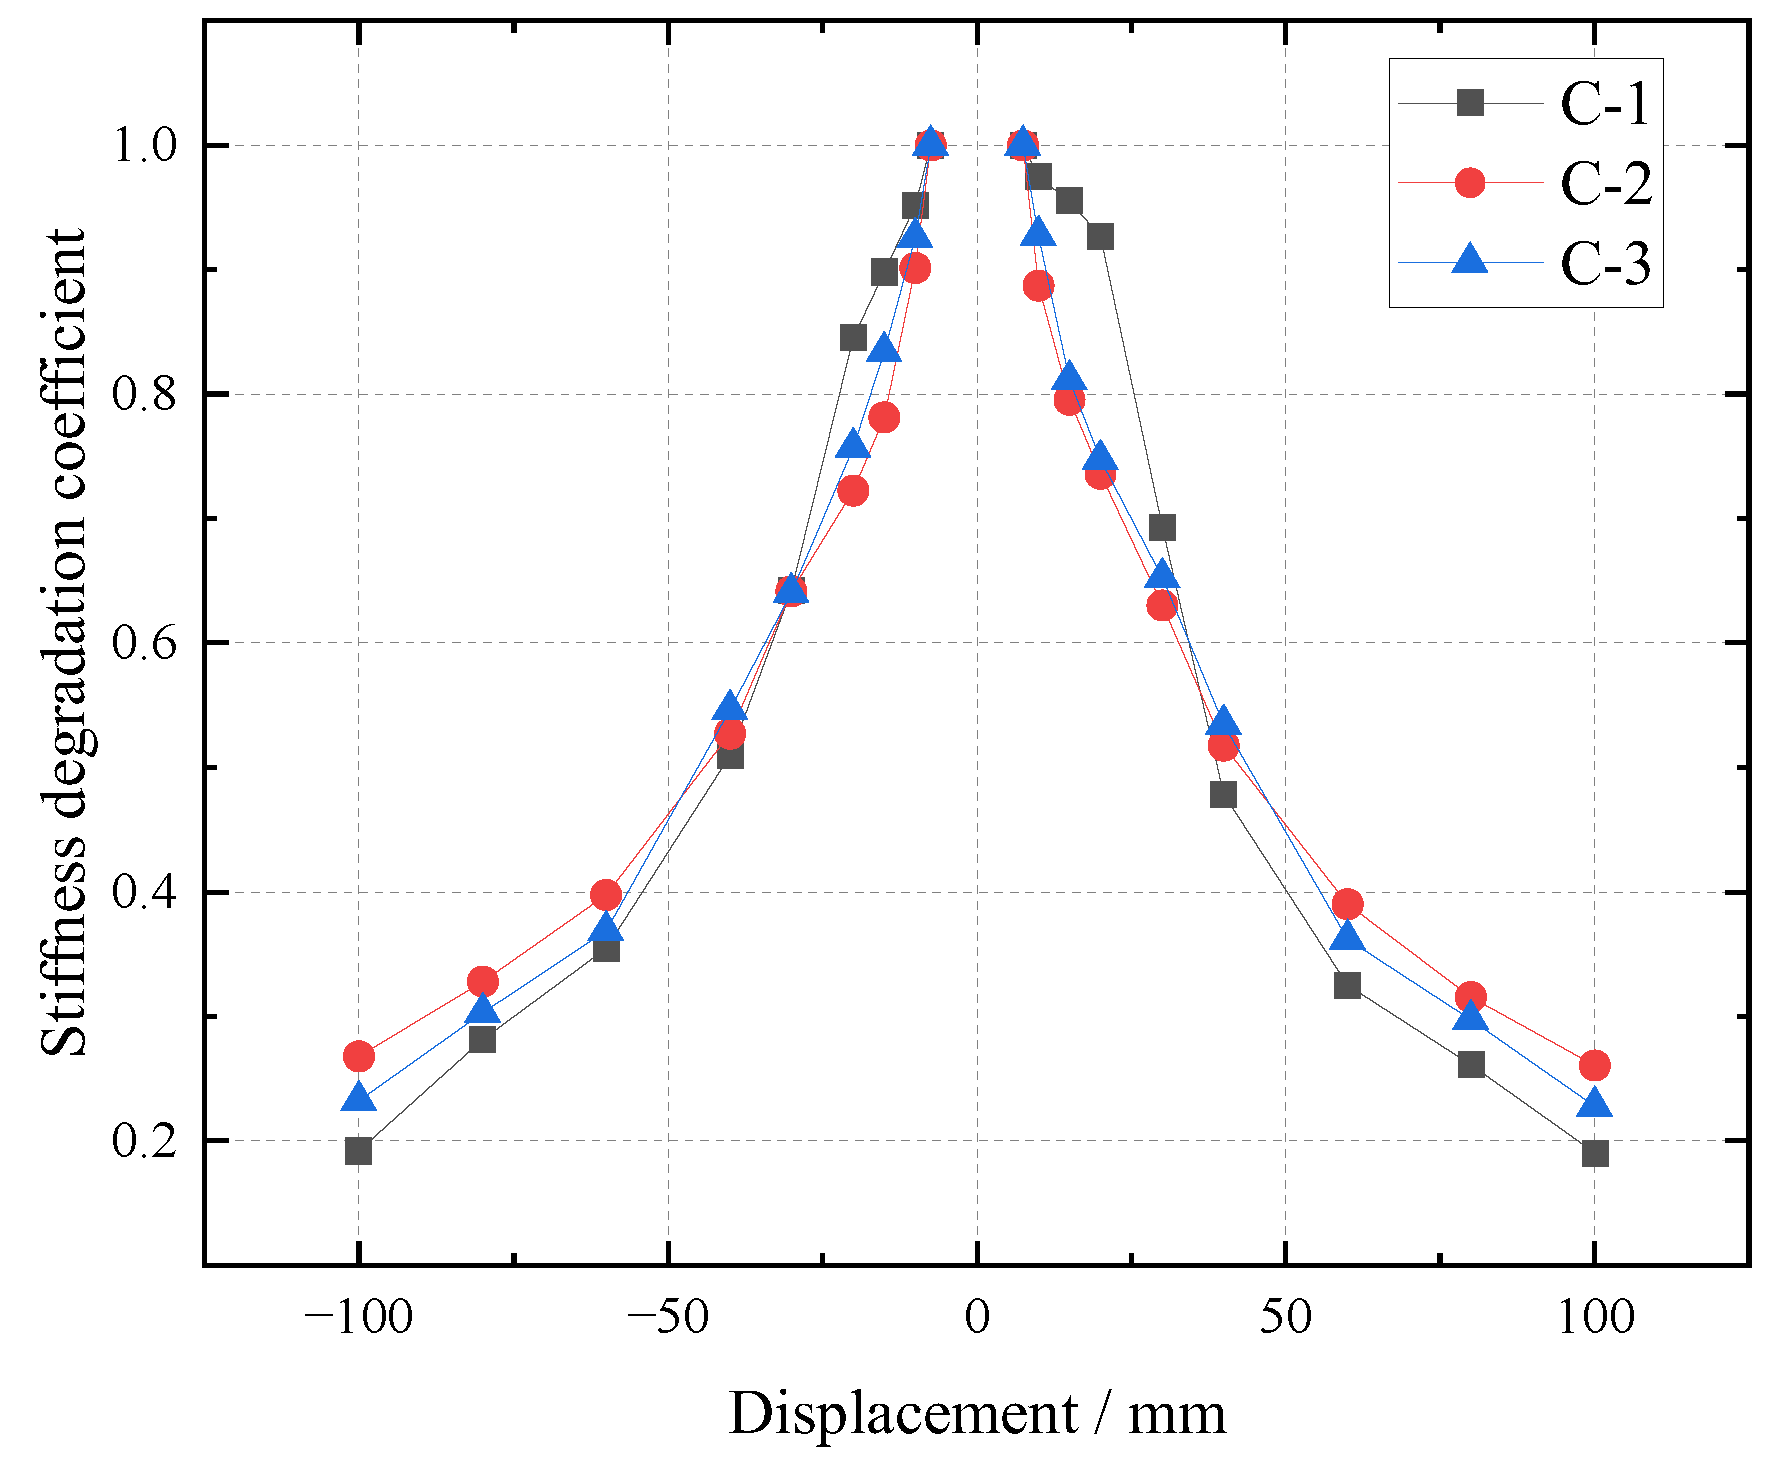
Figure 15.
Hysteretic dissipated energy.
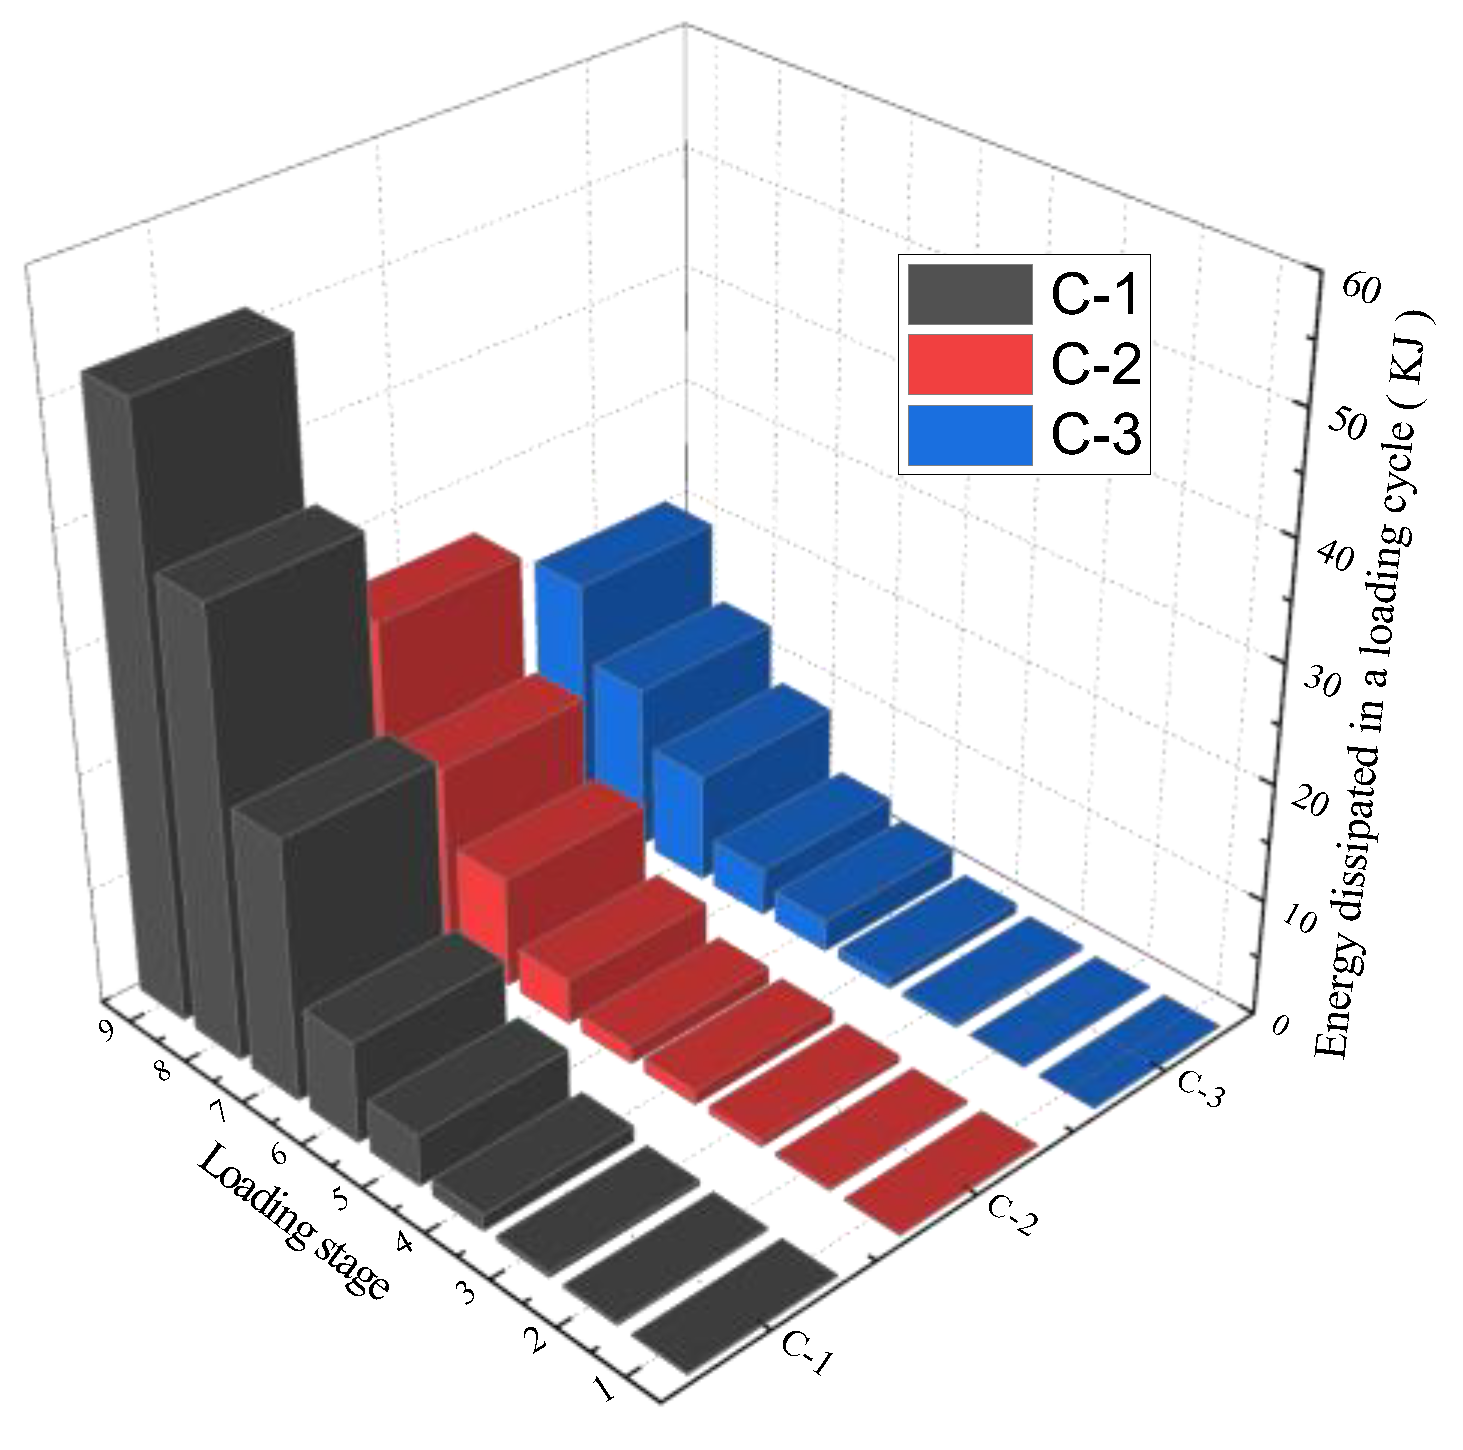
Figure 16.
Strain curves: (a) C-2; (b) C-3.

Figure 17.
Finite element models of the specimens: (a) specimen C-1; (b) specimen C-2; (c) specimen C-3.
Figure 17.
Finite element models of the specimens: (a) specimen C-1; (b) specimen C-2; (c) specimen C-3.

Figure 18.
Comparison of test and simulation results of specimen C-2: (a) column top; (b) column base.
Figure 18.
Comparison of test and simulation results of specimen C-2: (a) column top; (b) column base.
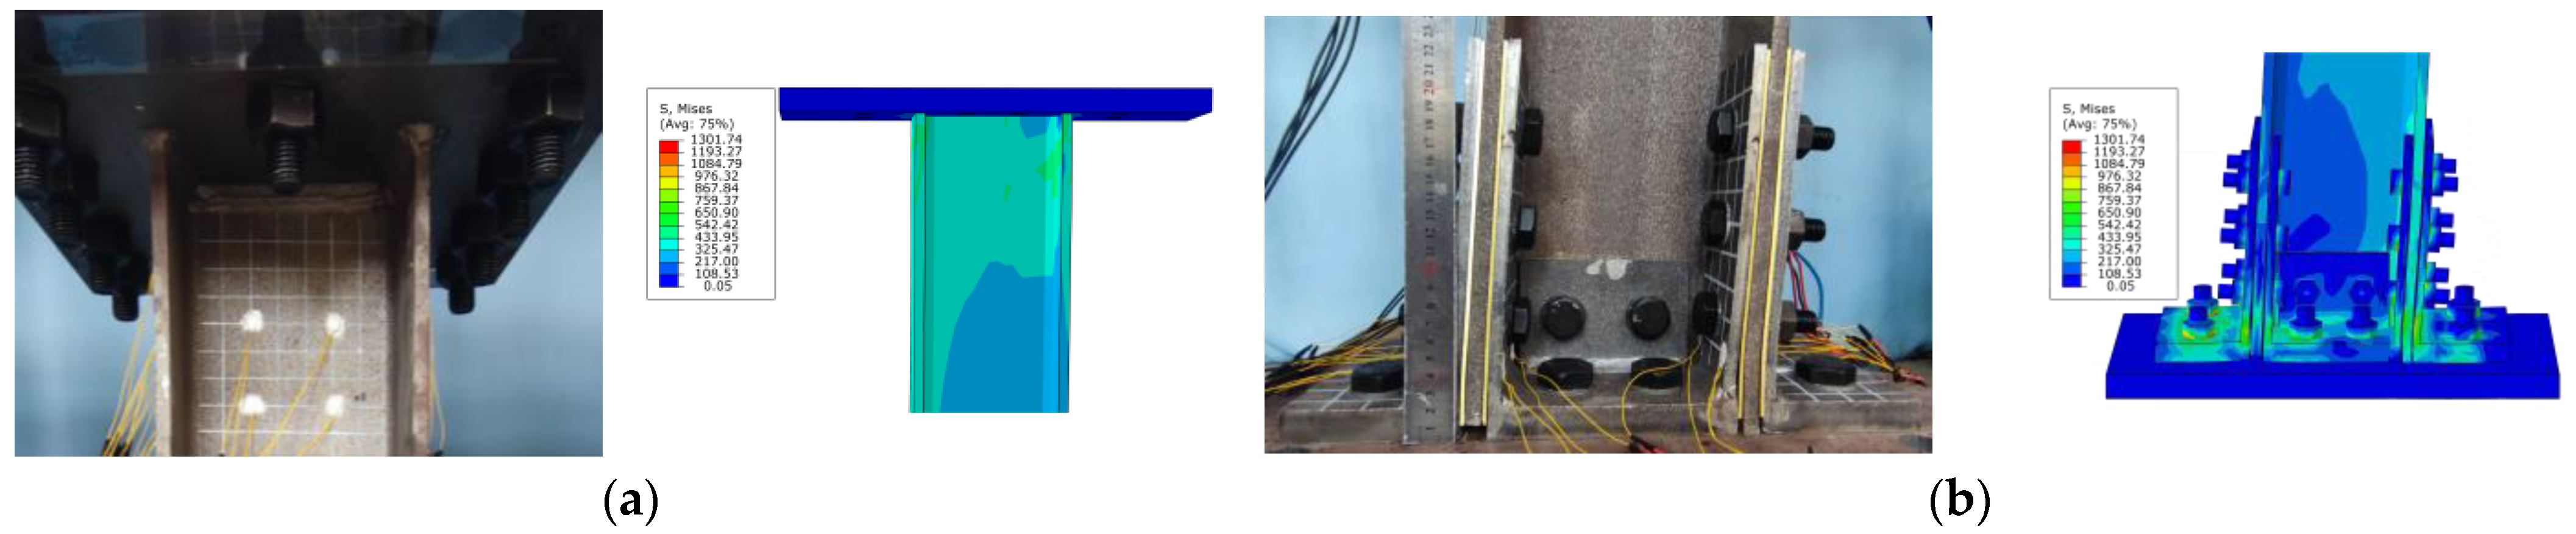
Figure 19.
Comparison of test and simulation results of specimen C-3: (a) column top; (b) column base.
Figure 19.
Comparison of test and simulation results of specimen C-3: (a) column top; (b) column base.
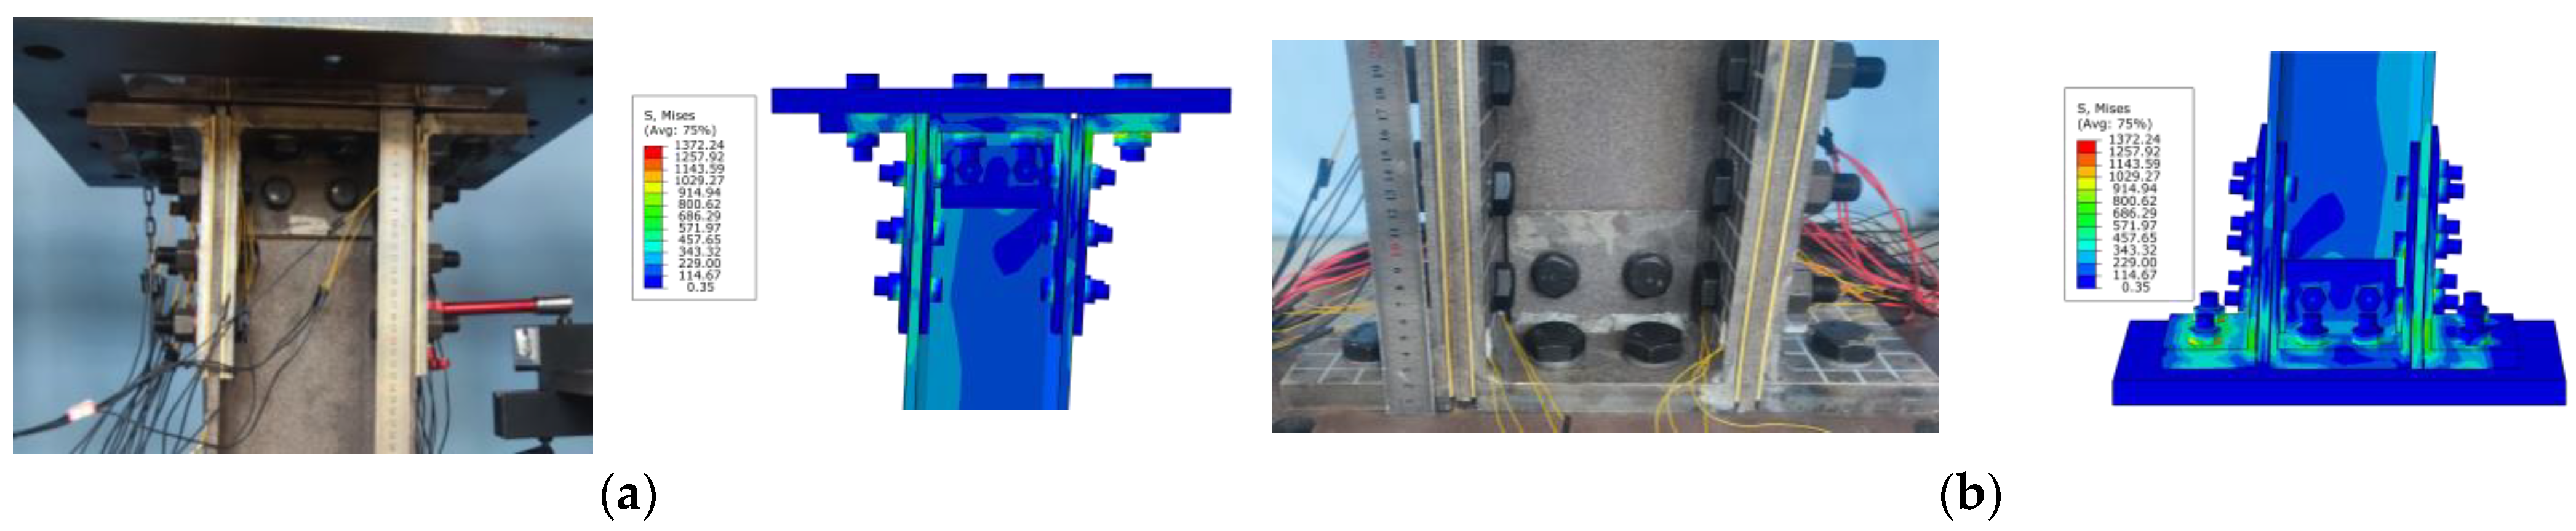
Figure 20.
Comparison of specimen hysteresis curves: (a) C-1; (b) C-2; (c) C-3.
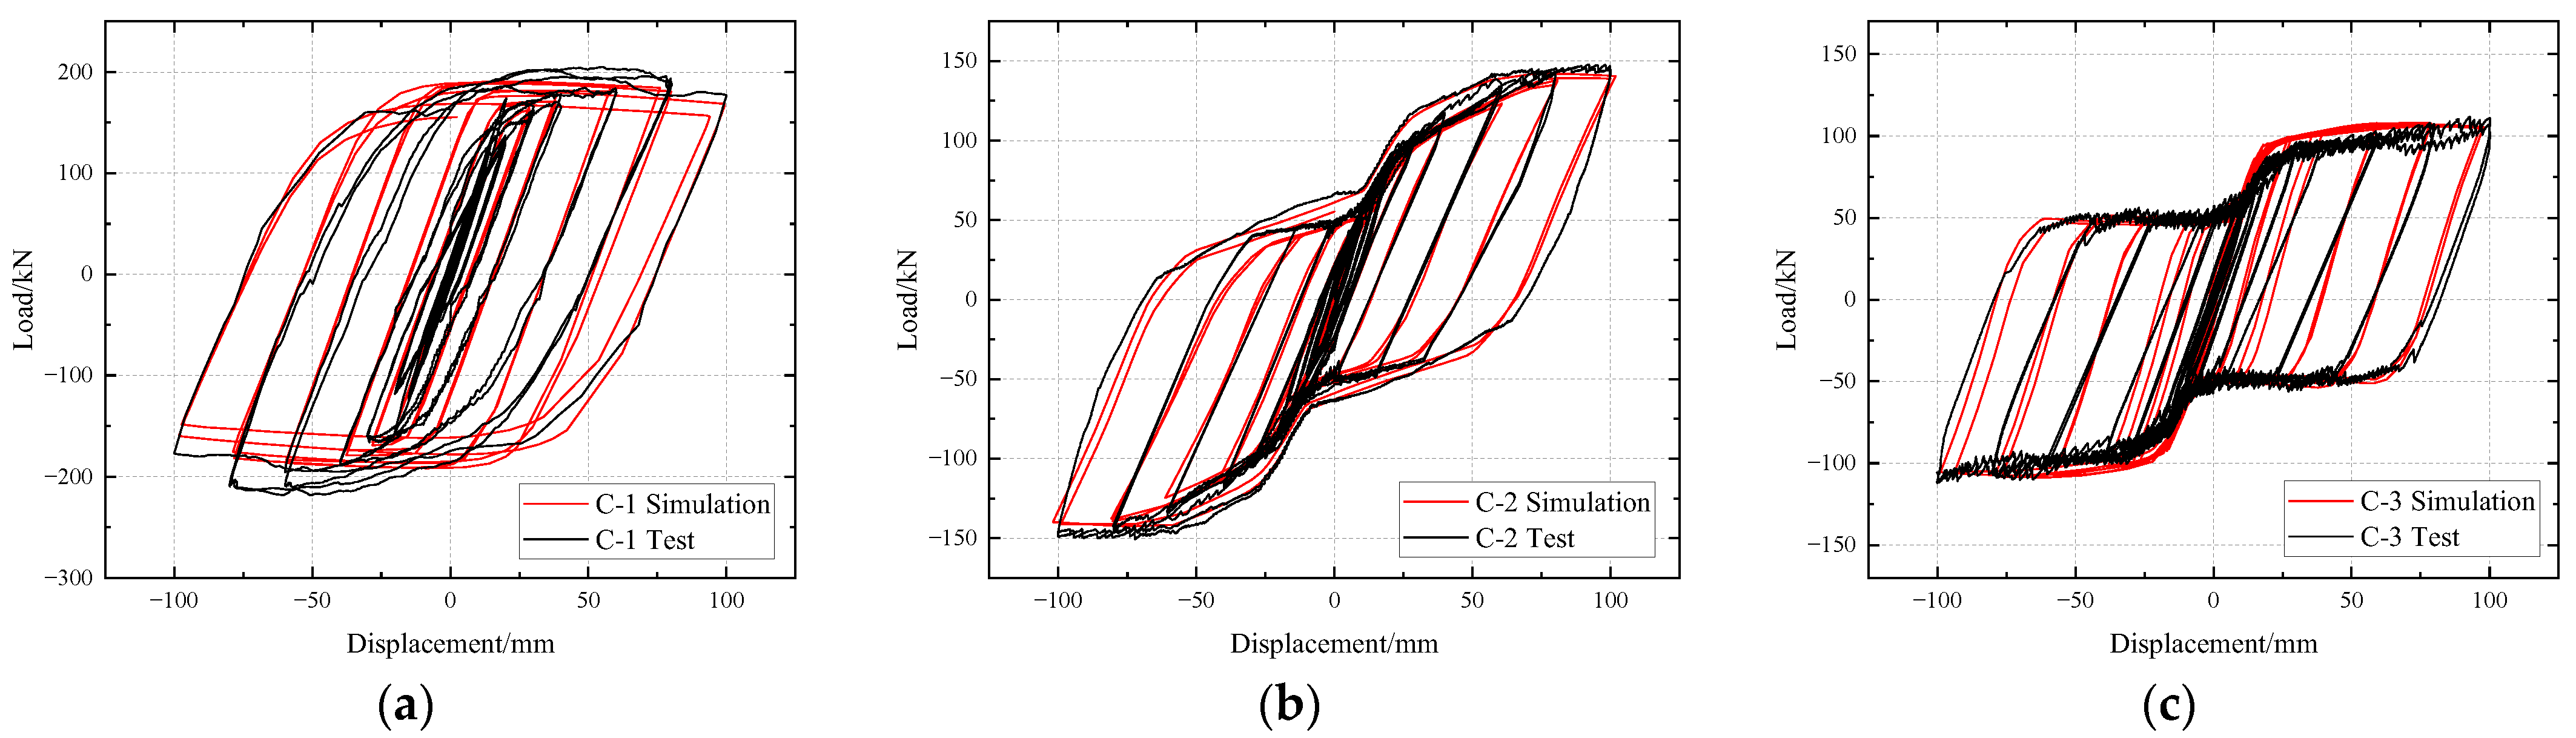
Figure 21.
Comparison of axial shortening of specimens.
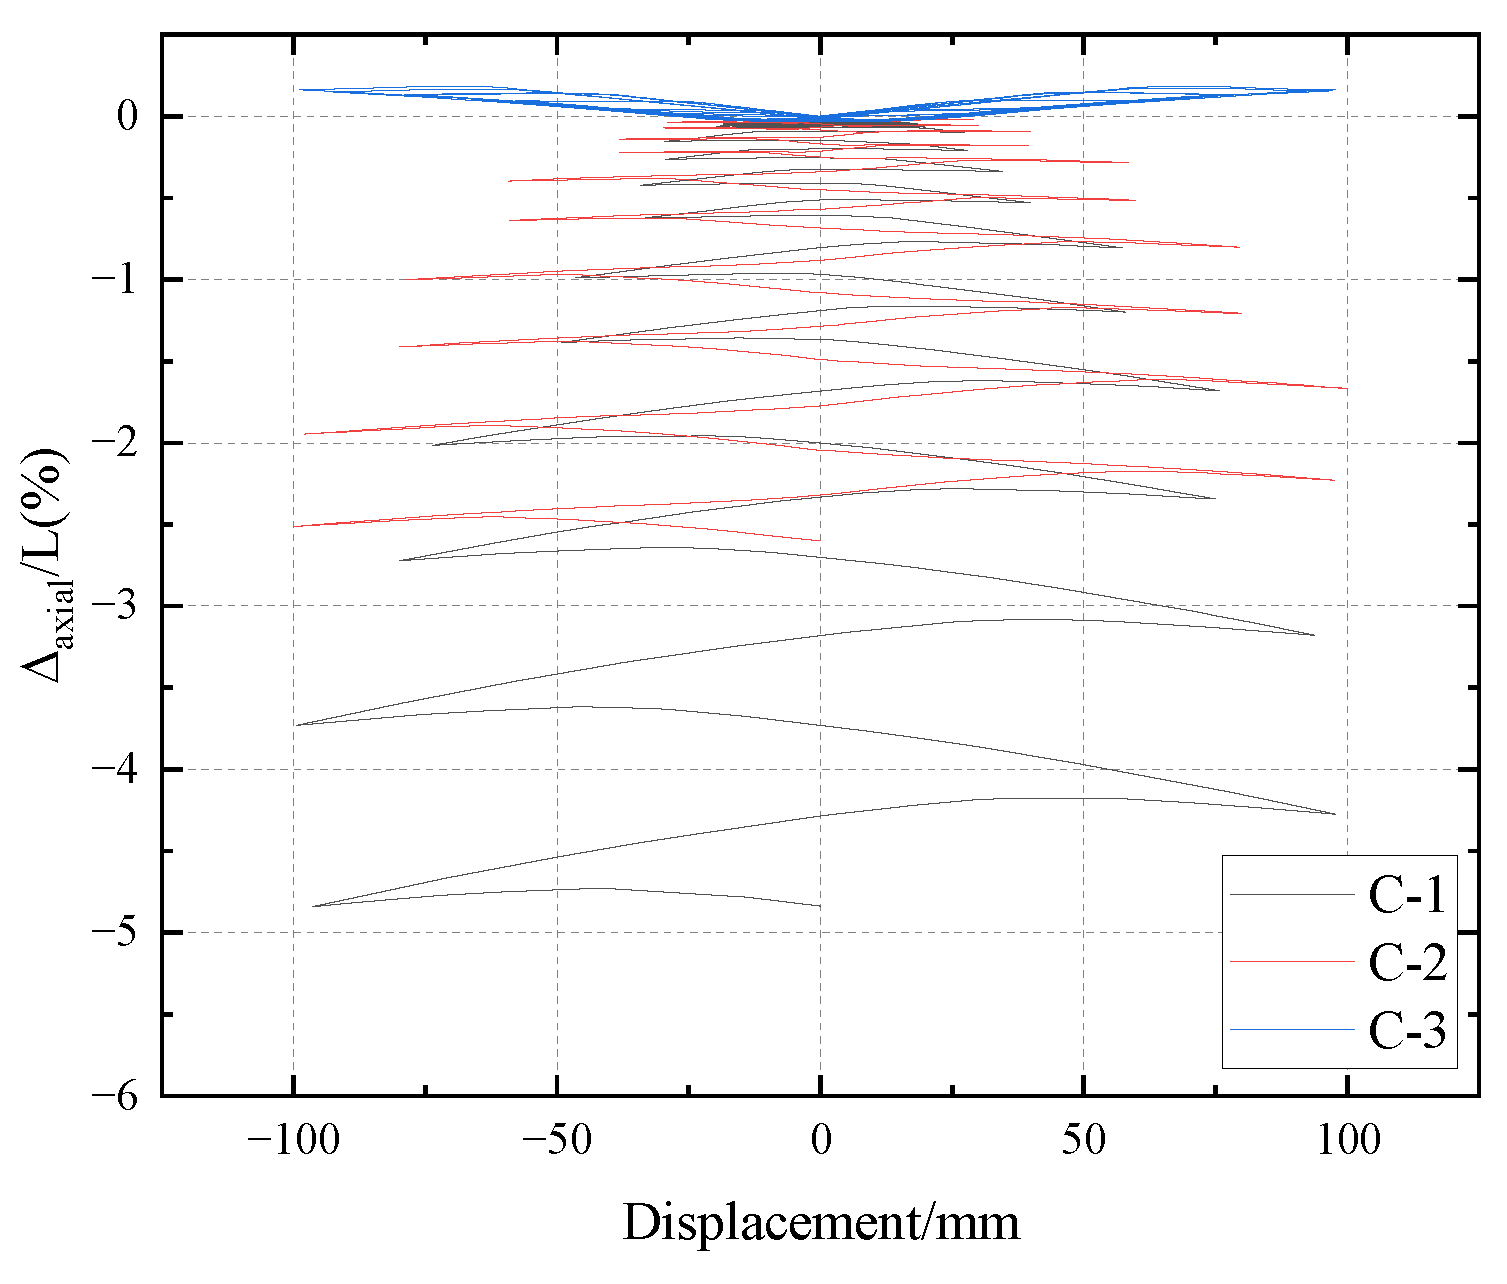
Figure 22.
Strain analysis of specimen C-3: (a) column base; (b) external connector; (c) internal connecting piece.
Figure 22.
Strain analysis of specimen C-3: (a) column base; (b) external connector; (c) internal connecting piece.
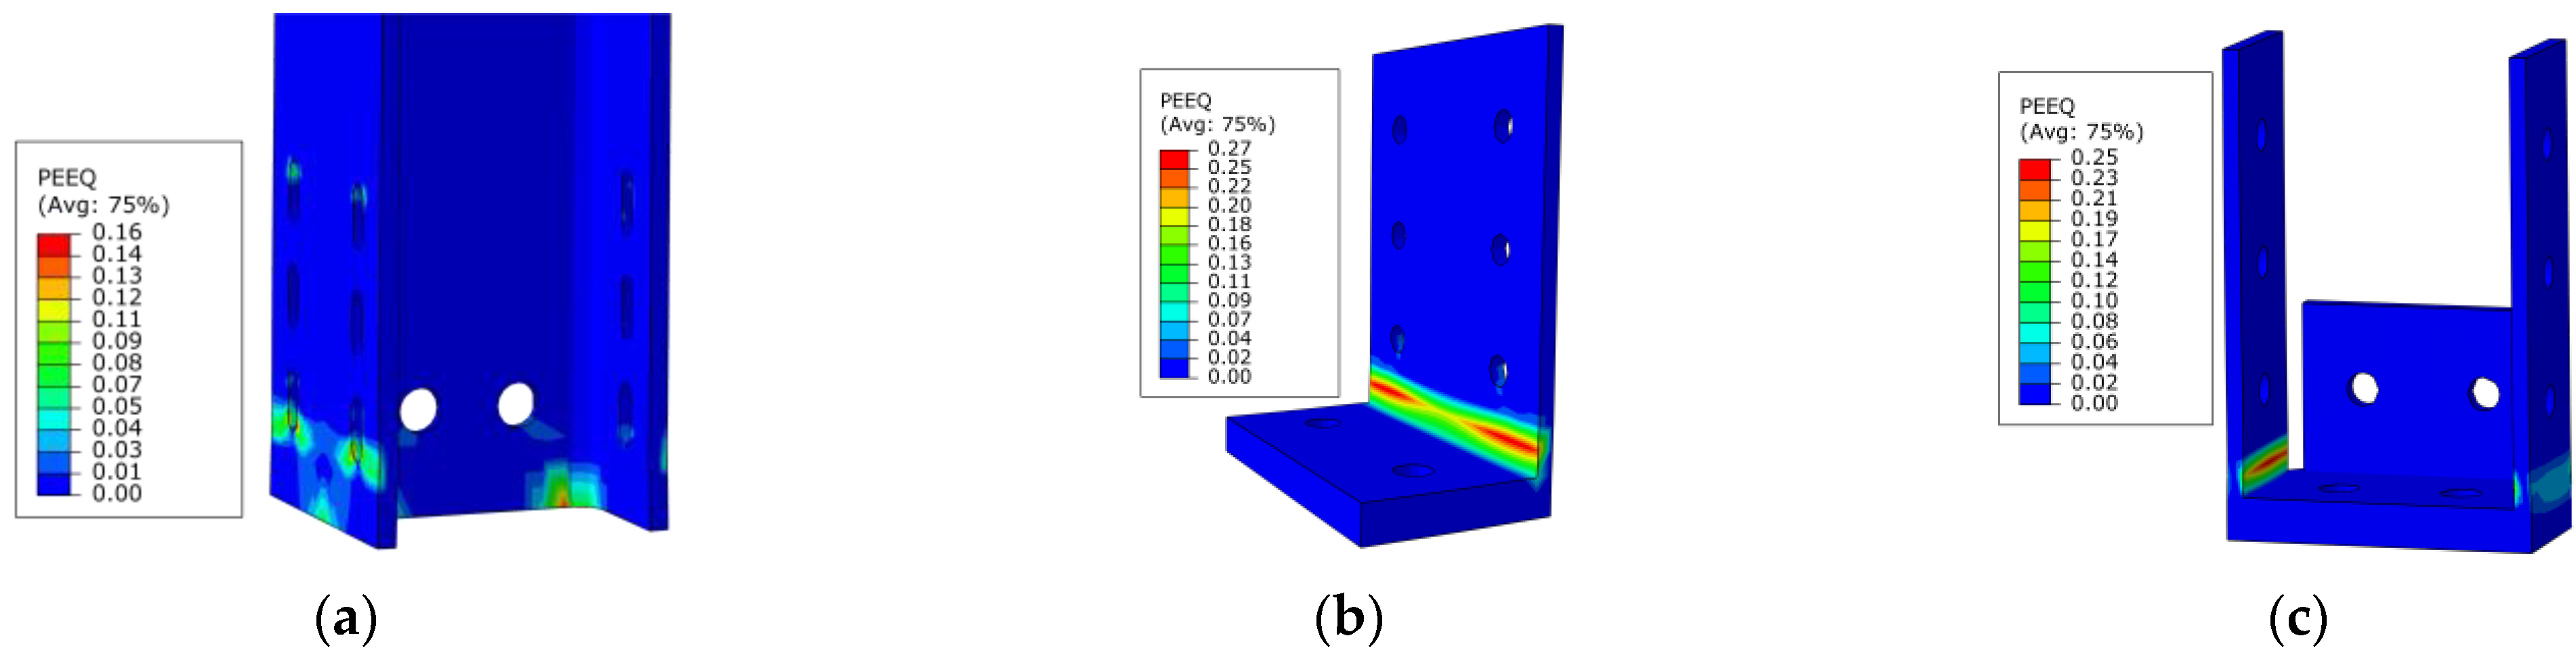
Figure 23.
The calculated hysteretic curves: (a) model C-3; (b) model C-4; (c) model C-5; (d) model C-6; (e) model C-7; (f) model C-8.
Figure 23.
The calculated hysteretic curves: (a) model C-3; (b) model C-4; (c) model C-5; (d) model C-6; (e) model C-7; (f) model C-8.
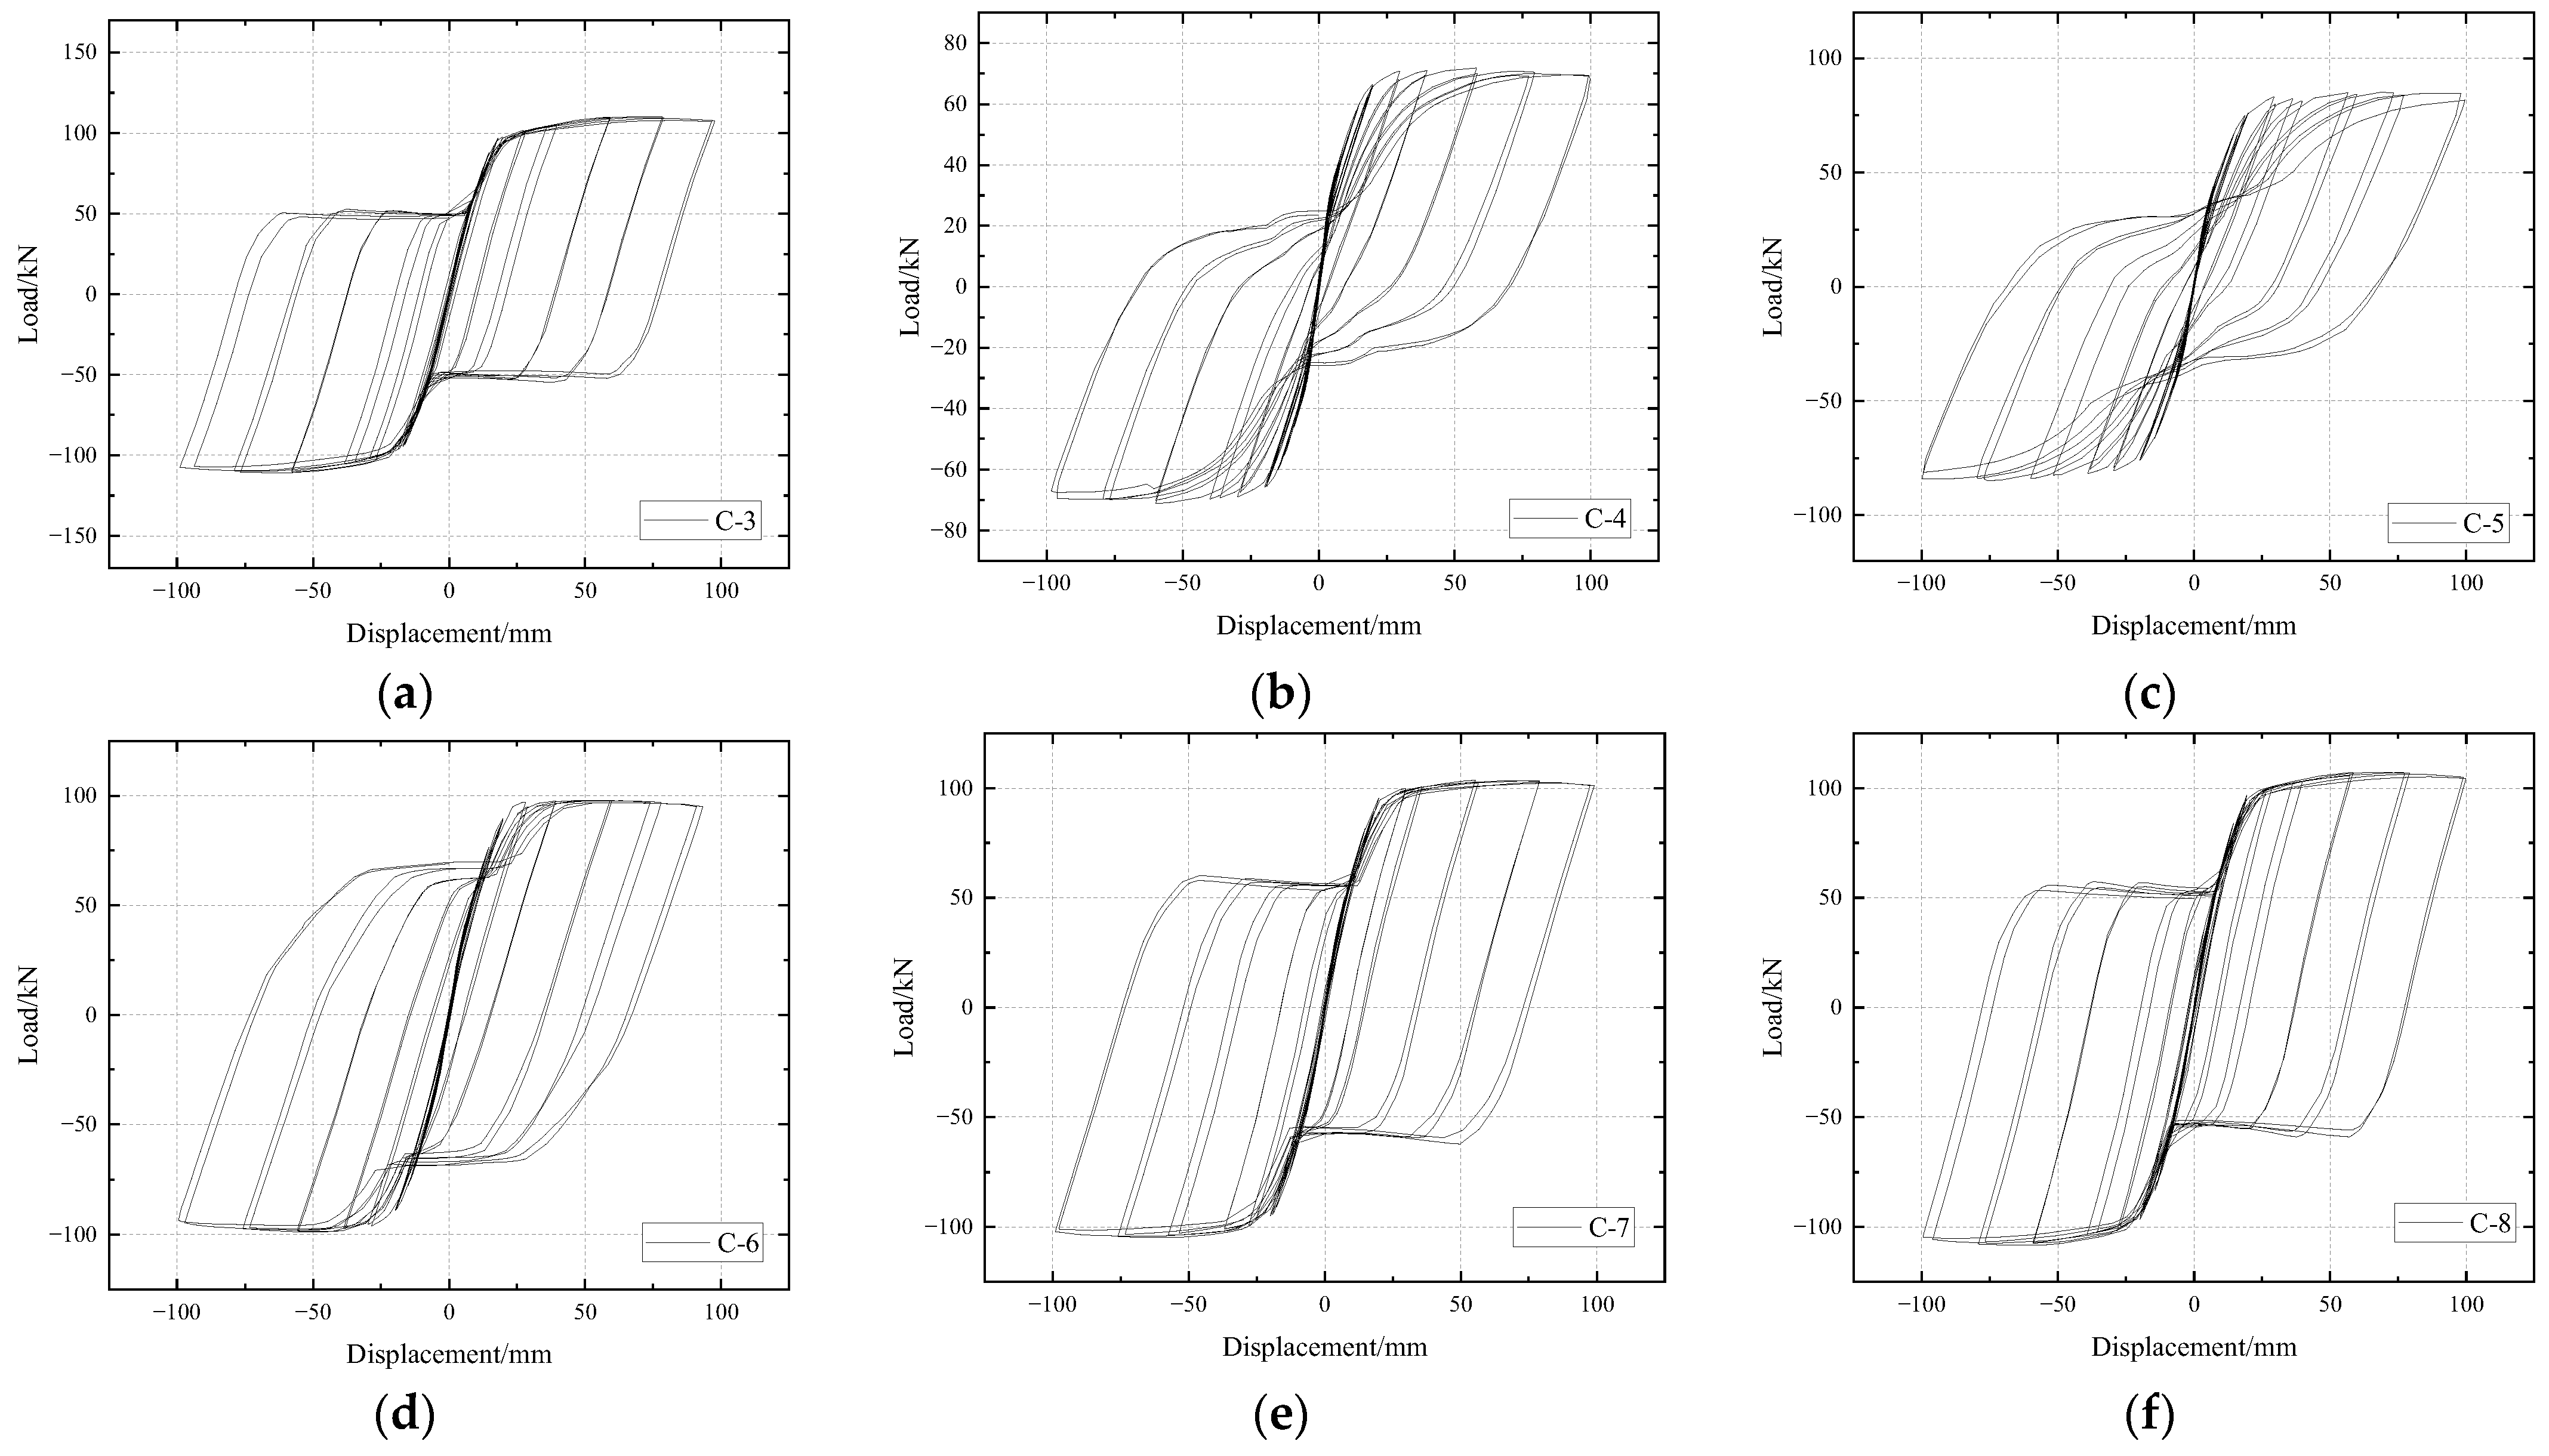
Figure 24.
Skeleton curves of models.
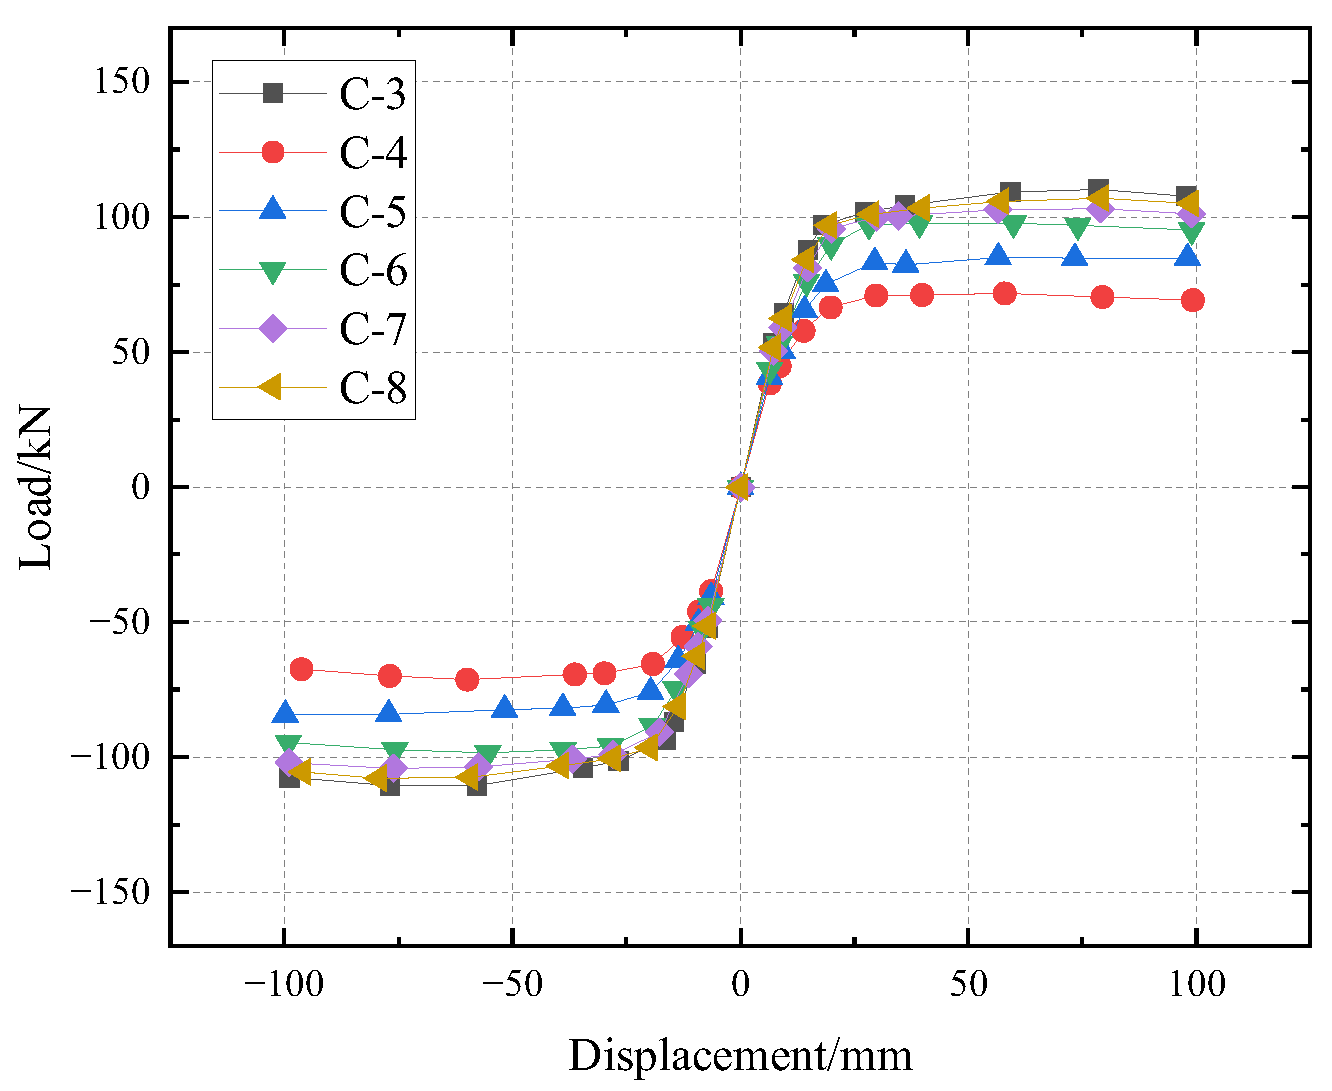
Figure 25.
Stiffness degradation curves of models.
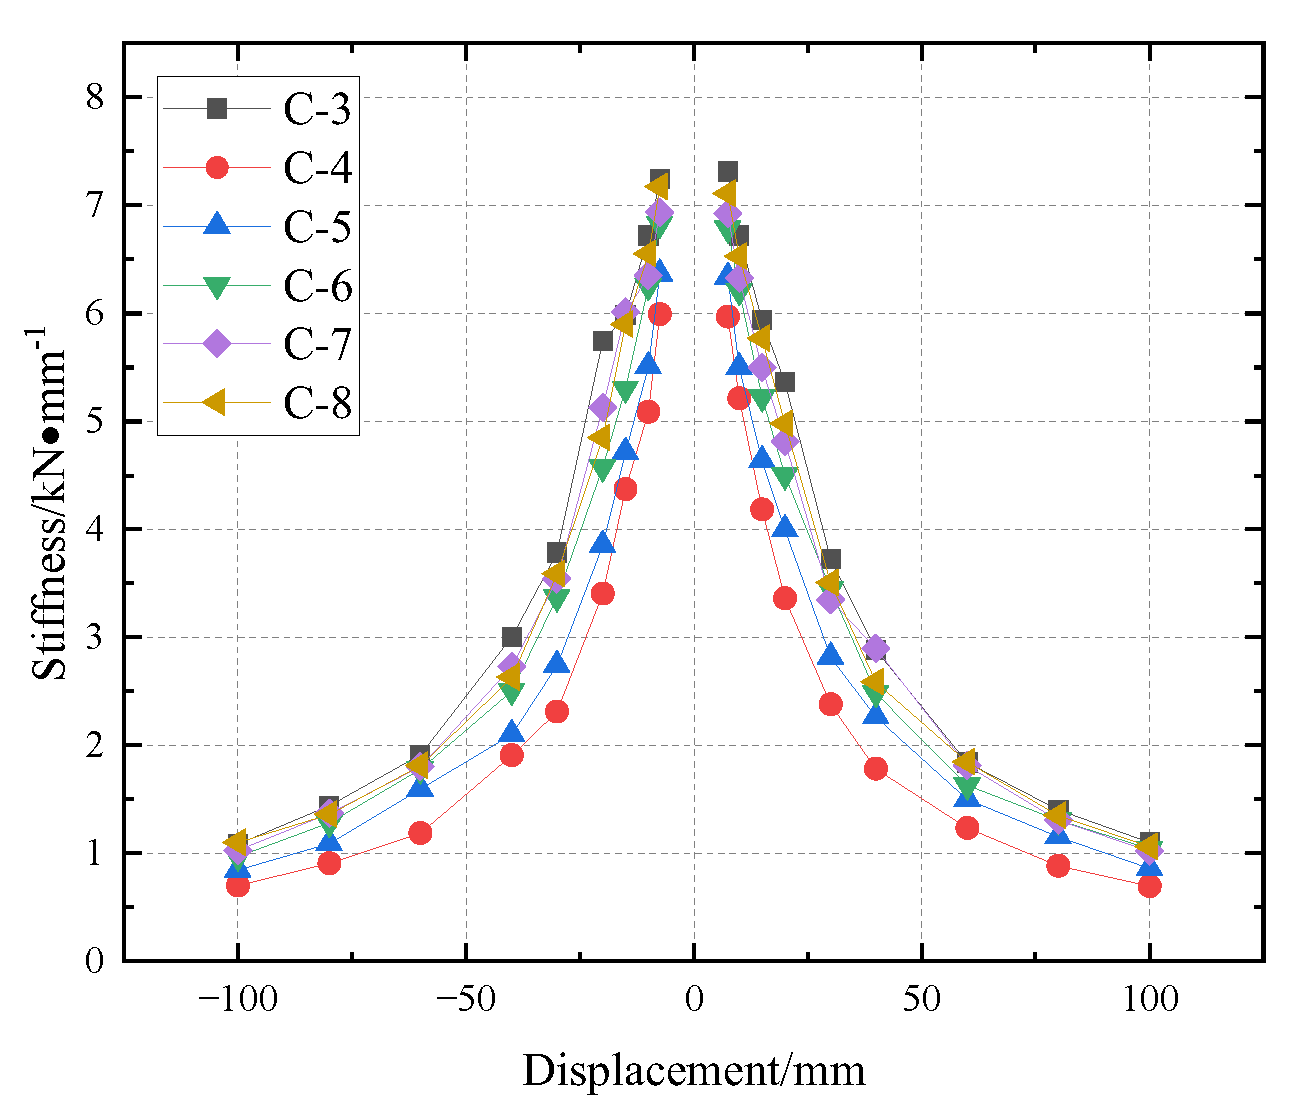
Figure 26.
Hysteretic dissipated energy of models.
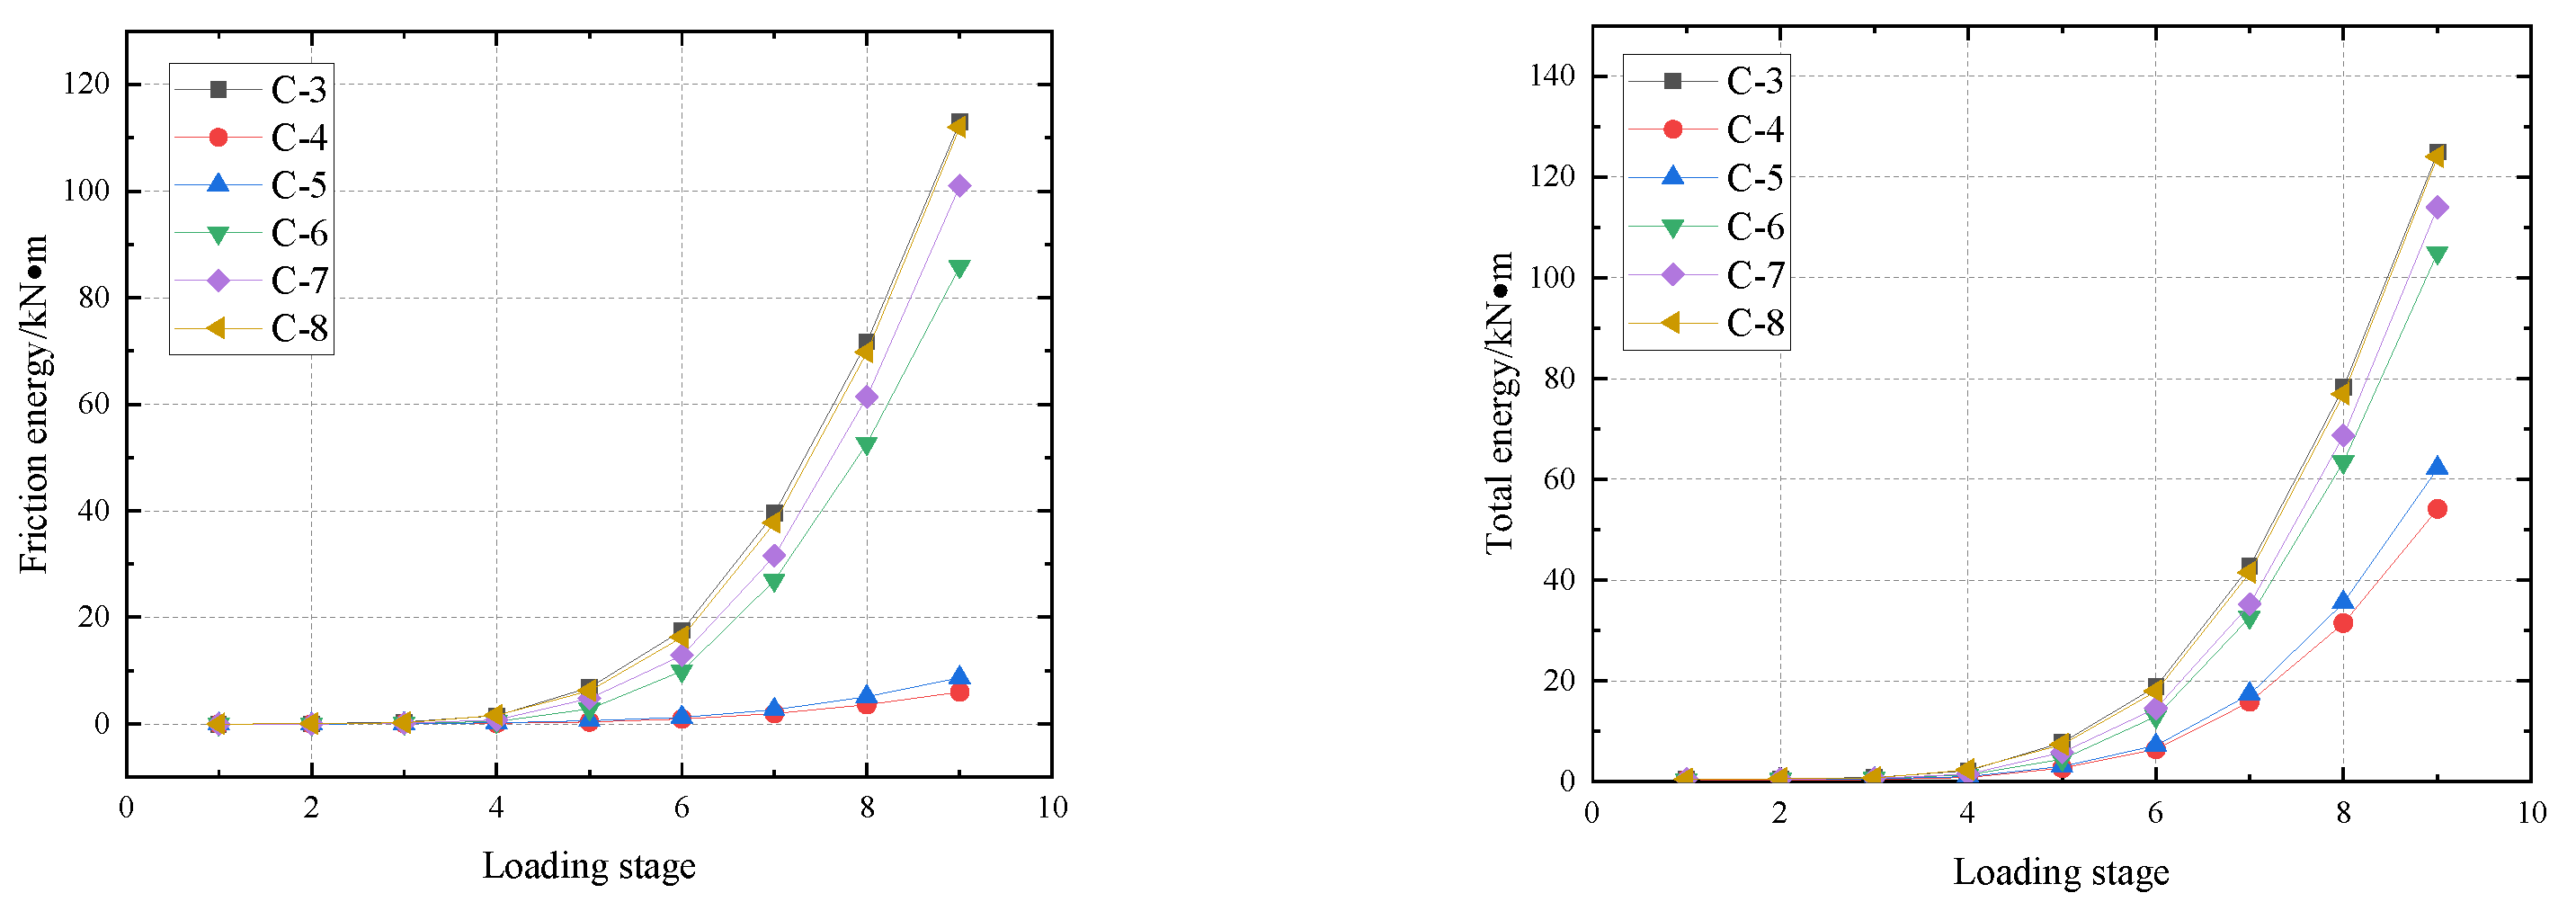
Figure 27.
Comparison of calculated axial shortenings: (a) model C-3; (b) model C-4; (c) model C-5; (d) model C-6; (e) model C-7; (f) model C-8.
Figure 27.
Comparison of calculated axial shortenings: (a) model C-3; (b) model C-4; (c) model C-5; (d) model C-6; (e) model C-7; (f) model C-8.
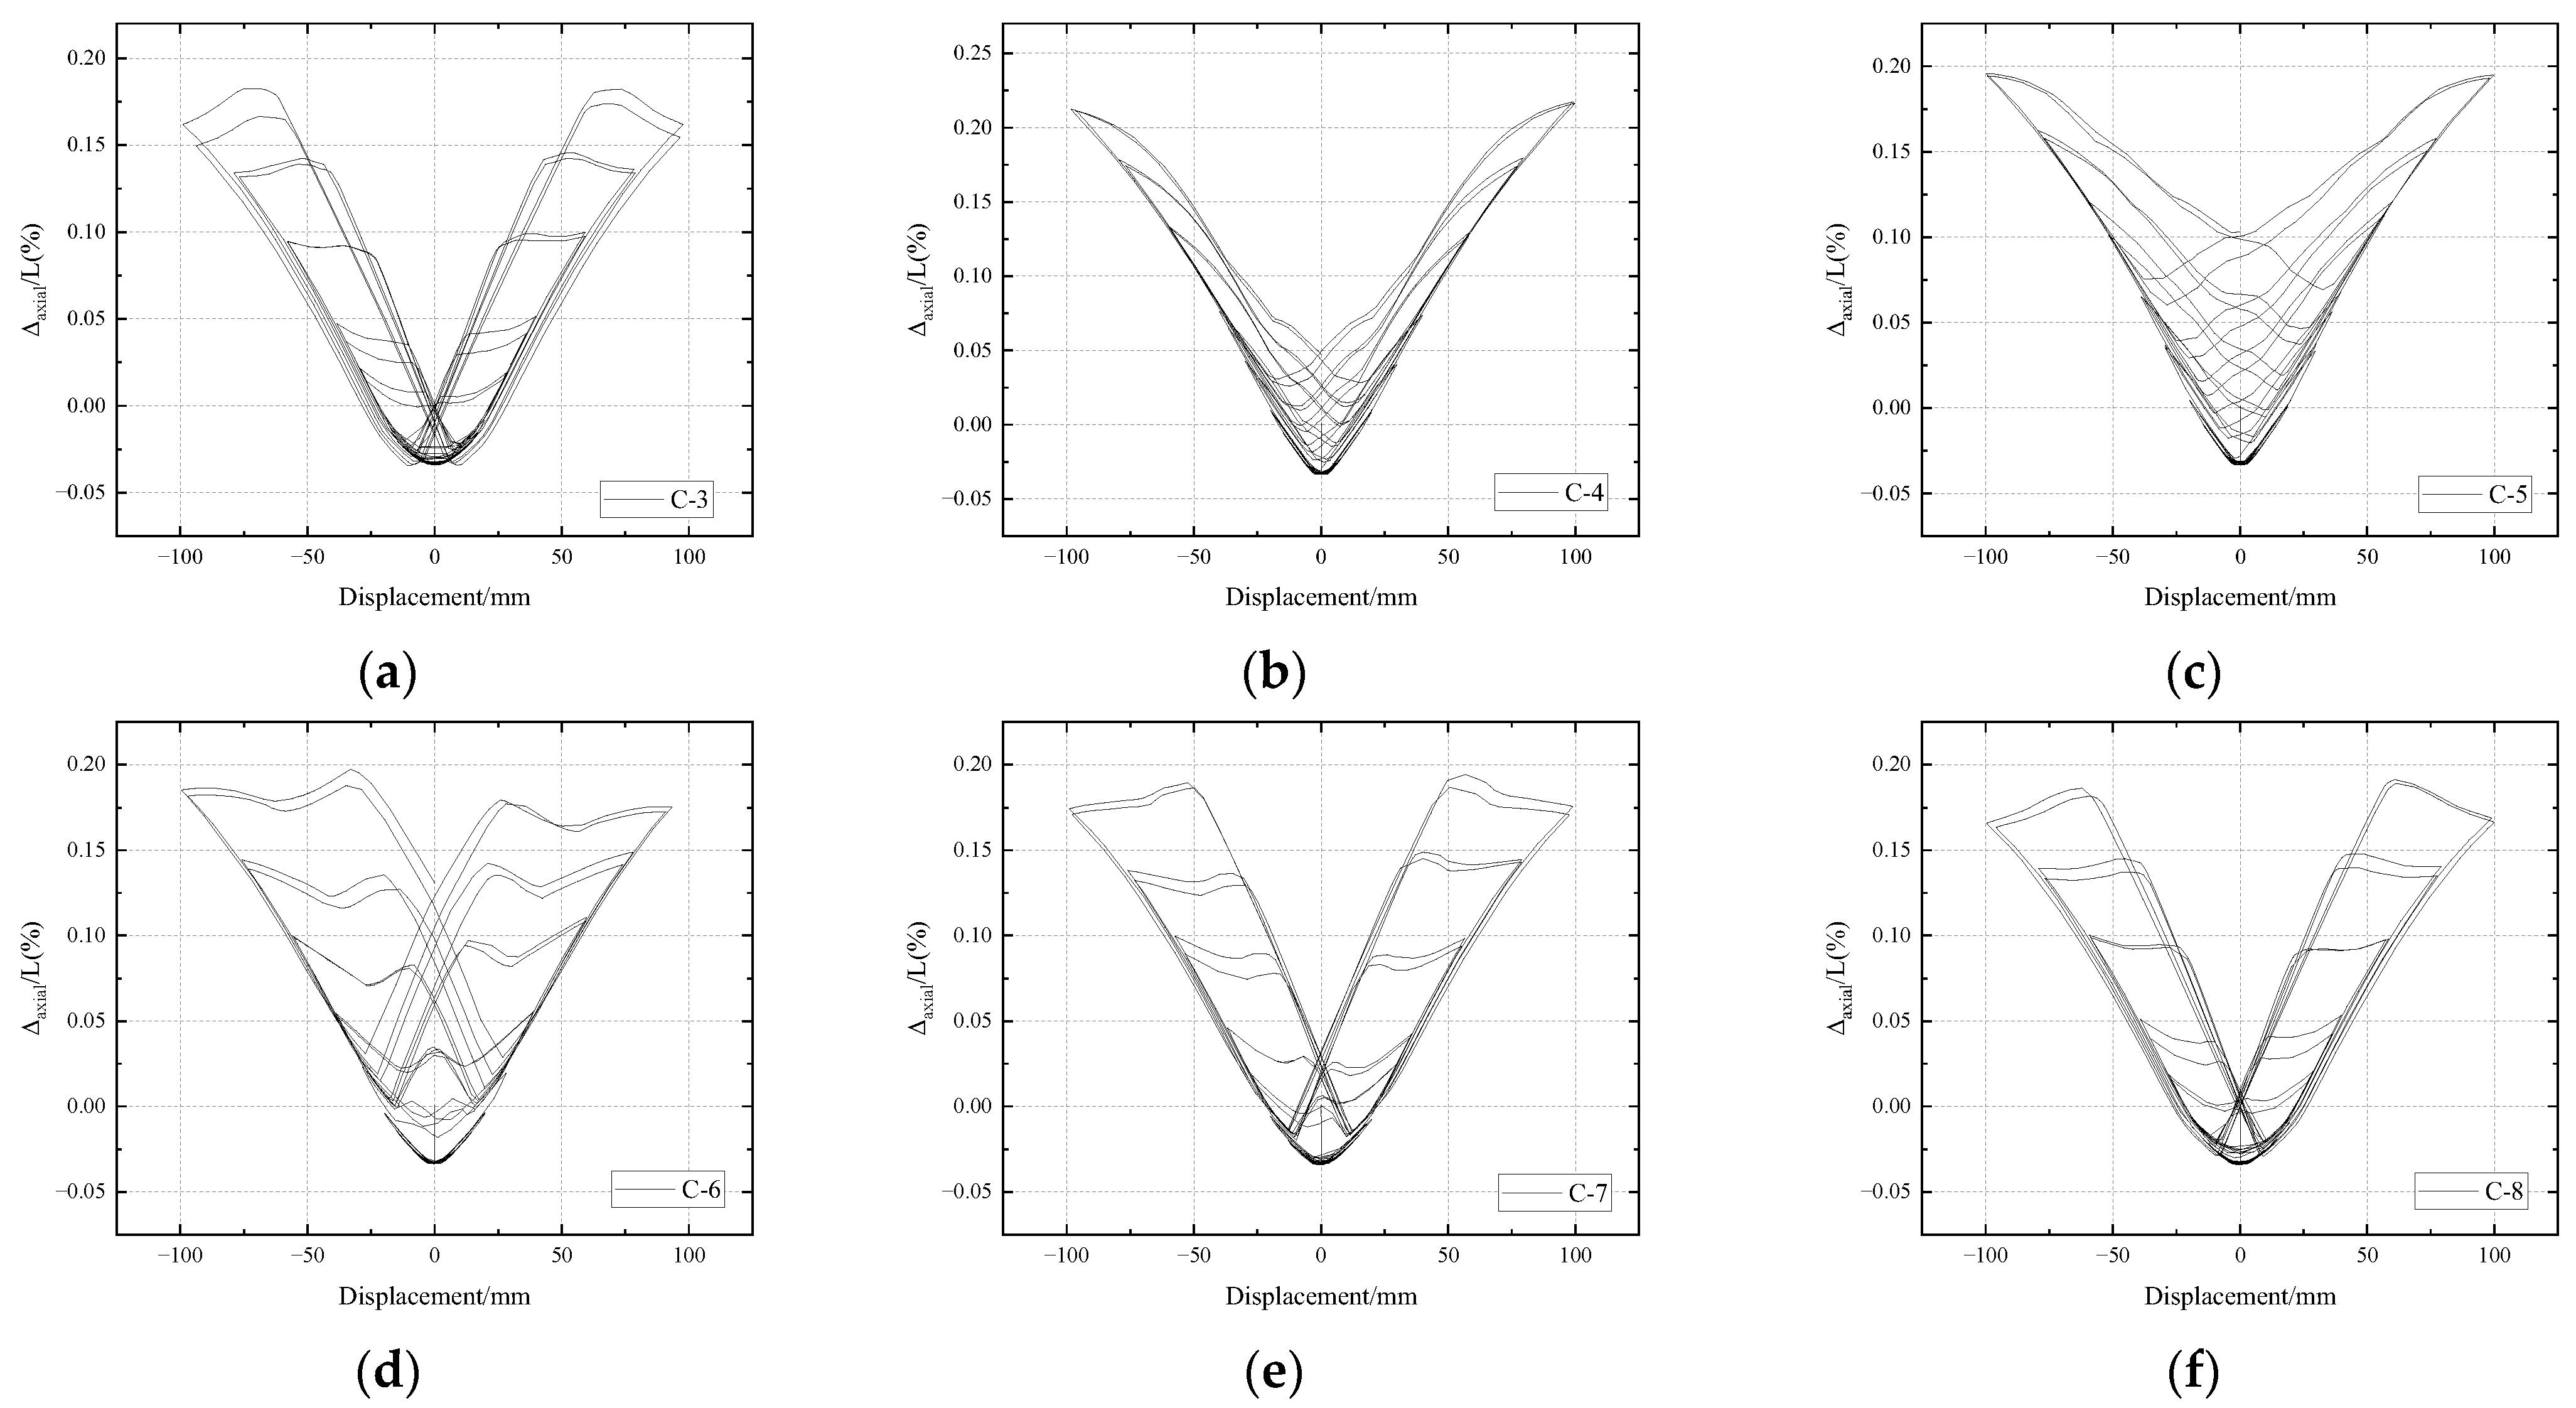
Figure 28.
Calculated strain distribution of the column base: (a) model C-3; (b) model C-4; (c) model C-5; (d) model C-6; (e) model C-7; (f) model C-8 column.
Figure 28.
Calculated strain distribution of the column base: (a) model C-3; (b) model C-4; (c) model C-5; (d) model C-6; (e) model C-7; (f) model C-8 column.

Table 1.
Mechanical properties of steel materials from steel coupon tests.
| Sampling Position | Steel Type | fy/MPa | fu/MPa | δ |
|---|---|---|---|---|
| Column flange | Q355B | 398.35 | 591.85 | 27% |
| Column web | Q355B | 435.40 | 606.89 | 25% |
| Connector horizontal leg | Q355B | 404.05 | 480.43 | 24% |
| Connector vertical leg | Q355B | 410.19 | 552.71 | 24% |
Table 2.
Basic model parameters.
| Model | Column Section Size (mm) | Thickness of Horizontal Legs of Connectors (mm) |
|---|---|---|
| C-3 | HW 175 × 175 × 7.5 × 11 | 20 |
| C-4 | 8 | |
| C-5 | 10 | |
| C-6 | 14 | |
| C-7 | 16 | |
| C-8 | 18 |
Table 3.
Primary performance indicators and energy dissipation indices during cyclic tests.
| Model | Py (kN) | Dy (mm) | Pmax (kN) | Dmax (kN) | Friction Energy Consumption (kN·m) | Total Energy Consumption (kN·m) | Proportion of Friction Energy Consumption (%) |
|---|---|---|---|---|---|---|---|
| C-3 | 97.62 | 19.64 | 110.11 | 78.51 | 113.34 | 125.02 | 90.66% |
| C-4 | 61.61 | 16.42 | 71.62 | 57.93 | 6.01 | 54.24 | 11.14% |
| C-5 | 74.27 | 18.59 | 84.99 | 56.59 | 8.70 | 62.18 | 13.99% |
| C-6 | 86.20 | 18.55 | 97.63 | 59.89 | 85.86 | 104.70 | 82.01% |
| C-7 | 93.32 | 19.10 | 103.13 | 78.91 | 100.94 | 114.25 | 88.35% |
| C-8 | 95.58 | 19.47 | 106.96 | 79.20 | 111.91 | 124.39 | 89.97% |
Publisher’s Note: MDPI stays neutral with regard to jurisdictional claims in published maps and institutional affiliations. |
© 2022 by the authors. Licensee MDPI, Basel, Switzerland. This article is an open access article distributed under the terms and conditions of the Creative Commons Attribution (CC BY) license (https://creativecommons.org/licenses/by/4.0/).
Share and Cite
MDPI and ACS Style
Li, C.-Y.; Wang, F.; Zhu, A.-Z. Seismic Performance of H-Shaped Steel Column with Replaceable Slip Friction Joints. Buildings 2022, 12, 2240. https://doi.org/10.3390/buildings12122240
AMA Style
Li C-Y, Wang F, Zhu A-Z. Seismic Performance of H-Shaped Steel Column with Replaceable Slip Friction Joints. Buildings. 2022; 12(12):2240. https://doi.org/10.3390/buildings12122240
Chicago/Turabian StyleLi, Cheng-Yu, Fan Wang, and Ai-Zhu Zhu. 2022. "Seismic Performance of H-Shaped Steel Column with Replaceable Slip Friction Joints" Buildings 12, no. 12: 2240. https://doi.org/10.3390/buildings12122240
Note that from the first issue of 2016, this journal uses article numbers instead of page numbers. See further details here.