Article

Train-Induced Vibration Predictions Based on Data-Driven Cascaded State-Space Model

1
School of Civil and Transportation Engineering, Guangdong University of Technology, Guangzhou 510006, China
2
School of Civil Engineering and Transportation, South China University of Technology, Guangzhou 510641, China
3
School of Economics and Management, North China Electric Power University, Baoding 071066, China
*
Author to whom correspondence should be addressed.
Buildings 2022, 12(2), 114; https://doi.org/10.3390/buildings12020114
Submission received: 20 December 2021 / Revised: 18 January 2022 / Accepted: 19 January 2022 / Published: 25 January 2022
(This article belongs to the Special Issue Structural Vibration Serviceability and Human Comfort)

Abstract

:
Over-track buildings above metro depots have become common in megacities due to urban land shortages. The transmission of vibrations into the over-track buildings during routine train operations has the potential to adversely impact the occupants in terms of perceptible vibration and noise. There is a need to quantify the potential impacts before construction for planning and design purposes. Train-induced vibration measurements were carried out on a six-story over-track building at the Luogang metro depot in Guangzhou, China, which is located adjacent to the tracks. The measurements were used to develop a data-driven cascaded state-space model, which can be applied to planned over-track buildings located in track areas to predict and assess whether train-induced vibrations would adversely affect the buildings’ future occupants. Vibration levels in the platform of the building’s columns were used as inputs to the models, thereby avoiding the complexity of modeling the transfer behavior of the platform. The predicted vibration levels corresponded with measurements in the existing building. This comparison validated the use of the model for future residential buildings where the predictions indicate that the impacts on its occupants will be within the applicable criteria.

1. Introduction

Urban rail transit, with the advantages of large capacity and lower energy consumption, is an efficient solution to road traffic congestion and environmental pollution in metropolitan cities. By the end of 2020, 45 cities in mainland China had put urban rail transit systems into service with a total length of 7969.7 km [1]. Current design standards stipulate that metro depots are necessary logistical support centers to the metro system [2]. Depots function as a metro system’s base for cleaning, storing, testing, and maintaining trains, covering a large land area. In order to balance the problem of urban land shortage and the construction of depots and to provide financial support to the sustainable operations of urban rail transit systems, exploiting air space over metro depots with over-track buildings is becoming a modern development trend [3]. Further, the distances between depots and nearby residential buildings are also decreasing. Given these facts, the side impact of train-induced perceptible vibrations and noise on human comfort and the performance of vibration-sensitive equipment becomes a social concern [4].
To control vibration impacts, it is of economic importance to predict vibrations before constructing over-track buildings in order to determine the need for vibration mitigation measures. Prediction models can normally be classified into three types: empirical, numerical, and analytical.
For characterizing train-induced vibrations, field measurement is the most direct and efficient method [5,6,7,8,9,10,11,12,13,14,15,16]. General vibration transmission characteristics at metro depots and within over-track buildings could be drawn. For instance, Xia et al. [9] investigated train-induced vibration transmissions in a six-story masonry building adjacent to the Beijing-Guangzhou railway line. The study showed train-induced vibrations increased with train speed and attenuated with increased distance from the track. However, train-induced vibration is a complex phenomenon, so field measurements were site-specific. In [6], it was concluded that train-induced ground vibrations were affected by various factors, including soil profiles, train type, train operation speed, and track unevenness.
Empirical models are developed based on past designs and construction experiences and need a great number of field measurement studies. They can account for factors such as the distance between the receiver and the tracks, train speeds, and geometric and material attenuation [17]. The shortcomings of empirical models lie mostly in predicting accuracy and applicability.
Numerical models always need to integrate three sub-models: the train-track, soil, and building structure models, representing the vibration source, vibration transmission path, and receiver, respectively. Vibrating loads can be calculated through a train-track model that accounts for the quasi-static loads from train axle loads and dynamic loads from track irregularities, wheel wear, and/or eccentric wheel mountings [18,19,20]. The finite element method (FEM) and boundary element method (BEM) are the most frequently adopted methods to establish a 2D or 3D soil model. The 2D or 3D building structure model is generally developed based on the FEM because of the geometric complexity of buildings. Train-induced vibration levels within a building depend not only on the natural frequency of the structure but also on the soil properties [21,22,23,24]. This results from the problem of coupling or dynamic interaction between soil and building foundations. The disadvantages of numerical models are their formidable computational cost and the uncertainty of numerical model parameters. The computational efficiency was improved by extensive simplification and optimization. More efficient numerical models have been proposed, such as 2.5D finite element models [25,26] and finite difference models [27].
Analytical models (i.e., the white-box model) are physics-based models developed from first principles and based on strict theoretical deduction with a closed-form and high prediction accuracy. Simplified 1D or 2D impedance models for predicting the axial vibration propagation within the buildings’ support structures belong to analytical models and proved efficient [28,29,30]. However, analytical closed-form solutions do not exist for most practical engineering problems with complex 3D geometries. In addition, analytical models normally introduce many unrealistic hypotheses to simplify the solutions.
Due to construction policies, over-track buildings above metro depots contain two stages. As seen in Figure 1, the footprint of first stage over-track buildings is away from the tracks, and these buildings are generally built synchronously with the platform. The buildings are used as office space or apartments for people working in the metro depot. The second stage over-track buildings are built after the construction of first stage over-track buildings, further exploiting the air space above metro depots. They have various usages such as residences, offices, schools, clinics, stores, and restaurants.
For simulating a dynamic system, another method called the system identification technique exists, which generally derives data-driven models from experimental data (i.e., the black-box model). In order to predict train-induced vibrations within future second stage over-track buildings and assess vibration impacts prior to construction, this paper develops and validates the cascaded state-space model based on the measurements from a first stage over-track building at Luogang metro depot in Guangzhou, China.
State-space models of sub-structural systems are efficient and have great applicability to similar structures. By applying vibration measurements from the platform to the cascaded state-space model as inputs, vibration responses in future second stage over-track buildings with similar structures can be predicted and assessed. It is of economic importance to predict train-induced vibration responses prior to construction to assess whether vibration mitigation measures are needed.
This research is comprised of four parts. Firstly, a cascaded state-space model for predicting vibrations within the building is proposed. Its modeling procedure and realization methods are presented in Section 2. Secondly, field measurements to develop and validate the cascaded state-space model have been carried out, and the setup and results are displayed in Section 3. Thirdly, a data-driven cascaded state-space model for the first stage over-track building is obtained based on the measurements. The predicted and measured vibrations are compared to verify the model’s accuracy and applicability. The cascaded state-space model is also applied to the future second stage over-track building to assess train-induced vibration impacts, as shown in Section 4. Finally, natural frequencies and damping ratios related to a typical floor of the first stage over-track building are identified to gain insights into structural dynamic characteristics, as exhibited in Section 5. The organization diagram of this paper is shown in Figure 2.

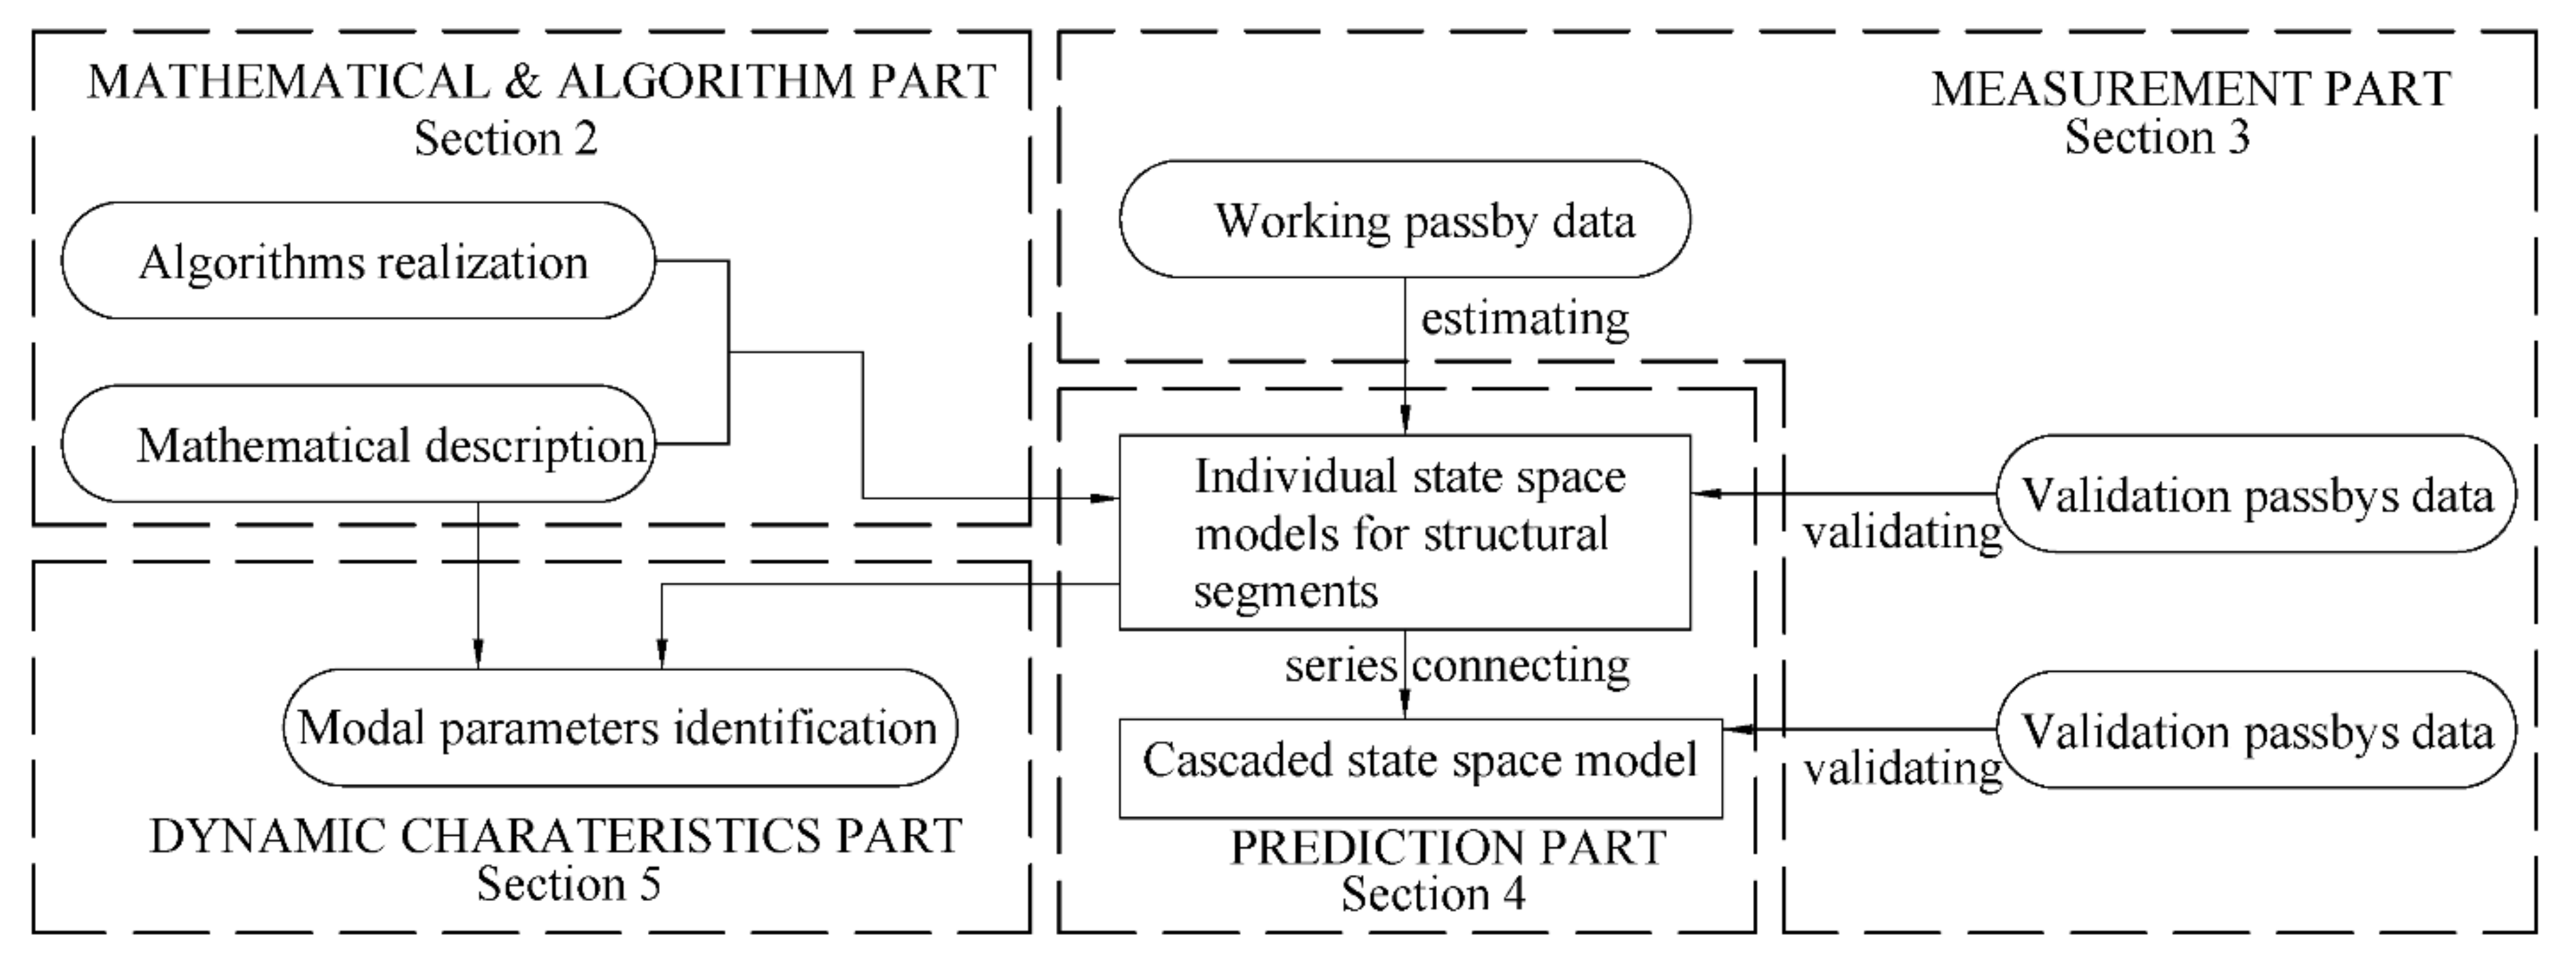
2. Prediction Method Based on State-Space Model

Unlike structural dynamic problems where time-variant forcing functions are directly applied to the system DOFs as inputs, train-induced structural vibration is affected by the problem of foundation excitation, which is widely studied in civil engineering [31]. Structural foundation excitation, induced by vibrations in the surrounding soil through soil-foundation dynamic interaction, can be caused by various sources, such as earthquakes, vehicular loads, and construction machines operated near a building. The corresponding system inputs to the problem of foundation excitation are the motions of the structure boundary. Each column or load-bearing wall segment between different floors can be considered a supported–excited structural component, through which vibrations in the foundation or lower floor will be transmitted to the upper floor [28].

2.1. Modeling Procedure

A data-driven cascaded state-space model was developed and validated based on an experimental study. As illustrated in Figure 3a, the i t h column segment and the ( i + 1 ) t h floor structures constitute a single-input and single-output (SISO) sub-structural system. A state-space model with the system order n i (see Equation (1)) can be used to describe the sub-structural system and its state variables, and coefficient matrices can be estimated from the measured input and output data using algorithms based on the subspace methods mentioned in Section 2.2. Such sub-structural systems of the different floors are assumed to be independent of each other, and the dynamic coupling between them is ignored. Successive sub-structural systems can be series connected through their communal joint vibrations (see Figure 3b). The predicted output of the lower i t h system is taken as the “measured” input of the upper ( i + 1 ) t h system.
A state-space model is typically used to simulate the dynamic behavior of a state-determined system that can be physically modeled with one-port elements such as masses, springs, and dampers. It can be expressed in either continuous-time or discrete-time form by using differential or difference equations, respectively. Theoretically, the system state is completely characterized by the state variables. The number of internal state variables of a system is physically equal to the number of independent energy storage elements in the system. This number is also defined as the system order. At any time (t), the value of each state variable represents the energy of the corresponding energy storage element. The time derivatives of state variables specify the changing rate of the system energy.
Considering the context of this study is small-amplitude structural vibrations induced by running metro trains, each individual sub-structural system in Figure 3a can be considered a linear time-invariant (LTI) system with a single input and single output. An nth-order discrete-time SISO state-space model for a combined deterministic–stochastic LTI system is mathematically described in Equation (1):
x k + 1 = [ A ] x ( k ) + [ B ] u ( k ) + w ( k ) y ( k ) = [ C ] x ( k ) + [ D ] u ( k ) + v ( k )
where u ( k ) is the input vibration at time step k, y ( k ) is the output vibration at time step k, and x ( k ) is the n-dimensional discrete state vector at time step k. [A] is the dynamical system matrix describing the dynamic characteristics of the sub-structural system. [B] is the input matrix representing a linear transformation through which the deterministic inputs influence the next system state. [C] is the output matrix implying how the system’s internal state is transferred to the measured output vibrations y ( k ) . D is a matrix consisting of feedthrough elements. w ( k ) and v ( k ) are the process noise and measurement noise at time step k, respectively. They are both assumed to be stochastic and uncorrelated Gaussian zero-mean white noise processes, whose covariance matrices can be defined by Equation (2):
E w ( k ) v ( k ) w ( q ) T v ( q ) T = [ Q ] [ S ] [ S T ] [ R ] δ k q
where [Q], [R], and [S] are covariance matrices of the noise vectors w ( k ) and v ( k ) .
Since this model considers the unknown disturbances coming from two additional stochastic processes, process and measurement noise, functioning as a data-driven model compared with a determined state-space model is more realistic. The task of simulating an LTI system through the combined deterministic–stochastic system identification method mentioned in Section 2.2 can be summarized as making the optimal estimation of matrices [A], [B], [C], and [D] when given measured input and output vectors with typically infinite measuring time [32,33]. The flow chart depicting the development of individual state-space models is shown in Figure 4. The realization of sub-structural system identification through subspace method-based algorithms is described in Section 2.2.

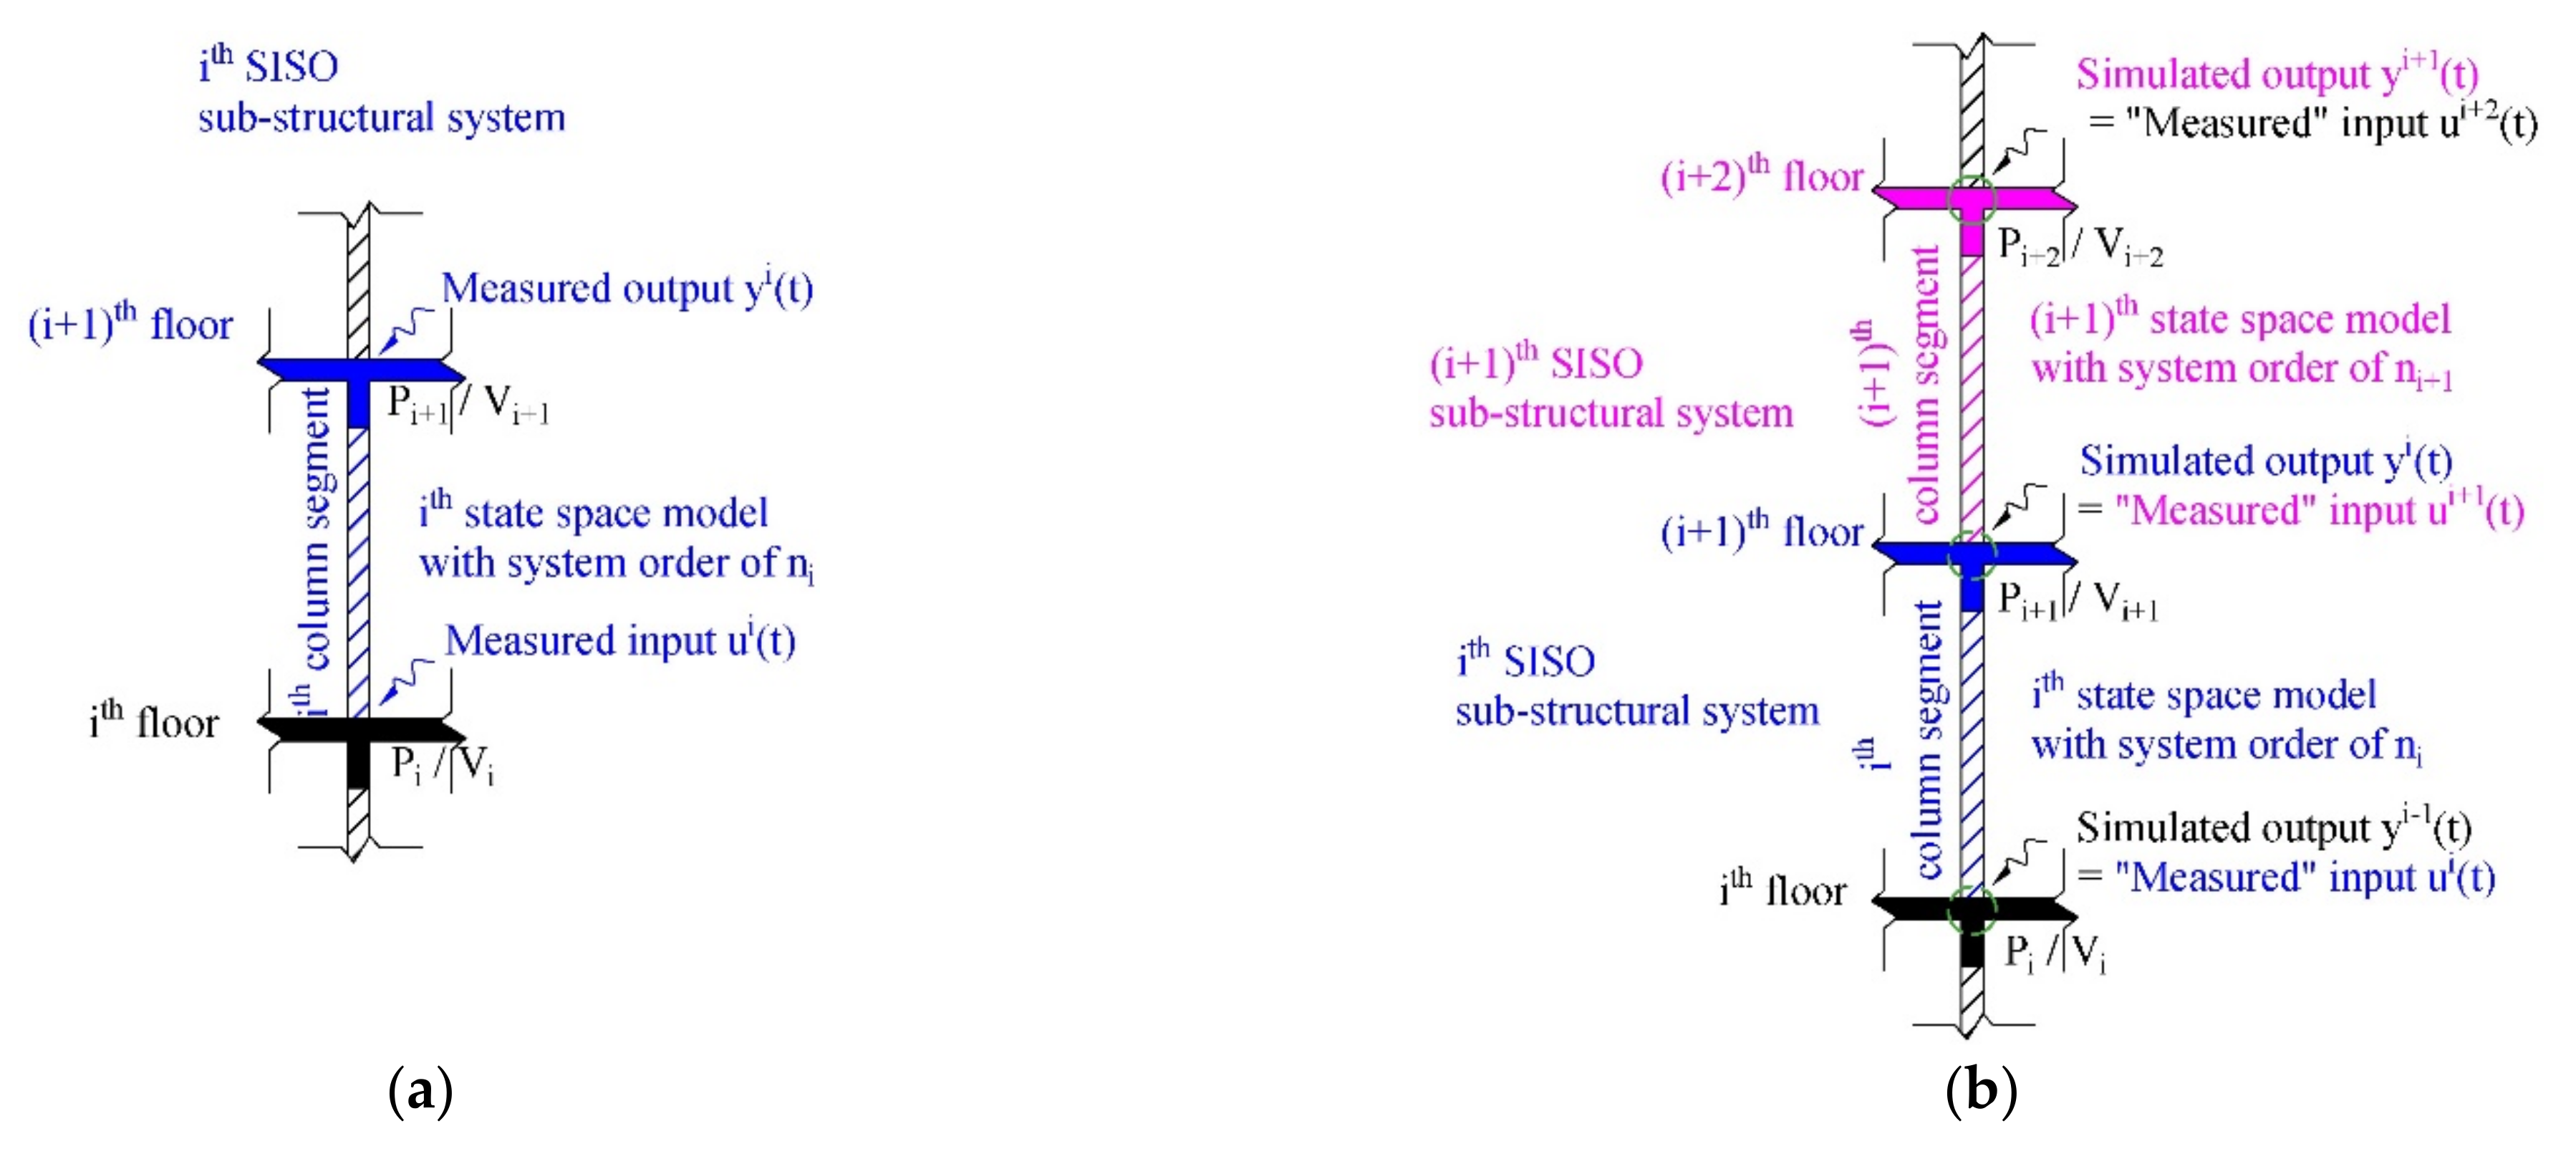
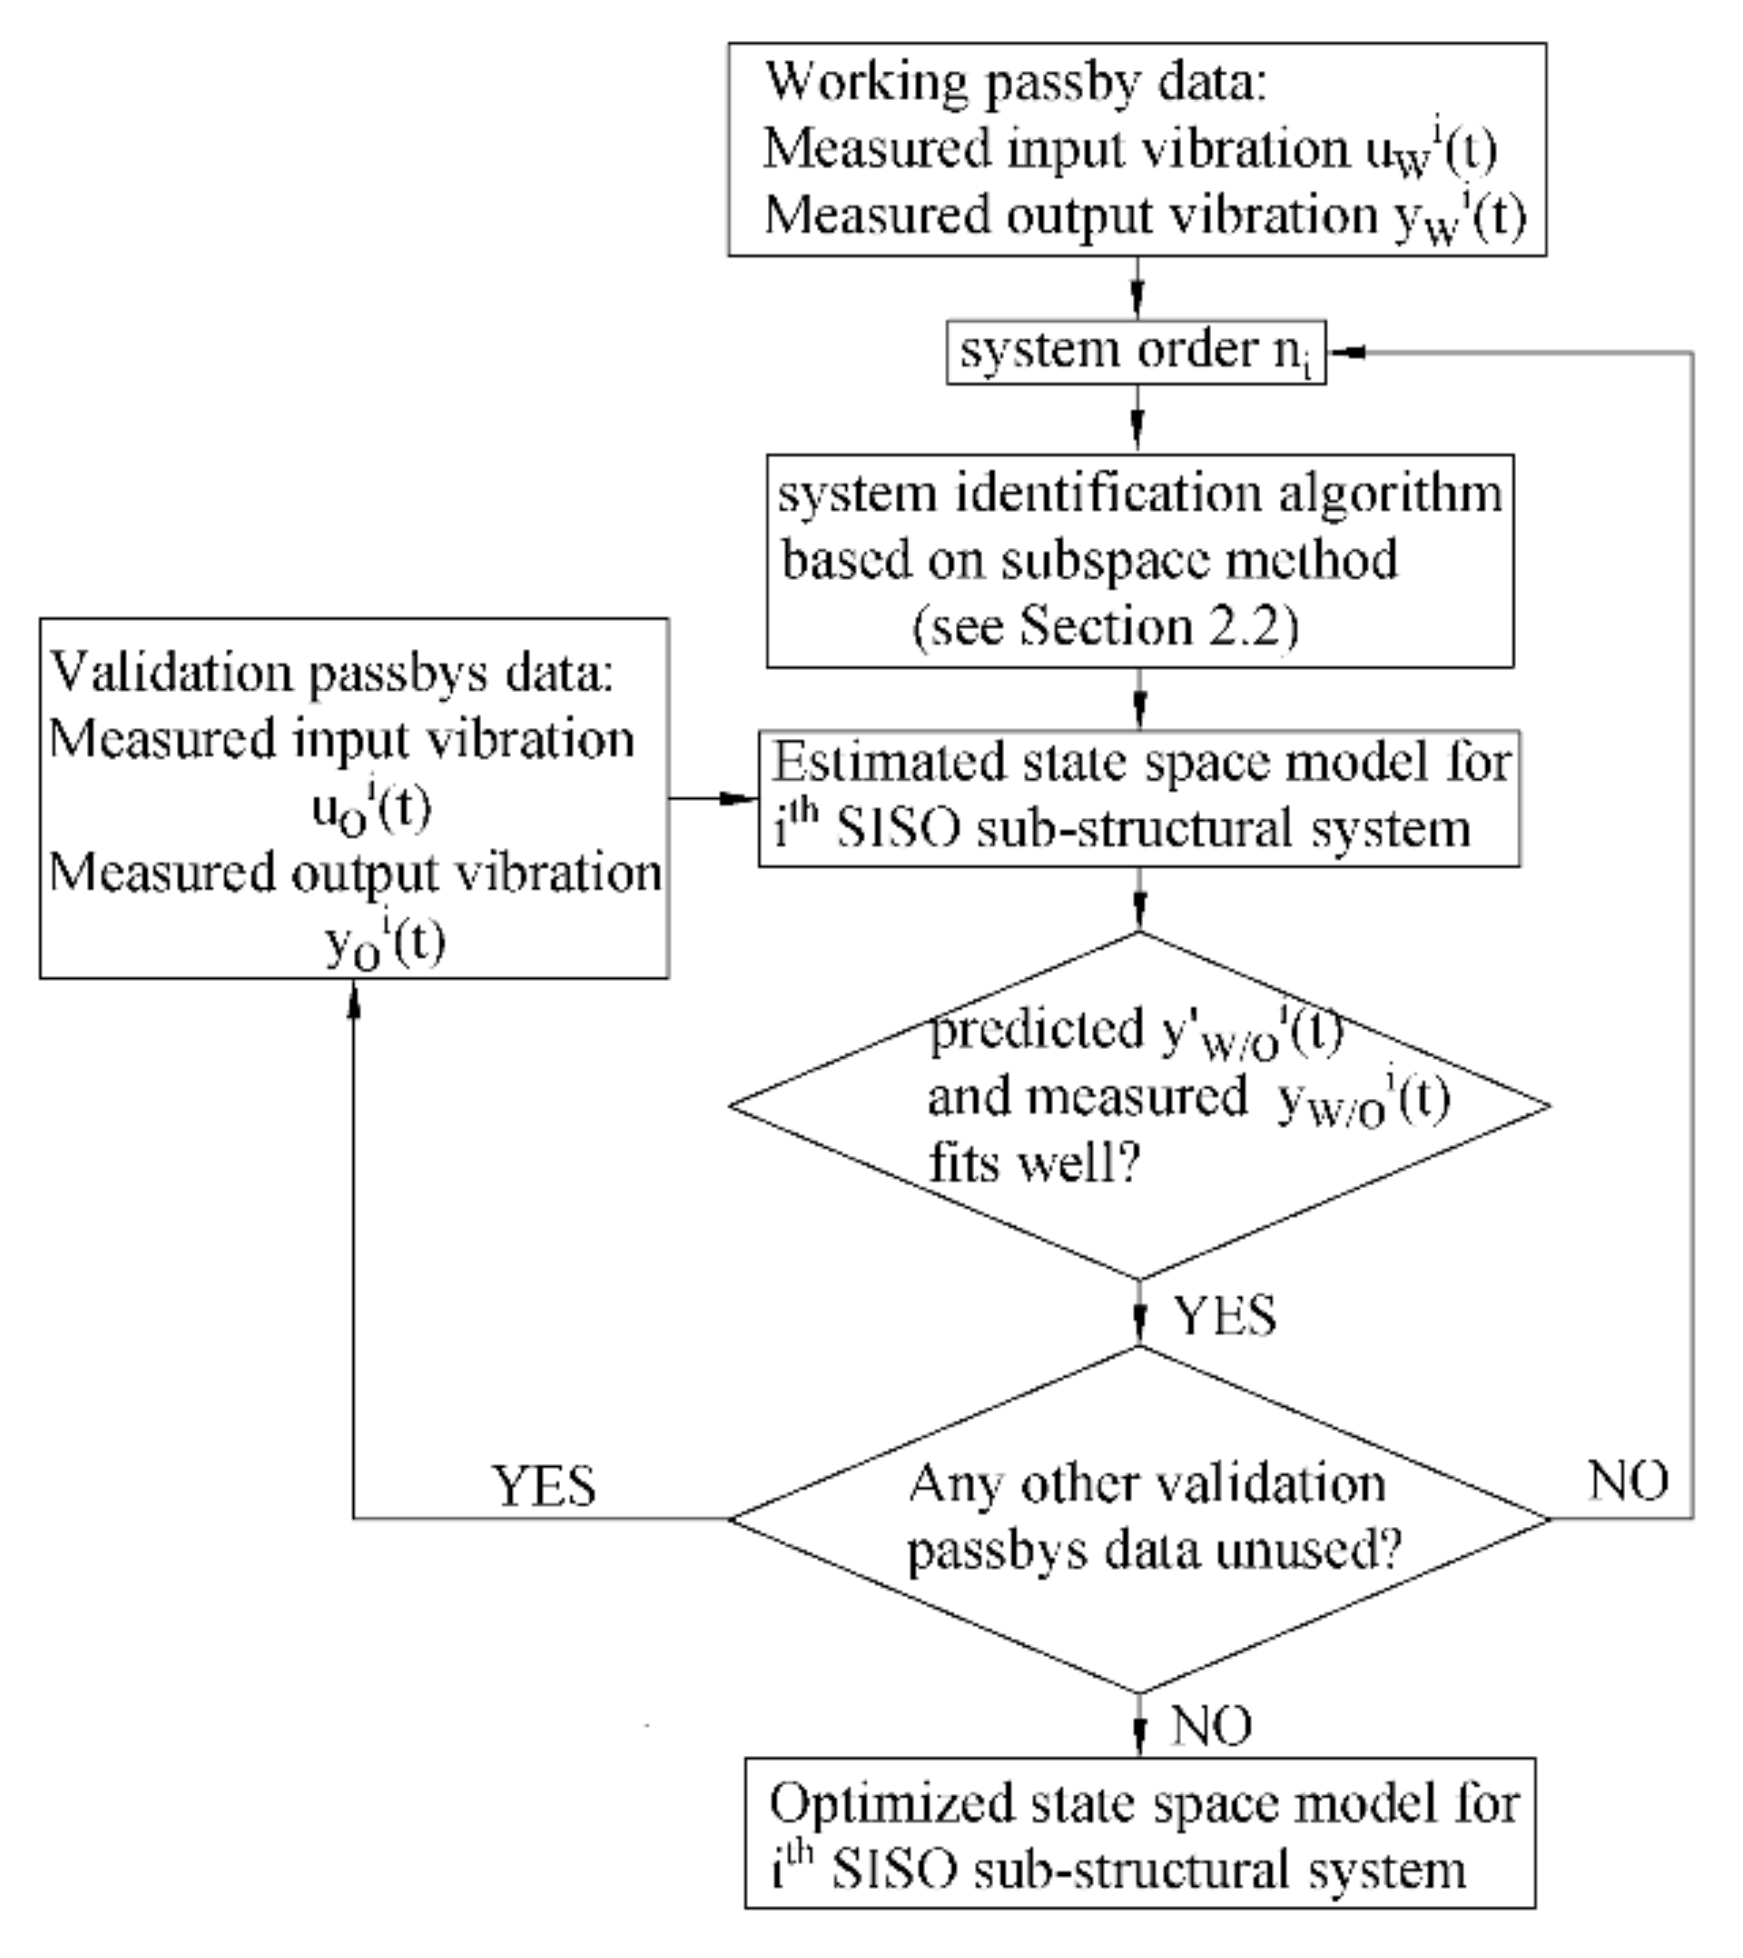
2.2. Sub-Structural System Identification

Developing a data-driven state-space model is also referred to as subspace state-space system identification (4SID), which are generally classified into two main types: realization-based and direct 4SID methods [34].
Realization-based methods extract state-space models by using the extended observability matrix [35], which is estimated directly from the Markov parameters (MPs). MPs indicate estimations of system impulse responses, and their reliable estimation is the backbone of realization-based 4SID methods.
Direct 4SID methods also are referred to as subspace methods, data-driven subspace identification, or subspace system identifications [36]. Unlike realization-based methods, direct 4SID methods estimate state-space models directly from an arbitrary set of input and output data (working data) without estimating system impulse response functions and then use other sets of input and output data (validation data) to verify the estimated state-space model. The measured system output y generally can be divided into three components: the forced vibration response, free vibration response, and colored noise response, where the colored noise response y S is the result of the unmeasured colored noise disturbance. From this point of view, system output y can be correspondingly decomposed into three orthogonal matrices [ H ] u , [ O ] x , and y S , which are parallel to the span of the system input u , the span of the joint null space of the input and the colored noise output u , y S , and the span of the colored noise output y S , respectively. The matrix [ O ] x is the product of the system extended observability matrix [ O ] and state sequence x . Direct 4SID methods estimate the matrix [ O ] x along the span of u , y S using subspace operations based on measured data since free vibration responses of the system are only related to the system dynamic characteristics. Then, the state-space matrices [A], [B], [C], and [D] of the system can be further extracted from the estimated matrix [ O ] x .
Plenty of numerical algorithms based on direct 4SID methods are well established, such as multivariable output-error state-space (MOESP) and the numerical algorithm for subspace state-space system identification methods (N4SID) [33,37,38]. The key to each algorithm is to project the measured system output y to the span of u , y S . MOESP uses orthogonal projection, while N4SID uses oblique projection. Even though MOESP and N4SID algorithms use different numerical procedures to obtain state-space matrices [A], [B], [C], and [D], the research demonstrated that the accuracy of these two algorithms was comparable [39]. Detailed algorithms were not discussed, and the N4SID algorithm was adopted in this research with the help of MATLAB.

3. Train-Induced Vibration Measurements

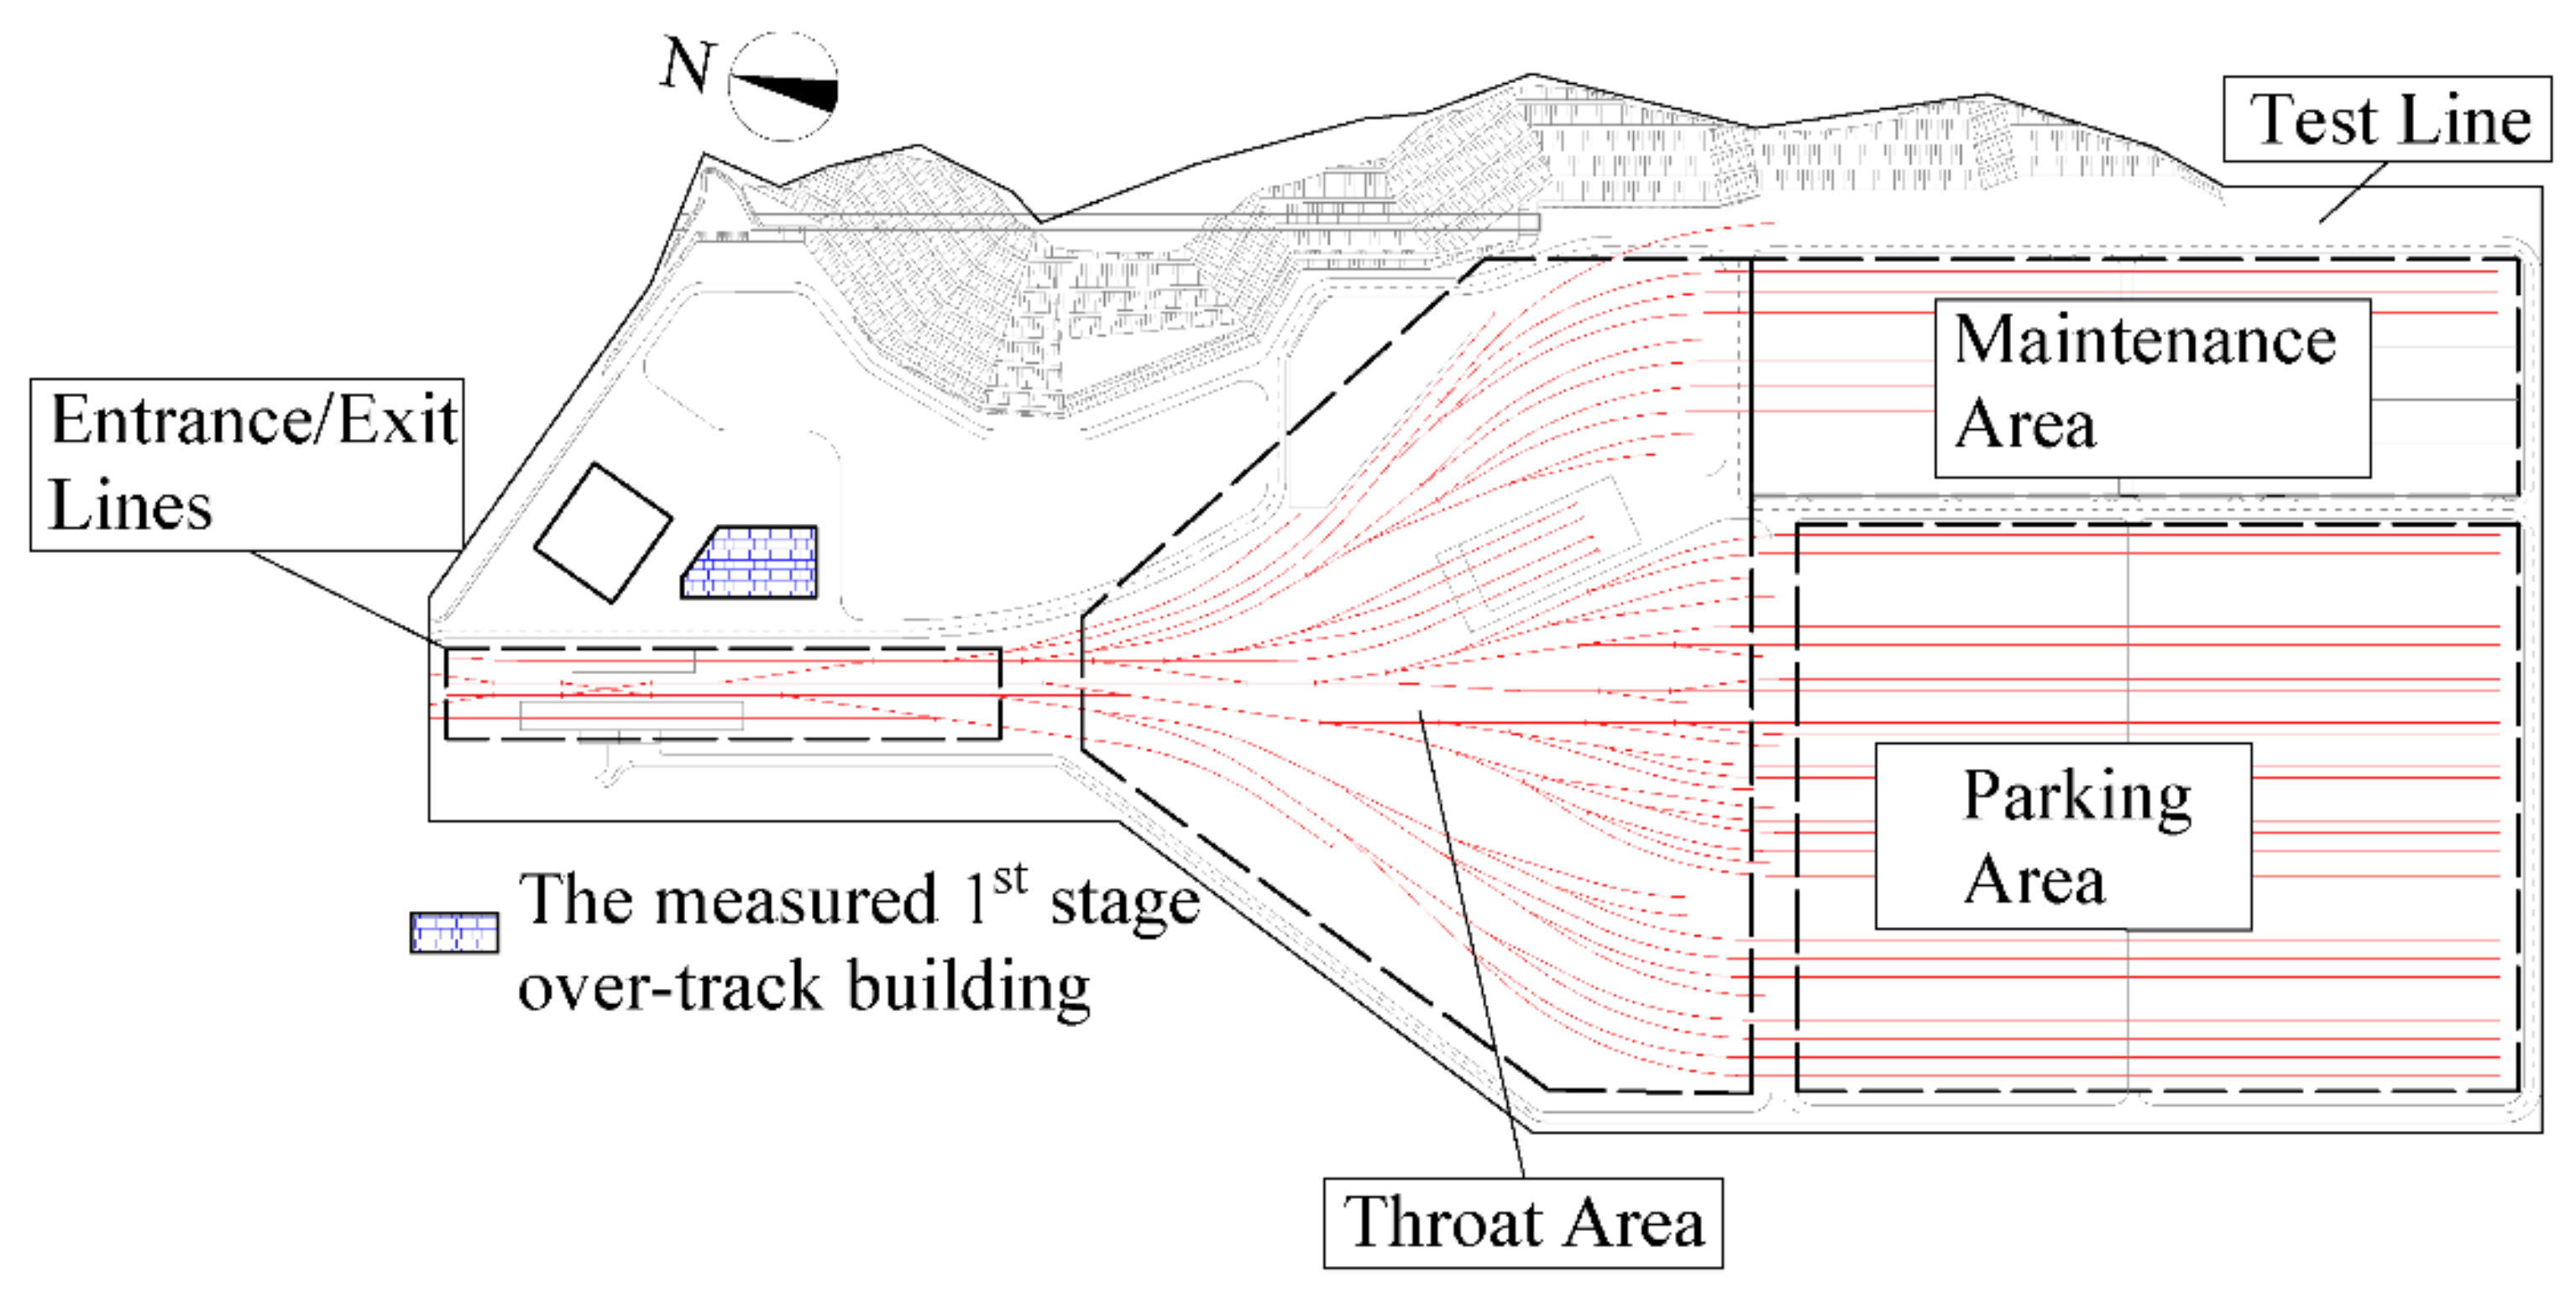
3.1. Measurement Program
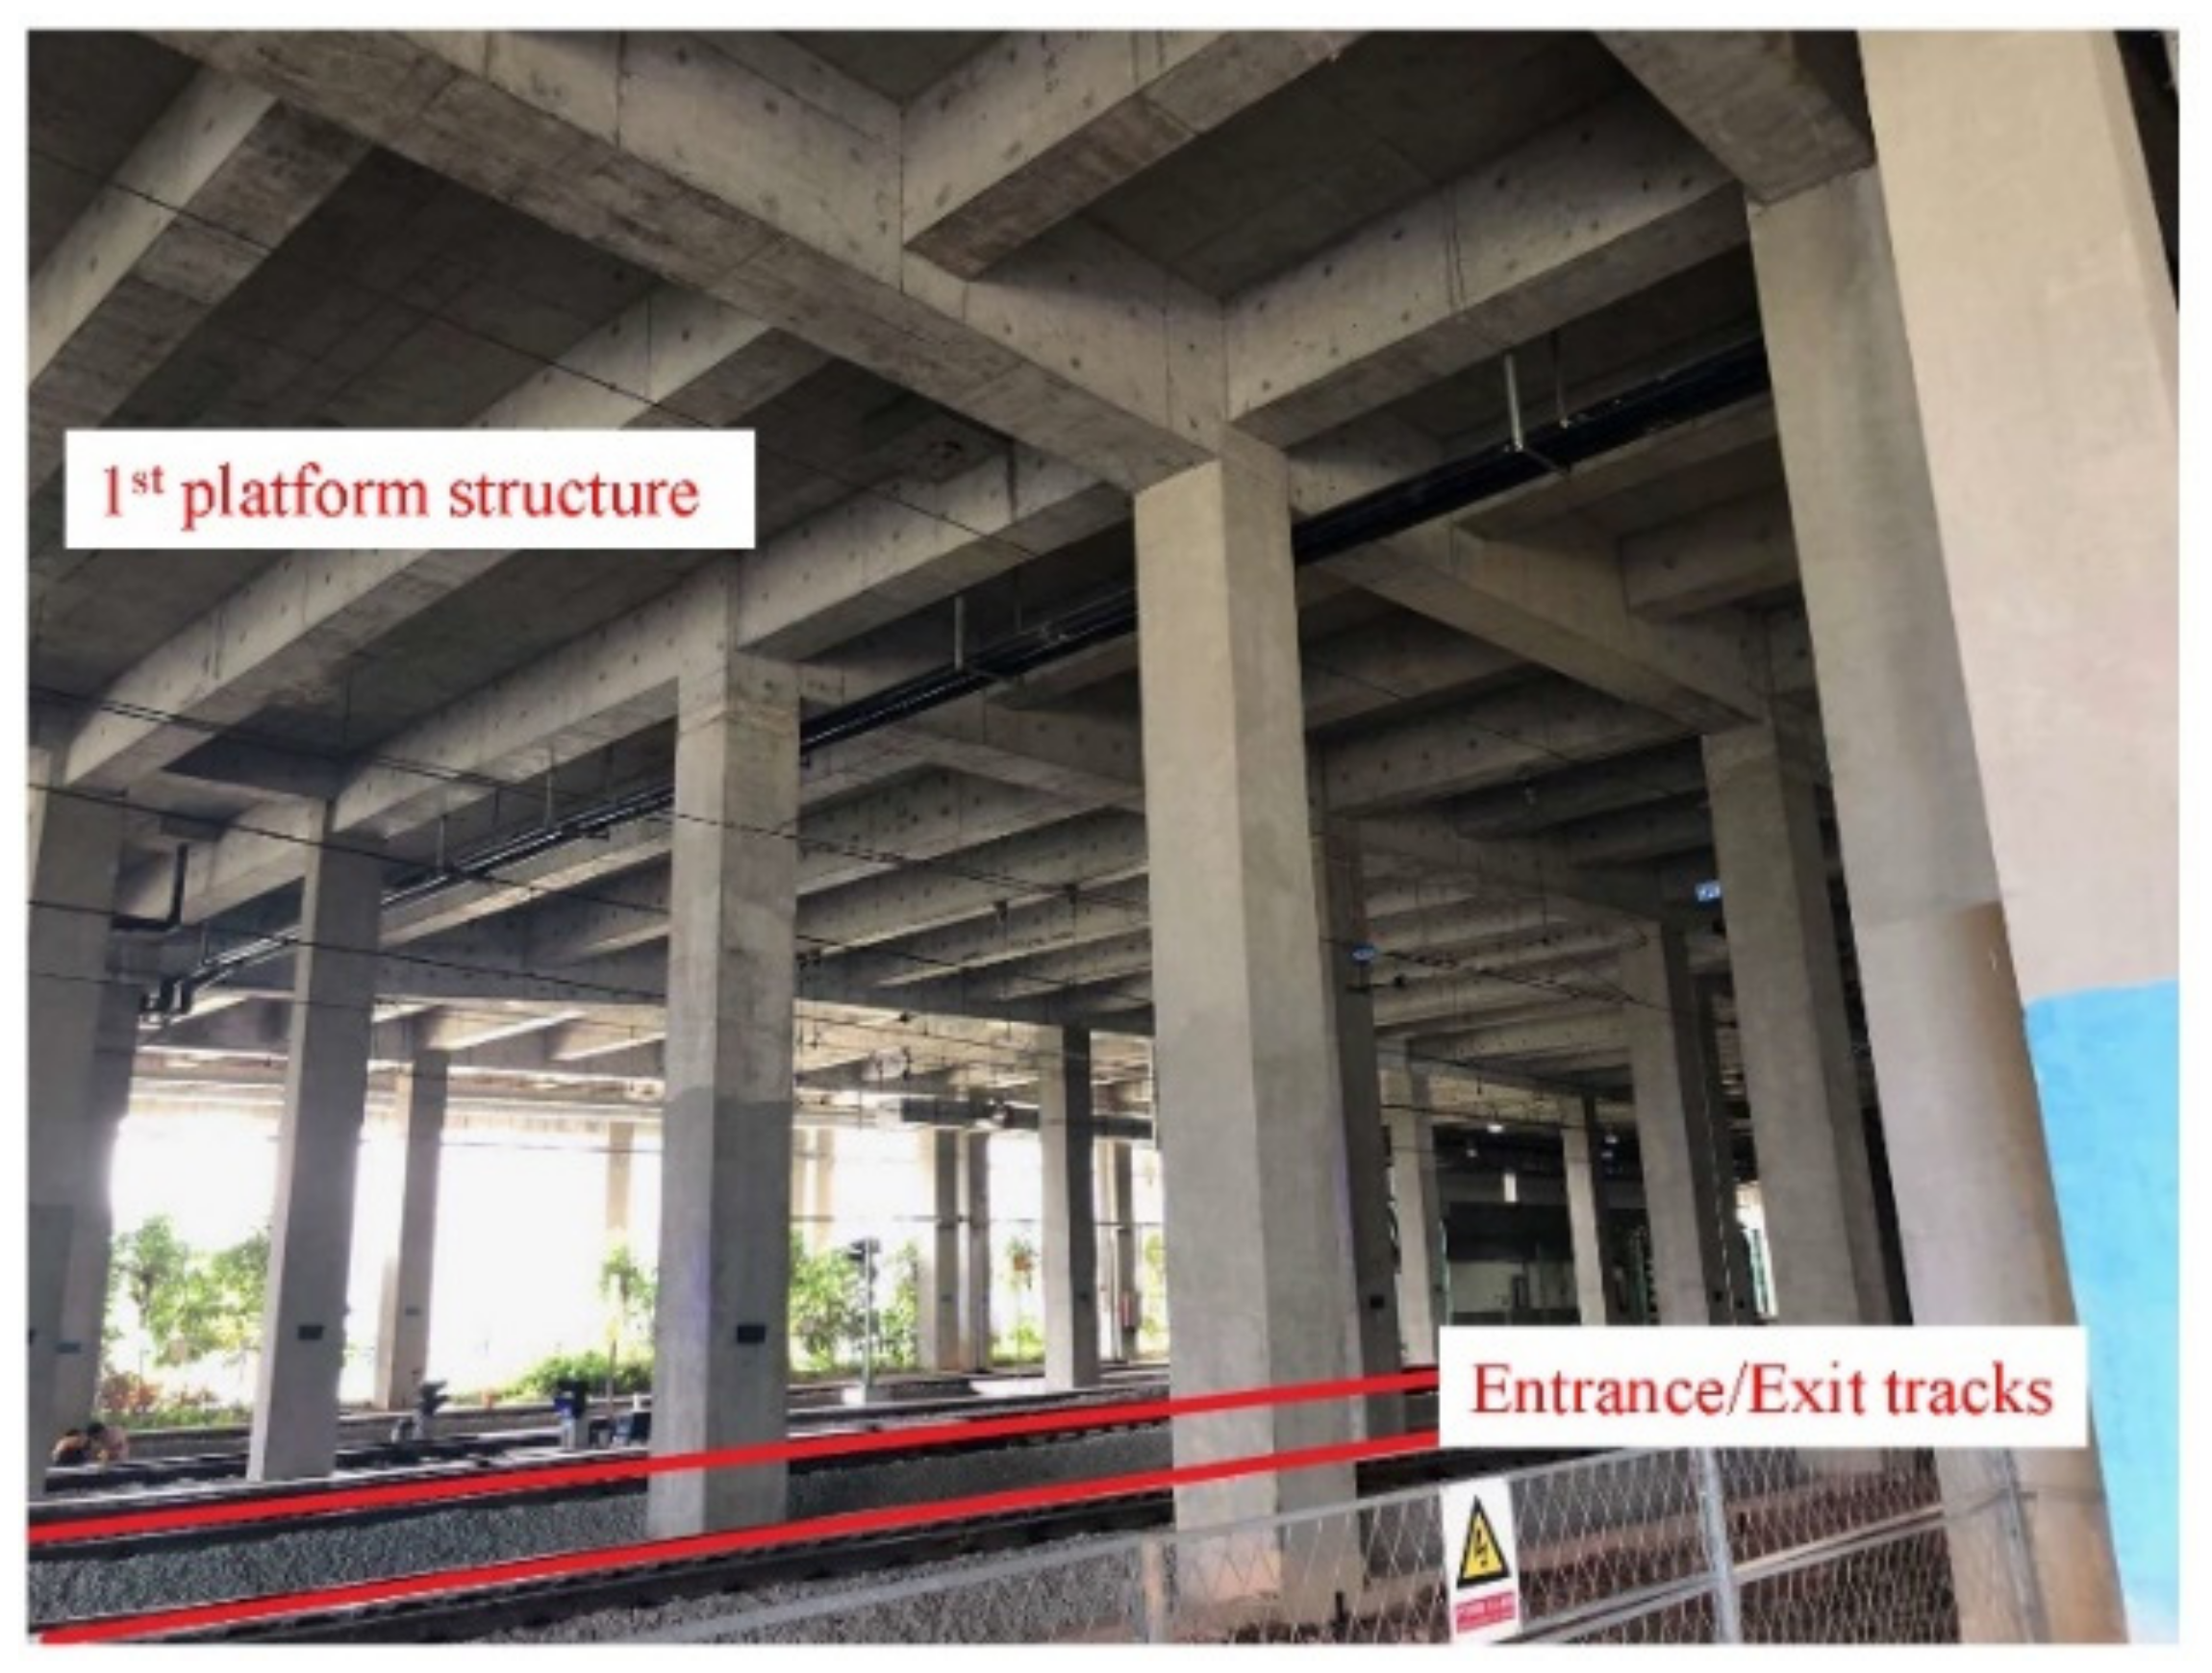
3.1.1. Location

The measurements were conducted at the Luogang depot (Figure 5) in Guangzhou, China. The Luogang depot is used for parking, testing, cleaning, and maintaining the Line 6 metro trains of Guangzhou Metro, covering an area of 0.354 km2.

3.1.2. Setup

The tested first stage over-track building, located beside the entrance/exit tracks (Figure 6), is a six-story residential building with a concrete frame structure. The instrumentations were wireless units with built-in accelerometers and a JM3873 Data Acquisition System [14]. The sampling frequency was 512 Hz, which was enough for researching railway-induced vibration responses in buildings up to 200 Hz [40].
Two columns (Figure 7a) of the first stage over-track building were measured from floor to floor. They are 9 m apart and of the same construction materials (see Table 1), the same sectional dimensions (0.8 m × 0.8 m), and the same distance to the nearest entrance/exit line (33.5 m, Figure 7b).
The column including measured points P1 to P9 was called the room column. The data from 11 train passbys were obtained: 4 passbys on Track 1 and 7 passbys on Track 2. The column including measured points V1 to V9 was named the staircase column. The data from 10 train passbys were recorded, 5 passbys on Track 1 and 5 passbys on Track 2. The main difference between the room column and the staircase column is that the latter connects to a staircase.

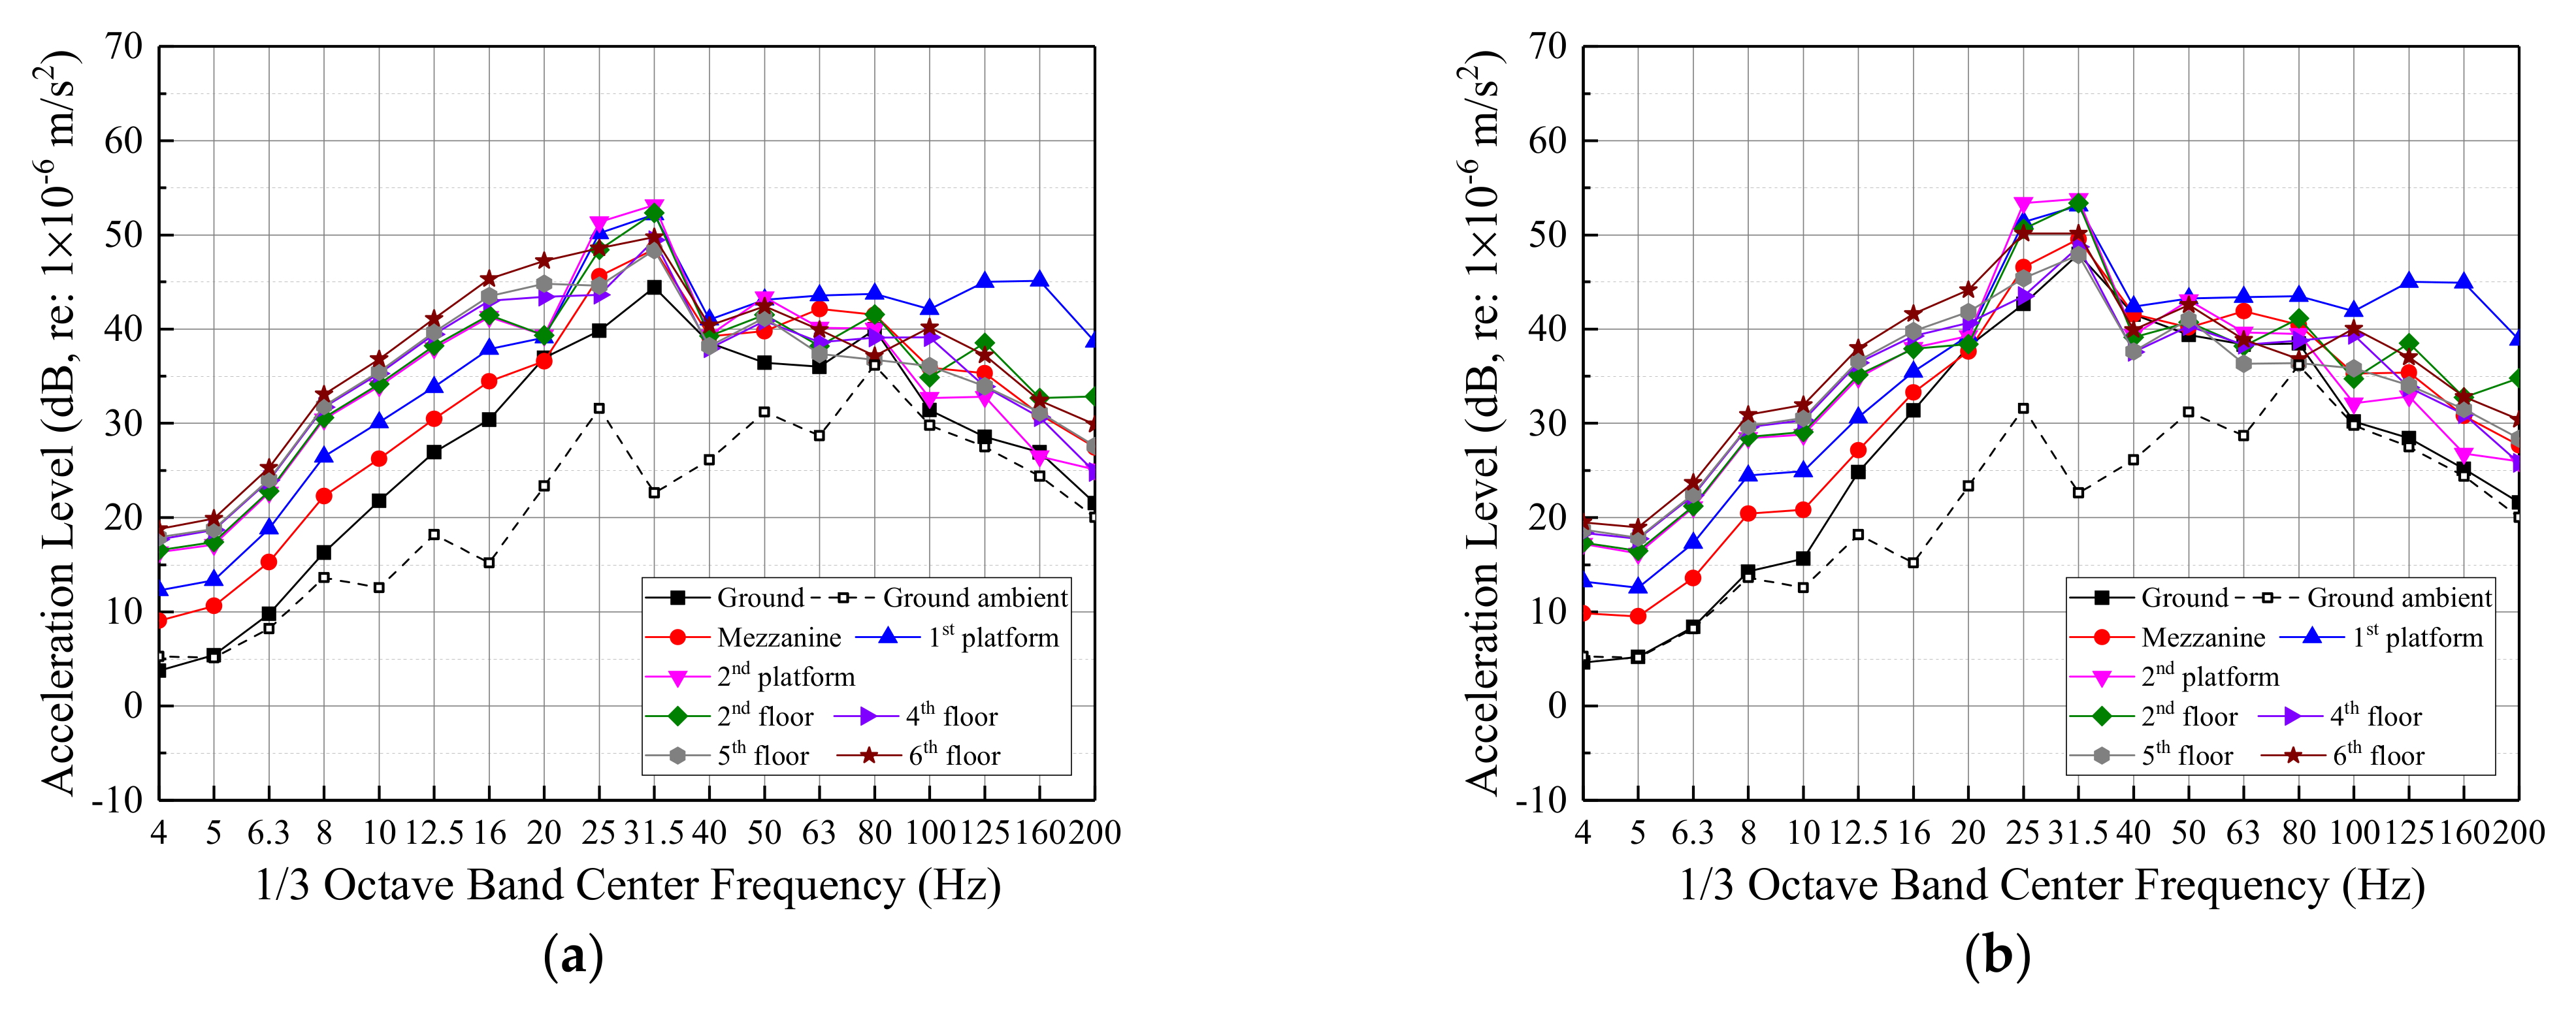
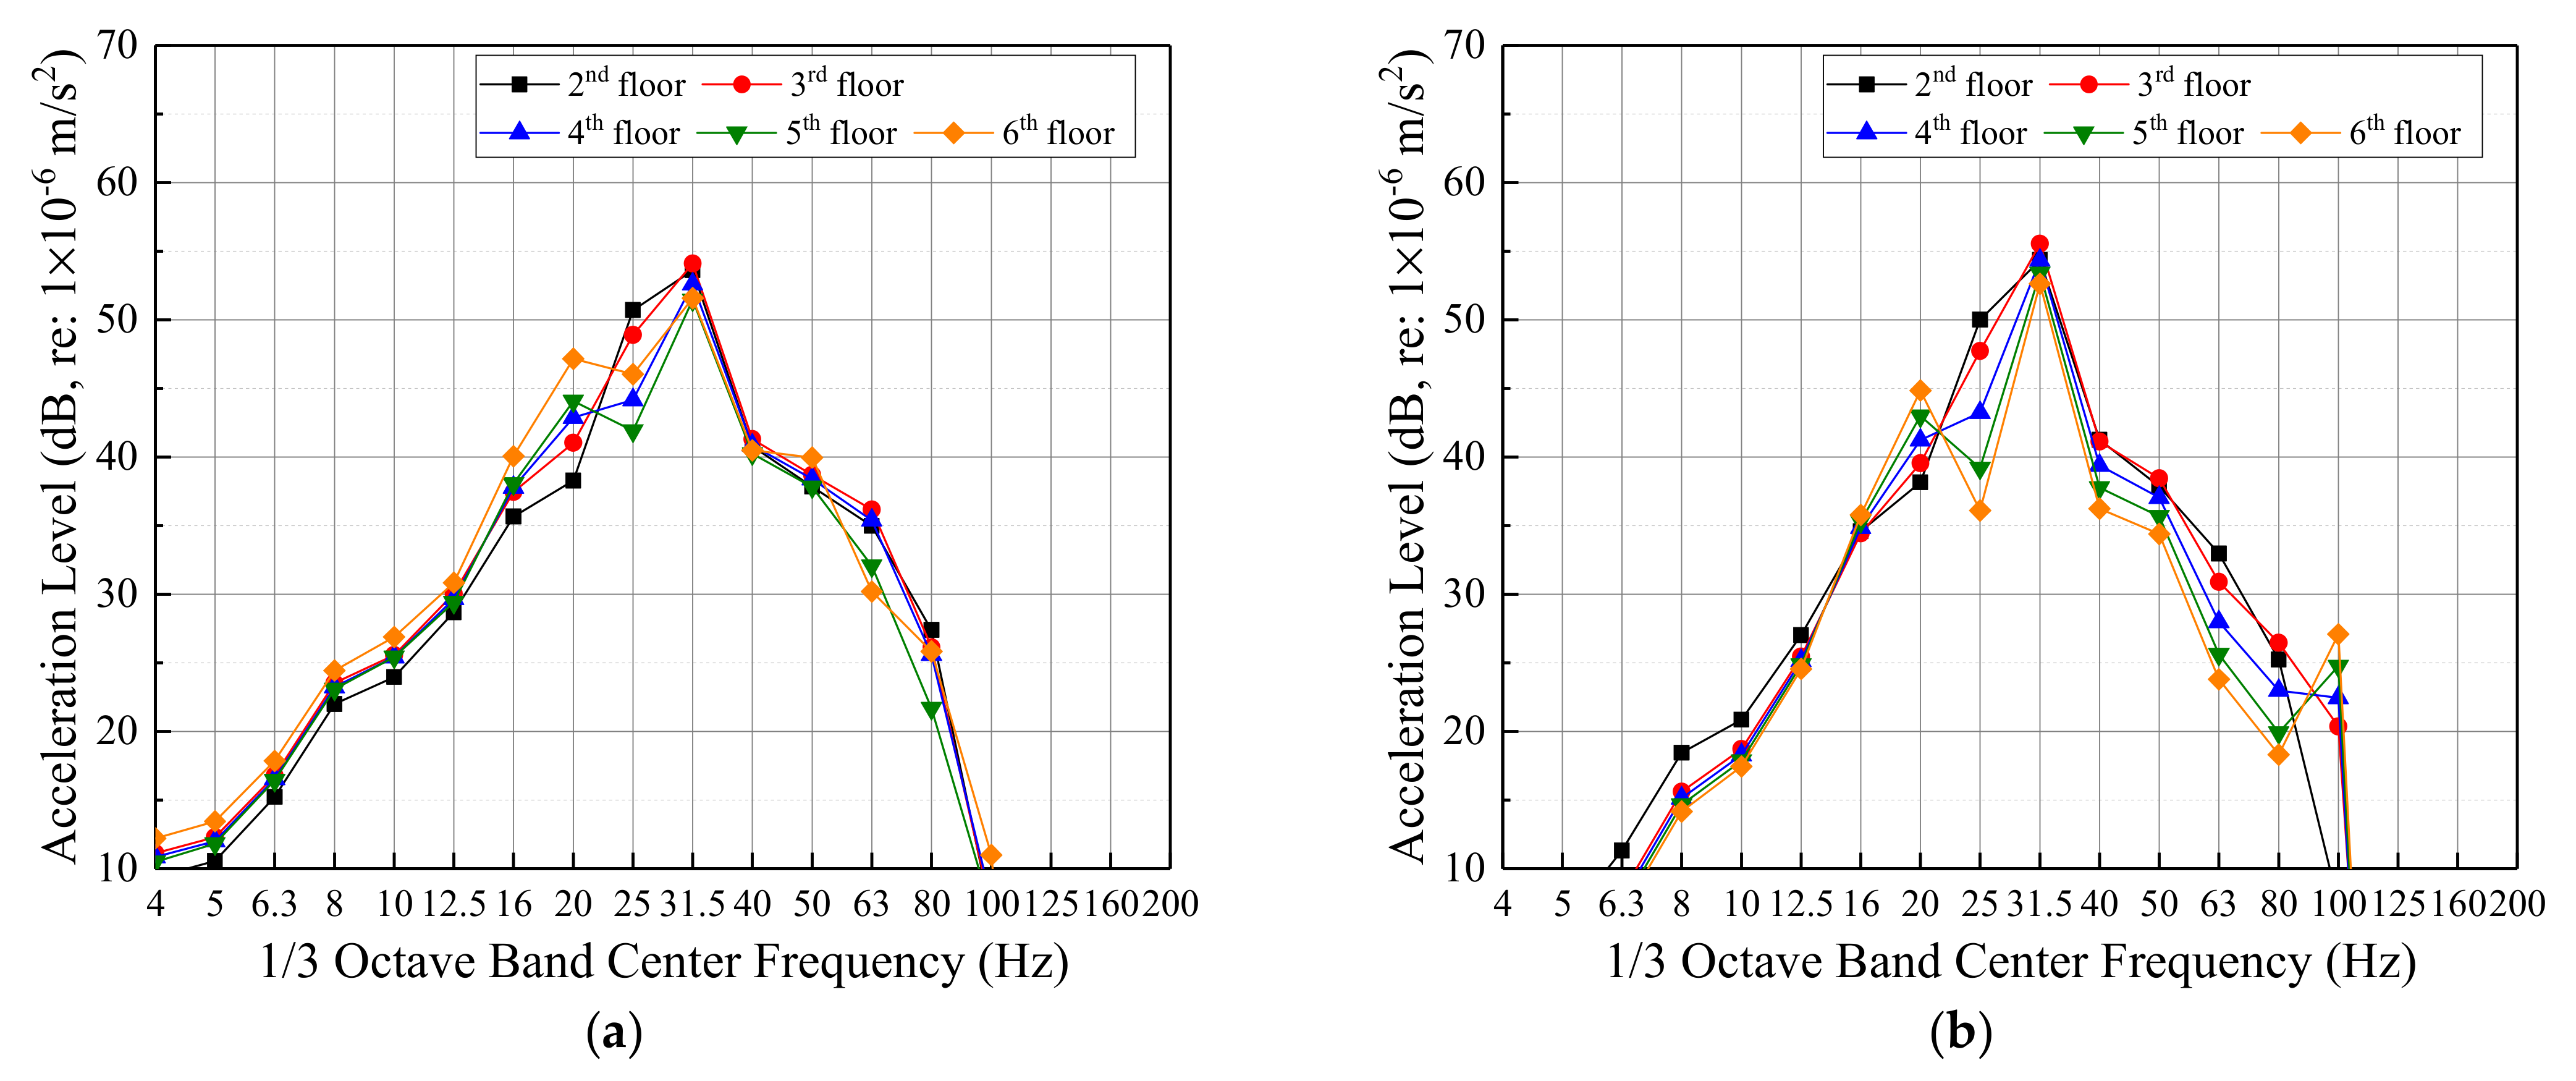
3.2. Vertical Vibration Levels on Different Floors in the First Stage Over-Track Building

3.2.1. Room Column

Figure 8 shows the vertical vibration transmission along the room column from the ground into the building. The averaged acceleration levels from four passbys on Track 1 and seven passbys on Track 2 were calculated and shown, respectively. Due to an instrumentation problem on the third floor, obtaining the P6 failed. As shown in Figure 7, Track 2 is 5.5 m closer to the first stage over-track building than Track 1. These two tracks are of the same design and construction but heading to different parking lines.
The building vibration levels caused by train passbys on Track 1 and Track 2 are comparable. The dominant frequency range of train-induced vibration is 8–80 Hz. Vibration transmission patterns along the room column caused by passbys on Track 1 and 2 are consistent. The vertical vibration amplified as the elevation increased from the ground to the first platform, which may have resulted from the structure’s stiffness changing. For upper building floors, the vibration reduction is minimal. Vibrations on the sixth floor were also amplified because of wave reflection from the roof.

3.2.2. Staircase Column

Figure 9 displays the vertical vibration transmission along the staircase column. The averaged acceleration level from five passbys on Track 1 and five passbys on Track 2 were calculated and shown, respectively. The dominant vibration frequencies are also 8–80 Hz.
Comparing Figure 8 and Figure 9, the general vibration transmission rule for the two columns is the same. Little vibration reduction was shown as the floor level increased, and the vibration was amplified at the top floor.

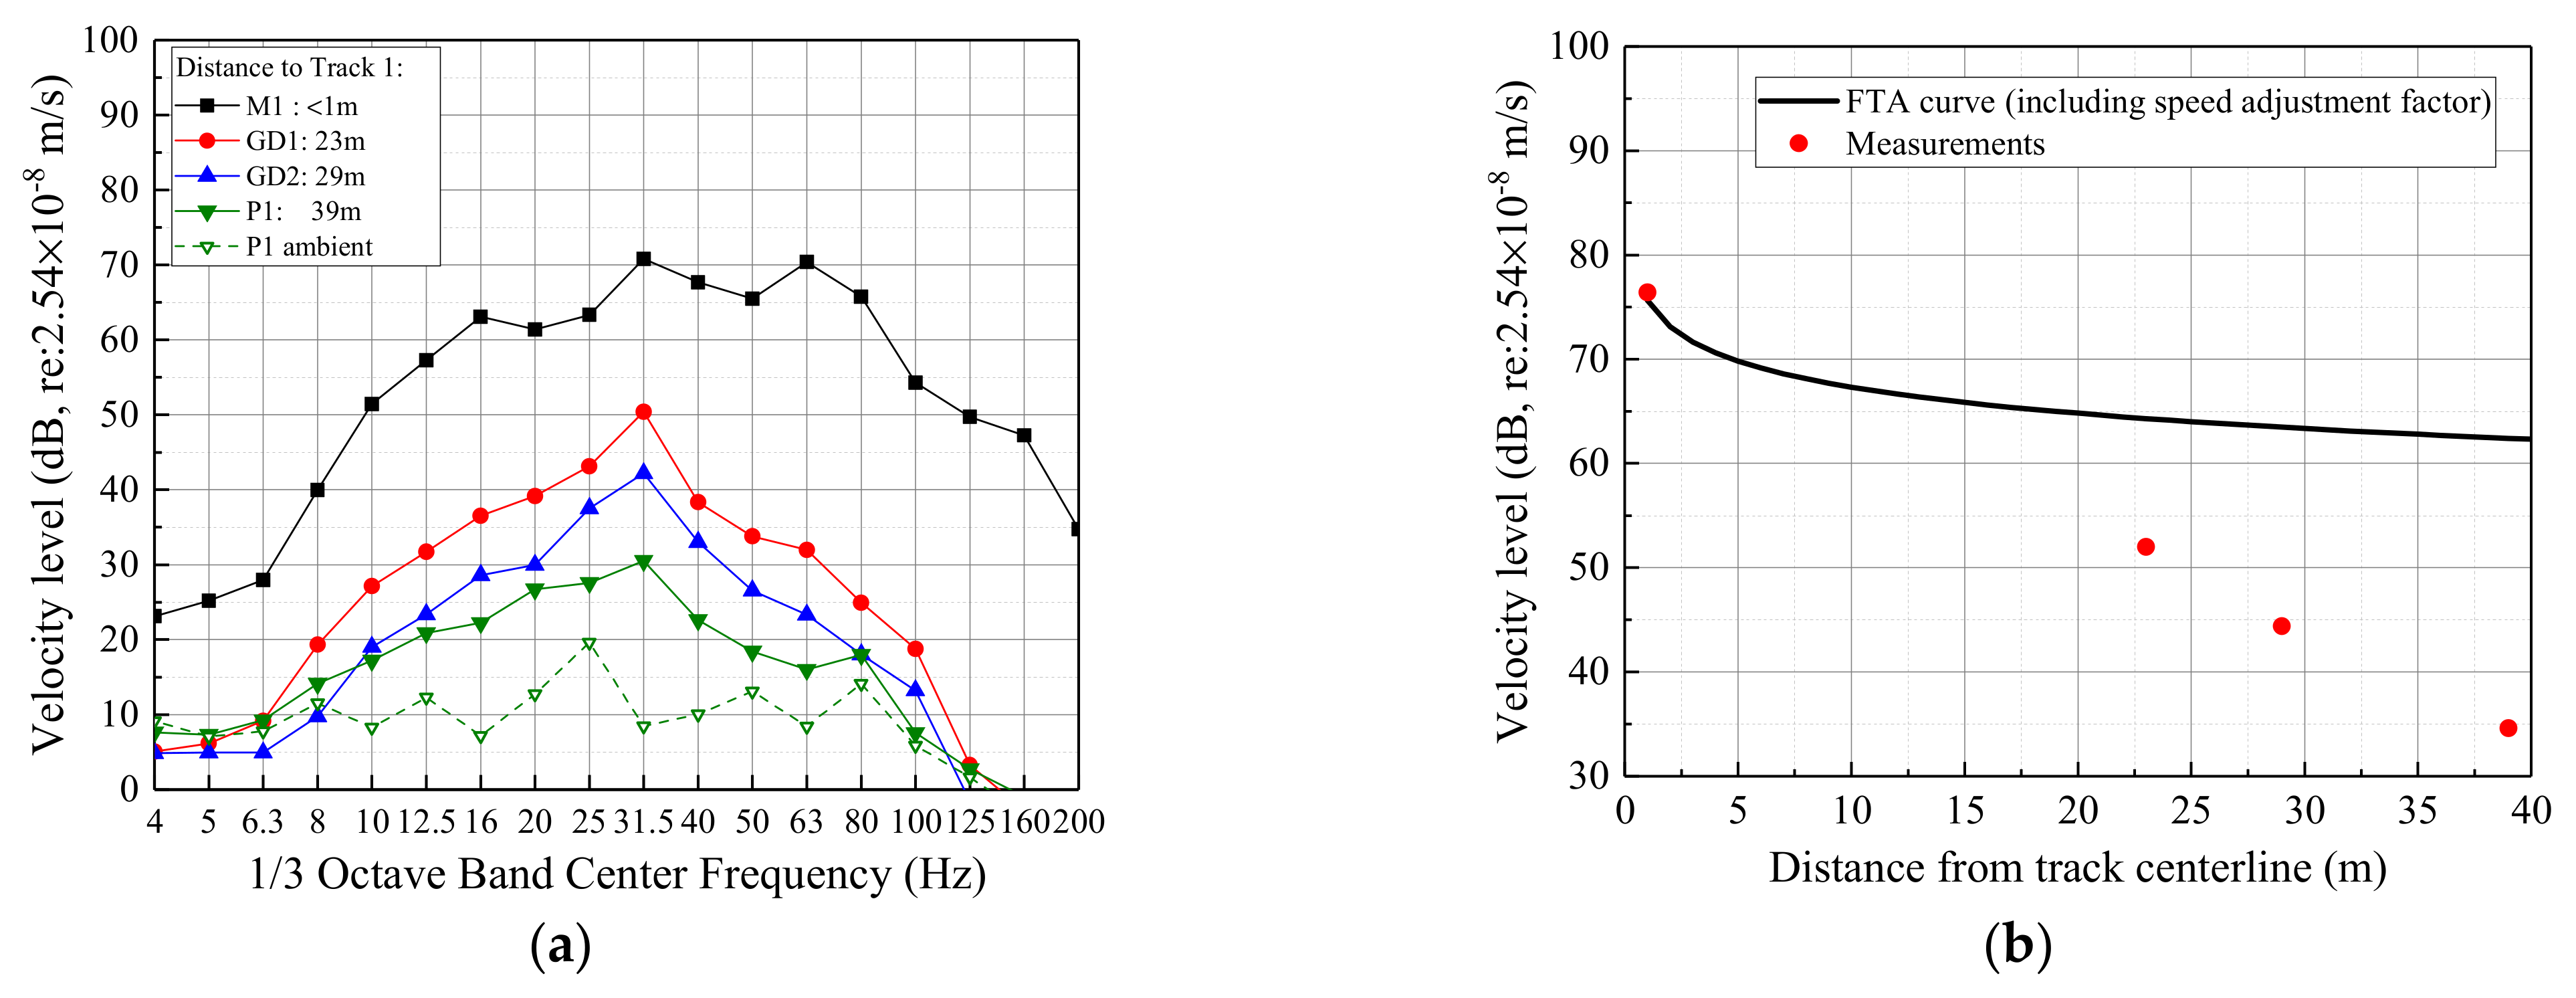
3.3. Ground Vibration Levels at Different Distances from the Track

According to FTA guidelines [41], the propagation of a basic curve for rapid transit or light rail vehicles is:
L v = 90.17 1.06 log D 2.32 log D 2 0.87 log D 3
where D is the distance to the track centerline, measured in m; L v is the velocity level, measured in dB. The speed adjustment factor is 20 log s p e e d r e f e r e n c e   s p e e d ; however, while the train speed used in this study is 15 km/h, the reference speed used by the FTA is 80 km/h. The FTA propagation curve with the added speed adjustment factor is shown in Figure 10b. Figure 10a shows the measured velocity levels at different distances from the Track 1 centerline. P1 was set on the ground floor within the building.
Although near-track measurements fit the FTA prediction well in Figure 10, far-field measurements are 12 dB, 19 dB, and 28 dB lower than the curve, respectively. The measurement at P1 is still 15 dB lower than the FTA curve even when adding an adjustment factor of −13 dB to account for coupling loss.

3.4. Different Vibration Transmissions from Ground to First Platfrom

Figure 11 shows the different vibration transmissions from the ground to the first platform between two setups. One is from M1 to M4, and the other is from P1 to P3. The distances between the Track 1 centerline and M1/P1 are 1 m and 39 m, respectively. P1 and P3 are under the first stage over-track building.
From Figure 11, the dominant frequencies of train-induced vibration at different locations on the first platform are different. For M4, which is just above tracks, the vibration could transmit directly into the platform through the ground columns. Its dominant frequency range is 4–200 Hz. The vibration amplitudes for P3, which is further away from the tracks horizontally, reduced more than 15 dB, and the dominant frequencies narrowed to 10–50 Hz.
When vibrations are transmitted from the ground at M1 to the first platform at M4, the vibrations are reduced by 5–25 dB at 25–200 Hz. Vibration components below 20 Hz were barely reduced. However, for vibrations transmitting from P1 to P3, the vibration is amplified by 6–8 dB. The different transmission pattern is related to different structural configurations.

4. Train-Induced Vibration Simulations and Predictions

The cascaded state-space model has been developed and validated and functions as a case study for the first stage over-track building. In order to save space, only Track 2 passbys are discussed in this section.

4.1. Model Versatility for Typical Floors

For the first stage over-track building, the third and sixth floors are standardized design. These floors are typical floors with the same construction materials, spans, column/floor structure dimensions, etc. Figure 12 and Figure 13 show the simulations and predictions of train-induced vibrations on the third floor over time and in a one-third octave band spectra, respectively.
As seen in Figure 8 and Figure 9, the dominant frequency range of train-induced vibration lies in the 8–80 Hz range. Thus, all measurements use a band-pass filter of 8–80 Hz for this section. The system order of the third floor state-space model was selected to be 29. Although the state-space model is a time–domain method, Figure 13 demonstrates that the vibration’s dominant frequency components are captured accurately, either for working passby simulation or for validation passby predictions.
In order to demonstrate the model’s versatility for typical floors, the third floor state-space model was applied to the fourth and fifth floors, using measurements at V7 and V8 as inputs, respectively. Figure 14 shows the comparison between the averaged measurement and prediction. In Figure 14a, the third floor state-space model is also effective for the fourth floor. However, when applying the third floor model to the fifth floor, the prediction accuracy was reduced though still acceptable. This is because the sixth floor is the top floor, and vibrations at V9 will normally amplify [13], which is consistent with the data in Figure 14b: the measurement was amplified and greater than predicted.

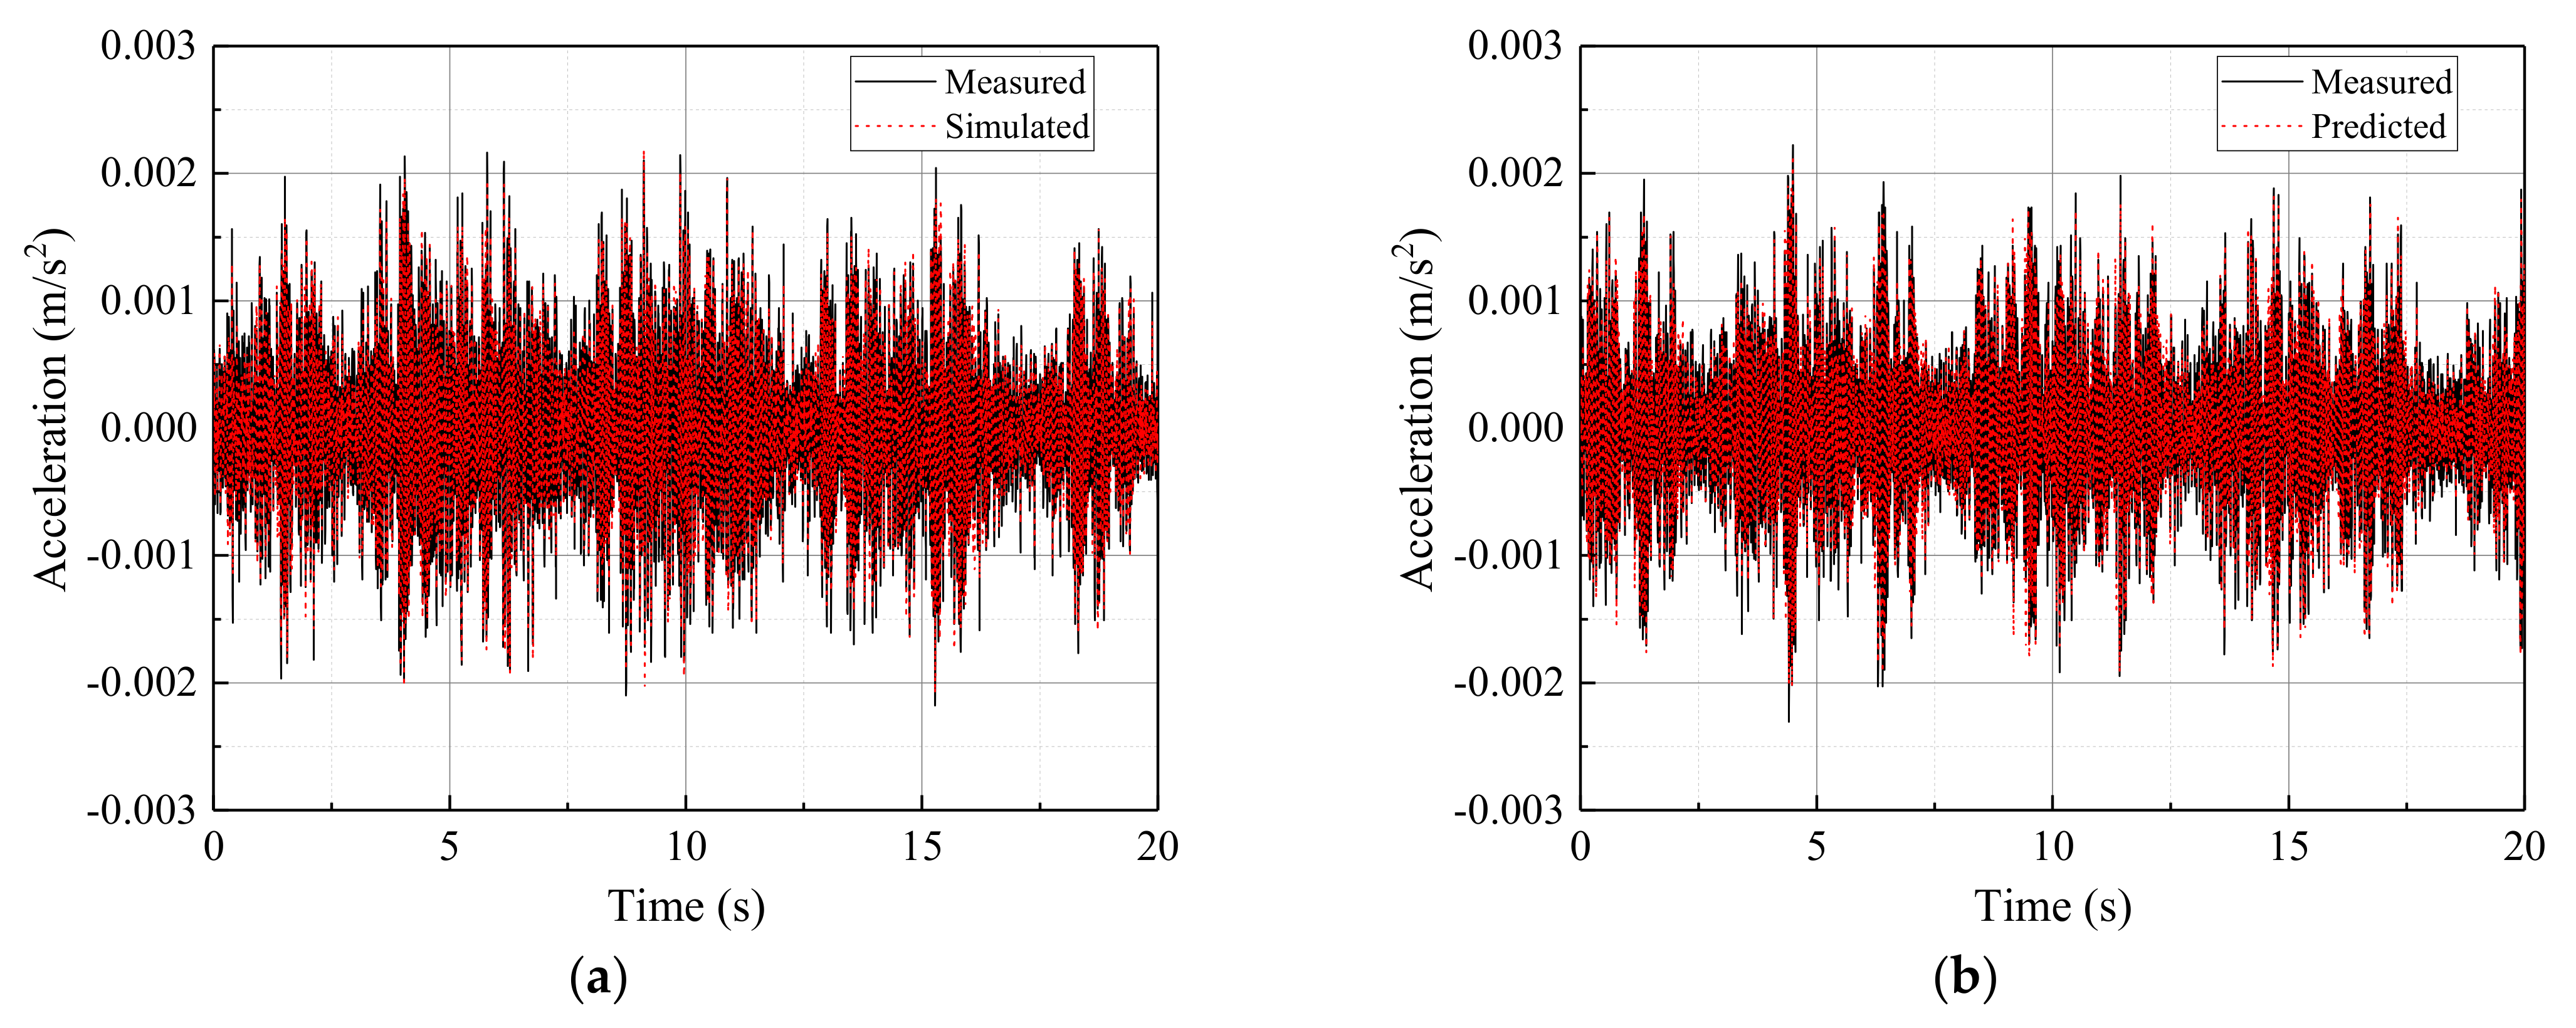
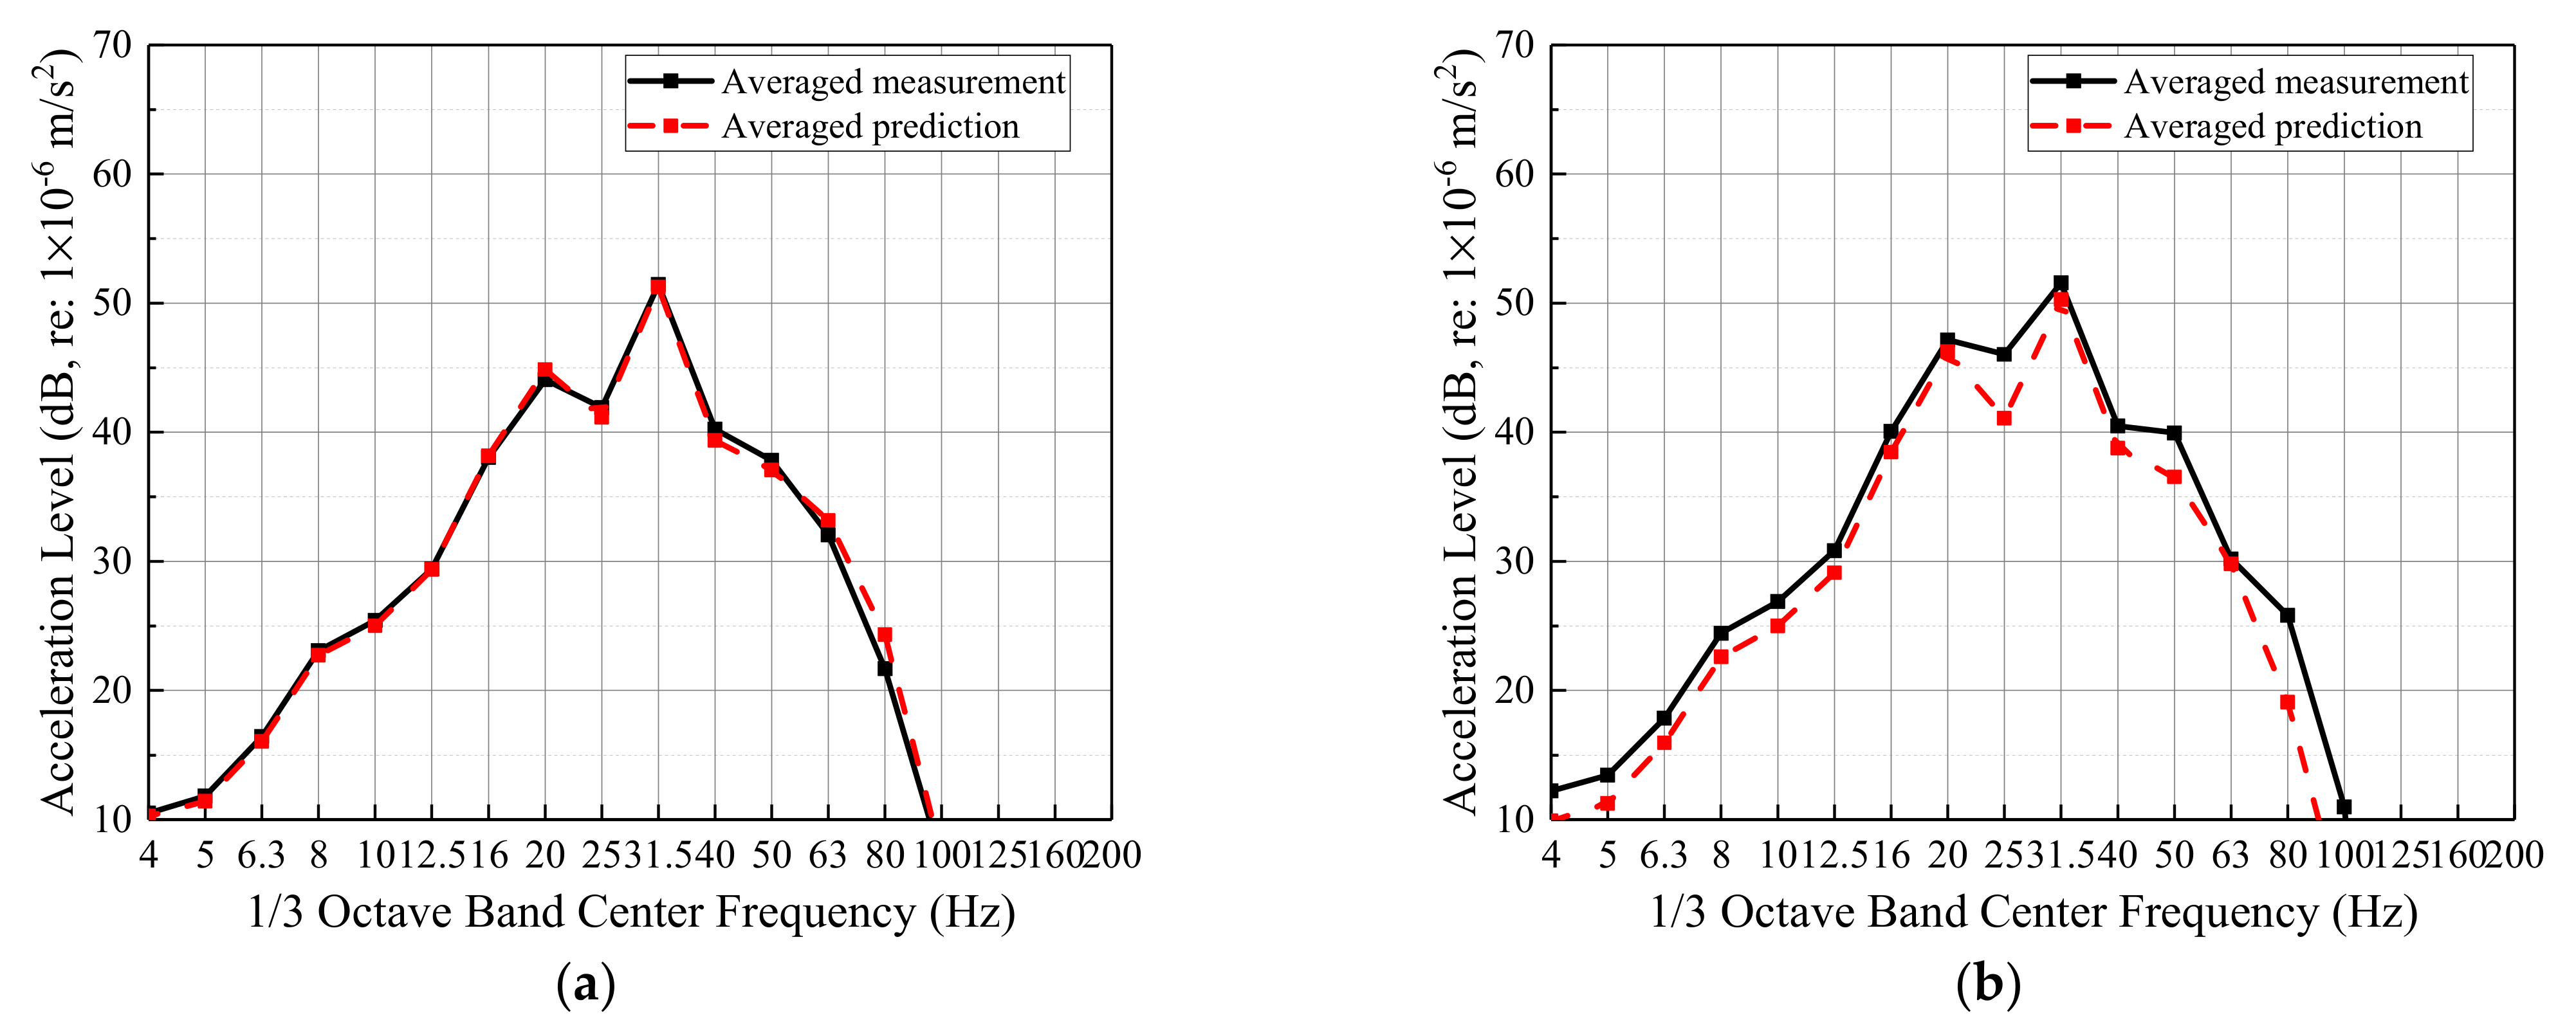
4.2. Cascaded State-Space Model Validation

According to the building drawings and analysis in Section 4.1, a cascaded state-space model can be generated by a series connecting two individual state-space models representing lower floors and typical floors, respectively. The predictions of one floor are used as inputs for the floor above.
The measurement pairs V4/V5 (first floor) and V6/V7 (third floor) are used to construct the lower floor and typical floor state-space models. Through comparison and selection, their system order was set at 26 and 29, respectively. Figure 15 shows the comparison of floor-to-floor vibration transmission between 8–80 Hz band-pass filtered measurements and cascaded state-space model predictions. This demonstrates that the cascaded state-space model is useful for predicting train-induced vibrations within a building.

4.3. Vibration Predictions for the Future Second Stage Over-Track Building

From measurements in this research and previous research [14], it was found that the vibration levels of the first and second platforms are comparable. Given this, the M4 measurements are used as the second platform input of the cascaded state-space model to predict vibration responses within the future second stage over-track building, assuming it is constructed similarly to the first stage over-track building. Figure 16 shows the floor-to-floor vibration transmission predicted by the cascaded state-space model. In order to compare the predictions with the Chinese standard limit [40] (a nighttime limit of 67 dB), the acceleration levels in Figure 16 were frequency weighted. As predicted, the train-induced maximum frequency-weighted acceleration level is quite close to the Chinese nighttime limit. Since vibrations in the center of the floor are higher than near the column bases [14], train-induced vibrations in the center of the floor of the future second stage over-track building have the potential to exceed the limit.

5. Modal Parameters Identification

The natural frequencies can be extracted from the estimated state-space matrices, [A] and [C] of the system, using Equation (4):
ω i = 1 Δ h ln λ i · ln λ i
where λ i are the eigenvalues of matrix [A]. λ i represents the conjugate complex number of λ i , and Δ h is the sampling time interval. ω i are the identified natural frequencies of the system measured in rad/s. This procedure is normally called modal parameter identification and uses a stabilization diagram for assistance.
In this section, the fourth floor room and staircase column’s natural frequencies were identified to understand the dynamic characteristic differences caused by structural appurtenances such as staircases. The natural frequency stabilization diagrams for the fourth floor column segments are shown in Figure 17. The system order ranges from 0 to 65 with an increment of 5. Structural modes with damping ratios of more than 3% were discarded.
For the room column, modes consistently appear at 26 Hz after a system order of 25. For the staircase column, modes consistently appear at 24 Hz and 32 Hz after a system order of 20. This means the system order of a typical floor state-space model in Section 4 is reasonably set as 29. Comparing the staircase column to the room column, the staircase column has more resonance frequencies, which may make its vibration responses more complex.

6. Discussion

6.1. Vibration Transmission within the First Stage Over-Track Building

The dominant train-induced vibration frequencies in the first stage over-track building are 8–80 Hz. Vibrations transmitted along columns into the building amplify in floors under the first platform and the top floor of the building, which may be attributed to stiffness changes and wave reflections, respectively.

6.2. Comparison between Measurements and FTA Guidelines

Figure 18 shows the floor-to-floor variation of the overall velocity levels within the first stage over-track building. Vibration amplifications of 2–4 dB/floor are shown under the first platform. The vibration levels of the first and second platforms are comparable. Vibration level differences among building floors above the second platform (except the top floor) are small, especially for the staircase column measurements where vibration level differences are within 2 dB. Vibrations are amplified by around 2 dB on the top floor. The FTA guidelines for floor-to-floor changes in overall levels are −2 dB per floor for the first through fifth floors and −1 dB per floor for the fifth through tenth floors, which is significantly different from these measurements.
As seen in Figure 10b, comparing the measured ground vibration levels at different distances from the track centerline to the FTA propagation curve demonstrated that the FTA propagation curve effectively estimated vibration levels near the track but overestimated the vibration levels at 23–39 m away from the track’s centerline. The FTA propagation curve underestimates the vibration transmission loss when the distance to the track’s centerline increases.
Measurements in this research enriched the database regarding train-induced vibrations at metro depots with over-track buildings. Train-induced vibration predictions based on measurements in this study are more accurate than the FTA’s empirical guidelines, which, therefore, offers a significant reference for similar research at metro depots.

6.3. Selection of State-Space Model System Order

The system order is the only parameter when estimating a state-space model from input/output measurements. Selecting a proper system order requires plenty of trials. In general, the more complex the system, the greater the system order. The natural frequency stabilization diagram is a helpful tool if the selected system order is stabilized.

6.4. Significance of the Cascaded State-Space Model

Over-track buildings above a metro depot can be classified into two types according to their construction period and the relationship between their footprints and the tracks. The first stage over-track building is further away from the tracks and usually built synchronously with the platform structure. The second stage over-track building is just above the tracks and usually requires transfer girders at the platform level to transfer building loads.
A cascaded state-space model for the first stage over-track building was developed and validated using measured vibrations from the second platform as input. When applying this model to the future second stage over-track building, it is assumed the second stage building is constructed similarly to the first stage building. Using the measured vibrations of the platform as an input, the vibration predictions for the future second stage building above the input level can be obtained and assessed. Predicting vibrations before the construction of over-track buildings is of economic significance to determine whether vibration mitigation measures should be designed and considered in advance. The measurements and predictions in this paper can be referred to when developing future metro depots with over-track buildings made of similar concrete-framed structures. The results enriched the database for train-induced vibrations in concrete-framed over-track buildings at metro depots. Future applications and validations of over-track buildings of other structural types, such as shear wall supported buildings, need further field measurements.

7. Conclusions

This paper proposed a data-driven cascaded state-space model for predicting train-induced vibrations within over-track buildings at metro depts. The method has been successfully applied and validated based on field measurements from the Luogang metro depot in Guangzhou, China. The insights from this study will be useful for understanding vibration transmission within a first stage over-track building with concrete-frame columns:
(1)
The data-driven cascaded state-space model predicts train-induced structural vibration responses with reasonable accuracy. It provides a practical method to assess train-induced vibration impacts prior to construction when designing similar buildings at metro depots in the future.
(2)
The system order of the estimated state-space model is related to the structural system complexity. In general, the more complex the system, the greater the system order.
(3)
Considering over-track buildings’ different supporting methods, it is advisable to use the measured vibration levels from the second platform as the inputs to the cascaded state-space model, which avoids the added complexity of modeling the transfer behavior of the platform and expands the applicability of the model.
(4)
Vibration levels within the first stage over-track building were amplified by 2–4 dB/floor from the first platform and barely reduced from one floor to the floor above. The FTA guidelines overestimate the vibration transmission loss within buildings.
(5)
The FTA propagation curve for rapid transit and light rail vehicles effectively estimates vibration levels near the track. However, it underestimates the vibration transmission loss when the distance to the track’s centerline increases.

Author Contributions

Conceptualization, Z.T. and C.Z.; methodology, Z.T.; software, Z.H.; validation, Z.T.; formal analysis, G.W.; investigation, C.H.; resources, Z.Y.; data curation, Z.H.; writing—original draft preparation, Z.T.; writing—review and editing, C.Z.; visualization, Z.T.; supervision, C.Z.; project administration, C.Z.; funding acquisition, C.Z. All authors have read and agreed to the published version of the manuscript.

Funding

This research was funded by the National Natural Science Foundation of China, grant number 51908139, and the Guangdong Basic and Applied Basic Research Foundation, grant number 2021A1515012605. The APC was funded by the National Natural Science Foundation of China.

Institutional Review Board Statement

Not applicable.

Data Availability Statement

New data were created or analyzed in this research. Data will be shared upon request and consideration of the authors.

Conflicts of Interest

The authors declare no conflict of interest.

References

  1. Lin, D.; Nelson, J.D.; Beecroft, M.; Cui, J. An overview of recent developments in China’s metro systems. Tunn. Undergr. Space Technol. 2021, 111, 103783. [Google Scholar] [CrossRef]
  2. Tao, Z.Y.; Zou, C.; Wang, Y.M.; Wu, J. Vibration transmissions and predictions within low-rise buildings above throat area in the metro depot. J. Vib. Control 2021, 10775463211057644. [Google Scholar] [CrossRef]
  3. Tao, Z.Y.; Wang, Y.M.; Zou, C.; Li, Q.; Luo, Y. Assessment of ventilation noise impact from metro depot with over-track platform structure on workers and nearby inhabitants. Environ. Sci. Pollut. Res. 2019, 26, 9203–9218. [Google Scholar] [CrossRef]
  4. Connolly, D.P.; Marecki, G.P.; Kouroussis, G.; Thalassinakis, I.; Woodward, P.K. The growth of railway ground vibration problems—A review. Sci. Total Environ. 2016, 568, 1276–1282. [Google Scholar] [CrossRef] [PubMed]
  5. Ma, M.; Jiang, B.; Gao, J.; Liu, W. Experimental study on attenuation zone of soil-periodic piles system. Earthq. Eng. Struct. Dyn. 2019, 126, 105738. [Google Scholar] [CrossRef]
  6. Kouroussis, G.; Conti, C.; Verlinden, O. Experimental study of ground vibrations induced by Brussels IC/IR trains in their neighborhood. Mech. Ind. 2013, 14, 99–105. [Google Scholar] [CrossRef]
  7. Connolly, D.P.; Kouroussis, G.; Woodward, P.K.; Costa, P.A.; Verlinden, O.; Forde, M.C. Field testing and analysis of high speed rail vibrations. Soil Dyn. Earthq. Eng. 2014, 67, 102–118. [Google Scholar] [CrossRef] [Green Version]
  8. Connolly, D.P.; Costa, P.A.; Kouroussis, G.; Galvin, P.; Woodward, P.K.; Laghrouche, O. Large scale international testing of railway ground vibrations across Europe. Soil Dyn. Earthq. Eng. 2015, 71, 1–12. [Google Scholar] [CrossRef] [Green Version]
  9. Xia, H.; Chen, J.; Wei, P.; Xia, C.; De Roeck, G.; Degrande, G. Experimental investigation of railway train-induced vibrations of surrounding ground and a nearby multi-story building. Earthq. Eng. Eng. Vib. 2009, 8, 137–148. [Google Scholar] [CrossRef]
  10. Sanayei, M.; Maurya, P.; Moore, J.A. Measurement of building foundation and ground-borne vibrations due to surface trains and subways. Eng. Struct. 2013, 53, 102–111. [Google Scholar] [CrossRef]
  11. Sanayei, M.; Moore, J.A.; Brett, C.R. Measurement and prediction of train-induced vibrations in a full-scale building. Eng. Struct. 2014, 77, 119–128. [Google Scholar] [CrossRef]
  12. Zou, C.; Wang, Y.M.; Wang, P.; Guo, J.X. Measurement of ground and nearby building vibration and noise induced by trains in a metro depot. Sci. Total Environ. 2015, 536, 761–773. [Google Scholar] [CrossRef] [PubMed]
  13. Zou, C.; Wang, Y.M.; Moore, J.A.; Sanayei, M. Train-induced field vibration measurements of ground and over-track buildings. Sci. Total Environ. 2017, 575, 1339–1351. [Google Scholar] [CrossRef]
  14. Tao, Z.Y.; Wang, Y.M.; Sanayei, M.; Moore, J.A.; Zou, C. Experimental study of train-induced vibration in over-track buildings in a metro depot. Eng. Struct. 2019, 198, 109473. [Google Scholar] [CrossRef]
  15. Cao, Z.L.; Guo, T.; Zhang, Z.Q.; Li, A.Q. Measurement and analysis of vibrations in a residential building constructed on an elevated metro depot. Measurement 2018, 125, 394–405. [Google Scholar] [CrossRef]
  16. He, W.; Zou, C.; Pang, Y.; Wang, X. Environmental noise and vibration characteristics of rubber-spring floating slab track. Environ. Sci. Pollut. Res. 2021, 28, 13671–13689. [Google Scholar] [CrossRef]
  17. Verbraken, H.; Lombaert, G.; Degrande, G. Verification of an empirical prediction method for railway induced vibrations by means of numerical simulations. J. Sound Vib. 2011, 330, 1692–1703. [Google Scholar] [CrossRef]
  18. Zhai, W.M.; Wang, K.Y.; Cai, C.B. Fundamentals of vehicle–track coupled dynamics. Veh. Syst. Dyn. 2009, 47, 1349–1376. [Google Scholar] [CrossRef]
  19. Yang, J.J.; Zhu, S.Y.; Zhai, W.M.; Kouroussis, G.; Wang, Y.; Wang, K.Y.; Lan, K.; Xu, F.Z. Prediction and mitigation of train-induced vibrations of large-scale building constructed on subway tunnel. Sci. Total Environ. 2019, 668, 485–499. [Google Scholar] [CrossRef]
  20. Jin, H.; Tian, Q.; Li, Z.; Wang, Z. Ability of vibration control using rubberized concrete for tunnel invert-filling. Constr. Build. Mater. 2022, 317, 125932. [Google Scholar] [CrossRef]
  21. Lopes, P.; Costa, P.A.; Ferraz, M.; Calçada, R.; Cardoso, A.S. Numerical modeling of vibrations induced by railway traffic in tunnels: From the source to the nearby buildings. Soil Dyn. Earthq. Eng. 2014, 61–62, 269–285. [Google Scholar] [CrossRef]
  22. Xia, H.; Zhang, N.; Cao, Y.M. Experimental study of train-induced vibrations of environments and buildings. J. Sound Vib. 2005, 280, 1017–1029. [Google Scholar] [CrossRef]
  23. Kuo, K.A.; Papadopoulos, M.; Lombaert, G.; Degrande, G. The coupling loss of a building subject to railway induced vibrations: Numerical modelling and experimental measurements. J. Sound Vib. 2019, 442, 459–481. [Google Scholar] [CrossRef]
  24. Xu, L.; Ma, M.; Cao, R.; Tan, X.; Liang, R. Effect of longitudinally varying characteristics of soil on metro train-induced ground vibrations based on wave propagation analysis. Soil Dyn. Earthq. Eng. 2022, 152, 107020. [Google Scholar] [CrossRef]
  25. François, S.; Schevenels, M.; Galvín, P.; Lombaert, G.; Degrande, G. A 2.5 D coupled FE–BE methodology for the dynamic interaction between longitudinally invariant structures and a layered halfspace. Comput. Methods Appl. Mech. Eng. 2010, 199, 1536–1548. [Google Scholar] [CrossRef]
  26. Liang, X.; Yang, Y.B.; Ge, P.; Hung, H.H.; Wu, Y. On computation of soil vibrations due to moving train loads by 2.5 D approach. Soil Dyn. Earthq. Eng. 2017, 101, 204–208. [Google Scholar] [CrossRef]
  27. Katou, M.; Matsuoka, T.; Yoshioka, O.; Sanada, Y.; Miyoshi, T. Numerical simulation study of ground vibrations using forces from wheels of a running high-speed train. J. Sound Vib. 2008, 318, 830–849. [Google Scholar] [CrossRef]
  28. Sanayei, M.; Zhao, N.; Maurya, P.; Moore, J.A.; Zapfe, J.A.; Hines, E.M. Prediction and mitigation of building floor vibrations using a blocking floor. J. Struct. Eng. 2012, 138, 1181–1192. [Google Scholar] [CrossRef]
  29. Zou, C.; Moore, J.A.; Sanayei, M.; Wang, Y.M.; Tao, Z.Y. Efficient impedance model for the estimation of train-induced vibrations in over-track buildings. J. Vib. Control 2020, 27, 924–942. [Google Scholar] [CrossRef]
  30. Zou, C.; Moore, J.A.; Sanayei, M.; Wang, Y.M. Impedance model for estimating train-induced building vibrations. Eng. Struct. 2018, 172, 739–750. [Google Scholar] [CrossRef]
  31. Richart, F.E.; Hall, J.R.; Wood, R.D. Vibrations of Soils and Foundations; Prentice Hall: Englewood Cliffs, NJ, USA, 1970. [Google Scholar]
  32. Kim, J.; Lynch, J.P. Subspace system identification of support excited structures—Part I: Theory and black-box system identification. Earthq. Eng. Struct. Dyn. 2012, 41, 2235–2251. [Google Scholar] [CrossRef] [Green Version]
  33. Verhaegen, M. Identification of the deterministic part of MIMO state-space models given in innovations form from input-output data. Automatica 1994, 30, 61–74. [Google Scholar] [CrossRef]
  34. Viberg, M. Subspace-based methods for the identification of linear time-invariant systems. Automatica 1995, 31, 1835–1851. [Google Scholar] [CrossRef]
  35. Ho, B.L.; Kalman, R.E. Effective construction of linear state-variable models from input-output functions. Regelungtechnik 1965, 12, 545–548. [Google Scholar]
  36. Peeters, B.; Ventura, C.E. Comparative study of modal analysis techniques for bridge dynamic characteristics. Mech. Syst. Signal Process. 2003, 17, 965–988. [Google Scholar] [CrossRef]
  37. Van Overschee, P.; De Moor, B. N4SID: Subspace algorithms for the identification of combined deterministic-stochastic systems. Automatica 1994, 30, 75–93. [Google Scholar] [CrossRef]
  38. Van Overschee, P.; De Moor, B. Subspace algorithm for the stochastic identification problem. Automatica 1993, 29, 649–660. [Google Scholar] [CrossRef]
  39. Viberg, M.; Ottersten, B.; Wahlberg, B.; Ljung, L. Performance of Subspace-Based System Identification Methods. In Proceedings of the 12th Federation of Automatic Control Symposium System Identification (IFAC SYSID), Sydney, Australia, 18–23 July 1993. [Google Scholar]
  40. JGJ/T 170-2009; Standard for Limit and Measuring Method of Building Vibration and Secondary Noise Caused by Urban Rail Transit. Ministry of Housing and Urban-Rural Development of the People’s Republic of China: Beijing, China, 2009.
  41. Federal Transit Administration. Transit Noise and Vibration Impact Assessment Manual; U.S. Department of Transportation: Washington, DC, USA, 2018.
Figure 1. Two-stage construction strategy.
Buildings 12 00114 g001
Figure 2. Paper organization diagram.
Buildings 12 00114 g002
Figure 3. Schematic diagram of individual and cascaded structural systems: (a) Individual SISO system; (b) Cascaded structural system.
Buildings 12 00114 g003
Figure 4. Flow chart of developing individual state-space model.
Buildings 12 00114 g004
Figure 5. Plan view of the Luogang depot.
Buildings 12 00114 g005
Figure 6. Entrance/exit tracks and first platform structure.
Buildings 12 00114 g006
Figure 7. Measurement setup: (a) Building profile along the tracks; (b) Building profile perpendicular to the tracks.
Buildings 12 00114 g007
Figure 8. Vertical vibration transmission along the working column: (a) Track 1; (b) Track 2.
Buildings 12 00114 g008
Figure 9. Vertical vibration transmission along the validation column: (a) Track 1; (b) Track 2.
Buildings 12 00114 g009
Figure 10. Vibration variation with distance comparison between measurements and FTA: (a) Measured vibration variation with distance; (b) Comparison between measurements and FTA.
Buildings 12 00114 g010
Figure 11. Different vibration transmissions from ground to first platform: (a) Track 1; (b) Track 2.
Buildings 12 00114 g011
Figure 12. Third floor model: time comparison: (a) Working passby; (b) Validation passby.
Buildings 12 00114 g012
Figure 13. Third floor model: 1/3 octave band spectra comparison: (a) Working passby; (b) Validation passby.
Buildings 12 00114 g013
Figure 14. Demonstration of model versatility for typical floors: (a) Applying sixth floor model to seventh floor; (b) applying sixth floor model to eighth floor.
Buildings 12 00114 g014
Figure 15. Comparison of filtered measurements and cascaded state-space model predictions: (a) 8–80 Hz band-pass filtered measurements; (b) cascaded state-space model predictions.
Buildings 12 00114 g015
Figure 16. Comparison of over-track building predictions and Chinese standard.
Buildings 12 00114 g016
Figure 17. Natural frequency stabilization diagrams: (a) Room column; (b) Staircase column.
Buildings 12 00114 g017
Figure 18. Floor-to-floor variation of overall velocity levels: (a) Track 1; (b) Track 2.
Buildings 12 00114 g018
Table 1. Structural parameters of the two measured columns.
LevelLength (m)Cross Area (m2)Young’s Modulus (GPa)Density
(kg/m3)
Floor Thickness (m)
Ground–Mezzanine4.450.6436.02440--
Mezzanine–1st platform4.435.524300.12
1st platform–2nd platform5.534.524200.15
2nd platform–2nd floor5.9533.524100.25
2nd floor–3rd floor3.632.524000.12
Upper floors3.631.523900.12
Publisher’s Note: MDPI stays neutral with regard to jurisdictional claims in published maps and institutional affiliations.

