Article

Utilization of Polyurethane Foam Dust in Development of Thermal Insulation Composite

Chemical and Petroleum Engineering Department, United Arab Emirates University, Al-Ain P.O. Box 15551, United Arab Emirates
*
Author to whom correspondence should be addressed.
Buildings 2022, 12(2), 126; https://doi.org/10.3390/buildings12020126
Submission received: 21 December 2021 / Revised: 24 January 2022 / Accepted: 24 January 2022 / Published: 26 January 2022
(This article belongs to the Section Building Materials, and Repair & Renovation)

Abstract

:
The massive production of Polyurethane foam from various products generates an extensive amount of waste, mostly in the form of dust that is emitted while cutting, trimming, or grinding the foam. In this research, the polyurethane dust (PUD) waste is incorporated into unsaturated polyester resin (UPR) to fabricate a heat insulation composite material to be used in construction. Filler percentages ranging from 10% to 50% were used to make the UPR-PUD composite materials. The thermal and mechanical properties of the material were studied in order to evaluate the ability of the composites for this type of application. Thermogravimetric Analysis and Differential Scanning Calorimeter tests were applied to determine the thermal stability of the material. In addition, the microstructure of the prepared composites and the incorporation of PUD filler into the polyester matrix were investigated by Scanning Electron Microscopy, X-ray diffraction (XRD), and Fourier-transform infrared spectroscopy (FTIR) analysis. The FTIR and XRD analyses suggested that adding PUD improved the curing process of unsaturated polyester and enhanced its crystalline structure. The experimental results showed promising thermal insulation capability, with low thermal conductivity in the range of 0.076 to 0.10 W / m · K and low water retention. Moreover, the composites exhibited compression strength between 56 and 100 MPa and tensile strength between 10.3 and 28 MPa, much higher than traditional thermal insulators and many building materials.

1. Introduction

Polyurethanes (PUs) are polymeric materials with a vast range of types and applications due to their characterization and properties. It was first developed by the German professor Otto Bayer in 1947 [1]. These types include rigid polyurethane foams, flexible polyurethane foams, and thermoplastic polyurethanes [2]. Each of these types has several applications and usages. For example, rigid polyurethane is used for thermal and noise insulation. Flexible polyurethane is used in packaging, interior parts of cars, and furniture. Thermoplastic polyurethane is used extensively in electronic parts, sports tools and medical devices [2]. Moreover, a very common usage for polyurethane and its subclasses is in coating applications [3]. The coating classifications of polyurethanes include moisture-cured PU-urea, PU-imide, and waterborne PU, all of which are heavily used in construction and automotive coatings [3].
The global demand for polyurethane products rose to about 22 million tons in 2020, making it the sixth most used polymer in the world [4]. Rigid PU foam is the most consumed type of PU product. In China, PU foam represents 60% of total PU production [5]. Flexible polyurethane foam accounts for about 30 percent of the entire North American polyurethane market, and is largely used for bedding, furniture and in the automotive industry. Rigid polyurethane foams have relatively low density, good mechanical behavior, low thermal conductivity, and show good resistant to weather conditions [6]. Nevertheless, 15% of total produced rigid PU foam becomes waste. In 2011, 675,000 tons out of the 7.5 million tons of rigid PU foam produced were dumped as waste [5]. Polymer waste is a major issue, as 93% of the 34 million tons of plastic generated annually worldwide is disposed of in landfills and oceans [7].
The first type of waste generated during the fabrication process, whether for polymers or any other material, is Post-Industrial waste (PI). This results from the different production processes such as injection molding, cutting, and grinding [8]. An advantage in dealing with this waste is that its composition is known, as it did not engage in any form of chemical reaction that could change its structure. Moreover, it is not contaminated by any other material, which ensures its purity [8].
A common method of PU foam manipulation is shaping through sanding or grinding. This process generates large amounts of PU dust [9]. The generated dust represents a potential respiratory and combustible hazard [10].
Because of its very resistant and strong urethane bonding, polyurethane is commonly employed in long-term applications. However, because of its widespread use, PU remains a solid waste stream in the environment, mostly in the form of abandoned consumer and industrial products [11]. The protection of our environment has received a great deal of attention in recent years. Both industry and households generate a lot of waste, which is linked to the deterioration of our environment, and significant efforts are being made to reuse, recycle, and decrease such waste [12].
Although chemical (hydrolysis, glycolysis, alcoholics) and thermal–chemical (pyrolysis, gasification) polyurethane recycling processes have been established, they are still evolving [13], and it is very difficult to apply them in all types of PU waste recycling. The high cost and investment risks of recycling are one explanation for this difficulty. Furthermore, the foregoing technologies must successfully be used in practice; any type of product arising from these facilities’ recycling technologies must satisfactorily mimic the distinctive qualities of polyurethane [14]. The main recycling route that does exist for thermosets is to grind down moldings to a fine powder and use it as filler in new molding compounds. Physical recycling methods, due to their simple operation and relatively active application, are an effective means in the short term. Therefore, utilization of UP dust in composite manufacturing can be a practical solution in thermoset waste recycling. The presence of UP waste in very small sizes, such as dust, facilitates this recycling option [15].
Untreated banana fiber and fiber treated with maleic anhydride were combined with waste polyurethane foam by El-Meligy et al. [16] to produce composites. Treated banana fiber reduced swelling and improved strength and dielectric properties. Wood waste and polyols derived from chemically recycled poly(ethylene terephthalate) (PET) and commercial polyols were used to make polyurethane/wood-based composites [17]. FTIR and SEM studies revealed that the wood adhered to the polymer matrix. This was corroborated by the composites’ relative Young’s modulus and relative tensile strength, suggesting effective load transfer from the matrix to the dispersion phase. There was no discernible improvement in the composites’ thermal stability.
Several polyurethane and natural fiber hybrid composites were produced by Otto et al. [18]. Composites were fabricated by replacing up to 20% w/w of the polyethylene glycol present in conventional polyurethane foams with a mixture of one of three natural fibers: sugarcane bagasse, sisal, and rice husk. Hybrid composites with up to 32 percent resilience, 0.1 GPa elastic modulus, and 7.32 percent permanent deformation were obtained. Due to its demonstrated strong resilience and elastic modulus, the produced composite has significant potential for applications in shock absorption and cushioning materials.
The properties of plaster mortar compressed PU foam waste were studied by Santamaria Vicario et al. [19]. Porous and lighter mortars were made by using PU waste foam and showed improved resistance to water vapor permeability, although with lower mechanical strength. Nonetheless, appropriate mechanical strengths were reached, resulting in a novel material that meets construction industry criteria. In a recent study, PU foam waste from vehicle shredder residue was utilized in the manufacture of plywood [20]. The powdered PU waste was combined with polymeric diphenyl methane diisocyanate resin at various weight ratios (2.5–10%) and the plywood binder was tested. The addition of PU powder to the polymer resin boosted adhesive viscosity and efficiency; according to the findings, utilizing PU powder in plywood manufacture offers a promising technique for recycling PU foam waste while increasing or preserving plywood performance.
Calvo-Correas et al. [21] developed hybrid biobased polyurethane flexible foam composites with PU powder from surf industry waste as a filler and graphite or graphene residue as a reinforcement. The addition of PU powder at low concentrations did not significantly alter the final properties, while it did increase the capacity of the foams to retain the carbonaceous fillers. The addition of graphite and graphene had no effect on the compressive performance of the hybrid foams. Zhang et al. [22] investigated the modification of bitumen with a PU/UPR mixture. When compared to the pure UPR modified bituminous binder, the PU/UPR modified bituminous binder had greater tensile strength and low-temperature performance, and somewhat inferior high-temperature stability. Recently, the structure and insulation properties of flexible PU/waste tire rubber composite foams were investigated by Hejna et al. [23], who found that prepared composite foams showed similar insulation properties compared to the neat matrix.
Because PU is utilized for thermal insulation in its rigid state and has outstanding qualities, the goal of this research was to employ PU dust waste as a filler material in a polyester matrix in order to generate composite materials with improved construction and thermal insulation properties. The produced composites were then evaluated in terms of their structure, thermal, physical, and mechanical properties. Utilization of waste materials in thermal insulation development will reduce costs and protect the environment.

2. Materials and Methods

2.1. Materials

This work used unsaturated polyester resin (UPR) and Polyurethane dust (PUD) to form composite materials. The polyester used in synthesizing the composites in this research was obtained from Reichhold Inc., Dubai (United Arab Emirates). The polyester resin is known commercially as Polylite 721-800E, and has a styrene content of 44–46% and a viscosity of 280–330 mPa.s. Unsaturated polyester resins are widely used in construction applications; it was chosen in this work because of its ease of handling, low water absorption values, low cost, and rapid curing with no gases evolved. Moreover, it has relatively low thermal conductivity. To overcome the low degree of crosslinking in polyester, methyl ethyl ketone peroxide was added as a cross-linker. Polyurethane dust was supplied by a local company in Dubai (United Arab Emirates).

2.2. Composite Fabrication

Composite materials with different PU dust concentrations ranging from 0 vol.% to 50 vol.% were prepared. The specified amount of filler was added gradually to the polyester under mixing conditions for three minutes. For the curing process, methyl ethyl ketone peroxide was added as an initiator with a concentration of 3 vol.% under manual mixing for 30 min. All composite samples were prepared at room temperature and atmospheric pressure. The mixture of UPR-PUD was poured directly into stainless-steel molds, which were prepared in different sizes and shapes according to the sample test requirements. The interior surfaces of the molds were coated with paraffin wax and polyvinyl acetate to ensure easy release of the composites from the mold. The molds were placed inside the glass incubator hood and the composites were cured for 24 h, and removed from the mold when the crosslinking had reached a satisfactory level. More details on the composite fabrication process can be found in Abu-Jdayil et al. [24] and Adi et al. [25]. Figure 1 shows the different shapes of the prepared composites. The following format was used to label the developed composites: <volume content of the filler> <name of the filler>. For example, “30-PUD sample” means a composite that contains 30 vol.% of PUD.

2.3. Composite Characterization and Testing

2.3.1. Scanning Electron Microscopy (SEM)

The morphology of the composite samples was investigated by scanning electron microscopy (SEM) provided by NeoScope, JEOL USA, Inc., Peabody, MA, USA. The obtained microphotographs show the arrangement of the PUD particles and the morphology of the neat polyester and UPR-PUD composites. The samples were mounted on aluminum stubs and coated with a gold layer to avoid electrostatic charges and ensure the maximum magnification of the textural and morphological characteristics of the composite sample. The micrograph SEM images were taken at resolutions of (10, 50, 100) µm for all composite samples.

2.3.2. Fourier-Transform Infrared Spectroscopy (FTIR)

FTIR spectroscopy was used to determine the functional groups present in the fabricated composite materials and whether a chemical reaction occurred due to the addition of the filler. This test was carried out with a Thermo Nicolet-Nexus 470 device, GMI, Ramsey, MN, USA. The filler was pelletized using 200 mg of potassium bromide with pure polyester; the UPR-PUD composites were scanned in a wavenumber between 500 to 4000 cm 1 at a resolution of 4 cm 1 .

2.3.3. X-ray Diffraction (XRD)

The crystallinity of the samples was determined using the X-ray diffraction method, which involves uniform x-ray exposure. The angle at which the peak occurs and how intense it is specifies which type of crystallinity is present. The test was performed using an Xpert3 X-ray diffractometer, Malvern Panalytical Ltd., Malvern, UK. The XRD data were taken throughout a diffraction angle (2θ) with range 5° ≤ 2θ ≤ 70° for the samples in powder form.

2.3.4. Bulk Density

The bulk density of the UPR-PUD composites was determined using cylindrical specimens with a diameter of 25 mm and a length of 60 mm. Bulk density is defined as total mass per unit volume. Each sample was weighed to an accuracy of 0.1 mg using an analytical balance, with the average of triplicate samples presented.

2.3.5. Thermal Conductivity Test

The thermal conductivity of the fabricated composites was measured using a Laser Comp heat flow meter instrument as thermal conductivity testing equipment. The test was carried out in accordance with ASTM C1045-19 (Standard Practice for Calculating Thermal Transmission Properties under Steady-State Conditions, STANDARD by ASTM International, 4 January 2019). Specimens with dimensions of 110 mm × 110 mm × 6 mm were prepared based on the standard size required by the equipment. A temperature gradient was produced over the thickness of the material by sandwiching samples between two plates in the test stack (closed chamber). Thermal conductivity is determined directly from the proportionality between heat flow and an applied temperature difference using steady-state methods (Fourier Law). When the thermal state of a tested material reaches total equilibrium, the steady-state approach records a measurement. When the temperature of the specimen remains consistent and does not change over time, it is said to be in a steady state. The thermal conductivity of composites ( k ) were measured in triplicate at 25 °C, and the average value is presented.

2.3.6. Differential Scanning Calorimeter (DSC)

The specific heat capacity ( C p ), the glass transition temperature ( T g ) and the curing temperature of UPR-PUD composites with different filler concentrations was measured using Differential Scanning Calorimetry (DSC 25) from TA Instruments, New Castle, DE, USA. The weight of the tested samples was between 6–8 mg. The measurements were performed in three stages: in the first heating cycle, the sample was heated from room temperature to 200 °C at a rate of 10 °C/min and then equilibrated at 200 °C for 2 min. Next, the sample was cooled down to 25 °C at the same rate (10 °C/min) and maintained for 2 min. The samples were then heated for a second time at a rate of 10 °C/min from 25 °C to 200 °C. The test was carried out with a nitrogen flow rate of 50 mL/min.

2.3.7. Thermal Gravity Analysis (TGA)

The TGA test provides definitive data for material and product design and aging stability information with short test times. This technique is effective in studying chemical and physical phenomena as a function of temperature, as it measures the weight change versus temperature. This test was carried out using a thermal gravimetric analyzer (Q50 TGA) from TA instruments, New Castle, DE, USA. The mass of the tested samples was between 5–10 mg. The samples were heated from 30 to 800 °C at a rate of 10 °C/min and under a nitrogen atmosphere with a 20 mL/min flow rate.

2.3.8. Water Retention

Two water retention tests were performed on the cylindrical specimens of the UPR-PUD composites. The specimens were fully immersed in distillate water at room temperature, and the percentage of water absorption was measured by periodically weighing samples after removing them from the water and drying their surfaces. The same procedure was followed in the second test, where the composite specimens were placed in a hot water bath at 50 °C to observe the effect of temperature on the water retention.

2.3.9. Compressive and Tensile Strength Tests

The compressive strength test was carried out using the universal testing machine CTM300 provided by Zhejiang Chenxin Machine Equipments Co., Ltd., Shaoxing, China. The cylindrical samples in this test had dimensions of 60 mm in length and 25 mm in diameter. In the compression test, the specimens were held between two platforms of the machine and the load was applied over the 25 mm span of the sample at a constant strain rate. Tensile tests were conducted on the UPR-PUD composites using a Universal Testing Machine provided by Jinan Precision Testing Equipment Co., Ltd., Jinan, China. The samples tested were dog-bone shaped, with 20 mm nick height, 12 mm width, and 4 mm thickness. The modulus of elasticity was calculated as the slope of the initial linear portion (elastic region) of the stress–strain curve. An average of 3–5 tests was reported for each mechanical property.

3. Results and Discussion

3.1. Scanning Electron Microscopy (SEM) Analysis

The morphology of pure cured polyester, 10-PUD, 30-PUD and 50-PUD composites is presented in Figure 2. The SEM images showed a notable number of air voids in the dust-free polyester; see Figure 2a. Presence of voids inside the matrix leads to a reduction in thermal conductivity because the presence of voids inhibits the transmission of heat. Figure 2b presents the micrograph of a 10-PUD sample, which shows a lower number of voids compared to the neat polymer. Moreover, the 30-PDU composite’s micrograph displayed in Figure 2c shows fewer voids, indicating higher cross-linking/bonding between PU dust and the unsaturated polyester. This structure results in higher values of both thermal conductivity and mechanical strength, as will be discussed in the following sections. On the other hand, Figure 2d presents the micrograph of a 50-PUD sample, showing a surface with irregular voids and cracks that can be attributed to the high-volume fraction of filler compared to other composites. This reduces the mechanical strength, although it develops suitable insulation properties as well.

3.2. FTIR Analysis

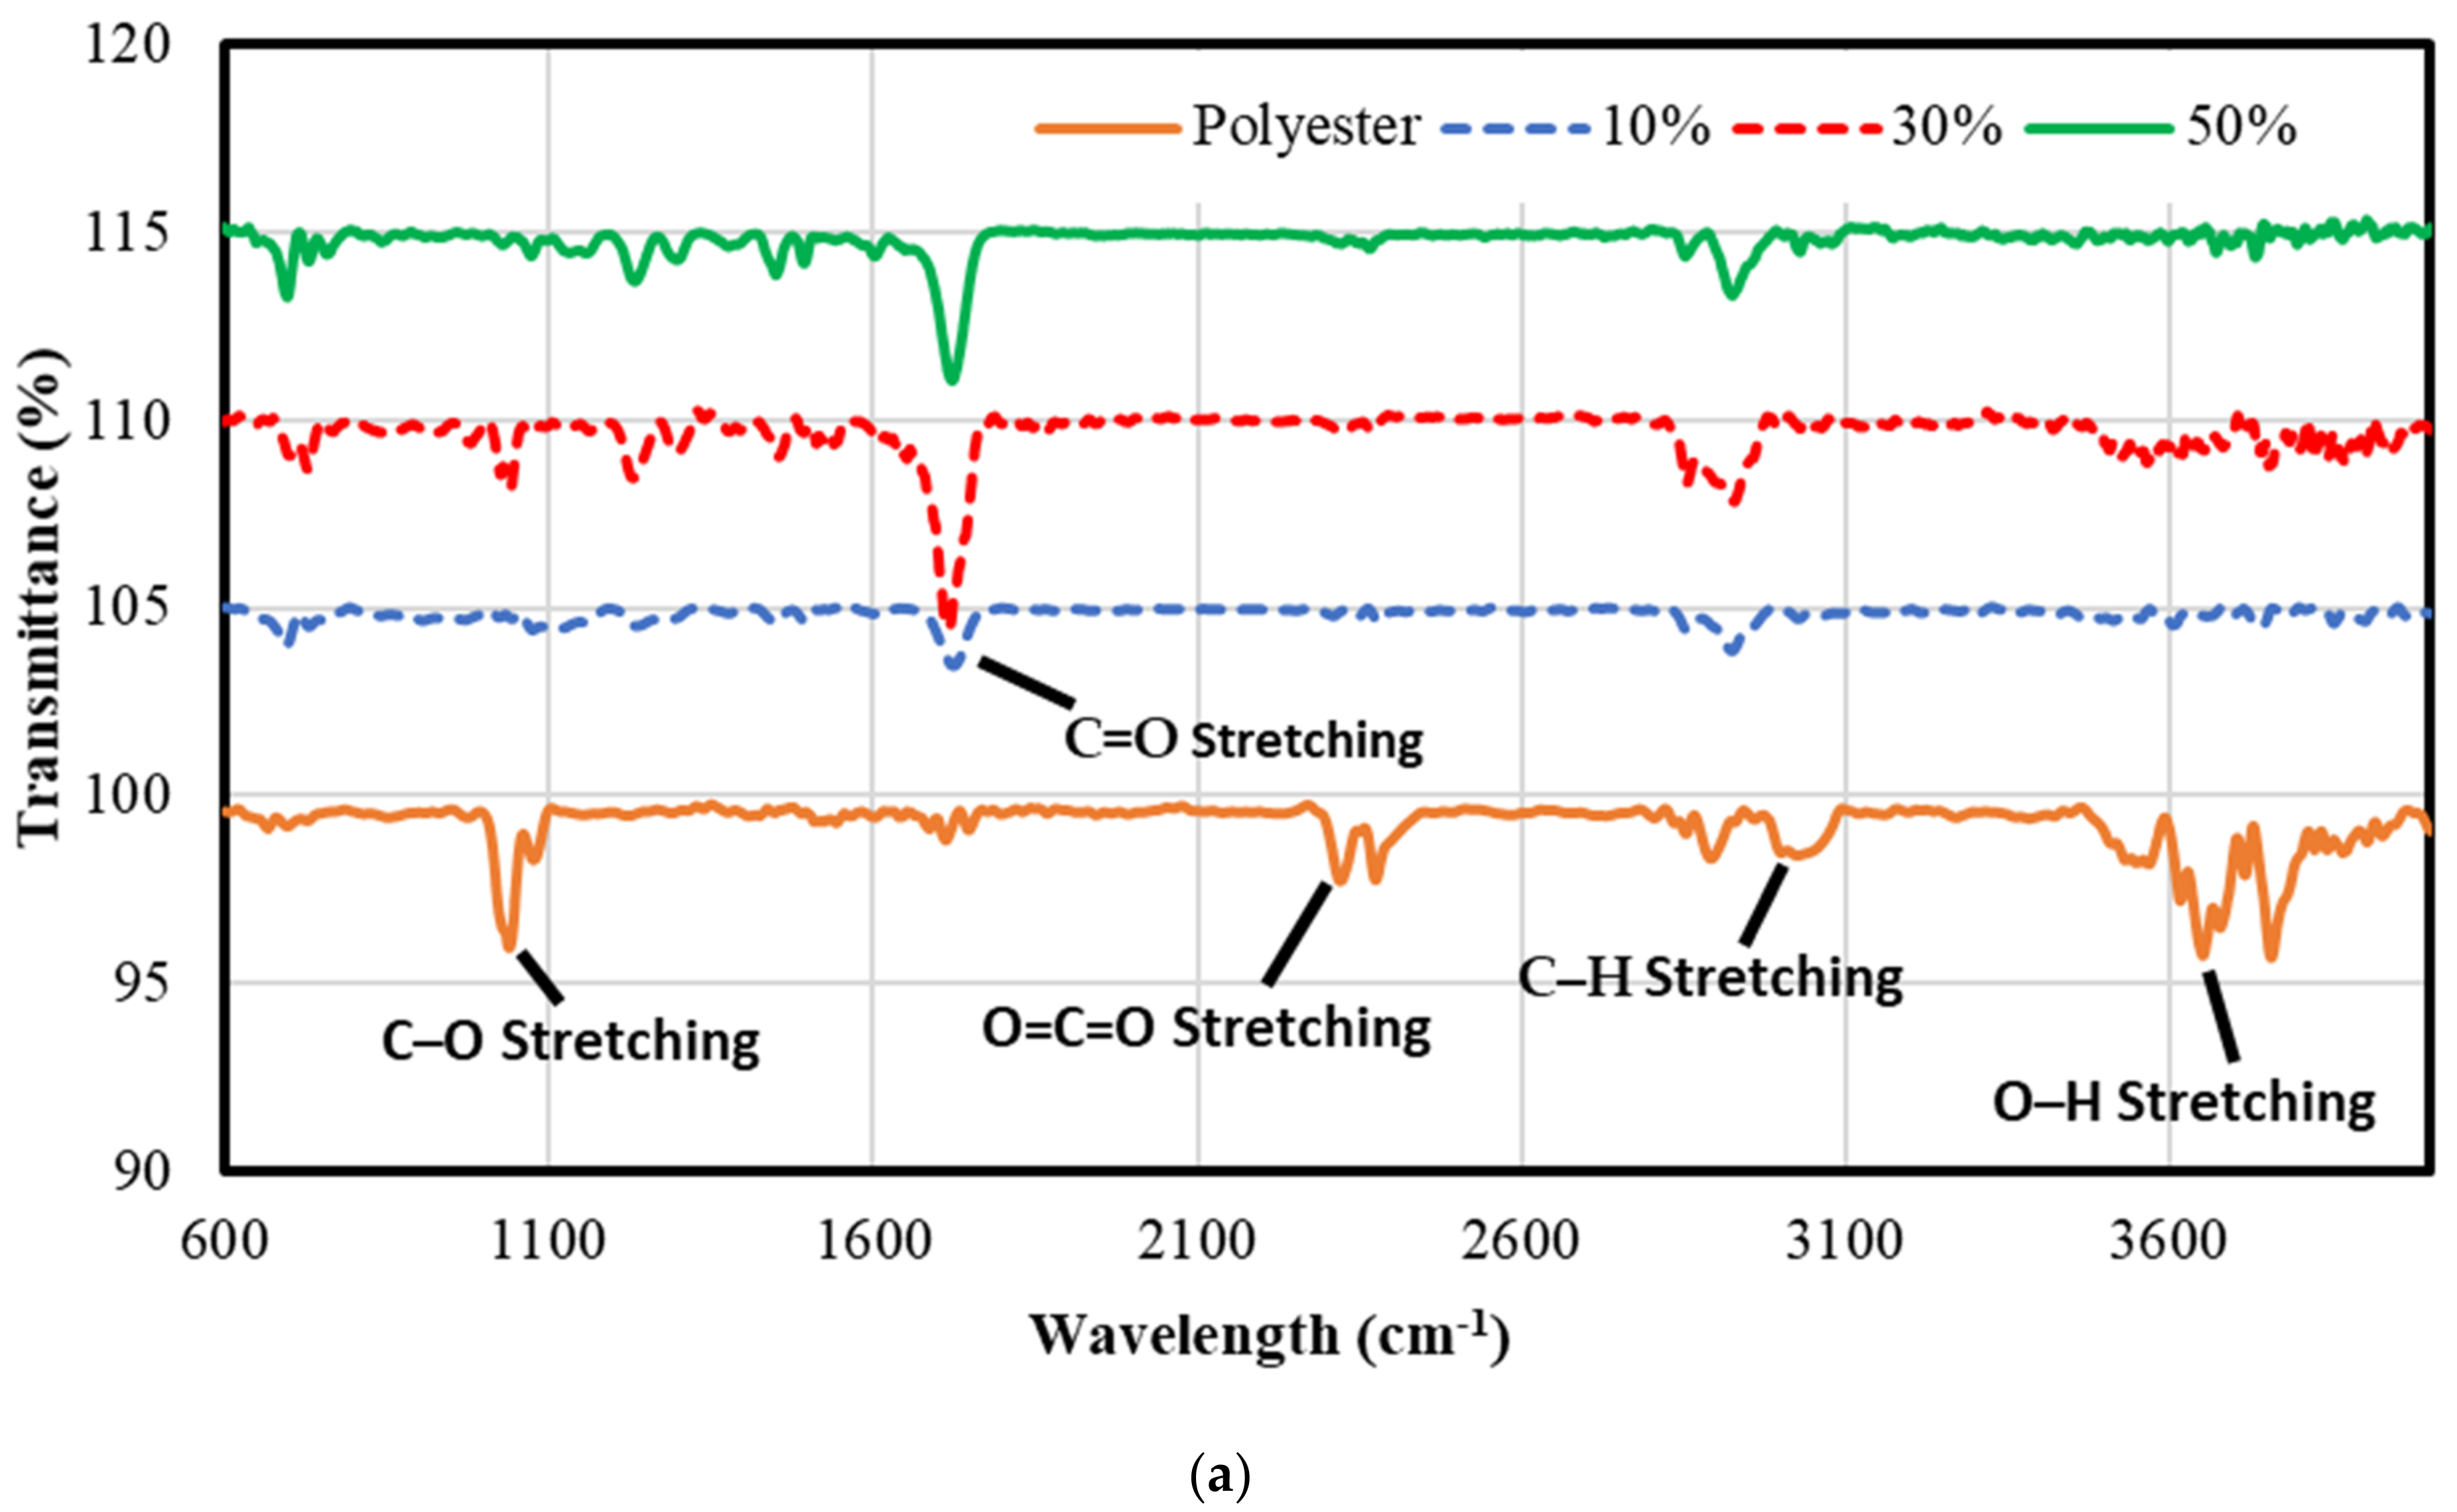
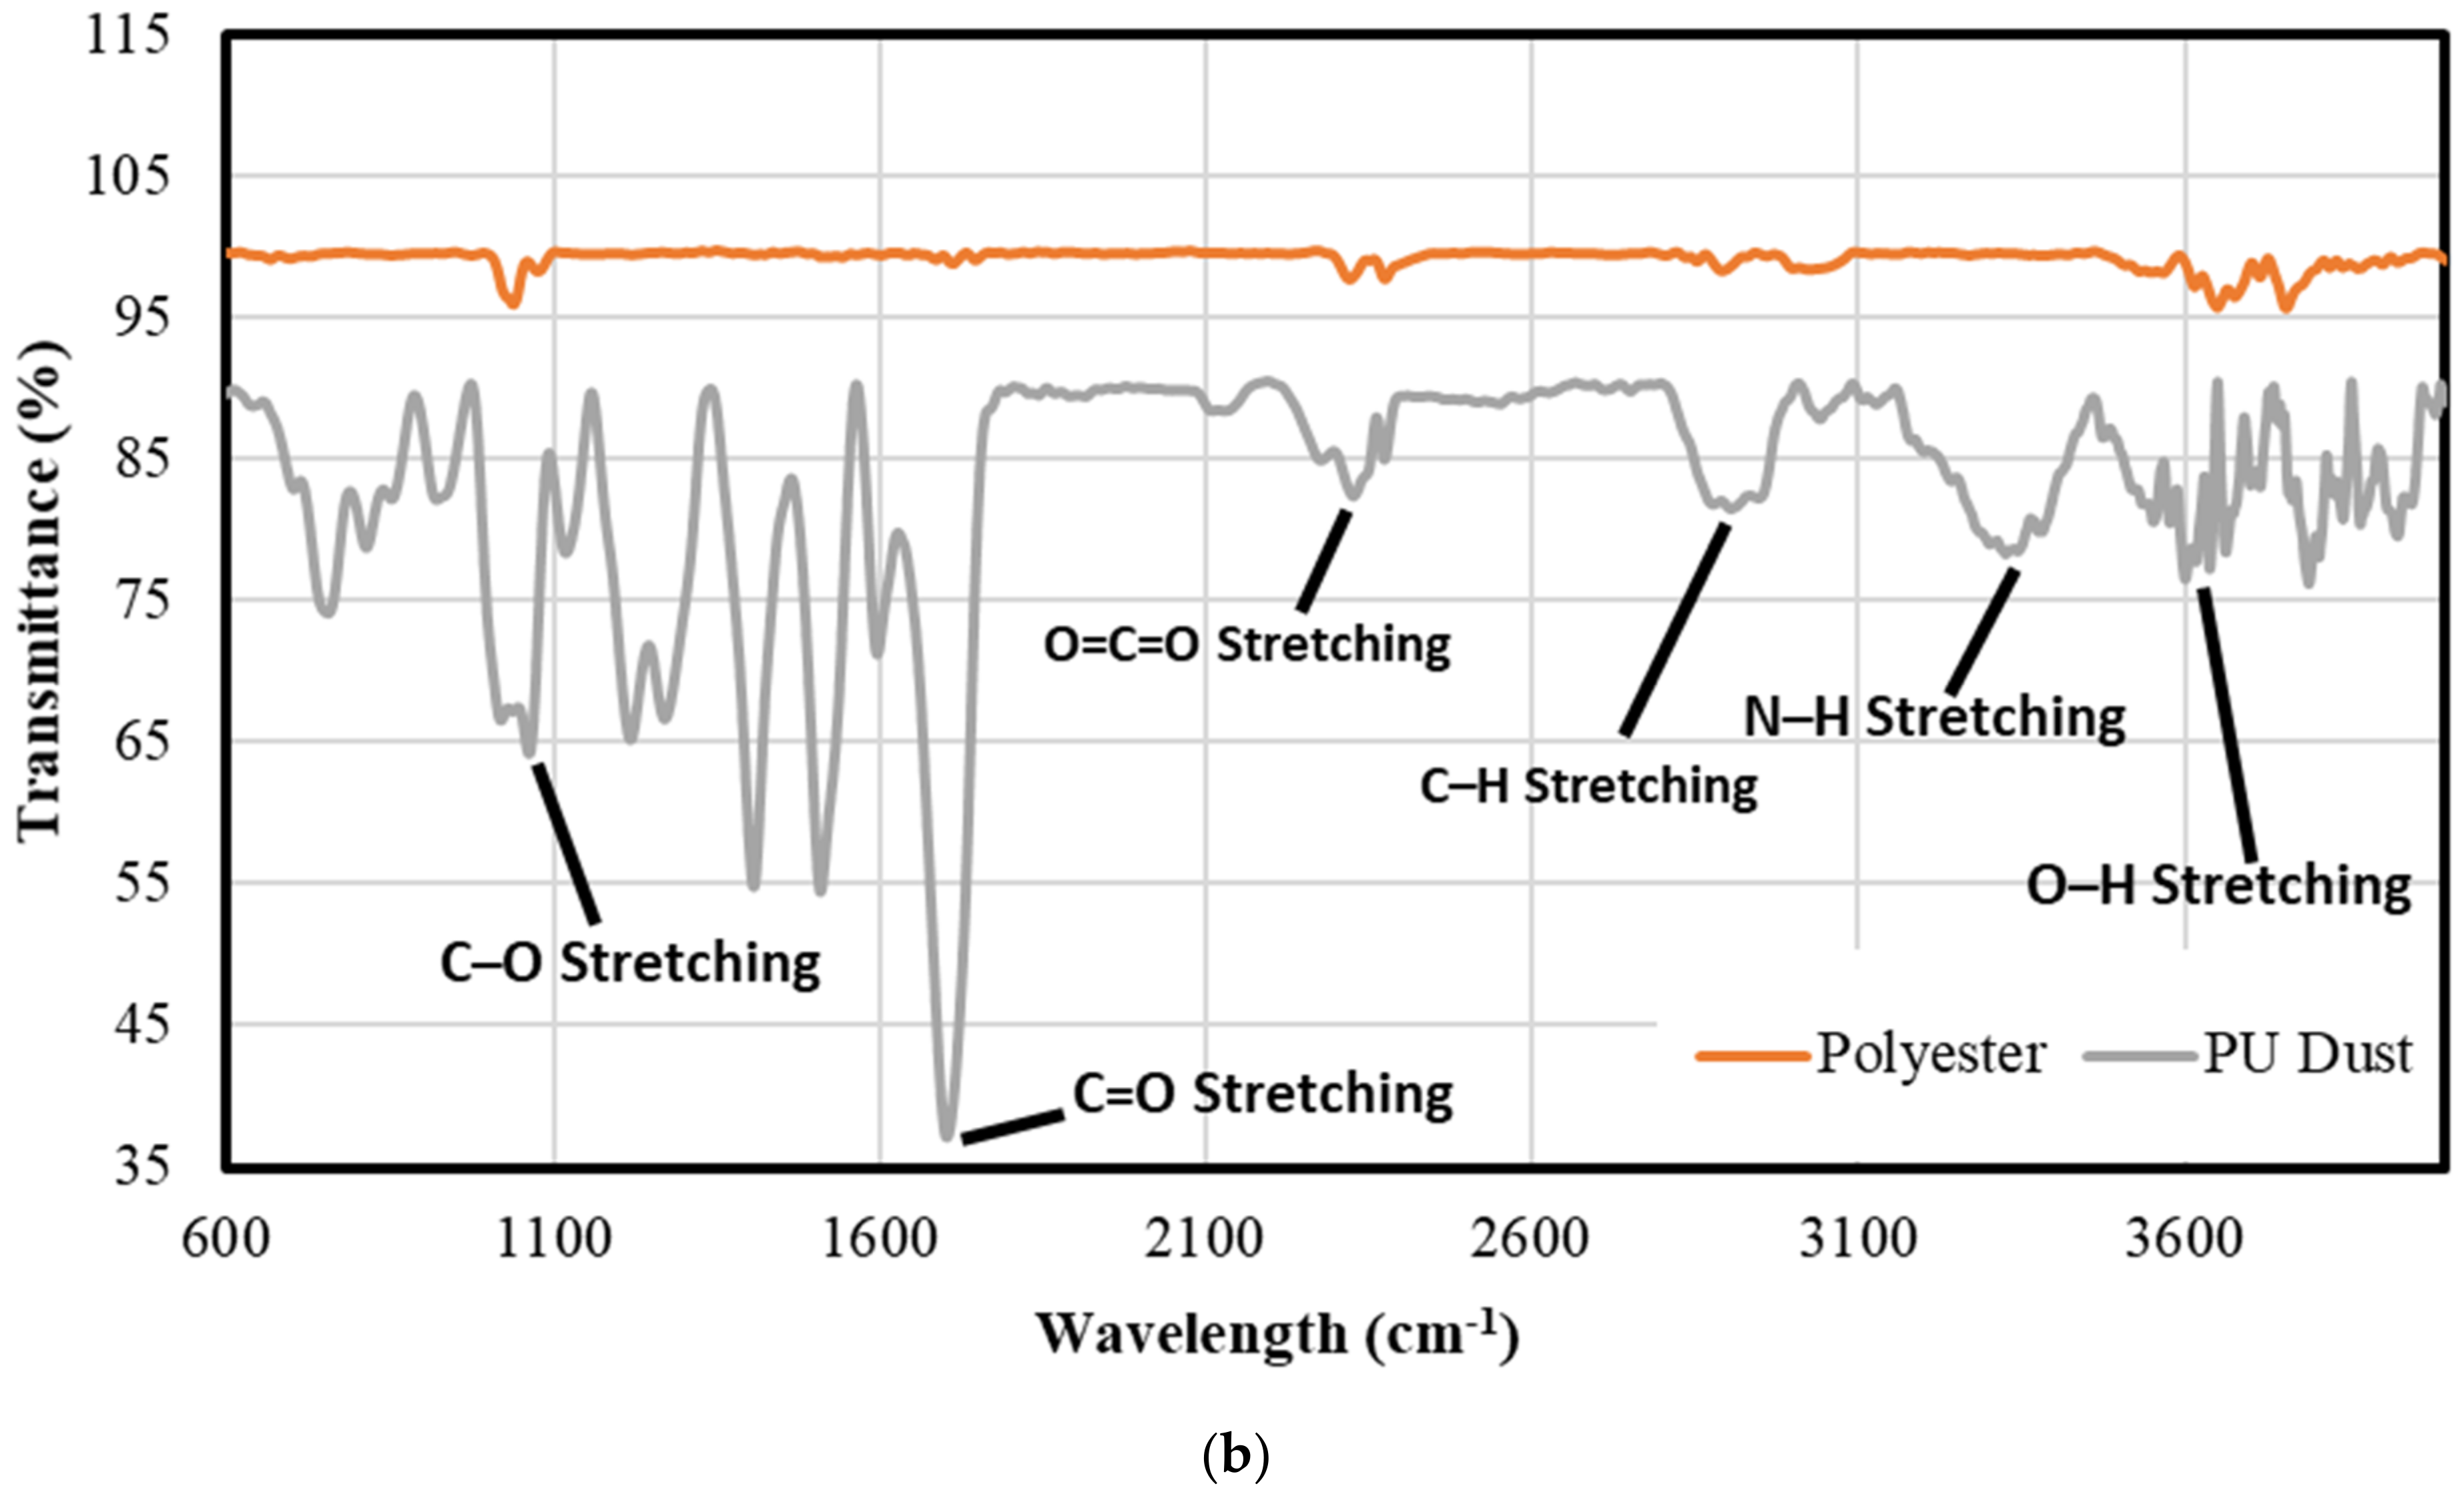
FTIR spectroscopy of the cured pure polyester, pure PU dust and UPR-PUD composites is illustrated in Figure 3. The pure polyester has mean peaks at around 1000 cm−1, and at 3700 cm 1 , which correspond to C-O, and O-H functional groups, respectively. In addition, two peaks with less intensity for O=C=O and C-H functional groups appear at around 2300 cm 1 , and 2900 cm 1 , respectively. In the UPR-PUD composites, the placement of these bands did not change; however, their intensity declined significantly, except for the C-H band where the intensity was higher in composites with high PUD content. Moreover, the FTIR analysis for composite samples introduced a new main peak at 1700 cm 1 which corresponds to C=O functional groups. This peak appears in the FTIR spectroscopy of pure PU dust; see Figure 3b. The 30-PUD composites exhibited stronger absorption at 1700 cm 1 than the 10-PUD and 50-PUD samples for C=O functional groups, indicating a higher crosslinking degree. The FTIR analysis suggested that adding PUD improved the curing process of unsaturated polyester. When the PU prepolymer is combined with UPR and cured, Cherian et al. [26] found that two reactions can occur. First, the prepolymer’s -NCO end groups can react with the UPR polyester’s -OH and -COOH functionalities at the chain ends, resulting in new urethane groups and chain extension. Second, short polystyrene chains can be grafted onto unsaturated locations. Due to the latter reaction, crosslinking between polyester chains and polyester and PU chains can occur. The disappearing of both functional groups N-H (which appeared in pure PUD) and O-H (which appeared in UPR and PUD) from the FTIR of the developed UPR-PUD composites supports the possibility of these reactions; see Figure 3a,b.

3.3. X-ray Diffraction Analysis (XRD)

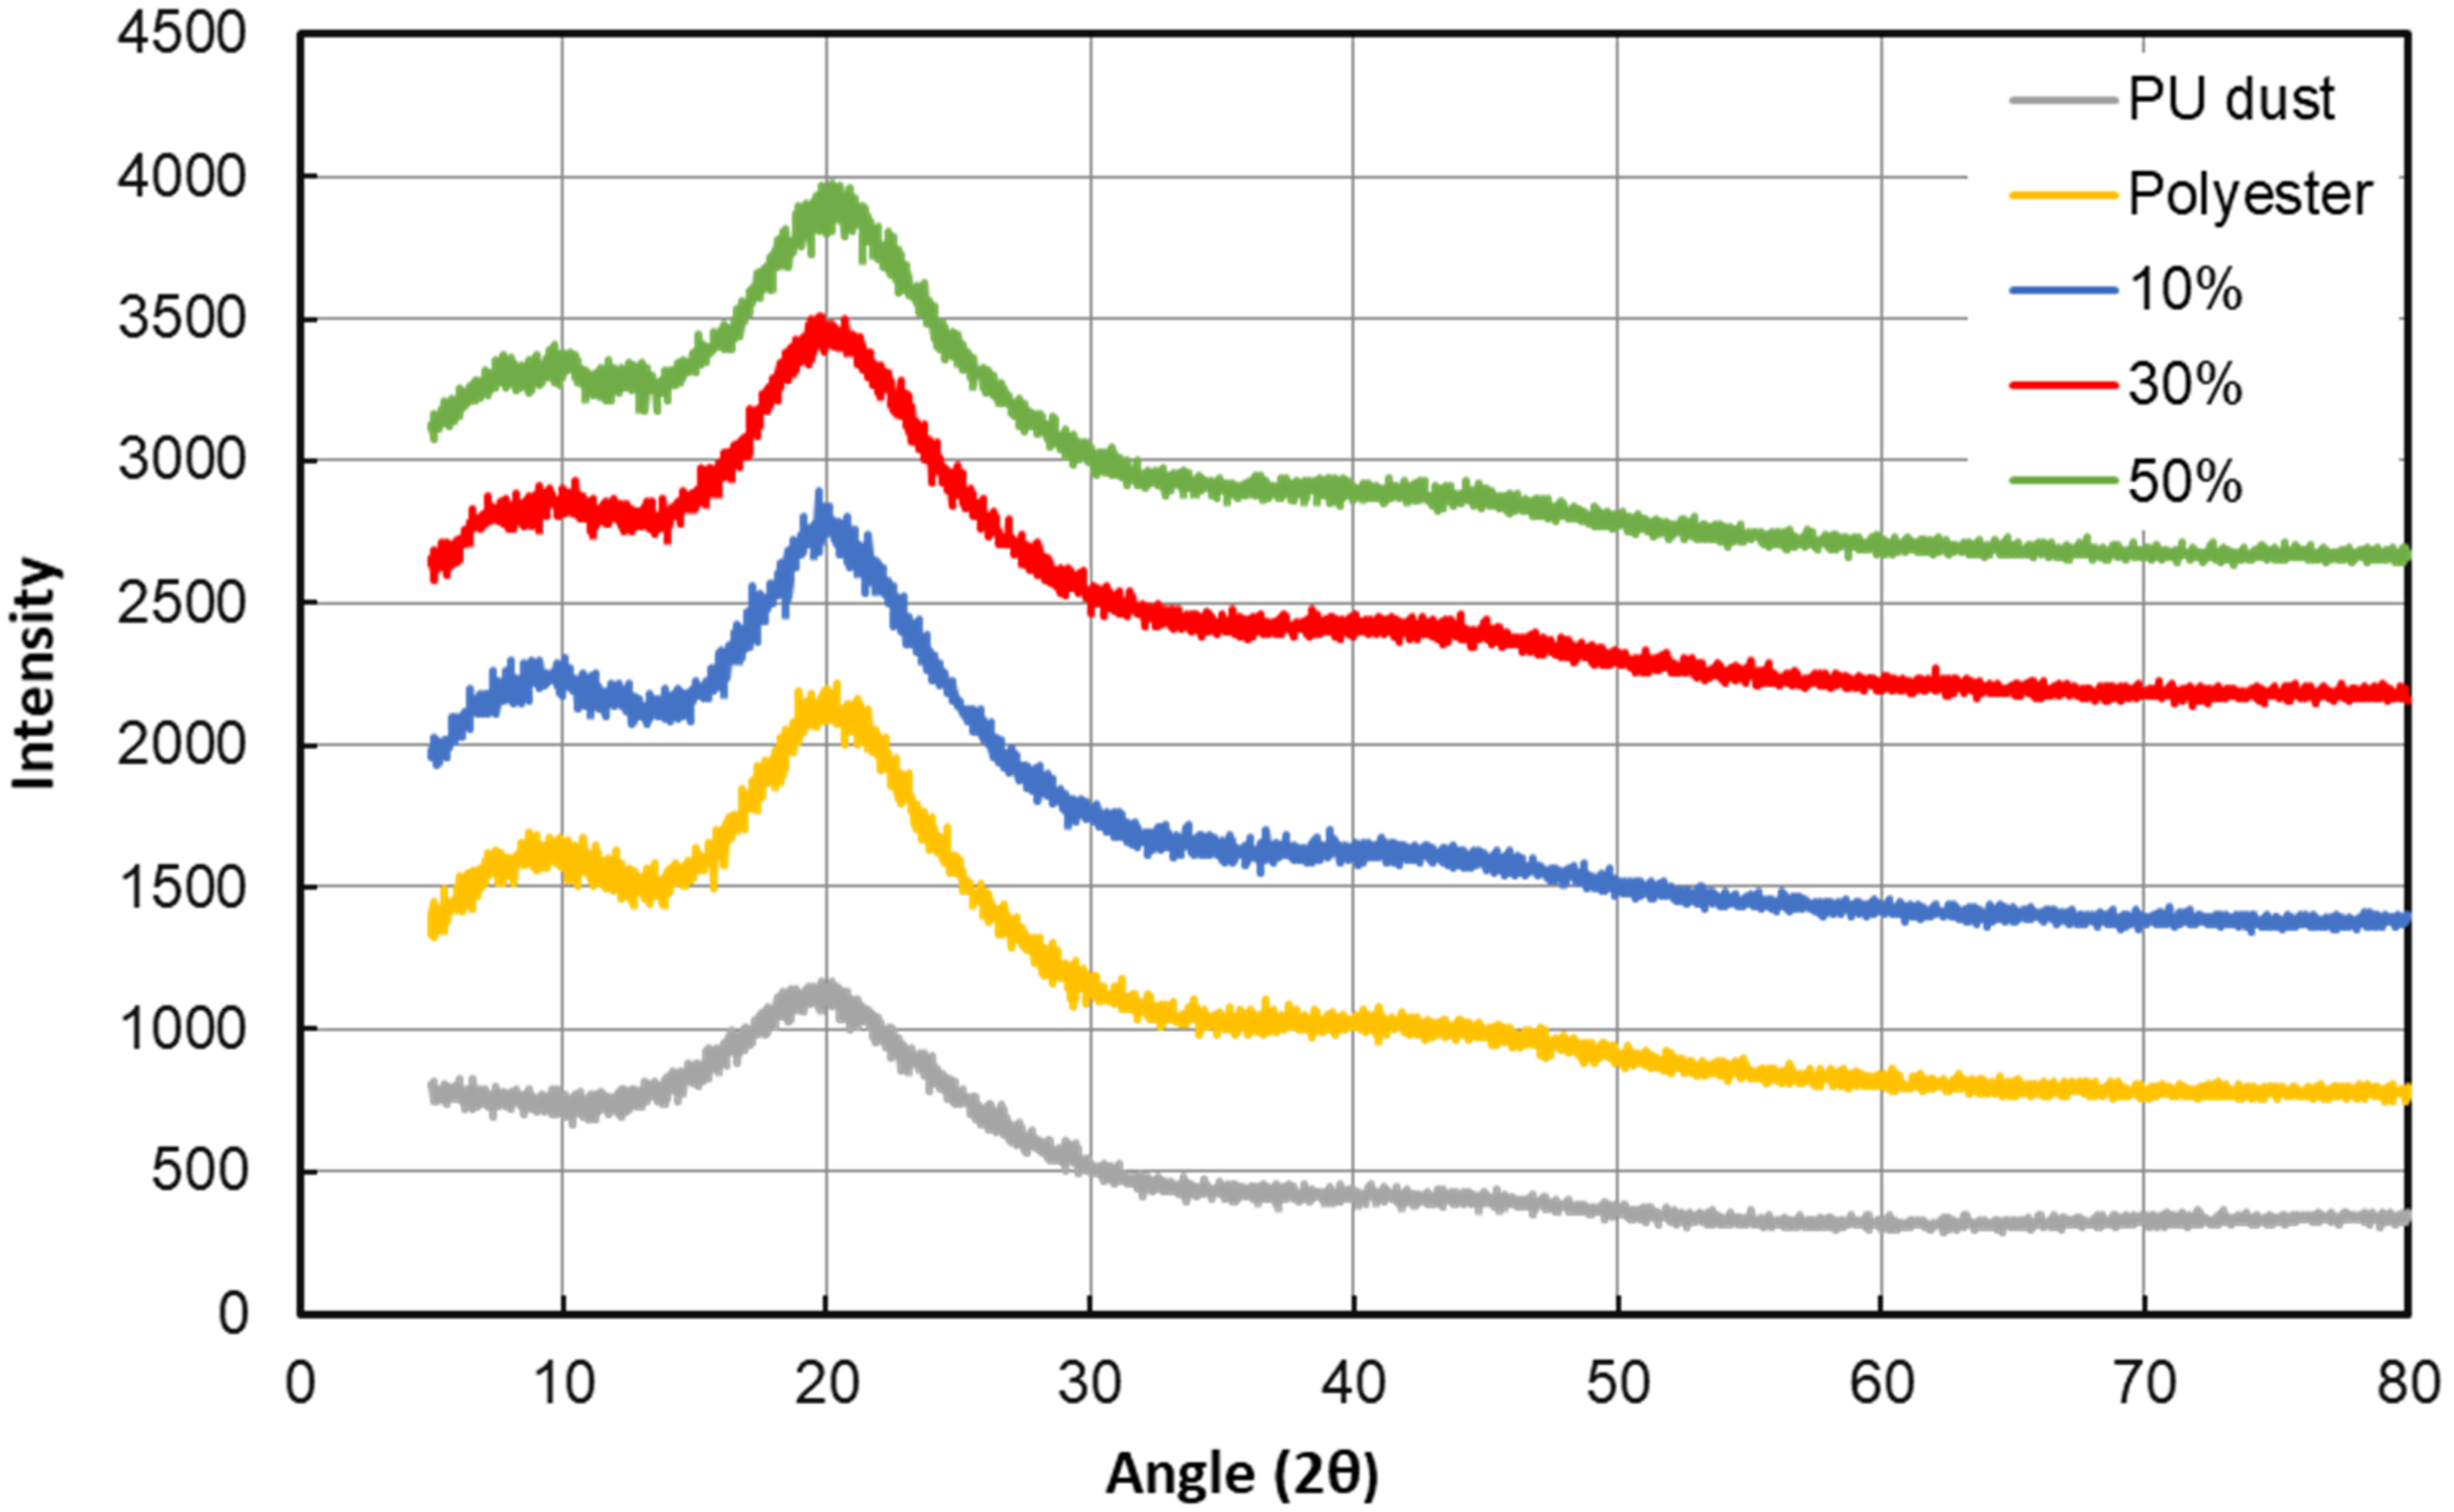
The XRD diffractograms obtained from pure polyester, PU dust, and their composites are shown in Figure 4. The UPR and composites exhibited two characteristic peaks. The first peak of the 10-PUD, 30-PUD, 50-PUD, and UPR was observed at 2θ = 19.7°, 19.85°, 20.16°, and 20.4°, respectively, and the second at 2θ = 8.7°, 10°, 10.5° and 9.66°, respectively. On the other hand, the PU dust exhibited only one peak, at 2θ = 20°. The wide peaks at a 20° angle were observed for pure polyurethane by Dias et al. [27] as well, and is the typical peak for materials with a semi-crystalline structure. Segal’s approach was used to calculate the degree of crystallinity ( X c ) of the samples by evaluating the XRD intensity of the amorphous and crystalline phases:
X c = I c I c + I A × 100
where I c is the integrated intensity of the sharp peak of the crystalline part and I A is the intensity of the broad peak of the amorphous part. The calculated degree of crystallinity was 52.0%, 52.7%. 52.4%, 56.0%, and 53.8% for PU dust, neat polymer, 10-PUD, 30-PUD, and 50-PUD samples, respectively. When PU dust was added to the UPR matrix, the degree of crystallinity increased to its maximum at a PU dust content of 30 vol.%. This can be attributed to the ability of PUD to pack in the UPR matrix and form a crystal region. However, the crystallinity of the resulting 50 -PUD composite decreased due to insufficient interaction between the excess PUD and the polymeric matrix; the PUD restricted the polymer chain movement, which reduced the crystallinity. These findings are in accordance with the results of the FTIR, which showed that the 30-PUD composites had a larger absorption of C=O functional groups at 1700 cm 1 , indicating a higher degree of crosslinking.

3.4. Composite Density

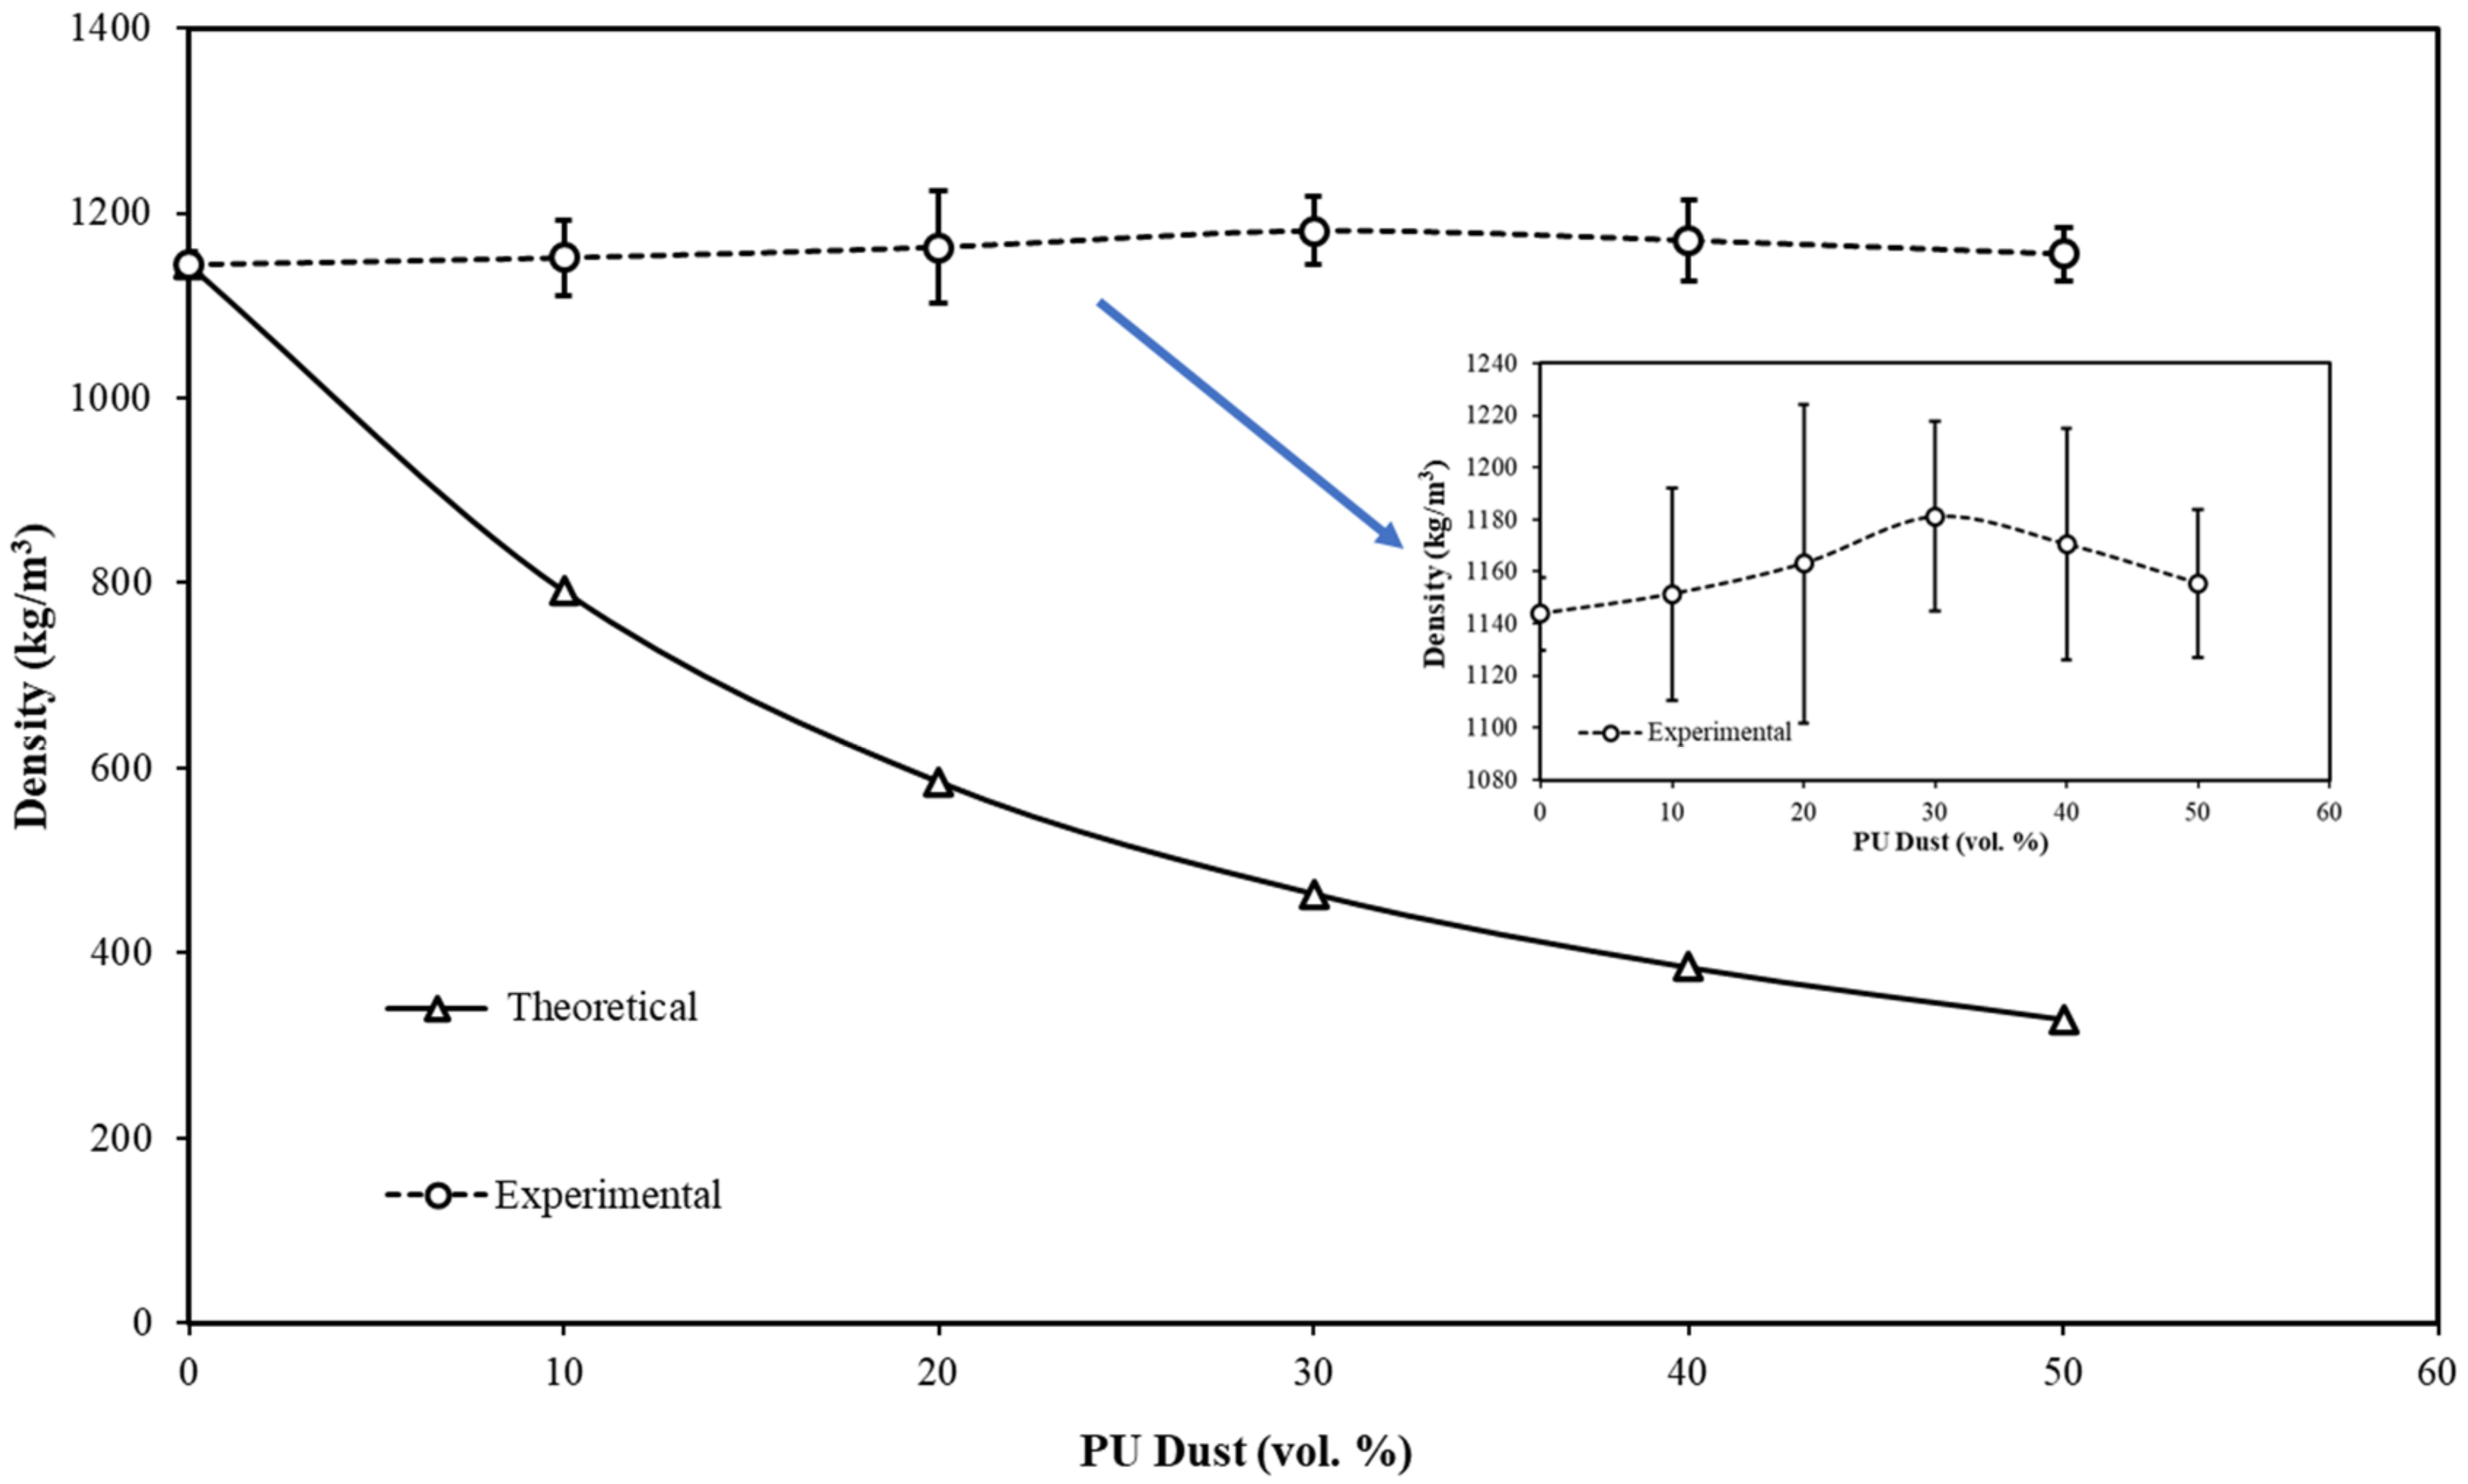
The density of pure polyester and pure PU dust was measured to be 1144 and 190 kg / m 3 . Figure 5 shows that the filler content has a marginal effect on the composite’s density, as it increased from 1151 kg / m 3   for 10-UPD composite to reach the maximum of 1181 kg / m 3 at 30-UPD composite and then decreased to 1155 kg / m 3 at 50-UPD composite. The highest density was reported for the 30-UPD composite, which exhibited the highest degree of crystalline structure as retrieved from the XRD measurements. However, the theoretical density was calculated for the prepared samples using the following linear mixing rule:
ρ c o m p   = f i l l e r ρ f i l l e r   + U P R ρ U P R
where ρ c o m p   , ρ f i l l e r   , and ρ U P R are the density of composite, PU dust and UPR, respectively, and f i l l e r and U P R are the volume fraction of PU dust and UPR, respectively. As Figure 5 depicts, the presence of PUD filler within the polymeric matrix enhanced the formation of the crystalline structure due to the chemical interactions during the curing. Consequently, the deviation between the experimental and theoretical density is significant. It is worth mentioning that the shrinkage of the composites during the curing process contributes to this deviation. During and after curing in the liquid and semi-solid phases, shrinkage of thermoset polymers is followed by the rearrangement and reorientation of polymer chains [28].
The developed composites have a lower density than UPR-based composites such as UPR-banana (1350 kg/m3), UPR-sisal (1450 kg/m3) [29], and UPR-bauxite residue (1500 kg/m3) [30], and are close to the density range of UPR-corn straw fiber (1218–1150 kg/m3) [31] and UPR-date seed (1099–1950 kg/m3) [32].

3.5. Thermal Insulation Properties

Composites of UPR-PUD with varying filler content ranging from 0 to 50 vol.% of PU dust were tested to determine their thermal conductivity. The thermal conductivity values for the composites at 25 °C are shown in Figure 6a. The results show that the thermal conductivity coefficient ( k ) increased from 0.073 W / m · K for pure polyester to 0.0993 W / m · K for 30 vol.% filler content composites. However, the thermal conductivity values dropped to 0.0847 W / m · K at 40 vol.%, and decreased further to 0.0787 W / m · K at 50 vol.%. The thermal conductivity of UPR-PUD composites can be directly correlated with the composite density and degree of crystallinity. The XRD analysis shown in Figure 6a illustrates that the 30-PUD composite achieved the highest crystallinity, which corresponds to the thermal conductivity trend where it achieved the highest value of thermal conductivity.
The UPR-PUD composites achieved a promising result in the thermal conductivity test and showed high potential for use in insulation for buildings. The obtained values are relatively close to the thermal conductivity of commercial heat insulators. The developed composites had lower thermal conductivity than numerous other UPR-based composites, including UPR-bauxite residue (0.082–0.149 W / m · K ) [30], UPR-red shale (0.135–0.218 W / m · K ) [33] and UPR-glass fiber (0.190 and 0.207 W / m · K ) [34].
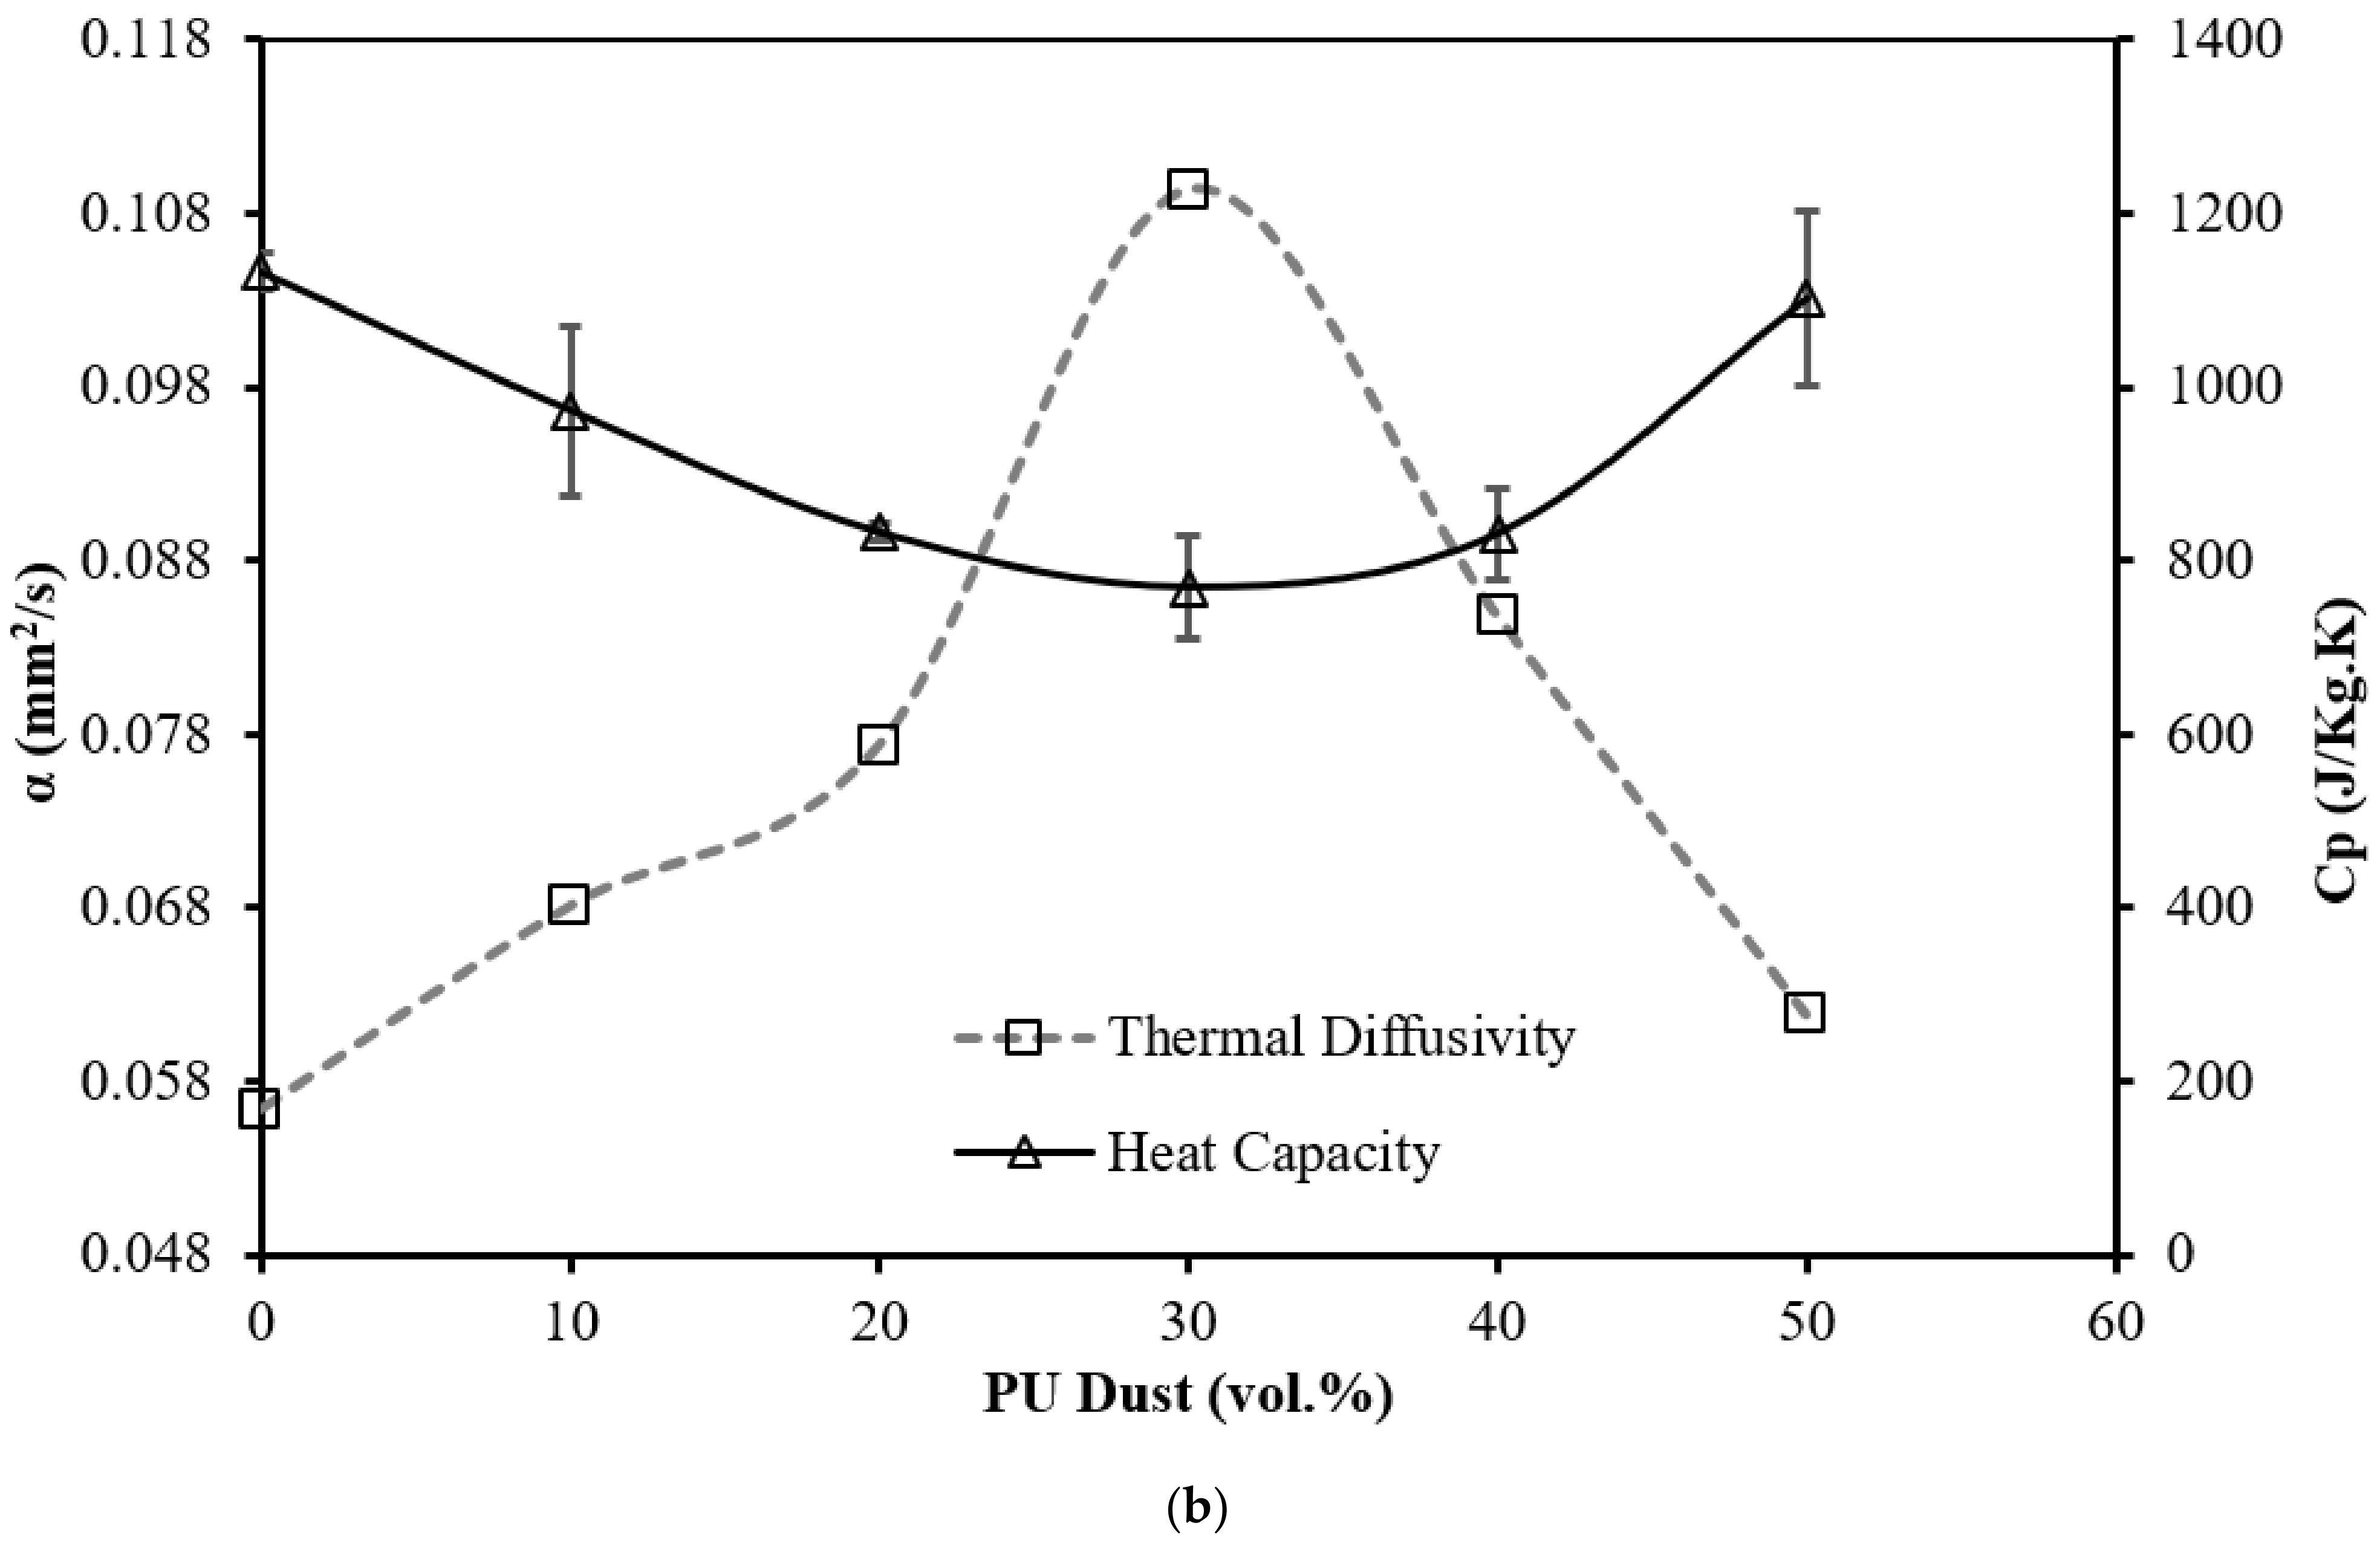
The measured specific heat capacity ( C p ) of UPR-PUD composites at different filler concentrations is illustrated in Figure 6b. The C p of the UPR-PUD composites decreased with filler content from 1132 J / kg · K for pure polyester to 769 J / kg · K for 30-PUD composite, then increased to 1102 J / kg · K for 50-PUD composite. Again, the 30-PUD composite, with the highest degree of crystallization, exhibited the lowest value of heat capacity as well. Nonetheless, the developed composites with 50 vol.% PUD exhibited a heat capacity similar to that of the commercial heat insulators such as expanded polystyrene (1200–1450 J / kg · K ), Rockwool (1000 J / kg · K ) and fiberglass (830 J / kg · K ) [35].
Using the measured values of specific heat capacity ( C p ), thermal conductivity ( k ), and bulk density ( ρ ), the thermal diffusivity ( α ) of the developed UPR-PUD composites was determined according to the following equation:
α = k ρ C p
Another crucial property for heat insulation is the thermal diffusivity, which measures how quickly heat moves from a hotter to a cooler area of a material. Figure 6b shows that the thermal diffusivity increased with PUD content to reach its maximum in the 30-PUD composite, then reduced with filler content until the minimum was reached in the 50-PUD composite. The developed UPR-PUD composites obtained a lower range of values (0.0618–0.109 mm 2 / s ) compared to commercial heat insulators such as extruded (α = 0.544–0.638 mm 2 / s ) and expanded polystyrene (α = 0.385–0467 mm 2 / s ) [35]. The obtained low values for thermal diffusivity indicate that the developed UPR-PUD composites possess a great advantage. In terms of thermal insulation properties, the 50-PUD composites which utilized the maximum amount of PU dust exhibited the best thermal insulation performance, with the lowest thermal conductivity, the lowest thermal diffusivity, and the highest heat capacity.

3.6. DSC Analysis

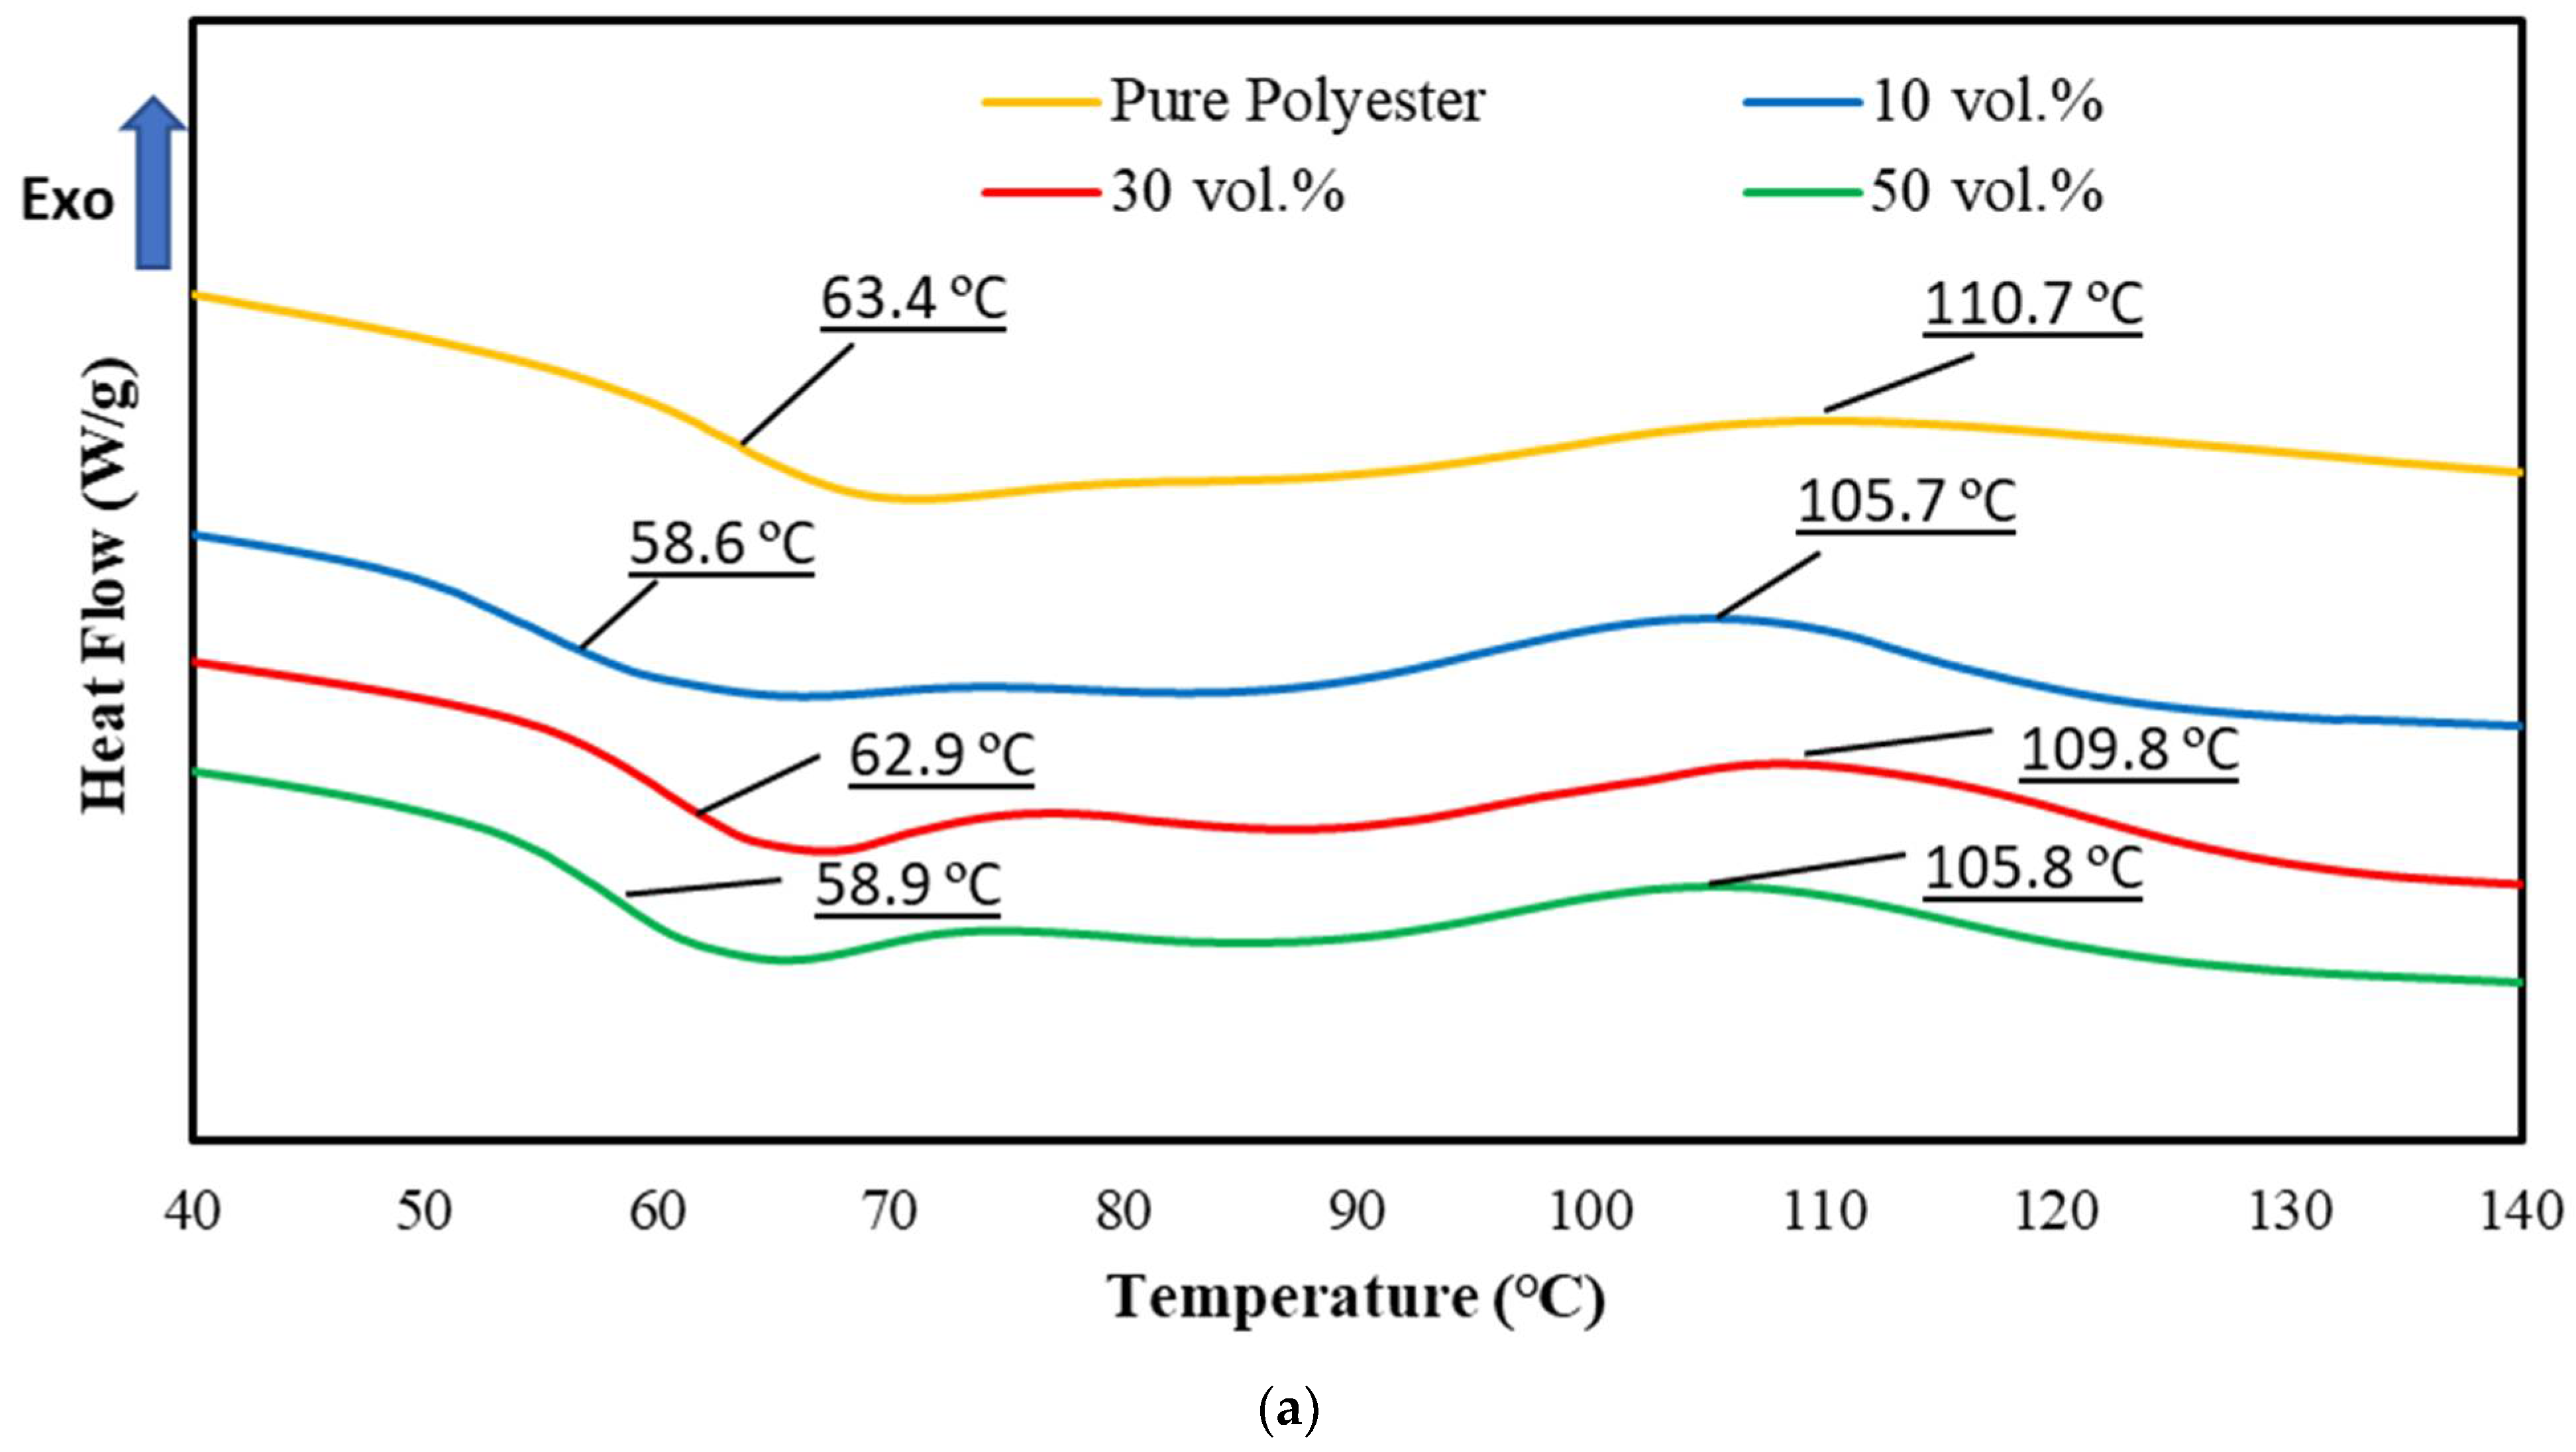
The thermal profile of the UPR-PUD composites for the first and second heating cycle is shown in Figure 7a,b, respectively. In the first heating cycle, both endothermic and exothermic peaks developed. In both the pure UPR and composite thermograms, an exothermic peak formed, indicating that polymer curing occurred even at high temperatures. The curing temperature varied between 105.7 °C and 110.7 °C. The maximum curing temperature was reported for 30-PUD composites, which have the highest degree of crystallization, while the minimum curing temperature was reported by 10-PUD and 50-PUD composites. The glass transition temperature T g found in the first heating cycle reflected the degree of crystallization, as the 30-PUD composites showed the highest value of T g . However, the addition of PUD filler induced some plasticizing effect in the polymer matrix, which led to a reduced glass transition temperature. The same behavior has been reported in other UPR-based composites [32].
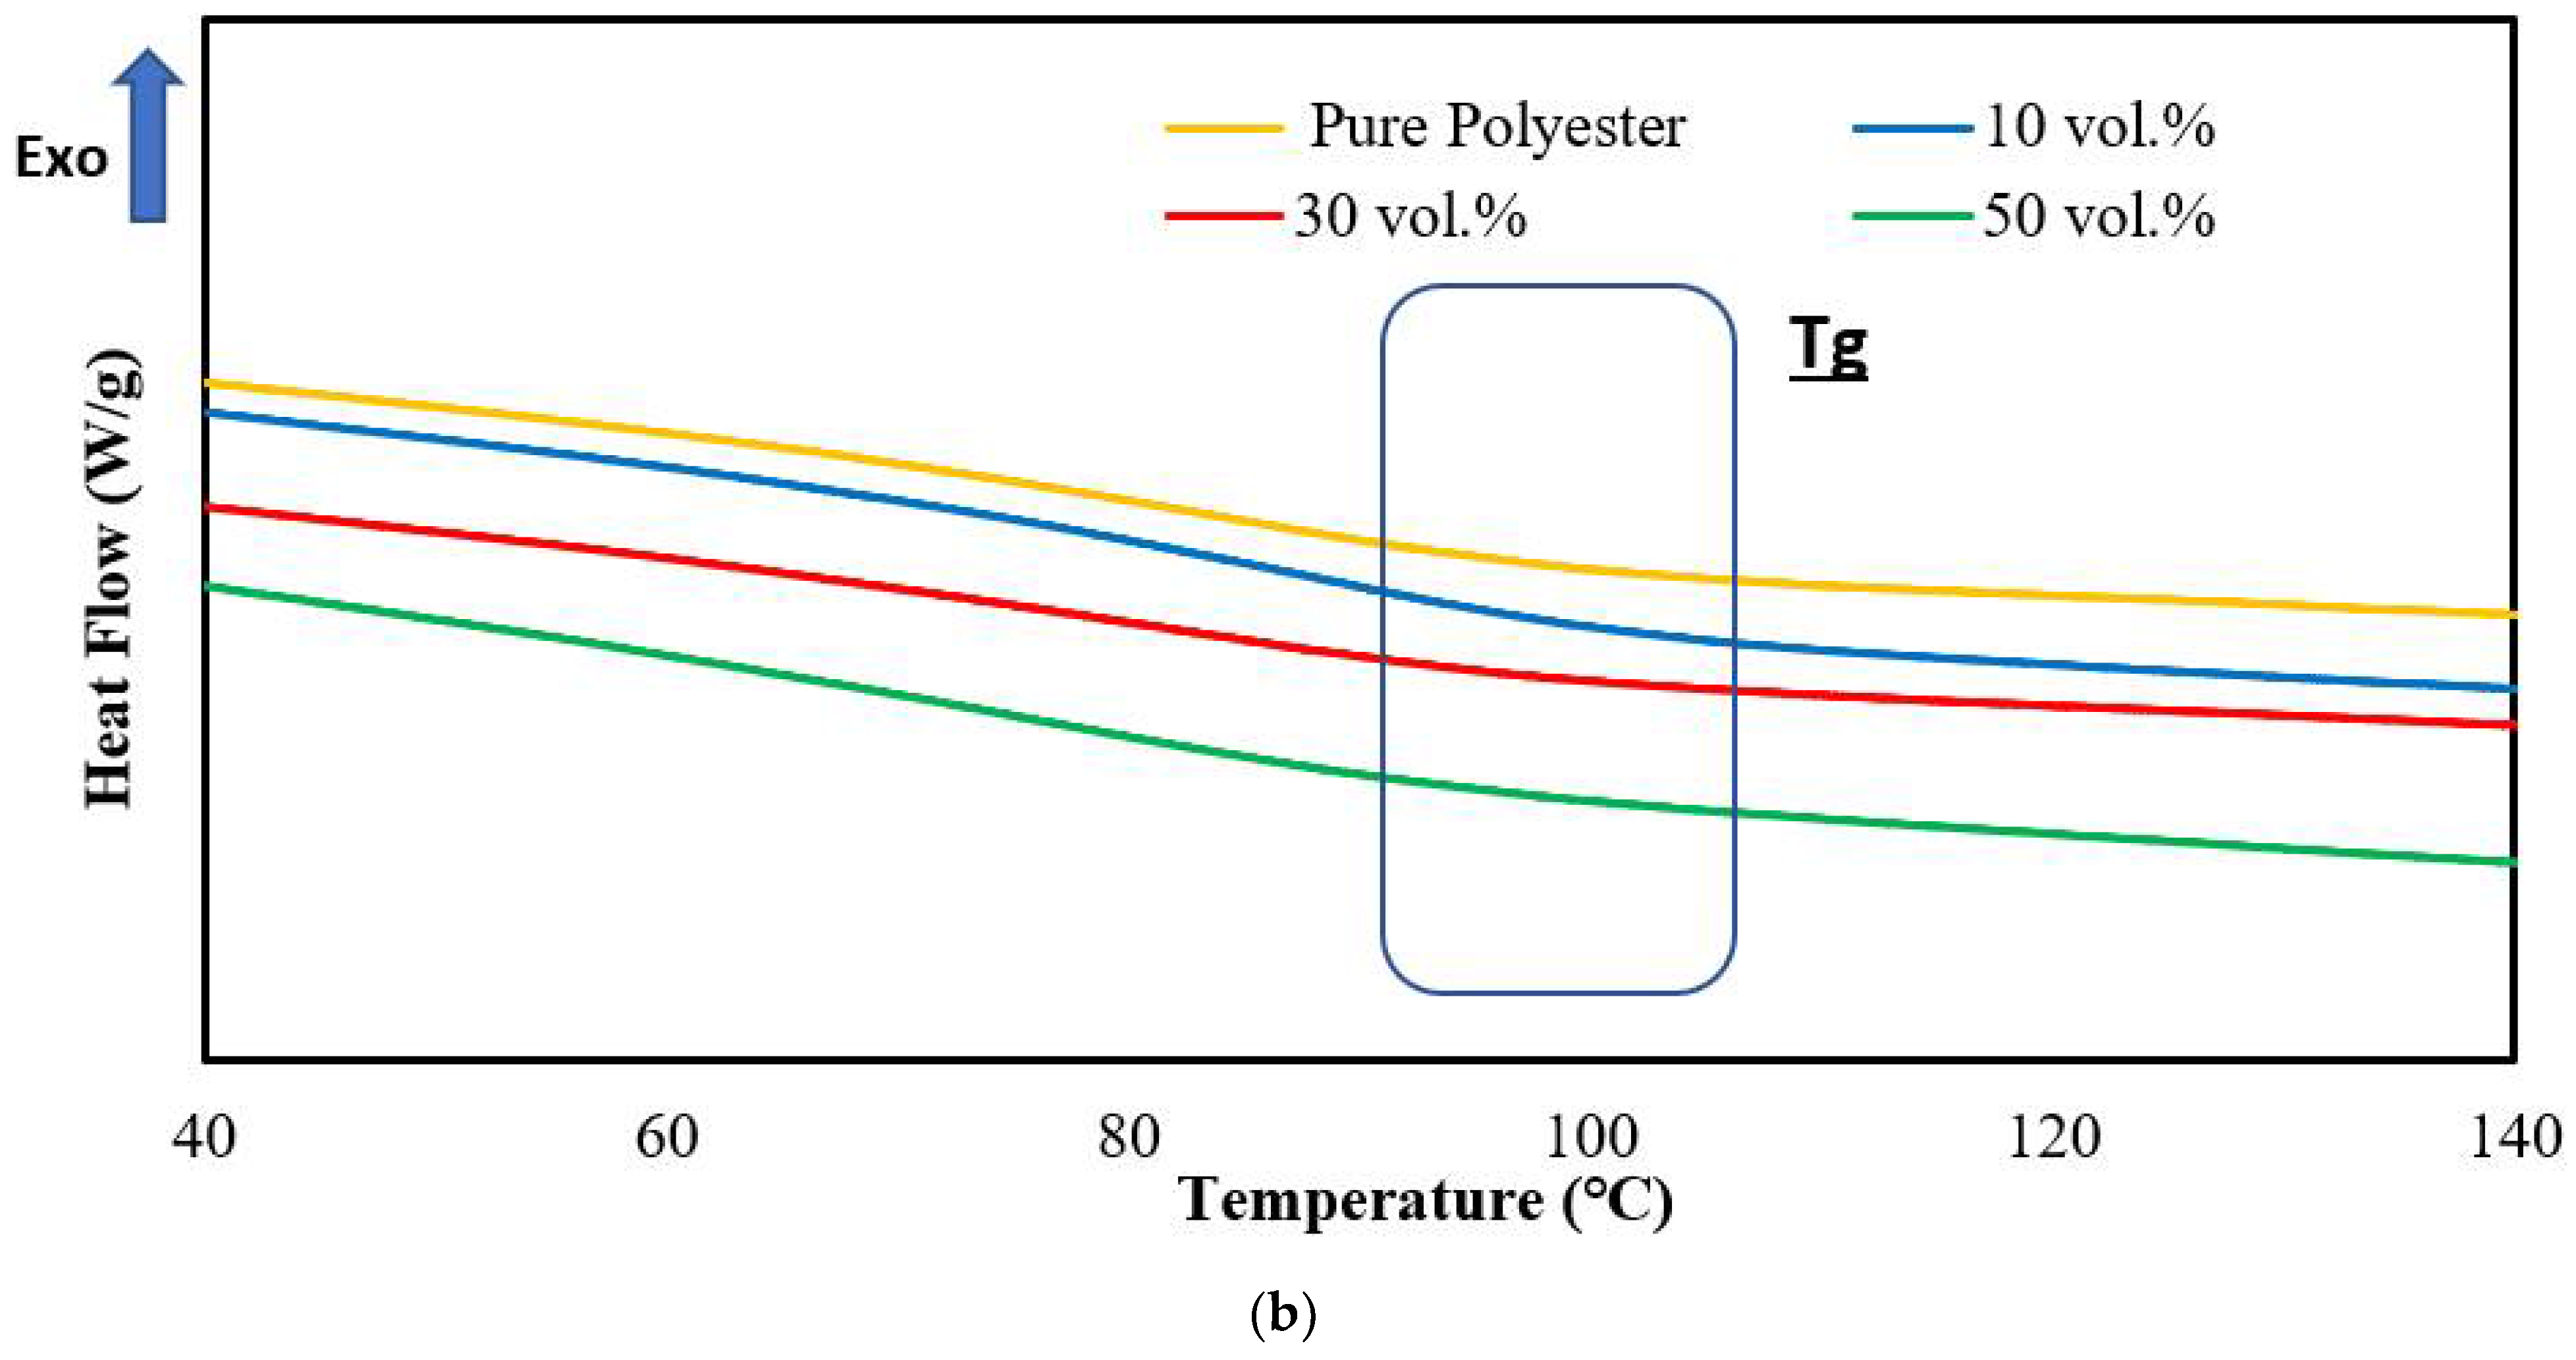
On the other hand, Figure 7b shows the DSC thermogram of the second heating cycle, which only shows the endothermic peaks ( T g ) and not the curing peak. This implies that the polymer matrix was completely cured during the first heating cycle. In comparison to the first cycle, the T g of the second heating cycle moved to a higher range, from 92 °C to 108 °C. The fully cured system in first heating cycle and resulting restriction of polymer chain mobility can justify this increase in the glass transition temperature.

3.7. TGA Analysis

Another critical property for the prospective use of UPR-PUD composite in construction applications is thermal stability. TGA analysis was used to examine the thermal stability of the produced composites in the temperature range of 20–800 °C. The TGA/DTG curves for pure materials and UPR-PUD composites with various filler contents are shown in Figure 8. The summary of TGA profiles is presented in Table 1. The degradation of the pure materials and UPR-PUD composites took place in three stages. The first stage occurred because of the evaporation of moisture, which was more pronounced in the PU dust. The pure polyester first degraded at around 319 °C with minimal weight loss of 5%, followed by 50% weight loss at 413 °C and near-complete mass loss of 96.5%. The major mass loss of UPR can be attributed mainly to the degradation of the polymer network and the production of volatile oligomers, which yielded a small amount of residual char. Alternatively, the pure filler (PU dust) degraded slightly, with 5% weight loss at 206 °C followed by a major degradation of 50% weight loss at 385 °C. The degradation of the PU dust within the range of 200–400 °C is primarily due to the depolycondensation reaction of polyurethane, which produces precursors including polyols and isocyanates. These precursors are then dimerized to produce carbodiimides. In addition, carbon dioxide, alcohol, amines and other components are byproducts generated by this process [36]. The aforementioned stage is followed by a second decomposition stage between 400–800 °C, which is mainly the degradation of substitutes produced from the reaction of carbodiimide with alcohol or water. However, the PUD showed a smaller peak on the DTG curve compared to the pure polyester; see Figure 8b. Moreover, at 800 °C the PUD had a residual weight of 23%, much higher than the pure polyester. In the presence of PUD, the T5% of the UPR-PUD shifted slightly to a lower value compared with pure polyester, while the T50% was not affected by the loading of PUD. In addition, the char yield of the composites increased with increasing PUD content.

3.8. Water Retention

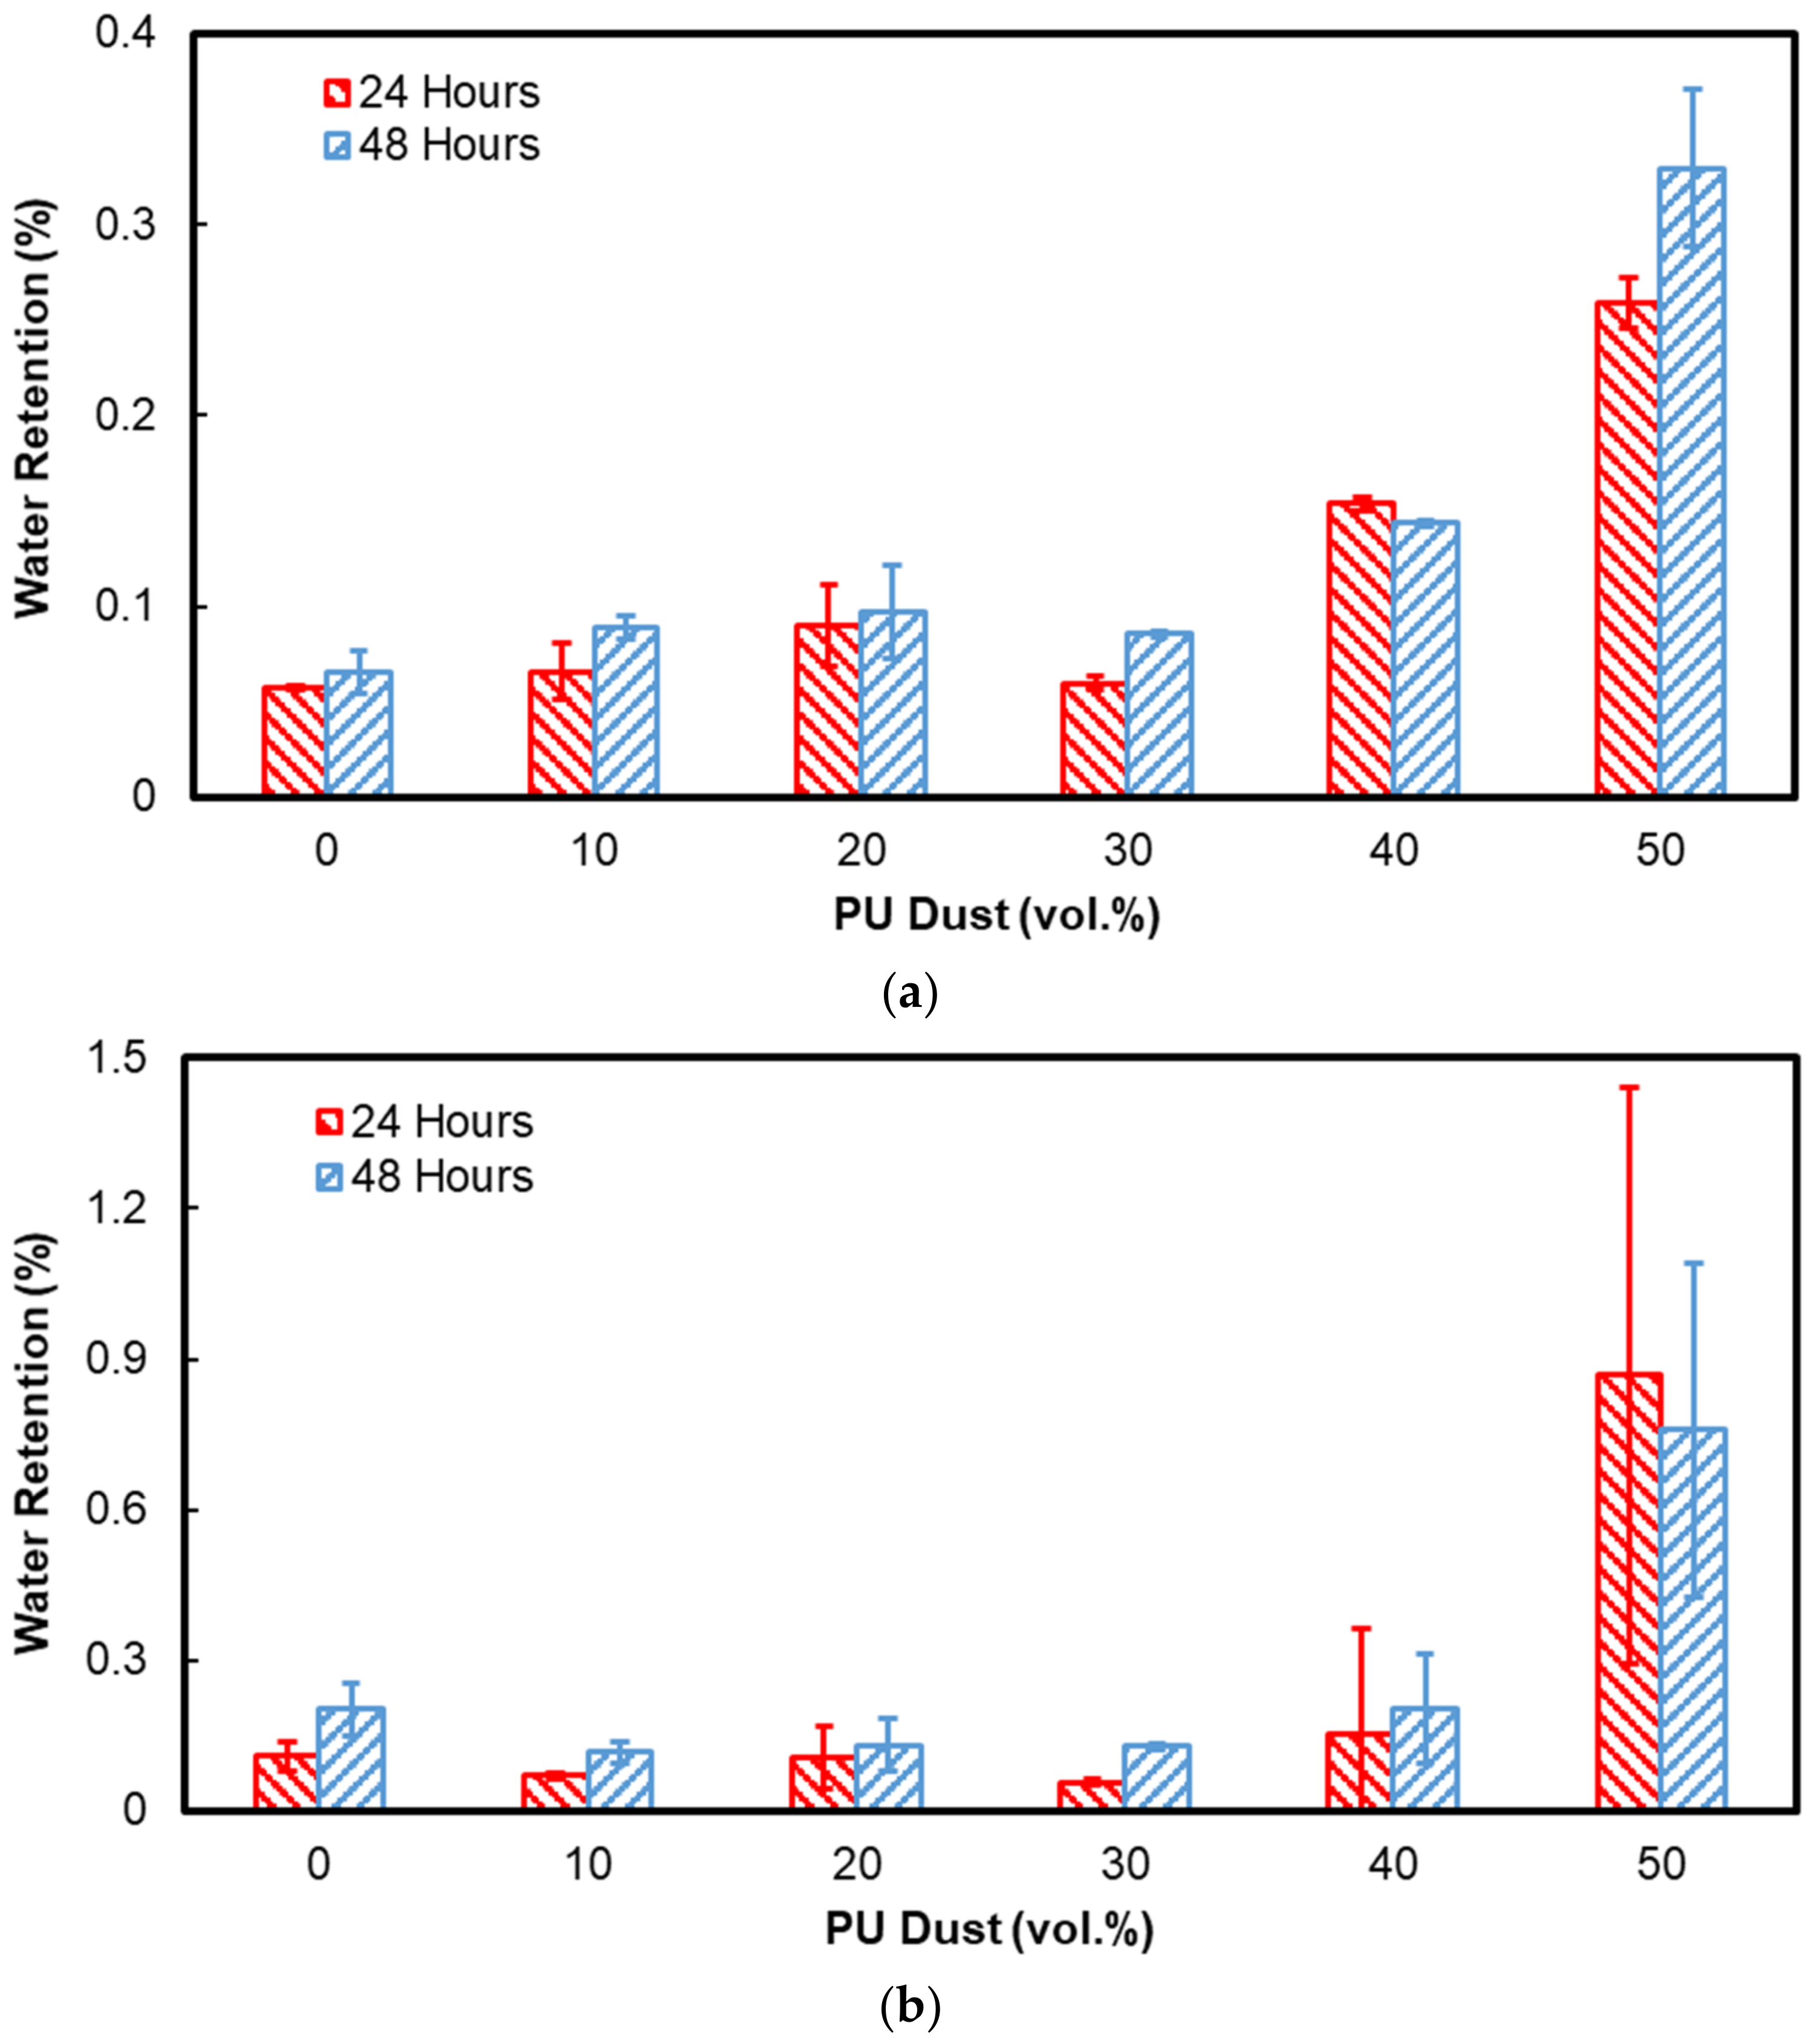
Figure 9 shows the results of water retention tests performed on the UPR-PUD composites after continuous immersion in distillate water for 48 h at two different temperatures, 25 °C and 50 °C. The water retention percentage ( W R % ) was calculated using Equation (4):
W R % = weight   of   equilibrated   sample weight   of   dry   sample weight   of   dry   sample
Water absorption increased with prolonged immersion time for all the composite specimens at all immersion temperatures. Generally, the water retention percentage ( W R % ) of the developed composites was relatively low, with the highest observed percent of water absorption 0.32% and 0.87% at of 25 °C and 50 °C, respectively. The measured water retention of the developed composites is comparable to that of commercial insulators [37]. Figure 9 shows that the water retention of composites increased with increasing PU dust content in both test conditions. For instance, the 30-PUD composites exhibited the lowest W R % because of their high degree of crystallinity. However, the effect of PUD content on water retention was minimal when the fiber loading was below 40 vol.%. It is believed that the cross-linking process was efficient in the tested conditions, resulting in fewer voids within the composites, and thus less water absorption. Increasing the temperature of the water to 50 °C led to an increase in water retention. A higher temperature enhances the mobility of molecules, thereby increasing the amount of water retained inside the solid matrix, which was noticeable when the temperature was increased to 50 °C.
It should be noted that UPR-PUD composites have lower water retention than other UPR-based composites such as UPR-bauxite residue [30] and UPR-date seed [32]. The hydrophobic nature of UPR and the substantially cross-linked structure of the UPR-PUD matrix are regarded as advantages of UPR-PUD composites. The hydrophobic characteristic of UPR and the highly crosslinked structure of the UPR-PUD matrix are responsible for UPR-PUD composites.

3.9. Mechanical Behavior of Composites

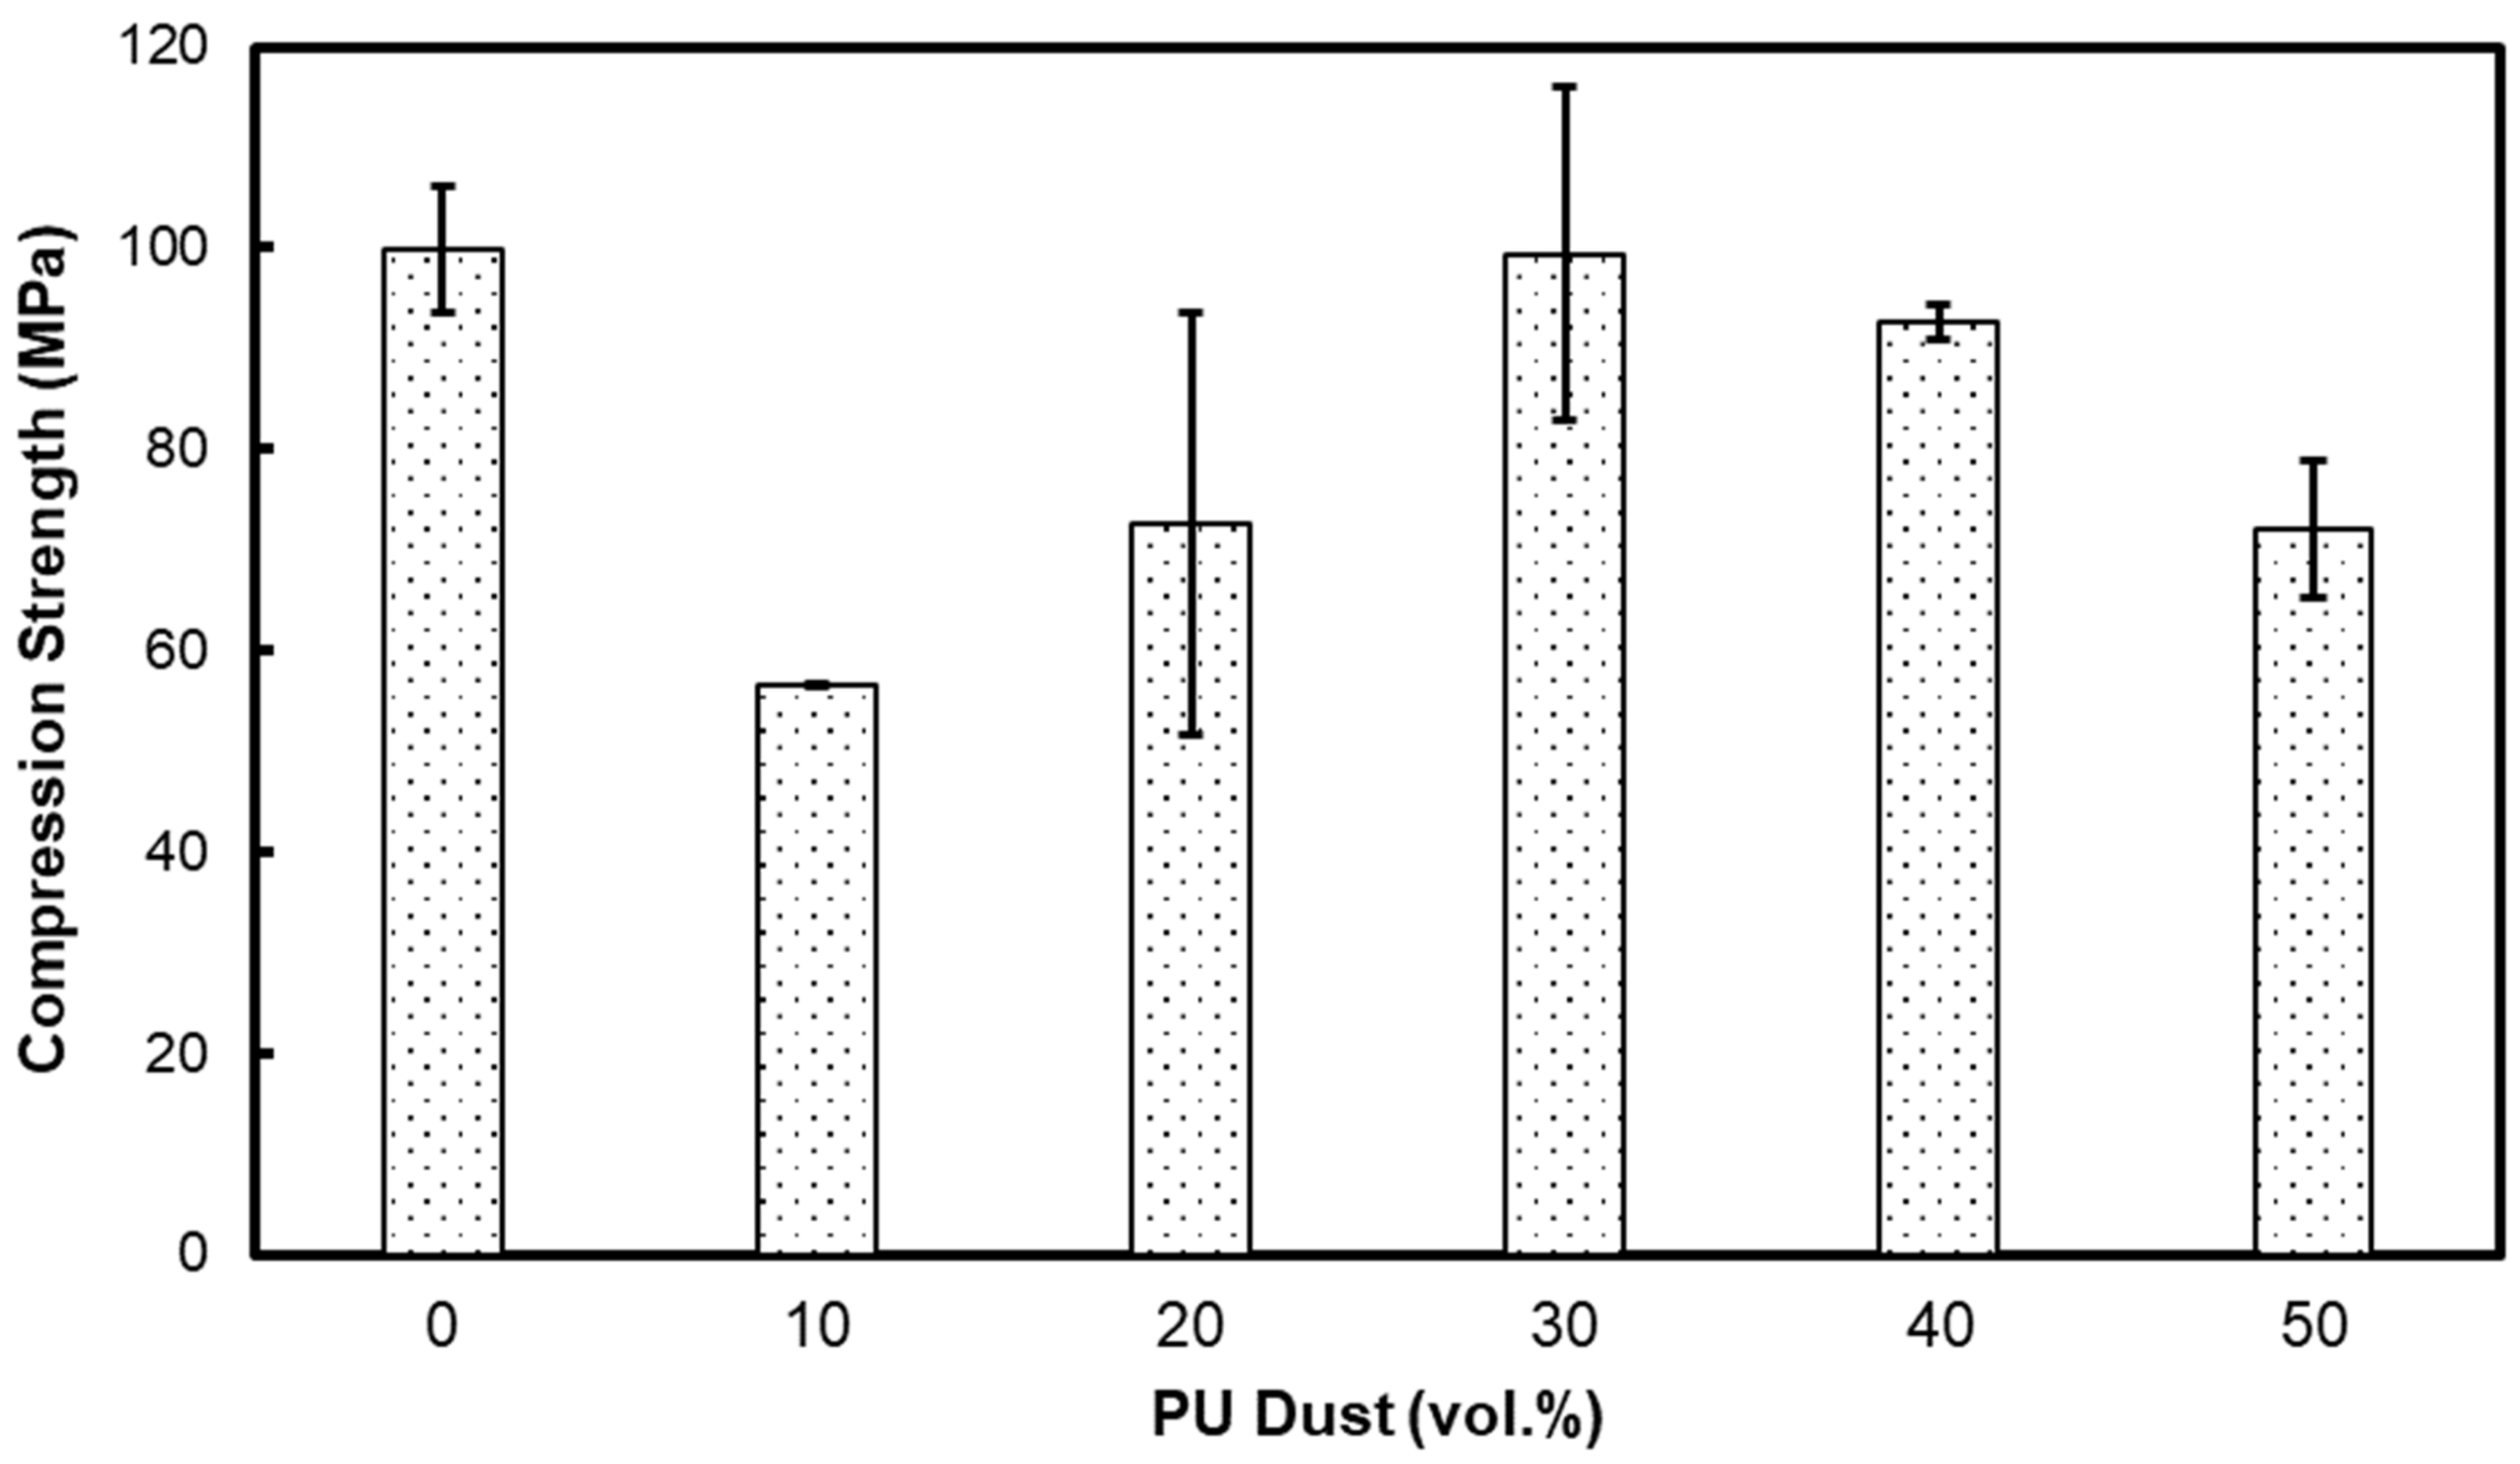
The effect of PUD volume percentage on the compression strength of the UPR-PUD composites is shown in Figure 10. The compressive strength decreased slightly upon adding small amounts of PUD (10 vol.%), as at this level the filler reduced the degree of crosslinking in the composite. However, increasing the PUD content resulted in an increase in the compressive strength of the composite, reaching a maximum value of 99.4 MPa for 30-PUD composites, which had the highest degree of crystallinity. Further increasing the PUD content to 50 vol.% reduced the compressive strength to 72.1 MPa, with the increase in porosity and voids the main reason for this reduction. Recalling the degree of crystallinity predicted by the XRD measurements, a direct relationship can be established between the compressive strength of the composites and their crystalline structure. The developed UPR-PUD composites attained higher compressive strength than that of other UPR-based composites such as UPR-rubber [24] and UPR-date seed [32], and were comparable with the compressive strength of UPR-bauxite residue composite [25] and UPR-calcined kaolin clay [38], with an advantage for the current composites in that they have a lower density. Furthermore, the proposed UPR-PUD composites achieved greater compressive strength than several lightweight insulation materials, with a compressive strength ranging from 2.4 to 3.3 MPa [39], as well as mineral wool and sisal fiber-reinforced building materials, with a strength of 3–4.5 MPa [40].
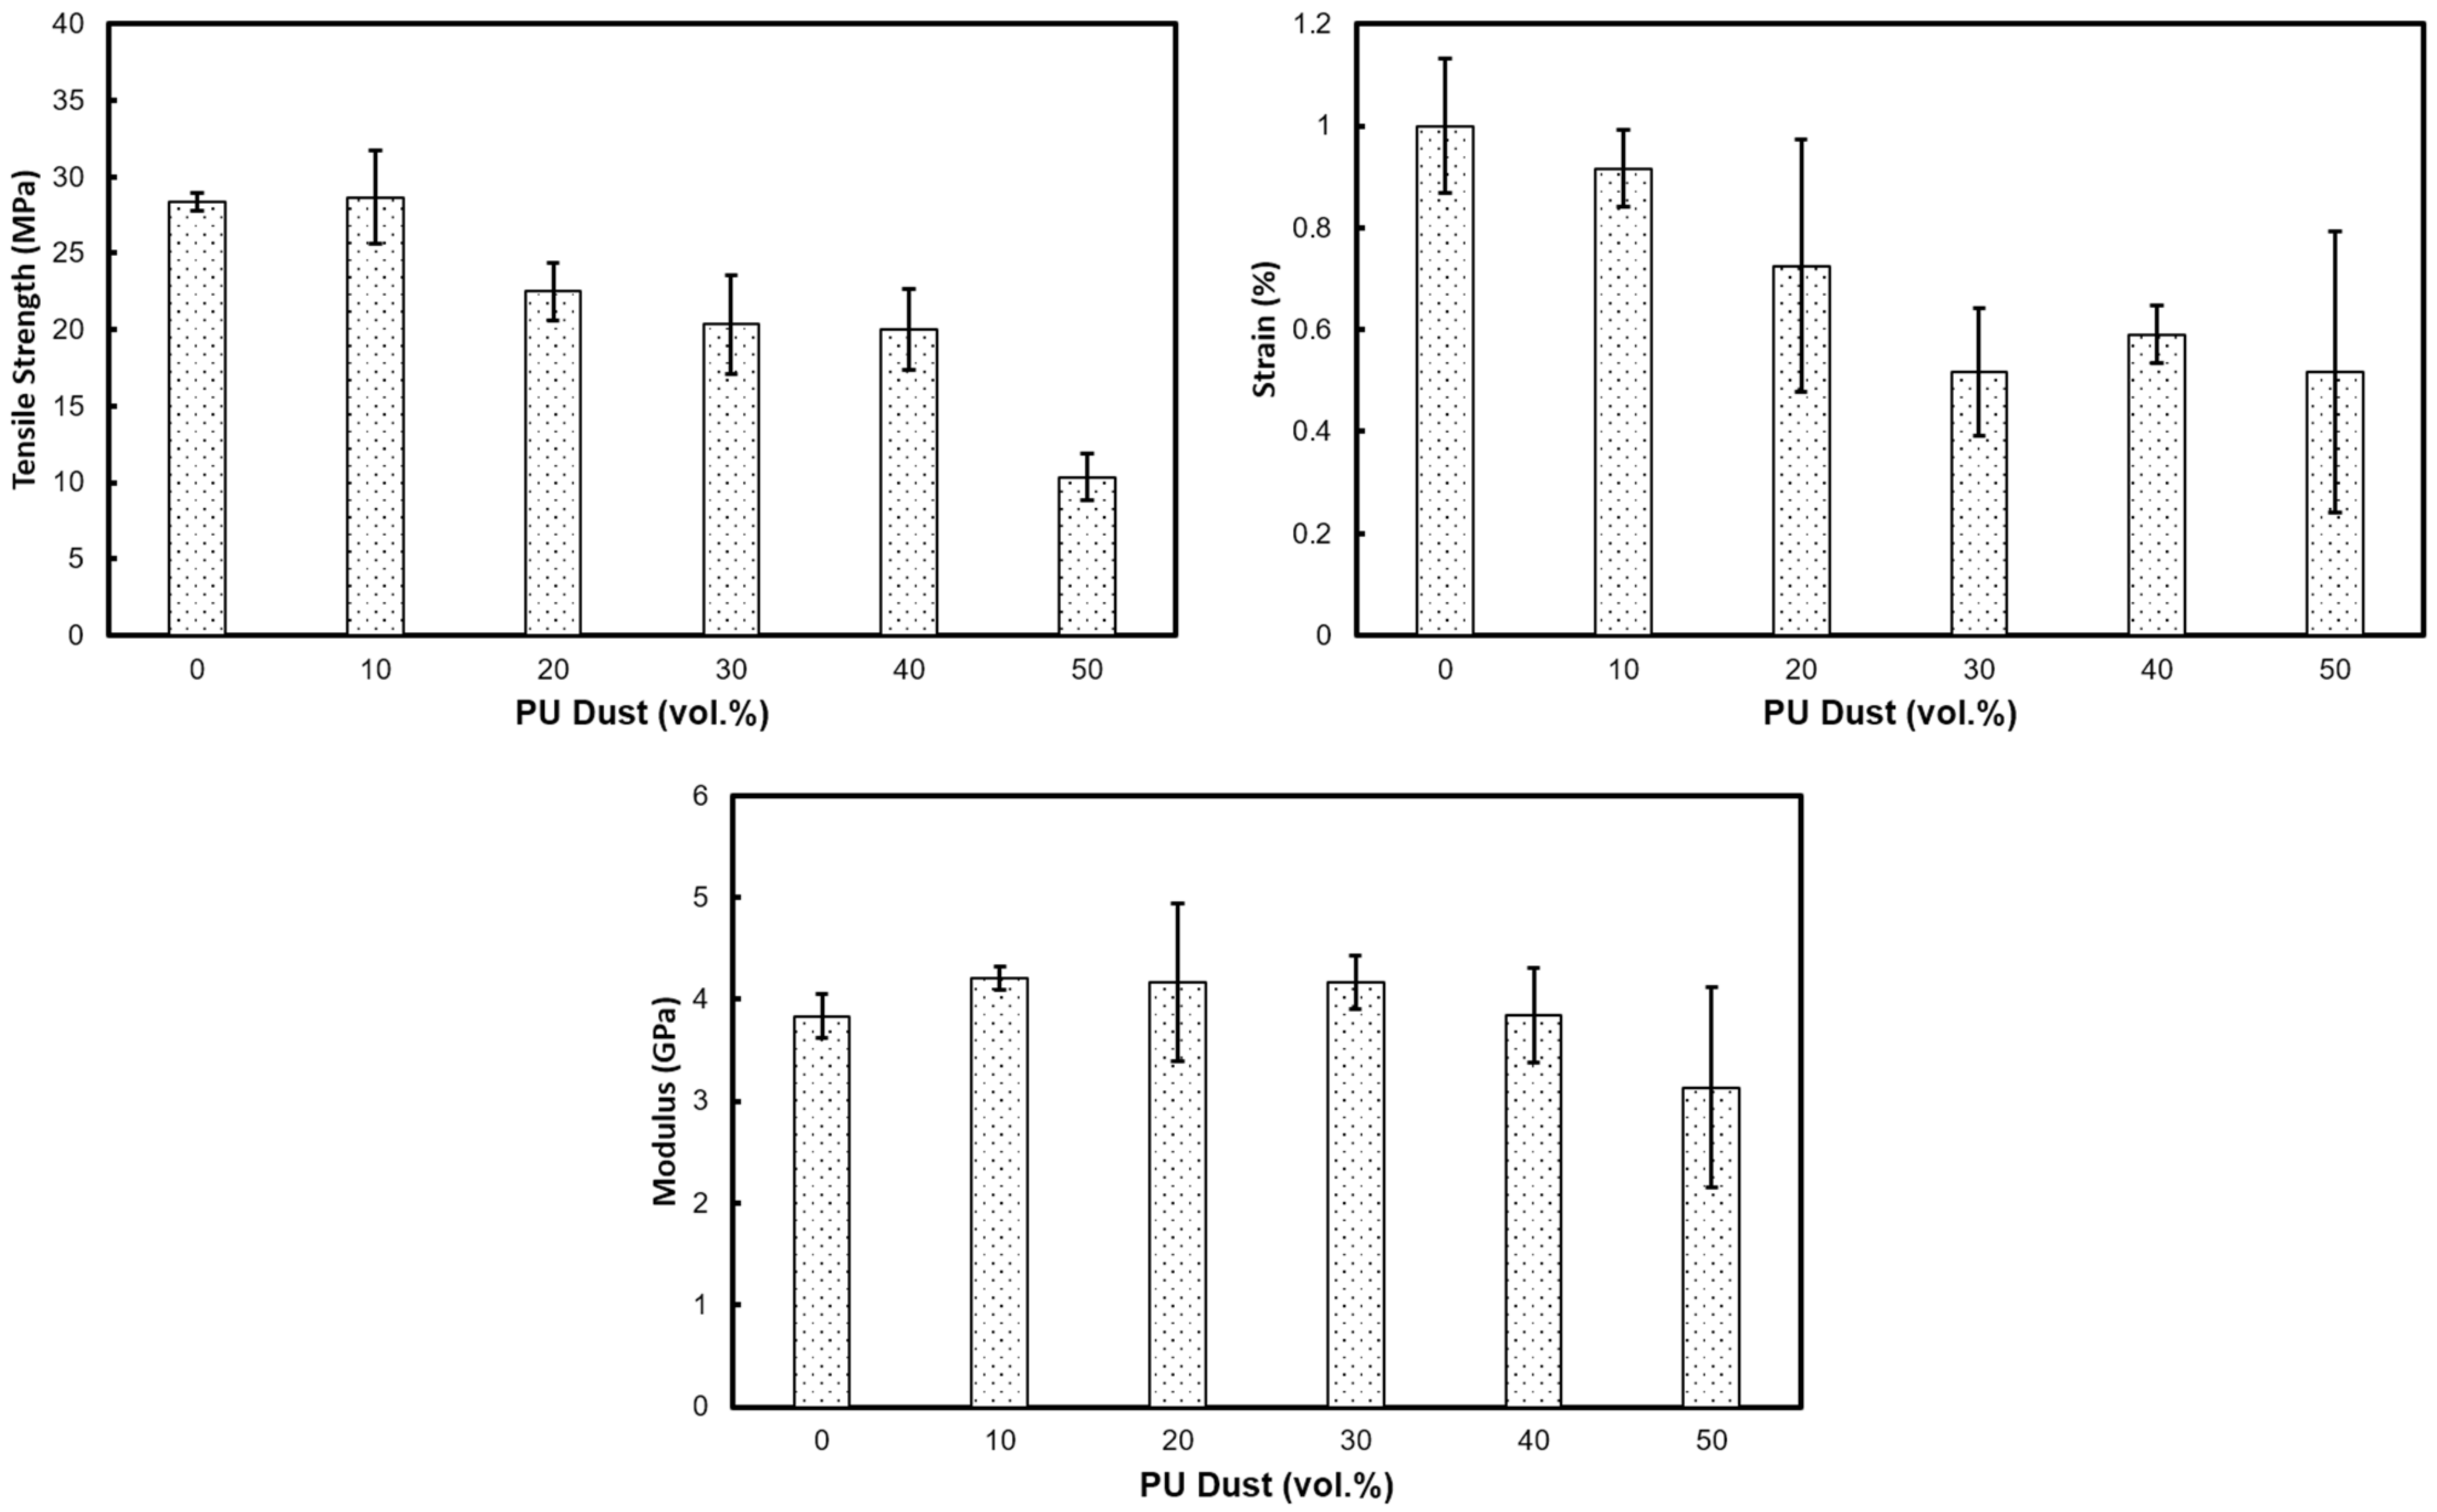
The average tensile characteristics of the UPR-PUD composites for various filler loadings are shown in Figure 11. The tensile strength of the developed composites declined as the filler content increased, starting from around 28 MPa for pure polyester and 10-PUD samples and dropping to around 10.3 Mpa for the 50-PUD composites. A similar trend was observed for the strain values, where the highest elongation of 1% was obtained for pure polyester and around 0.5% minimum elongation was exhibited by the 50-PUD samples. Moreover, Figure 11 shows that the tensile modulus of the prepared composites was enhanced slightly by the addition of PUD filler, reaching the maximum in the 30-PUD composites with a value of 4.17 GPa and decreasing to around 3.14 GPa for the 50-PUD samples. The formed crystalline structure could have possibly caused brittleness in the material which reduced the tensile properties of the UPR-PUD composites. Compared to other UPR based composites, the UPR-PUD composites demonstrate higher tensile strengths than UPR-date seed (7.7–37.6 MPa) [32] and UPR-bauxite residue (4.0–19.3 MPa) [25], and are very close to the tensile strength of UPR-red shale (20–40 MPa) [41], UPR-carbon nanotube–graphene (26–42 MPa) [42], UPR- non-metallic fractions (28–36 MPa) [43], and UPR-jute (37–43 MPa) [44]

4. Conclusions

The UPR-PUD composite presented here is a revolutionary solution for lowering landfill ratios. Because of its improved qualities, UPR-PUD composites can be employed as an alternative heat insulator. The use of PU dust lowers the cost of insulation materials while providing a viable solution to the problem of thermoset recycling and municipal waste management. Furthermore, due to their better qualities, UPR-PUD composites result in lower heating/cooling energy costs in buildings. As a result, the proposed composites for the building insulation business adhere to the circular economy’s three R’s: reduction, reuse, and recovery. The use of PU dust waste in the manufacture of thermal insulation composites with filler content varying from 0 to 50 percent volume was investigated in this work. According to the observed physical, thermal, and mechanical properties, these new UPR-PUD composites can replace traditional thermal insulation composites in the construction sector. The values for thermal conductivity and diffusivity were significantly low, and comparable with traditional insulators. Furthermore, the produced composite samples have high mechanical strength, which makes them usable for building materials alongside typical construction blocks. Low thermal conductivity (0.078 W / m · K ), low thermal diffusivity (0.0618 mm 2 / s ), low water retention (0.34 percent), and strong compressive (72.1 MPa) and tensile (10.3 MPa) strength were found in 50-PUD composites, which contained the most PUD. Furthermore, the thermal stability of polyester was enhanced slightly upon adding the PUD. Not only does the proposed unique technology allow for the recycling of PU dust, it minimizes the use of polymer-based thermal insulators. The utilization of the created composite in the building and construction industry will reduce polyurethane dust in landfills, carbon emissions from polymer manufacturing, and the other risks of PU dust.

Author Contributions

Conceptualization, B.A.-J.; methodology, B.A.-J., H.A.A., S.A., A.E.S., H.H., A.A. (Asayel Althabahi), A.A. (Alia AlAydaroos) and A.M.; validation, B.A.-J.; formal analysis, H.A.A., S.A., A.E.S., H.H., A.A. (Asayel Althabahi), A.A. (Alia AlAydaroos) and A.M.; investigation, H.A.A., S.A., A.E.S., H.H., A.A. (Asayel Althabahi), A.A. (Alia Alaydaroos) and A.M.; resources, B.A.-J.; data curation, H.A.A., S.A., A.E.S., H.H., A.A. (Asayel Althabahi), A.A. (Alia Alaydaroos) and A.M.; writing—original draft preparation, B.A.-J., H.A.A., S.A., A.E.S., H.H., A.A. (Asayel Althabahi), A.A. (Alia Alaydaroos) and A.M.; writing—review and editing, B.A.-J.; supervision, project administration, and funding acquisition, B.A.-J. All authors have read and agreed to the published version of the manuscript.

Funding

This work was supported by the UAE University (grant number G00003090) and by the National Water and Energy Center at the UAE University (grant number 12R021).

Institutional Review Board Statement

Not applicable.

Informed Consent Statement

Not applicable.

Data Availability Statement

The data presented in this study are available on request from the corresponding author.

Conflicts of Interest

The authors declare no conflict of interest.

References

  1. Bayer, O. Das Di-lsocganat-Poluadditionsverfahren (Polyurethane). Angew. Chem. 1947, 59, 257–272. [Google Scholar] [CrossRef]
  2. Akindoyo, J.O.; Beg, M.D.H.; Ghazali, S.; Islam, M.R.; Jeyaratnam, N.; Yuvaraj, A.R. Polyurethane types, synthesis and applications-a review. RSC Adv. 2016, 6, 114453–114482. [Google Scholar] [CrossRef] [Green Version]
  3. Chattopadhyay, D.K.; Raju, K.V.S.N. Structural engineering of polyurethane coatings for high performance ap-plications. Prog. Polym. Sci. 2007, 32, 352–418. [Google Scholar] [CrossRef]
  4. Kiss, G.; Rusu, G.; Peter, F.; Tănase, I.; Bandur, G. Recovery of Flexible Polyurethane Foam Waste for Efficient Reuse in Industrial Formulations. Polymers 2020, 12, 1533. [Google Scholar] [CrossRef] [PubMed]
  5. Yang, W.; Dong, Q.; Liu, S.; Xie, H.; Liu, L.; Li, J. Recycling and Disposal Methods for Polyurethane Foam Wastes. Procedia Environ. Sci. 2012, 16, 167–175. [Google Scholar] [CrossRef]
  6. Członka, S.; Bertino, M.F.; Strzelec, K.; Strąkowska, A.; Masłowski, M. Rigid polyurethane foams reinforced with solid waste generated in leather industry. Polym. Test. 2018, 69, 225–237. [Google Scholar] [CrossRef]
  7. Emadian, S.M.; Onay, T.T.; Demirel, B. Biodegradation of bioplastics in natural environments. Waste Manag. 2017, 59, 526–536. [Google Scholar] [CrossRef]
  8. Ragaert, K.; Delva, L.; Van Geem, K. Mechanical and chemical recycling of solid plastic waste. Waste Manag. 2017, 69, 24–58. [Google Scholar] [CrossRef]
  9. Sentryair, Reducing Occupational Exposure to Polyurethane Foam Dust. Available online: https://www.sentryair.com/blog/manufacturing/reducing-occupational-exposure-to-polyurethane-foam-dust/ (accessed on 14 June 2021).
  10. Nifuku, M.; Tsujita, H.; Fujino, K.; Takaichi, K.; Barre, C.; Paya, E.; Hatori, M.; Fujiwara, S.; Horiguchi, S.; Sochet, I. Ignitability assessment of shredder dusts of refrigerator and the prevention of the dust explosion. J. Loss Prev. Process. Ind. 2006, 19, 181–186. [Google Scholar] [CrossRef]
  11. Deng, Y.; Dewil, R.; Appels, L.; Ansart, R.; Baeyens, J.; Kang, Q. Reviewing the thermo-chemical recycling of waste polyurethane foam. J. Environ. Manag. 2021, 278, 111527. [Google Scholar] [CrossRef]
  12. Gama, N.; Godinho, B.; Marques, G.; Silva, R.; Barros-Timmons, A.; Ferreira, A. Recycling of polyurethane scraps via acidolysis. Chem. Eng. J. 2020, 395, 125102. [Google Scholar] [CrossRef]
  13. Simón, D.; Borreguero, A.M.; De Lucas, A.; Rodríguez, J. Recycling of polyurethanes from laboratory to industry, a journey towards the sustainability. Waste Manag. 2018, 76, 147–171. [Google Scholar] [CrossRef]
  14. Krosch, K.; Krosch, B.; Krosch, M.; Ecker, R. Recycling Process and Apparatus for Rigid Polyurethane Foam. U.S. Patent 5525278, 11 June 1996. [Google Scholar]
  15. Zia, K.M.; Bhatti, H.N.; Bhatti, I.A. Methods for polyurethane and polyurethane composites, recycling and recovery: A review. React. Funct. Polym. 2007, 67, 675–692. [Google Scholar] [CrossRef]
  16. El-Meligy, M.G.; Mohamed, S.H.; Mahani, R.M. Study mechanical, swelling and dielectric properties of prehy-drolysed banana fiber–waste polyurethane foam composites. Carbohydr. Polym. 2010, 80, 366–372. [Google Scholar] [CrossRef]
  17. Fornasieri, M.; Alves, J.W.; Muniz, E.C.; Ruvolo-Filho, A.; Otaguro, H.; Rubira, A.F.; De Carvalho, G.M. Synthesis and characterization of polyurethane composites of wood waste and polyols from chemically recycled pet. Compos. Part A Appl. Sci. Manuf. 2011, 42, 189–195. [Google Scholar] [CrossRef] [Green Version]
  18. Otto, G.P.; Moisés, M.P.; Carvalho, G.; Rinaldi, A.W.; Garcia, J.C.; Radovanovic, E.; Fávaro, S.L. Mechanical properties of a polyurethane hybrid composite with natural lignocellulosic fibers. Compos. Part B Eng. 2017, 110, 459–465. [Google Scholar] [CrossRef]
  19. Vicario, I.S.; Cuenca-Romero, L.A.; González, S.G.; Carpintero, V.C.; Saiz, R. Design and Characterization of Gypsum Mortars Dosed with Polyurethane Foam Waste PFW. Materials 2020, 13, 1497. [Google Scholar] [CrossRef] [Green Version]
  20. Li, Q.; Pang, Y.; Liu, X.; Xi, E.; Mao, A.; Wan, H. Addition of Polyurethane Foam Waste to Polymeric Diphenyl Methane Diisocyanate to Improve Plywood Binder Performance. For. Prod. J. 2020, 70, 262–267. [Google Scholar] [CrossRef]
  21. Calvo-Correas, T.; Ugarte, L.; Larraza, I.; Peña-Rodríguez, C.; Corcuera, M.A.; Eceiza, A. Residues from rigid foams and graphene for the synthesis of hybrid polyurethane flexible foams composites. J. Mater. Res. Technol. 2021, 12, 2128–2137. [Google Scholar] [CrossRef]
  22. Zhang, H.; Su, C.; Bu, X.; Zhang, Y.; Gao, Y.; Huang, M. Laboratory investigation on the properties of polyure-thane/unsaturated polyester resin modified bituminous mixture. Constr. Build. Mater. 2020, 260, 119865. [Google Scholar] [CrossRef]
  23. Hejna, A.; Kosmela, P.; Olszewski, A.; Zedler, Ł.; Formela, K. The impact of ground tire rubber treatment on the thermal conductivity of flexible polyurethane/ground tire rubber composites. In Proceedings of the 1st International Scientific and Practical Conference, Tallinn, Estonia, 16–18 December 2020; pp. 1062–1068. [Google Scholar]
  24. Abu-Jdayil, B.; Mourad, A.-H.; Hussain, A. Thermal and physical characteristics of polyester–scrap tire composites. Constr. Build. Mater. 2016, 105, 472–479. [Google Scholar] [CrossRef]
  25. Adi, M.; Abu-Jdayil, B.; Al Ghaferi, F.; Al Yahyaee, S.; Al Jabri, M. Seawater-Neutralized Bauxite Residue–Polyester Composites as Insulating Construction Materials. Buildings 2021, 11, 20. [Google Scholar] [CrossRef]
  26. Cherian, A.B.; Abraham, B.T.; Thachil, E.T. Modification of unsaturated polyester resin by polyurethane prepol-ymers. J. Appl. Polym. Sci. 2006, 100, 449–456. [Google Scholar] [CrossRef]
  27. Dias, R.C.M.; Góes, A.M.; Serakides, R.; Ayres, E.; Oréfice, R.L. Porous biodegradable polyurethane nanocompo-sites: Preparation, characterization, and biocompatibility tests. Mater. Res. 2010, 13, 211–218. [Google Scholar] [CrossRef]
  28. Mohanty, A.K.; Misra, M.; Drzal, L.T. (Eds.) Natural Fibers, Biopolymers, and Biocomposites; CRC Press Taylor & Francis Group: New York, NY, USA, 2005. [Google Scholar]
  29. Abu-Jdayil, B. Unsaturated Polyester Microcomposites. In Unsaturated Polyester Resins; Elsevier: Amsterdam, The Netherlands, 2019; pp. 67–100. [Google Scholar]
  30. Abu-Jdayil, B.; Adi, M.; Al Ghaferi, F.; Al Yahyaee, S.; Al Jabri, M. Physical and thermal insulation properties of the composites based on seawater-neutralised bauxite residue. J. Hazard. Mater. 2021, 403, 123723. [Google Scholar] [CrossRef]
  31. García, N.A.W.; Sánchez, J.L.A.; Ortiz, R.V.; Macías, A.H.; Ramírez, N.F.; Palazuelos, E.A.; Valenzuela, J.F.; Beltrán, A.C.; Beltrán, C.G.A. Physical and mechanical properties of unsaturated polyester resin matrix from recycled PET (based PG) with corn straw fiber. J. Appl. Polym. Sci. 2021, 138, 51305. [Google Scholar] [CrossRef]
  32. Abu-Jdayil, B.; Mourad, A.-H.I.; Hussain, A.; Al Abdallah, H. Thermal insulation and mechanical characteristics of polyester filled with date seed wastes. Constr. Build. Mater. 2022, 315, 125805. [Google Scholar] [CrossRef]
  33. Abu-Jdayil, B.; Mourad, A.-H.; Hassan, M. Development of polymeric heat insulators based on emirati red shale filler: Thermal and physical properties. Polym. Compos. 2018, 39, E1463–E1473. [Google Scholar] [CrossRef]
  34. Raju, N.S.; Reddy, M.I.; Kumar, M.A.; Ramji, K. Study on thermo physical properties of hemp, jute and glass fiber reinforced polyester composites. Mater. Today Proc. 2018, 5, 5918–5924. [Google Scholar] [CrossRef]
  35. Tiskatine, R.; Bougdour, N.; Oaddi, R.; Gourdo, L.; Rahib, Y.; Bouzit, S.; Bazgaou, A.; Bouirden, L.; Ihlal, A.; Aharoune, A. Thermo-physical analysis of low-cost ecological composites for building construction. J. Build. Eng. 2018, 20, 762–775. [Google Scholar] [CrossRef]
  36. Shi, X.; Jiang, S.; Zhu, J.; Li, G.; Peng, X. Establishment of a highly efficient flame-retardant system for rigid polyu-rethane foams based on bi-phase flame-retardant actions. RSC Adv. 2018, 8, 9985–9995. [Google Scholar] [CrossRef] [Green Version]
  37. Abu-Jdayil, B.; Mourad, A.-H.; Hittini, W.; Hassan, M.; Hameedi, S. Traditional, state-of-the-art and renewable thermal building insulation materials: An overview. Constr. Build. Mater. 2019, 214, 709–735. [Google Scholar] [CrossRef]
  38. Sarde, B.; Patil, Y.; Dholakiya, B.; Pawar, V. Effect of calcined kaolin clay on mechanical and durability properties of pet waste-based polymer mortar composites. Constr. Build. Mater. 2022, 318, 126027. [Google Scholar] [CrossRef]
  39. Khedari, J.; Suttisonk, B.; Pratinthong, N.; Hirunlabh, J. New lightweight composite construction materials with low thermal conductivity. Cem. Concr. Compos. 2001, 23, 65–70. [Google Scholar] [CrossRef]
  40. Gutiérrez-Orrego, D.A.; Garcia-Aristizabal, E.F.; Gomez-Botero, M.A. Mechanical and Physical Properties of Soil-Cement Blocks Reinforced with Mineral Wool and Sisal Fiber. J. Mater. Civ. Eng. 2017, 29, 04016225. [Google Scholar] [CrossRef]
  41. Mourad, A.-H.I.; Abu-Jdayil, B.; Hassan, M. Mechanical behavior of Emirati red shale fillers/unsaturated polyester composite. SN Appl. Sci. 2020, 2, 497. [Google Scholar] [CrossRef] [Green Version]
  42. Badakhsh, A.; Lee, Y.-M.; Rhee, K.Y.; Park, C.W.; An, K.-H.; Kim, B.-J. Improvement of thermal, electrical and mechanical properties of composites using a synergistic network of length controlled-CNTs and graphene nanoplatelets. Compos. Part B Eng. 2019, 175, 107075. [Google Scholar] [CrossRef]
  43. Kovačević, T.; Rusmirović, J.; Tomić, N.; Mladenović, G.; Milošević, M.; Mitrović, N.; Marinković, A. Effects of oxi-dized/treated non-metallic fillers obtained from waste printed circuit boards on mechanical properties and shrinkage of un-saturated polyester-based composites. Polym. Compos. 2019, 40, 1170–1186. [Google Scholar] [CrossRef]
  44. Hossain, S.; Chowdhury, A.M.S.; Khan, R.A. Effect of disaccharide, gamma radiation and temperature on the physico-mechanical properties of jute fabrics reinforced unsaturated polyester resin-based composite. Radiat. Eff. Defects Solids 2017, 172, 517–530. [Google Scholar] [CrossRef]
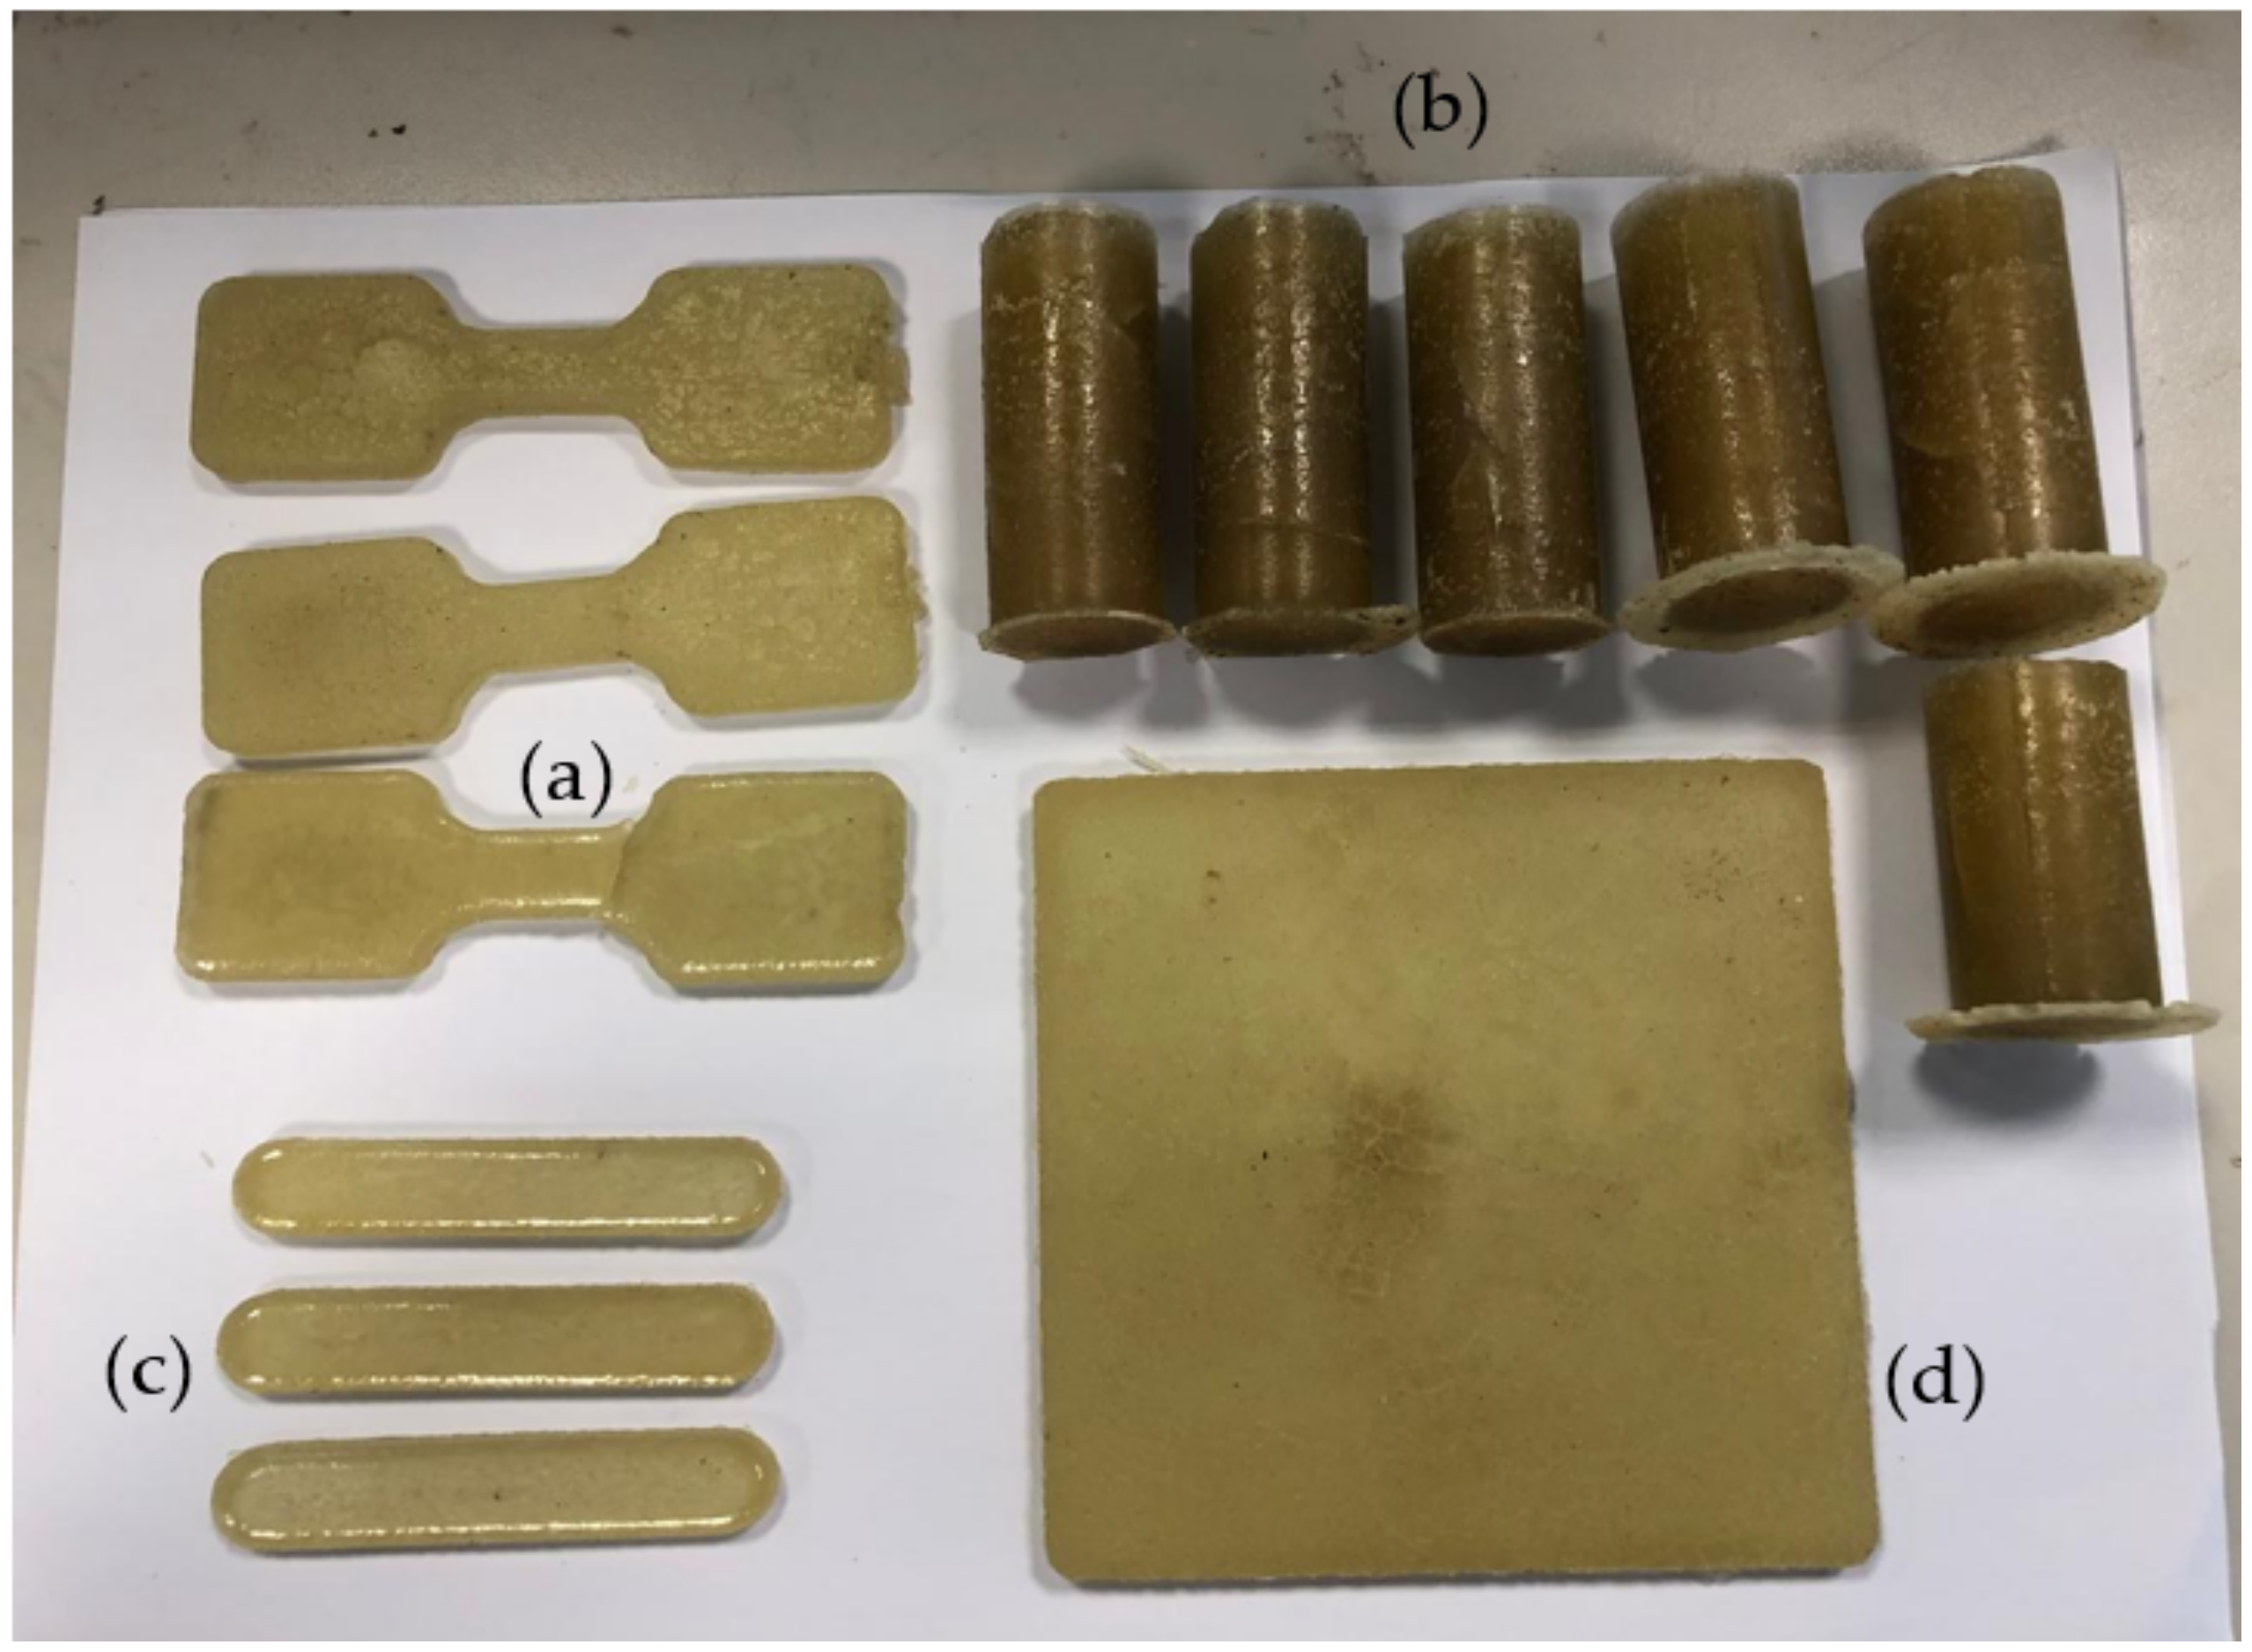
Figure 1. UPR-PUD composite samples for (a) Tensile test, (b) compression and water retention tests, (c) flexural test and (d) thermal conductivity test.
Buildings 12 00126 g001
Figure 2. SEM images of (a) pure polyester, (b) 10-PUD, (c) 30-PUD (d) and 50-PUD composites.
Buildings 12 00126 g002
Figure 3. FTIR analysis for (a) UPR, 10PUD, 30-PUD and 50-PUD composites; (b) pure UPR and PUD.
Buildings 12 00126 g003aBuildings 12 00126 g003b
Figure 4. XRD analysis for pure polyester, PU dust, 10-PUD, 30-PUD and 50-PUD composites.
Buildings 12 00126 g004
Figure 5. Experimental and theoretical density versus PU dust content.
Buildings 12 00126 g005
Figure 6. (a) Thermal conductivity and (b) heat capacity and thermal diffusivity of UPR-PUD composites.
Buildings 12 00126 g006aBuildings 12 00126 g006b
Figure 7. DSC thermal profile of UPR-PUD composites: (a) first and (b) second heating cycle.
Buildings 12 00126 g007aBuildings 12 00126 g007b
Figure 8. Thermograms of UPR, PUD and UPR-PUD composites: (a) TGA and (b) DTG.
Buildings 12 00126 g008aBuildings 12 00126 g008b
Figure 9. Water retention for UPR-PUD composites (a) at room temperature and (b) at 50 °C.
Buildings 12 00126 g009
Figure 10. Effect of PU Dust content on the compressive strength of developed composites.
Buildings 12 00126 g010
Figure 11. Tensile strength properties of UPR-PUD composites.
Buildings 12 00126 g011
Table 1. TGA results of UPR-PUD composites.
SamplesT50Final Mass Residue %
PU Dust38523.1
50 vol.% polyurethane4146.2
30 vol.% polyurethane4135.1
10 vol.% polyurethane4093.8
Pure polyester4133.4839
Publisher’s Note: MDPI stays neutral with regard to jurisdictional claims in published maps and institutional affiliations.