Article

Out-of-Plane Tensile Properties of Cross Laminated Timber (CLT)

by
Reinhard Brandner
1,* and
Lukas Jantscher
2
1
Institute of Timber Engineering and Wood Technology, Graz University of Technology, Inffeldgasse 24/I, 8010 Graz, Austria
2
Woodplan GmbH, Humboldtstraße 4, 8010 Graz, Austria
*
Author to whom correspondence should be addressed.
Buildings 2022, 12(2), 135; https://doi.org/10.3390/buildings12020135
Submission received: 26 December 2021 / Revised: 14 January 2022 / Accepted: 18 January 2022 / Published: 27 January 2022
(This article belongs to the Special Issue Timber Structures: Latest Developments, Challenges, and Perspectives)

Abstract

:
A systematic investigation is still lacking for tension out-of-plane in cross laminated timber (CLT), as a planar timber construction product. The objectives of the present study are the determination of the tensile properties of CLT made of Norway spruce, the identification of essential product-specific influencing parameters and a comparative analysis with glulam. For this purpose, seven test series were defined, which allowed the determination of the tensile properties on board segments and thereof produced glulam and CLT specimens by varying the number of layers, layer orientation and number of elements within a layer. The orthogonal laminated structure of CLT led to between 50% and 70% higher tensile properties out-of-plane, which is explained by the different stress distribution compared to glulam; the regulation of 30% higher properties than for glulam is suggested. In addition, the lognormal distribution turned out to be a more representative distribution model for characterizing the tensile strength out-of-plane than the Weibull distribution. This was also confirmed with regard to the investigated serial and parallel system effects, in which a clearly more homogeneous behavior was found in CLT compared to glulam, which in turn can be attributed again to the different stress distributions.

1. Introduction

In timber engineering, the doctrine of avoiding a planned tensile perpendicular to grain stresses wherever possible is well known, especially in combination with shear stresses (Spengler [1]; Hemmer [2]; SIA 265 [3]). The reasons for this are: (i) the generally low strength and elastic properties in tension perpendicular to the grain and shear, whereby the resistance of timber rapidly reduces when both stresses interact; (ii) the associated relatively brittle failure mode; as well as (iii) the high sensitivity of these properties in regard to wood moisture variations already in the course of normal climatic fluctuations (e.g., Ranta-Maunus [4]; Aicher and Dill-Langer [5]; Barrett [6]). In particular point results in additional internal stresses and cracking in combination with crack propagation and thus in a reduced cross section and resistance. A number of structural elements are in use, however, such as tapered, curved and pitched cambered beams, together with details such as notches, openings and joints, where stresses in tension perpendicular to the grain, often in combination with shear, are present and need to be considered in the design and execution. Therefore, reliable and realistic basic strength and elastic properties for tension perpendicular to the grain are required, which, looking for example at the European standards, are regulated on a very conservative basis, that is, the sensitivity to moisture and associated cracking are somehow implicitly considered in the basic properties, for example, for structural timber in EN 338 [7] and for glued laminated timber (glulam; GLT) in EN 14080 [8].
In general, a complete set of strength and elastic properties is needed, for any new timber product intended to be used for structural, load-bearing purposes; these properties may be either determined from tests or from analogue considerations with already established timber construction products. In the course of this determination, timber is to be regarded as a cylindrically orthotropic material, that is, featuring different material properties in axial, radial and tangential fiber directions, albeit treated and regulated further as transversely isotropic in engineering terms, that is, differentiation in properties is made only in parallel and perpendicular to the grain. Following this principle, it becomes clear that the mechanical properties perpendicular to the grain of usually prismatic structural timber, so-called off-axis properties (properties, which follow the cartesian coordinate system of the timber member, that is, the outer, product coordinate system) vary over the cross-section depending on the local annual ring pattern. This can be shown by corresponding coordinate transformations of the on-axis properties, which follow the natural cylindrically orthotropic material coordinate system, that is, the inner, material coordinate system (under the assumption of linear-elastic material behavior, see e.g., Aicher and Dill-Langer [5,9]; Ranta-Maunus [4]; Canisius [10]; Blaß and Schmid [11]; Dill-Langer [12]). As a result of the high ratios between modulus of elasticity and shear modulus in the radial-tangential plane, one outcome of this coordinate transformation is what is known as shear-coupling effects; see for example, Dill-Langer [12].
By gluing structural timber members to unidirectional or orthogonal linear or planar products, such stress concentrations in the individual cross-sections of the base material are additionally supplemented and partly also enhanced by the rigid composite action between the members, which are usually composed right to left, that is, the inner (pith face) to the outer side face (bark face; see e.g., Pedersen et al. [13]; Dill-Langer [12]). Additionally, the variation in annual ring patterns, caused, for example, by varying radial distance to the pith, results in an unnatural, heterogenous property profile over the cross section of such products. In unidirectionally laminated linear products, such as glulam, consisting of structural timber usually cut symmetrically to the pith, the stresses in tension perpendicular to the grain are normally maximal in the middle of the width. In depth the stresses are more homogeneous, with peaks at the glue lines. Micro cracks usually initiate at the zones of maximal stresses, which accumulate to macro cracks and finally to total fractures (e.g., Aicher et al. [14]; Dill-Langer [12]).
In the case of orthogonal lamination, in addition strain restrictions in the transverse direction need to be considered. Under these circumstances it should not be surprising that basic properties out-of-plane for glulam and other timber construction products as well as all members with special shapes and structural details where such stresses occur and need to be considered in the design process are intensively discussed in the literature (e.g., Barrett [6]; Mistler [15,16]; Aicher and Dill-Langer [5,9]; Ranta-Maunus [4]; Blaß and Schmid [11]; Pedersen et al. [13]; Dill-Langer [12]). One prominent example of this ongoing discourse is the treatment and regulation of size effects, which are either argued from a mechanical (e.g., Blaß and Schmid [11]; Pedersen et al. [13]; Astrup et al. [17]), purely probabilistic (e.g., Barrett [6]) or probabilistic-mechanical point of view (e.g., Mistler [15,16]; Dill-Langer [12]).
Cross laminated timber (CLT), which will be in foreground in the following, is a plane-like, large dimensional load-bearing timber construction product. CLT usually consists of orthogonally laminated boards or lamellas, whereby the lamellas are characterized by lengthwise finger jointed boards. These boards or lamellas are arranged in a symmetric layup, whereby the layers are usually side-face bonded to each other to create a rigid composite structure. Between the boards or lamellas of one layer there can be either no bond in combination with or without gaps of irregular width, whereby gaps in common products are as a rule largely closed, or a narrow-face bond, which is currently seldom intended for load-bearing purposes. Special CLT-like products featuring regular spacing between boards or lamellas within a layer, as for example discussed in Silly et al. [18] and Franzoni et al. [19], are not treated in the following; findings in this context, however, might be applicable in the form of an analogy. Because of its massive/solid character, its relatively high resistance and stiffness against loads in and out-of-plane and its large dimensions, in width up to 3.5 m, in length up to 20 m and in thickness multiple times {3; 5; 7; …} the lamella/layer thickness of commonly t = {20; 30; 40} mm up to 500 mm, common CLT is usually applied as a large two-dimensional wall, floor and roof element, but also as a one-dimensional girder (e.g., Brandner et al. [20]). With a look on PT SC5.T1 [21] and ÖNORM B 1995-1-1 [22], Annex K, many CLT properties are regulated analogue to the properties of glulam and in the last years and decades manifold research projects have been conducted to either confirm made assumptions or to establish new models or adaptations for the existing.
Investigations on the tensile properties out-of-plane for CLT are relatively limited, despite the fact that this product was developed in its current version in Central Europe about 25 years ago. In respect to investigations on the basic strength and elastic properties in tension out-of-plane, only the works of Bidakov [23] and Bidakov and Raspopov [24] are known to the authors. They analyzed experimentally (i) the differences between unidirectional and orthogonal lamination by testing specimens consisting of two side-face bonded board segments with w × t × = 150 × 30 × 150 mm3 as well as (ii) system effects in plane by testing five-layer CLT specimen of w × t × = 300 × 150 × 300 mm3 consisting of side-face bonded board segments featuring the same cross section as in the two-layer specimens in (i). The base material was pine (Pinus sylvestris), which, apart from excluding checks, was ungraded. Unfortunately, the outcomes are unclear in respect to comparability of different test series and applied setups, as information on density and moisture content together with other basic parameters and properties are not provided in these works. In contrast to the commonly reported findings in the literature, for specimens loaded in tangential direction Bidakov [23] reports higher strength values than for radially loaded specimens; please compare for example with Markwardt and Youngquist [25] (apart from Southern Yellow Pine, ft,90,rad,mean/ft,90,tan,mean = 1.28 to 1.56, on average 1.44 MPa; various coniferous and deciduous species; clear wood), Bröker [26] (ft,90,rad,mean = 2.84 MPa, ft,90,tan,mean = 1.16 MPa; Et,90,rad,mean = 620 MPa, Et,90,tan,mean = 440 MPa; Picea abies; clear wood) and Blaß and Schmid [11] (ft,90,mainly-rad,mean = 2.55 MPa, ft,90,mainly-tan,mean = 1.80 MPa; Picea abies; clear wood). According to ÖNORM B 1995-1-1 [22], which is currently the only national European standard that also provides regulations for CLT, the tensile strength out-of-plane of single CLT layers is given dependent on the tensile strength perpendicular to the grain of the base material, which is multiplied by the system factor ksys ≥ 1.00 in accordance with this standard. This to consider the planar structure of CLT, that is, to account for the common action of more than one lamella within the same layer in zones exposed to tensile stresses out-of-plane.
Apart from this research and regulations on the basic properties, applications of curved CLT plates, which are under planned tensile stresses out-of-plane due to their shape, are analyzed in Stecher et al. [27] and Stecher [28]; a corresponding product is assessed in ETA-16/0055 [29]. Notched CLT plates are investigated in Serrano [30,31], Serrano et al. [32], Serrano and Danielsson [33] and Malagic et al. [34]. They demonstrate the need to treat structural details in CLT exposed to tensile stresses out-of-plane in a manner that is different to that for unidirectionally laminated timber products, because of their orthogonal lamination. This aspect is also of relevance in conjunction with potential delamination during pull-out of fasteners, which are applied in the narrow face of CLT, as for example in case of glued-in rods; see e.g., Azinović et al. [35] and Ayansola et al. [36]. A quick overview of some common details and applications of CLT where tensile stresses out-of-plane need to be considered is presented in Figure 1.
The basic product properties and potential influencing parameters are still unknown, however, for all these applications and their detailing. By identifying this research gap, a project was initiated in 2019 aiming at the determination of these still missing basic CLT properties and its main influencing product parameters, both numerically and experimentally; see Jantscher [37]. The outcomes of these comprehensive investigations together with new findings are presented in the following.
In order to focus later primarily on influencing parameters specifically for CLT, for example, effects coming from its orthogonal structure as well as its production and layup parameters, major influencing parameters on tensile properties out-of-plane, which are already well-known for structural timber and unidirectionally laminated products like glulam, are briefly summarized. One of these parameters, already mentioned earlier, is the annual ring pattern. Another parameter is the volume which is exposed to tensile stresses perpendicular to the grain. Because of the latter, basic properties determined by testing usually refer to reference specimen dimensions; according to EN 408 [38], for structural timber these are given as w × h × = 45 × 180 × 70 mm3. For glulam, the same standard regulates a reference volume, Vref, of 0.01 m3 together with w × = 25,000 mm2 (for w ≥ 100 mm, this results in ≤ 250 mm) and h = 400 mm. In addition, there are some specific growth characteristics, in particular pith (approximately 50% lower resistance) and ring shake, which both significantly reduce the tensile strength perpendicular to the grain (e.g., Blaß and Schmid [11]; Dill-Langer [12]; Stuefer [39]). Stuefer [39] additionally identified seasoning checks as another important parameter which also led to an approximately 50% reduction in strength. Blaß and Schmid [11] and Bidakov [23] report density, if any, as parameter with minor influence on the tensile properties perpendicular to the grain. In unidirectionally laminated products like glulam, in addition the number of layers, their dimension and arrangement to each other (staggered or aligned; right on left side or right on right or left on left) additionally affect the stress distribution within the cross section and thus the overall behavior and properties in tension perpendicular to the grain.
Usually, the tensile strength perpendicular to the grain is also associated with high uncertainties, that is, high coefficients of variation CV(ft,90); a brief summary is presented in Table 1. Reasons can therefore be argued again by the irregular occurrence of local timber characteristics in test series featuring an enormous influence on the strength, such as pith, seasoning checks and ring shake. In addition, looking at the values in Table 1, it turns out that the uncertainties in glulam and structural timber are on the same level, that is, because of the local stress concentrations failures are governed by local timber properties in boards or lamellas in the highest stressed cross-sectional area. Thus, no or at least only a limited amount of homogenization between the lamellas occurs, at least when testing out-of-plane. Overall, for CV(ft,90) in glulam and structural timber a bandwidth of 10 to 40% might be concluded, on average between 20 to 30%. For comparison, the probabilistic model code of JCSS 3.5 [40] gives for coniferous structural timber CV(ft,90) = 30% but no value for glulam.
To summarize: although much is already known about the tensile properties perpendicular to the grain of structural timber and the serial action in unidirectionally laminated and at the side-faces rigidly bonded products like glulam, knowledge about the parallel interaction of boards or lamellas in planar structural components, like in layers, in combination with serial action between several orthogonal layers, as it is the case in CLT elements exposed to tension out-of-plane, is still lacking and insufficient. Thus, the aim is to present data and to discuss the basic tensile properties out-of-plane for CLT made of Norway spruce. Thereby, also relevant influencing parameters related to the product are identified and analogies between CLT and glulam, as frequently used for many other mechanical properties, are analyzed as well.

2. Materials and Methods

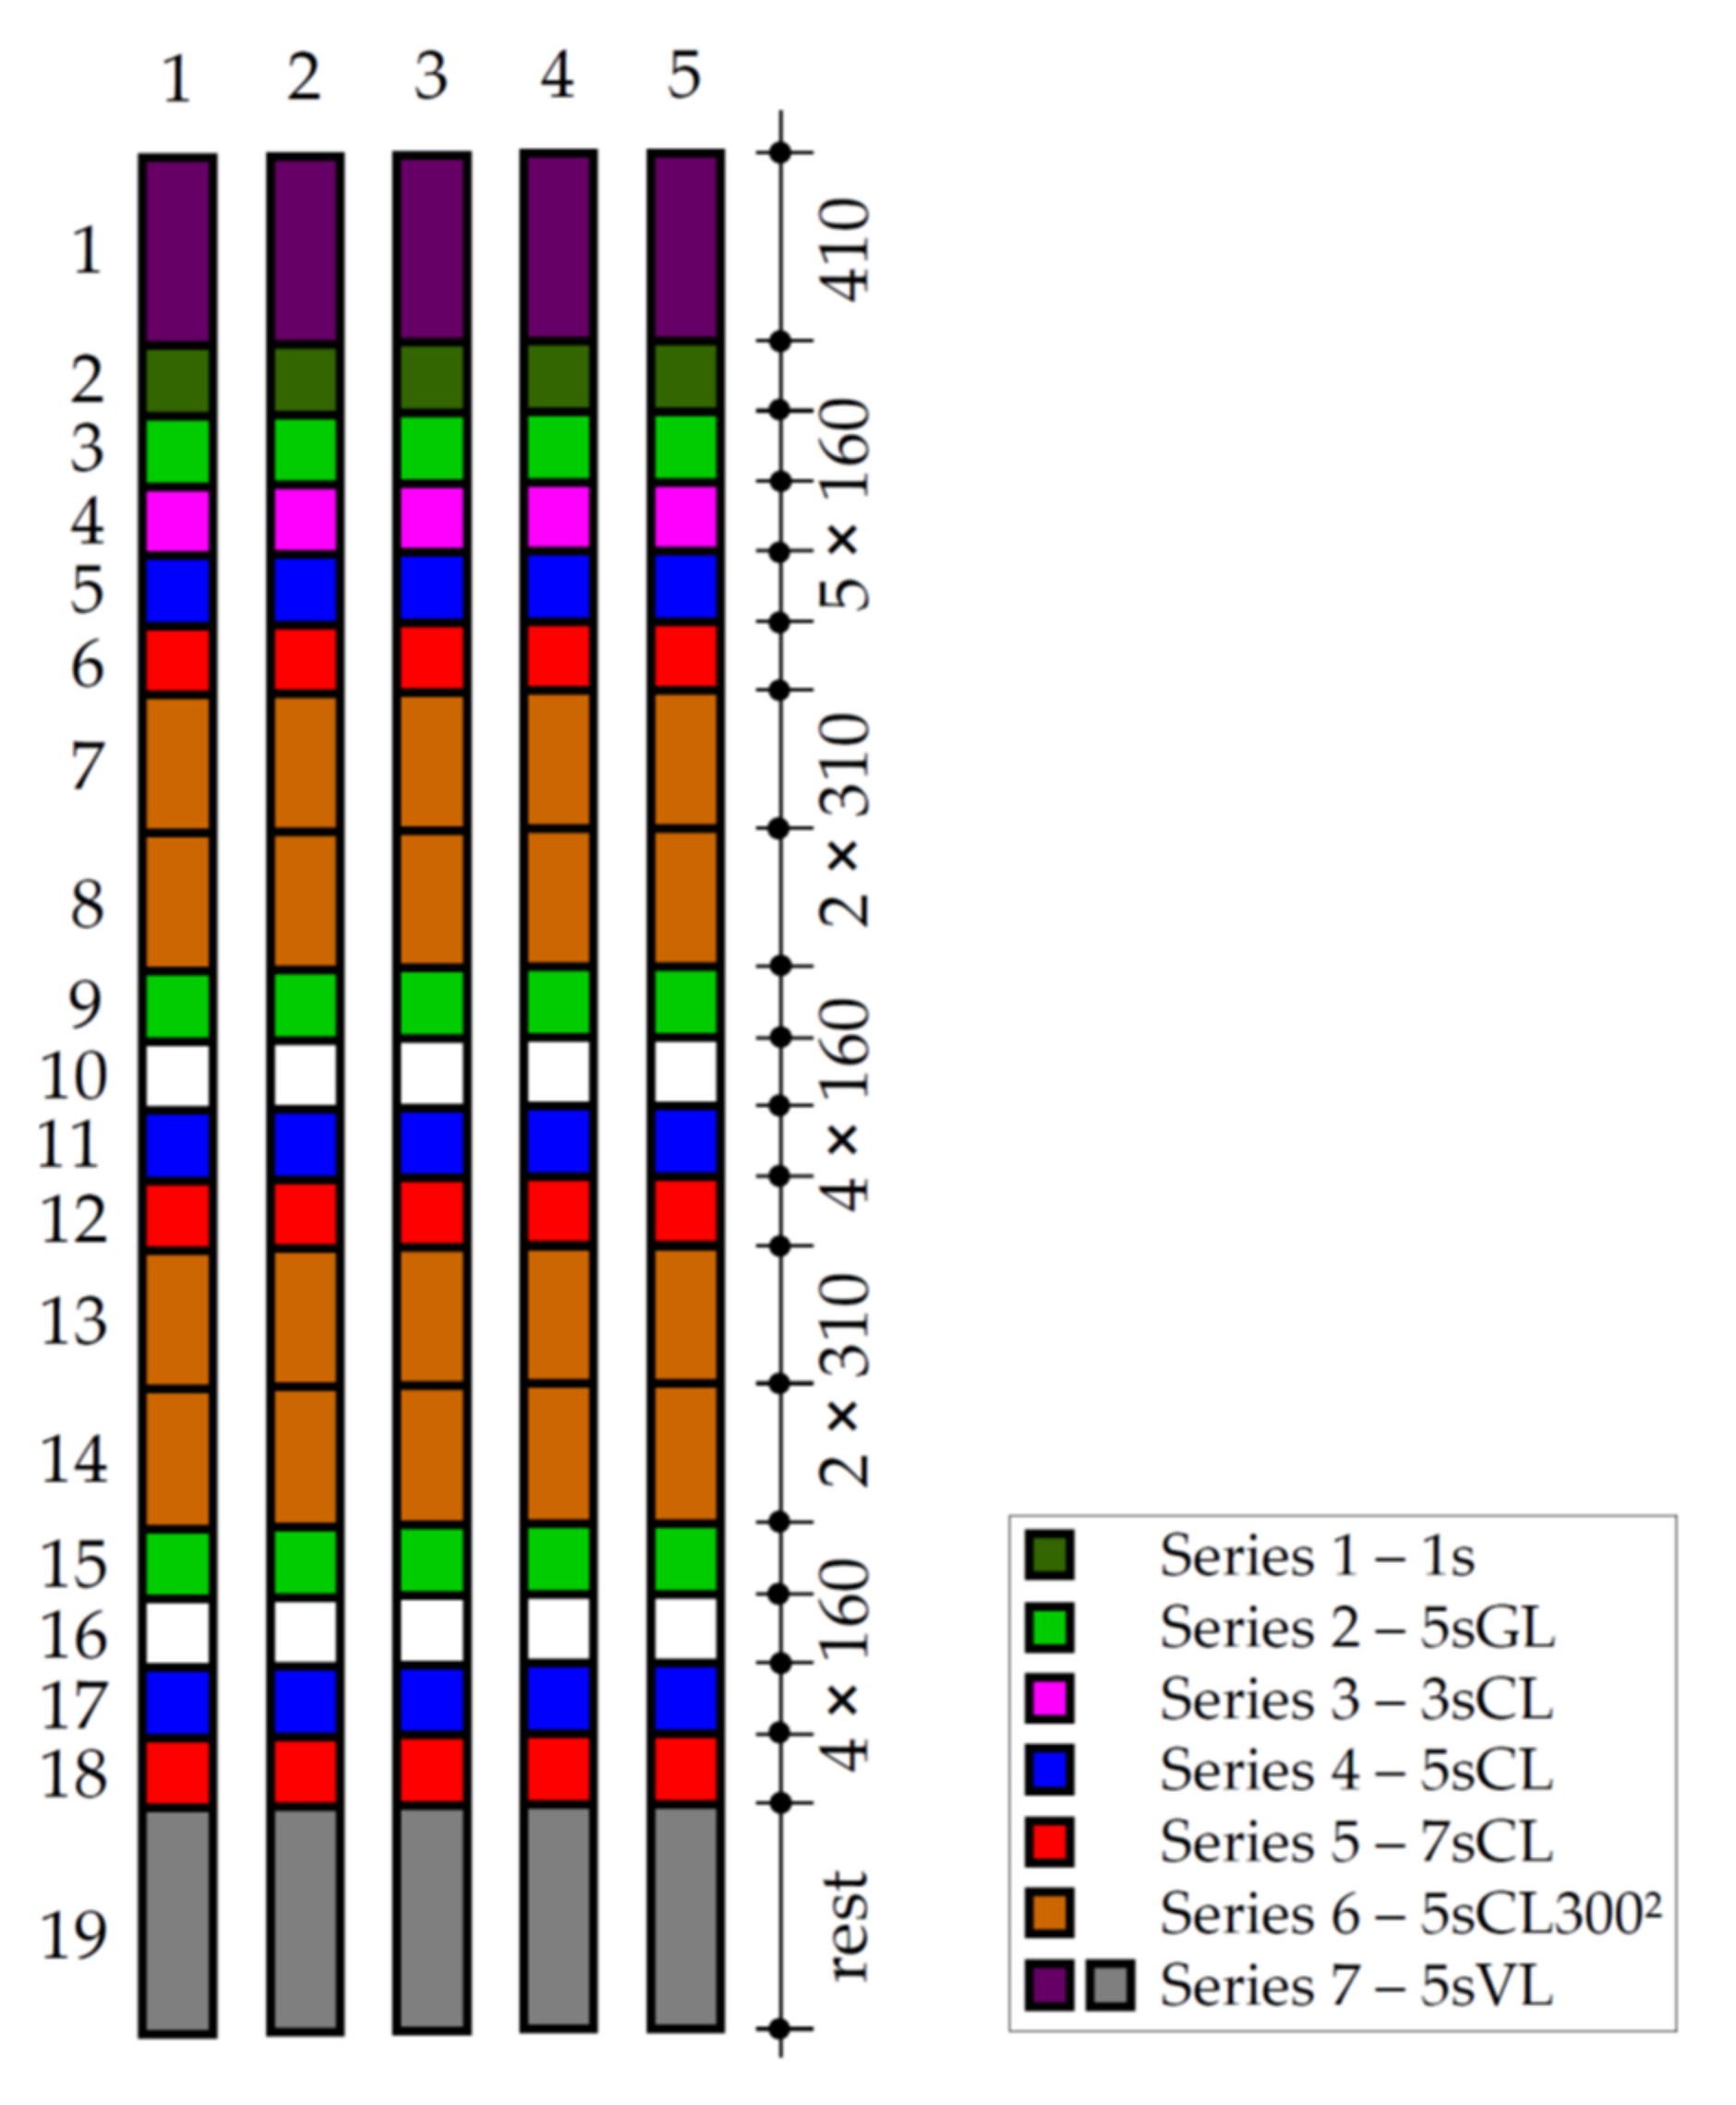
2.1. Test Plan and Setup

The test plan was developed with the support of simplified, three-dimensional finite-element (FE) analyses as presented in Jantscher [37]. These analyses addressed the following points always focusing on the distribution of stresses in tension perpendicular to the plane:
  • influence of the stiffness of the load transmission blocks according to the EN 408 [38] test configuration;
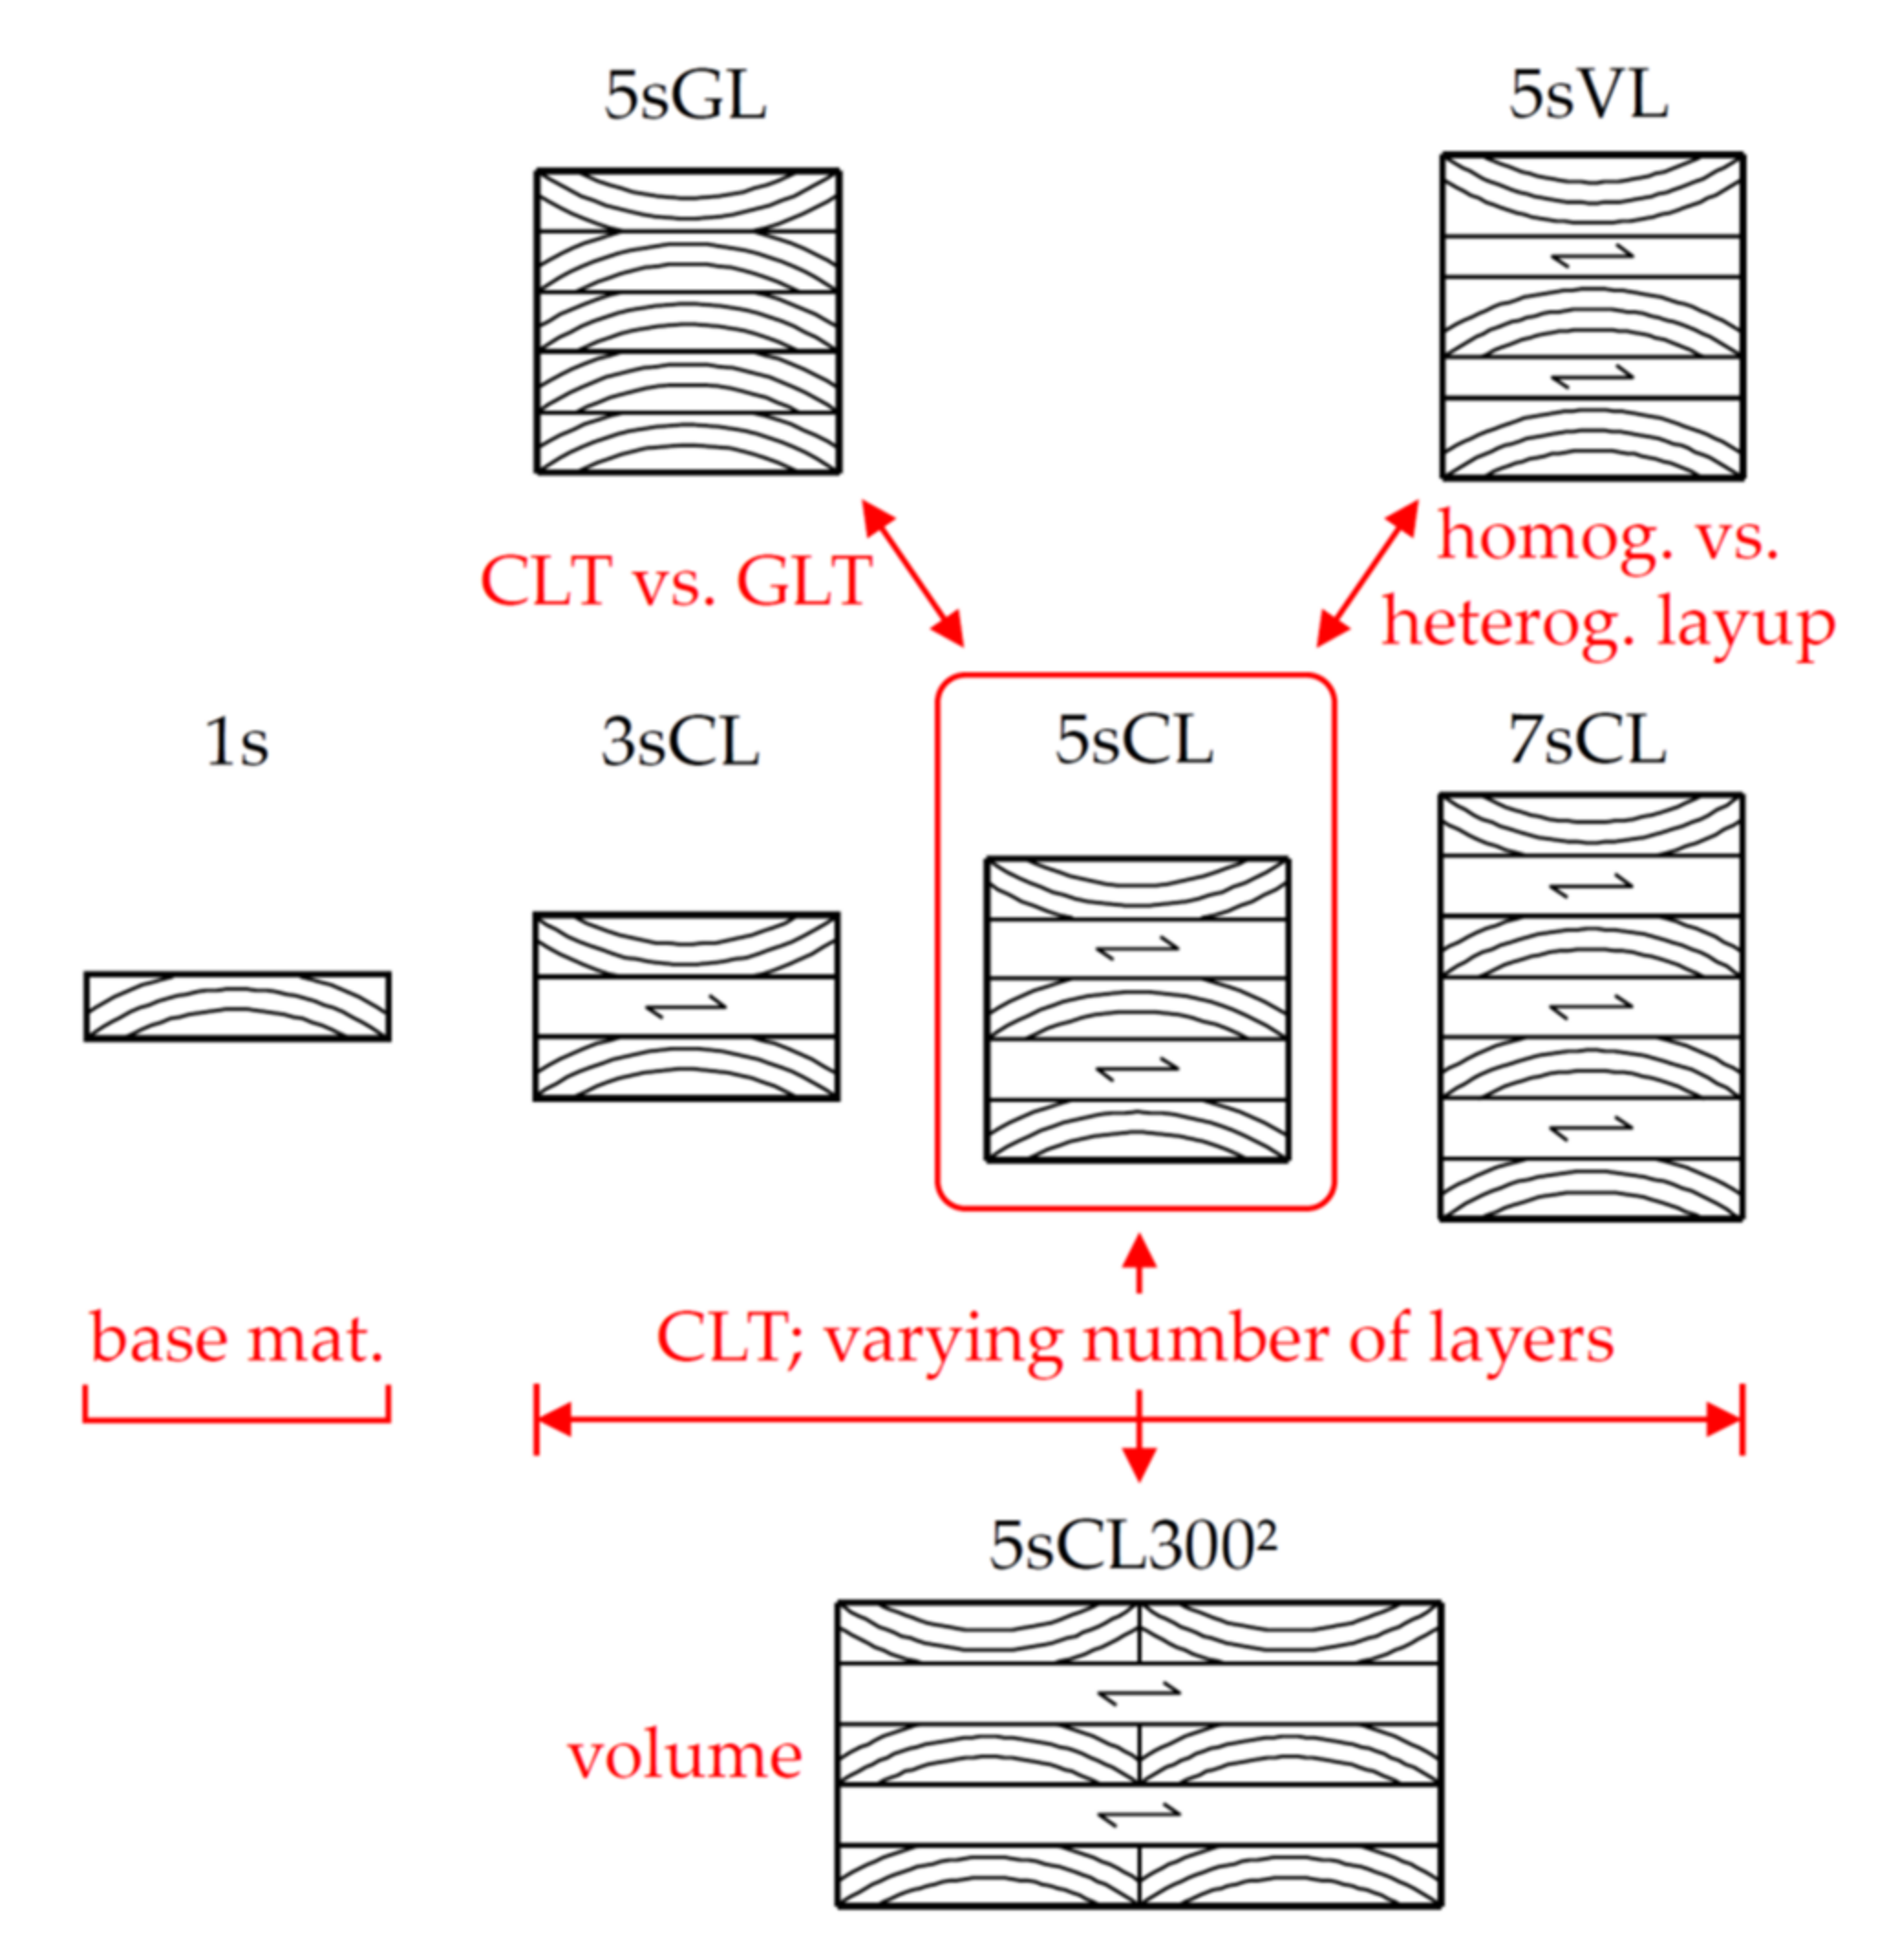
  • influence from the layer orientation, i.e., orthogonal vs. unidirectional;
  • influence of the ratio between neighboring layer thicknesses in orthogonally laminated members with symmetric layup, i.e., tℓ,i/tℓ,i+1 = 1.0 vs. tℓ,i/tℓ,i+1 ≠ 1.0;
  • influence of parallel action between lamellas within layers.
Regarding the first point, it was observed that load transmission blocks featuring lower elastic properties are advantageous for the stress distribution in particular in the interface zone between these blocks and the specimen, that is, the distribution of stresses is more homogeneous. Therefore, glulam load transmission blocks of the same or comparable material quality as the specimens are further preferred. In respect to the second point, in orthogonal layups a clear “locking effect”, caused by the restrained deformation capacity in plane perpendicular to the grain direction of the layers due to the high stiffness of neighboring layers parallel to the grain, could be identified. This circumstance reduces the typically local stress concentration in the central cross-grain plane as known from unidirectionally laminated products like glulam and leads to a more balanced stress distribution between all layers in the orthogonally laminated specimen. Analyses on the influence of unequally thick neighboring layers within a specimen by maintaining a symmetric layup, point three, demonstrate higher stress concentrations in the longitudinal direction of thinner layers adjacent to thicker layers, which are higher than in the case of CLT layups composed of equally thick layers. In respect to the fourth and last point, in contrast to a single-node system (layers of 1 × 1 the width of lamellas) in the additionally analyzed four-node system (layers of 2 × 2 the width of lamellas) stress concentrations were found in longitudinal direction of board segments, in particular between the specimen and the load transmission blocks as well as close to gaps.
Based on these qualitative outcomes a test plan for the experimental investigations was developed which comprises seven series, starting from testing the tensile properties out-of-plane of the base material as well as single- and multiple-node systems of CLT specimens featuring different numbers of layers and layups. For comparison also tests on glulam (GLT) were conducted; see Figure 2 and Table 2.
In this test plan series 5sCL represents the reference series for CLT featuring single-node tests on five-layer elements with homogeneous layup, that is, equally thick layers, with layer thicknesses of 30 mm. Taking this series as a reference is also motivated by the suggested reference cross section for the bending properties out-of-plane of CLT (see e.g., Brandner et al. [20]) and for the compression properties out-of-plane of CLT in Brandner [42]. Starting from this series, series 3sCL, with three layers and series 7sCL, with seven layers, each 30 mm thick, allow investigations on the serial effect caused by the number of layers stressed in tension out-of-plane. The comparison of reference series 5sCL with series 5sVL enables the quantification of the possible influence of heterogeneous layups, that is, neighboring layers featuring different thicknesses, whereas the comparison with series 5sCL3002, representing a four-node system, allows the quantification of possible parallel effects. Series 5sGL is motivated by the circumstance that properties of CLT are frequently regulated analog to glulam. The comparison between 5sCL and 5sGL should give answers to a possible difference in tensile properties out-of-plane caused by the orientation of layers themselves, that is, orthogonal vs. unidirectional. Finally, series 1s investigates the tensile properties perpendicular to the grain of the base material. Due to the expectation to observe higher uncertainty in the base material than in the structural timber products at the time the test plan was established, the sample size of series 1s is twice as high as in the other series.

2.2. Materials

The base material for the specimens was structural timber from species Norway spruce (Picea abies), according to DIN 4074-1 [43] apparently assignable to grading class S10+ (S10 and better) which, according to EN 338 [7], can be allocated to strength class C24+ (C24 and better) or T14+ (T14 or better). The in total 60 kiln dried sawn boards (u = 14 ± 2% at delivery) with dimensions × w × t = 4000 × 160 × 47 mm3 originated from one sawmill (Styria; Austria) and also from one single batch. In order to be able to determine tensile properties out-of-plane of CLT at first reference and secondly to quantify any influencing parameters in the best way possible, the series were matched according to their densities, whereas other timber characteristics, such as the annual ring orientation and local characteristics like knots, remained uncontrolled; this was done so as to be as close as possible to a real CLT and glulam production process. All specimens were prepared in the laboratory, so that much attention could be focused on their adequate assembly. In matching the series according to their density distribution, three main requirements had to be met:
  • apart from series 1s (single layer), maximum variation of density within each specimen;
  • maximum variation of density within each series;
  • minimum variation of density between all series.
The first requirement is argued by the common production process of CLT as well as glulam. Adjacent layers and lamellas are usually independent from each other, that is, origin from different logs or even trees, because of the large dimensions of the final product. The fulfilment of the second requirement is needed to be able to represent the whole bandwidth of C24+ or T14+ as the most common base material strength classes for CLT in Europe, that is, to produce representative samples. The third requirement follows the idea of matched samples and is motivated to exclude as much secondary variation, that is, differences in density between the series, and to focus on primary variation in conjunction with varied parameters. Consequently, the majority of boards is represented in each series at least by one segment. The second requirement could not be fulfilled to full extent, because of the constraint in having only 60 boards available, while a complete fulfillment would require multiple of boards. As a result, in series 5sGL, 5sCL, 7sCL and 5sCL3002 sub-series of specimens are created in respect to the similar build-up of the base material and the comparable density profiles:
  • in series 5sGL seven sub-series each with three specimens built up using segments of the same board at equal layer position;
  • in series 5sCL seven sub-series each with three specimens built up using segments from the same boards and apart from the orthogonal lamination following the same principles as in series 5sGL; this allows a direct comparison and analysis of the effect of orthogonal vs. unidirectional lamination;
  • in series 7sCL seven sub-series each with three specimens built up using segments of the same board at equal layer position in each specimen from the same sub-series but in addition segments for layer five and six from boards not represented in series 1s;
  • in series 5sCL3002 five sub-series each with four specimens built up using segments from ten different boards and segments of the same board at equal layer position, one of the sub-series with segments from boards not represented in series 1s.
The schema of assigning board segments to various series is for five boards exemplarily shown in Figure 3; further details and the complete schema can be found in Jantscher [37].
Before assembling the specimens, at first all the boards were planed to a thickness of 43 mm and secondly a segment of 400 mm in length was cut off for later use for 40 mm thick segments in series 7 (5sVL) before the remaining parts were further planed to a thickness of 33 mm and all together stored at reference climate conditions of 20 °C and 65% relative humidity. However, as can be seen later in Section 3.2, during storage the expected equilibrium moisture content of approximately uref = 12% was not reached.
Immediate to specimen assembling, the required board segments were planed to 20, 30 and 40 mm in thickness and, apart from series 6 (5sCL3002), cut to length and planed to 160 mm in width each. Subsequently the mass and volume were determined from each board segment, as the basis for density calculation and the moisture content from each middle layer, based on resistance measurement by means of GANN Hydromette M 4050 (Gann Mess- u. Regeltechnik GmbH, Gerlingen, Germany). To prevent unintended bonding at the narrow faces between the board segments of the same layer in series 6 the corresponding narrow faces were sealed by tape; see Figure 4. Each specimen was assembled via a predefined assembling plan (see Jantscher [37]); the whole process was photographically recorded to be able to trace each segment even after final formatting. For side face bonding the one-component polyurethane adhesive LOCTITE® HB S309 PURBOND (Henkel and Cie. AG; Pratteln, Switzerland) was applied with 120 to 160 g/m2 and pressed between 0.6 and 1.0 MPa.
After sufficient curing and formatting of the specimens to their final dimensions and recording their geometry and mass, the load transmission blocks were glued on to their side faces. Glulam made from Norway spruce (Picea abies) was used for the load transmission blocks. The two-component melamine-urea-formaldehyde adhesive Prefere 4546 (Dynea AS; Norway) with adhesive: hardener ratio 10:3 was used for gluing the load transmission blocks to the specimen, with the side face bonding on one side and the cross grain bonding on the other. In total 1600 g/m2 were applied in several steps because of the high capillary effect of the grain, whereby approximately 2/3 of the total quantity was used for the cross-grain surface. After fixing the position of the load transmission blocks on the specimen by means of clamps or wire nails, a bonding pressure of 1.0 MPa was applied. Great care was taken on correct alignment of specimen and load transmission blocks to avoid any moments caused by eccentricities; see also Blaß and Schmid [44].
In the case of series 5sCL3002, the final dimension of the specimens was too large to be pressed in standard laboratory facilities. Thus, a different procedure had to be applied (see Figure 4): at first, the load transmission blocks had to be produced by block gluing in two steps by means of adhesive polyvinyl acetate (PVAc) and a pressure of 0.4 MPa; the first step was simple block gluing of glulam sections on their side faces; in the second step block gluing was made on the narrow faces; thereby, perfect alignment between the parts from the first step was secured by fixation via fully-threaded self-tapping screws applied in predrilled holes. Secondly, load transmission blocks were glued on the specimens by means of a dead load (steel girder) of 10 kN which resulted in a bonding pressure of 0.11 MPa. In producing the first specimens only half of the pressure was applied as two of these were produced in parallel. After observing gaps in parts of the glue lines, which had been traced back to the low bonding pressure as well as inaccuracies in producing the load transmission blocks, the whole dead load was applied only to one specimen and the accuracy in producing the load transmission blocks was increased. Gaps observed in the first specimens were dealt with later in the best possible corrective manner by injecting a two-component epoxy-based adhesive (Toolkraft AG, Georgensgmünd, Germany).

2.3. Methods

2.3.1. Setup for Testing CLT in Tension Out-of-Plane

All tests were performed at the Lignum Test Centre (LTC), the laboratory of the Institute of Timber Engineering and Wood Technology at Graz University of Technology by means of the universal testing frame lignum_uni_275 (Z250, ZwickRoell GmbH & Co. KG, Ulm, Germany), which has a maximum load capacity in tension and compression of 275 kN.
The test setup basis on previous investigations from Stuefer [39] who determined tensile properties perpendicular to the grain on board segments and glulam. His configuration is a further development of the test setup as proposed in Blaß and Schmid [11] and developed earlier in Ehlbeck and Kürth [45]; see also EN 408 [38]. In principle, the setup consists of stiff steel adapter plates for mounting the total timber specimen in the test frame, whereas the whole timber specimen consists of load transmission blocks with grain orientation parallel to the load vector which are rigidly bonded to the actual specimen by adhesive, as described in the previous Section 2.2. The advantage of the load transmission blocks between specimen and steel plate instead of directly gluing the steel plates on the specimen is the more homogeneous stress distributions, that is, less stress concentrations in the interface between specimen and attached elements. Following Ehlbeck and Kürth [45] and the Annex B in EN 408 [38] the free length of the load transmission block, that is, the distance between specimen and load introduction via the testing frame, should be approximately equal to the width of the specimen. Furthermore, the steel plate bonded to the load transmission blocks should be relatively stiff to achieve widely uniform stresses perpendicular and parallel to the grain as well as shear already close to the interface between the specimen and the load transmission block; see Ehlbeck and Kürth [45].
In contrast to Ehlbeck and Kürth [45] as well as Blaß and Schmid [11], who attached the steel plate to the load transmission block by means of adhesive, in the tests presented in the following and similar to Stuefer [39] primary fully-threaded self-tapping screws arranged in a double symmetric group and inserted under various angles were applied. The distance between the specimen surface and the screw tip used for introducing the load in the case of 1502 mm2 and 3002 mm2 specimens was 70 mm and 170 mm, respectively. By assuming an approximately triangular load distribution along the effective thread length (excluding the screw tip) the distance between the specimen surface and the center of gravity of this load distribution in the case of 1502 mm2 and 3002 mm2 specimens was approximately 120 mm and 220 mm, respectively, given the total lengths of load transmission blocks with 200 mm and 300 mm, which is close to the recommendations in Ehlbeck and Kürth [45] and EN 408 [38].
To prevent additional stresses within the specimen caused by externally applied non-uniform loading and/or internal parameters, for example, not perfectly parallel side faces and/or not perfectly parallel mounted steel plates, and thus secure only uniaxial loading of the specimen in tension out-of-plane, the whole setup was extended on one sides by a cardan joint (two degrees of freedom) and on the other side by a spherical joint, allowing free rotation in all three directions; see Figure 5 and Jantscher [37].
In testing the board segments of the base material as well as all glulam and single-node CLT series, the same setup with a cross section of 1502 mm2 applied. To be able to test series 5sCL3002, consisting of four-nodes or four-times the volume of the reference series 5sCL, new steel plates had to be designed, whereby the principal setup remains the same; see Figure 5b. To secure widely uniform loading of all screws in the group of each adapter plate, the maximal allowed deformation at expected maximum load levels was set to <0.1 mm in the design of the steel plates, which was supported via FE analysis; for further details see Jantscher [37].

2.3.2. Measurements and Calculation of Properties

Based on the measured dimensions at given moisture content u (length u, width wu and thickness tu) and mass mu of each individual board segments, CLT and glulam specimens after formatting to their final dimensions, the density ρu was calculated. In the analysis of relationships between tension out-of-plane properties and density, the local density(ies) of the board segment(s) involved in the fractured zone, ρlocal, applied. In the discussion on the intra and inter variation of properties in Section 3.4.3, as part of the conducted sub-series analyses, the average density of the whole specimen, ρglobal, is analyzed as well.
The moisture content u at the time of testing was determined for each specimen after conducting the tensile tests and based on a small specimen taken from the fractured board segment(s) by means of the oven-dry procedure according to EN 13183-1 [46]. Based on the moisture content the density ρu was corrected to the density ρ12 according to EN 384 [47] which corresponds to the reference moisture content uref = 12%.
Before tensile testing, adhesive residues on the surfaces of the specimen were removed. The steel adapter plates, for fixing the whole specimen including the load transmission blocks in the test frame, were fixed by fully-threaded self-tapping screws. The first tests were run with fully-threaded screws of type ASSY VG 8 × 180 with drill tip (ETA-11/0190 [48]; Adolf Würth GmbH & Co. KG; Germany). To ease the screw insertion, the screw type was later changed to the screw of the SHERPA system connector 8 × 180 (ETA-12/0067 [49]; SHERPA Connection Systems GmbH; Austria) featuring a half tip. To secure equal loading of all screws a torque of 20 Nm was applied. During the tensile tests out-of-plane force together with all global and local deformations were recorded at 5 Hz frequency. Local deformations were measured by means of DD1 transducers (Hottinger Brüel and Kjaer Austria GmbH (HBM); Austria). Apart from series 6 (5sCL3002), the transducers were positioned centrically on all four faces with measurement bases according to Table 3. In series 5sCL3002 the placement of two transducers was slightly eccentric to avoid pins placed in gaps between the board segments within the outer layers. The local deformation was recorded until 40% of the estimated maximum load after which the transducers were dismounted in a 20 s hold-on break to prevent potential damage caused by sudden load drops. After the hold-on break, the load was again increased until it had fallen below 60% of the hitherto recorded maximum load. The whole test was controlled by continuous deformation per time unit to reach failure within (300 + 20) ± 120 s, according to EN 408 [38].
Prior, during and after the whole test procedure any observations made together with all partial and final failures were recorded. The recorded load measurements including pre-loading were further corrected by the mass of steel and timber parts as the specimen together with the whole setup was resting on the bottom cardan joints when mounted in the test frame with the load cell above before loading. Therefore, for each series an average dead load, corresponding to the half setup, was calculated and subtracted from the recorded load signal, see Table 4. For calculation of the timber parts an average density of 450 kg/m3 was assumed. As can be seen, apart from series 5sCL3002 the calculated dead loads have a negligible influence on recorded loads.
The modulus of elasticity in tension out-of-plane was calculated based on force and averaged local displacement measurements in two ways, that is, based on two different definitions of test data used for calculating the gradient between stress and strain. The first definition bases on EN 408 [38], which considers the stress-strain relationship within 10 and 40% of the maximum load Fmax. The second definition considers an individual, maximum range for this relationship based on visual inspection and fixation of an apparently linear relationship, that is, zone of constant gradient between the stress-strain gradient and the strain given as (σt,90,i+1 − σt,90,i)/(εt,90,i+1 − εt,90,i) and εt,90,i+1, respectively.
By analyzing the load increments, Fi+1Fi, vs. the line number of measurements, as shown exemplarily in Figure 6, zones of sudden load drops (load releases) can be identified. These zones, although not always visible in common load-deformation plots, are interpreted as some kind of partial failures in the form of initial cracks and/or as releases of internal stresses, for example, as a result of drying and/or gluing processes and also local growth features like knots and checks. For the quantification of these observations, the number of specimens featuring sudden stress releases as well as the stress level, given as ratio of stress at the first sudden release vs. the maximum stress equal to strength, was calculated. This to gain some quantitative information on a potential classification of the failure mode of timber and unidirectionally and orthogonally laminated timber products in tension out-of-plane, as being either relatively brittle or quasi-brittle, that is, some rating of the potential to redistribute stresses in conjunction with such sudden stress releases.

2.3.3. Statistical Data Analyses

After calculating all physical/mechanical properties, the data structures within and between test series were analyzed. Data sets from specimens not representative for the material of investigation were completely rejected. Specimens which feature singular suspicious and/or extreme values were intensively checked for potential reasons, for example, failures in measurements or analysis, and, if necessary, rejected from further data analyses. All rejected specimens and single values were protocolled; see Annex in Jantscher [37]. Values from specimens featuring insufficient bond line quality to the load transmission blocks, which were within the common range of valid specimens remained in the data analyses whereas values apparently influenced by the insufficient gluing procedure were excluded. This regulation is not in accordance with EN 408 [38] which requests that data of specimens featuring > 20% fractured surface in the glue line between the load transmission block and the specimen must be rejected, irrespective of their impact on series statistics.
Furthermore, the data set of the specimen 3-19 in series 3sCL, as the only specimen with pith, was excluded. As known from the literature, specimens with pith show a significantly (about 50%) lower tensile strength out-of-plane compared to specimens without pith (e.g., Blaß and Schmid [11]; Stuefer [39]).
For characterizing the stochastics in physical/mechanical properties, two statistical distribution models, namely the lognormal (LN) and the Weibull distribution (W), were analyzed. In both cases random variables are restricted to the positive domain which is true for density as well as for the tensile properties out-of-plane, the elastic modulus and the strength. Whereas the Weibull distribution origins from the statistical representation of ideal brittle materials strength characterized by randomly distributed microscopic flaws (Weibull [50]), the lognormal distribution, according to the Central limit theorem in logarithmic domain, represents multiplicative processes and is therefore also frequently used to describe strength properties of hierarchically structured, quasi-brittle materials (e.g., Brandner [51]). Timber exposed to tension perpendicular to the grain is frequently assigned to a brittle failure mode; because of that JCSS 3.5 [40] proposes the Weibull distribution as representative model for tensile strength perpendicular to the timber grain. The selection of this distribution model, however, has an enormous effect on the partial safety factor, calculated in frame of code calibration procedures, as illustrated for example, in Köhler and Fink [52].
The parameters for both distribution models, which were considered in their fundamental, two-parameter formulation, and for each series were estimated by means of the maximum likelihood estimation (MLE) in R [53] which on the one hand also allows the inclusion of right-censored data (MLErc), which was necessary in cases were an earlier failure mode and not the target failure mode occurred (e.g., failure due to insufficient bond-line quality), and on the other hand for the estimation of uncertainty in estimated parameters based on the Fisher Information. According to Bury [54], the following covariance matrices (Vij) are given for the parameters of the lognormal X~2pLN(x|λ; ε) as well as Weibull distributed variables X~2pW(x|α; β):
CoVar λ ; ε   X ~ 2 pLN = ε 2 / n 0 0 ε 2 / 2 n
CoVar α ; β   X ~ 2 pW = 1.10866 α 2 β 2 0.25702   α 0.25702   α 0.60793   β 2
In addition to standard statistics including the 5%-quantiles, characteristic values were also calculated by following the procedure in EN 14358 [55] and by assuming a lognormal distribution for density as well as modulus of elasticity and strength in tension out-of-plane.
Properties of timber, as natural, hierarchically structured material, have been frequently characterized by means of stochastic hierarchical models which allow the separation of the total variation of random variables such as strength in variation within (intra) and between various scales (inter; see e.g., Riberholt and Madsen [56]; Ditlevsen and Källsner [57,58]; Köhler [59]; Brandner [51]). Estimates for the shares of intra and inter variation are later calculated in the frame of sub-series analyses and by means of a two-level hierarchical model; see Equation (3). In this equation, Zik corresponds to the local property of segment i in board k as the sum of the average property of board k, expressed by Yk, and the iid (independent and identically distributed) local deviation from this average value, Xi|k, with E(Zik) = E(Yk), E(Xi|k) = 0, σZ2 = Var(Zik) = Var(Xi|k) + Var(Yk) = σX2 + σY2, with Var(Yk) = CoVar(Yk + Xi|k; Yk + Xj|k). A measure for the share of inter variation (variance of the average board properties) to the total variation is the equi-correlation coefficient ρequi; see Equation (3). This coefficient expresses the simplest type of statistical correlation as it assumes independency of the lag-distance between the segments and thus a constant value along the overall board (usually in longitudinal direction), that is, ρij = ρequi, for i, j = 1, …, M, ∀ ij; see also Brandner [60].
Z ik = Y k + X i k ;   ρ equi = σ Y 2 σ X 2 + σ Y 2

3. Results and Discussion

3.1. Analysis of Failure Modes and Fracture Processes

A qualitative overview of observed fracture patterns is shown in Figure 7. A first differentiation can be made in intra fractures (within or between board segments of the specimen) and inter fractures (between specimen and load transmission block).
According to the previous works of Dill-Langer [12], Stuefer [39] and Bidakov [23] another differentiation of fracture patterns can be made in “fractures in the interface region (interface fractures; can be either inter or intra fractures)” and “fractures within board segments” (intra fractures). The first group, “interface fractures”, can be further separated in “fractures between specimen and the load transmission blocks” (inter fractures; Figure 8a) and “fractures within the specimen” (intra fractures; Figure 9a). The first sub-group presumes at least a complete covering of the bond surface with wood fibers, often combined with some share of partial radial fractures; otherwise, it would be classified as partial or full adhesion failure within the glue line; see Figure 8b.
Specimens featuring a mixed interface fracture comprise shares of tangentially and radially fractured zones. A “W-shape fracture pattern”, following the annual rings radially at the outer and tangentially in the inner zone, is exemplarily shown in Figure 9b. This type of fracture was common for board segments originally with relatively shorter radial distance to the pith as well as for thin board segments. Otherwise, fractures occurred along the annual rings in tangential direction. In case of pith, which occurred in one of the board segments, a combined radial and tangential fracture through the pith, similar to the reports in the literature (e.g., Dill-Langer [12]; Stuefer [39]), was observed. In addition, mixed intra-segment fractures were found, which neither follow the W- nor the annual ring shape completely.
Table 5 summarizes the shares of intra and inter fractures for each series. On average only 29% of tests featured intra fractures, that is, fractures within the specimens, whereas the majority of fractures occurred in the interface between the specimen and the load transmission blocks. In only 4% of in total 158 valid tensile tests out-of-plane an (partial) adhesion failure between the specimen and the load transmission block was observed. However, it has to be remarked that in series 5sCL3002 the share of intra fractures is much higher, that is, 63%. One possible reason is the serial, sub-parallel structure caused by two board segments in each layer which provides a much larger potential to redistribute stresses internally than in other series which feature only one board segment in each layer.
Bidakov [23], who also tested CLT specimens with a side face area of 300 × 300 mm2, report failures mainly near the glue line between steel plates and the timber specimen, whereas in his tests on unidirectionally and orthogonally laminated specimens most failures occurred within the weaker of two board segments. In Dill-Langer [12] only 15% of in total 135 tests on glulam, made of Norway spruce, failed within board segments of the specimen, with fractures running usually through a local growth characteristic like pitch pockets, whereas the majority of failures (85%) occurred in the interface. Based on his observations and in-line with acoustic emission burst source analyses in Aicher et al. [14], fractures initiated and always accumulated in the center, not at the edges of the specimens.
In respect to the fracture process, Dill-Langer [12] report on apparent brittle failures at macroscopic scale in 40% of his tests, that is, no sign of successive damage evolution in the global force-displacement graphs. However, 60% of his glulam specimens recovered after small load drops and subsequently achieved even higher maximum loads. This demonstrates the ability to redistribute loads internally after partial failures occurred, whereby these partial failures are also marked by some minor non-linearities in the load-displacement graphs between 50 and 80 to 95% of the maximum load. According to him, at approximately 90 to 95% of Fmax in most stressed zones micro-cracks accumulated to macro cracks followed by ultimate failure after exceeding the critical macro crack length of maximal 2/3 of the specimen’s width. On average, these tests showed a 6% load increase after the first apparent partial failures combined with a 60% increase in displacement.
Aicher et al. [14], who conducted acoustic emission burst source analyses, report on similar observations and conclude only few local burst records below 50% of the maximum load whereas for all specimens distinct bursts were registered at 80 to 90% of Fmax. To conclude, although failures in tension perpendicular to the grain appear relatively brittle on the macroscopic scale, the evolution, successive accumulation of bursts and their reliable location indicate a progressive, quasi-brittle damage on the microscopic scale (Aicher et al. [14]). These findings clearly contradict a number of basic requirements for the application of the Weibull brittle fracture theory; see Weibull [50].
Based on own tests, the main statistics of the identified load drops, as indicators for partial failures which were apparently larger than the common white noise of the load-increment vs. ongoing data acquisition, are summarized in Table 6.
The main outcomes in brief: apart from series 7sCL and series 5sCL3002, in 70 to 80% of all tests partial failures could be registered. As a result, apparently “ideal brittle” behavior was only given in 20 to 30% of cases, whereby these numbers might be even smaller considering the applied measurement rate of 5 Hz and the chance of load drops occurring in between, which could not be recorded in consequence. To some extent, partial failures already occurred at relatively low load levels of only 20% of Fmax whereas in other specimens such load drops started not until 90% of Fmax. Overall, these numbers are in conjunction with a relatively high but constant coefficient of variation CV(ζ) = 40%. On average, first load drops took place at 60 to 70% of Fmax which is also in some agreement with Aicher et al. [14] and Dill-Langer [12].
In series 7sCL load drops were observed only in 50% of the specimens. In fact, the ratio n/N is decreasing from series 3sCL (85%), with three layers, to series 5sCL (76%), with five layers, to series 7sCL (50%), with seven layers. The reason for this decrease is seen analogue to glulam in increasing stress concentrations with increasing number of layers (see e.g., Dill-Langer [12]; Astrup et al. [17]). However, the reason for the small variation of ζ in series 7sCL, with CV(ζ) = 7%, is not yet clear.
In contrast to series 7sCL, in series 5sCL3002 load drops could be recorded for all specimens. As already argued previously in conjunction with the higher share of intra fractures, also here the additional parallel action between neighboring segments within layers is seen as the reason, since systems of this kind are known to ease load redistribution after partial failures and to prevent sudden fractures. In this series the registration of load drops started much earlier than in the other series, on average already at 50% of Fmax, whereby the range of ζ as well as CV(ζ) are on a comparable level.
Although this kind of partial failure/load drop analysis enhances the understanding of the internal fracture process, unfortunately the extent of damage caused by these partial failures and any consequences of these for the further behavior or more generally for structures cannot be deduced from the recordings and observations made.
Apart from this, the ability to redistribute loads after partial failures in tests of Dill-Langer [12] was 87% in case of lamellas taken close to the pith (fractures through several annual rings with higher gradients) but only 33% in case of lamellas taken from the outer part of logs (flat grain, thus fractures usually within one annual ring); see Figure 10. According to Dill-Langer [12] lamellas with a small radial distance to the pith and symmetric annual ring pattern favor partial failures and stable crack growth whereas lamellas featuring large radial distance to pith and/or eccentric annual ring pattern fail relatively brittle.
With a look on the load-displacement diagrams for the series 5sGL and series 5sCL in Figure 11 the failure behavior of glulam and CLT on the macroscopic scale is clearly different. Whereas on the macroscopic scale 60% of the glulam specimens show successive load drops and distinctive post-cracking behavior, all CLT specimens softened suddenly and without any load drops and short recoveries in the post-peak phase. In the interpretation it needs to be considered, that specimens of both series consisted of the same base material, featured similar layup, were tested the same way and have similar partial fracture analysis statistics as in Table 6. Consequently, different layer orientations, unidirectional vs. orthogonal, are seen as a reason for the different behavior: the reinforcing or locking effect in CLT overall leads to higher resistances which also result in higher release rates of fracture energy. Furthermore, highly stressed zones are relatively fragmented in CLT whereas they accumulate in glulam. Both effects together reduce the probability for internal load redistributions in CLT even in tests conducted displacement-controlled.
Apart from this comparison between series, there are also some observations made in respect to the failure behavior of sub-series: in series 5sGL, concerning seven sub-series each with three specimens, in two sub-series all specimens and in four further sub-series two of three specimens failed in segments of the same board which was, according to Section 2.2, also always located at the same layup position. In series 5sCL, also featuring seven sub-series with three specimens with segments of the same boards and similar layup than in series 5sGL, in four sub-series all specimens (only one of them equal to series 5sGL) and in two further sub-series two of three specimens failed in segments of the same board. By comparing series 5sGL with series 5sCL, in twelve of 21 specimens the failure occurred in segments of the same board whereas different segments were involved only in nine specimens, whereby the majority of failures took place in the interface between the load transmission block and the specimen; see Table 5. In series 7sCL, also featuring seven sub-series each with three specimens, in two sub-series all specimens and in four further sub-series two of three specimens failed in segments of the same board. In series 5sCL3002, featuring five sub-series each with four specimens, in three sub-series two and in another sub-series two-times-two specimens failed in segments of the same boards although within each layer segments of different boards were used.
Based on these observations, it can be concluded that: (1) glulam and CLT behave differently when loaded in tension out-of-plane; the orthogonal structure in CLT affects the cracking in pre- as well as the post-peak fracturing behavior; (2) there is an accumulation of failures in segments of the same boards, that is, the individual potential of boards used in the production has an impact on the overall resistance of products against loads in tension out-of-plane; and (3) there is also an accumulation of failures in the interface zone between load transmission blocks and outer side face of the specimens. Thus, in addition to the deterministic localization of failures due to local stress concentrations, well describable by mechanics, also the randomness in base material properties, well describable by stochastics, contributes to the overall tensile properties out-of-plane of laminated structural timber products such as glulam and CLT, whereby CLT may be more affected due to a relatively fragmented distribution of highly stressed zones. Apart from this, as stress concentrations which result from the applied test setup, that is, at the interface to the load transmission blocks, do not occur in real design situations, the resistance in tension perpendicular to the grain might be even slightly higher. However, there are a number of other influences, for example, additional stresses due to moisture variations, which are to be expected during typical service lives, however, and which have an enormous effect on the resistance in tension out-of-plane, expected to be in magnitudes higher than the additional stresses caused by the applied test setup.

3.2. Overview of Physical Properties from Tensile Tests Out-of-Plane

After discussing the failure mechanisms and fracture behavior, in the following the focus is on the physical/mechanical properties determined from tensile tests out-of-plane on single board segments as well as glulam and CLT specimens. A first graphical overview in form of box-plots of density, modulus of elasticity and strength in tension out-of-plane is presented in Figure 12 and a summary of the main statistics from moisture content, density and tensile properties out-of-plane in Table 7.
In all series a comparable moisture content (on average 14%) and density (on average 450 kg/m3) are observed. Only in series 5sCL the mean density differs 20 kg/m3 from the overall average whereas between the other series the difference is less or equal to ± 10 kg/m3. The coefficient of variation for density, CV(ρ12), with 12% in series 1s is above common values for structural timber which are 6% to 10% according to Brandner [51]. The variation in density in the other series is within the common range but overall, on the upper level. Please note, that the density discussed here refers to the density of those board segment(s) within each specimen which took part in the final fracture process, that is, a reduction in variation with increasing number of board segments composing each specimen cannot be expected here. To conclude, overall, the series are well matched in respect to their density and moisture content.
The moisture content is on average generally 2% higher than usually targeted for reference tests, which indicates that the samples were stored for too short a period in standard climate. According to Gerhards [61], who provides a summary of various works on this topic, within 6% ≤ u ≤ 20% on average 2.3% change in strength and 3.1% change in modulus of elasticity per 1% change in moisture content are expected. These conversion factors are seen to be applicable for both, structural timber and glued laminated products such as glulam and CLT, latter as rigid composites of the first. Consequently, herein presented data for modulus of elasticity and strength in tension out-of-plane, respectively, are expected to be on average approximately 6% and 4% higher when related to a reference moisture content of uref = 12%. It is remarked that in EN 384 [47], EN 14080 [8] nor in EN 16351 [62] conversion factors for the adjustment of tension out-of-plane properties to uref are provided, not for structural timber and glulam nor for CLT. In view of the sensitivity of the tensile properties out-of-plane to changes in moisture content and the quasi-brittle failure mechanism, it is highly recommended to include corresponding conversion factors in these standards and to consider the given sensitivity also in design standards explicitly.
In evaluating the modulus of elasticity from out-of-plane tensile tests the setup for measuring the local deformations needs to be considered, that is, the positioning of DD1 transducers in respect to the non-uniform stress distribution. Dill-Langer [12], for example, concluded from his numerical analyses on glulam that for common annual ring patterns and layups the tensile stresses are much higher in the core of the specimen and in respect to the circumference higher in the middle of the end-grain face than in the middle of the narrow faces (see also Figure 10). Consequently, measuring the deformations on the circumference might overall lead to some underestimation; however, by measuring the deformations in the middle of the end grain and narrow faces, as done in herein presented tests, the maximum deformations at the circumference are gained. Considering further the relatively stiff steel plates and load transmission blocks it can be assumed that the side faces of the specimen are widely forced to uniform deformations, as it is also indicated by the minor differences between the average measurements taken from the middle of the narrow faces from glulam and CLT specimen, as exemplarily demonstrated in Figure 13. Both graphs show lower module of elasticity in end grain faces or faces featuring a higher share of end grain within the measurement base, that is, higher deformations. Furthermore, it clearly points out the much higher modulus of elasticity in case of CLT (series 5sCL) in comparison to glulam (series 5sGL) although and apart from the layer orientation the board segments are taken from the same boards and the layups of both specimens are similar. The reason therefore is seen in the missing reinforcement by the cross layers and consequently the much more concentrated stresses in the central part of the glulam specimens. More on the differences between glulam and CLT specimens based on sub-series analyses will be discussed in Section 3.4.2. Because of the distinctive non-uniform stress distributions within the specimens in particular in series 5sGL and the dependency of the measurement system on the conditions at the applied narrow faces, the modulus of elasticity in tension out-of-plane is relatively an apparent than a realistic product value.
With focus now on CLT, on average a decrease in the modulus of elasticity in tension out-of-plane with increasing number of layers, N, is found, that is, in series 1s the mean value is highest whereas from series 1s, via 3sCL and 5sCL to 7sCL it is steadily decreasing. The reason for with N decreasing mean values can be argued by the serial system, from both a probabilistic as well as mechanical point of view. The probabilistic point of view manifests also in a decreasing variation, which can be found also in herein presented data. More on serial and parallel system effects will be discussed in Section 3.6.
Apart from decreasing mean values with increasing N, a possible influence from different neighboring layer thicknesses on Et,90,mean, as indicated in the FE-analyses in Jantscher [37], cannot be confirmed when comparing series 5sCL with series 5sVL. In respect to an additional parallel system action, there is only a minor increase in Et,90,mean and decrease in CV(Et,90) from series 5sCL to series 5sCL3002. Series 5sCL3002 features the same layup but four-times higher volume and two-times more board segments than series 5sCL. However, in series 5sCL3002 the local displacements are measured between neighboring board segments within the same layer, that is, relatively over half-rift (radial-tangential) than over flat annual rings (radial), as it is the case in the other series.
In comparison with Stuefer [39], who also conducted tensile tests perpendicular to the grain on single board segment from Norway spruce loaded primary in radial direction, the statistics for the modulus of elasticity from series 1s are overall slightly higher. The reason therefore might be an overall larger radial distance to the pith in series 1s. Stuefer [39], who in his tests also differentiated in boards taken close and far off the pith, found higher values for the latter, overall and on average approximately 870 MPa together with CV(Et,90,12) = 15%. By referring the statistics of series 1s to uref = 12%, Et,90,12,mean would become 1030 MPa together with CV(Et,90,12) = 16%. Blaß and Schmid [44] conducted also tests with a comparable setup on structural timber segments of Norway spruce but with a much smaller fracture surface (45 × 70 mm2). They report on Et,90,12,mean = {726; 285; 164} MPa together with CV(Et,90,12) = {21; 67; 23}%, respectively, for structural timber loaded primarily {radially; 45°; tangentially}.
For glulam, Blaß and Schmid [11,44] and Dill-Langer [12] report on Et,90,mean in the range of 330 to 540 MPa together with CV(Et,90) between 3 and 23%. Again, higher mean values result for glulam built-up of boards taken farther away from the pith and consequently for glulam featuring a higher strength class. For comparison, the statistics of series 5sGL, referred to uref = 12% with Et,90,12,mean = 475 MPa and CV(Et,90,12) = 13%, agree well with the bandwidths found from literature. For CLT, so far, no literature values are known to the authors; Bidakov [23], who tested also CLT, does not provide any statistics on that.
With the focus on the tensile strength out-of-plane, with increasing number of layers, N, steadily decreasing statistics of location (mean value, quantiles and min/max values) are now observed, analog to the observations made for Et,90 before. Hereby, the decrease in mean strength values from one to five-layer specimens is double that for glulam (series 5sGL) compared to CLT (series 5sCL and 5sVL). In contrast, whereas the variation in tensile strength out-of-plane in CLT series is lower than observed from tests on single board segments and overall, in tendency steadily decreasing with increasing number of layers, in glulam (series 5sGL) the variation is even higher than in series 1s. The overall decrease in strength is again the result of both probabilistic and mechanical effects in the serial systems tested here. In respect to the systems, this increase in local stress concentrations in the specimen center with an increasing number of layers as is well known for glulam can again be seen; see for example, Pedersen et al. [13], Dill-Langer [12] and Astrup et al. [17]). This is also confirmed by the apparently increasing brittleness in the failure behavior as well as quantitatively in statistics from partial fracture analysis in Table 6 for both glulam and CLT series. However, apart from these local stress concentrations FE-analyses in Jantscher [37] demonstrate that in the case of CLT every layer contributes in a manner that is widely proportional to the overall load bearing of the specimen whereas this is not the case for glulam where stresses accumulate not only locally within layers but also globally within the specimen.
In series 5sCL3002 in addition to the serial, a parallel system action is also activated. Apart from the parallel interaction between adjacent board segments within the same layer but still highest stresses in the central part of the specimen, not only the system changes from serial to serial, sub-parallel but also the annual ring pattern at zones of highest stresses from the central board region with relatively flat annual rings to the board edges featuring relatively half-rift annual rings. For example, Blaß and Schmid [11] and Dill-Langer [12] report higher tensile properties perpendicular to the grain for boards and glulam with a flat rather than a rift annual ring pattern, respectively, loaded primary in the radial rather than in the tangential material direction. Consequently, in comparison to series 5sCL, corresponding to a serial system with board segments mainly loaded radially in the highest stressed zones, in series 5sCL3002, as serial, sub-parallel system with board segments featuring a mixed radial and tangential annual ring pattern (half rift) in the highest stressed zones, a slightly lower tensile strength is expected, which on a glance at the test data, is compensated by sub-parallel system effects which, according to Table 6, are also clearly demonstrated by partial failure analysis.
In regard to the research question on a possible negative impact of different adjacent layer thicknesses on the tensile strength out-of-plane, by comparing the statistics from series 5sCLwith those of series 5sVL no significant differences are found; slightly lower mean values in series 5sVL are opposed by slightly higher median values. Although only one series is available for the purpose of answering this research question, which, in fact, represents the maximum difference in neighboring layer thicknesses in common specimen layups (20 vs. 40 mm thick board segments), there would currently appear to be no need to differentiate tensile properties out-of-plane in CLT in respect to this point. There is in relative terms a need to consider the number of layers, as some kind of depth or thickness effect (serial effect; axis out-of-plane) and the stressed volume or area exposed to tensile stresses out-of-plane in both in-plane axes, in respect to the generation of sub-parallel effects; for a more detailed discussion on this topic, see Section 3.6.
Table 7 also provides statistics for the displacement at maximum load Fmax, wf, based on global deformation recordings (including also deformations from the overall test frame and setup). Apart from statistics of series 5sCL3002 which, because of the basis of global deformations, cannot be compared to the others, obviously a good agreement between single-layer tests and tests on CLT specimens is found, with wf,mean in the range of 1.19 and 1.26 mm. In contrast, wf,mean = 0.96 mm from series 5sGL is clearly lower which might be again attributed to the accumulated stress concentrations.
Apart from these general observations, in comparison with the literature and when referred to uref = 12% the statistics of the tensile strength out-of-plane from series 1 (1s), with N = 1, ft,90,12,mean = 2.06 MPa and CV(ft,90,12) = 27%, are overall well in line. Blaß and Schmid [11] give ft,90,12,mean = {2.6; 2.0; 1.8} MPa for specimens primary loaded {radially; at 45°; tangentially}. Again, the relatively small fracture surface of only 45 × 70 mm2 needs to be mentioned. Astrup et al. [17] report ft,90,12,mean = 1.73 MPa from tests on single board segments, Stuefer [39] on ft,90,12,mean between 1.7 and 2.9 MPa, with, equal to the modulus of elasticity, higher values for specimens cut farther from the pith.
In respect to series 5sGL, with N = 5, the corresponding statistics at uref = 12% can be estimated with ft,90,12,mean = 0.96 MPa and CV(ft,90,12) = 34%. These are again well in line with statistics from the literature. For example, for glulam made of Norway spruce Blaß and Schmid [11] report on ft,90,12,mean = {1.9; 1.3; 0.7} MPa, respectively, for N = {1; 3; 10}. Dill-Langer [12] presents ft,90,12,mean in the range of 0.6 and 0.9 MPa for glulam specimens of Norway spruce with 396 and 533 mm depth (N ≥ 12). Astrup et al. [17] also conducted tests on glulam made of Norway spruce with N = {2; 3; …; 6} lamellas each. The corresponding mean values are ft,90,12,mean = {1.33; 1.28; 1.13; 1.08; 0.96} MPa. Stuefer [39] also tested glulam specimens with N = {3; 6} lamellas each and found ft,90,12,mean = {1.6; 1.3} MPa, respectively.
In regard to CLT, comparison with literature can be made only based on series 5sCL3002 as this series widely confirms those for one series in Bidakov [23]. In reference to uref = 12% the statistics of series 6 (5sCL3002) would become ft,90,12,mean = 1.64 MPa and CV(ft,90,12) = 12% which is overall in good agreement with Bidakov [23] who give ft,90,mean = 1.43 MPa for tests on CLT specimens of similar size and layup but made of pine.

3.3. Comparison of Statistical Distribution Models

Table 8 summarizes the main statistics from the MLE analyses for determination of parameters for the lognormal and Weibull distribution as potential candidates for the characterization of the tensile strength out-of-plane. Apart from mean values and (co)variances also the minimized sums from the negative log-likelihood are included with the last one as some criteria for the representativeness of the respective distribution model, that is, the lower the value the better the agreement between the model and the test data.
In only two series (series 5sCL and 5sVL) the sum from log-likelihood under the assumption of a Weibull distribution is smaller than for lognormal, whereby in series 5sCL the difference between both models is nearly negligible. A qualitative check via qq- and pp-plots confirms the preference for the lognormal distribution to represent the tensile strength out-of-plane, in particular for series 1 to 4. In series 7sCL, 5sCL3002 and 5sVL a comparison between theoretical quantile estimates based on lognormal and Weibull distribution reveals close results and also good agreement with empirical quantiles; see Table 7.
In summary, although the Weibull distribution is frequently preferred in the literature, which might have several reasons (e.g., apparent brittle failure of timber and structural timber products in tension perpendicular to the grain; statistical distribution model analytically solvable in closed form), based on conducted tests and observations in the literature the lognormal distribution is the overall preference. This distribution model also represents implicitly the potential for load-redistribution and subsequent fracture processes, as usually expected from and observed in hierarchically structured materials like timber (at least on microscopic scale) which is in clear contradiction to the assumptions of an ideal brittle material behavior in conjunction with randomly distributed microscopic flaws as it is the background of the Weibull distribution model. In particular the random distribution and dimension of flaws clearly differs as in timber the main strength dominating flaws, like knots and knot clusters, occur relatively regularly and their dimensions are in comparison with typical dimensions of structural timber relatively macroscopic; see for example, Brandner [51].

3.4. Sub-Series Analysis

3.4.1. General Comments

As mentioned earlier, in the series 5sGL, 5sCL, 7sCL and 5sCL3002 sub-series of three to four specimens each were generated. As in each of these sub-series segments from the same boards and in the same layer position were used, a more detailed analysis of the test data is possible. This in particular in respect to the comparison of glulam and CLT, that is, unidirectional and orthogonal laminated structural timber products (series 5sGL vs. series 5sCL) as well as in respect to the earlier introduced two-level hierarchical model, that is, the inter and intra variation of tensile properties out-of-plane together with local and global density.

3.4.2. Analysis of the Effect of Layer Orientation—Unidirectional vs. Orthogonal

In the following the effect of unidirectional vs. orthogonal lamination is analyzed by comparing the sub-series data of series 5sGL (glulam) with series 5sCL (CLT). The main statistics are summarized in Table 9 and the single as well as mean values presented in Figure 14.
Table 9 contains also the mean values of density, modulus of elasticity and strength in tension out-of-plane from corresponding segments from single-layer tests in series 1s; these statistics are marked as ρ12,1,mean, Et,90,1,mean and ft,90,1,mean. In addition, also the ratios between the statistics from five- and single-layer specimens are included. Apart from sub-series E where, in contrast to all other sub-series, higher tensile strength values in five-layer specimens and relatively low values in single-layer tests are observed, the ratios between the statistics from sub-series from series 5sGL and/or series 5sCL and from corresponding tests in series 1s are in a relatively narrow bandwidth, that is, ρ12,mean12,1,mean = 0.92 to 1.11 (on average 1.02) for both series 5sGL and 5sCL, Et,90,mean/Et,90,1,mean = 0.40 to 0.55 (0.47) in series 5sGL and 0.64 to 0.81 (0.73) in series 5sCL, and ft,90,mean/ft,90,1,mean = 0.40 to 0.52 (0.45) in series 5sGL and 0.69 to 0.91 (0.79) in series 5sCL. The ratio between the density values of overall 1.02 again confirms the successful creation of density matched samples (see also Figure 14) whereas the ratios between the moduli of elasticity and strengths, which are in general clearly below 1.0 and different in series 5sGL and 5sCL, demonstrate on one hand the significant influence of the number of layers N and on the other hand a significant influence of the layer orientation, that is, unidirectional vs. orthogonal.
Figure 14, which presents single and mean values of all sub-series from both series 5sGL and 5sCL, marks single values in dark-grey, light-grey or white, respectively, in cases were all (3/3) or two of three failures within a sub-series occurred in segments of the same board or in cases were all failures occurred in segments of different boards. First of all, with a look on the average density values from both series a very good agreement is found, because the segments used for the specimens in each series originate from the same boards, that is, in each series and sub-series there is one specimen that has the same layup and base material. Consequently, differences between the tensile properties and failure behavior in sub-series from series 5sGL and 5sCL are further related to the layer orientation, that is, unidirectional vs. orthogonal lamination, as influences from the annual ring pattern, density and test setup are excluded.
Looking at the single data points of failed segments/layers which origin from the same boards marked as dark- or light-grey, as expected, relatively narrow values, that is, low variation, is observed. The comparison of mean as well as single values of the sub-series from both series 5sGL and 5sCL clearly points out that in CLT the modulus of elasticity as well as strength in tension out-of-plane are much higher than in glulam. On average, the modulus of elasticity out-of-plane in CLT is 53% (45 to 66%) and the tensile strength out-of-plane in CLT 68% (37 to 93%) higher than in the corresponding sub-series of glulam specimens, although they feature the same layup and are built up of the same base material.
The reason for these higher tensile properties in CLT is seen again in the restricted transversal deformation capability, a so-called reinforcing effect of the orthogonal, traversal layers, which is caused by the much higher elastic properties of structural timber parallel to the grain than perpendicular to the grain; for coniferous timber species the ratio between the modulus of elasticity parallel and perpendicular to the grain is typically 30:1; see for example, EN 338 [7]. The orthogonal lamination interrupts and generally reduces the lateral contraction of the CLT specimen and thereby interrupts also the centrically accumulation of stresses. A similar phenomenon can be observed when testing CLT and glulam specimens in compression out-of-plane. In this case for CLT, there are on average approximately 30% higher elastic and strength properties than can be observed for glulam; see for example, Halili [63], Bogensperger et al. [64], Ciampitti [65] and Brandner [66]. Interestingly, one of the highest effects of orthogonal vs. unidirectional lamination is in sub-series D where none of the failures occurred in segments from the same board.
In the context of the fractures observed in 12/21 (57%) specimens, the fracture occurred in both series 5sGL and 5sCL in segments of the same board; however, the failure mechanism was only the same in 4/21 cases (19%); none of them occurred within the specimen. In 10/42 (24%) specimens fractured within the specimen (intra fractures), either within or between the segments; all other failures occurred within or close to the interface between load transmission blocks and specimen as well as in two cases because of an insufficient glue line quality, as marked in Figure 14; both values remained in the statistical analysis in Table 9.

3.4.3. Analysis of Inter and Intra Variation

On the basis of the present sub-series, the intra and inter variation in density and tensile properties out-of-plane can be discussed. This circumstance is in particular true for those sub-series were all or at least two failures occurred in segments of the same board, that is, within the same layer. This is possible as all specimens within each sub-series were built up of segments from the same boards and placed at the same layup position. However, the number of specimens in each sub-series is relatively limited and given by three in series 5sGL, 5sCL and 7sCL as well as by four in series 5sCL3002. The number of sub-series where all specimens failed in the same layer are two, four, two and zero, respectively, in series 5sGL, 5sCL, 7sCL and 5sCL3002; see Table 10. Consequently, statistics from such small samples and from such a limited number of samples are subject to large uncertainties.
With focus on the equi-correlation, as measure for the inter and intra variation, for its determination in particular the variation between and within sub-series or the total variation are required. The calculation of the variance, as second moment, is possible only for samples with at least two entries. As a result, all sub-series featuring less than two failures in segments of the same board are excluded. Nevertheless, only rough estimates for equi-correlations can be expected from such small samples, but these should still be sufficient to compare these findings with the already available knowledge on equi-correlation coefficients for tensile properties perpendicular to the grain (e.g., Brandner and Schickhofer [66]) and also other elastic and strength properties of timber (e.g., Brandner [60] and Kandler et al. [67]).
Table 10 summarizes the equi-correlation coefficients determined on the test data presented here and also provides some statistics on the number and sample size of sub-series and the number of failures within segments of the same board in sub-series. The equi-correlation coefficients ρequi(.) were calculated as the ratio between the variance of mean values (inter variance), σY2, and the total variance σZ2 = σY2 + σX2, with σX2 as intra variance, of property (.), separately for each series; see Equation (3). In addition to the density of the failed layer(s), ρ12 = ρ12,local, the density of the specimens, ρ12,global, is also analyzed. In fact, the equi-correlation coefficients for the local density and the tensile strength out-of-plane represent estimates for shares of variance between boards exposed to different stress conditions caused by differing layups and lamination and not shares of variance between specimens. Consequently, the outcomes of this analysis can be compared directly regardless of their test series affiliation.
As expected, the equi-correlation coefficients for the local and global density are relatively high and on average in the range of 0.85 to 0.90 with slightly higher values for the global density. The bandwidth is well in line with previous investigations, for example, Brandner and Schickhofer [66] and Ehrhart and Brandner [68]. The equi-correlation found for the modulus of elasticity in tension out-of-plane with on average 0.85 appears relatively high in comparison with average outcomes from the literature whereas the value for the tensile strength out-of-plane is within the expected range; see for example, Riberholt and Madsen [56], Leicester [69], Taylor [70], Taylor and Bender [71], Richburg and Bender [72], Lam et al. [73], Williamson [74], Källsner et al. [75], Ditlevsen and Källsner [57,58] and Isaksson [76]. By summarizing values from the literature, Brandner [51] proposes ρequi12) = 0.80 to 0.90, ρequi(E) = 0.50 to 0.60 and ρequi(f) = 0.40 to 0.50, with higher values for higher material qualities, that is, material featuring less local variation. Brandner and Schickhofer [66], who investigated the equi-correlations for the tensile properties perpendicular to the grain in structural timber, and Ehrhart and Brandner [68], who report on equi-correlations for the rolling shear properties in structural timber, both by testing samples apparently free from any local growth irregularities from Norway spruce, conclude overall similar or slightly higher values for ρequi(E; G) and ρequi(f), respectively, with ρequi(E; G) = 0.65 to 0.88 and ρequi(f) = 0.47 to 0.60.
In general, lower coefficients for strength properties result from the local dependence on local growth characteristics like knots, pith, pitch pockets as well as the local annual ring pattern and stress concentrations. In contrast, the density, even if determined for the failed segment only, as well as the modulus of elasticity in tension out-of-plane represent relatively average properties of the investigated specimen volume.
In summary, although the equi-correlation coefficients determined from the tests presented here are subject to large uncertainties, due to the small number of observations per board, the values are well in-line with previous investigations in the literature although only a minority of them focused on tensile properties perpendicular to the grain but relatively represent a summary of tension and compression parallel to the grain as well as bending and shear test outcomes.

3.5. Analysis of General Relationships

Apart from these more specific intra- and inter-relationships and correlations within the same properties, as discussed in the previous Section 3.4, the relationships and correlations between different properties and in particular between strength and strength indicating properties, with focus on a non-destructive estimation of strength capacities, are also of interest. Consequently, possible relationships between tensile properties out-of-plane as well as between them and density of the failed segment(s) were analyzed by means of power regression analysis. The motivation for power regression models is argued by considering the lognormal distribution as a representative model for all three properties. The analysis was made for each series and is provided in more detail in Jantscher [37]. Overall, the correlation between ft,90 and Et,90 was found moderate with on average 0.45. For Et,90 and ft,90 vs. ρ12 the average correlations were 0.35 and 0.15, respectively. As known from previous investigations, for example, Blaß and Schmid [11] and Stuefer [39], which also conclude moderate correlations between tensile properties out-of-plane (r(Et,90; ft,90) = 0.40 to 0.53) and less or even a negative correlation between them and the density (r(Et,90; ρ12) = 0.30 to 0.57; r(ft,90; ρ12) = –0.40 to 0.36), the outcome is not surprising and supportive for these earlier works. However, both references report on moderate correlations between both tensile properties and the radial distance to the pith, PD, as surrogate for the annual ring pattern, with r(Et,90; PD) = 0.35 to 0.66 and r(ft,90; PD) = 0.29 to 0.65).

3.6. Analysis of Serial and Parallel System Effects on the Tensile Properties Out-of-Plane

In this section the influence from the number of layers, N, expressible as serial system or depth effect (effect in out-of-plane direction), and the influence from the number of segments within each layer, M, expressible as parallel system or width effect (effect in both in plane directions), are analyzed. These effects are commonly referred to size and volume effects in the literature (e.g., Barrett [6]; Blaß and Schmid [11]; Dill-Langer [12]). In order to bring more light into the two clearly different mechanisms associated with serial and parallel system actions, which is in particular of interest for CLT as a planar product, both mechanisms will be analyzed and discussed separately. In this respect the works of Mistler [15,16] on the resistance of glulam against tensile stresses perpendicular to the grain have to be mentioned. Although his investigations concentrate on linear structural members, by establishing his rope-chain model he clearly underlines the necessity for differentiating between serial and parallel system actions by combining the principles of Weibull’s (Weibull [50]) and Daniels’ (Daniels [77]) theories. Aicher et al. [41], who compared the predictive quality for the tensile strength perpendicular to the grain by means of different and combined geometrical measures of the tested glulam members, found highest agreement when effects in length and cross section are treated separately in the model.
In the discussion on serial and parallel system effects it must be considered that both probabilistic and mechanical aspects usually act together. This circumstance must be considered especially when comparing different systems with simultaneous changes in the stress distribution within and between the elements. However, in the framework of a first simple approach, the contribution of probabilistic effects from serial and/or parallel acting elements is analyzed by considering equally loaded elements, that is, any change in the stress distribution is neglected. In view of common glulam and CLT productions, another boundary condition is the independence between lamellas (elements) from different layers and within large dimensioned CLT elements even within layers. Furthermore, with a focus on homogeneous layups, that is, all boards/lamellas of an equal strength class, the tensile properties out-of-plane are further treated as iid, that is, independent and identically distributed.
Starting at first with the serial effects on the modulus of elasticity in tension out-of-plane, under the given boundary conditions of equally loaded segments, iid elastic properties and 2pLN as representative statistical distribution model, the probabilistic models in Brandner and Schickhofer [78] can be directly applied to calculate moments of Et,90,N in dependency of N. Given the coefficient of variation of the base material from series 1s, with CV(Et,90,N=1) = 16.2% at N = 1, for N = {3; 5; 7} the following relative changes in expected value, E(Et,90,N), and coefficient of variation, CV(Et,90,N), are determined: E(Et,90,N,calc)/E(Et,90,N=1,test) = {0.983; 0.980; 0.978} and CV(Et,90,N,calc)/CV(Et,90,N=1,test) = {0.577; 0.447; 0.378}. The same ratios calculated directly from test statistics of series 3sCL, 5sCL and 7sCL give: Et,90,N,test,mean/Et,90,N=1,test,mean = {0.756; 0.703; 0.685} and CV(Et,90,N,test)/CV(Et,90,N=1,test) = {0.679; 0.593; 0.395}. For series 5sGL the same ratios become Et,90,N,test,mean/Et,90,N=1,test,mean = 0.462 and CV(Et,90,N,test)/CV(Et,90,N=1,test) = 0.809. Consequently, for CLT the change in mean values with increasing N is higher than calculated by means of the simplified probabilistic approach, whereas the theoretical and empirical ratios of the coefficients of variation are relatively close. The shift in mean values, in particular from series 1s to series 3sCL, can probably be explained by different stress distributions in single- and multiple-layer tests, that is, by a higher stress concentration in the center in series 3sCL leading to disproportionately higher local displacement recordings. In the case of glulam (series 5sGL) the relative changes are almost twice as pronounced as in CLT. In contrast to CLT, the stresses in glulam accumulate locally in the center. Consequently, the number of layers that are subject to a serial system behavior is lower than can be justified by the system structure itself. This explains why the change in the mean value is so pronounced, whereas the change in the coefficient of variation is much less than expected.
For the modulus of elasticity in tension out-of-plane in systems of M parallel acting, equally loaded iid segments, according to for example, Brandner and Schickhofer [78] the expected ratios are E(Et,90,M,calc)/E(Et,90,1,test) = 1.00 and CV(Et,90,M,calc)/CV(Et,90,1,test) = 1/√M; in case of series 5sCL3002 with M = 2 this would be CV(Et,90,2,calc)/CV(Et,90,1,test) = 1/√2 = 0.71 for the layer properties and E[Et,90,N×M=5×2,calc]/E[Et,90,1,test] = 0.990 and CV(Et,90,N×M=5×2,calc)/CV(Et,90,1,test) = 0.316 for the total system of N × M = 5 × 2. For comparison, the ratios between the test statistics of series 5sCL3002 and series 1s give E(Et,90,N×M=5×2,test)/E(Et,90,1,test) = 0.741 and CV(Et,90,N×M=5×2,test)/CV(Et,90,1,test) = 0.530. For the difference in mean-ratios similar arguments as for the serial system apply. In respect to the ratios between the coefficient of variations the difference between theoretical and empirical values is not clear yet but sign for a lower degree in homogenization within the parallel acting segments.
With respect to the tensile strength and in view of the boundary conditions set before, from a statistical point of view the failure in a series of N equally loaded layers will occur in the weakest layer, that is, the layer with the lowest resistance, Ft,90,N,max = min(Ft,90,N=1,max,i), with i = 1, …, N. The minimum can be asymptotically described by one of in total three possible extreme value distributions. Because of the small system size N, however, Brandner [51] recommends retaining the distribution of the base material properties and adapting their parameters accordingly. In view of the literature and the outcome in Section 3.3, for the tensile strength perpendicular to the grain of the base material the Weibull, 2pW, and the lognormal distributions, 2pLN, are further analyzed.
In case of the 2pW, the minima of a system of N, M or N × M elements under the mentioned boundary conditions can be directly described by means of a simple power model with power coefficient k = 1/β given as the inverse of the 2pW shape parameter β. The shape parameter itself depends only on the coefficient of variation, CV(ft,90), which, by definition of 2pW, remains constant and independent of the system size. By analyzing the data in Aicher et al. [41], however, CV(ft,90) is, although not significantly, steadily decreasing with increasing N and volume Vt,90 stressed in tension perpendicular to the grain.
Table 11 summarizes some test data for glulam from the literature where only the number of layers were varied. Power coefficients ktest from power models calibrated to mean values from test series together with corresponding coefficients of determination, r2, as well as power coefficients, k2pW, as the inverse of the 2pW shape parameter calculated for average values of CV(ft,90), are presented (please note: since given values for r2 refer to only a few data points, it is recommended not to overrate the high values). Whereas values for k2pW for the given range of CV(ft,90) = 19 to 30% are overall close to the current regulations in EC 5 (EN 1995-1-1 [79]) with 1/5, the values for ktest are clearly different, that is, the serial effect as observed from tests on glulam is much higher than estimated from the Weibull theory which can roughly explain only half of the decrease in mean values, at least as long as equally loaded lamellas are preconditioned.
In calculating the tensile stresses out-of-plane from tests, uniformly distributed stresses are assumed, that is, σt,90 = Ft,90/At,90, with At,90 as the surface area loaded in tension out-of-plane. However, in reality these stresses are far from being uniform (see Figure 10 and for example, Pedersen et al. [13]; Dill-Langer [12]; Astrup et al. [17]); instead, in glulam stresses accumulate locally at much higher levels than calculated. This results in higher strains, and consequently lower moduli of elasticity and lower resistances, and also in lower calculated strength values, because of the applied calculation schema. Thus, not the weakest segment in the serial system but the segment with the highest degree of utilization, that is, the highest ratio of stress vs. strength, might lead to failure of the specimen. As already discussed above in conjunction with the modulus of elasticity, the accumulation of stresses in the specimen center not only affects the mean but also the coefficient of variation. This is because the number of layers that are under high stress and therefore most likely to fail is significantly lower than the number of layers in the product itself. Consequently, more realistic probabilistic-mechanical models, which consider the distribution of stresses by integrating the statistical distribution function over the stress distribution of the whole volume, that is, via a weighting process, are needed; see for example, Dill-Langer [12].
With the focus on CLT and in contrast to glulam, there is now once again a heterogeneous stress distribution over the specimen but stresses accumulate relatively locally within the layers rather than within the specimen. This is again attributed to the so called “locking effect” caused by the orthogonal lamination in CLT, which restricts the lateral deformations in neighboring layers and thus tends to distribute the tensile stresses out-of-plane on the layers instead of accumulating them in the specimen’s center as it is the case for glulam; see for example, the numerical simulations in Jantscher [37]. Consequently, a lower serial effect in total is expected in comparison to glulam. This circumstance is also expressed in the coefficients of variation, for example, in comparison with series 1s no reduction in glulam, for example, in series 5sGL (see also Table 1), but, because of probabilistic serial effects, lower coefficients of variation in series 3sCL, 5sCL and 7sCL.
Considering this and based on the statistics for ft,90,N=1 from series 1s (see Table 7), estimates for the statistics of serial systems with N = {3; 5; 7} as well as for the serial, sub-parallel system with N × M = 5 × 2, representing the systems in series 3sCL, 5sCL, 7sCL as well as 5sCL3002, respectively, were calculated and compared with the test statistics. Table 12 summarizes the ratios between mean values, coefficients of variation and 5%-quantile values from theoretical calculations assuming either 2pW or 2pLN distribution models. As already outlined before, in case of 2pW the coefficient of variation CV(ft,90,N=1) = 27.3% from series 1s is set constant and independent from the system dimension N, M and N × M. Consequently, the values for xmean,2pW and x05,2pW only depend on ft,90,mean,N=1 = 1.98 MPa, CV(ft,90,N=1) = 27.3% and the number of segments in the system N or N × M. In case of 2pLN, the probabilistic models for calculating xmean,2pLN, CV(x2pLN) and x05,2pLN in dependency of N in Brandner [51] and Brandner and Stadlober [80] are used; these references provide simplified equations for estimating the relative change in distribution parameters and moments of minima from basically lognormally distributed random variables in dependency of CV(xN=1) of the base material and N. In contrast to 2pW, in the case of 2pLN not only the mean values but also the coefficient of variation becomes smaller with a higher N. This observation is also confirmed by the test outcomes in Table 7. For the comparison with series 5sCL3002, as serial, sub-parallel system with N = 5 and M = 2, at first the parallel system action was evaluated by using the outcomes in Brandner [60]. In doing so, the system strength at first had a partial failure, that is, when exceeding the resistance of the first segment, and the system strength corresponding to the maximum resistance of the system at ultimate failure (in this case the resistance of the system at the failure of the first or second segment) were determined. Secondly, the outcomes from this parallel system analysis served as input for the analysis of the serial system.
The ratios between the theoretical values based on the 2pW distribution and the empirical statistics demonstrate in general decreasing correspondence with increasing N and also for series 5sCL3002 with N × M = 5 × 2. Whereas the ratios between the mean values are within 0.72 and 0.89, because of the constant CV(ft,90) the ratios between the 5%-quantiles are only within 0.48 to 0.70. There is already a clear difference between the theoretical and the empirical 5%-quantile for series 1s with x05,2pW/x05 = 0.83. In contrast to that, the ratios based on the lognormal distribution are relatively close to 1.0 although the reduction in CV(ft,90) with increasing number of segments in the system is overpredicted for the serial systems. Widely constant ratios close to 1.0 underline the generally good agreement between theoretical and empirical values but also that for the tensile strength out-of-plane of CLT the probabilistic models are able to explain differences between the test series and the influence of the system dimension already to a satisfactory agreement. As the tensile stresses out-of-plane in CLT not only concentrate on the central layers but also affect all layers in the serial system in a broadly equal manner, the previously made assumption of equally loaded layers is roughly fulfilled.
Finally, Figure 15 presents a comparison between the mean and 5%-quantile values for the tensile strength out-of-plane from tests and the size effect power model of EC 5 (EN 1995-1-1 [79]) given a power coefficient of 1/5 = 0.2. The test statistics from series 5sCL with a volume of V = 0.0034 m3 are set as a reference whereby the volume of this series is clearly lower than the reference volume for glulam with Vref = 0.01 m3 according to EC 5. Because of the scale invariance of the power model associated with it is only a shift on the vertical axis whereas the shape of the model remains. In contrast to the comparison discussed before and given in Table 12 therewith associated is also a lower coefficient of variation with CV(ft,90,5sCL) = 22.6% instead of CV(ft,90,1s) = 27.3%. In-line with the previous outcomes based on 2pW, both series 3sCL and 7sCL featuring comparable coefficients of variation are well represented by the theoretical model whereas the values for series 1s are overpredicted, but not significantly, whereas for series 5sCL3002, featuring a four-times higher volume, and in particular for series 5sGL the predicted values differ significantly from the observed ones. Nevertheless, for the description of the serial effect on the tensile strength out-of-plane of CLT of typically N = {3; 5; 7} layers the current size effect model in EC 5 would be applicable for as long as the reference strength value is set accordingly.

4. Summary and Conclusions

In the following the main outcomes from the literature study and from the own numerical and experimental investigations with a focus on CLT are summarized and conclusions are drawn:
  • Generally, in timber engineering, stresses in tension perpendicular to the grain should be avoided wherever possible. However, as there are a number of design situations where this is not possible, reliable tensile properties perpendicular to the grain are needed for the base material and also for the structural timber products produced from it.
  • In regulating these properties, (i) the non-homogeneous stress distribution within the volume exposed to tension perpendicular to the grain, caused by the cylindrical orthotropy of timber, (ii) the layup, i.e., the number and orientation of layers to each other, as well as (iii) the dependency of tensile properties on moisture content and their vulnerability to moisture variations need to be considered.
  • The non-homogeneous stress distribution, which is neglected in calculating tensile properties perpendicular to the grain from standard tests, for example, according to EN 408 [38], affects the base material as well as the product properties; latter, by an increased depth or layer effect at least in unidirectionally laminated products like glulam.
  • As the distribution of tensile stresses perpendicular to the grain is less heterogeneous in boards/lamellas with larger radial distance to the pith and more pronounced in boards/lamellas taken close to the pith, and as the distance to the pith is also an indicator for the strength class of the base material and products made thereof, for example in glulam increasing properties in tension perpendicular to the grain with increasing glulam strength class would be expected; this was also anchored in the former glulam standard EN 1194 [81]. However, in respect to ease of use and the uncertainties in the properties, primarily caused by the influence of moisture, long-term behavior and variability in local stresses and associated design situations, together with constant values for all strength classes, as currently anchored in for example, EN 14080 [8], are seen as being more promising.
  • For the adjustment of tensile properties perpendicular to the grain to moisture contents others than tested and/or regulated, the outcomes from Gerhards [61] might be a valuable basis, within 6% ≤ u ≤ 20% with 3% and 2% per percent difference in moisture content, respectively, for the modulus of elasticity and strength in tension perpendicular to the grain.
  • In the context of the investigations carried out here, the power of the lognormal and Weibull distribution models in the representation of the tensile strength out-of-plane was analyzed. The lognormal distribution proved to be more suitable for the majority of the test series, both qualitatively and quantitatively. This outcome is also consistent with observations made experimentally, where a successive rather than an ideally brittle failure mechanism, as underlying the Weibull theory, was found. The preference for the lognormal distribution can be argued also with the hierarchical material structure of the natural raw material timber and the multiplicative process that underlies a lognormal distribution. Consequently, the lognormal distribution is recommended for the characterization of tensile properties perpendicular to the grain of structural timber and the structural timber products made from it.
  • In the framework of the investigations presented here, the intra (between) and inter (within) variations in tensile properties out-of-plane and the density were analyzed. Despite the given uncertainties caused by the small number of replicants per series the outcomes are in good agreement with previous investigations made on the tensile properties out-of-plane of the base material structural timber but also more generally with data for other elastic and strength properties of structural timber and structural timber products. This information on the intra and inter variation of timber properties provides a valuable basis for more realistic probabilistic-numerical models of CLT and other structural timber products.
  • In respect to the influence of the number of layers and the layer orientation, a significant difference was found between unidirectional and orthogonal laminates both numerically and experimentally. In contrast to unidirectionally laminated products such as glulam, in orthogonally laminated products such as CLT the distribution of tensile stresses out-of-plane over the volume is much more homogeneous. Consequently, every layer takes part in the serial system action, which is not the case in glulam where the stresses accumulate and concentrate in the specimen center. Thus, in glulam the ratio between maximum and average stresses is much higher which is reflected in a more pronounced serial system effect, i.e., depth or number of layer effect.
  • In contrast to CLT the much higher serial system effects in glulam affect both the modulus of elasticity and strength in tension out-of-plane. In CLT, the modulus of elasticity and strength in tension out-of-plane are on average 50% and 70% higher, respectively, than in glulam. This outcome refers to the analysis of seven sub-series of glulam and CLT featuring similar boundary conditions, for example, number of layers, layup, base material, test setup and execution.
  • Considering the already mentioned uncertainties associated with these properties in real structures and the demand for ease of use in the design process, in analogy to the recommendations for regulation of the properties of CLT in compression out-of-plane in Brandner [42] also for the tensile properties out-of-plane, it is proposed to set the properties for CLT 30% higher than for glulam. These plus 30% do not account for the additional parallel system effects in CLT as a plane-like product, which provides an additional benefit, featuring more planar distributed tensile stresses out-of-plane such as, for example, in joints between CLT floor elements executed as double surface splines or half-lapped joints.
  • In analogy to the proposed setup and specimen dimensions for testing CLT in compression out-of-plane in Brandner [42] with reference to Brandner et al. [20] and PT SC5.T1 [21], also for the determination of the tensile properties out-of-plane of CLT, the proposal is to use specimens with dimensions CLT × wCLT × dCLT = 150 × 150 × 150 mm3 but in the plane not greater than CLT × wCLT = 300 × 300 mm2, which corresponds to a reference five-layer CLT element with constant layer thicknesses t = 30mm and reference lamination width w = 150 mm. In contrast to the tests presented here, these specimens shall be taken arbitrarily from CLT plates including typical timber growth (e.g., knots; sawing pattern) and CLT product characteristics (e.g., gaps; stress reliefs).
  • When determining tensile properties perpendicular to the grain from tests, a homogeneous stress distribution over the specimen side face is assumed. However, as already mentioned several times before, at least for structural timber and unidirectionally laminated members, this is usually far from reality. In tapered or curved beams and plates, the shape of the building components already causes tensile stresses perpendicular to the grain which also accumulate in certain areas of the component. In addition to the volume, the distribution of these tensile stresses perpendicular to the grain is considered for example in the design code EC 5 (EN 1995-1-1 [79]) via the coefficient kdis. It remains to be clarified to what extent the assumptions made in the determination of the tensile properties perpendicular to the grain of products and those in the determination of the volume exposed to tensile stresses perpendicular to the grain as well as the distribution of the tensile stresses perpendicular to the grain (kdis) itself led to a coherent overall result in the course of the design. However, the treatment of the basic tensile properties perpendicular to the grain as properties based on a uniform stress distribution in the design of components and details subjected to tensile stresses perpendicular to the grain is generally questioned as being critical.

Author Contributions

R.B., main conceptualization, methodology, additional test data analyses, supervision, modelling of probabilistic effects, writing—original draft preparation; L.J., numerical modelling, testing and first test data analyses, writing—review and editing. All authors have read and agreed to the published version of the manuscript.

Funding

This research received Open Access Funding by the Graz University of Technology.

Institutional Review Board Statement

Not applicable.

Informed Consent Statement

Not applicable.

Data Availability Statement

Details regarding the numerical modelling as well as testing and analyses are provided in the Master Thesis of Jantscher [37] which is freely available at the repository of Graz University of Technology; see https://diglib.tugraz.at/download.php?id=5f90179a91027&location=browse, accessed on 11 September 2021.

Acknowledgments

The support of the company Hasslacher Norica Timber, which provided all timber boards for the specimens and MUF adhesive, is thankfully acknowledged.

Conflicts of Interest

The authors declare no conflict of interest.

References

  1. Spengler, R. Festigkeitsverhalten von Brettschichtholz unter zweiachsiger Beanspruchung, Teil 1, Ermittlung des Festigkeitsverhaltens von Brettlamellen aus Fichte durch Versuche. Berichte zur Zuverlässigkeitstheorie der Bauwerke; Technische Universität München: München, Germany, 1982; Heft 62. (In German) [Google Scholar]
  2. Hemmer, K. Versagensarten des Holzes der Weißtanne (Abies Alba) unter mehrachsiger Beanspruchung. Ph.D. Thesis, TH Karlsruhe, Karlsruhe, Germany, 1984. (In German). [Google Scholar]
  3. SIA 265 Timber Structures. SN; Swiss Society of Engineers and Architects: Zurich, Switzerland, 2002.
  4. Ranta-Maunus, A. Duration of load effect in tension perpendicular to grain in curved glulam. In Proceedings of the International Council for Building Research Studies and Documentation, Working Commission W18–Timber Structures (CIB-W18) Meeting, Savonlinna, Finland, 12–14 August 1998; Görlacher, R., Ed.; Lehrstuhl für Ingenieurholzbau und Baukonstruktionen, Universität Karlsruhe: Karlsruhe, Germany, 1998; CIB-W18/31-9-1. [Google Scholar]
  5. Aicher, S.; Dill-Langer, G. DOL effect in tension perpendicular to grain of glulam depending on service classes and volume. In Proceedings of the International Council for Building Research Studies and Documentation, Working Commission W18–Timber Structures (CIB-W18) Meeting, Vancouver, BC, Canada, 25–28 August 1997; Görlacher, R., Ed.; Lehrstuhl für Ingenieurholzbau und Baukonstruktionen, Universität Karlsruhe: Karlsruhe, Germany, 1997; 30-9-1. [Google Scholar]
  6. Barrett, J.D. Effect of size on tension perpendicular-to-grain strength of Douglas-Fir. Wood Fiber 1974, 6, 126–143. [Google Scholar]
  7. EN 338 Structural timber–Strength Classes; CEN: Brussels, Belgium, 2016.
  8. EN 14080 Timber Structures–Glued Laminated Timber and Glued Solid Timber–Requirements; CEN: Brussels, Belgium, 2013.
  9. Aicher, S.; Dill-Langer, G. Zugfestigkeit senkrecht zur Faserrichtung von qualitativ hochwertigem Brettschichtholz gemäß CEN Festigkeitsklassen GL32 und GL36. Otto Graf J. 1995, 6. (In German) [Google Scholar]
  10. Canisius, T. End conditions for tension testing of solid timber perpendicular to grain. In Proceedings of the International Council for Building Research Studies and Documentation, Working Commission W18–Timber Structures (CIB-W18) Meeting, Copenhagen, Denmark, 18–21 April 1995; Görlacher, R., Ed.; Lehrstuhl für Ingenieurholzbau und Baukonstruktionen, Universität Karlsruhe: Karlsruhe, Germany, 1995; 28-6-6. [Google Scholar]
  11. Blaß, H.J.; Schmid, M. Tensile strength of timber perpendicular to grain. Holz als Roh-und Werkstoff 2001, 58, 456–466. (In German) [Google Scholar]
  12. Dill-Langer, G. Schädigung von Brettschichtholz bei Zugbeanspruchung rechtwinklig zur Faserrichtung. Ph.D. Thesis, Materialprüfungsanstalt, Institut für Werkstoffe im Bauwesen, Universität Stuttgart, Stuttgart, Germany, 2004. (In German). [Google Scholar]
  13. Pedersen, M.U.; Clorius, C.O.; Damkilde, L.; Hoffmeyer, P. A simple size effect model for tension perpendicular to the grain. Wood Sci. Technol. 2003, 37, 125–140. [Google Scholar] [CrossRef]
  14. Aicher, S.; Höfflin, L.; Dill-Langer, G. Damage evolution and acoustic emission of wood at tension perpendicular to fiber. Holz als Roh-und Werkstoff 2001, 59, 104–116. [Google Scholar] [CrossRef]
  15. Mistler, H.L. Die Tragfähigkeit des am Endauflagers unten rechtwinkelig ausgeklinkten Brettschichtträgers. Ph.D. Thesis, Lehrstuhl für Ingenieurholzbau und Baukonstruktionen, Technische Hochschule Karlsruhe, Karlsruhe, Germany, 1979. (In German). [Google Scholar]
  16. Mistler, H.L. Über die Querzugfestigkeit von Fichten-Brettschichtholz in Abhängigkeit von der Bauteilgröße und der Verteilung der Beanspruchung. In Ingenieurholzbau in Forschung und Praxis; Ehlbeck, J., Steck, G., Eds.; Bruder Verlag: Karlsruhe, Germany, 1982. (In German) [Google Scholar]
  17. Astrup, T.; Clorius, C.O.; Damkilde, L.; Hoffmeyer, P. Size effect of glulam beams in tension perpendicular to grain. Wood Sci. Technol. 2007, 41, 361–372. [Google Scholar] [CrossRef]
  18. Silly, G.; Thiel, A.; Augustin, M. Options for the Resource Optimised Production of Laminar Load Carrying Members Based on Wood Products; World Conference on Timber Engineering (WCTE): Vienna, Austria, 2016. [Google Scholar]
  19. Franzoni, L.; Lebée, A.; Lyon, F.; Forêt, G. Elastic behavior of Cross Laminated Timber and timber panels with regular gaps: Thick-plate modeling and experimental validation. Eng. Struct. 2017, 141, 402–416. [Google Scholar] [CrossRef] [Green Version]
  20. Brandner, R.; Flatscher, G.; Ringhofer, A.; Schickhofer, G.; Thiel, A. Cross Laminated Timber (CLT): Overview and Development. Eur. J. Wood Wood Prod. 2016, 74, 331–351. [Google Scholar] [CrossRef]
  21. PT SC5.T1 Chapters for CLT on the Basis of the Eurocode 5: Document & Background Document. In Properties, Testing and Design of Cross Laminated Timber. A State-of-the-art Report by COST Action FP1402/WG 2; Brandner, R.; Tomasi, R.; Moosbrugger, T.; Serrano, E.; Dietsch, P. (Eds.) Shaker Verlag: Düren, Germany, 2018. [Google Scholar]
  22. ÖNORM B 1995-1-1 Eurocode 5: Design of Timber Structures–Part 1-1: General–Common Rules and Rules for Buildings–Consolidated Version with National Specifications, National Comments and National Supplements for the Implementation of ÖNORM EN 1995-1-1; ASI: Vienna, Austria, 1995.
  23. Bidakov, A. CLT strength in tension perpendicular to grain. In Properties, Testing and Design of Cross Laminated Timber. A State-of-the-Art Report by COST Action FP1402/WG 2; Brandner, R., Tomasi, R., Moosbrugger, T., Serrano, E., Dietsch, P., Eds.; Shaker Verlag: Düren, Germany, 2018. [Google Scholar]
  24. Bidakov, A.M.; Raspopov, I.A. Test method of CLT by tension perpendicular to grain. Acad. J. Ser. Ind. Mach. Build. Civ. Eng. 2018, 1, 148–158. [Google Scholar] [CrossRef]
  25. Markwardt, L.J.; Youngquist, W.G. Tension Test Methods for Wood, Wood-Base Materials, and Sandwich Constructions; Report No. 2055; USDA Forest Service, Forest Products Laboratory: Madison, WI, USA, 1956. [Google Scholar]
  26. Bröker, F.W. Tensile strength of spruce perpendicular to the grain under different load directions. Holz als Roh-und Werkstoff 1984, 42, 474. (In German) [Google Scholar]
  27. Stecher, G.; Maderebner, R.; Zingerle, P.; Flach, M.; Kraler, A. Curved Cross Laminated Timber Elements. In Proceedings of the World Conference on Timber Engineering (WCTE), Vienna, Austria, 22–25 August 2016. [Google Scholar]
  28. Stecher, G. Zur Berechnung der Tragfähigkeit und Verformung einfach gekrümmter Brettsperrholzelemente. Ph.D. Thesis, Universität Innsbruck, Innsbruck, Austria, 2017. (In German). [Google Scholar]
  29. ETA-16/0055 Radiusholz–Massive plattenförmige Holzbauelemente für tragende Bauteile in Bauwerken; Holzbau Unterrainer, OIB: Vienna, Austria, 2016.
  30. Serrano, E. Cross Laminated Timber Plates with Notches–Analyses based on fracture mechanics. In Timber–Bonds, Connections and Structures; Dill-Langer, G., Ed.; MPA University of Stuttgart: Stuttgart, Germany, 2018; ISBN 978-3-946789-01-7. [Google Scholar]
  31. Serrano, E. Cross laminated timber plates with a notch at the support. In Thematic Conference on Computational Methods in Wood Mechanics—From Material Properties to Timber Structures (CompWood 2019); ECCOMAS: Växjö, Sweden, 2019. [Google Scholar]
  32. Serrano, E.; Gustafsson, P.J.; Danielsson, H. Prediction of load-bearing capacity of notched cross laminated timber plates. In Proceedings of the International Network on Timber Engineering Research (INTER) Meeting, Tacoma, WA, USA, 26–29 August 2019; Görlacher, R., Ed.; Timber Scientific Publishing, KIT Holzbau und Baukonstruktionen: Karlsruhe, Germany, 2019. 52-12-2. [Google Scholar]
  33. Serrano, E.; Danielsson, H. Fracture Mechanics Based Design of CLT plates–Notches at Supports and Half and-Half Joints. In Proceedings of the International Network on Timber Engineering Research (INTER) Meeting, online, 17–19 August 2020; Görlacher, R., Ed.; Timber Scientific Publishing, KIT Holzbau und Baukonstruktionen: Karlsruhe, Germany, 2020; 53-12-2. [Google Scholar]
  34. Malagic, A.; Augustin, M.; Silly, G.; Thiel, A.; Schickhofer, G. Load-bearing Capacity and Fracture Behaviour of Notched Cross Laminated Timber Plates. In Proceedings of the International Network on Timber Engineering Research (INTER) Meeting, online, 16–19 August 2021; Görlacher, R., Ed.; Timber Scientific Publishing, KIT Holzbau und Baukonstruktionen: Karlsruhe, Germany, 2021; 54-12-5. [Google Scholar]
  35. Azinović, B.; Serrano, E.; Kramar, M.; Pazlar, T. Experimental investigation of the axial strength of glued-in rods in cross laminated timber. Mater. Struct. 2018, 51, 143. [Google Scholar] [CrossRef]
  36. Ayansola, G.S.; Tannert, T.; Vallee, T. Experimental Investigations of Glued-in Rod Connections in CLT. Available online: https://papers.ssrn.com/sol3/papers.cfm?abstract_id=3970702 (accessed on 11 September 2021).
  37. Jantscher, L. Querzugkenngrößen von Brettsperrholz (BSP). Master’s Thesis, Graz University of Technology, Institute of Timber Engineering and Wood Technology, Graz, Austria, 2020. (In German). [Google Scholar]
  38. EN 408:2010+A1 Timber Structures–Structural Timber and Glued Laminated Timber–Determination of Some Physical and Mechanical Properties; CEN: Brussels, Belgium, 2012.
  39. Stuefer, A. Einflussparameter auf die Querzugfestigkeit von BSH-Lamellen. Bachelor’s Thesis, Graz University of Technology, Graz, Austria, 2011. (In German). [Google Scholar]
  40. JCSS 3.5 JCSS Probabilistic Model Code–Part 3: Resistance Models–3.5 Properties of Timber; Joint Committee on Structural Safety (JCSS): Zurich, Switzerland, 2006; Available online: www.jcss.byg.dtu.dk (accessed on 11 September 2021).
  41. Aicher, S.; Dill-Langer, G.; Klöck, W. Evaluation of different size effect models for tension perpendicular to grain strength of glulam. In Proceedings of the International Council for Research and Innovation in Building and Construction, Working Commission W18–Timber Structures (CIB-W18) Meeting, Kyoto, Japan, 16–19 September 2002; Görlacher, R., Ed.; Lehrstuhl für Ingenieurholzbau und Baukonstruktionen, Universität Karlsruhe: Karlsruhe, Germany, 2002; 35-6-2. [Google Scholar]
  42. Brandner, R. Cross laminated timber (CLT) in compression perpendicular to plane: Testing, properties, design and recommendations for harmonizing design provisions for structural timber products. Eng. Struct. 2018, 171, 944–960. [Google Scholar] [CrossRef]
  43. DIN 4074-1 Strength Grading of Wood–Part 1: Coniferous Sawn Timber; DIN: Berlin, Germany, 2012.
  44. Blaß, H.J.; Schmid, M. Ermittlung der Querzugfestigkeit von Voll-und Brettschichtholz. In Research Report 1998; Versuchsanstalt für Stahl, Holz und Steine, Abteilung Ingenieurholzbau, Universität Fridericiana Karlsruhe: Karlsruhe, Germany, 1998. (In German) [Google Scholar]
  45. Ehlbeck, J.; Kürth, J. Ermittlung der Querzugfestigkeit von Voll-und Brettschichtholz–Entwicklung eines Prüfverfahrens. In Research Report 1994; Versuchsanstalt für Stahl, Holz und Steine, Abteilung Ingenieurholzbau, Universität Karlsruhe: Karlsruhe, Germany, 1995. (In German) [Google Scholar]
  46. EN 13183-1 Moisture Content of a Piece of Sawn Timber–Part 1: Determination by Oven Dry Method; CEN: Brussels, Belgium, 2002.
  47. EN 384 Structural Timber–Determination of Characteristic Values of Mechanical Properties and Density; CEN: Brussels, Belgium, 2016.
  48. ETA-11/0190 Würth Selbstbohrende Schrauben–Selbstbohrende Schrauben als Holzverbindungsmittel; Adolf Würth GmbH & Co. KG, DIBt: Berlin, Germany, 2018.
  49. ETA-12/0067 Sherpa XS, S, M, L, XL und XXL–Dreidimensionale Nagelplatte (Träger-Endverbinder für Holz-Holz Verbindungen und Holz-Beton oder Holz-Stahl Verbindungen); Vinzenz Harrer GmbH; OIB: Vienna, Austria, 2019.
  50. Weibull, W. A Statistical Theory of the Strength of Materials; Royal Swedish Academy of Engineering Sciences: Stockholm, Sweden, 1939; Handling Nr. 151. [Google Scholar]
  51. Brandner, R. Stochastic System Actions and Effects in Engineered Timber Products and Structures; Monographic Series TU Graz 2013; Verlag der Technischen Universität Graz: Graz, Austria, 2013; ISBN 978-3-85125-263-7. [Google Scholar]
  52. Köhler, J.; Fink, G. Aspects of code based design of timber structures. In Proceedings of the 12th International Conference on Applications of Statistics and Probability in Civil Engineering (ICASP12), Vancouver, BC, Canada, 12–15 July 2015; Haukaas, T., Ed.; University of British Columbia Library: Vancouver, BC, Canada, 2015. [Google Scholar] [CrossRef]
  53. R Core Team. R: A Language and Environment for Statistical Computing; R Foundation for Statistical Computing: Vienna, Austria, 2020; Available online: https://www.R-project.org/ (accessed on 15 August 2020).
  54. Bury, K.V. Statistical Models in Applied Science; John Wiley & Sons Inc.: Hoboken, NJ, USA, 1975; ISBN 0-471-12590-3. [Google Scholar]
  55. EN 14358 Timber Structures–Calculation and Verification of Characteristic Values; CEN: Brussels, Belgium, 2016.
  56. Riberholt, H.; Madsen, P.H. Strength Distribution of Timber Structures—Measured Variation of the Cross Sectional Strength of Structural Lumber; Structural Research Laboratory, Technical University of Denmark: Lyngby, Denmark, 1979; No. R 114. [Google Scholar]
  57. Ditlevsen, O.; Källsner, B. System effects influencing the bending strength of timber beams. In Proceedings of the Working Conference on Reliability and Optimization of Structural Systems 1998, IFIP 8th WG 7.5, Krakow, Poland, 11–13 May 1998. [Google Scholar]
  58. Ditlevsen, O.; Källsner, B. Span-dependent distributions of the bending strength of spruce timber. J. Eng. Mech. 2005, 131, 485–499. [Google Scholar] [CrossRef]
  59. Köhler, J. Reliability of Timber Structures. Ph.D. Thesis, ETH Zurich, Institut für Baustatik und Konstruktion, Zürich, Switzerland, 2007. IBK-Bericht Nr. 301. [Google Scholar]
  60. Brandner, R. Stochastic Modelling in Timber Engineering. In Habilitation; Graz University of Technology: Graz, Austria, 2018. [Google Scholar]
  61. Gerhards, C.C. Effect of moisture content and temperature on the mechanical properties of wood: An analysis of immediate effects. Wood Fiber 1982, 14, 4–36. [Google Scholar]
  62. EN 16351 Timber Structures–Cross Laminated Timber–Requirements; CEN: Brussels, Belgium, 2015.
  63. Halili, Y. Versuchstechnische Ermittlung von Querdruckkenngrößen für Brettsperrholz. Master’s Thesis, Graz University of Technology, Graz, Austria, 2008. (In German). [Google Scholar]
  64. Bogensperger, T.; Augustin, M.; Schickhofer, G. Properties of CLT-panels exposed to compression perpendicular to their plane. In Proceedings of the International Council for Research and Innovation in Building and Construction, Working Commission W18–Timber Structures (CIB-W18) Meeting, Alghero, Italy, 29 August–1 September 2011; Görlacher, R., Ed.; Ingenieurholzbau und Baukonstruktionen, Karlsruhe Institute of Technology: Karlsruhe, Germany, 2011; 44-12-1. [Google Scholar]
  65. Ciampitti, A. Untersuchung ausgewählter Einflussparameter auf die Querdruckkenngrößen von Brettsperrholz. Master’s Thesis, Graz University of Technology, Graz, Austria, 2013. (In German). [Google Scholar]
  66. Brandner, R.; Schickhofer, G. Spatial correlation of tensile perpendicular to grain properties in Norway spruce timber. Wood Sci. Technol. 2014, 48, 337–352. [Google Scholar] [CrossRef]
  67. Kandler, G.; Füssl, J.; Eberhardsteiner, J. Stochastic finite element approaches for wood-based products: Theoretical framework and review of methods. Wood Sci. Technol. 2015, 49, 1055–1097. [Google Scholar] [CrossRef]
  68. Ehrhart, T.; Brandner., R. Rolling shear: Test configurations and properties of some European soft- and hardwood species. Eng. Struct. 2018, 172, 554–572. [Google Scholar] [CrossRef]
  69. Leicester, R.H. Configuration factors for the bending strength of timber. In Proceedings of the International Council for Building Research Studies and Documentation, Working Commission W18–Timber Structures (CIB-W18) Meeting, Beit Oren, Israel, June 1985; Görlacher, R., Ed.; Lehrstuhl für Ingenieurholzbau und Baukonstruktionen, Universität Karlsruhe: Karlsruhe, Germany, 1985. 18-6-2. [Google Scholar]
  70. Taylor, S.E. Modeling Spatial Variability of Localized Lumber Properties. Ph.D. Thesis, Texas A&M University, College Station, TX, USA, 1988. [Google Scholar]
  71. Taylor, S.E.; Bender, D.A. Stochastic model for localized tensile strength and modulus of elasticity in lumber. Wood Fiber Sci. 1991, 23, 501–519. [Google Scholar]
  72. Richburg, B.A.; Bender, D.A. Localized tensile strength and modulus of elasticity of E-rated laminated grades of lumber. Wood Fiber Sci. 1992, 24, 225–232. [Google Scholar]
  73. Lam, F.; Wang, Y.T.; Barrett, J.D. Simulation of correlated nonstationary lumber properties. J. Mater. Civil. Eng. 1994, 6, 34–53. [Google Scholar] [CrossRef]
  74. Williamson, J.A. Statistical dependence of timber strength. In Proceedings of the IUFRO/S 5.02 Timber Engineering Meeting, Sydney, Australia, 30 May 1994; pp. 353–363. [Google Scholar]
  75. Källsner, B.; Ditlevsen, O.; Salmela, K. Experimental verification of a weak zone model for timber in bending. In Proceedings of the IUFRO S 5.02—Timber Engineering 1997, Copenhagen, Denmark, 18–20 June 1997. [Google Scholar]
  76. Isaksson, T. Modeling the Variability of Bending Strength in Structural Timber. Ph.D. Thesis, Division of Structural Engineering, Lund University, Lund, Sweden, 1999. Report TVBK-1015. [Google Scholar]
  77. Daniels, H.E. The statistical theory of the strength of bundles of threads. I. Proc. R. Soc. Lond. Ser. A 1945, 183, 405–435. [Google Scholar]
  78. Brandner, R.; Schickhofer, G. Probabilistic models for the modulus of elasticity and shear in serial and parallel acting timber elements. Wood Sci. Technol. 2015, 49, 121–146. [Google Scholar] [CrossRef]
  79. EN 1995-1-1:2004 + AC:2006 + A1:2008 + A2:2014 Eurocode 5: Design of Timber Structures—Part 1-1: General–Common Rules and Rules for Buildings; CEN: Brussels, Belgium, 2014.
  80. Brandner, R.; Stadlober, E. Samples of iid Lognormals: Approximations for Characteristics of Minima. Commun. Stat.–Simul. Comput. 2016, 45, 504–518. [Google Scholar] [CrossRef]
  81. EN 1194 Timber Structures–Glued Laminated Timber: Strength Classes and Determination of Characteristic Values; CEN: Brussels, Belgium, 1999.
Figure 1. Examples for tensile stresses out-of-plane in CLT elements and connection details: (a) notched CLT floor element and screwed joint to CLT wall; (b) half-lapped joint between CLT floor elements; (c) notched CLT floor elements resting on I-beam in steel covered by fire protection layer; (d) curved CLT element; (e) opening in CLT beam; (f) CLT element lifted for assembling.
Buildings 12 00135 g001
Figure 2. Test plan overview: base material, glulam (GLT) and CLT reference series as well as variations thereof.
Buildings 12 00135 g002
Figure 3. Assignment of board segments for specimens of different test series, exemplarily shown for five of 60 boards; for complete schema, see Jantscher [37]; lengths contain oversize.
Buildings 12 00135 g003
Figure 4. Assembling of specimens exemplarily shown for series 5sCL3002: (a) application of tape to prevent unintended narrow face bonding; (b) dry assembled five-layer CLT specimen before final formatting; (c) second step of block gluing of load transmission blocks with fixation by self-tapping screws; (d) final assembling of specimen with load transmission blocks on lower and upper side with the dead load applied.
Buildings 12 00135 g004
Figure 5. (a) test setup with cardan joints on both ends as used by Stuefer [39]; (b) test setup as used in Jantscher [37], exemplarily shown for the series 1s and series 5sCL3002 with a cardan joint at the bottom and a spherical joint at the top.
Buildings 12 00135 g005
Figure 6. Example for the detection of potential partial failure(s) and/or sudden release of internal stresses.
Buildings 12 00135 g006
Figure 7. Classification of common fracture patterns (bold lines in red): (a) inter interface fracture pattern, partially radially at the edges; (b) intra interface fracture, partially radially at the edges and tangentially at the center; (c) intra W-fracture, partially radially and partially tangentially; (d) intra tangential fracture; (e) intra fracture through pith.
Buildings 12 00135 g007
Figure 8. (a) inter interface fracture between specimen and load transmission block; (b) partial adhesion failure in the glue line between specimen and load transmission block (inter fracture).
Buildings 12 00135 g008
Figure 9. (a) intra interface fracture within specimen in adjacent orthogonally laminated board segments; (b) W-fracture (intra fracture) within board segment within the specimen.
Buildings 12 00135 g009
Figure 10. (below) qualitative distributions of tensile stresses perpendicular to the grain in the horizontal center line and (above) the corresponding annual ring patterns and qualitative fracture lines (in red) in lamella cross sections with (a) infinite, (b) large and (c) small radial distance to the pith; see also Dill-Langer [12].
Buildings 12 00135 g010
Figure 11. Force-displacement diagrams for half of (a) series 5sGL and (b) series 5sCL; global displacement which includes the total deformation of test setup and test frame.
Buildings 12 00135 g011
Figure 12. Box-plots with notches as 95% confidence intervals of medians for (a) density, (b) modulus of elasticity and (c) strength from tension out-of-plane tests.
Buildings 12 00135 g012
Figure 13. Stress-strain diagrams exemplarily for (a) specimen 2-10 of series 5sGL and (b) specimen 4-10 of series 5sCL; strain based on local displacement measurements of DD1 transducers.
Buildings 12 00135 g013
Figure 14. Analysis of sub-series in series 5sGL and 5sCL: (above) density; (middle) modulus of elasticity in tension out-of-plane; (below) tensile strength out-of-plane; single and mean values as well as identification of failed segments from the same board.
Buildings 12 00135 g014
Figure 15. Tensile strength out-of-plane vs. number of layers and volume in comparison with the size effects power model for the tensile strength perpendicular to the grain in EC 5 [79].
Buildings 12 00135 g015
Table 1. Summary of coefficients of variation of the tensile strength perpendicular to the grain, CV(ft,90), gained from tests on structural timber and glulam from literature; bandwidths as observed from various series together with average values in brackets.
ReferenceStructural TimberGlulam
Markwardt and Youngquist [25]CV(ft,90) = 11–30% (16%)
various deciduous and coniferous timber species; clear wood; ASTM
Blaß and Schmid [11]CV(ft,90) = 19–61% (29%)
Norway spruce; series with 61% includes specimens with pith
CV(ft,90) = 22–33% (29%)|V = Vref = 0.01 m3
CV(ft,90) = 17–34% (26%)|V < Vref
Norway spruce; series from different producers
Aicher et al. [41]CV(ft,90) = 9–36% (26%)
Norway spruce; test data from various references
Barrett [6]CV(ft,90) = 12–39% (30%)
Douglas fir; test data from various references
Stuefer [39]CV(ft,90) = 20–29%
Norway spruce
CV(ft,90) = 19–29%
Norway spruce
Astrup et al. [17]CV(ft,90) = 14–27%
Norway spruce; material selected for special tests
Dill-Langer [12]CV(ft,90) = 11–18%
Norway spruce; material selected for special tests
Table 2. Test plan for the experimental investigations.
SeriesLayup (mm)Planned Sample SizeComments/Aims
Series 1 (1s)3040base material (single layer) tests
Series 2 (5sGL *)30|30|30|30|3021comparison with glulam
Series 3 (3sCL)30|30|3020serial effect; n = 3
Series 4 (5sCL *)30|30|30|30|3021CLT reference series
Series 5 (7sCL *)30|30|30|30|30|30|3021serial effect; n = 7
Series 6 (5sCL3002 *)30|30|30|30|3020parallel effect; four nodes
Series 7 (5sVL)40|20|40|20|4020varying layer thicknesses
Total163-
* series with sub-series.
Table 3. Absolute and relative measurement bases as well as shares of cross grain in both faces of tested series.
SeriesSpecimen Thickness t (mm)Measurement Base h0
(mm)
h0/t
(%)
Share of Cross Grain in Both Faces
Along h0 (%)|(%)
1s302583100|0
5sGL15014597100|0
3sCL90758360|40
5sCL1501459759|41
7sCL2102009555|45
5sCL30021501459759|41
5sVL1601459172|28
Table 4. Average dead loads of half of the specimen including steel parts from the overall setup.
Series1s5sGL3sCL5sCL7sCL5sCL30025sVL
Dead load (N)130136133136139602136
Table 5. Shares of intra and inter fractures.
Series1s5sGL *3sCL5sCL *7sCL *5sCL3002 *5sVLOn Average
Inter interface and mixed fractures (%)7867757670265867
Inter adhesion failure (%)0505101164
Intra interface fracture (%)1451410371812
Intra W-, tangential or mixed fracture (%)221420510261817
* … series with sub-series.
Table 6. Main statistics from partial failure analysis.
Series1s5sGL *3sCL5sCL *7sCL *5sCL3002 *5sVL
Sample size N (−)40212021201917
No. of specimens with observed
partial failures n (−)
27161716101914
n/N (%)687685765010082
ζmin (%)|ζmax (%)16|9613|9718|9618|9678|9616|8213|97
ζmean (%)59686968925071
CV(ζ) (%)4441424374237
* … series with sub-series.
Table 7. Main statistics of moisture content, density and tensile properties out-of-plane per series.
Series1s5sGL *3sCL5sCL *7sCL *5sCL3002 *5sVL
Sample size (–)40212021201917
umean (%)|CV(u) (%)14.2|3.914.3|2.814.3|3.614.3|2.214.5|1.914.1|2.613.7|5.7
ρ12,mean (kg/m3)|CV(ρ12) (%)450|12.1460|9.8461|10.8472|9.1446|8.4449|7.4441|9.8
Et,90,mean (MPa)|CV(Et,90) (%)969|16.2448|13.1733|11.0681|9.6664|6.4718|6.1678|12.5
ft,90,min (MPa)|ft,90,max (MPa)1.13|3.430.58|1.641.27|2.620.96|2.091.00|1.851.18|1.850.82|1.80
ft,90,mean (MPa)|CV(ft,90) (%)1.98|27.30.92|34.11.78|21.61.51|22.61.39|18.41.58|12.41.41|18.5
ft,90,50,emp (MPa)1.930.831.701.451.401.621.48
ft,90,05,emp (MPa)1.210.591.270.971.001.200.84
ft,90,05,LN (MPa)1.230.501.221.021.011.281.03
ft,90,05,W (MPa)1.010.401.050.930.931.260.99
ft,90,k,LN (MPa)1.170.461.150.960.961.240.97
wf,mean (mm)|CV(wf) (%) (1)1.19|23.50.96|25.21.26|18.61.23|18.81.24|15.73.48|18.91.19|15.7
* … series with sub-series, (1)wf as global fracture displacement at Fmax (includes the total deformation of test setup and test frame); due to the pronounced delays at the start of loading in a number of tests (see e.g., Figure 11), wf corresponds to the deformation from the test data between 1 kN and Fmax supplemented by those between 0 and 1 kN based on the gradient between 1 and 3 kN.
Table 8. Mean values, (co)variances and minimized sums from negative log-likelihood from lognormal and Weibull distribution parameter estimations via MLE for tensile strength out-of-plane.
Series1s5sGL *3sCL5sCL *7sCL *5sCL3002 *5sVL
n40212021201917
X = ft,90~2pLN(x|λ; ε)
μ ^ λ 0.6500−0.13320.55390.38990.30960.45100.3274
μ ^ ε 0.25900.30340.20300.22770.18260.12690.2036
σ ^ λ 2 0.00170.00440.00210.00250.00170.00080.0024
σ ^ ε 2 0.00080.00220.0010.00120.00080.00040.0012
∑ln(L)−28.7178−1.9531−7.5611−6.9083−0.5593.6882−2.6293
X = ft,90~2pW(x|α; β)
μ ^ α 2.18711.02751.93191.64951.49031.6631.5154
μ ^ β 3.83433.10864.85045.0826.232210.68246.9623
σ ^ α 2 0.01420.01290.02530.0210.01990.0230.0225
σ ^ β 2 0.19460.24170.62610.75071.17264.11431.869
CoVar(α;β)0.00920.00590.0090.00560.00320.00140.0031
∑ln(L)−32.5705−4.8495−9.6462−6.8432−0.73915.7298−0.0241
* … series with sub-series.
Table 9. Main statistics from sub-series data of series 5sGL (above) and series 5sCL (below) together with statistics from corresponding single board segment tests in series 1s.
Sub-SeriesABCDEFG
Series 5sGLSub-series sample size (–)3333333
umean (%)14.414.214.314.014.514.414.0
ρ12,mean (kg/m3)|CV(ρ12) (%)480|2.0454|2.9487|1.4435|9.0507|5.0432|10.5429|1.8
ρ12,1,mean (kg/m3)471 (1)435 (2)484 (2)409549 (2)453 (1)428 (2)
ρ12,mean12,1,mean (–)1.021.041.011.060.920.951.00
Et,90,mean (MPa)|CV(Et,90) (%)448|6.4486|4.2423|4.0374|4.6546|3.1457|11.3399|5.5
Et,90,1,mean (MPa)850 (1)886 (2)968 (2)8791082 (2)1051 (1)1007 (2)
Et,90,mean/Et,90,1,mean (–)0.530.550.440.430.500.440.40
ft,90,mean (MPa)|CV(ft,90) (%)0.79|30.30.85|15.80.81|21.70.76|8.61.50|13.30.93|45.50.79|26.6
ft,90,1,mean (MPa) 1.75 (1)1.87 (2)1.85 (2)1.791.54 (2)1.79 (1)1.99 (2)
ft,90,mean/ft,90,1,mean (–)0.450.450.440.420.970.520.40
Series 5sCLSub-series sample size (–)3333333
umean (%)14.614.314.314.014.714.114.1
ρ12,mean(kg/m3)|CV(ρ12) (%) 485|2.0469|1.7494|1.6453|4.8 543|1.6409|10.9451|2.9
ρ12,1,mean (kg/m3)471 (1)435 (2)484 (1)409542 (1)404 (2)435 (1)
ρ12,mean12,1,mean (–)1.031.081.021.111.001.011.04
Et,90,mean (MPa)|CV(Et,90) (%) 671|3.7719|0.8622|4.2621|8.4 792|2.4713|4.9631|3.4
Et,90,1,mean (MPa)850 (1)886 (2)974 (1)8791119 (1)926 (2)957 (1)
Et,90,mean/Et,90,1,mean (–)0.790.810.640.710.710.770.66
ft,90,mean (MPa)|CV(ft,90) (%) 1.33|15.6 1.46|27.0 1.27|13.2 1.39|27.1 2.05|2.31.79|5.11.30|6.0
ft,90,1,mean (MPa)1.75 (1)1.87 (2)1.85 (1)1.791.42 (1)1.96 (2)1.57 (1)
ft,90,mean/ft,90,1,mean (–)0.760.780.690.781.440.910.83
(1) … all failures in segments of the same board; mean value bases on only one value. (2) … two of three failures in segments of the same board; mean value bases on two values.
Table 10. Estimates for the equi-correlation coefficients, expressing the variation between board segments within sub-series for series 5sGL, 5sCL, 7sCL and 5sCL3002 together with statistics on the number of failures in segments of the same board within sub-series.
Series5sGL5sCL7sCL5sCL3002
# sub-series|spec. per sub-series7|37|37|35|4
#1|#2|#3|#4 (1)1|4|2|–1|2|4|–1|4|2|–1|5 (2)|0|0
ρequi12) = ρequi12,local) (–)0.800.970.850.93
ρequi12,global) (–)0.900.800.880.72
ρequi(Et,90) (–)0.750.930.850.88
ρequi(ft,90) (–)0.500.770.500.32
(1) … No. of sub-series featuring 1, 2, 3 or 4 failures in segments of the same board. (2) … two-times two failures in segments of the same board within the same sub-series.
Table 11. Power coefficients from power regression analysis based on tests on glulam as well as for a two-parameter Weibull distribution model.
ReferenceCommentsktest (–)|CV(ft,90,test) (%) (1)k2pW (–)|CV(ft,90) (%) (2)
Blaß and Schmid [11]BS 11/14; N = {1; 2; 10}1/2.4; r2 = 0.98| 17 … 331/4.2|27
BS 16; N = {2; 3; 10}1/2.7; r2 = 0.99|16 … 241/5.8|20
BS 18; N = {2; 3; 10}1/2.4; r2 = 1.00|15 … 331/4.8|24
Astrup et al. [17]glulam; N = {1; 2; …; 6}1/3.3; r2 = 0.97|14 … 271/6.1|19
Stuefer [39]glulam; N = {1; 3; 6}1/3.7; r2 = 1.00|19; 291/4.8|24
own testsseries 1s vs. 5sGL; N = {1; 5}1/2.1; r2 = NaN (3)|27; 341/3.7|30
(1) … power coefficients from power regression analysis on mean values from test series and range of observed CV(ft,90). (2) … power coefficients k2pW = 1/β and corresponding CV(ft,90) as average value from test data. (3) … as there are only two data points for a two-parameter regression model, coefficients of determination r2 not calculated.
Table 12. Ratios between theoretical values from probabilistic models and empirical statistics assuming either a 2pW or a 2pLN distribution model.
N; N × M (1)xmean,2pW/xmean (2)CV(x2pW)/CV(x) (2)x05,2pW/x05 (2)xmean,2pLN/xmean (2)CV(x2pLN)/CV(x) (2)x05,2pLN/x05 (2)
11.001.000.831.001.001.02
30.851.260.610.870.890.86
50.891.210.700.940.761.06
70.891.480.630.970.871.00
5 × 20.722.200.480.90 … 1.00 (3)1.11 … 1.02 (3)0.93 … 1.05 (3)
(1)N serial elements and M parallel elements in serial (sub-parallel) systems. (2) … ratios between theoretical values and empirical statistics; latter in relation to emp. arithmetic mean, emp. coefficient of variation or emp. 5%-quantile based on rank statistics. (3) … first value refers to the resistance at the first failure and second value to the maximum resistance of the system; see Brandner [60].
Publisher’s Note: MDPI stays neutral with regard to jurisdictional claims in published maps and institutional affiliations.

