Article

Has China’s Construction Waste Change Been Decoupled from Economic Growth?

1
School of Architecture, Southeast University, Nanjing 210096, China
2
College of Civil Engineering and Architecture, Jiaxing University, Jiaxing 314001, China
3
College of Architecture and Urban Planning, Lanzhou Jiaotong University, Lanzhou 730070, China
*
Author to whom correspondence should be addressed.
Buildings 2022, 12(2), 147; https://doi.org/10.3390/buildings12020147
Submission received: 10 January 2022 / Revised: 25 January 2022 / Accepted: 27 January 2022 / Published: 31 January 2022

Abstract

:
Construction waste management is crucial to the sustainable development of the construction industry and environmental management, and China has the highest construction waste emission in the world, making it typical and representative globally. In this paper, we conducted an empirical study on the relationship between the change in construction waste and economic growth at the provincial level in China from 2009 to 2018 based on a decoupling model and spatial analysis methods, and we reached the findings as follows. (1) Most provinces in China are still in the stage of continuous growth of construction waste emissions, and about 30% have reached the peak (inverted U-shaped), prominently characterized by inter-provincial spatial heterogeneity and agglomeration. (2) The decoupling types between inter-provincial construction waste and construction economic growth in China are dominated by weak decoupling, expansive coupling, and recessive decoupling, and they are changing in general with positive signs but in a more diversified and complex trend. (3) Based on the analysis results, this paper classifies China into three types of policy zones, namely transformation, adjustment, and stabilization, and proposes differentiated and targeted recommendations to provide an important decision basis for the design of construction waste management policies in China and similar countries and to help achieve a “zero waste society” in early global development.

1. Introduction

1.1. Background

As a major obstacle in promoting a “Zero Waste World” and ecological civilization, the issue of construction waste management and its recycling has become a key area of concern for governments, scholars, and the public [1,2]. With the rapid pace of urbanization and industrialization, the production of construction waste is also growing at a high rate and has become a major environmental problem that restricts the sustainable development of cities and villages around the world, making the implementation of targeted and appropriate policies and actions for construction waste management an urgent need [3,4].
According to What a Waste 2.0 released by the World Bank in 2018, China is the country with the largest emission of construction and democracy waste in the world, and the United States ranks second. China is nearly three times that of the United States, which is more than the sum of the countries ranked second to sixth. According to the 2018 Annual Development Report of Construction Waste Disposal Industry, China has a large stock of construction waste with fast growth, and its treatment methods are mostly extensive and backward, resulting in the overall recovery of construction waste less than 10% (the proportion of the amount of reused construction waste to the total of construction waste). Construction waste can be turned into something of value after being cleaned, sorted, and reprocessed. For example, metallic materials such as steel, copper, and iron can be reused directly or by melting down, used bricks and tiles can be reprocessed to produce reclaimed bricks and concrete, and waste wood can be treated as raw materials for papermaking. The stacking and disposal of construction waste occupies land, wastes resources, and brings environmental pollution. About 2/3 of Chinese cities face the dilemma of “garbage siege” [5,6].
The construction waste in China has been a major challenge, limiting its sustainable economic development as well as its ecological and environmental management performance due to its rapid growth and large scale. In addition, China is similar to the rest of the world in terms of the change and disposal of construction waste. Therefore, an empirical study of the Chinese case will help reveal the global construction waste change and provide a basis for the development of construction waste management policies in countries around the world. In summary, China is typical and representative globally. It is of great theoretical value and practical significance to analyze the trends of construction waste in China in time and space dimensions, identify the connection between construction waste changes and construction economy growth and its evolutionary characteristics, providing a basis for decision making in construction waste management [7].

1.2. Literature Review

1.2.1. Construction Waste Management

With the acceleration of urbanization and industrialization, the production, treatment, and emissions of construction waste are growing rapidly, and promoting and realizing the reduction and resourceization of construction waste has become a major challenge for governments at all levels and an emerging research topic in environmental science, economics, and architecture [8]. To acquire the data on the current production and emissions of construction waste is the first step to implement effective management; however, the lack of official statistics has induced a considerable amount of literature to place the focus on quantitative estimation studies [9]. Estimation of construction waste generation includes construction waste generated from design [10], construction [11], demolition [12,13], and the full life cycle [14] in terms of stages, including construction waste generated from residential buildings [15,16], non-residential buildings [17], and underground buildings [18] in terms of type, and including construction waste generated from different materials including concrete and drywall waste streams [19,20] in terms of materials. Li [21] developed the construction waste estimation system for construction projects, and Bakchan [22] developed the automatic quantification and management system for construction waste. The differences in calculation methods, spatial scales, and data calibers lead to significantly different construction waste estimation results, so it is necessary to use publicly available and widely accepted estimation data when conducting the study and compare the analysis results with existing papers to discover conclusions with higher credibility and precision through corroboration and discussion.
As for research methodology, most papers are based on traditional analytical approaches, including exploratory factor analysis and hierarchical analysis [23], structural equations [24,25], least squares [26], life cycle [27,28], system dynamics [29,30], Bayesian networks [31], long-term and short-term memory networks [32], deep convolutional neural networks [33], behavioral extension theory [34], fuzzy set theory [35,36], and enterprise survey methods [37]. Research on the application of new technologies and methods has been increasing in recent years, including big data [38,39], machine learning [40,41], BIM technology [42], and intelligent agent technology [43]. These methods are applied to the estimation of construction waste generation and emissions, analysis of influencing factors, and evaluation of management performance; however, they are too complex, weak in direct correlation with policies, difficult in practical application of construction waste management, and insufficiently supportive of policy design for sustainable development of the construction industry.
As for research scales, most of the papers focus on the studies of countries, including UAE [44], Saudi Arabia [45], Canada [46], Thailand [47,48], Spain [49], Turkey [50], Brazil [51,52], and Malaysia [53,54]. Some papers also bring attention to the studies of cities, such as Hong Kong [55,56] and Shenzhen [57,58,59]. The changing patterns of construction waste and its management strategies at different spatial scales exhibit significant differences and achieving efficient management of construction waste requires not only the top-level design of the central government but also the improvement of the pertinence and appropriateness of local policies. The existing papers mainly focus on macro-scale (national), while empirical studies at the meso-micro-scale, such as provinces and cities, are very insufficient, thus limiting the application of relevant findings in construction waste management practices [60].

1.2.2. Decoupling Model Application

Decoupling models are widely used to analyze the decoupling between economic growth and resource use [61,62], energy consumption [63,64], greenhouse gas emissions [65], and land use [66,67]. The study of waste management performance and environmental policy effectiveness based on decoupling models has become an emerging research field in recent years. For example, Chen [68] assessed the sustainability of municipal solid waste management in China based on the decoupling model, and Pu [69] further analyzed the drivers of changes in the decoupling between solid waste production and economic growth. Wang [70] analyzed the decoupling state of municipal solid waste production and economic development in China using Tapio and EKC models. Ichinose [71] analyzed the connection between municipal solid waste production and income using the decoupling model and concluded that JPY 3.7 million was a significant turning point. Swart [72] tested whether waste recycling meets the EKC model and analyzed the management alternatives of waste recycling and decoupling under an economy of scale. Tsiamis [73] argued that municipal solid waste production rates increase with personal consumption expenditures and that the increased use of plastics is a significant contributing factor to the decoupling. Jaligot [74] analyzed the decoupling between municipal solid waste production and economic growth by testing the effects of income, urbanization, and policy implementation factors on waste in the canton of Vaud, Switzerland, based on the EKC hypothesis. Wu [75] discussed the decoupling between industrial emissions and industrial value added and its influencing factors using the Tapio decoupling model, social network analysis method, and logit model, and found a strong decoupling between sulfur dioxide, nitrogen oxides, soot, and industrial value added in most provinces. Sjostrom [76] conducted a case study of the decoupling between solid waste production and economic growth in Sweden and compared the waste intensity outcomes in a “Decoupling scenario” and a “Baseline scenario” of the Swedish economy 2006–2030 to illustrate the strength of the policy measures needed to attain this target. Madden [77] argued that municipal waste production and average income in New South Wales are in a relative rather than absolute decoupling state. Madden further pointed out that there are regional differences in the decoupling of waste production from income in Australia and that geographical characteristics and changes in provincial characteristics must be taken into account in decoupling analysis and policy development.
In general, the on-hand papers have tested simultaneous changes between waste production (emissions) and economic growth with a focus on municipal solid waste, domestic waste, and recycling waste using the decoupling model, thus providing an important basis for decision making for national, regional, and urban policies. However, they have paid little attention to construction waste, and no paper has yet analyzed the decoupling between construction waste change and economic growth and its evolutionary trends [78]. Therefore, it is of great theoretical significance and practical value to study the decoupling state between construction waste change and economic growth to reveal the evolutionary law and development trend of the relationship between the two using the decoupling model and provide a basis for decision making on construction waste management and sustainable economic development, in the context of building “waste-free cities” and “waste-free societies”.

1.3. Aim and Question

Construction waste emissions are huge in China, and they are still in continuous growth, which has become a complex environmental problem that the government must face and solve. Besides, there are huge differences between regions in China, with significant variation in the scale, intensity, changing trends, influencing factors, pressure to reduce emissions, and policies of construction waste emissions between provinces. The Chinese central and local governments have introduced a series of construction waste management policies in recent years, but their implementation has not achieved the desired result due to many factors such as policy precision, game of interest subjects, and the executive power of the actor, so there is an urgent need to find a new set of tools that can provide a basis for the design and dynamic adjustment of construction waste management policies [79]. To this end, we conduct the empirical study in this paper on 31 Chinese provinces during 2009–2018 using the decoupling model and GIS spatial analysis methods. This paper focuses on the following issues: (1) What are the regular changes in provincial construction waste in China in time and space dimensions? (2) What is the type of decoupling between the change in construction waste and the growth of construction economy (gross output value, value added, profit) in provinces of China? (3) What are the trends in the evolution of the decoupling between changes in construction waste and economic growth in provinces of China, and how to cope with them in policy design? This paper attempts to analyze the spatial and temporal evolution of the connection between changes in construction waste and economic benefits in China by examining the above issues, providing a basis for the government to scientifically formulate and dynamically adjust construction waste management policies, thus making the policies more effective and practical [80].

2. Materials and Methods

2.1. Study Area: China

The study area of this paper is mainland China, covering 31 provinces, autonomous regions, and municipalities directly under the central government, but excluding Taiwan, Hong Kong, and Macao (Figure 1) with consideration of data accessibility, completeness, and comparability, as well as the difficulty of data acquisition due to the fact that the statistical calibers are different between Hong Kong, Macau, Taiwan, and mainland China. According to the trend of the construction waste change 2009–2018 in China, it is divided into two periods of rapid growth and steady development, with the former having an average annual growth up to 18%, while that of the latter decreasing to about 2.54% (Figure 2).
The Chinese government has long attached importance to construction waste management and has promulgated a series of construction waste management policies. From the perspective of the central government policy, the implementation of the Regulations on the Management of Urban Construction Waste in 2005 marked the independence of the construction waste from the municipal solid waste and the development of circular economy in management. The Technical Specification for Construction Waste Disposal, brought into force in 2009, standardizes the planning, design, and management of construction waste collection, transportation, transfer, utilization, backfill, and landfill at the national level. The Ministry of Housing and Urban-Rural Development issued a Notice on the Pilot Work of Construction Waste Management in 2018 to carry out pilot work of construction waste management in 35 cities, including Beijing, Shanghai, Guangzhou, Shenzhen, Chongqing, Nanning, and Yangzhou.
To strengthen the whole process management of construction waste and improve the quality of urban development, the Ministry of Housing and Urban-Rural Development issued the Guiding Opinions on Promoting the Reduction of Construction Waste, the Guiding Manual on the Reduction of Construction Waste on Construction Sites, and the Notice on Carrying out Special Remediation Actions of Construction Waste. In the same period, Beijing, Guangzhou, Shanghai, Xi’an, as well as provinces and autonomous regions such as Jiangsu, Henan, Qinghai, Guangxi, Shandong, and Gansu also developed local laws and regulations for construction waste disposal. These policies have pointed out the direction for the transformation and development of the construction industry in China from high waste to low waste and zero waste and have also laid the foundation for China to build a zero-waste society and a “zero-waste city”.

2.2. Research Methods: Decoupling Model

There are two methods on decoupling model calculation at present, that is, OECD [81] and Tapio [82]. Tapio decoupling index calculation method is adopted in this paper. Designed with an elastic coefficient, this method addresses the shortcomings of the OECD model in terms of uncertainty in the analysis results and poor guidance for practical application [83,84]. Decoupling refers to the breakdown of the synergistic relationship between economic growth and environmental change. This paper analyzes the connection between construction waste change and construction economic growth based on the decoupling model, to determine whether there is a correlation between the two with synchronous or asynchronous changes. With Z as the decoupling index, Δ x as the average annual growth of construction waste in provinces of China, C W i and C W i + n as the values of construction waste emissions in years i and i + n , Δ y as the average annual growth of economic indicators of the construction industry (including gross output value and profit of construction industry), C I i and C I i + n as the annual values of economic output indicators in years i and i + n , and n as the study time period, the decoupling index between the change in construction waste and the economic growth of the construction industry is calculated as:
z = Δ x Δ y
Δ x = C W i + n C W i n
Δ y = C I i + n C I i n
The concept of “decoupling” emphasizes the long-term trending process. Based on the relevant research experience [85,86] and the length of the time series of the research data in this paper, n = 5 in this paper, and the research period is divided into two time periods of 2009–2014 and 2015–2018. Based on the positive and negative results of Δ x and Δ y , the decoupling is divided into 3 types and 8 sub-types with 0.8 and 1.2 as the classification thresholds for z (Table 1) [87,88]. The introduction of 8 sub-types for analysis is suitable for local policy design for it guarantees a high degree of judgment accuracy and data sensitivity, which helps to enrich the detailed policy content; the introduction of 3 types for analysis is suitable for national policy design as it offers a low degree of judgment accuracy and data sensitivity, which helps to improve the inclusiveness of policy content. The comparative analysis of the 3 types and 8 sub-types of decoupling in Section 3.2 and Section 3.3 leads to both rigidity and flexibility in policy design and leads to an overall increase in policy universality and flexibility. It should be noted that decoupling is a prerequisite for low and zero-waste development, and negative decoupling indicates that the construction industry is still in a high-waste development stage.

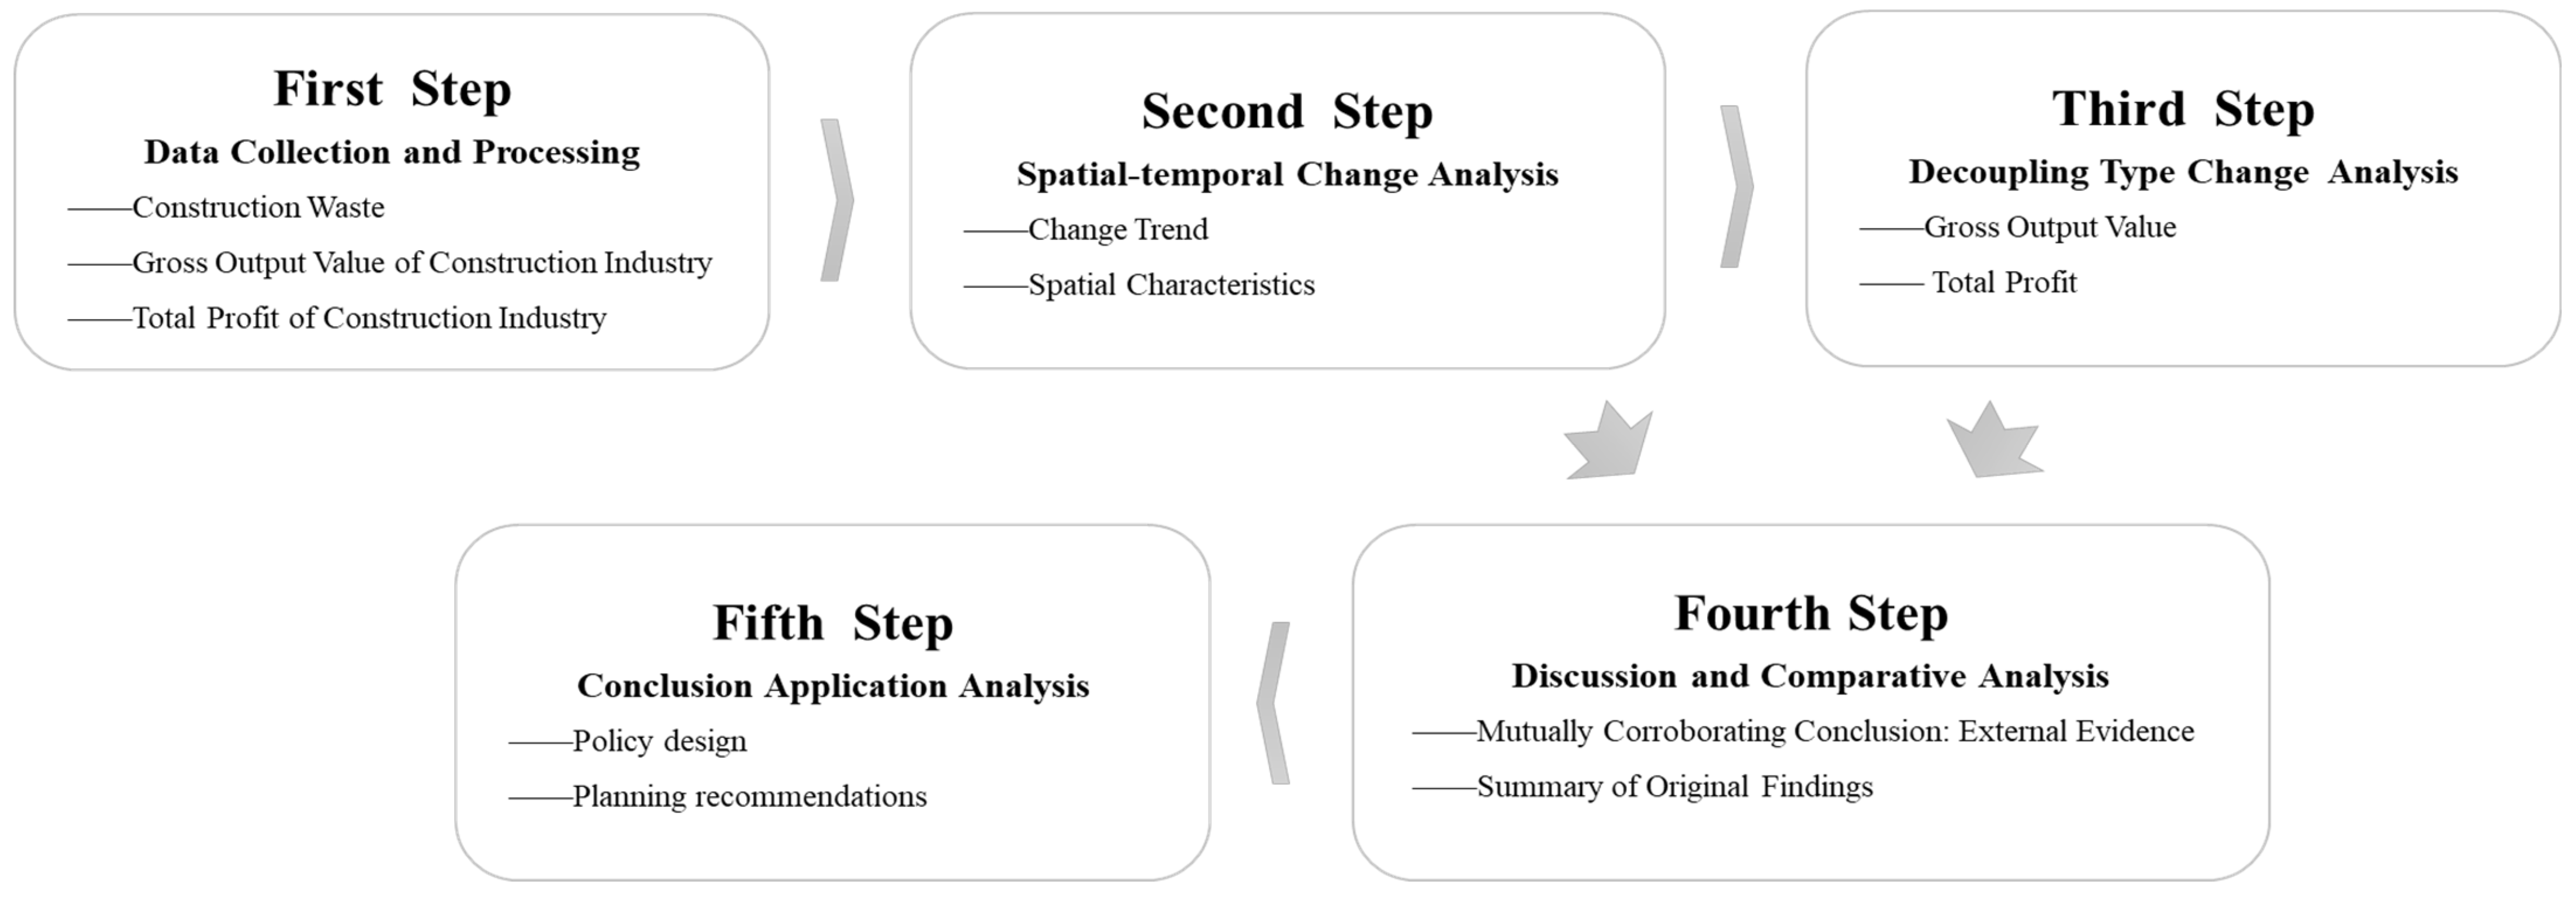
2.3. Research Steps and Data Sources

This study is performed in five steps (Figure 3). The first step is raw data collection and processing. It involves the compilation of data for the study area 2009–2018, including construction waste, gross output value of construction industry, and total profit of construction industry. The second step is the analysis of spatial and temporal changes. Firstly, the current characteristics and changing trends of construction waste emissions in 31 provinces are presented from the time dimension. Secondly, the spatial pattern and evolution characteristics of inter-provincial construction waste emissions are studied based on the cluster analysis method of GIS. The third step is decoupling analysis, to analyze the connection between construction waste change and construction economic growth based on the perspectives of gross output value and total profit. The fourth step is discussion and reflection. A comparative analysis of the main findings reached in the analysis of the results is conducted to reflect on and summarize the innovation and shortcomings in this paper. The fifth step is the application of conclusions. Based on the trends and problems of construction waste emissions in provinces of China, further differentiated response strategies are proposed to provide a reference for the government to carry out construction waste management and industry governance policy design for decision making.
Construction waste is the waste generated by undertaking and construction organizations in building, rebuilding, expanding and dismantling structures, buildings and pipe networks, as well as residents in housing decoration and renovation, such as waste soil and scrap. It should be noted that construction waste generation and emission are completely different concepts in this paper, and the focus in this study is placed on the latter. The construction waste generation represents the overall waste created during building construction, remodeling, demolition, and renovation, including materials such as steel, plastic, masonry, glass, and earth. The construction waste emission represents the remaining portion of construction waste produced after being recycled and reused, excluding the amount sent for disposal or discharged into the environment. Construction waste emission includes building construction waste, demolition waste, and renovation waste. It is a component of construction waste generation, that is, the emission is always less than production. After being treated by some industrial, physical and chemical, and biochemical processes, much construction waste can be reused as recycled resources, for example, steel and plastic can be used to reproduce building materials and used bricks and stones can be pulverized and processed into concrete, wall panels, and floor tiles. With the implementation of the concept of green development and sustainable development, the increasing attention and importance of the government and society to the management of construction waste will certainly bring about the expansion of the scale of reuse of construction waste, which will lead to a gradual decline in construction waste emissions or even to zero.
Gross output value of the construction industry represents the total output of the construction industry, and it is a critical indicator to comprehensively reflect the development scale of construction industry. Total profit of the construction industry represents the financial status of production and operation activities of construction enterprises, and it is a critical indicator to reflect the business performance of enterprises. The two indicators, both represented by monetary value and derived from the China Statistical Yearbook on Construction, are commonly used in the policy design of national and local governments. Since prices vary somewhat across regions and time, we base our study on present value change data of the two indicators, mainly for the following reasons: first, the Chinese government conducts assessments and makes policies more on the basis of present value rather than constant value; second, this paper is based on change rates rather than scale volume, leading to negligible impact of prices on the analysis of this paper.
There are no official statistics on construction waste emissions in China, and the data in this article come from a public report published by Zhenbang Environmental Protection Technology Co., Ltd. The data are estimates, mainly based on the official figures released by the China Statistical Yearbook, China Statistical Yearbook on Construction, and Annual Development Report of China Building Energy Efficiency, as well as studies by relevant scholars. Construction waste emissions are equal to the sum of the amount of waste discharged during the work of building construction, demolition, and renovation. The amount of waste discharged from building construction is equal to the annual completed construction area multiplied by the emission factor of construction waste per unit area in the construction process, the amount of waste discharged from building demolition is equal to the demolition area multiplied by the emission factor of construction waste per unit area in the demolition process, and the amount of waste discharged from building renovation is equal to the renovation area multiplied by the emission factor of construction waste per unit area in the renovation process. The completed construction area of each province comes from the China Statistical Yearbook on Construction, which is an official authoritative book to provide an overall picture of the development of China’s construction industry. It is issued by China’s National Bureau of Statistics on a regular basis with a high reliability. Building demolition and renovation areas are estimated based on a certain proportion of the completed area, and the proportion coefficients are derived from the Annual Development Report of China Building Energy Efficiency and the study of Wang [89]. The waste emission factors in different processes are consistent with the studies of Li [90] and Xiang [91]. The data of China’s construction economic efficiency indicators are mainly from China Statistical Yearbook and China Statistical Yearbook on Construction, with some missing data from the statistical yearbooks and statistical bulletins of provinces and cities. The standardized and normalized data are shown in Table A3 and Table A4 in Appendix A, based on the outlier standardization method.

3. Results

3.1. Spatial-Temporal Change Analysis
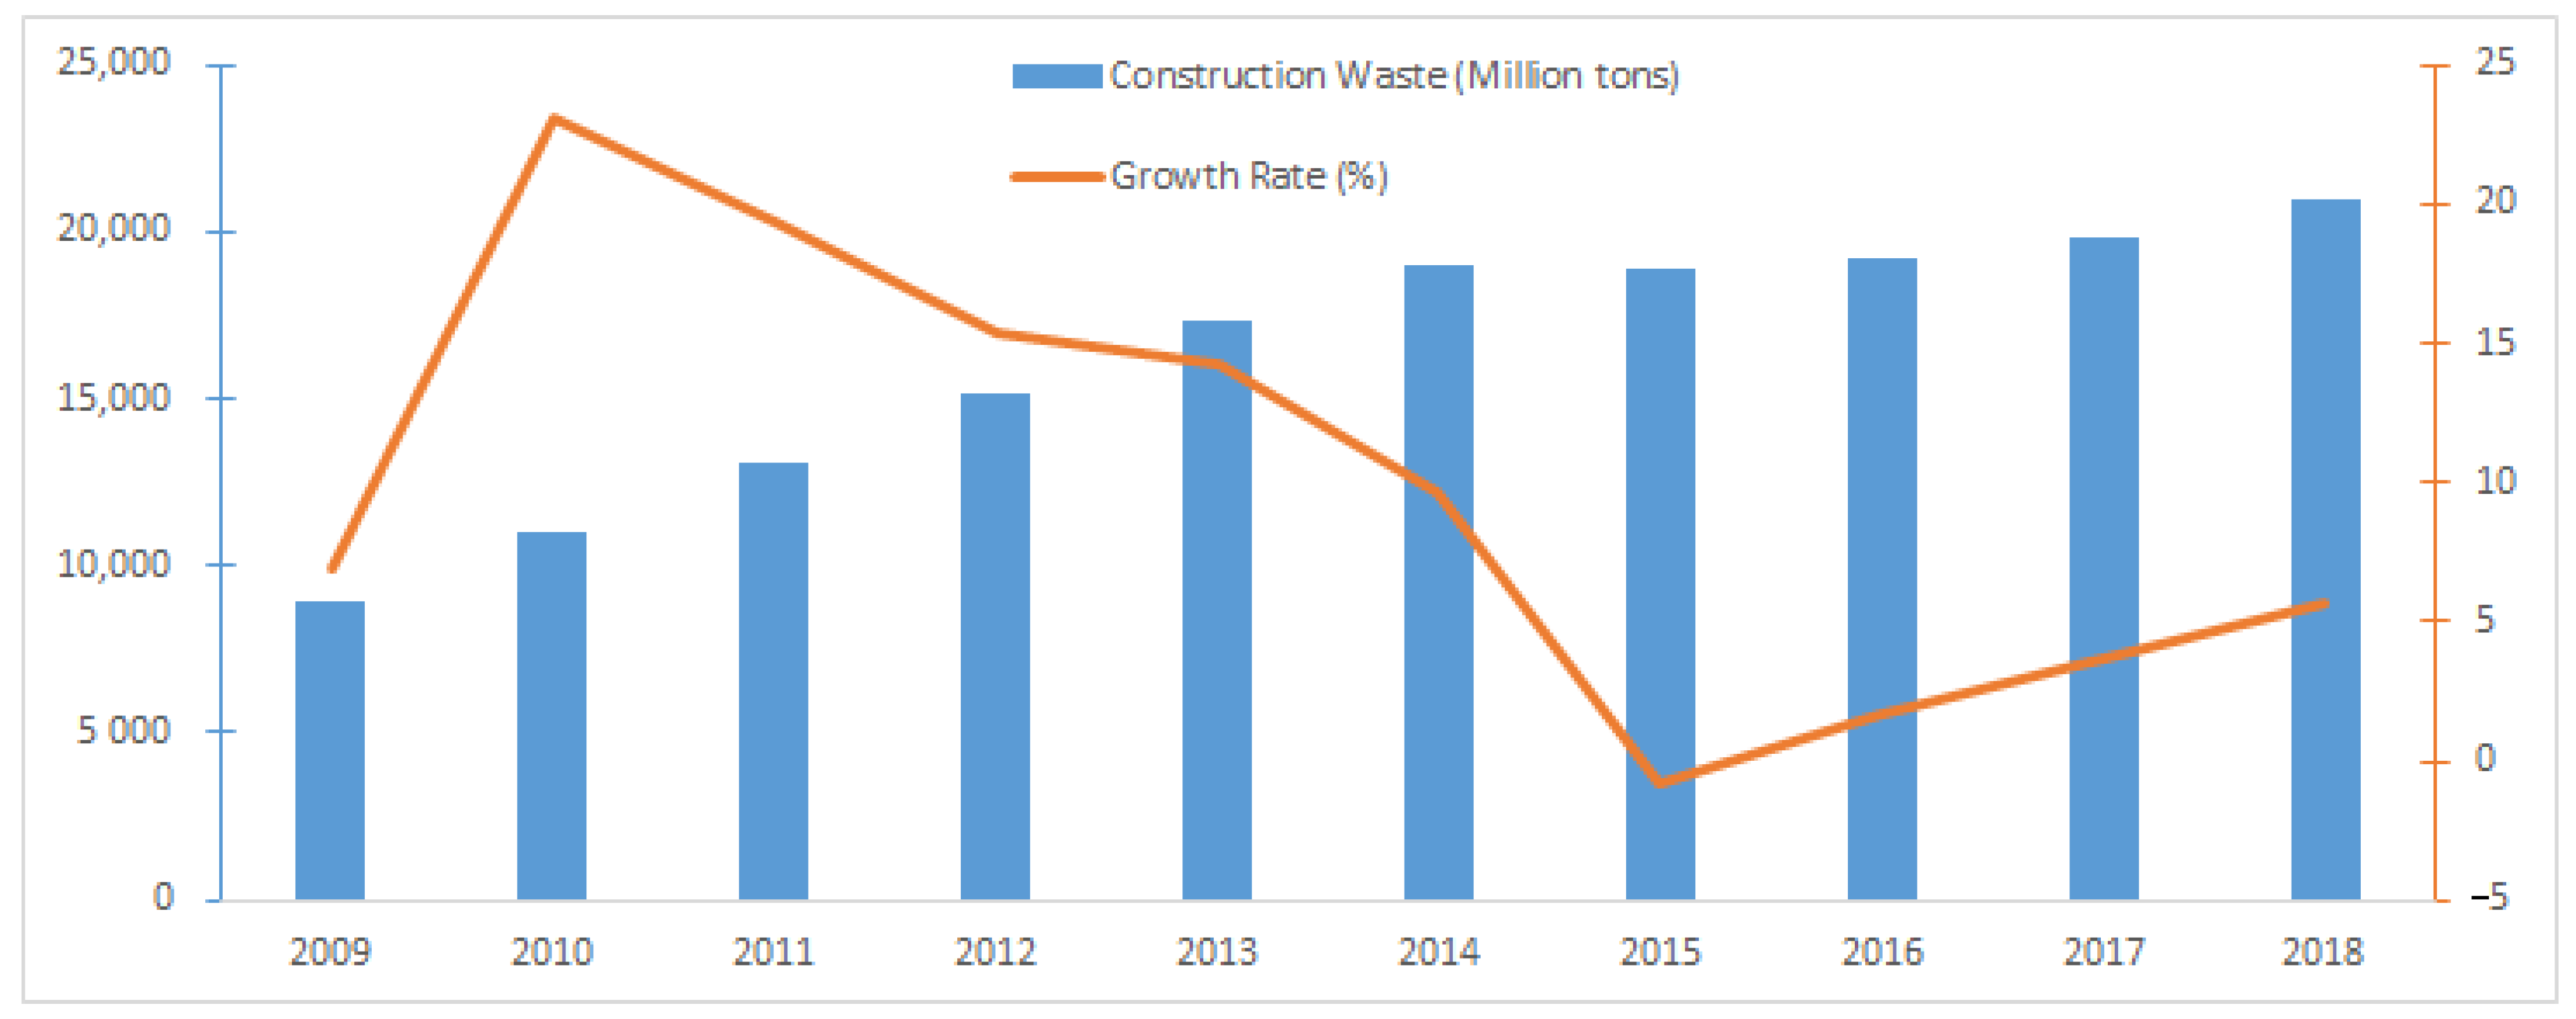
3.1.1. Change Trend

The construction waste emissions of most provinces in China are in a “J-shaped” growth state, while the provinces in northeast and northwest regions are in an “inverted U-shaped” state, reaching the peak in construction waste emissions (Figure 4). From 2009 to 2018, construction waste emissions in more than 60% of the regions, including Beijing, Shanghai, Jiangsu, Zhejiang, Anhui, Fujian, Shandong, Hubei, Guangdong, Sichuan, and Shaanxi, were in a “J-shaped” growth state, and they were concentrated in the eastern and central parts of China, while 38.71% of the regions were in an “inverted U-shaped” state, mainly distributed in northeast and northwest China, where the decrease in construction waste emissions was mainly the result of urbanization and industrialization slowdown. Construction waste emissions in Hebei, Hainan, and Qinghai are likely to change from an “inverted U-shaped” to an “N-shaped” state, with their construction waste emissions increasing and then decreasing for most of the study period but increasing again in 2015 or 2018. Inter-provincial construction waste emission changes in China are becoming increasingly diversified, and more provinces are moving into the development stage of construction waste reduction. Only construction waste in Tibet was reduced in 2009–2013, while the scope was expanded to 10 cities and provinces, namely Tianjin, Hebei, Inner Mongolia, Liaoning, Jilin, Heilongjiang, Gansu, Qinghai, Ningxia, and Xinjiang in 2014–2018. Only Inner Mongolia, Liaoning, and Heilongjiang achieved the development of construction waste reduction in 2009–2018, indicating that the construction waste management in China remains a daunting task.

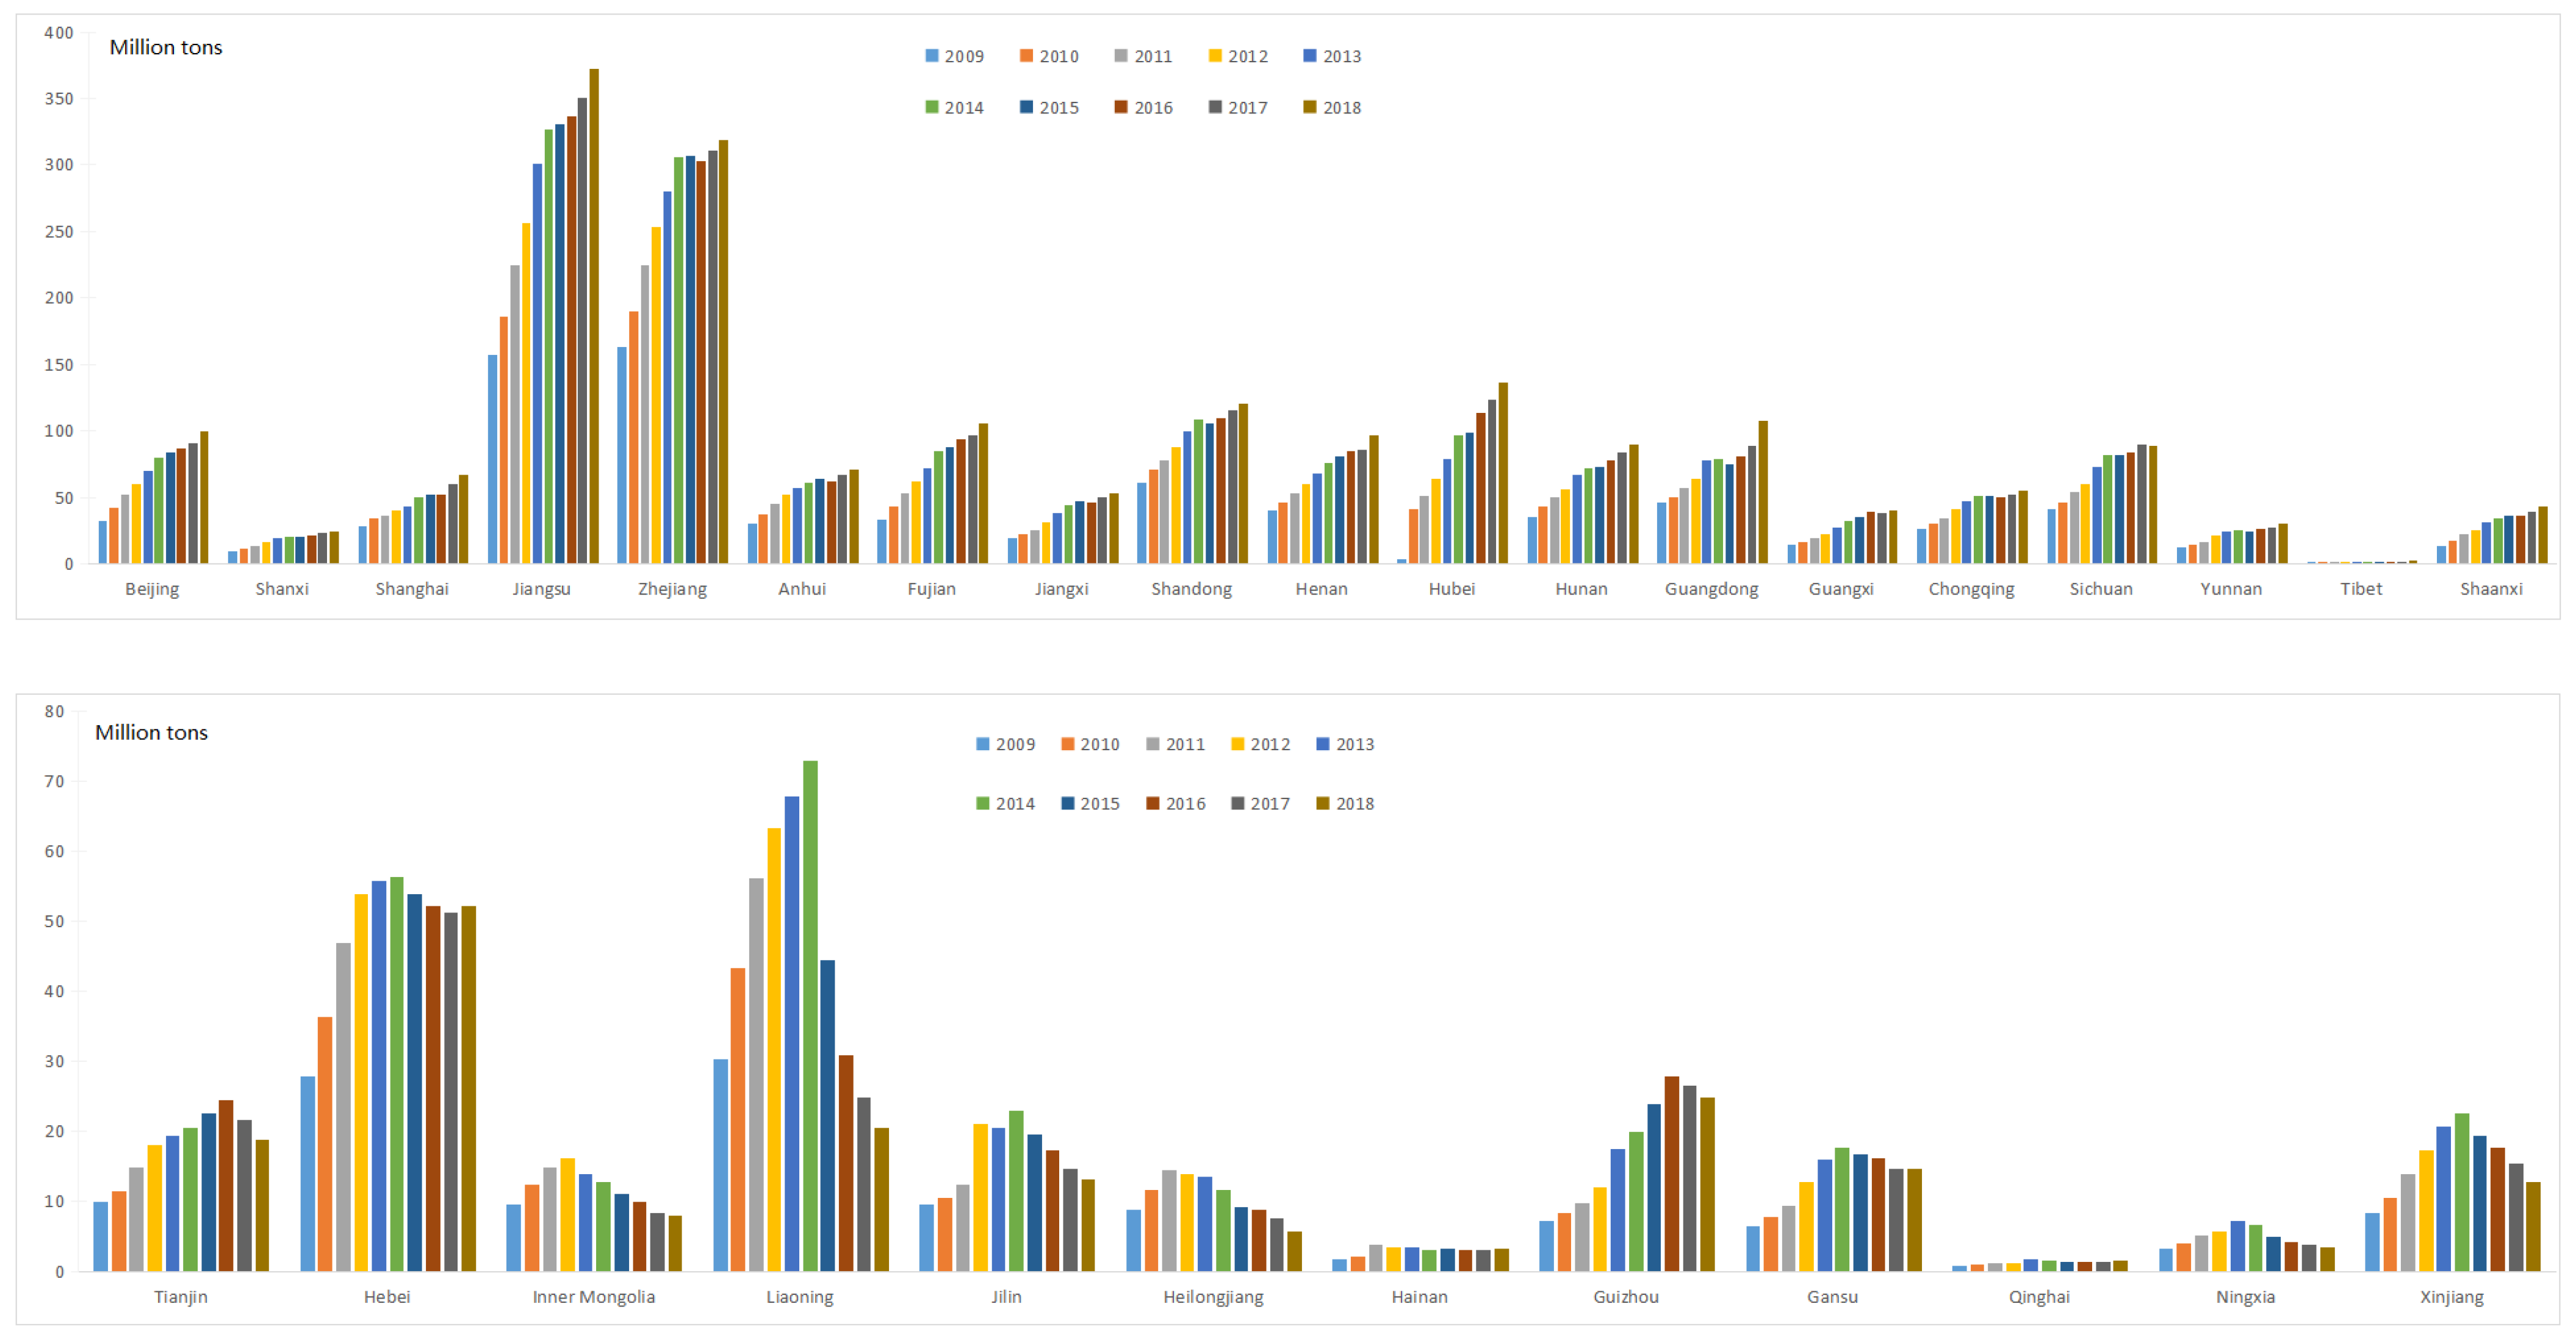
3.1.2. Spatial Characteristics

Construction waste emissions have been varying widely among different provinces in China, with significant spatial heterogeneity and agglomeration. The provinces with the largest and smallest construction waste emissions in 2009 and 2018 were Jiangsu and Tibet, respectively, and the extremes ratio (maximum value of Jiangsu/minimum value of Tibet) was expanded from 337.70 to 485.10. According to Guan [92], Zhao [93,94], and Miyamoto [95], the variables are highly discrete and unbalanced when the coefficient of variation is greater than 0.36. The inter-provincial coefficient of variation of construction waste emissions in 2009–2018 remained above 1.2 for a long time, indicating very serious spatial heterogeneity and inequality. Based on the spatial clustering analysis carried out by the natural break method of ARCGIS, the construction waste emissions were classified into three types of high clustering, medium clustering, and low clustering. Jiangsu and Zhejiang are provinces of high clustering and remain stable in the Yangtze River Delta region. Beijing, Shandong, Shanghai, Fujian, Guangdong, Hunan, Anhui, Henan, and Sichuan are regions of medium clustering, and they are concentrated and distributed in coastal areas. The spatial scope of the medium clustering was increasingly contracting from 2009 to 2018, especially in north China. The provinces of the low clustering are the most numerous, and they are clustered in northwest, northeast, and southwest regions for a long time (Figure 5).

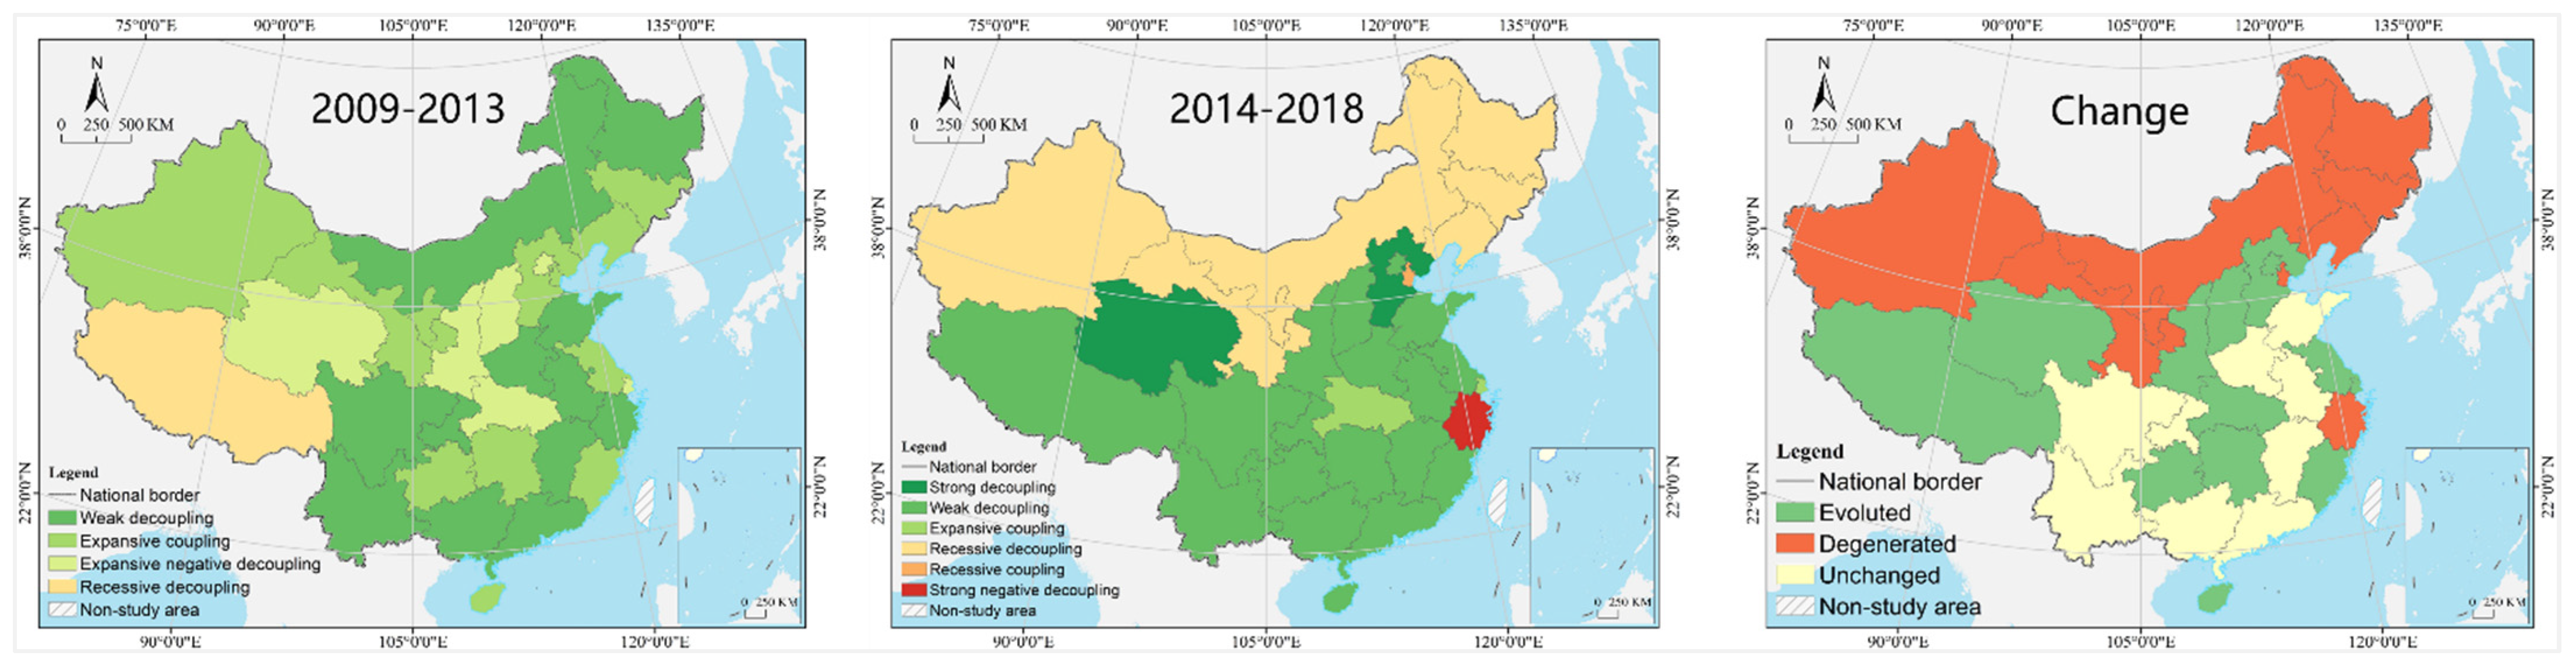
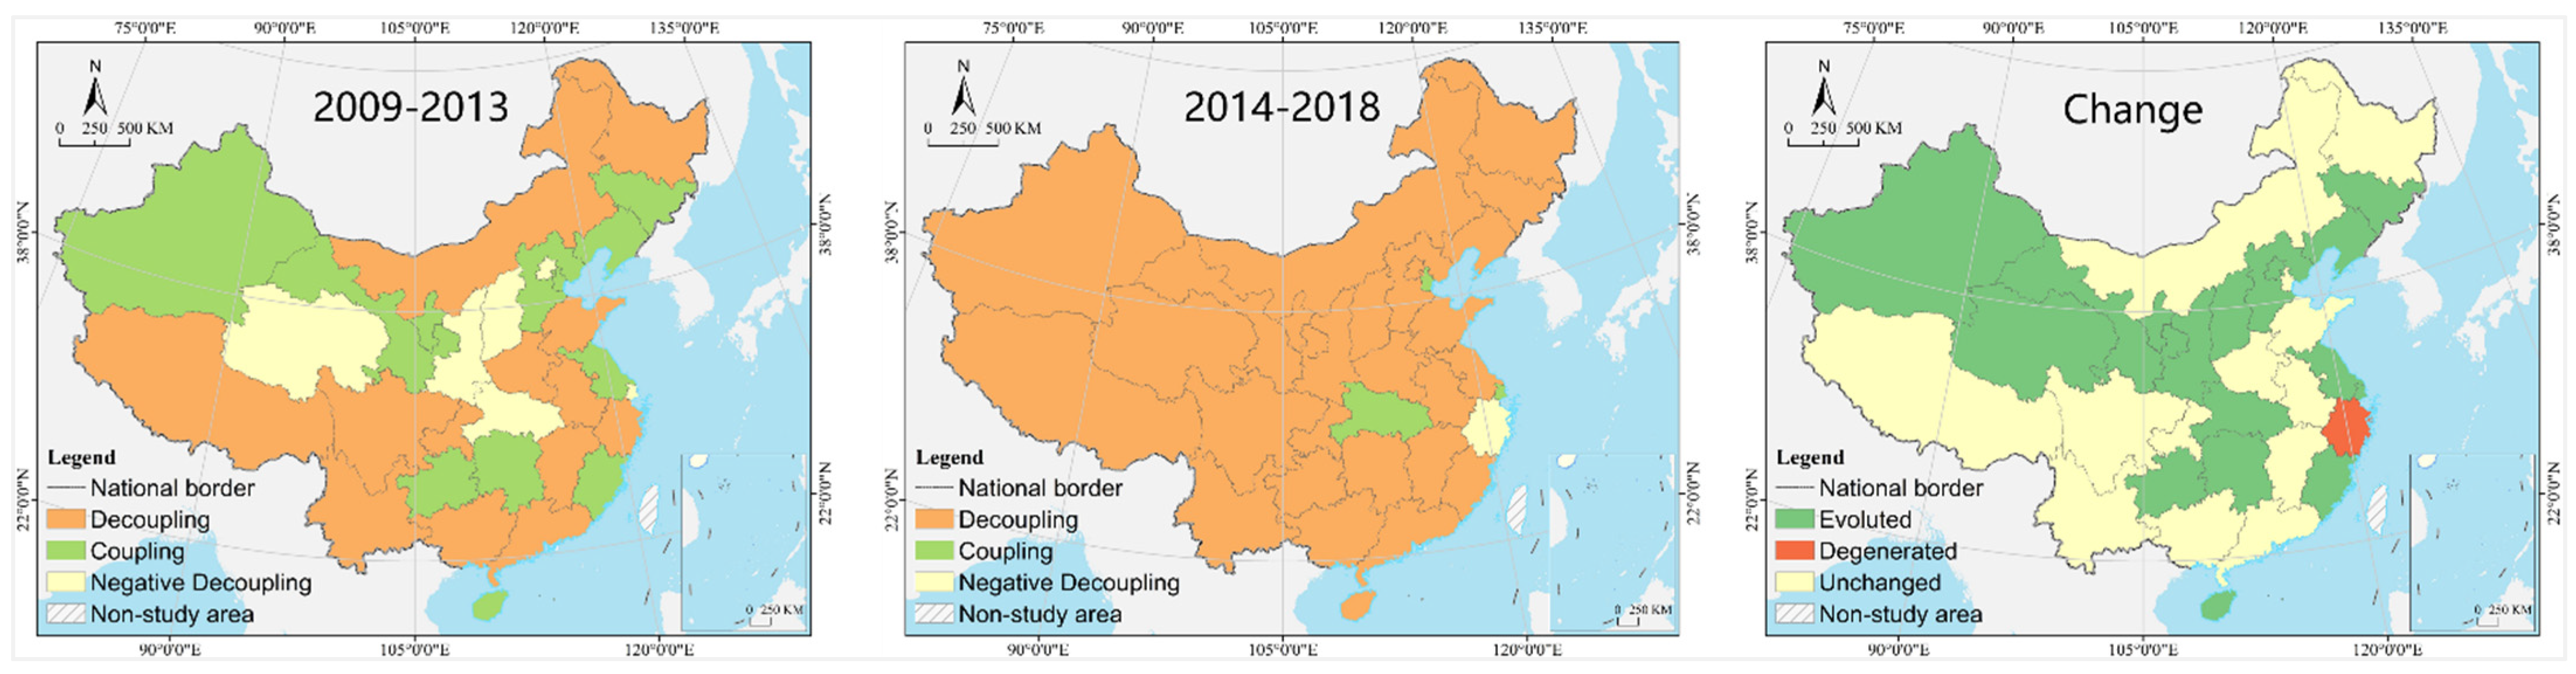
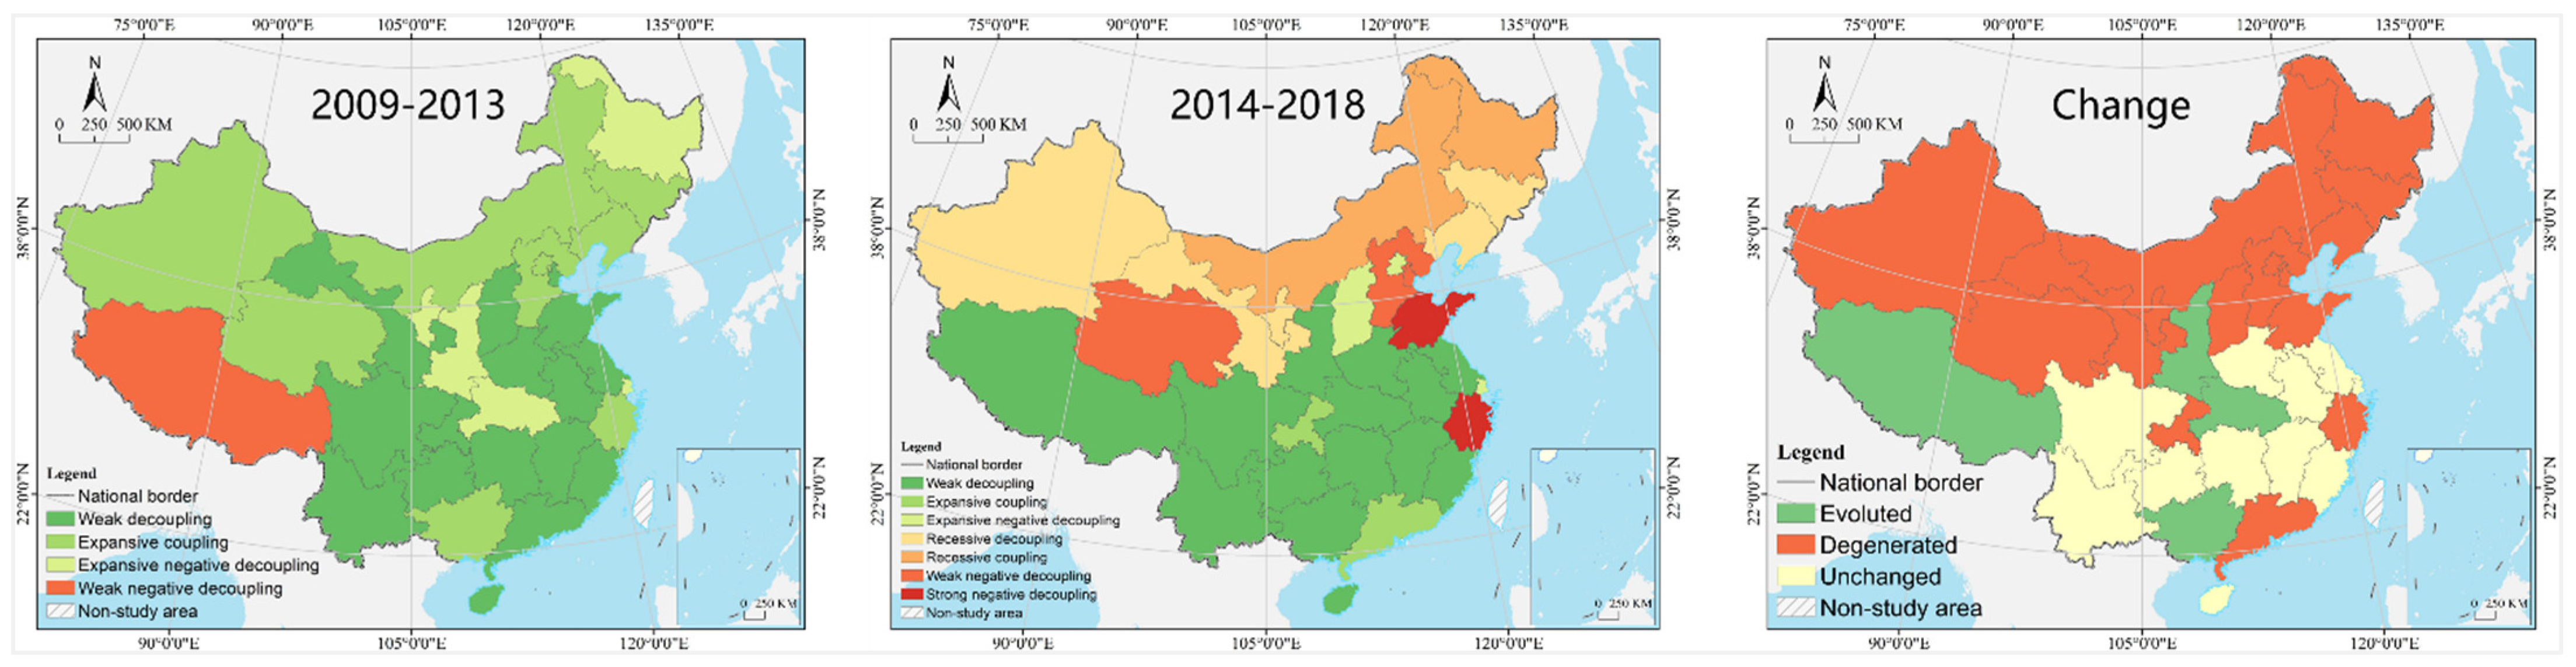
3.2. Decoupling Type Change of Gross Output Value

3.2.1. Eight Type

In 2009–2013, there was no strong decoupling, recessive coupling, weak negative decoupling, or strong negative decoupling, and recessive decoupling was found in Tibet only. The provinces in weak decoupling and expansive coupling states were the same and they were the most numerous, with a combined percentage of 77.42%. Inner Mongolia, Heilongjiang, Zhejiang, Anhui, Jiangxi, Shandong, and Henan were in the weak decoupling state, mainly distributed in the Pearl River Delta and the northern, central, and southwestern regions. Tianjin, Hebei, Liaoning, Jilin, Fujian, Jiangsu, Hunan, Guizhou, Gansu, Xinjiang, Ningxia, and Hainan were in the expansive coupling state, mainly distributed in northwest China and Bohai Rim region. Beijing, Shanxi, Shanghai, Hubei, Shaanxi, and Qinghai were in the expansive negative decoupling state, accounting for about 20% (Figure 6).
From 2014 to 2018, there were no provinces in the expansive negative decoupling or weak negative decoupling state, and 58.06% of the provinces were in the weak decoupling state, covering most areas of China, and concentrated in a contiguous distribution in coastal and southwest regions. Inner Mongolia, Liaoning, Jilin, Heilongjiang, Gansu, Ningxia, and Xinjiang were in the recessive decoupling state, mainly distributed in north China. Hebei and Qinghai evolved into strong decoupling provinces, and they were in the best state. Shanghai and Hubei were in the expansive coupling state, while the state of Tianjin and Zhejiang degenerated to recessive coupling and strong negative decoupling, respectively, making them problematic regions (Figure 6).
From the changes of decoupling types in 2009–2013 and 2014–2018, more than 40% of the geographic regions evolved, including Shanghai, Jiangsu, Fujian, Beijing, Hebei, Shanxi, Shaanxi, Hunan, Hubei, Guizhou, Hainan, Tibet, and Qinghai, mainly clustered in the central and northern China regions. About 30% of the regions degenerated, including Xinjiang, Inner Mongolia, Gansu, Jilin, Heilongjiang, Tianjin, and Zhejiang, clustered in northwest and northeast China. Shandong, Henan, Anhui, Jiangxi, Guangdong, Guangxi, Yunnan, and Sichuan remained unchanged, concentrated in contiguous distribution in central and southwest China (Figure 6).

3.2.2. Three Type

In 2009–2013, about 41.49% of the territory was in the decoupling state, distributed in a band in northeast, southwest, and central China. Xinjiang, Gansu, Ningxia, Liaoning, Hebei, Tianjin, Jiangsu, and Fujian were in the coupling state, and most of them were concentrated in the northwest and Bohai Bay region. Qinghai, Beijing, Shanxi, Shaanxi, Hubei, and Shanghai were in the negative decoupling state, accounting for less than 20% and geographically dispersed. In 2014–2018, the decoupling space expanded significantly, accounting for up to 87.10%. Tianjin, Shanghai, and Hubei were in the coupling state, while Zhejiang was in the negative decoupling state and became a problematic region. From the changes of decoupling types in 2009–2013 and 2014–2018, more than about 55% of the geographic areas evoluted, including Xinjiang, Gansu, Qinghai, Ningxia, Shaanxi, Shanxi, Hebei, Beijing, Jilin, Liaoning, Hubei, Hunan, Guizhou, Jiangsu, Shanghai, Fujian, and Hainan, concentrated and contiguous in zonal distribution. Only Zhejiang degenerated, and 41.94% of the territory remained unchanged (Figure 7).

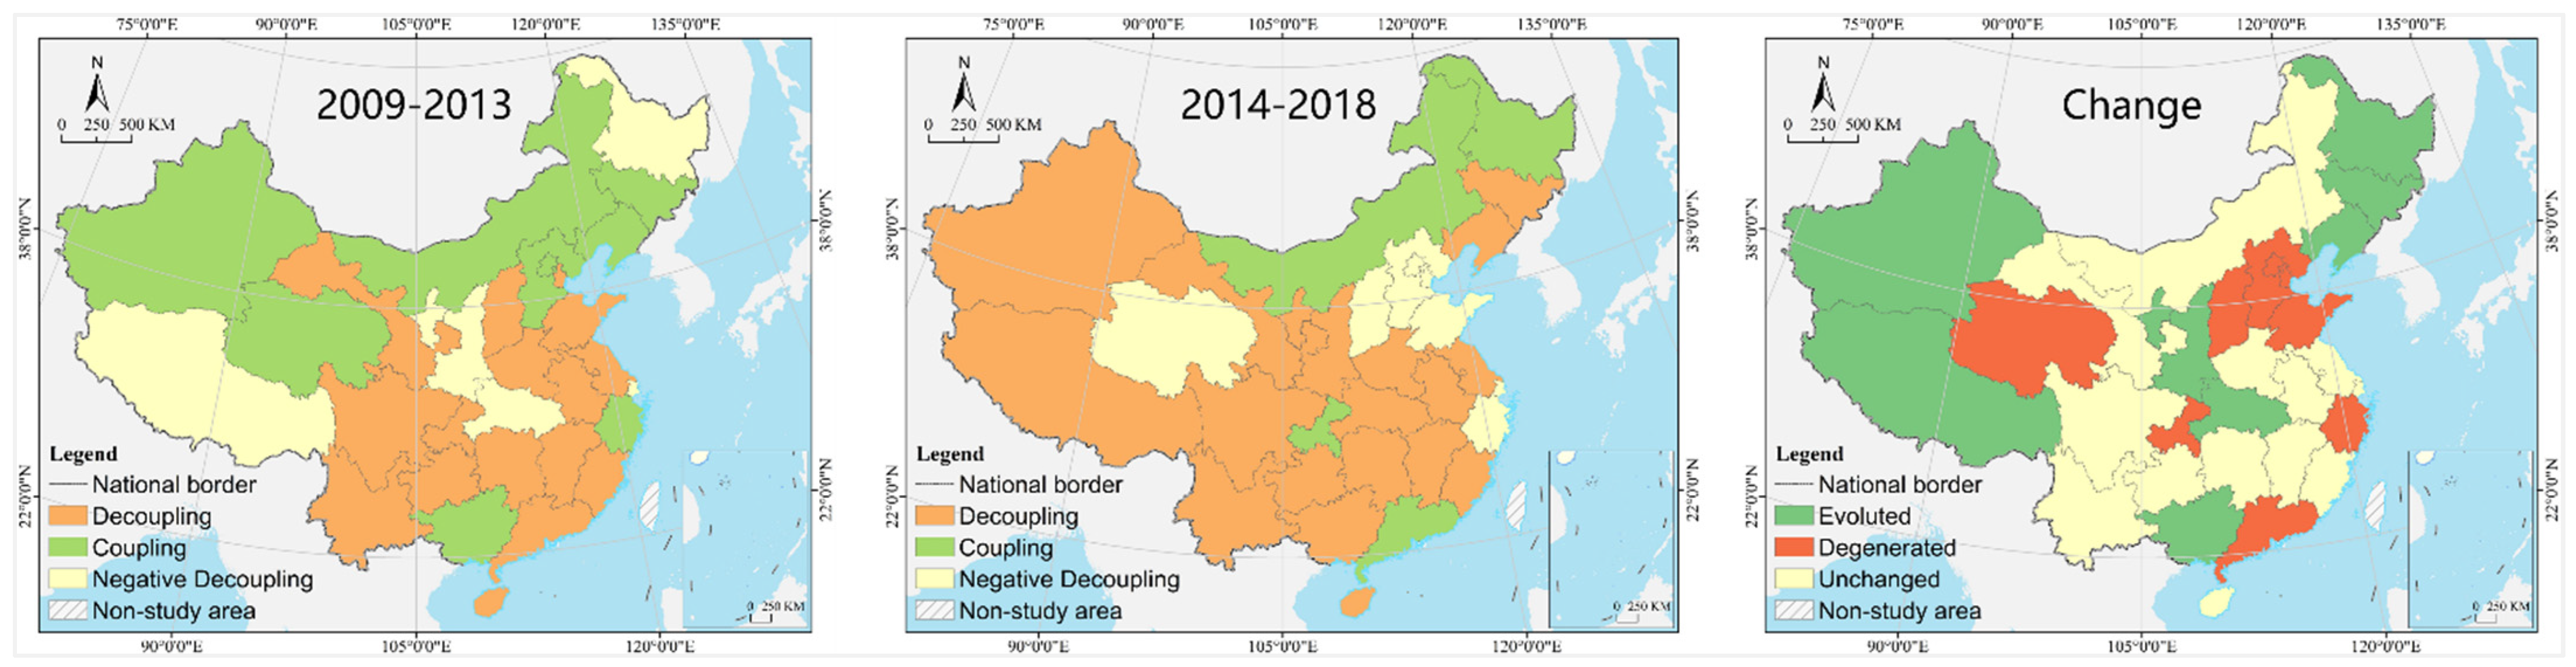
3.3. Decoupling Type Change of Total Profit

3.3.1. Eight Type

In 2009–2013, there was no strong decoupling, recessive coupling, recessive decoupling, or strong negative decoupling, and only Tibet was in the weak negative decoupling state. Weak decoupling had the largest number of provinces, accounting for 58.06%, including Gansu, Sichuan, Chongqing, Yunnan, Guizhou, Hubei, Guangdong, Hainan, Jiangxi, Fujian, Anhui, Henan, Jiangsu, Shandong, Shanxi, and Tianjin, mainly clustered in the Yangtze River Delta, the Pearl River Delta, Chengdu–Chongqing urban agglomeration and the Yunnan–Guizhou plateau. Xinjiang, Qinghai, Inner Mongolia, Jilin, Liaoning, Hebei, Beijing, Zhejiang, and Guangxi were in the expansive coupling state, clustered in north China. Ningxia, Shaanxi, Hubei, and Heilongjiang were in the expansive negative decoupling state, accounting for 16.13% (Figure 8).
In 2014–2018, all decoupling types were found except strong decoupling. Jiangsu, Anhui, Henan, Fujian, Jiangxi, Hainan, Guangxi, Yunnan, Sichuan, and Tibet were in the weak decoupling state, accounting for 45.16% and covering the largest geographical area, while Liaoning, Jilin, Xinjiang, Gansu, and Ningxia were in the recessive decoupling state, mainly distributed in the northwest and northeast regions. The provinces in the remaining five types of decoupling were balanced in number and they were concentrated in north China. Guangdong and Chongqing were in the expansive coupling state; Beijing, Shanghai, and Shanxi were in the expansive negative decoupling state; Inner Mongolia and Heilongjiang were in the recessive coupling state; Tianjin, Hebei, and Qinghai were in the weak negative decoupling state; and Zhejiang and Shandong were in the strong negative decoupling state (Figure 8).
From the changes of decoupling types in 2009–2013 and 2014–2018, only Guangxi, Hubei, Shaanxi, and Qinghai evoluted, and they were geographically dispersed. More than half of the regions degenerated, including Xinjiang, Inner Mongolia, Gansu, Jilin, Heilongjiang, Tianjin, Zhejiang, and Guangdong, concentrated in the northern regions of China. About 35.48% of the territory remained unchanged, mainly in the central and southwestern regions, including Jiangsu, Anhui, Henan, Jiangxi, Fujian, Hunan, Guizhou, Sichuan, Yunnan, and Hainan (Figure 8).

3.3.2. Three Type

In 2009–2013, more than 50% of the regions were in the decoupling state, including Jiangsu, Anhui, Shandong, Henan, Shanxi, Guangdong, Fujian, Jiangxi, Hunan, Guizhou, Chongqing, Sichuan, Gansu, Yunnan, and Hainan, clustered in the Yangtze River Delta, Pearl River Delta, and southwest region. Xinjiang, Qinghai, Gansu, Liaoning, Hebei, Beijing, Jilin, Zhejiang, and Guangxi were in the coupling state, mainly clustered in north and northwest China. Heilongjiang, Ningxia, Shaanxi, Hubei, and Tibet were in the negative decoupling state, and they were geographically dispersed. In 2014–2018, the decoupling space further expanded by up to 61.29%. Inner Mongolia, Heilongjiang, Chongqing, and Guangdong were in the coupling state, and they were small in number and geographically dispersed. Beijing, Tianjin, Hebei, Shandong, Shanxi, Shanghai, Zhejiang, and Qinghai were in the negative decoupling state. They were mostly clustered in the capital ring area and became problematic regions. The change in the type of decoupling in 2009–2013 and 2014–2018 showed that about 30% of the geographic regions evoluted, including Xinjiang, Tibet, Guangxi, Ningxia, Shanxi, Hubei, Heilongjiang, Jilin, and Liaoning. Qinghai, Chongqing, Guangdong, Zhejiang, Shanxi, Hebei, Beijing, Tianjin, and Shandong degenerated, mainly concentrated in the Bohai Rim region. More than 40% of the territory remained unchanged, and the regional distribution showed obvious agglomeration (Figure 9).

4. Discussion

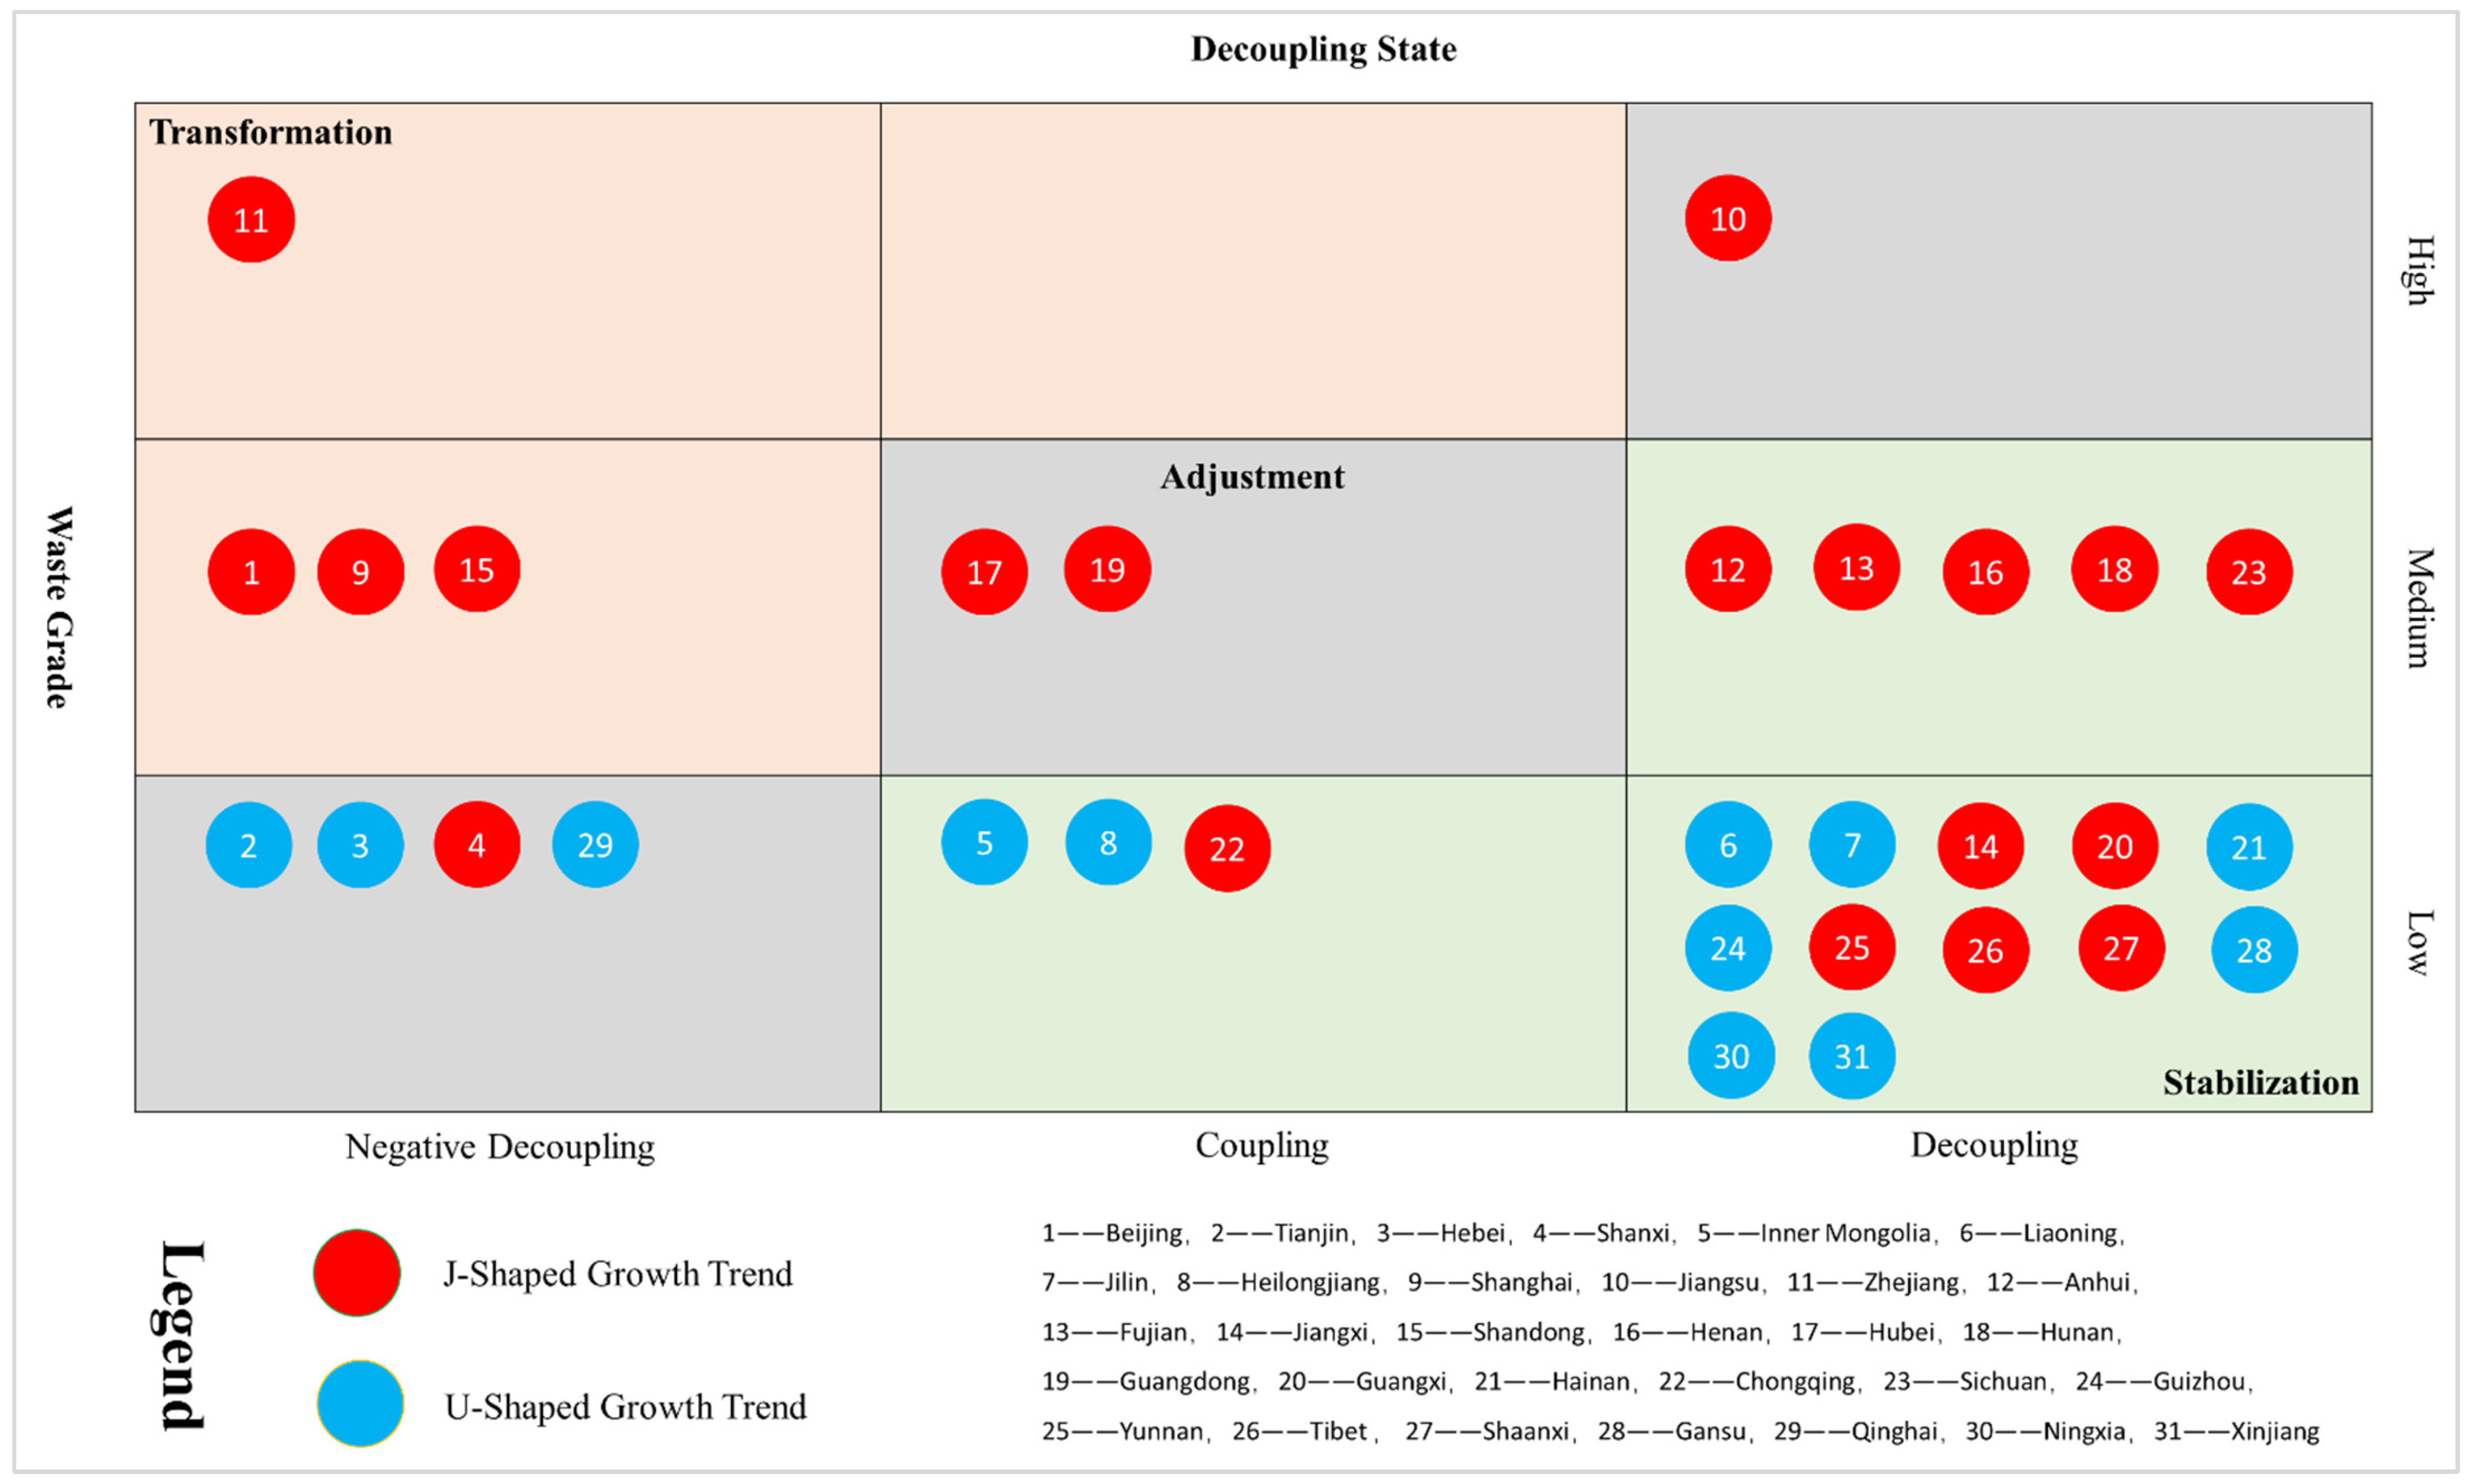
4.1. Theoretical Enlightenment

In this paper, we find that construction waste emissions in China continue to grow, with huge inter-provincial differences and significant spatial heterogeneity and agglomeration. These conclusions are corroborated with other papers, but the details are not exactly the same. Zhao [96] found that the overall trend of construction waste emissions in China is “rising first and then declining” and “high in the east and central regions, while low in the west and north”, and there is an obvious spatial clustering and variation with agglomeration spreading from west to east, by the gray prediction method and K-means clustering algorithm. This conclusion is generally in agreement with the findings of this paper, such as the viewpoints on spatial agglomeration and heterogeneity. However, they differ slightly in some details, such as the difference in the trend of continuous increase and “inverted U-shaped” state of construction waste emissions, which is mainly due to the different methods and calibers for estimation of construction waste emissions. In this paper, we estimate full-caliber construction waste based on new buildings and building stocks, while Zhao estimated only construction waste produced in the construction process according to the local codes (Shenzhen). Based on the panel data analysis of 25 EU countries, Mazzanti [97] found that there is no absolute decoupling between waste production and economic development in EU countries, and there are great differences among different countries.
This paper finds that the decoupling relationship between inter-provincial construction waste and construction economic growth in China is dominated by weak decoupling, expansive coupling, and recessive decoupling types, followed by recessive coupling, strong negative decoupling, and strong decoupling types, and no weak negative decoupling is found. In addition, the decoupling types are increasingly diversified and complex, and the geographical distribution of decoupling types and their changes show significant heterogeneity and agglomeration. Besides, the decoupling types are changing for the better, and the decoupling types in most regions remain stable or even evolve. The northeast and northwest regions degenerate into recessive decoupling and become problematic regions for construction waste management and sustainable development of the construction economy in China. These new findings and viewpoints are the original research conclusions of this paper, and they are useful additions to the theories related to the transition from high waste to low or even zero waste in the construction industry.
Theoretically, the decoupling model effectively portrays the dynamic relationship between construction waste changes and economic growth, and it determines in time whether the development with construction waste minimization and resourceization is in a reasonable state, to provide a new method to study the law of low-carbon transformation of the construction industry for researchers, government policy makers and the public. Practically, the methods and conclusions of this paper are applicable to China and also provide valuable references for decision making in the design of construction waste management policies in the US, Germany, France, UK, Sweden, Poland, the Netherlands, Iran, Japan, Korea, Italy, Brazil, India, Australia, Russia, Egypt, and other countries. These countries have been among the world leaders in construction waste emissions in recent years and are under as much pressure as China to reduce construction waste [98,99].
The analysis of the decoupling between construction waste changes and economic growth will provide a basis for the design of construction waste management policies in the aforementioned countries, and it will also contribute to the green development of their construction industry, solid waste management, and sustainable development of regional economy. In the design of construction waste management solutions based on the decoupling model, different countries must have some basic conditions, for example, they should have 5–10 years, or even more years, of data on construction waste, construction economy, and regional economic development, including waste emissions, added value, gross output value, and profit of construction industry and regional GDP. In addition, these countries should be aware of some constraints when designing the application scheme in accordance with the research steps described in Section 2.3 of this paper, for the results of the decoupling analysis are influenced by the study period and its phase division, and the choice of the base period and the choice of parameter n in Equations (2) and (3) may lead to variations in the type of decoupling. Therefore, the research base period (to determine the best research starting point) and stage division (to determine reasonable values of parameter n) should be determined comprehensively according to the national policy design objectives, regional economic development stages, and construction waste change trends, so as to make the research results more stable, suitable, and accurate.

4.2. Limitations and Deficiencies

The decoupling model is of great value in the practice of construction waste management in general. Fell [100] also believes that it is an effective tool to help local authorities manage waste growth based on accumulating data and improving the calculation methods of the model. It must be noted that due to the limitation of data and information, this paper only performs analysis at the provincial scale without involving the comparative analysis at the national and urban scales.
Due to the fact that the existence of scale effects may lead to certain differences in the research results of different levels of cities, regions, and countries, and that the policy-oriented and stage-oriented decoupling analysis may lead to large differences in the institutional environment and development stages of different countries and regions, and the choice of study area and cases may have certain effects on the results, there may be changes in details such as the size of the decoupling index and the determination of the decoupling type. To improve the accuracy of determining the connection between changes in construction waste and economic growth and to reveal the patterns of interactive changes between them, it is required to attract more scholars to this field and carry out studies at city, provincial and state, and national scales, to discover their similarities and differences through comparative analysis of different study areas (cases) at different scales.
This paper does not provide an in-depth analysis of the factors influencing and driving mechanisms of the evolution of the decoupling type. Based on the latest decoupling state, coupled with the scale and grade of construction waste and its changing trend, differentiated policies can be designed for construction waste management by dividing the study area into specific policy zones as a whole. Influencing factors and driving mechanisms will not affect the results of decoupling analysis and overall policy design; however, policy design at the level of individuals (a province within the study area) based on them will be a little rough. Further analysis of influencing factors and driving mechanisms will help the government enrich policy details and improve the precision of policy design. Therefore, the study of the influencing factors and driving mechanisms of the evolution of decoupling types between construction waste changes and economic growth will and should be the next new research field, and it deserves our continued efforts and those of researchers with similar interests.

4.3. Policy Design Value

Construction waste accounts for about 30% of municipal solid waste in China, posing a huge challenge to urban authorities in environmental management and high-quality economic development, but up to now, more than 40% of cities have not yet enacted a specific policy on construction waste management [101]. Implementation of scientifically sound construction waste minimization measures will curb waste production by 50% [102]. Therefore, it is necessary to formulate differentiated construction waste management policies according to the analysis results and the development trends and environment of each province; divide the final decoupling types based on the analysis results from the perspective of gross output value and total profile on the severe and strict side; and classify 31 provinces into three policy zones of transformation, adjustment, and stabilization by construction waste emission level, change trend, and decoupling type, and carry out differentiated and targeted policy design accordingly (Figure 10).
Most Chinese provinces are stabilization policy zones. They should continuously and steadily implement or fine-tune the existing construction waste management policies and accelerate the summary and refinement of their own experience to form a replicable and scalable construction waste management model and standards. Liaoning, Jilin, Hainan, Guizhou, Gansu, Ningxia, and Xinjiang are in the leading position in construction waste management, and they are already in a decoupling state, with low total construction waste emissions and an “inverted U-shaped” change trend. It is recommended that they take the lead in developing national and industry and construction waste management standards to play a leading and exemplary role. For example, Jilin has formulated or implemented the Opinions on Further Promoting Comprehensive Utilization of Construction Waste, the Implementation Plan for “Construction Waste Management and Resourceful Utilization Pilot Province”, and the Management Regulations for Construction Waste Emission Reduction and Resourceful Utilization, making it a national construction waste management and resourceful utilization pilot province recognized by the Ministry of Housing and Urban-Rural Development. Its focus of future work is to steadily promote the effective implementation of the relevant policies and plans. Jiangxi, Guangxi, Yunnan, Tibet, Shaanxi, Anhui, Fujian, Henan, Hunan, and Sichuan have been in the decoupling state, with construction waste emissions at a low to medium level but still in rapid growth. It is recommended that they should accelerate the development of construction waste management planning, with focus on controlling the growth of waste to achieve the peak early. Inner Mongolia, Heilongjiang, and Chongqing have low emissions of construction waste, but they are still in the coupling state. They should give priority to promoting the decoupling of construction waste changes and economic growth in the future. In particular, Chongqing should strictly implement the Implementation Plan for Pilot Work of Urban Construction Waste Control in Urban Areas, the Technical Standards for Construction Waste Disposal and Resource Utilization, the Special Planning for Construction Waste Governance in Urban Areas of Chongqing, the Technical Regulations for Setting Up Construction Waste Disposal Sites in Chongqing, the Opinions on the Promotion and Application of Recycled Construction Waste Products in Chongqing, as well as other governance policies and supporting standards, to improve the capacity of construction waste reduction, harmless and resourceful disposal, and achieve the peak of construction waste emissions early.
In the adjustment policy area, Tianjin, Hebei, Qinghai, and Shanxi are in the state of negative decoupling, with construction waste emissions at a low level, and they have all achieved a peak except Shanxi. They should learn from the successful experience of the leaders in the stabilization policy area (such as Liaoning, Jilin, Hainan, and Guizhou) in the future to accelerate construction waste reduction, resourceization, harmlessness, and reuse, focusing on promoting themselves to be in the coupling or even decoupling state. Ajayi [103] and Mahpour [104] identified legislation and fiscal policy as critical drivers to reduce construction waste, and Liu [105] suggested a PPP model to reduce the risk of construction waste resourceization projects. It is recommended that provinces in the adjustment policy area develop legislation on construction waste management; use financial funds to develop incentive programs for construction waste minimization and resource utilization; promote the application of the PPP concession model; clarify the responsibilities, rights, and needs of multiple subjects in construction waste management; and guide and drive all types of market and social funds to invest independently and establish a long-term mechanism. Although Jiangsu is in the decoupling state, its construction waste emissions are huge and in continuous growth. Hubei and Guangdong are in the coupling state, and their construction waste emissions are also large and still in continuous rapid growth. Jiangsu, Hubei, and Guangdong should place their focus on controlling the growth of construction waste in their future policy design, thus promoting the development of the construction industry from a high waste-based to a low waste-based stage and achieving peak construction waste emissions early. According to the findings of Zoghi [106] and Kucukvar [107], it is recommended that these provinces accelerate the transformation of construction waste management from end-of-pipe management to whole-process and whole-life management, strengthen source reduction, promote sorting and collection, and improve the collection and transportation system. In addition, for provinces such as Jiangsu and Guangdong that are already in the developed stage but have a high level of construction waste for a long time, they should carry out pilot demonstration work of comprehensive utilization of construction waste in representative cities, to establish a governance policy and technology system suitable for themselves, and build a number of demonstration bases for comprehensive utilization of construction waste with high technology level, strong innovation ability, large production scale, and satisfactory economic benefits.
Zhejiang, Beijing, Shanghai, and Shandong are in the transformation policy area. They are economically developed and in the negative decoupling state due to their large and fast-growing construction waste emissions, with sharp contradictions between environmental management and economic development. To improve construction waste management performance, greater efforts must be made for better systematic and innovative policy design. The first dimension is to formulate and implement a policy for the development of construction waste recycling [108,109], making a clear timeline and roadmap, to set up responsibility targets and assessment indicators for reduction and resourceization, and to plan and build construction waste recycling facilities, treatment, and reuse plants [110,111]. The second dimension is to actively implement a classification system for construction waste to collect, store, and dispose of the waste by classification; establish a comprehensive information monitoring platform for construction waste based on big data, cloud computing, Internet of Things, and other technologies; publish basic information on construction waste generation, transportation and disposal, construction waste disposal facilities, and licensed and qualified enterprises and vehicles; and disclose information on the supply and demand of construction waste and its recycled products [112,113]. The third dimension is to accelerate the pace of scientific and technological innovation and technology application of comprehensive utilization of construction waste; introduce advanced foreign technology and mature equipment; and encourage and support colleges and universities, scientific research institutions, and enterprises to develop new technologies, new techniques, new equipment, and new products for comprehensive utilization of construction waste [114]. The fourth dimension is to promote new construction methods, accelerate industrialization, digitalization, and intelligent upgrading of the construction industry; increase the proportion of zero-waste buildings, prefabricated buildings, and intelligent buildings; and improve resource utilization [115,116]. The fifth dimension is to establish a charging system for the collection and disposal of construction waste, reasonably determine the waste charging level, actively explore metering and differentiated charging methods [117], and establish an Internet trading platform for construction waste and its quota, to realize the healthy development of the market for construction waste and its disposal. The sixth dimension is to improve the quality control of architectural design and construction, implement the design concept of minimizing construction waste, strengthen the quality control of each construction process, and reduce rework or repair due to quality problems [118,119].

5. Conclusions

Construction waste management has become an issue of common concern in recent years, and China is typical and representative in the world. In this paper, we conducted an empirical study on the relationship between changes in provincial construction waste 2009–2018 and economic growth in China based on the decoupling model and GIS tools and reached the following conclusions:
(1) Provincial construction waste emissions in China are characterized by significant spatial heterogeneity and agglomeration, and most of the provinces with large emissions are concentrated in the eastern coastal and central regions, with construction waste emissions in Jiangsu and Zhejiang at a high level for a long time. In addition, they mainly show growth-oriented and “inverted U-shaped” changes, about 1/3 of the provinces have been in the peak state of construction waste emissions.
(2) The decoupling relationship between inter-provincial construction waste and construction economic growth in China is dominated by weak decoupling, expansive coupling, and recessive decoupling types, while recessive coupling, strong negative decoupling, and strong decoupling types are less common.
(3) The changes of decoupling types are generally favorable, but the evolutionary trends are increasingly diversified and complex, with significant difference and agglomeration in geographical distribution of decoupling types and their changes. Over the past decade, the decoupling type has seen evoluted, degenerated, and unchanged changes, with most regions remaining unchanged or realizing evolution.
(4) Based on construction waste emission levels, change trends, and decoupling types combined, the 31 provinces are divided into three types of policy zones of transformation, adjustment, and stabilization, and differentiated and targeted recommendations are made to provide a basis for the government to develop construction waste management policy design. As the northeast and northwest regions degenerate into the recessive decoupling state, and some developed coastal regions such as Zhejiang, Shandong, and Tianjin change from decoupling to recoupling or connecting again, they become problematic regions that restrict the overall performance improvement of construction waste management and sustainable development of the construction economy in China.
The urbanization and industrialization in China, India, Iran, Brazil, Egypt, and other countries will continue at a high rate in the future, and urban population growth and industrial upgrading will lead to a continuous increase in construction waste emissions, which is a major challenge in building a “zero-waste city” and a “zero-waste society”. This study shows that the decoupling model can be used as a new tool to analyze the synergistic relationship between construction waste and economic growth. We call for more scholars to conduct case and empirical studies to provide a decision basis for the government to develop a timeline and roadmap for construction waste reduction.

Author Contributions

Conceptualization, H.W. and S.X.; methodology, H.W., S.X. and Q.Z.; software, H.W. and P.Z.; validation, H.W., S.X. and Q.Z.; formal analysis, H.W. and S.X.; investigation, H.W. and Q.Z.; resources, H.W. and P.Z.; data curation, H.W. and Q.Z.; writing—original draft preparation, H.W. and S.X.; writing—review and editing, P.Z. and Q.Z.; visualization, H.W.; supervision, Q.Z.; project administration, P.Z.; funding acquisition, H.W. and P.Z. All authors have read and agreed to the published version of the manuscript.

Funding

This study and the related research was financially supported by the National Natural Science Foundation of China (Project Number: 51768029) and the National Natural Science Foundation of China (Project Number: 51768030).

Institutional Review Board Statement

Not applicable.

Informed Consent Statement

Not applicable.

Data Availability Statement

Most of the data can be obtained by visiting the following links: https://www.sohu.com/a/412958972_120225018?_trans_=000014_bdss_dkhhsqs (accessed on 19 July 2021), https://data.cnki.net/yearbook/Single/N2020110007 and http://www.stats.gov.cn/tjsj/ndsj/ (accessed on 21 September 2021).

Conflicts of Interest

The authors declare no conflict of interest.

Appendix A

Table A1. Growth rate and decoupling index of construction waste and economy from 2009 to 2013.
Growth RateDecoupling Index
Construction WasteGross Output ValueTotal ProfitGross Output ValueTotal Profit
1Beijing21.18 16.45 18.88 1.29 1.12
2Tianjin17.81 17.91 27.48 0.99 0.65
3Hebei18.95 20.05 22.10 0.95 0.86
4Shanxi18.13 13.54 30.90 1.34 0.59
5Inner Mongolia9.57 12.97 10.14 0.74 0.94
6Liaoning22.23 26.36 27.54 0.84 0.81
7Jilin20.97 17.94 23.84 1.17 0.88
8Heilongjiang11.49 16.49 4.66 0.70 2.47
9Shanghai11.25 7.97 8.89 1.41 1.27
10Jiangsu17.50 20.99 22.41 0.83 0.78
11Zhejiang14.46 20.48 17.91 0.71 0.81
12Anhui17.28 22.03 26.03 0.78 0.66
13Fujian21.40 25.47 29.62 0.84 0.72
14Jiangxi18.03 27.25 32.10 0.66 0.56
15Shandong12.77 16.61 19.18 0.77 0.67
16Henan14.45 18.13 27.33 0.80 0.53
17Hubei120.26 25.41 31.61 4.73 3.80
18Hunan17.13 20.48 22.52 0.84 0.76
19Guangdong13.69 19.87 20.38 0.69 0.67
20Guangxi18.22 25.12 22.42 0.73 0.81
21Hainan16.98 18.76 23.40 0.91 0.73
22Chongqing15.53 25.37 23.78 0.61 0.65
23Sichuan15.34 21.24 27.39 0.72 0.56
24Guizhou24.51 27.38 48.69 0.90 0.50
25Yunnan18.60 24.85 32.67 0.75 0.57
26Tibet−8.32 −5.10 −20.42 1.63 0.41
27Shaanxi22.61 14.73 17.28 1.54 1.31
28Gansu25.01 31.25 40.04 0.80 0.62
29Qinghai23.55 19.28 28.05 1.22 0.84
30Ningxia21.54 21.71 17.74 0.99 1.21
31Xinjiang25.63 27.51 27.67 0.93 0.93
Table A2. Growth rate and decoupling index of construction waste and economy from 2014 to 2018.
Growth RateDecoupling Index
Construction WasteGross Output ValueTotal ProfitGross Output ValueTotal Profit
1Beijing5.90 7.45 2.90 0.79 2.03
2Tianjin−2.19 −2.14 −14.15 1.02 0.15
3Hebei−1.90 0.43 −3.86 −4.46 0.49
4Shanxi3.86 7.19 0.58 0.54 6.68
5Inner Mongolia−10.93 −6.57 −12.51 1.66 0.87
6Liaoning−27.14 −17.51 −19.12 1.55 1.42
7Jilin−13.10 −5.32 −5.41 2.46 2.42
8Heilongjiang−15.93 −13.27 −17.65 1.20 0.90
9Shanghai7.38 6.64 3.16 1.11 2.33
10Jiangsu3.32 5.92 4.33 0.56 0.77
11Zhejiang1.10 −2.28 −3.76 −0.48 −0.29
12Anhui3.78 9.62 7.14 0.39 0.53
13Fujian5.71 14.28 13.35 0.40 0.43
14Jiangxi4.78 13.63 9.87 0.35 0.48
15Shandong2.72 6.41 −1.31 0.42 −2.07
16Henan5.98 9.08 13.67 0.66 0.44
17Hubei8.79 10.83 17.05 0.81 0.52
18Hunan5.57 12.39 11.14 0.45 0.50
19Guangdong8.28 13.49 9.77 0.61 0.85
20Guangxi5.90 13.97 15.18 0.42 0.39
21Hainan0.96 6.66 6.79 0.14 0.14
22Chongqing1.70 7.24 1.88 0.23 0.90
23Sichuan2.04 14.09 20.30 0.14 0.10
24Guizhou5.74 19.57 36.37 0.29 0.16
25Yunnan4.26 14.95 18.37 0.29 0.23
26Tibet18.08 26.06 47.36 0.69 0.38
27Shaanxi5.79 11.36 14.30 0.51 0.41
28Gansu−4.52 −0.09 −3.57 49.89 1.27
29Qinghai−1.88 0.48 −5.82 −3.91 0.32
30Ningxia−14.43 −2.41 −7.77 5.98 1.86
31Xinjiang−13.25 −1.92 −0.53 6.89 24.81
Table A3. Standardized and normalized raw data in 2009 and 2013.
Construction WasteGross Output ValueTotal Profit
200920132009201320092013
1Beijing0.19580.23150.38980.33710.22470.1796
2Tianjin0.05840.06300.17860.16510.13120.1127
3Hebei0.16780.18440.23890.23580.43670.4109
4Shanxi0.05840.06370.17020.13490.18590.1624
5Inner Mongolia0.05600.04500.08550.06820.25380.2794
6Liaoning0.18350.22480.32350.39020.43910.4700
7Jilin0.05550.06680.10300.09740.19210.1825
8Heilongjiang0.05060.04380.12270.10930.20390.1834
9Shanghai0.17200.14430.36730.23400.24500.1721
10Jiangsu0.96481.00001.00001.00001.00001.0000
11Zhejiang1.00000.93310.93350.91820.64410.5681
12Anhui0.18130.18810.21090.22310.36890.3828
13Fujian0.19970.23780.20740.24570.39810.5010
14Jiangxi0.11660.12480.12080.15480.31000.3093
15Shandong0.37410.32990.44090.38280.95210.9134
16Henan0.24110.22620.34430.31600.50390.4966
17Hubei0.01750.26000.32710.38270.37580.4334
18Hunan0.21520.22170.23720.23760.38250.3953
19Guangdong0.28170.25700.36520.35530.61300.5444
20Guangxi0.08370.09070.08250.10100.20730.2713
21Hainan0.00830.01030.00480.00960.01970.0272
22Chongqing0.15830.15470.17900.21240.21410.2820
23Sichuan0.25160.24340.31880.32550.46550.5442
24Guizhou0.04150.05690.04220.05940.06030.1001
25Yunnan0.07390.08140.10830.12910.19560.2857
26Tibet0.00000.00000.00000.00000.00000.0000
27Shaanxi0.08170.10270.21770.17900.31620.3608
28Gansu0.03720.05210.04770.07500.11010.1120
29Qinghai0.00180.00490.01080.01540.00070.0006
30Ningxia0.01770.02330.01620.02240.01920.0273
31Xinjiang0.04820.06800.06800.09140.13530.1569
Table A4. Standardized and normalized raw data in 2014 and 2018.
Construction WasteGross Output ValueTotal Profit
200920132009201320092013
1Beijing0.24210.26670.33190.34970.44200.4152
2Tianjin0.06160.04840.16530.11700.15780.0653
3Hebei0.17160.13850.22650.18010.16250.1116
4Shanxi0.06210.06260.12370.12730.09150.0740
5Inner Mongolia0.03810.01970.05430.02890.07040.0278
6Liaoning0.22230.05320.31730.11230.25630.0852
7Jilin0.06910.03310.09990.06000.10840.0672
8Heilongjiang0.03450.01360.08480.03370.04740.0108
9Shanghai0.15320.17820.22140.22530.20030.1874
10Jiangsu1.00001.00001.00001.00001.00001.0000
11Zhejiang0.93490.85660.92150.66580.58580.4201
12Anhui0.18660.18920.22070.25150.19350.2120
13Fujian0.25790.28210.26990.36490.23520.3263
14Jiangxi0.13460.14160.16520.21750.15560.1886
15Shandong0.33010.32180.37690.38210.43070.3407
16Henan0.23270.25700.31970.35820.32430.4563
17Hubei0.29610.36360.40730.48730.39600.6282
18Hunan0.22070.23990.24260.30640.20860.2665
19Guangdong0.23920.28820.33790.44460.37710.4606
20Guangxi0.09650.10580.10350.13720.04720.0679
21Hainan0.00840.00670.00840.00580.00710.0035
22Chongqing0.15530.14490.22350.23280.27630.2472
23Sichuan0.25020.23730.32610.43830.23220.4112
24Guizhou0.05970.06480.06400.10310.03140.0964
25Yunnan0.07620.07830.12170.16750.11920.1968
26Tibet0.00000.00000.00000.00000.00000.0093
27Shaanxi0.10430.11400.18300.22190.12780.1823
28Gansu0.05300.03750.07110.05290.06060.0384
29Qinghai0.00400.00220.01470.00850.00960.0000
30Ningxia0.01910.00750.02260.01260.01700.0038
31Xinjiang0.06810.03240.09110.06350.04810.0344

References

  1. Mortaheb, M.M.; Mahpour, A. Integrated construction waste management, a holistic approach. Sci. Iran. 2016, 23, 2044–2056. [Google Scholar] [CrossRef] [Green Version]
  2. Wang, Q.F.; Yang, Y.; Luan, D.; Qin, S. Current Situation and Comprehensive Treatment of Construction Waste. Fresenius Environ. Bull. 2020, 29, 8751–8756. [Google Scholar]
  3. Ma, L.; Zhang, L. Evolutionary game analysis of construction waste recycling management in China. Resour. Conserv. Recycl. 2020, 161, 104863. [Google Scholar] [CrossRef]
  4. Manowong, E. Investigating factors influencing construction waste management efforts in developing countries: An experience from Thailand. Waste Manag. Res. J. Sustain. Circ. Econ. 2012, 30, 56–71. [Google Scholar] [CrossRef] [PubMed]
  5. Song, X.; Zhang, F. Social Risk Assessment of “Garbage Siege” in the National High-Efficiency Ecological Economic Strategic Zone. Ecol. Econ. 2022, 38, 190–196. [Google Scholar]
  6. Yuan, H. A SWOT analysis of successful construction waste management. J. Clean. Prod. 2013, 39, 1–8. [Google Scholar] [CrossRef]
  7. Mazzanti, M.; Montini, A.; Nicolli, F. Waste dynamics in economic and policy transitions: Decoupling, convergence and spatial effects. J. Environ. Plan. Manag. 2012, 55, 563–581. [Google Scholar] [CrossRef]
  8. Wang, B.; Sun, J.; Wang, J.; Huo, S. Study on Policies and Countermeasures for the Disposal of Construction and Demolition Waste. Constr. Econ. 2021, 42, 8–13. [Google Scholar] [CrossRef]
  9. Kolaventi, S.S.; Tezeswi, T.P.; Kumar, M.S. An assessment of construction waste management in India: A statistical approach. Waste Manag. Res. 2020, 38, 444–459. [Google Scholar] [CrossRef]
  10. Ding, Z.; Zhu, M.; Tam, V.W.; Yi, G.; Tran, C. A system dynamics-based environmental benefit assessment model of construction waste reduction management at the design and construction stages. J. Clean. Prod. 2018, 176, 676–692. [Google Scholar] [CrossRef]
  11. Sáez, P.V.; Merino, M.D.R.; Porras-Amores, C.; González, A.S.-A. Assessing the accumulation of construction waste generation during residential building construction works. Resour. Conserv. Recycl. 2014, 93, 67–74. [Google Scholar] [CrossRef]
  12. Srour, I.M.; Chehab, G.R.; El-Fadel, M.; Tamraz, S. Pilot-based assessment of the economics of recycling construction demolition waste. Waste Manag. Res. J. Sustain. Circ. Econ. 2013, 31, 1170–1179. [Google Scholar] [CrossRef]
  13. Umar, U.A.; Shafiq, N.; Ahmad, F.A. A case study on the effective implementation of the reuse and recycling of construction & demolition waste management practices in Malaysia. Ain Shams Eng. J. 2020, 12, 283–291. [Google Scholar] [CrossRef]
  14. Zambrana-Vasquez, D.; Bribian, I.Z.; Jáñez, A.; Aranda-Usón, A. Analysis of the environmental performance of life-cycle building waste management strategies in tertiary buildings. J. Clean. Prod. 2016, 130, 143–154. [Google Scholar] [CrossRef] [Green Version]
  15. Sáez, P.V.; Porras-Amores, C.; Merino, M.D.R. New quantification proposal for construction waste generation in new residential constructions. J. Clean. Prod. 2015, 102, 58–65. [Google Scholar] [CrossRef]
  16. Carpio, M.; Roldán-Fontana, J.; Pacheco-Torres, R.; Ordóñez, J. Construction waste estimation depending on urban planning options in the design stage of residential buildings. Constr. Build. Mater. 2016, 113, 561–570. [Google Scholar] [CrossRef]
  17. Bakchan, A.; Faust, K.M. Construction waste generation estimates of institutional building projects: Leveraging waste hauling tickets. Waste Manag. 2019, 87, 301–312. [Google Scholar] [CrossRef]
  18. Chen, R.; Li, L.; Yang, K.; Ren, F.; Xi, C.; Lin, Y.; Zheng, H. Quantitative methods for predicting underground construction waste considering reuse and recycling. Environ. Sci. Pollut. Res. 2021, 1–12. [Google Scholar] [CrossRef]
  19. Guerra, B.C.; Bakchan, A.; Leite, F.; Faust, K.M. BIM-based automated construction waste estimation algorithms: The case of concrete and drywall waste streams. Waste Manag. 2019, 87, 825–832. [Google Scholar] [CrossRef]
  20. Guerra, B.C.; Leite, F.; Faust, K.M. 4D-BIM to enhance construction waste reuse and recycle planning: Case studies on concrete and drywall waste streams. Waste Manag. 2020, 116, 79–90. [Google Scholar] [CrossRef]
  21. Li, Y.; Zhang, X. Web-based construction waste estimation system for building construction projects. Autom. Constr. 2013, 35, 142–156. [Google Scholar] [CrossRef]
  22. Bakchan, A.; Faust, K.M.; Leite, F. Seven-dimensional automated construction waste quantification and management framework: Integration with project and site planning. Resour. Conserv. Recycl. 2019, 146, 462–474. [Google Scholar] [CrossRef]
  23. Chinda, T. Investigation of factors affecting a construction waste recycling decision. Civ. Eng. Environ. Syst. 2016, 33, 214–226. [Google Scholar] [CrossRef]
  24. Kolaventi, S.S.; Momand, H.; Tadepalli, T.; Kumar, M.V.N.S. Construction waste in India: A structural equation model for identification of causes. Proc. Inst. Civ. Eng.-Eng. Sustain. 2020, 173, 303–314. [Google Scholar] [CrossRef]
  25. Liu, J.; Yi, Y.; Wang, X. Exploring factors influencing construction waste reduction: A structural equation modeling approach. J. Clean. Prod. 2020, 276, 123185. [Google Scholar] [CrossRef]
  26. Mohammed, M.; Shafiq, N.; Elmansoury, A.; Al-Mekhlafi, A.-B.A.; Rached, E.F.; Zawawi, N.A.; Haruna, A.; Rafindadi, A.D.; Ibrahim, M.B. Modeling of 3R (Reduce, Reuse and Recycle) for Sustainable Construction Waste Reduction: A Partial Least Squares Structural Equation Modeling (PLS-SEM). Sustainability 2021, 13, 10660. [Google Scholar] [CrossRef]
  27. Bizcocho, N.; Llatas, C. Inclusion of prevention scenarios in LCA of construction waste management. Int. J. Life Cycle Assess. 2019, 24, 468–484. [Google Scholar] [CrossRef]
  28. Llatas, C.; Bizcocho, N.; Soust-Verdaguer, B.; Montes, M.; Quiñones, R. An LCA-based model for assessing prevention versus non-prevention of construction waste in buildings. Waste Manag. 2021, 126, 608–622. [Google Scholar] [CrossRef]
  29. Mak, T.M.; Chen, P.-C.; Wang, L.; Tsang, D.C.; Hsu, S.; Poon, C.S. A system dynamics approach to determine construction waste disposal charge in Hong Kong. J. Clean. Prod. 2019, 241, 118309. [Google Scholar] [CrossRef]
  30. Hao, J.; Yuan, H.; Liu, J.; Chin, C.S.; Lu, W. A model for assessing the economic performance of construction waste reduction. J. Clean. Prod. 2019, 232, 427–440. [Google Scholar] [CrossRef]
  31. Bakchan, A.; Srour, I.; Chehab, G.; El-Fadel, M.; Karaziwan, J. Behavioral determinants towards enhancing construction waste management: A Bayesian Network analysis. Resour. Conserv. Recycl. 2017, 117, 274–284. [Google Scholar] [CrossRef]
  32. Huang, L.; Cai, T.; Zhu, Y.; Zhu, Y.; Wang, W.; Sun, K. LSTM-Based Forecasting for Urban Construction Waste Generation. Sustainability 2020, 12, 8555. [Google Scholar] [CrossRef]
  33. Davis, P.; Aziz, F.; Newaz, M.T.; Sher, W.; Simon, L. The classification of construction waste material using a deep convolutional neural network. Autom. Constr. 2020, 122, 103481. [Google Scholar] [CrossRef]
  34. Mak, T.M.; Yu, I.K.; Wang, L.; Hsu, S.-C.; Tsang, D.C.; Li, C.; Yeung, T.L.; Zhang, R.; Poon, C.S. Extended theory of planned behaviour for promoting construction waste recycling in Hong Kong. Waste Manag. 2019, 83, 161–170. [Google Scholar] [CrossRef]
  35. Maués, L.M.F.; Nascimento, B.D.M.O.D.; Lu, W.; Xue, F. Estimating construction waste generation in residential buildings: A fuzzy set theory approach in the Brazilian Amazon. J. Clean. Prod. 2020, 265, 121779. [Google Scholar] [CrossRef]
  36. Kong, L.; Ma, B. Evaluation of environmental impact of construction waste disposal based on fuzzy set analysis. Environ. Technol. Innov. 2020, 19, 100877. [Google Scholar] [CrossRef]
  37. Białko, M.; Hoła, B. Identification of Methods of Reducing Construction Waste in Construction Enterprises Based on Surveys. Sustainability 2021, 13, 9888. [Google Scholar] [CrossRef]
  38. Xu, J.; Lu, W.; Ye, M.; Xue, F.; Zhang, X.; Lee, B.F.P. Is the private sector more efficient? Big data analytics of construction waste management sectoral efficiency. Resour. Conserv. Recycl. 2020, 155, 104674. [Google Scholar] [CrossRef]
  39. Lu, W.; Chen, X.; Ho, D.C.; Wang, H. Analysis of the construction waste management performance in Hong Kong: The public and private sectors compared using big data. J. Clean. Prod. 2016, 112, 521–531. [Google Scholar] [CrossRef] [Green Version]
  40. Yang, Z.; Xue, F.; Lu, W. Handling missing data for construction waste management: Machine learning based on aggregated waste generation behaviors. Resour. Conserv. Recycl. 2021, 175, 105809. [Google Scholar] [CrossRef]
  41. Lu, W.; Lou, J.; Webster, C.; Xue, F.; Bao, Z.; Chi, B. Estimating construction waste generation in the Greater Bay Area, China using machine learning. Waste Manag. 2021, 134, 78–88. [Google Scholar] [CrossRef] [PubMed]
  42. Akinade, O.O.; Oyedele, L.O.; Ajayi, S.O.; Bilal, M.; Alaka, H.A.; Owolabi, H.A.; Arawomo, O.O. Designing out construction waste using BIM technology: Stakeholders’ expectations for industry deployment. J. Clean. Prod. 2018, 180, 375–385. [Google Scholar] [CrossRef]
  43. Su, Y. Multi-agent evolutionary game in the recycling utilization of construction waste. Sci. Total Environ. 2020, 738, 139826. [Google Scholar] [CrossRef] [PubMed]
  44. Rogers, S. Battling construction waste and winning: Lessons from UAE. Proc. Inst. Civ. Eng.-Civ. Eng. 2011, 164, 41–48. [Google Scholar] [CrossRef]
  45. Ouda, O.K.M.; Peterson, H.P.; Rehan, M.; Sadef, Y.; Alghazo, J.; Nizami, A.S. A Case Study of Sustainable Construction Waste Management in Saudi Arabia. Waste Biomass-Valorization 2017, 9, 2541–2555. [Google Scholar] [CrossRef]
  46. Mendis, D.; Hewage, K.N.; Wrzesniewski, J. Contractual Obligations Analysis for Construction Waste Management in Canada. J. Civ. Eng. Manag. 2015, 21, 866–880. [Google Scholar] [CrossRef]
  47. Kofoworola, O.F.; Gheewala, S.H. Estimation of construction waste generation and management in Thailand. Waste Manag. 2009, 29, 731–738. [Google Scholar] [CrossRef]
  48. Luangcharoenrat, C.; Intrachooto, S.; Peansupap, V.; Sutthinarakorn, W. Factors Influencing Construction Waste Generation in Building Construction: Thailand’s Perspective. Sustainability 2019, 11, 3638. [Google Scholar] [CrossRef] [Green Version]
  49. Solís-Guzmán, J.; Marrero, M.; Montes-Delgado, M.V.; Ramírez-De-Arellano, A. A Spanish model for quantification and management of construction waste. Waste Manag. 2009, 29, 2542–2548. [Google Scholar] [CrossRef]
  50. Esin, T.; Cosgun, N. A study conducted to reduce construction waste generation in Turkey. Build. Environ. 2007, 42, 1667–1674. [Google Scholar] [CrossRef]
  51. Moraes, F.T.F.; Gonçalves, A.T.T.; Lima, J.; Lima, R.D.S. An assessment tool for municipal construction waste management in Brazilian municipalities. Waste Manag. Res. J. Sustain. Circ. Econ. 2020, 38, 762–772. [Google Scholar] [CrossRef]
  52. Da Paz, D.H.F.; Lafayette, K.P.V.; Holanda, M.J.D.O.; Sobral, M.D.C.M.; Costa, L.A.R.D.C. Assessment of environmental impact risks arising from the illegal dumping of construction waste in Brazil. Environ. Dev. Sustain. 2018, 22, 2289–2304. [Google Scholar] [CrossRef]
  53. Begum, R.A.; Siwar, C.; Pereira, J.J.; Jaafar, A.H. A benefit–cost analysis on the economic feasibility of construction waste minimisation: The case of Malaysia. Resour. Conserv. Recycl. 2006, 48, 86–98. [Google Scholar] [CrossRef]
  54. Nawi, M.N.M.; Osman, N.N.; Osman, W.N.; Zulhumadi, F.; Riazi, S.R.M. Environmental Study on Methods of Handling Construction Waste for Achieving Sustainability in Malaysian Construction Projects. Ekoloji 2018, 27, 1041–1046. [Google Scholar]
  55. Lu, W.; Peng, Y.; Webster, C.; Zuo, J. Stakeholders’ willingness to pay for enhanced construction waste management: A Hong Kong study. Renew. Sustain. Energy Rev. 2015, 47, 233–240. [Google Scholar] [CrossRef] [Green Version]
  56. Wu, Z.; Yu, A.T.; Wang, H.; Wei, Y.; Huo, X. Driving Factors for Construction Waste Minimization: Empirical Studies in Hong Kong and Shenzhen. J. Green Build. 2019, 14, 155–167. [Google Scholar] [CrossRef]
  57. Tam, V.W.; Li, J.; Cai, H. System dynamic modeling on construction waste management in Shenzhen, China. Waste Manag. Res. J. Sustain. Circ. Econ. 2014, 32, 441–453. [Google Scholar] [CrossRef]
  58. Wu, H.; Duan, H.; Wang, J.; Wang, T.; Wang, X. Quantification of carbon emission of construction waste by using streamlined LCA: A case study of Shenzhen, China. J. Mater. Cycles Waste Manag. 2015, 17, 637–645. [Google Scholar] [CrossRef]
  59. Bao, Z.; Lu, W. A decision-support framework for planning construction waste recycling: A case study of Shenzhen, China. J. Clean. Prod. 2021, 309, 127449. [Google Scholar] [CrossRef]
  60. Hu, M.; Yang, M. Analysis of the Policies of Construction Waste Recycling in China Based on Policy Tools. Constr. Econ. 2019, 40, 22–26. [Google Scholar] [CrossRef]
  61. Wiedenhofer, D.; Virág, D.; Kalt, G.; Plank, B.; Streeck, J.; Pichler, M.; Mayer, A.; Krausmann, F.P.; Brockway, P.; Schaffartzik, A.; et al. A systematic review of the evidence on decoupling of GDP, resource use and GHG emissions, part I: Bibliometric and conceptual mapping. Environ. Res. Lett. 2020, 15, 063002. [Google Scholar] [CrossRef]
  62. Haberl, H.; Wiedenhofer, D.; Virág, D.; Kalt, G.; Plank, B.; Brockway, P.; Fishman, T.; Hausknost, D.; Krausmann, F.P.; Leon-Gruchalski, B.; et al. A systematic review of the evidence on decoupling of GDP, resource use and GHG emissions, part II: Synthesizing the insights. Environ. Res. Lett. 2020, 15, 065003. [Google Scholar] [CrossRef]
  63. Frodyma, K.; Papież, M.; Śmiech, S. Decoupling Economic Growth from Fossil Fuel Use—Evidence from 141 Countries in the 25-Year Perspective. Energies 2020, 13, 6671. [Google Scholar] [CrossRef]
  64. Yasmeen, H.; Tan, Q. Assessing Pakistan’s energy use, environmental degradation, and economic progress based on Tapio decoupling model. Environ. Sci. Pollut. Res. 2021, 28, 68364–68378. [Google Scholar] [CrossRef] [PubMed]
  65. Mikayilov, J.I.; Hasanov, F.J.; Galeotti, M. Decoupling of CO2 emissions and GDP: A time-varying cointegration approach. Ecol. Indic. 2018, 95, 615–628. [Google Scholar] [CrossRef]
  66. Li, Y.-N.; Cai, M.; Wu, K.; Wei, J. Decoupling analysis of carbon emission from construction land in Shanghai. J. Clean. Prod. 2018, 210, 25–34. [Google Scholar] [CrossRef]
  67. Guo, S.; Wang, Y.; Huang, J.; Dong, J.; Zhang, J. Decoupling and Decomposition Analysis of Land Natural Capital Utilization and Economic Growth: A Case Study in Ningxia Hui Autonomous Region, China. Int. J. Environ. Res. Public Health 2021, 18, 646. [Google Scholar] [CrossRef] [PubMed]
  68. Chen, X.; Pang, J.; Zhang, Z.; Li, H. Sustainability Assessment of Solid Waste Management in China: A Decoupling and Decomposition Analysis. Sustainability 2014, 6, 9268–9281. [Google Scholar] [CrossRef] [Green Version]
  69. Pu, L.; Ma, Y.L.; Bi, C.W.; Li, S.R.; Li, Y. Exploring the relationship between solid waste production and economic development and the influence factor in Chengdu Plain Economic Zone. Environ. Pollut. Prev. 2021, 43, 266–270. [Google Scholar] [CrossRef]
  70. Wang, K.; Zhu, Y.; Zhang, J. Decoupling economic development from municipal solid waste generation in China’s cities: Assessment and prediction based on Tapio method and EKC models. Waste Manag. 2021, 133, 37–48. [Google Scholar] [CrossRef]
  71. Ichinose, D.; Yamamoto, M.; Yoshida, Y. The decoupling of affluence and waste discharge under spatial correlation: Do richer communities discharge more waste? Environ. Dev. Econ. 2014, 20, 161–184. [Google Scholar] [CrossRef] [Green Version]
  72. Swart, J.; Groot, L. Waste management alternatives: (Dis)economies of scale in recovery and decoupling. Resour. Conserv. Recycl. 2015, 94, 43–55. [Google Scholar] [CrossRef]
  73. Tsiamis, D.A.; Torres, M.; Castaldi, M.J. Role of plastics in decoupling municipal solid waste and economic growth in the U.S. Waste Manag. 2018, 77, 147–155. [Google Scholar] [CrossRef]
  74. Jaligot, R.; Chenal, J. Decoupling municipal solid waste generation and economic growth in the canton of Vaud, Switzerland. Resour. Conserv. Recycl. 2018, 130, 260–266. [Google Scholar] [CrossRef]
  75. Wu, X.; Wang, L.; Zheng, H. A network effect on the decoupling of industrial waste gas emissions and industrial added value: A case study of China. J. Clean. Prod. 2019, 234, 1338–1350. [Google Scholar] [CrossRef]
  76. Sjöström, M.; Östblom, G. Decoupling waste generation from economic growth—A CGE analysis of the Swedish case. Ecol. Econ. 2010, 69, 1545–1552. [Google Scholar] [CrossRef]
  77. Madden, B.; Florin, N.; Mohr, S.; Giurco, D. Using the waste Kuznet’s curve to explore regional variation in the decoupling of waste generation and socioeconomic indicators. Resour. Conserv. Recycl. 2019, 149, 674–686. [Google Scholar] [CrossRef]
  78. Zhao, J.; Liu, Q.; Lin, L.; Qian, G.; Xiao, J. Evolution and comparison of construction waste of large cities in China. J. Cent. South Univ. (Sci. Technol.) 2013, 44, 1297–1304. [Google Scholar]
  79. Li, J.; Zuo, J.; Cai, H.; Zillante, G. Construction waste reduction behavior of contractor employees: An extended theory of planned behavior model approach. J. Clean. Prod. 2017, 172, 1399–1408. [Google Scholar] [CrossRef]
  80. Montevecchi, F. Policy Mixes to Achieve Absolute Decoupling: A Case Study of Municipal Waste Management. Sustainability 2016, 8, 442. [Google Scholar] [CrossRef]
  81. Organization for Economic Cooperation and Development. Indicators to Measure Decoupling of Environmental Pressure and Economic Growth; OECD: Paris, France, 2002. [Google Scholar]
  82. Tapio, P. Towards a theory of decoupling: Degrees of decoupling in the EU and the case of road traffic in Finland between 1970 and 2001. Transp. Policy 2005, 12, 137–151. [Google Scholar] [CrossRef] [Green Version]
  83. Casadio Tarabusi, E.C.; Guarini, G. An axiomatic approach to decoupling indicators for green growth. Ecol. Indic. 2018, 84, 515–524. [Google Scholar] [CrossRef]
  84. Pesce, A. The Decoupling of Emerging Economies: Theoretical and Empirical Puzzle. J. Econ. Surv. 2016, 31, 602–631. [Google Scholar] [CrossRef]
  85. Song, Y.; Sun, J.; Zhang, M.; Su, B. Using the Tapio-Z decoupling model to evaluate the decoupling status of China’s CO2 emissions at provincial level and its dynamic trend. Struct. Chang. Econ. Dyn. 2020, 52, 120–129. [Google Scholar] [CrossRef]
  86. Lu, Z.; Wang, H.; Yue, Q. Decoupling Analysis of the Environmental Mountain-with Case Studies from China. J. Ind. Ecol. 2014, 19, 1082–1090. [Google Scholar] [CrossRef]
  87. Longhofer, W.; Jorgenson, A. Decoupling reconsidered: Does world society integration influence the relationship between the environment and economic development? Soc. Sci. Res. 2017, 65, 17–29. [Google Scholar] [CrossRef]
  88. Zhao, S.; Zhao, K.; Yan, Y.; Zhu, K.; Guan, C. Spatio-Temporal Evolution Characteristics and Influencing Factors of Urban Service-Industry Land in China. Land 2021, 11, 13. [Google Scholar] [CrossRef]
  89. Wang, Z.S.; Ran, C.M. Decoupling Relationship between Construction Waste Production and Economic Growth from a Spatiotemporal Perspective. J. Eng. Manag. 2020, 34, 39–44. [Google Scholar] [CrossRef]
  90. Li, J.X.; Shi, F.; Cui, S.Q. Analysis on the Construction Waste Production in Time-apatial Perspective. Sci. Manag. 2015, 35, 50–56. [Google Scholar] [CrossRef]
  91. Xiang, W.; Yang, Y.M.; Liu, J. Research on Present Situation and Production Predict of Construction and Demolition Debris in Chongqing. Environ. Sanit. Eng. 2020, 28, 105–109. [Google Scholar] [CrossRef]
  92. Guan, X.Y.; Wang, S.L.; Gao, Z.Y.; Lv, Y.; Fu, X.J. Spatio-temporal variability of soil salinity and its relationship with the depth to groundwater in salinization irrigation district. Acta Ecol. Sin. 2012, 32, 198–206. [Google Scholar]
  93. Zhao, S.; Yan, Y.; Han, J. Industrial Land Change in Chinese Silk Road Cities and Its Influence on Environments. Land 2021, 10, 806. [Google Scholar] [CrossRef]
  94. Zhao, S.; Li, W.; Zhao, K.; Zhang, P. Change Characteristics and Multilevel Influencing Factors of Real Estate Inventory—Case Studies from 35 Key Cities in China. Land 2021, 10, 928. [Google Scholar] [CrossRef]
  95. Miyamoto, S.; Chacon, A.; Hossain, M.; Martinez, L. Soil salinity of urban turf areas irrigated with saline water I. Spatial variability. Landsc. Urban Plan. 2005, 71, 233–241. [Google Scholar]
  96. Zhao, L.; Liu, Y.; Tian, J. Spatiotemporal evolution law and output prediction of construction waste in the People’s Republic of China. Waste Manag. Res. J. Sustain. Circ. Econ. 2021, 40, 174–184. [Google Scholar] [CrossRef]
  97. Mazzanti, M.; Zoboli, R. Waste generation, waste disposal and policy effectiveness: Evidence on decoupling from the European Union. Resour. Conserv. Recycl. 2008, 52, 1221–1234. [Google Scholar] [CrossRef]
  98. Liu, J.; Gong, E.; Wang, D.; Lai, X.; Zhu, J. Attitudes and behaviour towards construction waste minimisation: A comparative analysis between China and the USA. Environ. Sci. Pollut. Res. 2018, 26, 13681–13690. [Google Scholar] [CrossRef]
  99. Li, J.; Ding, Z.; Mi, X.; Wang, J. A model for estimating construction waste generation index for building project in China. Resour. Conserv. Recycl. 2013, 74, 20–26. [Google Scholar] [CrossRef]
  100. Fell, D.; Cox, J.; Wilson, D.C. Future waste growth, modelling and decoupling. Waste Manag. Res. J. Sustain. Circ. Econ. 2010, 28, 281–286. [Google Scholar] [CrossRef]
  101. Lv, H.; Li, Y.; Yan, H.-B.; Wu, D.; Shi, G.; Xu, Q. Examining construction waste management policies in mainland China for potential performance improvements. Clean Technol. Environ. Policy 2020, 23, 445–462. [Google Scholar] [CrossRef]
  102. Liu, J.; Teng, Y.; Wang, D.; Gong, E. System dynamic analysis of construction waste recycling industry chain in China. Environ. Sci. Pollut. Res. 2020, 27, 37260–37277. [Google Scholar] [CrossRef]
  103. Ajayi, S.O.; Oyedele, L.O. Policy imperatives for diverting construction waste from landfill: Experts’ recommendations for UK policy expansion. J. Clean. Prod. 2017, 147, 57–65. [Google Scholar] [CrossRef] [Green Version]
  104. Mahpour, A.; Mortaheb, M.M. Financial-Based Incentive Plan to Reduce Construction Waste. J. Constr. Eng. Manag. 2018, 144, 04018029. [Google Scholar] [CrossRef]
  105. Liu, J.; Hua, Z.; Pang, Y.; Wang, X. Risk sharing for PPP project in construction waste recycling industry in China. Environ. Sci. Pollut. Res. 2021, 1–15. [Google Scholar] [CrossRef]
  106. Zoghi, M.; Kim, S. Dynamic Modeling for Life Cycle Cost Analysis of BIM-Based Construction Waste Management. Sustainability 2020, 12, 2483. [Google Scholar] [CrossRef] [Green Version]
  107. Kucukvar, M.; Egilmez, G.; Tatari, O. Evaluating environmental impacts of alternative construction waste management approaches using supply-chain-linked life-cycle analysis. Waste Manag. Res. J. Sustain. Circ. Econ. 2014, 32, 500–508. [Google Scholar] [CrossRef]
  108. Wei, Y.; Ji, G.; Hu, L. Research Summary on Recycling of Construction Waste. Bull. Chin. Ceram. Soc. 2019, 38, 2842–2846. [Google Scholar] [CrossRef]
  109. Liu, J.; Nie, J.; Yuan, H. Interactive decisions of the waste producer and the recycler in construction waste recycling. J. Clean. Prod. 2020, 256, 120403. [Google Scholar] [CrossRef]
  110. Gao, S.-Y.; Liu, Y.; Zhou, Y.-Y.; Zhang, M. Spatial Distribution of Construction Waste Recycling Facilities. Sens. Mater. 2020, 32, 3975. [Google Scholar] [CrossRef]
  111. Shi, Q.; Ren, H.; Ma, X.; Xiao, Y. Site selection of construction waste recycling plant. J. Clean. Prod. 2019, 227, 532–542. [Google Scholar] [CrossRef]
  112. Lu, W.; Tam, V.W. Construction waste management policies and their effectiveness in Hong Kong: A longitudinal review. Renew. Sustain. Energy Rev. 2013, 23, 214–223. [Google Scholar] [CrossRef] [Green Version]
  113. Hossain, U.; Wu, Z.; Poon, C.S. Comparative environmental evaluation of construction waste management through different waste sorting systems in Hong Kong. Waste Manag. 2017, 69, 325–335. [Google Scholar] [CrossRef] [PubMed]
  114. Umar, U.A.; Shafiq, N.; Malakahmad, A.; Nuruddin, M.F.; Khamidi, M.F. A review on adoption of novel techniques in construction waste management and policy. J. Mater. Cycles Waste Manag. 2016, 19, 1361–1373. [Google Scholar] [CrossRef]
  115. Li, Z.; Shen, Q.; Alshawi, M. Measuring the impact of prefabrication on construction waste reduction: An empirical study in China. Resour. Conserv. Recycl. 2014, 91, 27–39. [Google Scholar] [CrossRef] [Green Version]
  116. Zhao, S.; Zhang, P.; Li, W. A Study on Evaluation of Influencing Factors for Sustainable Development of Smart Construction Enterprises: Case Study from China. Buildings 2021, 11, 221. [Google Scholar] [CrossRef]
  117. Poon, C.S.; Yu, A.T.W.; Wong, A.; Yip, R. Quantifying the Impact of Construction Waste Charging Scheme on Construction Waste Management in Hong Kong. J. Constr. Eng. Manag. 2013, 139, 466–479. [Google Scholar] [CrossRef]
  118. Laovisutthichai, V.; Lu, W.; Bao, Z. Design for construction waste minimization: Guidelines and practice. Arch. Eng. Des. Manag. 2020, 1–20. [Google Scholar] [CrossRef]
  119. Banihashemi, S.; Tabadkani, A.; Hosseini, M.R. Integration of parametric design into modular coordination: A construction waste reduction workflow. Autom. Constr. 2017, 88, 1–12. [Google Scholar] [CrossRef]
Figure 1. Study area.
Buildings 12 00147 g001
Figure 2. Analysis on the change of construction waste in the study area.
Buildings 12 00147 g002
Figure 3. Research steps.
Buildings 12 00147 g003
Figure 4. Analysis on the change of construction waste in provinces.
Buildings 12 00147 g004
Figure 5. Analysis on the spatial cluster of construction waste in the study area.
Buildings 12 00147 g005
Figure 6. Analysis on the eight types of decoupling relationships in gross output value.
Buildings 12 00147 g006
Figure 7. Analysis on the three types of decoupling relationships in gross output value.
Buildings 12 00147 g007
Figure 8. Analysis on the eight types of decoupling relationships in total profit.
Buildings 12 00147 g008
Figure 9. Analysis on the three types of decoupling relationships in total profit.
Buildings 12 00147 g009
Figure 10. Policy zoning of decarbonization development.
Buildings 12 00147 g010
Table 1. Decoupling type and decoupling indicator range.
Decoupling TypeΔxΔyz
DecouplingStrong≤0≥0≤0
Weak>0>0(0, 0.8]
Recessive<0<0(1.2, +∞)
CouplingExpansive>0>0(0.8, 1.2]
Recessive<0<0(0.8, 1.2]
Negative DecouplingStrong>0<0<0
Weak<0<0(0, 0.8]
Expansive>0>0(1.2, +∞)
Publisher’s Note: MDPI stays neutral with regard to jurisdictional claims in published maps and institutional affiliations.

