Article

Life Cycle Regional Economic Impacts of Bridge Repair Using Cross-Laminated Timber Floor Slabs: A Case Study in Akita Prefecture, Japan

1
United Graduate School of Agricultural Science, Tokyo University of Agriculture and Technology, 3-5-8 Saiwai-cho, Fuchu 183-8509, Japan
2
Research Faculty of Agriculture, Hokkaido University, Kita 9, Nishi 9, Kita-ku, Sapporo 060-8589, Japan
3
Hattori Engineer Co., Ltd., 2-2-12 Miroku, Aoi-ku, Shizuoka 420-0053, Japan
4
Institute of Agriculture, Tokyo University of Agriculture and Technology, 3-5-8 Saiwai-cho, Fuchu 183-8509, Japan
*
Author to whom correspondence should be addressed.
Buildings 2022, 12(2), 158; https://doi.org/10.3390/buildings12020158
Submission received: 27 December 2021 / Revised: 28 January 2022 / Accepted: 29 January 2022 / Published: 2 February 2022

Abstract

:
Recently, cross-laminated timber (CLT) has attracted attention as a civil engineering material in Japan. In particular, the use of CLT floor slabs for bridge repair is expected to have regional economic impacts throughout their life cycle, but their economic impacts have not been evaluated. In this study, the life cycle regional economic impacts of using non-waterproofed CLT, waterproofed CLT, and reinforced concrete (RC) floor slabs for bridge repair in Akita Prefecture, Japan, were compared. Using past-to-present input–output tables, we quantitatively evaluated the economic impacts over the life cycle of floor slabs by estimating the future input–output tables for construction, maintenance, and disposal. The results showed that the construction and maintenance costs (final demand increase) of CLT floor slabs are higher than those of RC slabs, but the regional economic impact is larger. In addition, the non-waterproofed CLT must be renewed every time it is maintained. Therefore, the demand for CLT production in the prefecture will increase, and the economic impact will be larger than that of the other two floor slabs. This demand for CLT production will not only redound to the benefit of the forestry and wood industry but also the revitalization of regional economies.

1. Introduction

Timber is a renewable resource when forests are managed sustainably [1] and, thus, contributes to sustainable construction projects. In addition, it acts as a carbon sink and consumes less energy during material production than other alternatives, such as concrete and steel, thereby contributing to the mitigation of global warming [2]. According to the Food and Agriculture Organization of the United Nations, global timber consumption is increasing [3]. In Japan, the housing construction industry is a major contributor to the demand for timber. However, the number of new housing construction projects has been declining over the long term, and it is reasonable to assume that housing demand will continue to decline in the future owing to population decline and other factors [4]. In this context, the use of timber in civil engineering fields, such as non-residential and public works, is expected to support the timber industry [5,6,7,8,9].
The aging of bridges has become a critical issue in civil engineering structures in Japan. There are approximately 720,000 road bridges in Japan, and local governments manage more than 90% of them (approximately 660,000 bridges). Of these, more than 70% are small bridges with lengths of less than 15 m. As of 2020, 36% of the small bridges are more than 50 years old, and this figure will reach 62% by 2030. Currently, such bridges are maintained in service by repairing the damage and deterioration; however, large-scale measures, such as renewal and reinforcement, will be required in the near future [10]. Many municipalities that manage bridges have limited financial resources [11], and even for small bridges, there is a limit to how financially feasible it is to manage the structure.
In recent years, cross-laminated timber (CLT) has become popular as a timber material and is expected to be used as a structural material, as evidenced by reports evaluating the functionality of the product [12,13,14], examining its function as a flooring material [15,16], and evaluating its use in bridges [17,18]. In CLT, the laminae are arranged in a widthwise direction and then laminated and glued so that the fiber directions are orthogonal. There are eight CLT factories in Japan that are certified under the Japanese Agricultural Standards. The location of each factory is shown in Figure 1. The factories are located in Hokkaido, Akita, Miyagi, Ishikawa, Tottori, Okayama, Ehime, and Kagoshima prefectures, and the annual production capacity of CLT in Japan is approximately 63,000 m3 (8 h of operation per day) [19]. CLT use as a structural material is expected to increase in Japanese Civil Engineering and Architecture owing to its rigidity in two directions and low weight (approximately 1/6 to 1/4 that of concrete) [20]. A previous study reported on the potential for cost reduction using CLT floor structures, which have a faster production time and lower weight compared to those of concrete [21]. In other words, when the concrete slab thickness needs to be increased to repair the floor slabs of small bridges, CLT is expected to be used to repair aging bridges by only renewing its floor slabs without reinforcing the main structure, such as the steel girders. This is expected to shorten the construction time and reduce the economic burden on local governments.
According to Ahmed and Arocho [22], the construction of mass timber buildings primarily with CLT is more expensive than concrete. According to Iwase et al. [23], when CLT is used for floor slabs, the overall cost of construction, maintenance, and disposal for the consumer are higher than that of reinforced concrete (RC). CLT floor slabs involve various industries throughout their life cycle, including manufacturing, use, and disposal. Therefore, not only the costs borne by the consumer but also the regional economic impact must be evaluated. However, this aspect has not been considered in previous studies [22,23]. Conversely, other previous studies [24,25,26] have shown that, despite its associated high construction costs, the use of timber has a positive impact on the regional economy for timber check dams [24,25] and high-rise mass timber buildings [26]. Therefore, it is important to quantitatively clarify the impact of using CLT floor slabs on the regional economy.
To study the effect of civil engineering structures using CLT floor slabs on the regional economy, it is necessary to estimate the long-term effects over the life cycle of the structure, including maintenance and disposal, instead of only estimating the effect for a single year at the time of construction. However, previous studies on timber check dams [24,25] and high-rise mass timber buildings [26] only examined the economic impacts during construction and not the long-term effects, including maintenance and disposal. Therefore, studies on the estimation of the regional economic impacts of timber use, including CLT, in civil engineering and architecture over its entire life cycle are lacking.
In this study, we quantitatively evaluated the regional economic impacts of bridge repair using the CLT floor slabs studied by Iwase et al. [23] during their overall life cycle from construction to disposal by estimating the future input–output tables using past-to-present input–output tables. In addition, CLT floor slabs with and without waterproofing were also considered. Subsequently, the results of this study were compared with those of ordinary RC floor slabs.

2. Materials and Methods

2.1. Target Bridge and Floor Slabs

This study targeted the repair of a 10-m-long and 3.3-m-wide girder bridge in Daisen City, Akita Prefecture, Japan, constructed in 1990 and managed by Akita Prefecture itself [23]. Before the repair, timber floor slabs with a simple structure consisting of square timber (chestnut) lined up perpendicular to the bridge axis were used. As the bridge was built more than 25 years ago and the slabs had deteriorated, they were replaced with waterproofed CLT floor slabs (WP CLT) made of Japanese cedar wood in 2018 (Figure 2 [27]). Conventional chestnut square timber was not used because it is difficult to procure in Japan, and the durability of floor slabs using only chestnut timber is unsatisfactory. Because there was no deterioration of the abutment and bridge girder, only the replacement and repair of the floor slabs and the pavement were carried out in the bridge repair work. For this reason, only the floor slabs and pavement were considered in this study.
The design loads, bridge lengths, and widths of the WP CLT, non-waterproofed CLT floor slabs (NWP CLT), and RC used for comparison were unified as functional units.

2.2. Scope and Duration of Estimation

We evaluated the production value induced and the employment effect for the direct effect, indirect effect, secondary effect, total effect, and economic impact rate with respect to the economic impact.
Production value induced refers to the amount of intra-industry output provoked by each item of final demand, whereas the employment effect refers to the number of employees whose employment in each industry is directly or indirectly triggered because of a change in final demand. The direct effect is the increase in output resulting from newly generated final demand, such as consumption and investment. In general, the production of these goods and services is not solely provided within the region; however, the direct effect was assumed to be the same amount as the final demand increase because the bridges targeted in this study are public works projects in Akita Prefecture. The indirect effect refers to the effect of inducing multiple production activities as a result of raw material production in industries whose production has increased due to the direct effect. Secondary effects are those that are newly provoked by the employment income generated by direct and indirect effects. The total effect is the sum of direct, indirect, and secondary effects. The economic impact rate is the total effect divided by the direct effect, and it indicates the relative magnitude of the economic impact.
The estimation period was set to 50 years, which is the design service life of the subject floor slabs, and it was assumed that the floor slabs were disposed of 50 years after construction. The cost items of construction, maintenance, and disposal during the estimation period are shown in Figure 3. For the maintenance of NWP CLT, it was assumed that CLT floor slabs would be renewed at 15-year intervals (the legal service life of timber bridges). For WP CLT, it was assumed that the waterproofing agent would be reapplied at 15-year intervals (based on interviews with the contractor). Similarly, crack repairs in RC were assumed to be performed at 25-year intervals (again, based on interviews with the contractor). The asphalt pavement would be replaced at each maintenance period described above. For disposal of the floor slabs, it was assumed that the floor slabs would be disposed of at the 15th, 30th, 45th, and 50th years (the renewal and disposal periods for NWP CLT), and at the 50th year (the disposal period for WP CLT and RC). However, the asphalt pavement was assumed to be disposed of at each maintenance period (15th, 25th, 30th, and 45th year) and disposal period (50th year) for the three floor slabs.

2.3. Creating an Extended Input–Output Table for Construction

For the economic impact estimation, we developed an extended input–output table, for which we used the latest input–output table for Akita Prefecture—the 2015 Akita Input–Output Table (hereinafter, “Akita Table”) [28]. The Akita Table classifies Akita Prefecture’s industries into a maximum of 107 sectors. However, because the only industry classification related to timber is the sector of lumber and wood products, and the special forest products sector is included in the forestry sector, it is impossible to properly evaluate the economic impacts of timber utilization, such as CLT. Therefore, we developed an extended input–output table, as shown in Figure 4. Thus, we utilized the method used by Huzita et al. [25] and divided the lumber and wood products sector into timber, plywood and glued laminated timber, wooden chips, and miscellaneous wooden products sectors, and the forestry sector into silviculture, logs, and special forest products (including hunting) sectors. In addition, a 113-sector extended table was prepared by adding NWP CLT construction, WP CLT construction, or RC construction sectors. Note that CLT manufacturing is included in the plywood and glued laminated timber sector.

2.4. Creating an Extended Input–Output Table for Maintenance and Disposal

The lumber and wood products sector and the forestry sector were divided in the same manner as in the extended table for construction, and an extended table for maintenance was created with new NWP CLT maintenance, WP CLT maintenance, or RC maintenance sectors. The future estimates were made using the oldest to the latest basic sector tables [29,30,31,32,33,34] from 1990 to 1995, 2000, 2005, 2011, and 2015 in the currently published Akita Prefecture input–output tables. As for the method, there is a non-survey method used in a previous study [35] that created a municipal-scale input–output table from a prefectural-scale input–output table using multiple administrative data. Regarding the non-survey method, a previous study [36] estimated the future of the input–output table by calculating the rate of change in the basic sector table between two time points in the past and multiplying the rate of change by the basic sector table. In this study, we used this method to estimate the future. Specifically, the industry classifications in the basic sector table of transactions were integrated into three sectors (primary, secondary, and tertiary industries), and the five-year rate of change in the future was calculated by averaging the five-year rates of change in the input and output of each sector from the past to the present (Table S1 in Supplementary Material). The input and output of each industrial sector after 15, 25, 30, 45, and 50 years were calculated by multiplying the obtained five-year change rate by the number of years required for the relevant sector in the basic sector table of the extended table for maintenance. Similarly, for the employment-induced coefficient, the industrial sectors were combined into three sectors, and the rate of change was calculated for almost every five-year period using the number of employees from 1995 (when the number of employees was published) to 2015 (the latest year available) [37,38,39,40,41] and averaged to obtain the five-year rate of change (Table S2). The reason for consolidation into three sectors was that because the input–output table of Akita Prefecture has undergone several consolidations, the definitions of the past and current sectors may differ, and three sectors represented the maximum number of units whose definitions would not differ even after the consolidations.
The current maintenance and disposal costs may change in the future, depending on future economic conditions. However, because it is difficult to predict the future, this study assumed that the final demand increase for maintenance and disposal will remain constant until the future.

2.5. Data Used

To establish a new sector in the extended table, cost data for construction, maintenance, and disposal, including material and labor costs for NWP CLT, WP CLT, and RC, are required. These data were obtained through interviews with design and construction companies and design estimates. Using the sectoral classification of the Ministry of Internal Affairs and Communications [42], the expenditures of the obtained cost data were classified into the corresponding industrial sectors within the newly established sector. The construction and maintenance costs of NWP CLT, WP CLT, and RC and their classification into corresponding industrial sectors are shown in Tables S3–S8, respectively. The cost data for the disposal process are listed in Tables S9 and S10.

2.6. Commercial Margin and Domestic Freight Rate Treatment

Because the collected cost data are purchaser prices, including commercial margins and domestic freight rates, it is necessary to convert them to producer prices before classifying them in the extended table. To convert to producer prices, we quoted values from the input table (basic sector) [43] to obtain commercial margins and domestic freight rates. Specifically, commercial margins and domestic freight rates were obtained by dividing the commercial margin amount and domestic freight rate of each sector in the total domestic demand (column code 790,000) of the input table (basic sector) by the purchaser price and then removing them from the collected data. The removed margins were classified into the corresponding commercial and transportation sectors (six sectors).

2.7. Prefecture’s Self-Sufficiency Rate

The CLT was made of cedar grown in Akita Prefecture, and all the production, processing, and transportation of the timber were carried out locally. Therefore, the prefecture’s self-sufficiency rate for the log sector, which includes the manufacturing industry of materials, such as logs, and the plywood and glued laminated timber sector (including CLT manufacturing), was assumed to be 100%, and the import coefficient for each sector was set to zero. The original self-sufficiency rates in Akita Prefecture for the log sector and the plywood and glued laminated timber sector were 62% and 45%, respectively. Therefore, the current import and export coefficients were 0.38 and 0.55, respectively. The self-sufficiency rate in Akita Prefecture was also assumed to be constant in the future.

2.8. Estimation of Economic Impacts

The estimation procedure of the economic impact is shown in Figure 5.
The input coefficient matrix ( A ) is a square matrix with a i j as a component and is represented by Equation (1):
a i j = x i j X j
where i is the row sector number, j is the column sector number, a i j is the amount of input from row sector i that sector j needs to produce one unit of output (input coefficient), x i j is the amount of the intermediate input that sector j has input from sector i , and X j is the prefecture’s production of sector j .
For the inverse matrix coefficients, we used the open inverse matrix coefficients matrix ( B ), which reflects the fact that some of the economic impacts flow out of the prefecture, as defined in Equation (2):
B = I I M A 1
where I is the unit matrix, M is the diagonal matrix of the import coefficients, and A is the input coefficient matrix. The import coefficients can be calculated by dividing the import value by the total demand in the prefecture for each sector in the input–output table.

3. Results and Discussion

3.1. Regional Economic Impact

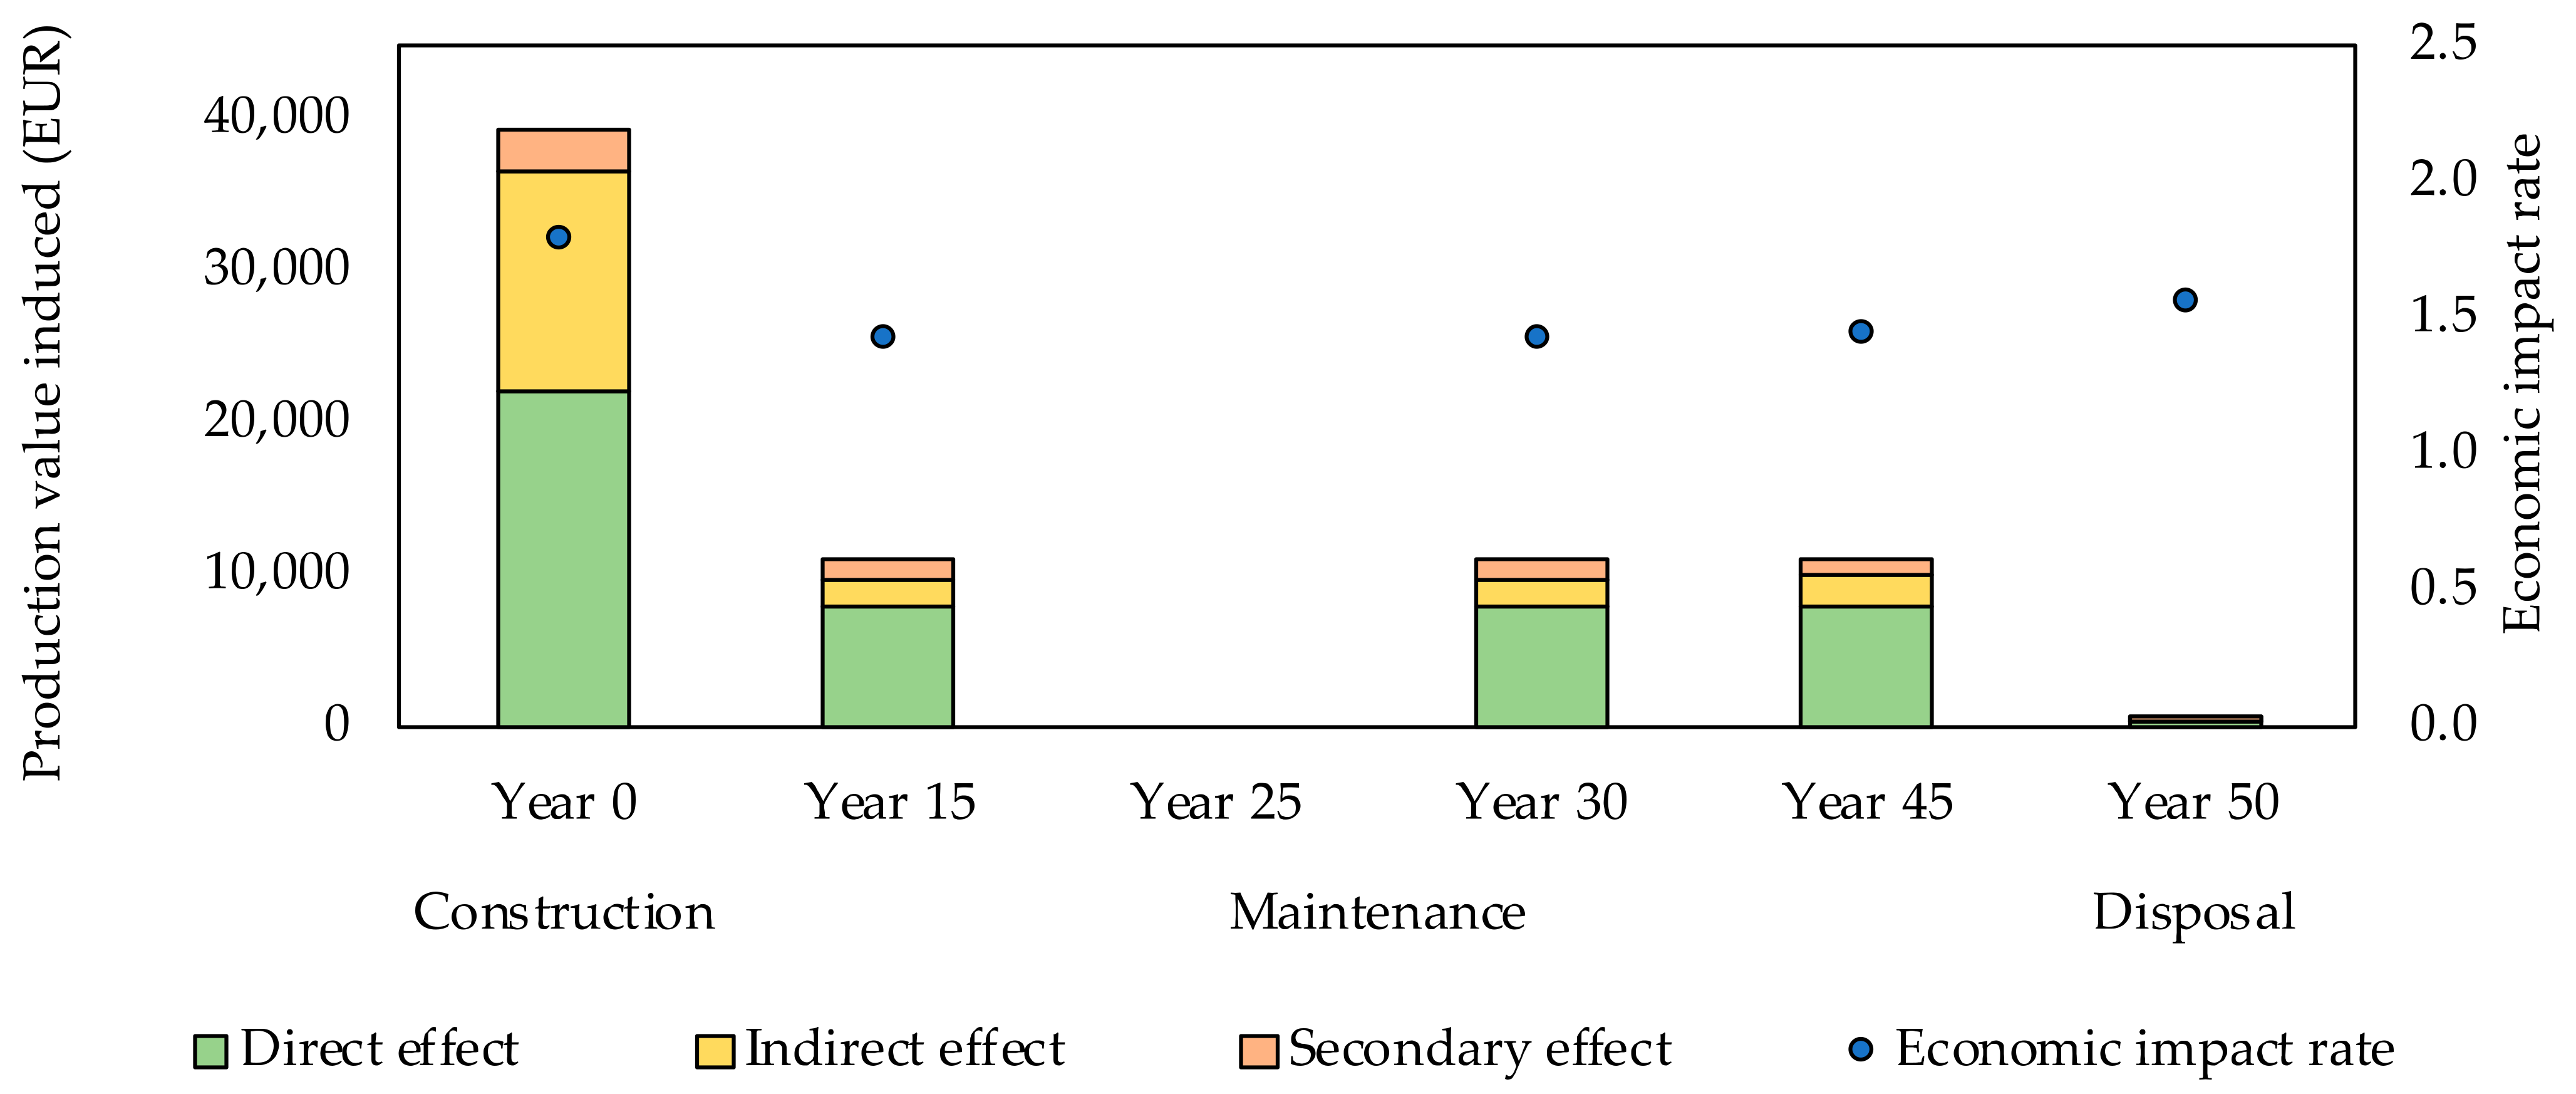
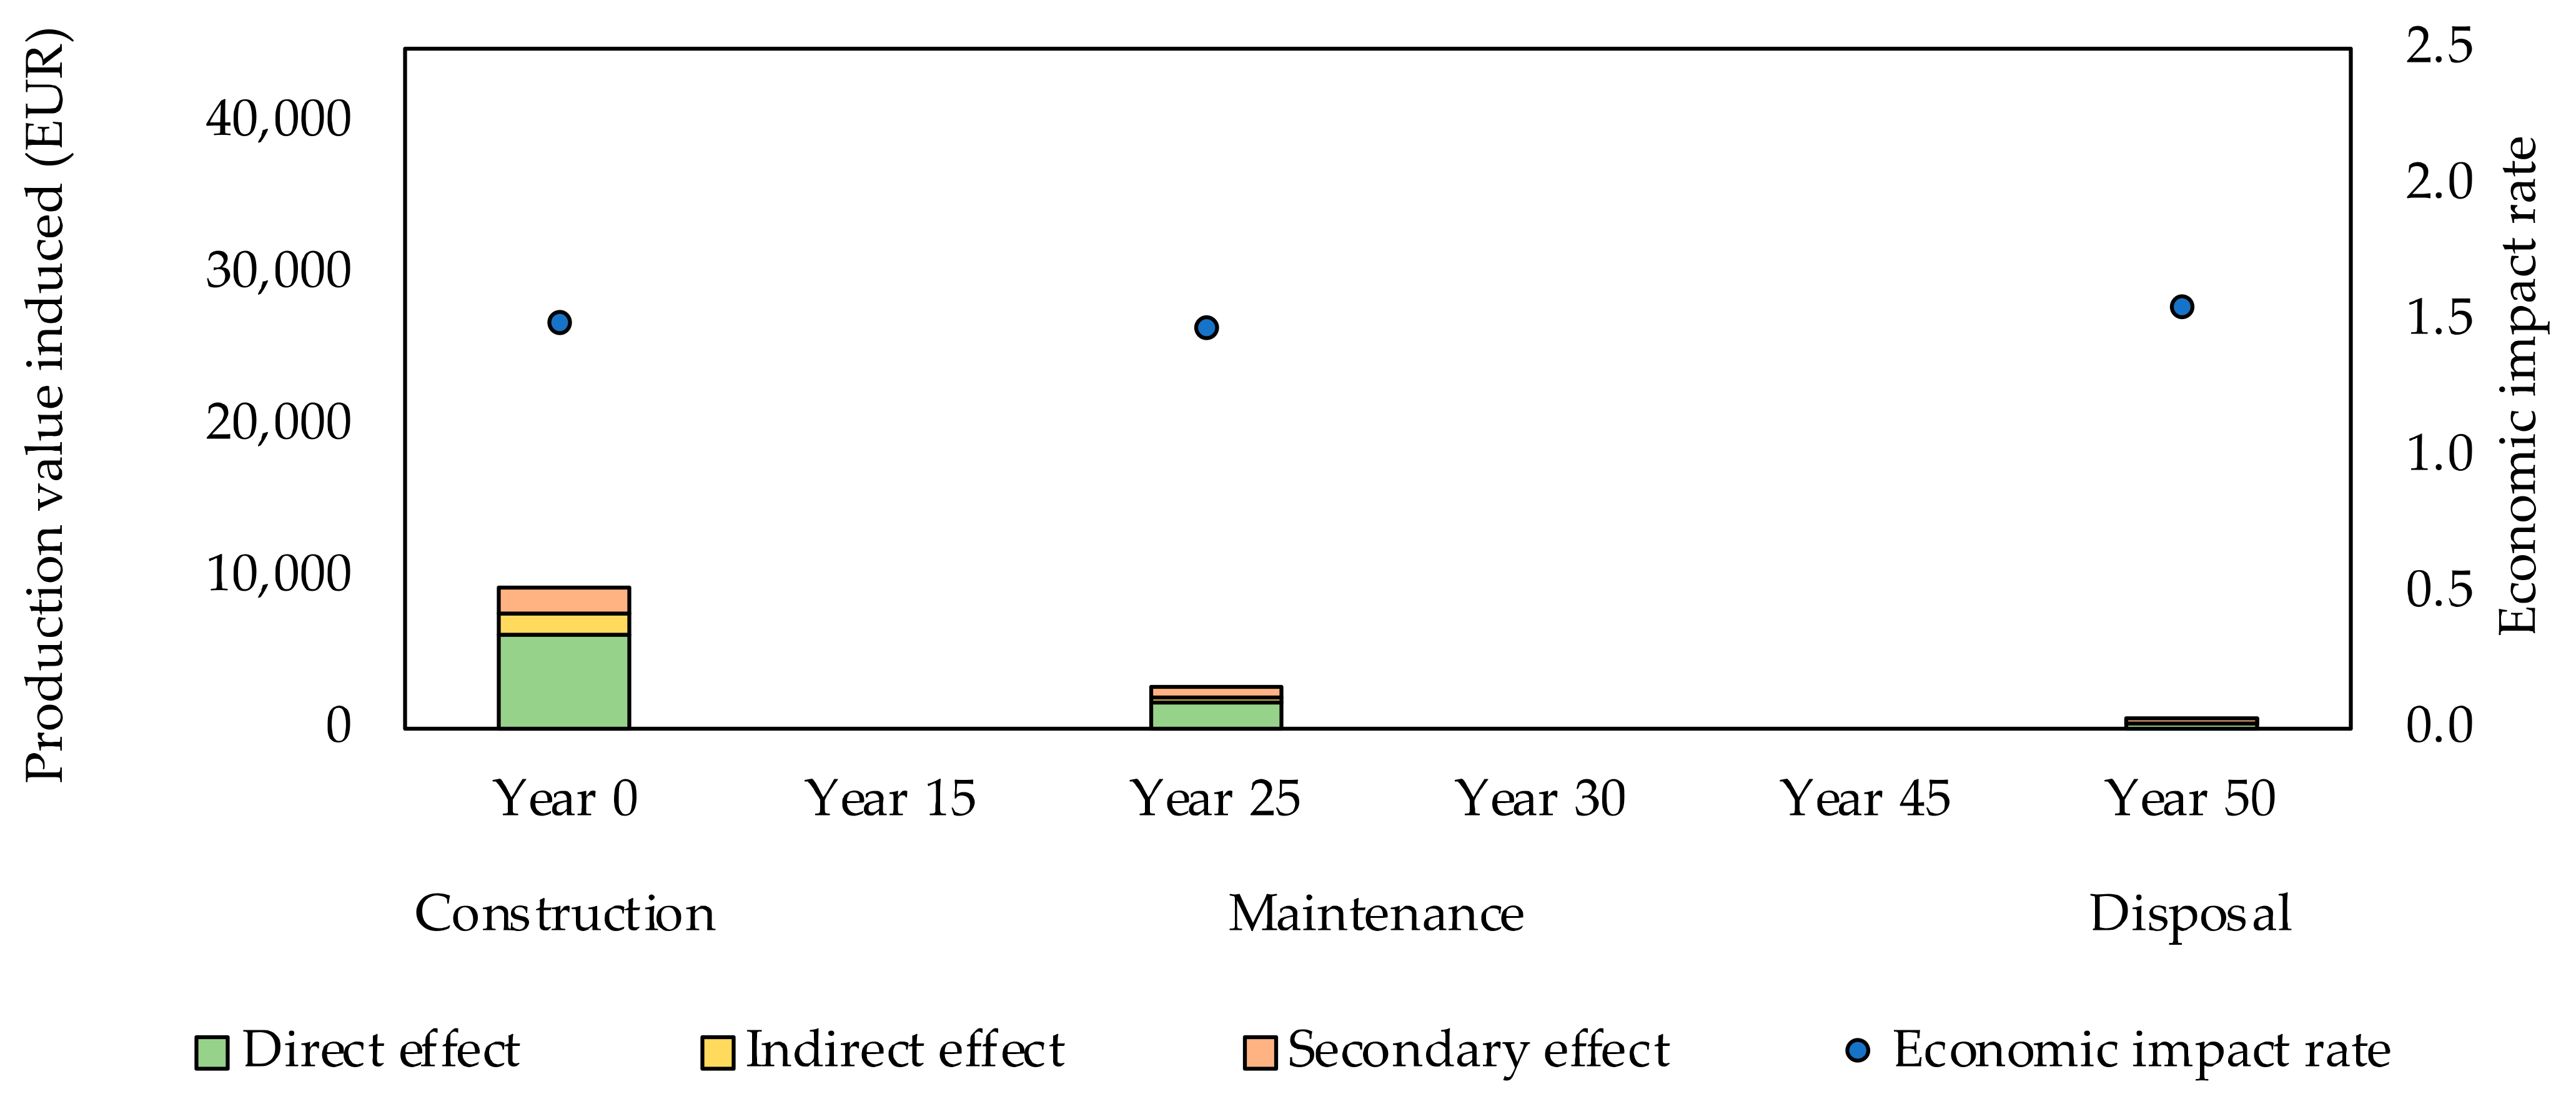
3.1.1. Regional Economic Impacts over the Life Cycle of the Three Floor Slabs

Figure 6, Figure 7, Figure 8, Figure 9, Figure 10, Figure 11, Figure 12, Figure 13, Figure 14, Figure 15 and Figure 16 show the results of the regional economic impacts and employment effects during the life cycle of the three floor slabs, the top-five sectors’ indirect effects in construction, and the top-five sectors’ indirect effects on maintenance, respectively. The results for USD are shown in Figure A1, Figure A2, Figure A3, Figure A4, Figure A5, Figure A6, Figure A7, Figure A8, Figure A9 and Figure A10. The results for EUR are shown in Figure A11, Figure A12, Figure A13, Figure A14, Figure A15, Figure A16, Figure A17, Figure A18, Figure A19 and Figure A20. In this study, 1 USD is assumed to be equal to 114 JPY and 1 EUR as 130 JPY.
In the life cycle of floor slabs, NWP CLT has a higher total final demand increase than WP CLT and RC, but the regional economic impact is the largest when compared with the economic impact rate (Figure 6, Figure 7, Figure 8 and Figure 9). First, the reason for the higher final demand increase for NWP CLT is discussed. The maintenance of NWP CLT involves the renewal of CLT, while WP CLT are maintained using waterproofing agents that are cheaper than the renewal of the CLT. The maintenance cycle of RC is longer and less expensive than that of CLT. Therefore, the final demand increase in NWP CLT is expected to be higher than that of WP CLT and RC. Next, the reasons for the higher economic impact rate of NWP CLT are discussed. In particular, NWP CLT has the highest rate of indirect effect on the total effect in the life cycle (43% for NWP CLT, 28% for WP CLT, and 14% for RC) among the three floor slabs. This is thought to be because NWP CLT has increased the demand for CLT production not only in construction but also in maintenance, which has had a significant economic impact on the forestry and wood industries. In the case of WP CLT, where no renewal of CLT is performed for maintenance, the life cycle economic impact rate is slightly higher than that of RC.
As shown in Figure 11, Figure 12 and Figure 13, in construction, both WP CLT and NWP CLT show economic impacts on the plywood and glued laminated timber sector and logs sector. However, in maintenance, as there is no renewal of CLT in WP CLT, the economic impacts on these sectors are not shown in the top rank (Figure 14 and Figure 15). In construction, NWP CLT also has a large impact on the silviculture sector, which is further upstream than the logs sector, but this sector does not rank high in WP CLT. In contrast, because the maintenance methods for WP CLT and RC are waterproofing, chemical injection, and crack repair, the indirect effect is that the purchase of these materials has an economic impact on sectors such as commerce and self-transport (Figure 15 and Figure 16). In the case of WP CLT, the purchase of waterproofing agents, which are not produced in the prefecture, results in the outflow of certain goods to other prefectures or countries; therefore, the economic impact is not significant. NWP CLT also has a significant economic impact on the upstream industries of CLT production, such as the logs sector and silviculture sector. Therefore, the production of CLT in the prefecture and the implementation of public works projects will have a significant economic impact on the regional economy, particularly in the forestry and wood industries of the prefecture.
In contrast, the cement and cement products sector, which includes the production of concrete, the main material for RC, accounts for 35% of the indirect effect, but the miscellaneous mining industry sector, which is the upstream industry of cement and cement products, does not appear in the top-five sectors. The steel products sector, which includes the manufacture of rebar, one of the main materials for RC, also does not appear in the top-five sectors. In other words, compared to the production of RC, the production of CLT is likely to ripple goods to various industries, including upstream industries.
As the employment effect increases according to the magnitude of the direct effect, the former is the largest for WP CLT in construction, NWP CLT in maintenance, and WP CLT and NWP CLT in disposal (Figure 10). However, the employment effect on the direct effect (cost) is the largest for RC (9.85 × 10⁻⁸ person/JPY for NWP CLT, 10.06 × 10⁻⁸ person/JPY for WP CLT, and 11.19 × 10⁻⁸ person/JPY for RC). Even if the employment effect occurs in areas with a rapidly declining population, such as Akita Prefecture, the industry will not be able to maintain itself in the future as many employees leave the working population [44], and there is a possibility that the working population will not be sufficient to compensate for the employment effect. In other words, the results show that CLT could be a more advantageous material than concrete in terms of labor, although the employment effect on the cost is smaller.
The decrease in NWP CLT from year 15 to year 45 of maintenance is 8%, while the total effect of WP CLT is increasing. In particular, the reduction rate of the indirect effect of NWP CLT (16%) is large. It should be noted that the larger reduction rate in the total effect and indirect effect of NWP CLT is influenced by the assumptions of the future estimation of this study in the primary and secondary industries in the prefecture, which include forestry and wood industries (see Section 2.4).
In the case of floor slab disposal 50 years after construction, there is little difference in the total effect of the three floor slabs. In this study, only the disposal of floor slabs by the waste management service sector was considered. However, in CLT floor slabs, disposed CLT can be reused as fuel, and in RC, concrete can be reused as recycled aggregate, and steel can be reused. As the number of biomass power generation and recycling facilities increases in the prefecture, an impact on the regional economy can be expected in the recycling sector. Therefore, it is a future issue to consider the regional economic impact after the floor slabs have been disposed of.

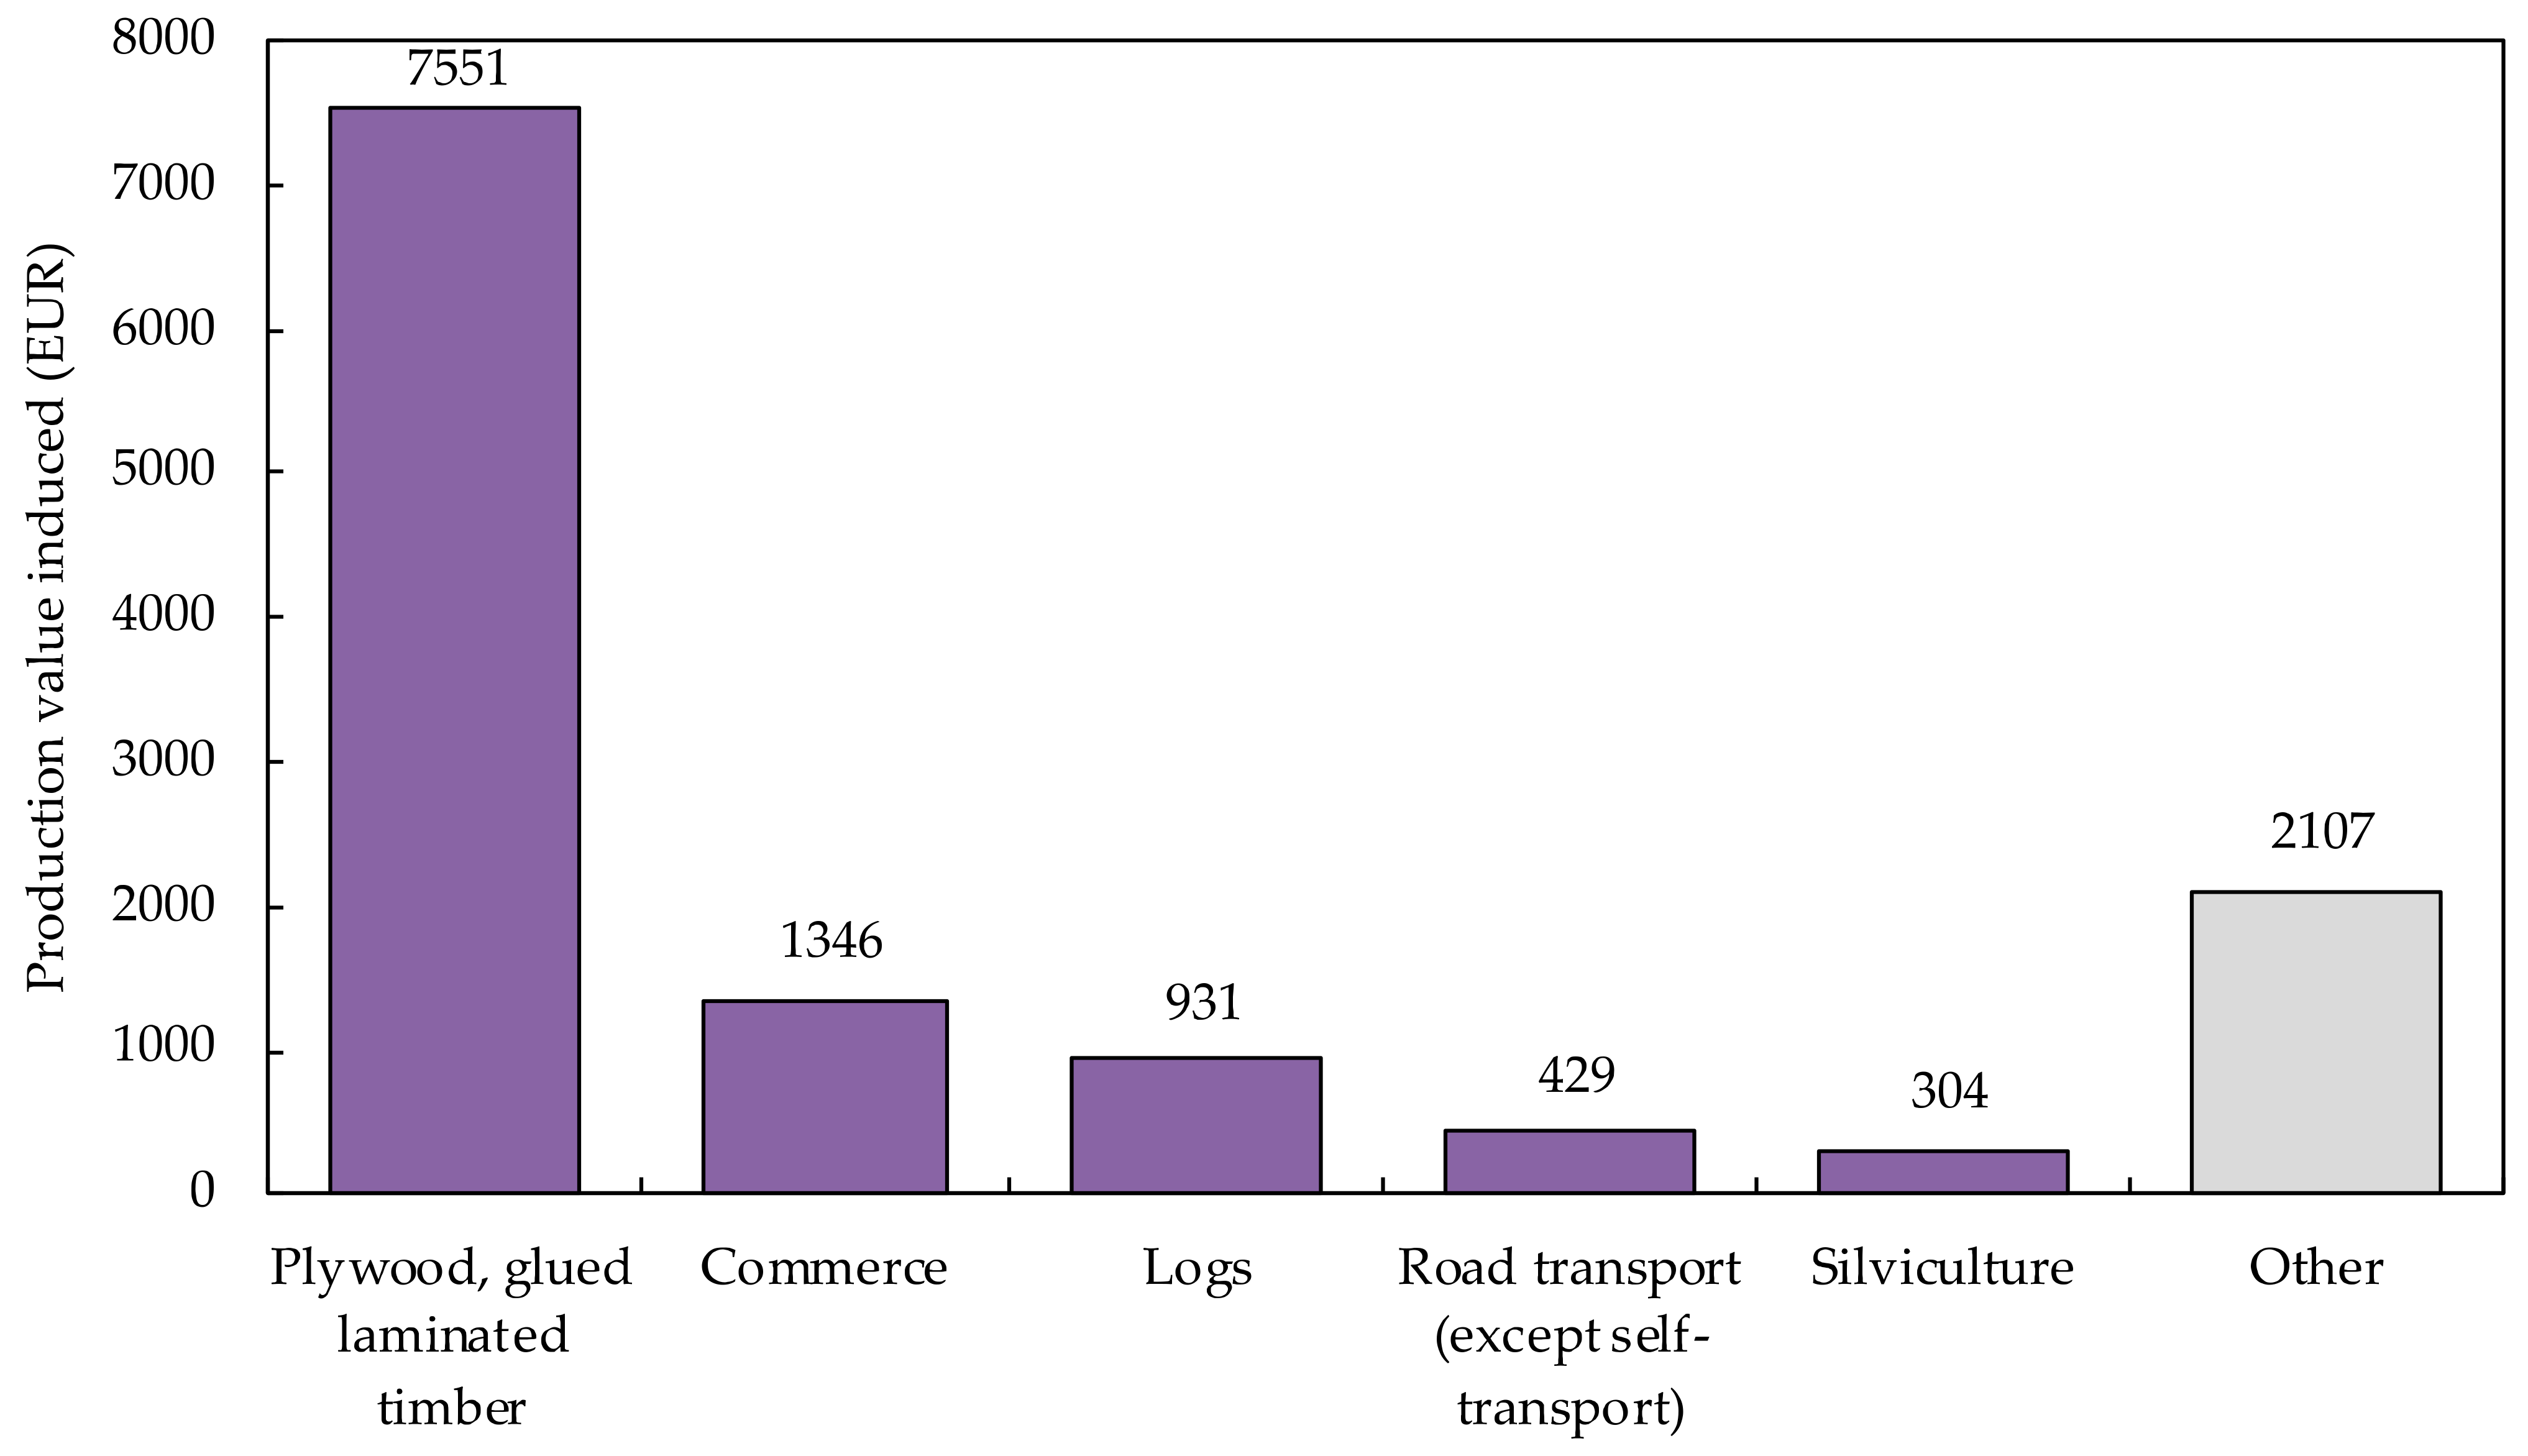
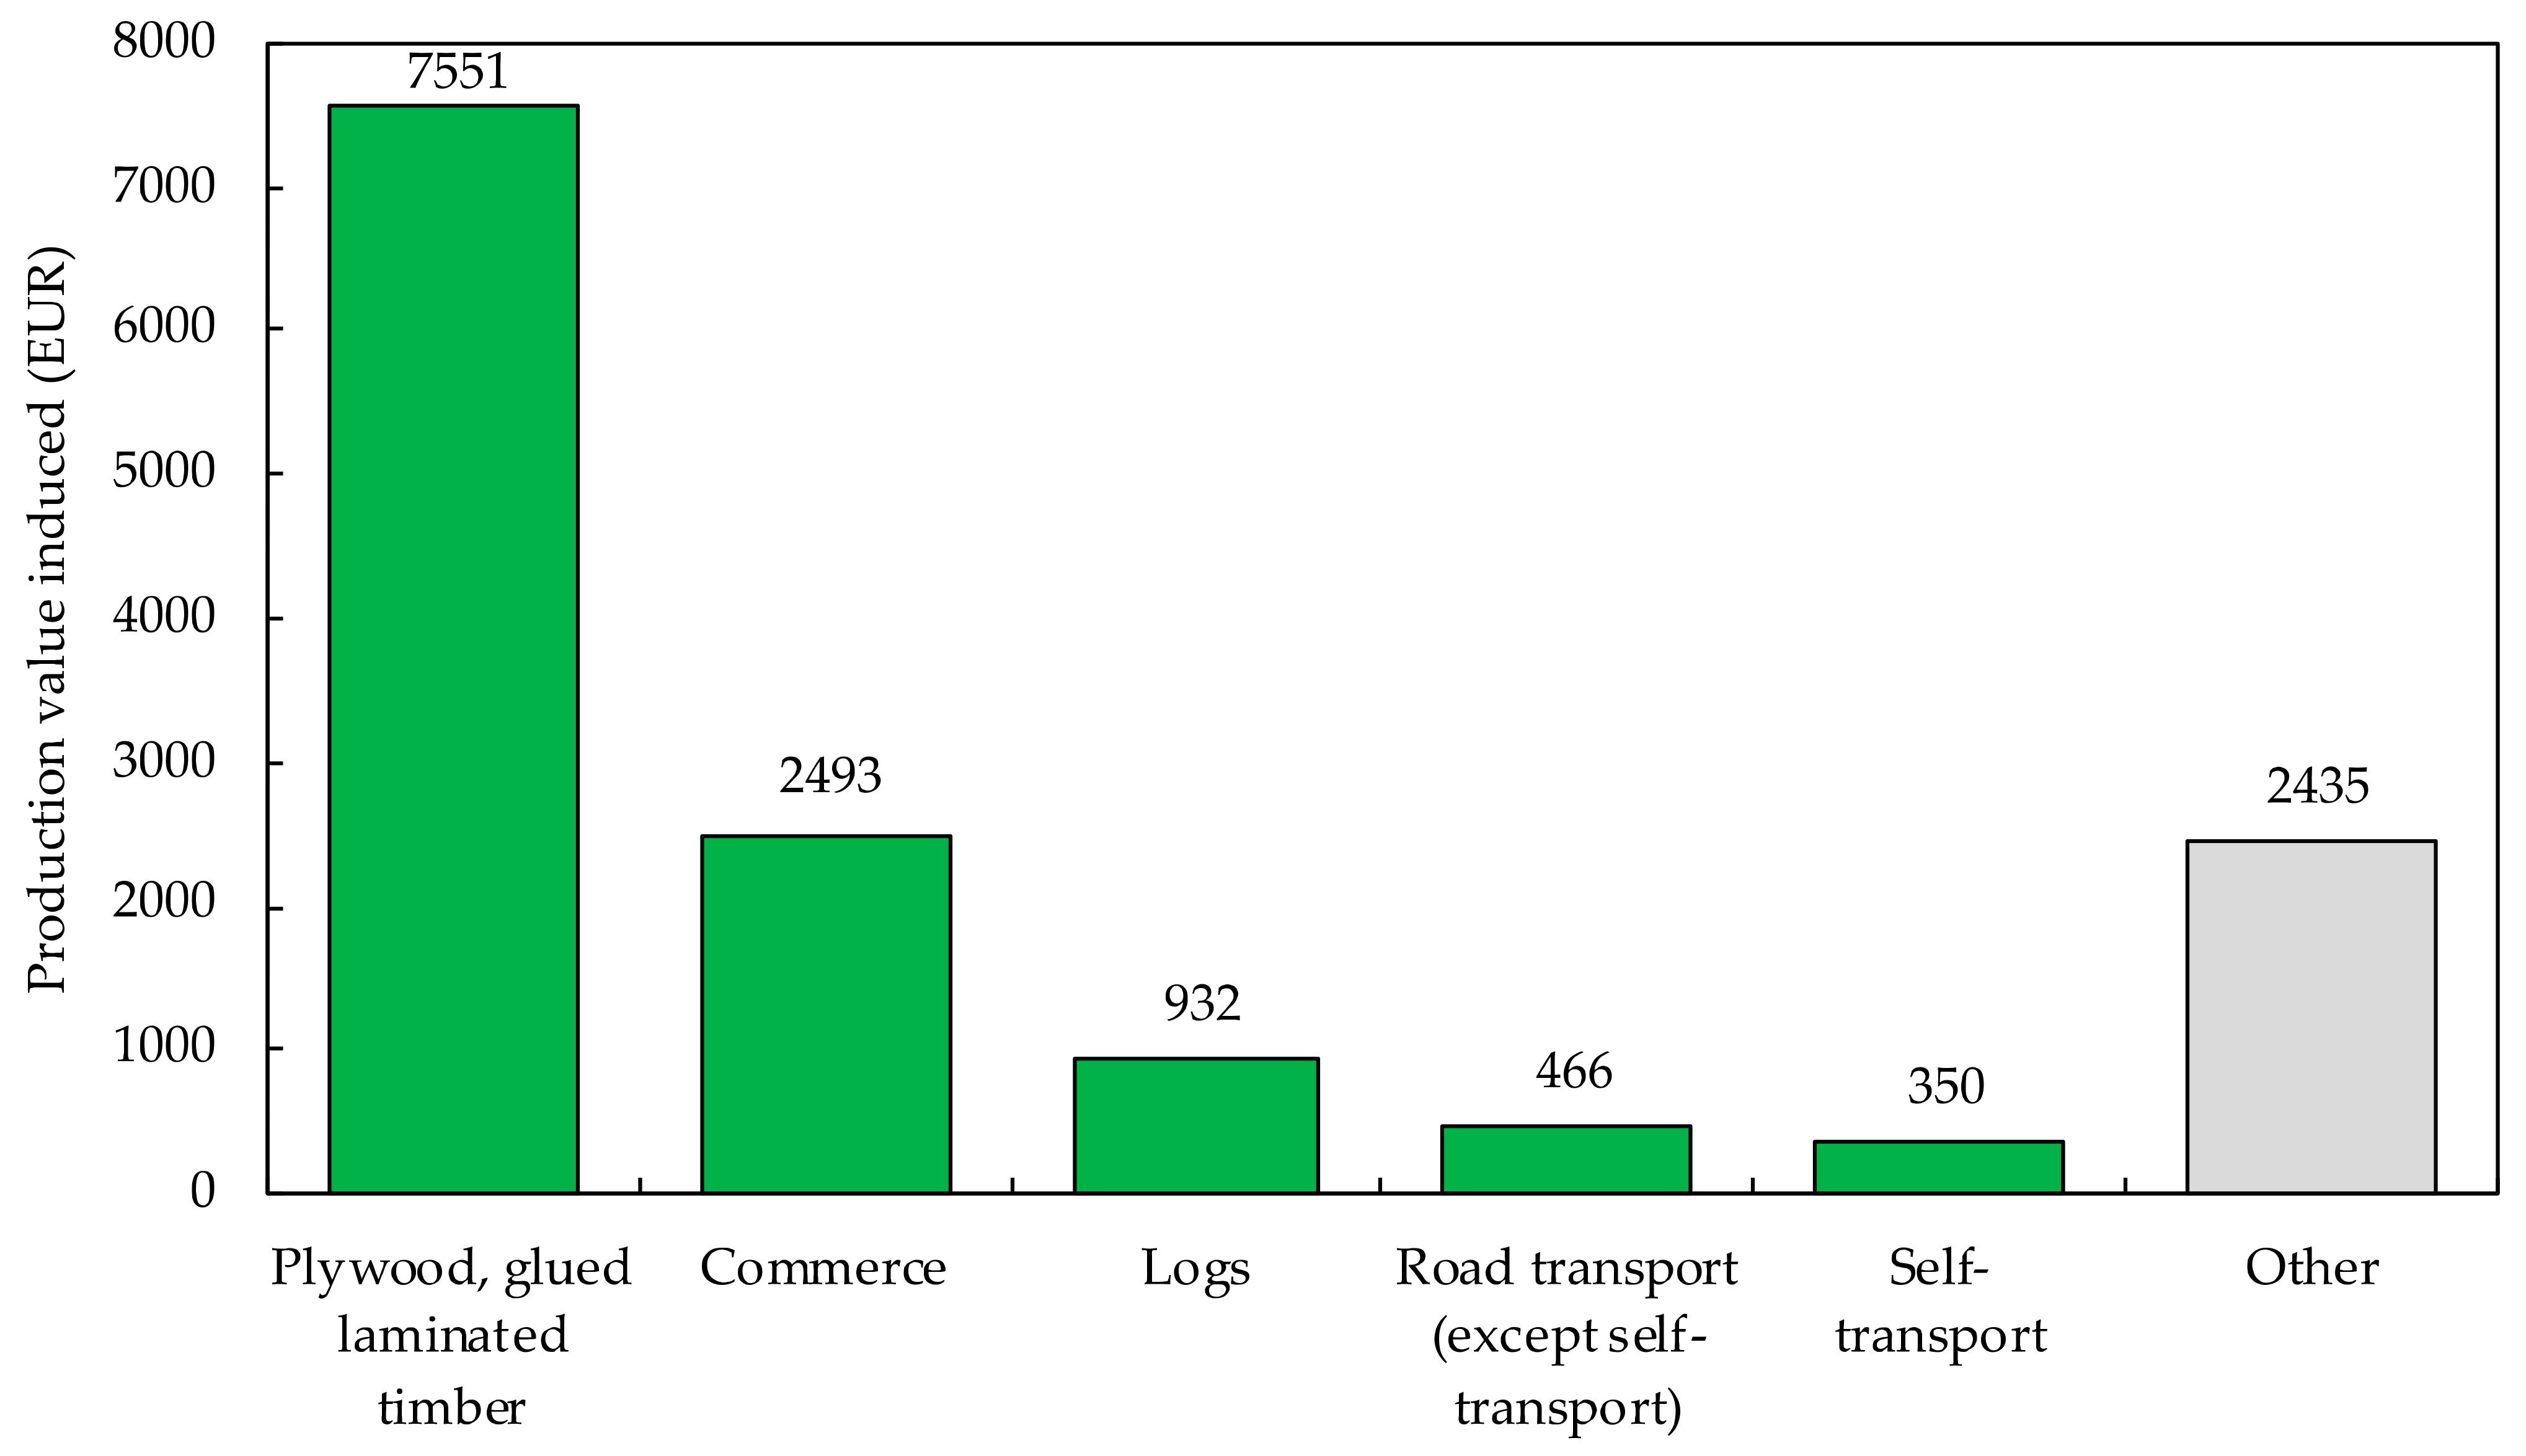
3.1.2. Net Regional Economic Impacts

The net regional economic impact over the life cycle of the project was examined, considering the regional economic impact lost in each floor slab. First, the total net effect was calculated by subtracting the total effect of WP CLT and RC in their respective life cycles from the total effect of NWP CLT in its life cycle. From Figure 6, the total effect of NWP CLT is 13,816,130 JPY, and the total effect of WP CLT is 9,493,620 JPY; thus, the total net effect of replacing WP CLT with NWP CLT is 4,322,510 JPY. The total net effect of replacing RC with NWP CLT is 12,214,773 JPY from 1,599,126 JPY. If WP CLT or RC is replaced with NWP CLT, the total net effect over the life cycle will be positive. Therefore, it shows that repairing and maintaining floor slabs made of NWP CLT would have a significant regional economic impact.
Focusing on the indirect effect, the net indirect effect of replacing WP CLT with NWP CLT was calculated by subtracting the indirect effects of each sector of WP CLT from the indirect effects of each sector of NWP CLT. The results are shown in Table 1 as a net benefit for positive values and net loss for negative values. The results for USD are shown in Table A1. The results for EUR are shown in Table A4. The larger loss in the commerce sector can be attributed to the high commercial margin rate (35%) in the final chemical products (except medicaments) sector, which produces waterproofing materials used in WP CLT and has a greater impact on the commerce sector. However, the total value of the top-five net benefit sectors is 3,119,354 JPY, which is higher than the total value of net loss of 158,143 JPY. In particular, the net benefit to wood industries, such as the plywood and glued laminated timber sector and logs sector, is significant. Thus, the net loss is offset by the net benefit.
The net indirect effect of replacing RC with NWP CLT was calculated by subtracting the indirect effect of each sector of RC from the indirect effect of each sector of NWP CLT. The results are shown in Table 2 as a net benefit for positive values and net loss for negative values. The results for USD are shown in Table A2. The results for EUR are shown in Table A5. Because concrete is not used in NWP CLT, if RC is replaced by NWP CLT, there will be significant losses in the sector of cement and cement products, which includes the production of concrete. However, as in the case of WP CLT, the net loss is offset by net benefits in the plywood and glued laminated timber sector and logs sector (total net benefit of the top-five sectors: 3,119,354 JPY).
In other words, when WP CLT or RC is replaced by NWP CLT, the regional economic impact over the life cycle will be negative for certain industrial sectors. However, the net benefits to industries, such as the plywood and glued laminated timber sector and logs sector, offset the net losses, resulting in a net positive economic impact.

3.2. Sensitivity Analysis

3.2.1. Effect of Different Maintenance Cycles

In this study, the maintenance cycle was set by interviewing the contractor. However, there is an element of uncertainty in this setting. Therefore, we conducted a sensitivity analysis to examine the effect of different maintenance cycles on the results.
Table 3 shows the results of the regional economic impacts during the life cycle of the three floor slabs when the maintenance cycle is extended or shortened by five years. The results for USD are shown in Table A3. The results for EUR are shown in Table A6. The magnitude of the total effect is different because the direct effect increased or decreased owing to the different maintenance costs caused by the different maintenance cycles. However, there is little difference in the rates of direct, indirect, and secondary effects on the total effect. Therefore, as there is no significant change in the economic impact rate, the change in the maintenance cycle is not expected to have a significant impact on the results of regional economic impacts.

3.2.2. Effect of Changes in the Prefecture’s Self-Sufficiency Rate of CLT

The CLT targeted in this study is produced in Akita Prefecture—from the production of logs to the processing of lamina to the production of CLT. However, depending on future conditions, it is possible that logs and lamina may be transferred from other prefectures. In addition, there are regional differences in the production of CLT in Japan, and, in some areas, CLT is sourced from other prefectures. Therefore, we conducted a sensitivity analysis of the prefecture’s self-sufficiency rate of CLT. The prefecture’s self-sufficiency rate of CLT was varied from 0% to 100% to evaluate its effect on the regional economic impact. (The production of CLT falls under the plywood and glued laminated timber sector in the Input–Output table.) The results are shown in Figure 17. Since the direct effects in the life cycle vary among NWP CLT, WP CLT, and RC, it was decided to compare them in terms of economic impact rate. The slope of the graph for the NWP CLT is steeper because CLT is demanded not only in construction but also in maintenance, and the slope of the graph for the WP CLT is lower because CLT is demanded only in construction. For RC, the demand for CLT does not occur during the entire life cycle, so the economic impact rate is constant.
Because the CLT cost of NWP CLT accounts for a high percentage of the final demand increase (54% for construction and 63% for maintenance), a decrease in the prefecture’s self-sufficiency rate of CLT production will result in a large decrease in the economic impact rate. Therefore, when the self-sufficiency rate falls below 17%, NWP CLT has a smaller regional economic impact than WP CLT. The economic impact rate of NWP CLT is smaller than that of RC when the self-sufficiency rate is less than 31%. WP CLT is smaller than RC when the prefecture’s self-sufficiency rate is less than 60%. If the self-sufficiency rate of CLT becomes low, the regional economic impact will be smaller than that of RC. Therefore, the use of CLT produced in the prefecture will contribute not only to forestry and wood industries but also to the revitalization of the prefecture’s economy. However, when CLT produced in other prefectures is used, there is a large outflow of goods outside the prefecture, and the same use of timber cannot be said to revitalize the economy of the prefecture. In this study, the prefecture’s self-sufficiency rate was assumed to be constant in the future. However, if the supply of CLT in the prefecture declines in the future, the regional economic impacts may be smaller than the estimated results.

3.3. Comparison with Previous Studies

Because the regional economic impact of CLT floor slabs was quantified for the first time in this study, there is no previous study with which the current results can be directly compared. Therefore, we decided to compare the results with those of previous studies on architecture and other civil engineering structures. A previous study that compared the economic impact of framework construction with mass timber frames, including CLT and framework construction with concrete, showed that the construction cost with mass timber was higher, but the economic impact on the region was larger [26]. In addition, previous studies [24,25] that compared a timber check dam with a concrete check dam using lumber for the frame showed that the construction cost of the timber check dam is higher than that of the concrete check dam, but the economic impact on the regional economy is larger. These results are consistent with those of the present study. However, these previous studies did not quantify the regional economic impact over the life cycle. In this study, the economic impact resulting from using CLT for floor slab construction was greater than that resulting from using concrete. However, when the life cycle of the floor slabs is considered, from maintenance to disposal, the economic impact rate is comparable to that of RC when CLT is not used for maintenance (WP CLT). In contrast, when CLT is also used for maintenance (NWP CLT), the economic impact rate is higher than that of RC. In other words, by considering not only the construction but also the maintenance of CLT, the economic impact of the use of CLT will be larger.
Iwase et al. [23] reported that the cost of using CLT is higher than that of RC in the life cycle of floor slabs; however, this study shows that the regional economic impact is larger with CLT. It has also been shown that the regional economic impact of NWP CLT is significant. This is because, unlike WP CLT, NWP CLT increases the demand for CLT production not only in construction but also in maintenance. Comparing NWP CLT and RC, RC has a longer maintenance period and lower maintenance costs. However, both the net economic impact and the economic impact rate were smaller for RC in this study than for NWP CLT. In other words, the production of CLT in the prefecture and the increase in demand for CLT will involve many upstream industries in the forestry and wood industry, which will lead to the circulation of goods within the prefecture and the possibility of revitalizing the prefecture’s economy.

4. Conclusions

This study clarified the regional economic impacts of CLT floor slabs and RC floor slabs during their life cycle through construction, maintenance, and disposal in Akita Prefecture, Japan.
(1)
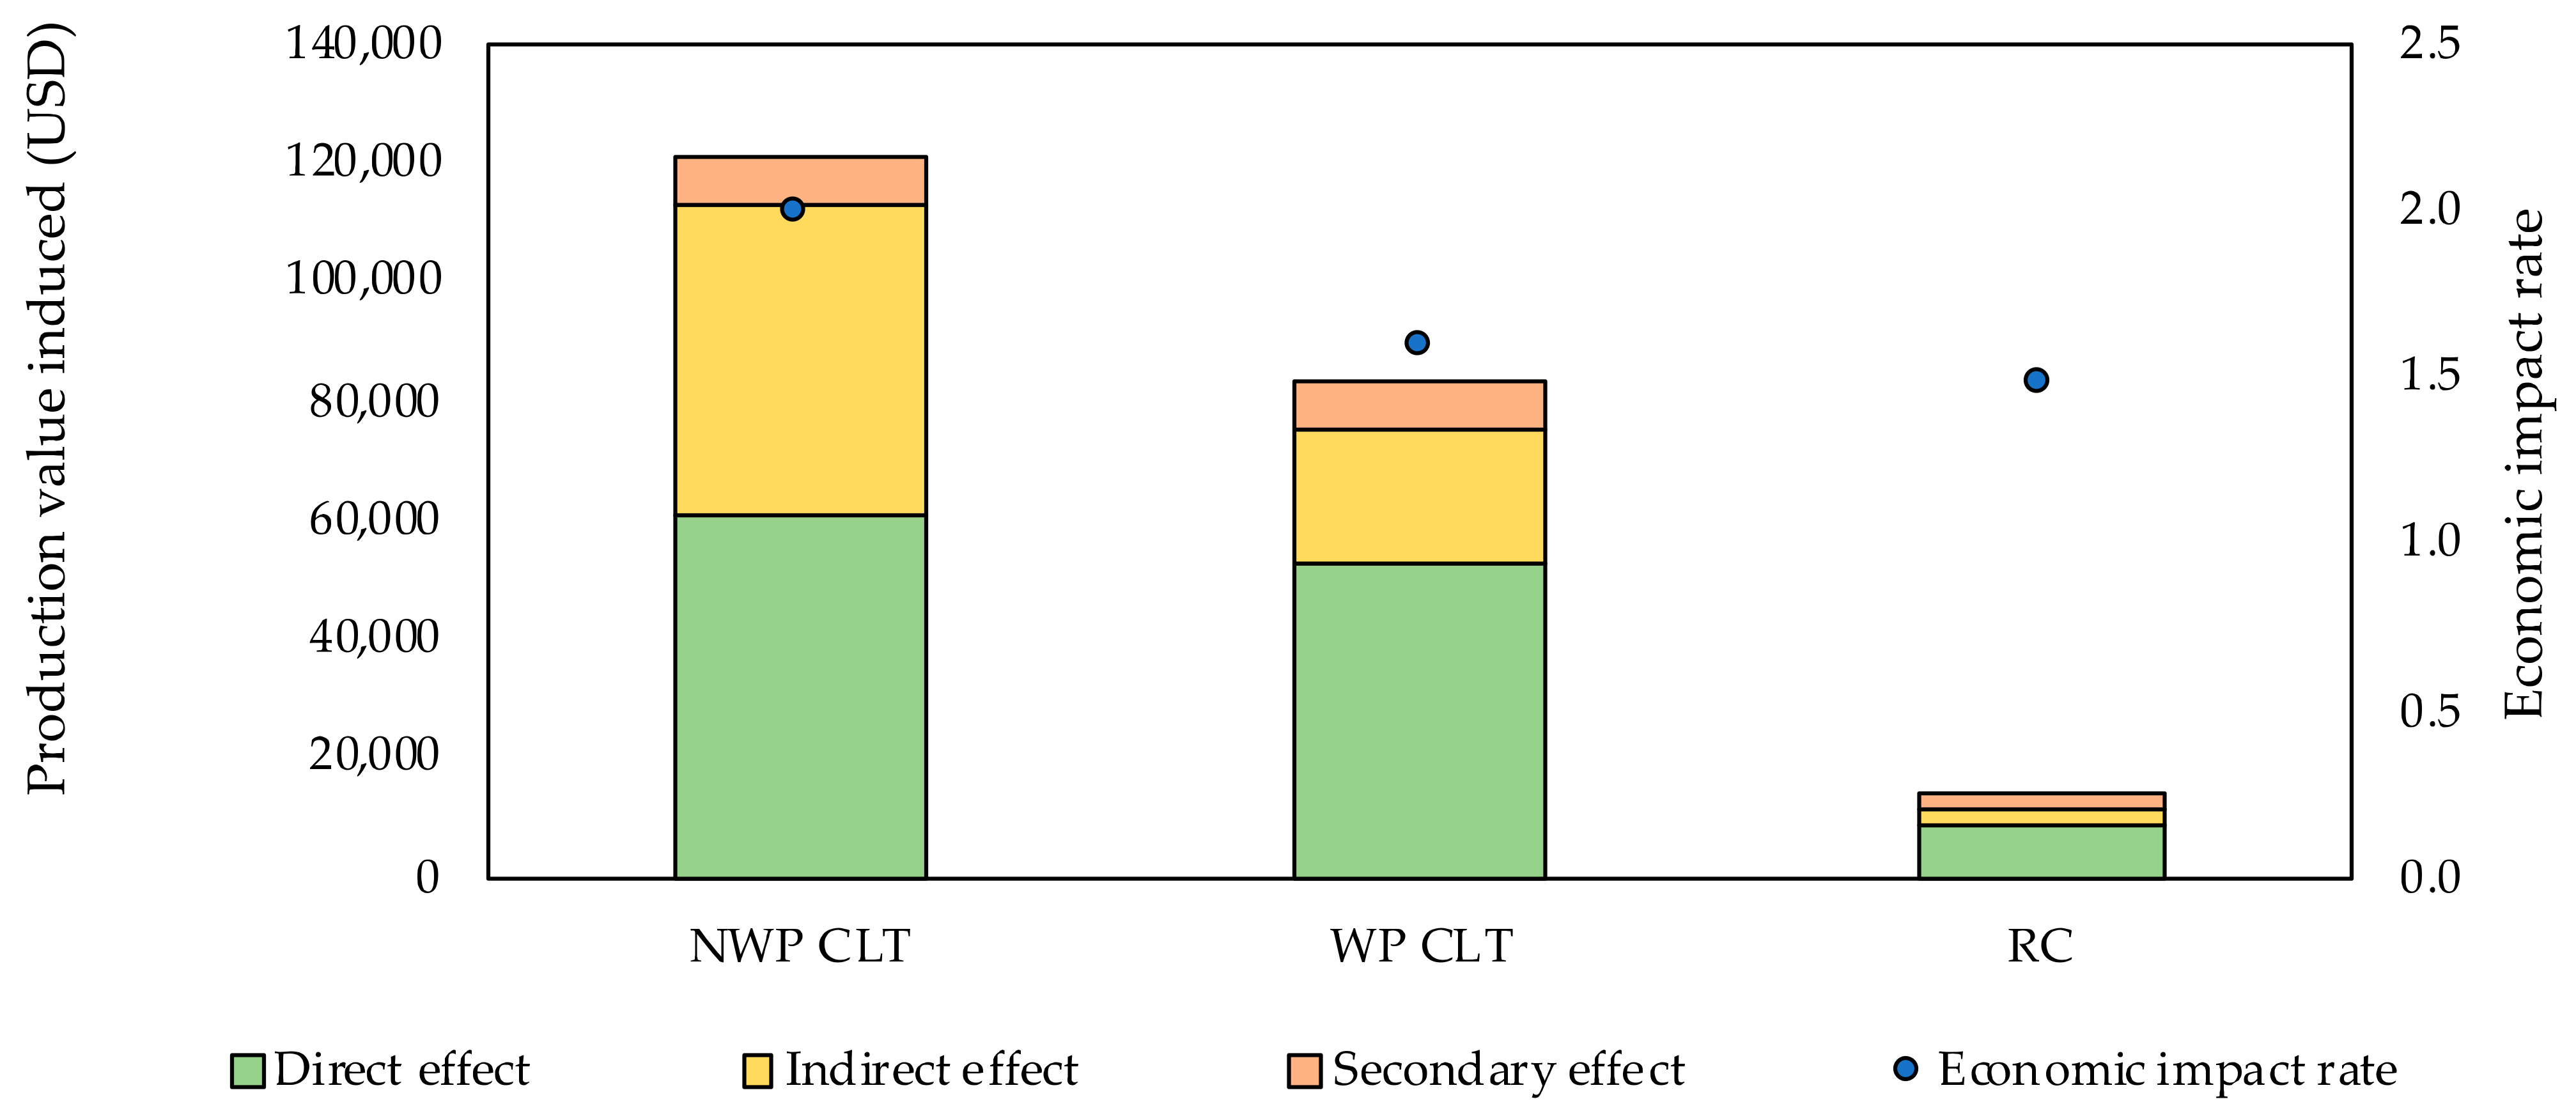
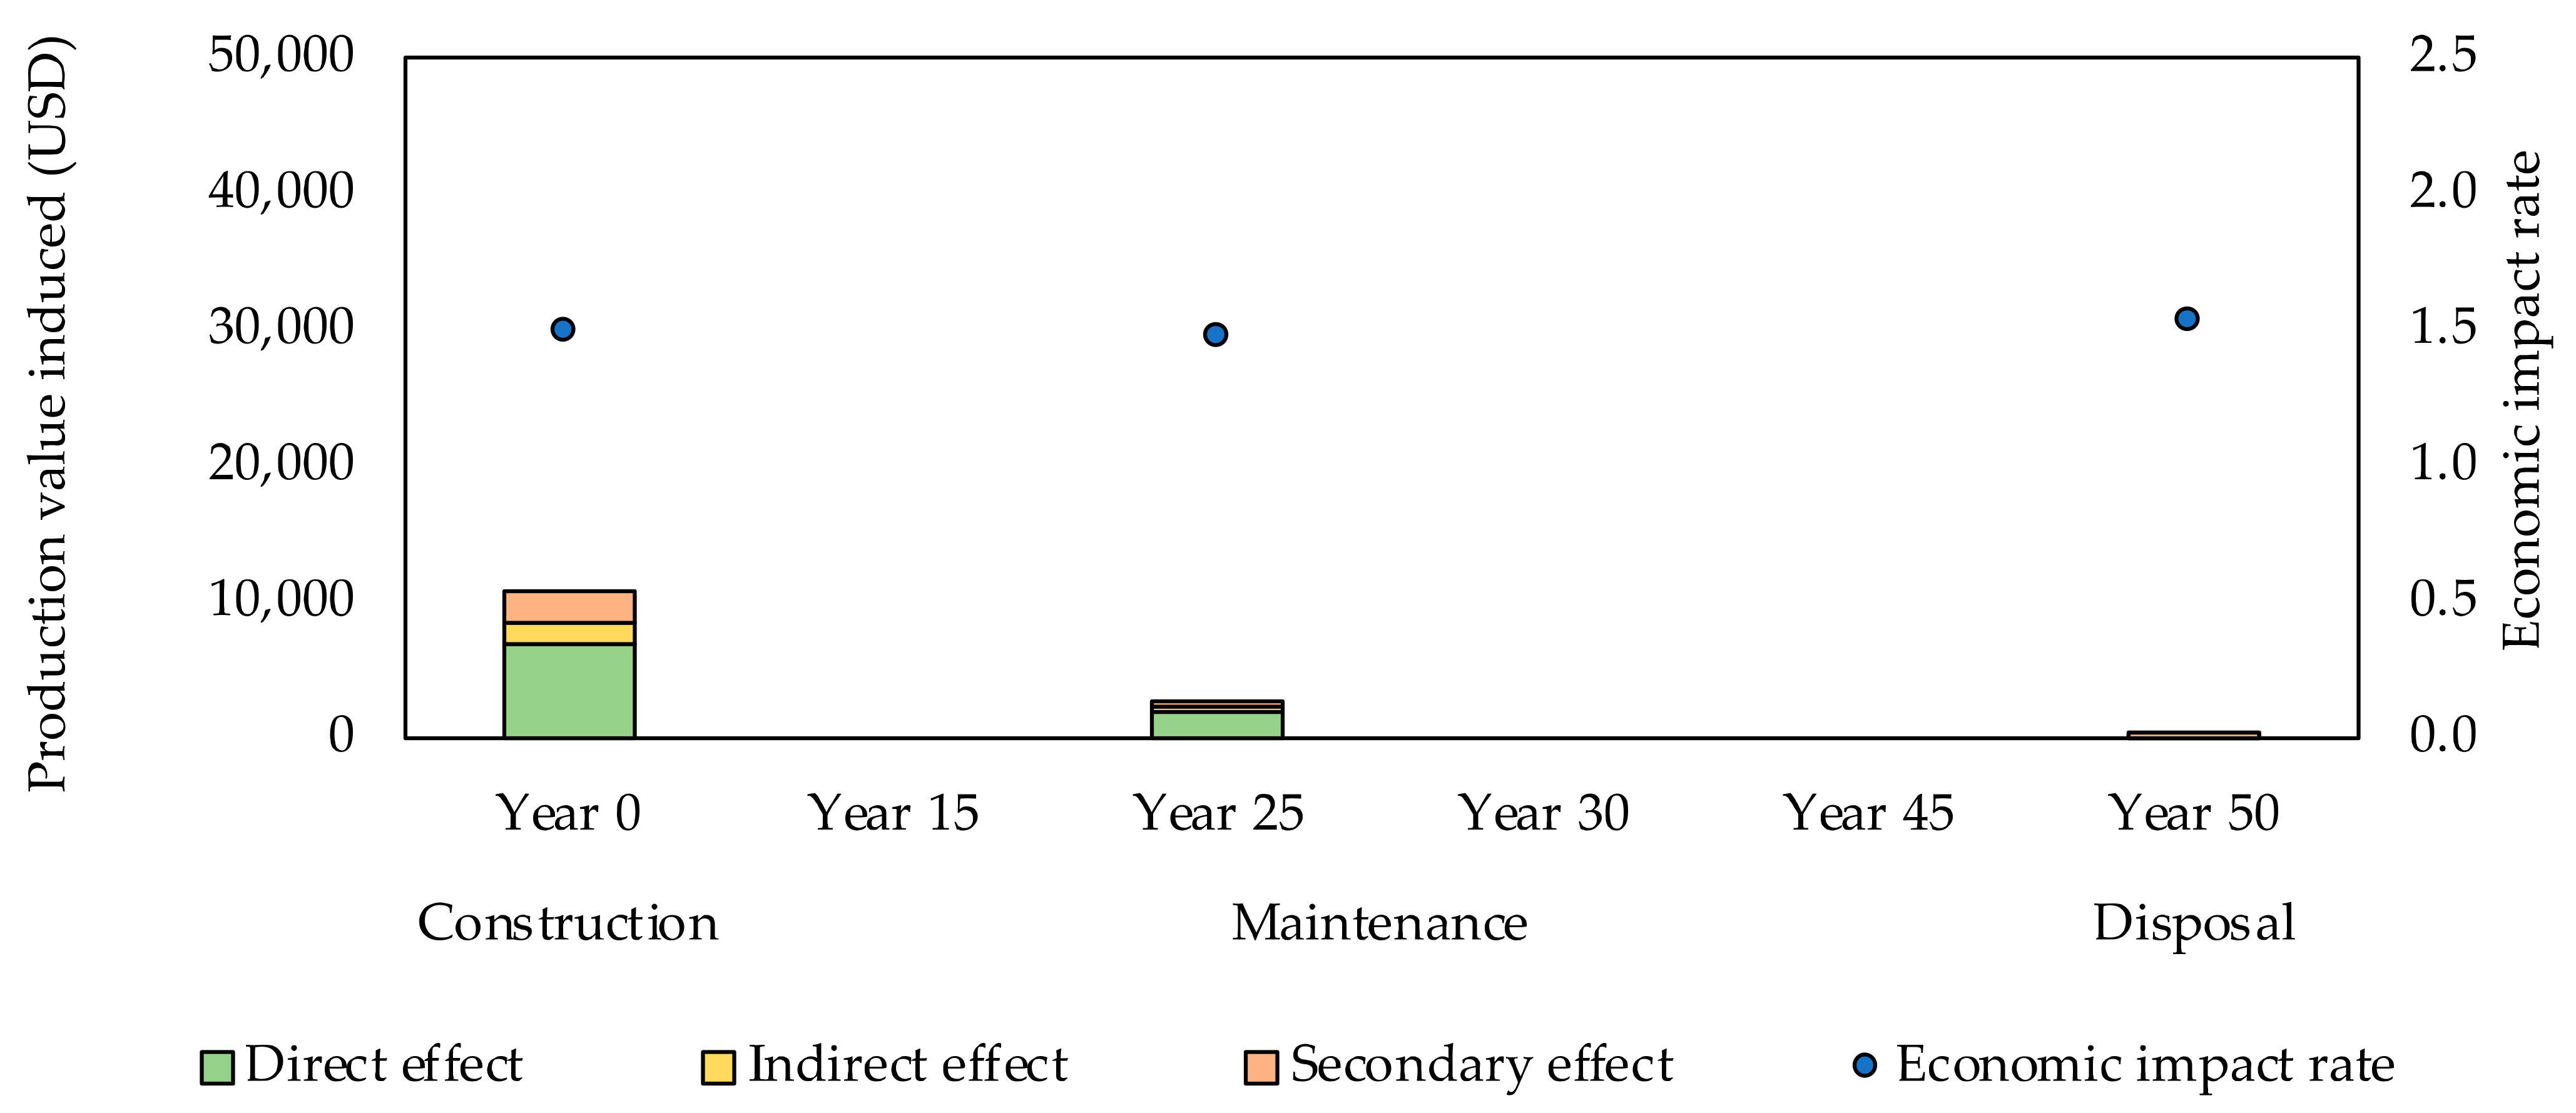
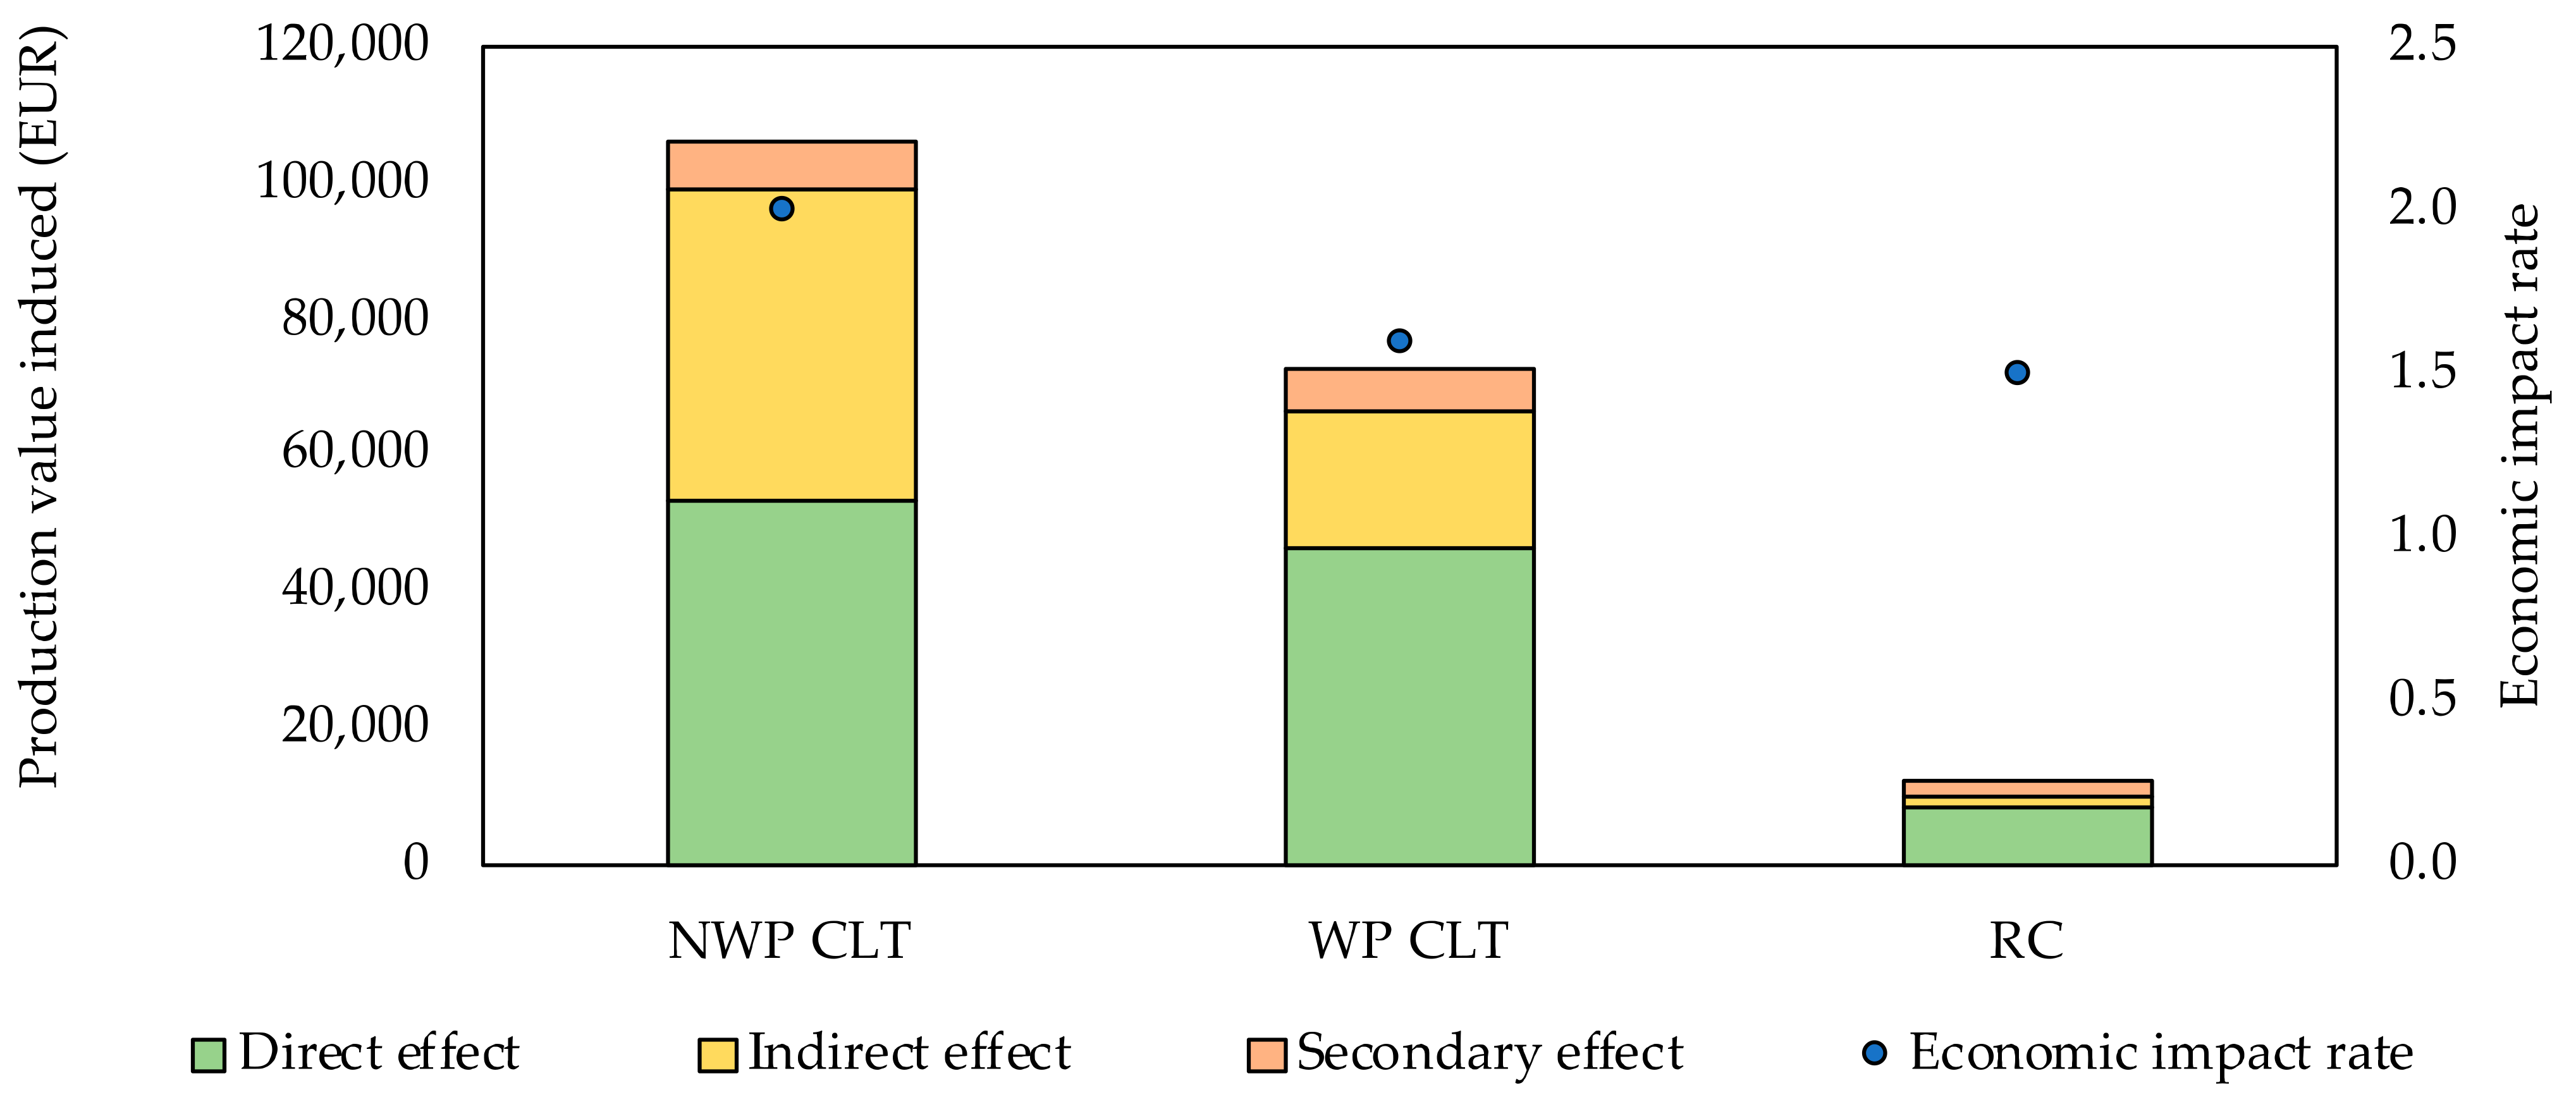
The regional economic impact of floor slab construction was larger for CLT than for RC. The construction and maintenance costs of RC are lower than those of CLT. However, the use of CLT also has a greater economic impact on upstream industries, indicating that its use has a more positive impact on the regional economy.
(2)
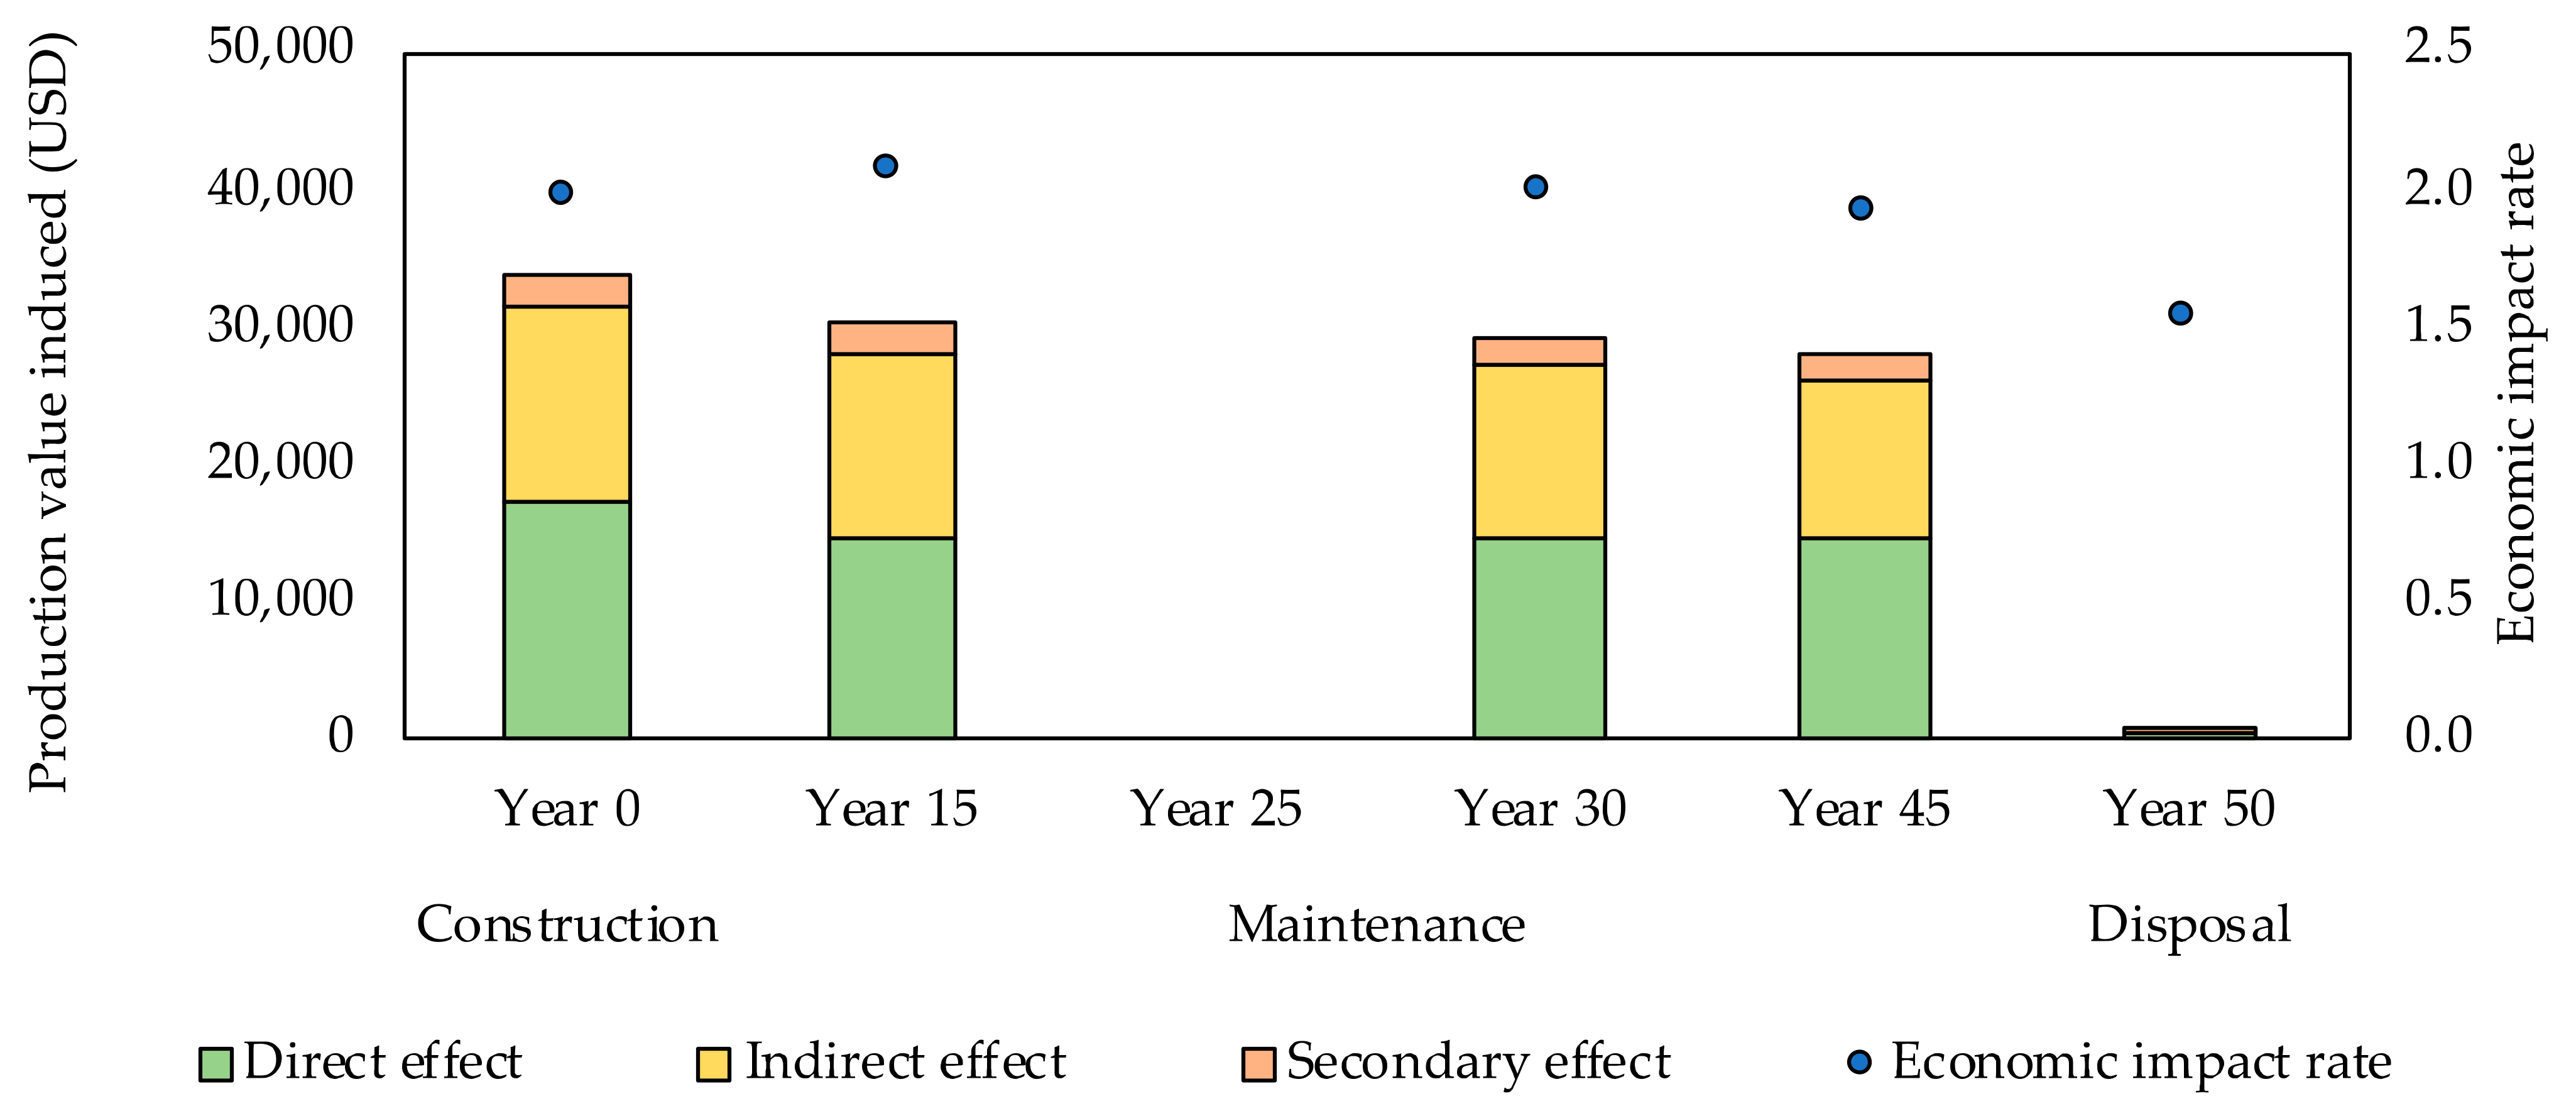
The largest economic impact rate over the life cycle of the floor slabs was observed for NWP CLT. Compared to WP CLT, NWP CLT increases the demand for CLT production during maintenance. Since CLT is more expensive than waterproofing agents, the maintenance cost of NWP CLT is higher than that of WP CLT. However, an increase in the demand for CLT should have a positive economic impact on upstream industries, thus increasing the regional economic impact.
(3)
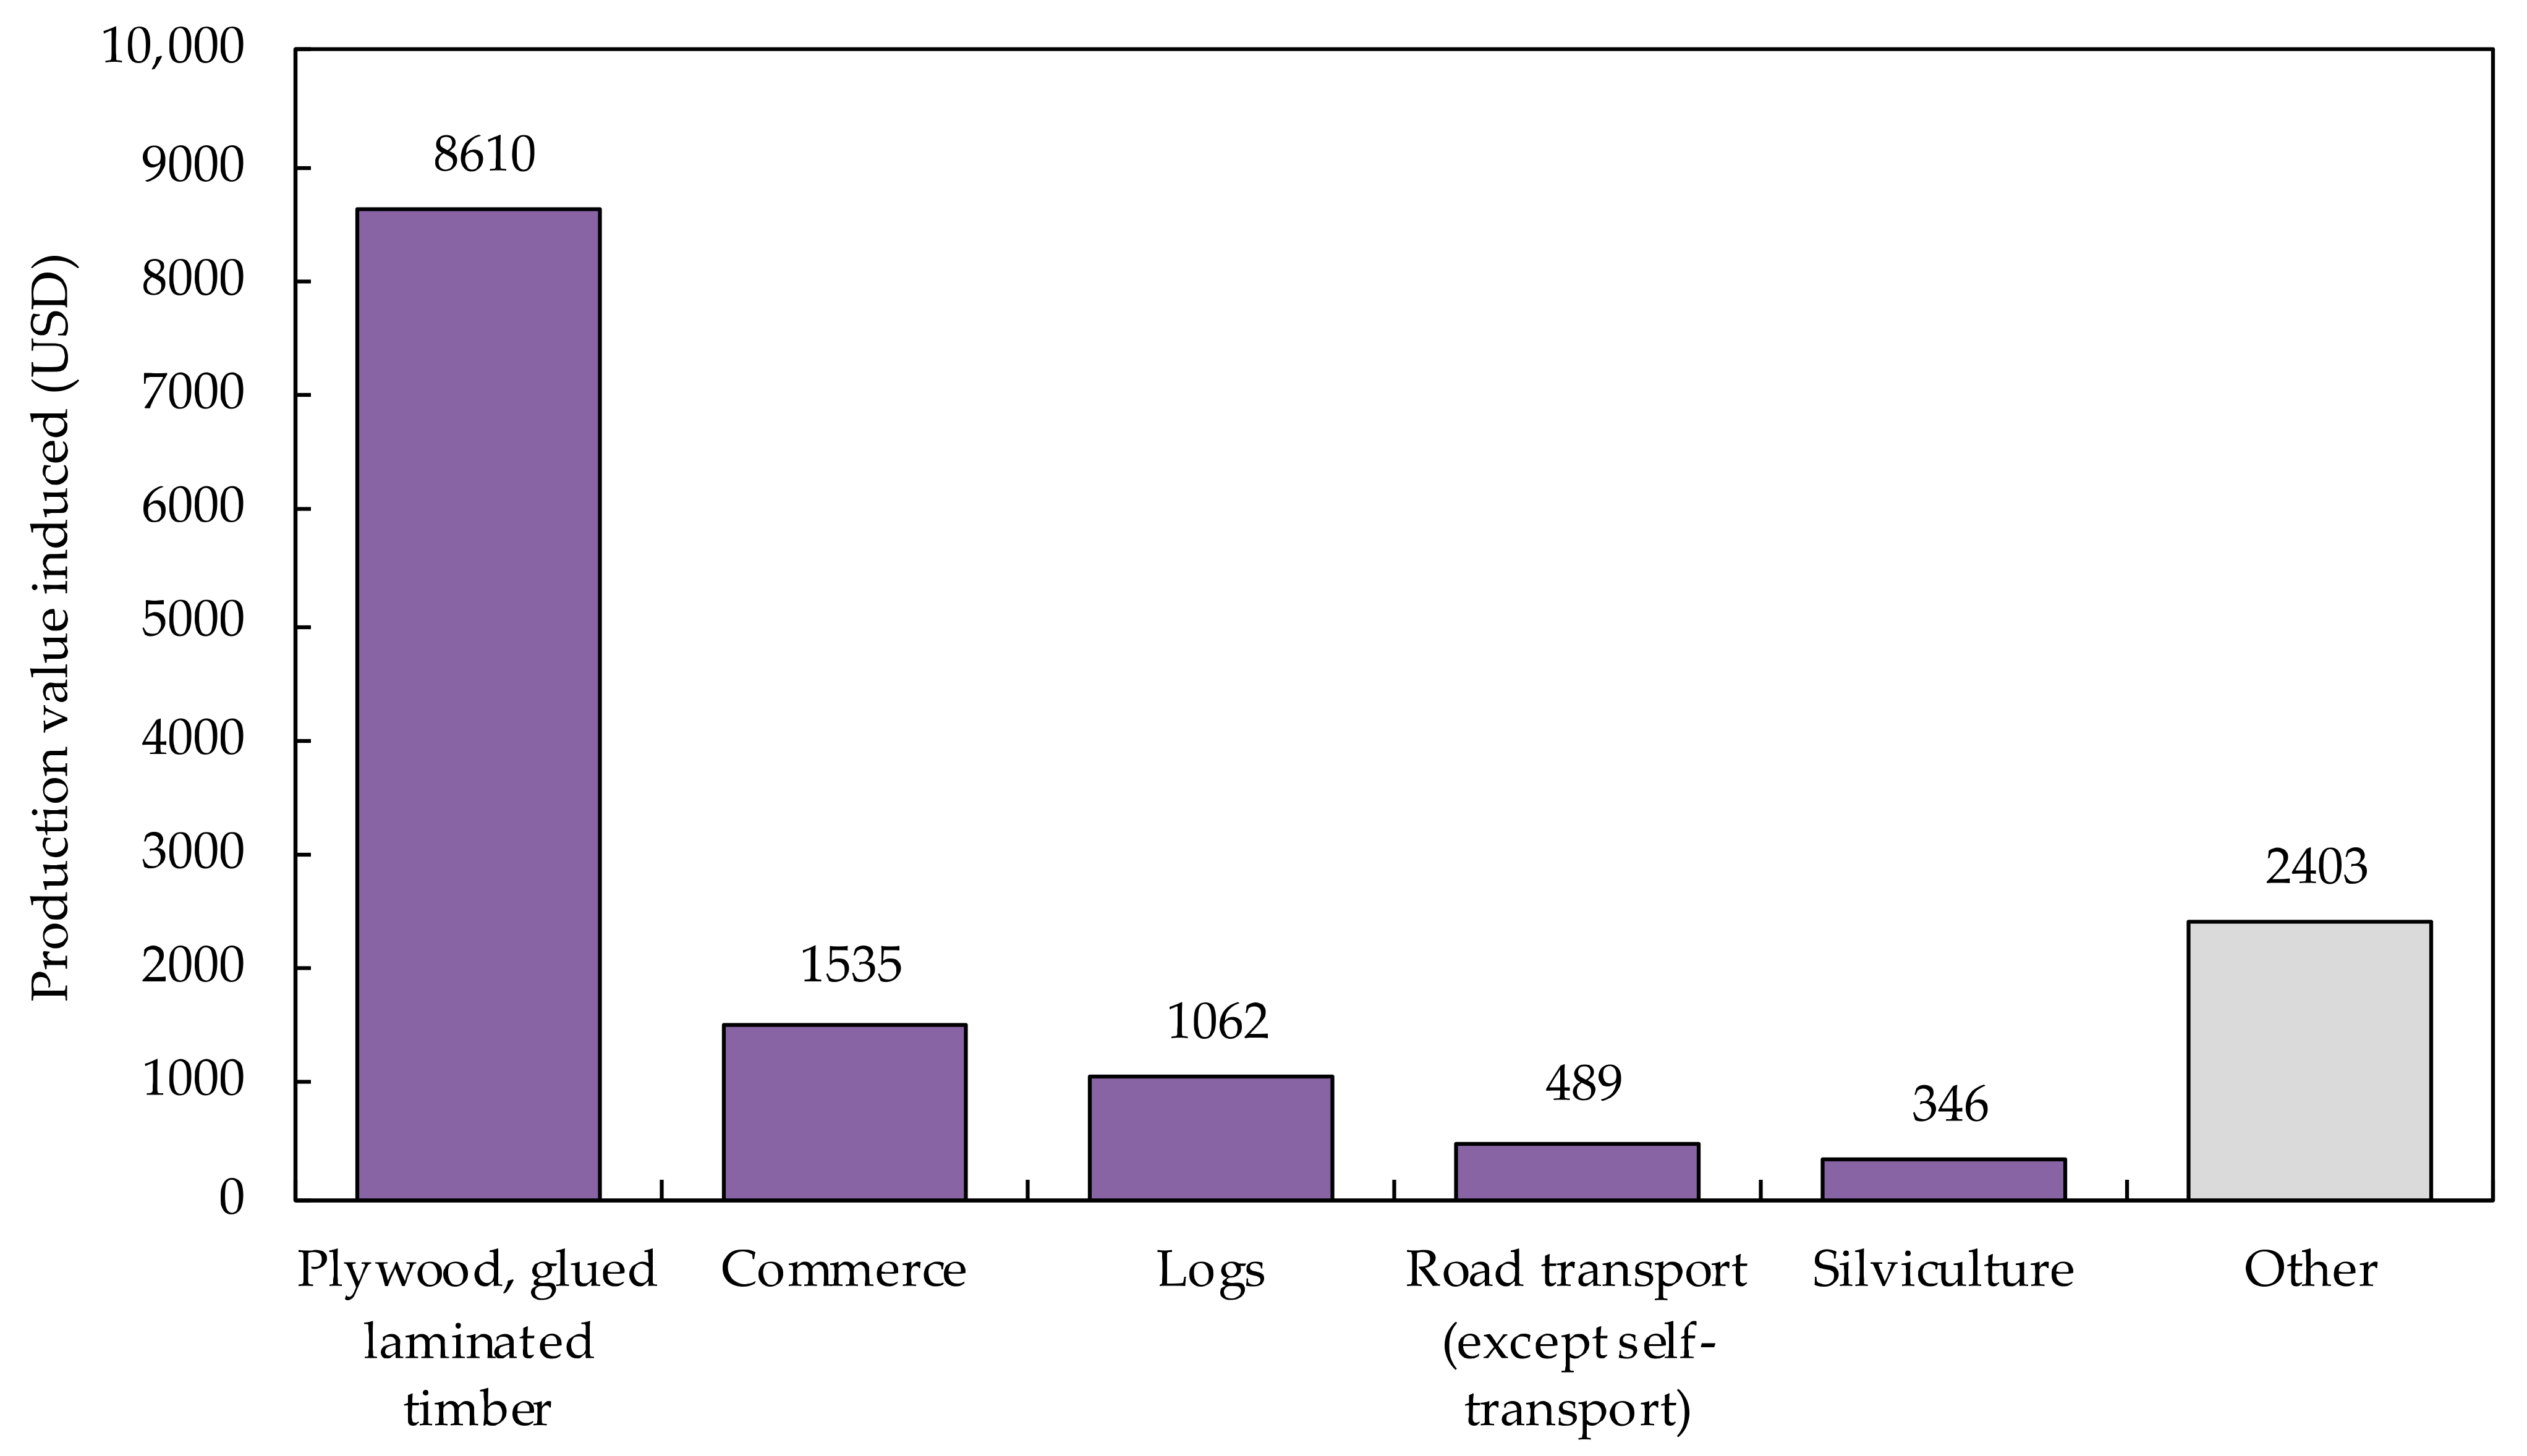
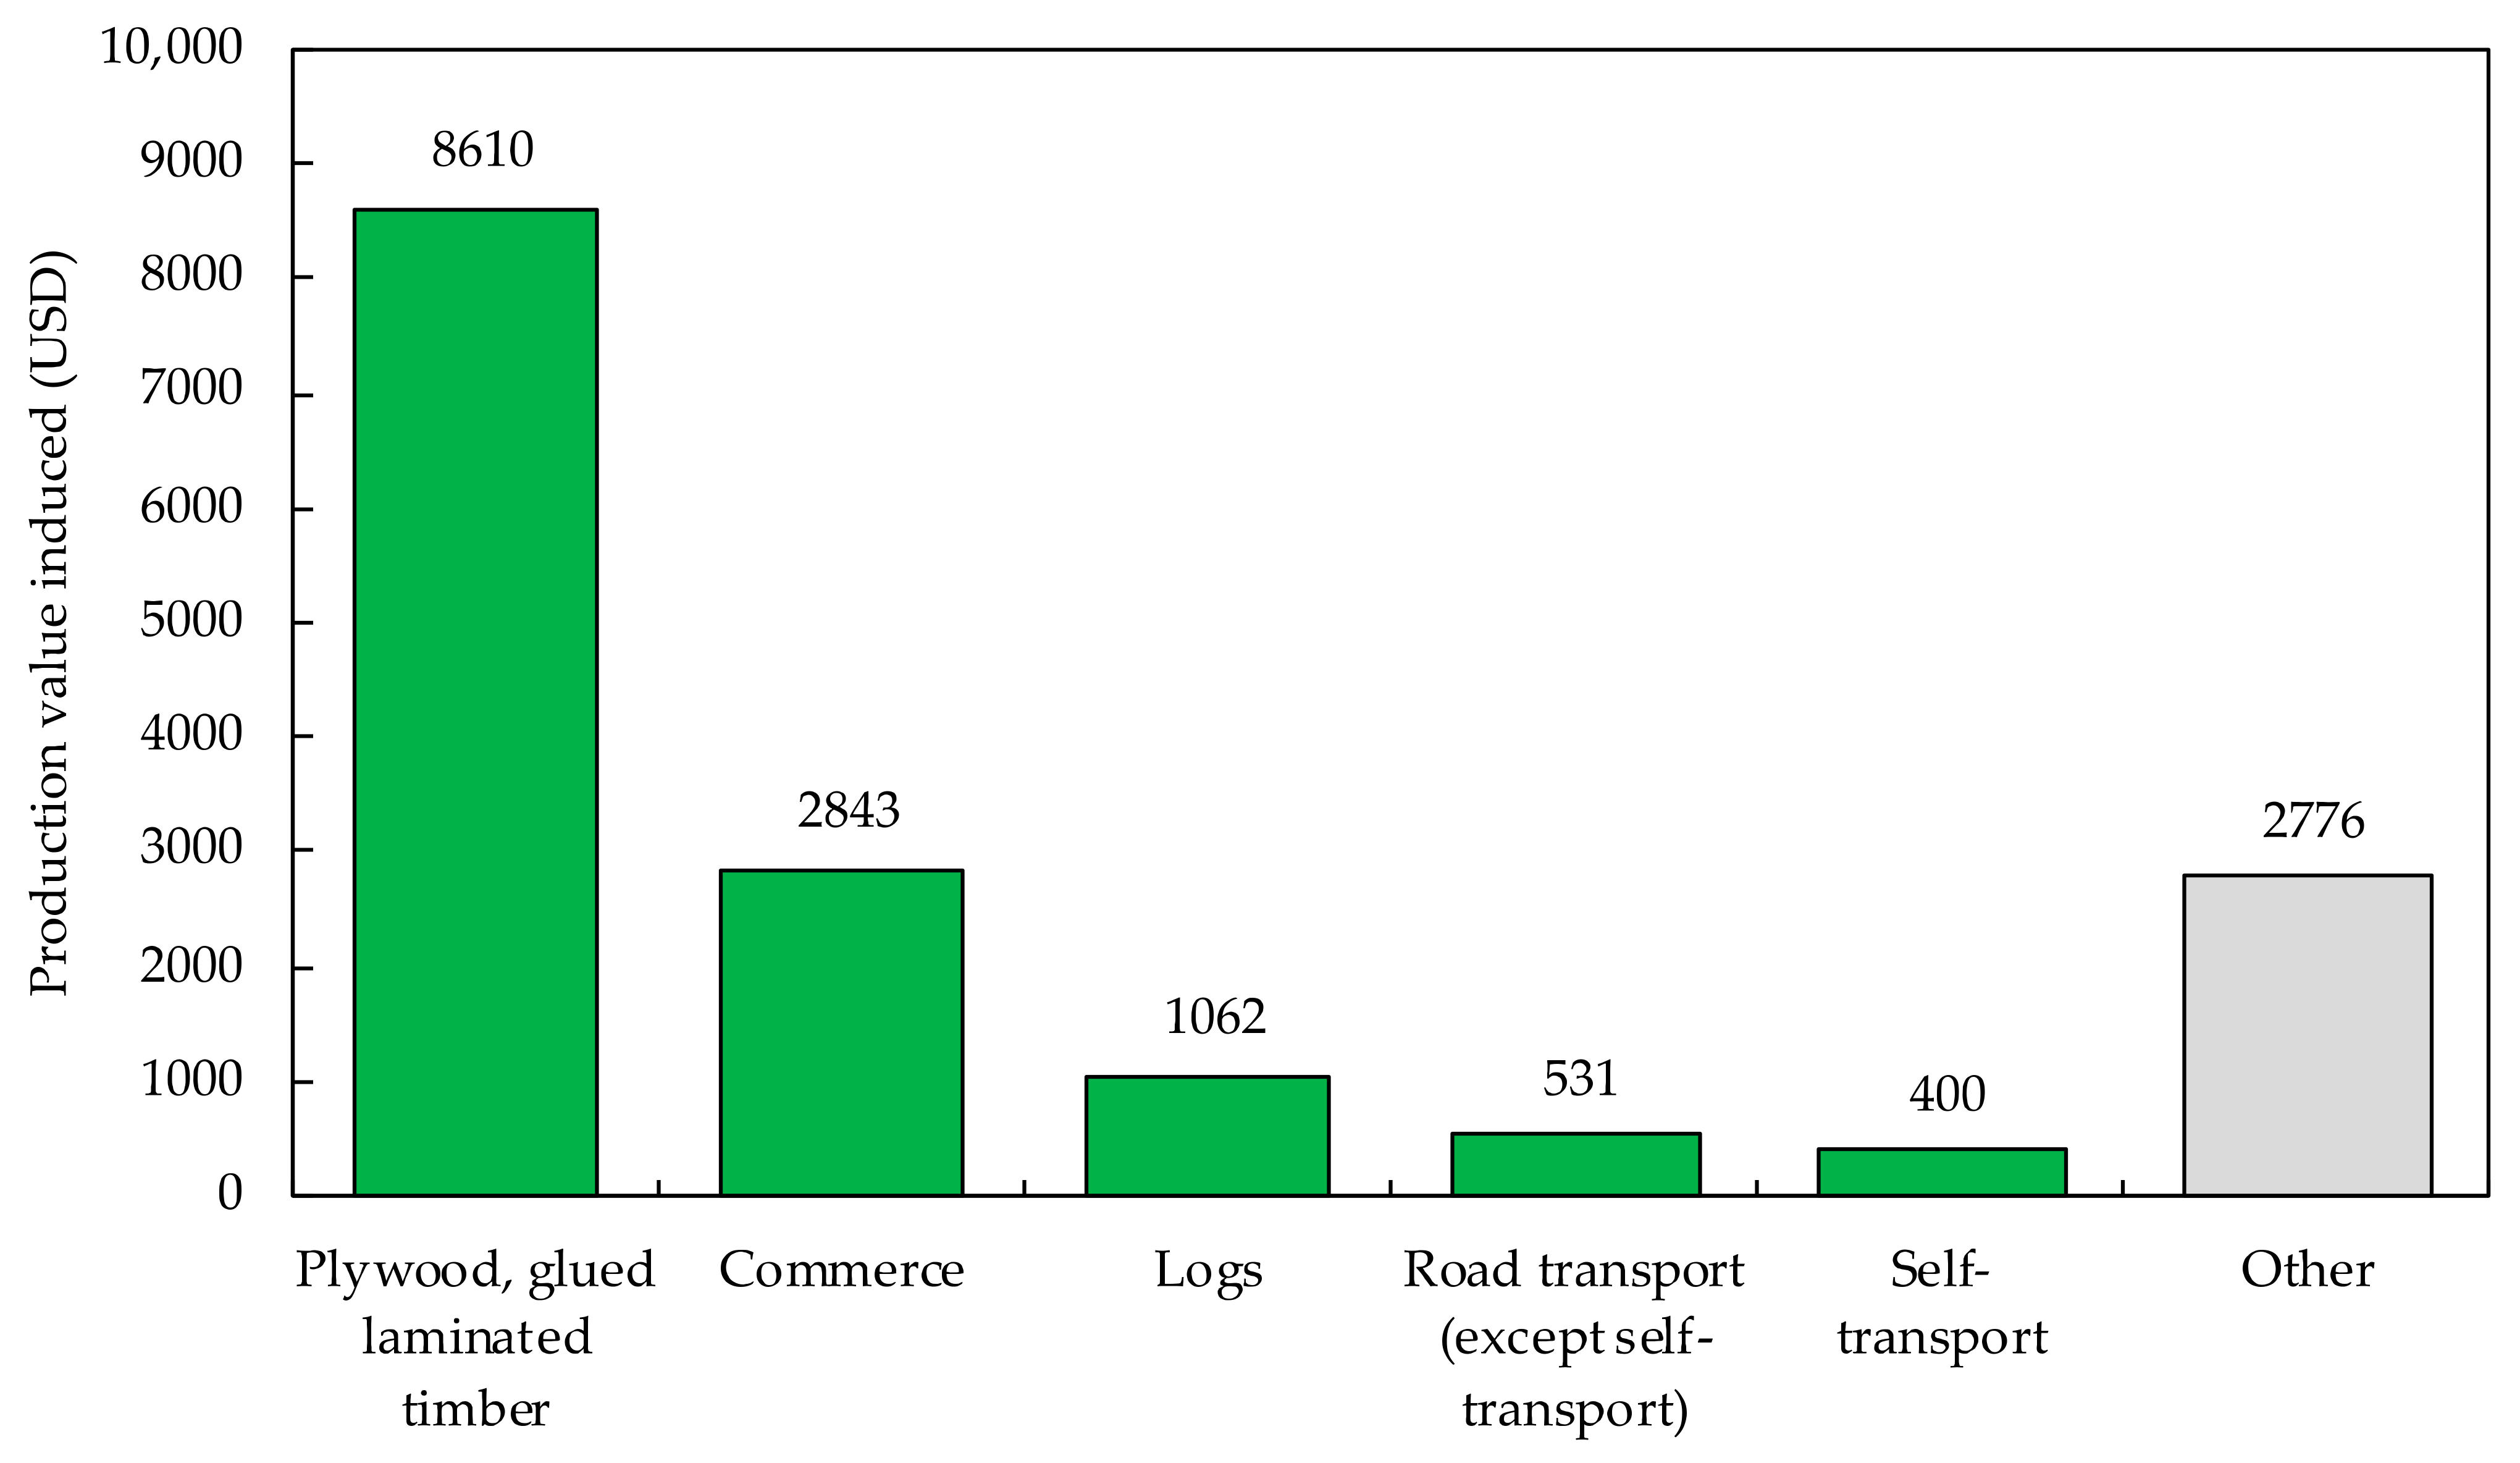
The net economic impact over the life cycle of the floor slabs was largest for NWP CLT. If NWP CLT replaces WP CLT or RC, net losses will occur in certain sectors. However, this is offset by the net benefits of NWP CLT in the plywood and glued laminated sector and logs sector. Therefore, replacement with NWP CLT has a net positive economic impact.
(4)
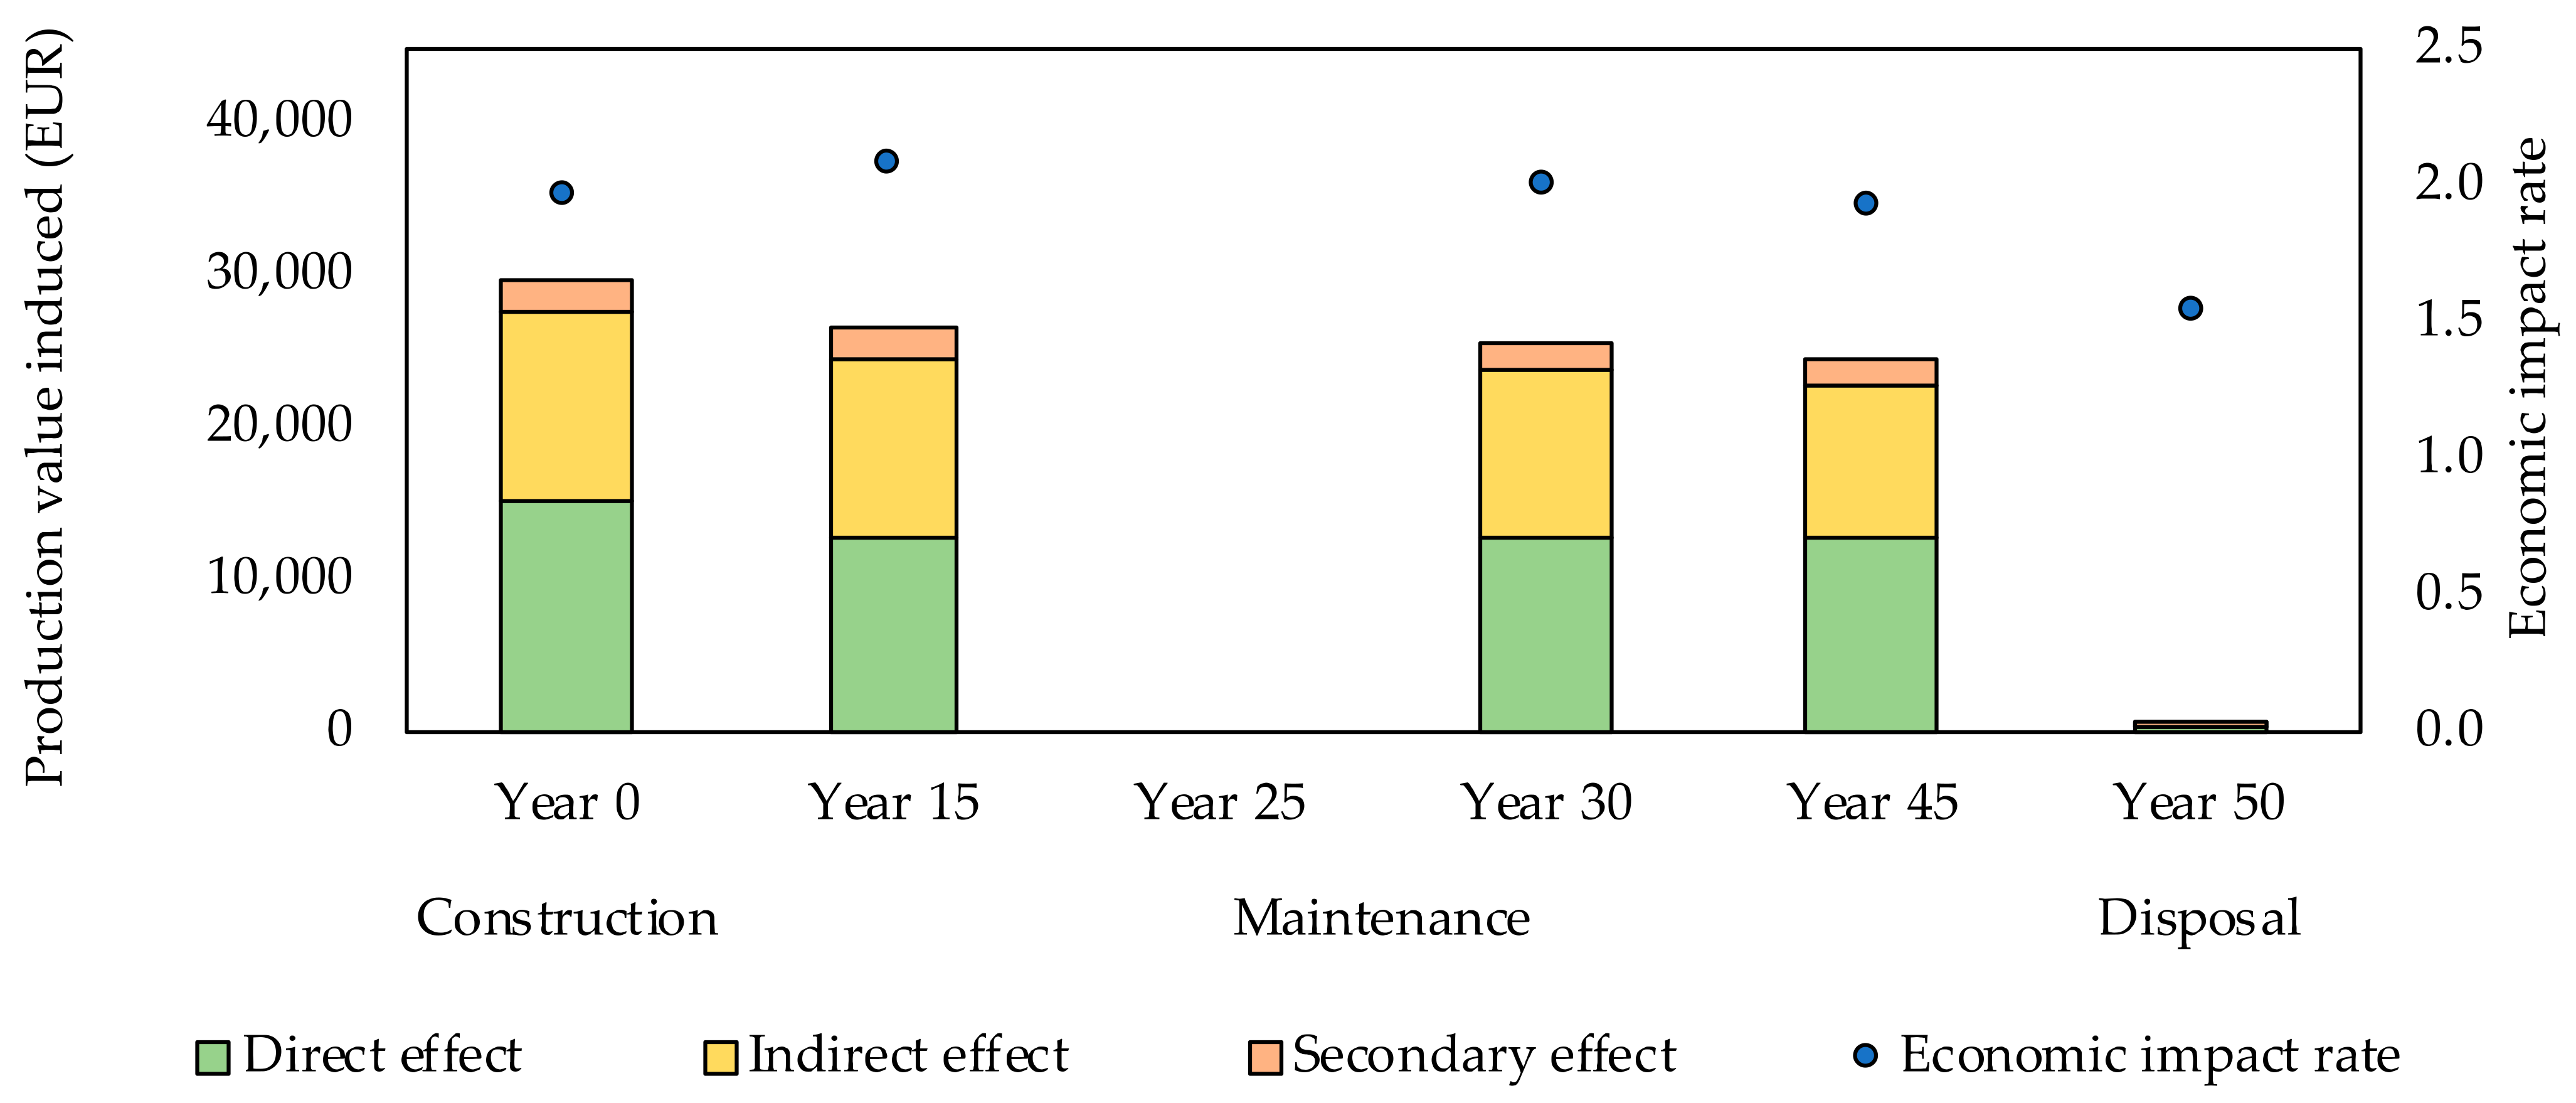
The impact of the change in the maintenance period on the economic impact is small. However, a decrease in the prefecture’s self-sufficiency rate of CLT production may reverse the economic impact of NWP CLT and that of WP CLT and RC. In other words, to expect a great economic impact, it is important to have a large amount of CLT production in the prefecture when using CLT for floor slabs.
Because bridge construction is often a public works project, the methods and findings of this study will enable policymakers to select construction types that consider not only the cost but also the effect on the regional economy. For example, local governments with limited financial resources have no choice but to choose inexpensive RC to reinforce and renew bridges. However, when CLT is used for floor slabs, not only in construction but also in maintenance, the use of CLT can have a significant economic impact on the regional economy and various industries. The method presented in this study is not limited to the use of timber for floor slabs but can also be applied to the estimation of economic impacts throughout the life cycle of other materials (such as concrete and steel) and other structures (such as buildings and civil engineering structures).

Supplementary Materials

The following supporting information can be downloaded at https://www.mdpi.com/article/10.3390/buildings12020158/s1, Table S1: Five-year change rate in the basic sector table; Table S2: Five-year change rate in employment-induced coefficient; Table S3: Non-waterproofed CLT floor slab construction cost data; Table S4: Waterproofed CLT floor slab construction cost data; Table S5: Reinforced concrete floor slab construction cost data; Table S6: Non-waterproofed CLT floor slab maintenance cost data (years 15, 30, and 45); Table S7: Waterproofed CLT floor slab maintenance cost data (years 15, 30, and 45); Table S8: Reinforced concrete floor slab maintenance cost data (year 25); Table S9: Non-waterproofed CLT floor slab and waterproofed CLT floor slab disposal cost data (year 50); Table S10: Reinforced concrete floor slab disposal cost data (year 50).

Author Contributions

Conceptualization, T.H., T.S., S.A. and C.K.; methodology, T.H. and C.K.; data curation, T.H., T.S., S.A. and C.K.; writing—original draft preparation, T.H.; writing—review and editing, T.H., T.S., S.A. and C.K.; funding acquisition, C.K. All authors have read and agreed to the published version of the manuscript.

Funding

This work was supported by the Japan Society for the Promotion of Science (grant number JP20H04384), the Kajima Foundation Fiscal 2021 Research Grant (grant number 4), and the Japan Cross-Laminated Timber Association Fiscal 2021 Grant.

Institutional Review Board Statement

Not applicable.

Informed Consent Statement

Not applicable.

Data Availability Statement

The data presented in this study are available on request from the corresponding author.

Acknowledgments

We would like to thank the bridge design and construction contractors and the CLT manufacturers for providing invaluable data for this study.

Conflicts of Interest

The authors declare no conflict of interest. The funders had no role in the design of the study; in the collection, analyses, or interpretation of data; in the writing of the manuscript, or in the decision to publish the results.

Appendix A

Figure A1. Regional economic impacts during the life cycle of floor slabs (The result when 1 USD is set to 114 JPY). (Note: NWP CLT: non-waterproofed CLT floor slabs; WP CLT: waterproofed CLT floor slabs; RC: RC floor slabs).
Buildings 12 00158 g0a1
Figure A2. Regional economic impacts during the life cycle of non-waterproofed CLT floor slabs (The result when 1 USD is set to 114 JPY). (Note: Year 0: construction; Years 15–45: maintenance; Year 50: disposal).
Buildings 12 00158 g0a2
Figure A3. Regional economic impacts during the life cycle of waterproofed CLT floor slabs (The result when 1 USD is set to 114 JPY). (Note: Year 0: construction; Years 15–45: maintenance; Year 50: disposal).
Buildings 12 00158 g0a3
Figure A4. Regional economic impacts during the life cycle of RC floor slabs (The result when 1 USD is set to 114 JPY). (Note: Year 0: construction; Years 15–45: maintenance; Year 50: disposal).
Buildings 12 00158 g0a4
Figure A5. Top-five sectors of indirect effects of non-waterproofed CLT floor slab construction (The result when 1 USD is set to 114 JPY).
Buildings 12 00158 g0a5
Figure A6. Top-five sectors of indirect effects of waterproofed CLT floor slab construction (The result when 1 USD is set to 114 JPY).
Buildings 12 00158 g0a6
Figure A7. Top-five sectors of indirect effects of RC floor slab construction (The result when 1 USD is set to 114 JPY).
Buildings 12 00158 g0a7
Figure A8. Top-five sectors of indirect effects of non-waterproofed CLT floor slab maintenance (The result when 1 USD is set to 114 JPY).
Buildings 12 00158 g0a8
Figure A9. Top-five sectors of indirect effects of waterproofed CLT floor slab maintenance (The result when 1 USD is set to 114 JPY).
Buildings 12 00158 g0a9
Figure A10. Top-five sectors of indirect effects of RC floor slab maintenance (The result when 1 USD is set to 114 JPY).
Buildings 12 00158 g0a10
Table A1. Indirect effect of the top-five sectors that generate net benefits and losses when subtracting the indirect effect of waterproofed CLT floor slabs from the indirect effect of non-waterproofed CLT floor slabs (The result when 1 USD is set to 114 JPY).
Net BenefitNet Loss
SectorUSDSectorUSD
Plywood, glued
laminated timber
23,925Commerce−1329
Road transport
(except self-transport)
1091Final chemical products (except medicaments)−58
Logs1027Special forest products−0.016
Activities not elsewhere classified686Synthetic resins−0.009
Waste management service634--
Table A2. Indirect effect of the top-five sectors that generate net benefits and losses when subtracting the indirect effect of RC floor slabs from the indirect effect of non-waterproofed CLT floor slabs (The result when 1 USD is set to 114 JPY).
Net BenefitNet Loss
SectorUSDSectorUSD
Plywood, glued
laminated timber
32,435Cement and cement products−537
Commerce5292Miscellaneous mining industry−2
Logs2082Miscellaneous ceramic, stone, and clay products−0.53
Road transport (except self-transport)1717Miscellaneous iron or steel products−0.020
Activities not elsewhere classified1027--
Table A3. Regional economic impacts during the life cycle of floor slabs if the maintenance period is extended or shortened by 5 years (The result when 1 USD is set to 114 JPY).
Maintenance PeriodDirect Effect
(USD) (A)
Total Effect
(USD) (B)
Economic
Impact Rate (B/A)
Employment
Effect (People)
NWP CLTCurrent (year 15, 30, 45)61,079121,1941.9840.686
+5 years (year 20, 40)46,50992,1701.9820.554
−5 years (year 10, 20, 30, 40)75,649151,7592.0060.886
WP CLTCurrent (year 15, 30, 45)52,61383,2771.5830.635
+5 years (year 20, 40)43,62470,6451.6190.564
−5 years (year 10, 20, 30, 40)61,60295,7811.5550.737
RCCurrent (year 25)947714,0271.4800.129
+5 years (year 30)947714,0271.4800.123
−5 years (year 20, 40)11,53617,0521.4780.139
Note: NWP CLT: non-waterproofed CLT floor slabs; WP CLT: waterproofed CLT floor slabs; RC: RC floor slabs.

Appendix B

Figure A11. Regional economic impacts during the life cycle of floor slabs (The result when 1 EUR is set to 130 JPY). (Note: NWP CLT: non-waterproofed CLT floor slabs; WP CLT: waterproofed CLT floor slabs; RC: RC floor slabs).
Buildings 12 00158 g0a11
Figure A12. Regional economic impacts during the life cycle of non-waterproofed CLT floor slabs (The result when 1 EUR is set to 130 JPY). (Note: Year 0: construction; Years 15–45: maintenance; Year 50: disposal).
Buildings 12 00158 g0a12
Figure A13. Regional economic impacts during the life cycle of waterproofed CLT floor slabs (The result when 1 EUR is set to 130 JPY). (Note: Year 0: construction; Years 15–45: maintenance; Year 50: disposal).
Buildings 12 00158 g0a13
Figure A14. Regional economic impacts during the life cycle of RC floor slabs (The result when 1 EUR is set to 130 JPY). (Note: Year 0: construction; Years 15–45: maintenance; Year 50: disposal).
Buildings 12 00158 g0a14
Figure A15. Top-five sectors of indirect effects of non-waterproofed CLT floor slab construction (The result when 1 EUR is set to 130 JPY).
Buildings 12 00158 g0a15
Figure A16. Top-five sectors of indirect effects of waterproofed CLT floor slab construction (The result when 1 EUR is set to 130 JPY).
Buildings 12 00158 g0a16
Figure A17. Top-five sectors of indirect effects of RC floor slab construction (The result when 1 EUR is set to 130 JPY).
Buildings 12 00158 g0a17
Figure A18. Top-five sectors of indirect effects of non-waterproofed CLT floor slab maintenance (The result when 1 EUR is set to 130 JPY).
Buildings 12 00158 g0a18
Figure A19. Top-five sectors of indirect effects of waterproofed CLT floor slab maintenance (The result when 1 EUR is set to 130 JPY).
Buildings 12 00158 g0a19
Figure A20. Top-five sectors of indirect effects of RC floor slab maintenance (The result when 1 EUR is set to 130 JPY).
Buildings 12 00158 g0a20
Table A4. Indirect effect of the top-five sectors that generate net benefits and losses when subtracting the indirect effect of waterproofed CLT floor slabs from the indirect effect of non-waterproofed CLT floor slabs (The result when 1 EUR is set to 130 JPY).
Net BenefitNet Loss
SectorEURSectorEUR
Plywood, glued
laminated timber
20,980Commerce−1166
Road transport
(except self-transport)
956Final chemical products (except medicaments)−51
Logs901Special forest products−0.014
Activities not elsewhere classified602Synthetic resins−0.0075
Waste management service556--
Table A5. Indirect effect of the top-five sectors that generate net benefits and losses when subtracting the indirect effect of RC floor slabs from the indirect effect of non-waterproofed CLT floor slabs (The result when 1 EUR is set to 130 JPY).
Net BenefitNet Loss
SectorEURSectorEUR
Plywood, glued
laminated timber
28,443Cement and cement products−471
Commerce4641Miscellaneous mining industry−2
Logs1826Miscellaneous ceramic, stone, and clay products−0.47
Road transport (except self-transport)1506Miscellaneous iron or steel products−0.018
Activities not elsewhere classified900--
Table A6. Regional economic impacts during the life cycle of floor slabs if the maintenance period is extended or shortened by 5 years (The result when 1 EUR is set to 130 JPY).
Maintenance PeriodDirect Effect
(EUR) (A)
Total Effect
(EUR) (B)
Economic
Impact Rate (B/A)
Employment
Effect (People)
NWP CLTCurrent (year 15, 30, 45)53,562106,2781.9840.686
+5 years (year 20, 40)40,78580,8261.9820.554
−5 years (year 10, 20, 30, 40)66,339133,0812.0060.886
WP CLTCurrent (year 15, 30, 45)46,13773,0281.5830.635
+5 years (year 20, 40)38,25561,9501.6190.564
−5 years (year 10, 20, 30, 40)54,02083,9921.5550.737
RCCurrent (year 25)831112,3011.4800.129
+5 years (year 30)831112,3001.4800.123
−5 years (year 20, 40)10,11714,9531.4780.139
Note: NWP CLT: non-waterproofed CLT floor slabs; WP CLT: waterproofed CLT floor slabs; RC: RC floor slabs.

References

  1. Ross, R.J. Wood Handbook: Wood as an Engineering Material; U.S. Dept. of Agriculture, Forest Service, Forest Products Laboratory: Madison, WI, USA, 2010.
  2. Intergovernmental Panel on Climate Change (IPCC) Climate Change 2014, Mitigation of Climate Change, Fifth Assessment Report; Cambridge University Press: New York, NY, USA, 2014.
  3. Food and Agriculture Organization of the United Nations (FAO) FAOSTAT. Available online: http://www.fao.org/faostat/en/#data/QC (accessed on 29 November 2021).
  4. Forestry Agency Annual Report on Forest and Forestry in Japan (Fiscal Year 2020); Forestry Agency: Tokyo, Japan, 2020.
  5. Ministry of Land, Infrastructure, Transport and Tourism White Paper on Land, Infrastructure, Transport and Tourism in Japan, 2016; Ministry of Land, Infrastructure, Transport and Tourism: Tokyo, Japan, 2016.
  6. Ministry of Land, Infrastructure, Transport and Tourism White Paper on Land, Infrastructure, Transport and Tourism in Japan, 2017; Ministry of Land, Infrastructure, Transport and Tourism: Tokyo, Japan, 2017.
  7. Ministry of Land, Infrastructure, Transport and Tourism White Paper on Land, Infrastructure, Transport and Tourism in Japan, 2018; Ministry of Land, Infrastructure, Transport and Tourism: Tokyo, Japan, 2018.
  8. Ministry of Land, Infrastructure, Transport and Tourism White Paper on Land, Infrastructure, Transport and Tourism in Japan, 2019; Ministry of Land, Infrastructure, Transport and Tourism: Tokyo, Japan, 2019.
  9. Ministry of Land, Infrastructure, Transport and Tourism White Paper on Land, Infrastructure, Transport and Tourism in Japan, 2020; Ministry of Land, Infrastructure, Transport and Tourism: Tokyo, Japan, 2020.
  10. Ministry of Land, Infrastructure, Transport and Tourism Annual Report on Road Maintenance in Japan (Fiscal Year 2020); Ministry of Land, Infrastructure, Transport and Tourism: Tokyo, Japan, 2020.
  11. Ministry of Internal Affairs and Communications List of Major Financial Indicators for Local Governments in FY2019. Available online: https://www.soumu.go.jp/iken/zaisei/R01_chiho.html (accessed on 19 August 2021).
  12. Daneshvar, H.; Niederwestberg, J.; Dickof, C.; Chui, Y.H. Structural Behaviour of Deep CLT Lintels Subjected to Concentric and Eccentric Loading. J. Build. Eng. 2021, 43, 103101. [Google Scholar] [CrossRef]
  13. Sandoli, A.; Calderoni, B. The rolling shear influence on the out-of-plane behavior of CLT panels: A comparative analysis. Buildings 2020, 10, 42. [Google Scholar] [CrossRef] [Green Version]
  14. Cherry, R.; Manalo, A.; Karunasena, W.; Stringer, G. Out-of-grade sawn pine: A state-of-the-art review on challenges and new opportunities in cross laminated timber (CLT). Constr. Build. Mater. 2019, 211, 858–868. [Google Scholar] [CrossRef]
  15. Haynes, M.; Coleri, E.; Estaji, M. Selection of the Most Effective Pavement Surfacing Strategy for the Glenwood Cross Laminated Timber Parking Garage. Constr. Build. Mater. 2019, 226, 162–172. [Google Scholar] [CrossRef]
  16. Pang, S.-J.; Jeong, G.Y. Effects of combinations of lamina grade and thickness, and span-to-depth ratios on bending properties of cross-laminated timber (CLT) floor. Constr. Build. Mater. 2019, 222, 142–151. [Google Scholar] [CrossRef]
  17. Goremikins, V.; Serdjuks, D.; Buka-Vaivade, K.; Pakrastins, L.; Vatin, N. Prediction of Behaviour of Prestressed Suspension Bridge with Timber Deck Panels. Balt. J. Road Bridge Eng. 2017, 12, 234–240. [Google Scholar] [CrossRef] [Green Version]
  18. Divekar, N. Introduction to New Material—Cross Laminated Timber. Int. J. Eng. Res. 2016, 5, 675–679. [Google Scholar] [CrossRef]
  19. Japan Cross Laminated Timber Association List of Domestic CLT Manufacturing Companies (Japan CLT Association Members, JAS Certified Factories). Available online: https://clta.jp/wp-content/uploads/2021/09/Jas-Approved-CLT-Factory20210610.pdf (accessed on 27 December 2021).
  20. Toyoda, A.; Sasaki, T.; Araki, S.; Ariyama, Y.; Gotou, H. Design and repairing of short span bridge using cross laminated timber slabs. J. Struct. Eng. 2019, 65, 799–806. [Google Scholar] [CrossRef]
  21. Hassan, O.A.B.; Öberg, F.; Gezelius, E. Cross-laminated timber flooring and concrete slab flooring: A comparative study of structural design, economic and environmental consequences. J. Build. Eng. 2019, 26, 100881. [Google Scholar] [CrossRef]
  22. Ahmed, S.; Arocho, I. Analysis of cost comparison and effects of change orders during construction: Study of a mass timber and a concrete building project. J. Build. Eng. 2021, 33, 101856. [Google Scholar] [CrossRef]
  23. Iwase, T.; Sasaki, T.; Araki, S.; Huzita, T.; Kayo, C. Environmental and economic evaluation of small-scale bridge repair using cross-laminated timber floor slabs. Sustainability 2020, 12, 3424. [Google Scholar] [CrossRef] [Green Version]
  24. Huzita, T.; Noda, R.; Kayo, C. Regional economic impacts from timber check dam construction—A comparison with concrete check dam construction. Forests 2020, 11, 1073. [Google Scholar] [CrossRef]
  25. Huzita, T.; Kayo, C. Regional economic impacts from timber check dam construction—A comparison with concrete check dam construction, Part II: The question of premium vouchers. Forests 2021, 12, 347. [Google Scholar] [CrossRef]
  26. Scouse, A.; Kelley, S.S.; Liang, S.; Bergman, R. Regional and net economic impacts of high-rise mass timber construction in Oregon. Sustain. Cities Soc. 2020, 61, 102154. [Google Scholar] [CrossRef]
  27. Sasaki, T.; Yamauchi, H.; Adachi, K.; Hayashi, T. Water Resistance Evaluation of CLT Treated with Wrapping. In Proceedings of the 34th Annual Meeting of the Japan Wood Protection Association, Tokyo, Japan, 22–24 April 2018. [Google Scholar]
  28. Akita Prefecture 2015 Akita Prefecture Input-Output Table. Available online: https://www.pref.akita.lg.jp/pages/archive/53289/ (accessed on 20 December 2021).
  29. Akita Prefecture 1990 Transactions Valued at Producers’ Prices for Akita Prefecture. Available online: https://www.pref.akita.lg.jp/uploads/public/archive_0000000854_00/H2sangyorenkan_1.seisanshakakaku-14.xls (accessed on 10 April 2021).
  30. Akita Prefecture 1995 Transactions Valued at Producers’ Prices for Akita Prefecture. Available online: https://www.pref.akita.lg.jp/uploads/public/archive_0000000854_00/H7sangyorenkan_1.bumon-14.xls (accessed on 10 April 2021).
  31. Akita Prefecture 2000 Transactions Valued at Producers’ Prices for Akita Prefecture. Available online: https://www.pref.akita.lg.jp/uploads/public/archive_0000000150_00/050012022200000000001.xls (accessed on 10 April 2021).
  32. Akita Prefecture 2005 Transactions Valued at Producers’ Prices for Akita Prefecture. Available online: https://www.pref.akita.lg.jp/uploads/public/archive_0000004356_00/torihiki-15.xls (accessed on 10 April 2021).
  33. Akita Prefecture 2011 Transactions Valued at Producers’ Prices for Akita Prefecture. Available online: https://www.pref.akita.lg.jp/uploads/public/archive_0000031259_00/%E5%8F%96%E5%BC%95%E5%9F%BA%E6%9C%AC%E8%A1%A8%E7%AD%89%EF%BC%88%EF%BC%91%EF%BC%95%E9%83%A8%E9%96%80%E5%88%86%E9%A1%9E%EF%BC%89.xls (accessed on 10 April 2021).
  34. Akita Prefecture 2015 Transactions Valued at Producers’ Prices for Akita Prefecture. Available online: https://www.pref.akita.lg.jp/uploads/public/archive_0000053289_00/27-1%E5%85%AC%E8%A1%A8%E7%94%A8%E3%83%87%E3%83%BC%E3%82%BF%EF%BC%8815%E9%83%A8%E9%96%80%E5%88%86%E9%A1%9E%EF%BC%89ok.xlsx (accessed on 10 April 2021).
  35. Terasaki, T. Non-survey method for constructing input-output tables and measuring errors: A case study of production ripple effects using the input-output table of Miyazu City. Kyoto Sangyo Univ. Econ. Rev. 2018, 5, 1–39. [Google Scholar]
  36. Maruyama, S. Estimation and verification of input coefficient by non-survey approach. Econ. Bus. Rev. 2009, 21, 1–7. [Google Scholar]
  37. Akita Prefecture 1995 Employees Engaged in Production Activities (by Occupation) for Akita Prefecture. Available online: https://www.pref.akita.lg.jp/uploads/public/archive_0000000854_00/H7sangyorenkan_4.koyo.xls (accessed on 10 April 2021).
  38. Akita Prefecture 2000 Employees Engaged in Production Activities (by Occupation) for Akita Prefecture. Available online: https://www.pref.akita.lg.jp/uploads/public/archive_0000000150_00/050012022200000000004.xls (accessed on 10 April 2021).
  39. Akita Prefecture 2005 Employees Engaged in Production Activities (by Occupation) for Akita Prefecture. Available online: https://www.pref.akita.lg.jp/uploads/public/archive_0000004356_00/koyou-15.xls (accessed on 10 April 2021).
  40. Akita Prefecture 2011 Employees Engaged in Production Activities (by Occupation) for Akita Prefecture. Available online: https://www.pref.akita.lg.jp/uploads/public/archive_0000031259_00/%E9%9B%87%E7%94%A8%E8%A1%A8%E7%AD%89%EF%BC%88%EF%BC%91%EF%BC%95%E9%83%A8%E9%96%80%E5%88%86%E9%A1%9E%EF%BC%89.xls (accessed on 10 April 2021).
  41. Akita Prefecture 2015 Employees Engaged in Production Activities (by Occupation) for Akita Prefecture. Available online: https://www.pref.akita.lg.jp/uploads/public/archive_0000031259_00/27-1%E5%85.xls (accessed on 10 April 2021).
  42. Ministry of Internal Affairs and Communications 2015 Input-Output Tables Explanatory Report; Ministry of Internal Affairs and Communications: Tokyo, Japan, 2020; pp. 147–358.
  43. Ministry of Internal Affairs and Communications Input-Output Tables for Japan 2015. Available online: https://www.e-stat.go.jp/en/stat-search/files?page=1&layout=datalist&toukei=00200603&tstat=000001130583 (accessed on 10 April 2021).
  44. Ministry of Health, Labour and Welfare Annual Health, Labour and Welfare Report 2020; Ministry of Health, Labour and Welfare: Tokyo, Japan, 2020; pp. 65–70.
Figure 1. Annual production capacity of CLT in factories certified under Japan’s Japanese Agricultural Standards Adapted from Ref. [19].
Buildings 12 00158 g001
Figure 2. Construction process of waterproofed CLT floor slabs.
Buildings 12 00158 g002
Figure 3. Cost items of construction, maintenance, and disposal during the estimation period: (a) non-waterproofed CLT floor slabs; (b) waterproofed CLT floor slabs; (c) RC floor slabs.
Buildings 12 00158 g003
Figure 4. Simple model of the extended input–output table.
Buildings 12 00158 g004
Figure 5. Procedure for estimating economic impact.
Buildings 12 00158 g005
Figure 6. Regional economic impacts during the life cycle of floor slabs. (Note: NWP CLT: non-waterproofed CLT floor slabs; WP CLT: waterproofed CLT floor slabs; RC: RC floor slabs).
Buildings 12 00158 g006
Figure 7. Regional economic impacts during the life cycle of non-waterproofed CLT floor slabs. (Note: Year 0: construction; Years 15–45: maintenance; Year 50: disposal).
Buildings 12 00158 g007
Figure 8. Regional economic impacts during the life cycle of waterproofed CLT floor slabs. (Note: Year 0: construction; Years 15–45: maintenance; Year 50: disposal).
Buildings 12 00158 g008
Figure 9. Regional economic impacts during the life cycle of RC floor slabs. (Note: Year 0: construction; Years 15–45: maintenance; Year 50: disposal).
Buildings 12 00158 g009
Figure 10. Employment effects during the life cycle of floor slabs. (Note: NWP CLT: non-waterproofed CLT floor slabs; WP CLT: waterproofed CLT floor slabs; RC: RC floor slabs; Year 0: construction; Years 15–45: maintenance; Year 50: disposal).
Buildings 12 00158 g010
Figure 11. Top-five sectors of indirect effects of non-waterproofed CLT floor slab construction.
Buildings 12 00158 g011
Figure 12. Top-five sectors of indirect effects of waterproofed CLT floor slab construction.
Buildings 12 00158 g012
Figure 13. Top-five sectors of indirect effects of RC floor slab construction.
Buildings 12 00158 g013
Figure 14. Top-five sectors of indirect effects of non-waterproofed CLT floor slab maintenance.
Buildings 12 00158 g014
Figure 15. Top-five sectors of indirect effects of waterproofed CLT floor slab maintenance.
Buildings 12 00158 g015
Figure 16. Top-five sectors of indirect effects of RC floor slab maintenance.
Buildings 12 00158 g016
Figure 17. Regional economic impacts of the life cycle of floor slabs on the prefecture’s self-sufficiency rate of CLT.
Buildings 12 00158 g017
Table 1. Indirect effect of the top-five sectors that generate net benefits and losses when subtracting the indirect effect of waterproofed CLT floor slabs from the indirect effect of non-waterproofed CLT floor slabs.
Net BenefitNet Loss
SectorJPYSectorJPY
Plywood, glued
laminated timber
2,727,449Commerce−151,533
Road transport
(except self-transport)
124,318Final chemical products (except medicaments)−6607
Logs117,093Special forest products−2
Activities not elsewhere classified78,253Synthetic resins−1
Waste management service72,241--
Table 2. Indirect effect of the top-five sectors that generate net benefits and losses when subtracting the indirect effect of RC floor slabs from the indirect effect of non-waterproofed CLT floor slabs.
Net BenefitNet Loss
SectorJPYSectorJPY
Plywood, glued
laminated timber
3,697,592Cement and cement products−61,196
Commerce603,302Miscellaneous mining industry−247
Logs237,321Miscellaneous ceramic, stone, and clay products−61
Road transport (except self-transport)195,773Miscellaneous iron or steel products−2
Activities not elsewhere classified117,030--
Table 3. Regional economic impacts during the life cycle of floor slabs if the maintenance period is extended or shortened by 5 years.
Maintenance PeriodDirect Effect
(JPY) (A)
Total Effect
(JPY) (B)
Economic
Impact Rate (B/A)
Employment
Effect (People)
NWP CLTCurrent (year 15, 30, 45)6,963,03713,816,1301.9840.686
+5 years (year 20, 40)5,302,04310,507,3751.9820.554
−5 years (year 10, 20, 30, 40)8,624,03117,300,5432.0060.886
WP CLTCurrent (year 15, 30, 45)5,997,8639,493,6201.5830.635
+5 years (year 20, 40)4,973,1038,053,5291.6190.564
−5 years (year 10, 20, 30, 40)7,022,62210,918,9991.5550.737
RCCurrent (year 25)1,080,4001,599,1261.4800.129
+5 years (year 30)1,080,4001,599,0461.4800.123
−5 years (year 20, 40)1,315,1501,943,8861.4780.139
Note: NWP CLT: non-waterproofed CLT floor slabs; WP CLT: waterproofed CLT floor slabs; RC: RC floor slabs.
Publisher’s Note: MDPI stays neutral with regard to jurisdictional claims in published maps and institutional affiliations.

