Abstract
Due to global concerns about energy issues, global warming, and urban quality, vertical greening systems (VGS) are receiving more attention in construction and design research. Therefore, VGS has become part of building envelope design as a passive technique for saving energy in building sectors. The current study aimed to investigate shading and energy performances of VGS in buildings in hot climate regions and to optimize VGS design as a building design element. The study was conducted through simulation and field experiments in a student housing building at a university campus (Irbid, Jordan). Field measurements were taken to assess the thermal effect of the green wall and daylight performance as well as the efficiency of the typical green wall design configuration. Furthermore, a methodology for accurately representing green walls was established and used. Both simulation and experimentation demonstrated that the thickness of the air cavity and the percentage of foliage coverage can have a substantial impact on the performance of the green wall system. Results showed that green wall systems are effective natural sunscreens and shading systems. A green wall helped to reduce the exterior wall surface temperatures by a range of 6 to 11 °C compared to the base case of the wall without a VGS on different days. In addition, it decreased the interior surface temperature of the investigated southern façade by an average of 5 °C compared to the base case. Green wall design configurations for hot climate regions, such as Jordan, will help designers to use the VGS as a design element. Our findings indicate that GW could help to improve the thermal and daylight environment and thus the results could be taken as indicative for GW wall design in other areas or buildings.
1. Introduction
Buildings are responsible for approximately one-third of total energy consumption worldwide [1]. Therefore, building energy efficiency is a critical factor in dealing with global climate change, regional and urban warming (urban heat island), and urban environment degradation [2].
Sustainability has become a key approach in architecture design and environment studies. Architects are creating inventive solutions to tackling the problem of energy needs in the building sector in response to the energy crisis and climatic changes [3]. Over the last decade, the use of greening systems in building envelopes is increasing due to their performance as passive climatic tools to save energy in buildings, reduce heat gain, work as windscreens, and provide shading for buildings [4,5,6]. Vertical greening systems provide passive cooling for indoor and outdoor environments by reducing ambient air temperature, as well as enhancing the atmospheric quality and occupations’ thermal comfort [7]. Moreover, green walls have many extraordinary benefits such as reducing internal air temperature, reducing energy consumption for cooling, creating a pleasant environment, and helping adapt urban areas and cities to climate change and global warming, mitigating the impact of industrialization and urbanization on the environment, and improving urban air quality [1,8,9,10,11,12,13].
Building envelopes are significant elements that have a great impact on buildings’ thermal and energy performance and are responsible for 20–60% of the heating and cooling energy utilized in buildings [14]. Therefore, several studies emphasized the significant role of vegetation in improving surrounding environments: the presence of vegetation near the built environment (e.g., green roof, green facade) helped to decrease surrounding temperatures by providing shading and transpiration. In summer, VGS blockage of direct solar radiation via a vegetative layer owing to the shading effect of leaves, regulate lighting and adjusts the temperature within the buildings. It works in winter as a thermal buffer layer and keeps heat from escaping from buildings [15,16].
The cooling effects of green walls were investigated in many studies, such as using direct green walls at the south façade, southwest façade, and east façade of buildings in Berlin [4] and using a south-facing indirect green wall in Slovenia [17]. Previous studies show how green wall orientation affected buildings’ thermal performance; such as using direct GW walls on north-, south-, west-, or east-facing facades with a reduction of up to 1.8 °C, 3.0 °C, 11.1 °C, and 12.6 °C, respectively, in Chicago city [18], and up to 15.18 °C for a south-facing green wall in Spain [19], air temperature reduction up to 10.1 °C at the north-facing green wall, and up to 6.1 °C for a west-facing green wall in Hong Kong [20].
Dede [13] studied how different growing media, such as municipal solid waste compost, peat, rice hull, and perlite, affected the performance of the green wall and found that peat and perlite mixture provided the highest thermal performance as they help to increase the shading and isolation effect. The study used an experimental testing model. Cuce [8] and Addo-Bankas et al. [10] studied two types of green walls; climbing plants directly on the wall and green wall supported by a structure integrated into the external wall as a double façade, green facade, and living wall systems (LW). Cuce [8] studied systems in Nottingham university buildings using a real model and computer simulation using the ECOTECT program. The study showed that green walls could help to reduce internal wall temperature by an average of 2.5 °C. The study concluded that green walls are promising for sunny and cloudy conditions. The simulation did not investigate more variables from a design point of view. On the other hand, Addo-Bankas et al. [10] reviewed previous research on green walls and discussed the significant role of green walls in the removal of different pollutants. Andric et al. [1] investigated green roofs and green walls as retrofitting scenarios to face climate change and improve buildings’ thermal performance in extremely hot climates. The study used a global climate simulation program to find out the impact of green wall on the energy efficiency of residential buildings and future weather scenarios using the CCWorldWeatherGen tool. The study concluded that in desert climates with extreme weather temperatures thermal insulation material is more efficient than green walls and roofs due to transmission loads through the envelope. The study was based on expected climate scenarios using a computer simulation without using a real study. Viecco et al. [11] investigated the impact of green walls on improving the air quality in urban areas. They studied a numerical and simulation module, ENVI-met numerical model, to study the air quality in highly polluted areas. The study concluded that green walls have a significant impact in improving the air quality compared to green roofs with a high ratio of green coverage. The study focused on air quality using computer simulation. Kenai et al. [12] developed TRNSYS, a model to study the energy balance of green walls. The developed model was based on thermal exchanges between building facades and the external environment in the presence of green walls. The study showed the thermal advantages of green walls, especially in summer. Vertical greening systems are efficient in saving energy in summer for all climatic areas across the world; however, vertical greening systems may have a negative effect in winter by raising heating demand, thereby increasing energy consumption [21]. Pérez et al. [19] observed temperature reduction for the exterior surface of the façade by 7.9–16 °C in snow climate regions, and they also found a temperature reduction of 1.7–13 °C in warm temperature climates.
Jordan’s annual maximum temperature has risen by 0.3–1.8 °C since the 1960s, while the annual minimum temperature has risen by 0.4–2.8 °C and the average annual temperature is estimated to rise by 2 °C by 2050 [22]. In Jordan, the residential sector accounts for 21% of total energy consumption and 43% of total electricity consumption [23]; because of the absence of shading devices or systems, inadequately insulated external walls and inefficient building service operations. More than 60% of the energy spent in houses is utilized for space heating and cooling [24]. As a result, the building sector has the highest potential for energy savings and future research.
Previous research on green walls studied; the benefits of green walls such as the impact on air quality, growing media, or orientations and used simulation tools or real experiments using testing rooms. It is necessary to introduce the green wall as an architectural design element, especially the impact of the green wall dimensional variables and other variables such as air cavity, foliage percentage, shading effects, and how to select the green walls as design element or retrofit device of existing buildings. This research provides a sustainable assessment for different types of GWS to optimize the best practice model that suits hot-arid areas such as Jordan. The research will help to identify the most influential variables and determine special local values for Jordan’s region and climate to provide a base for architects and designers on how to design and incorporate GWS in building design. Therefore, the main purpose of this research is to investigate the shading effect of green wall systems and optimize green wall system performance for student housing buildings at the Jordan University Science and Technology (JUST). To the best of our knowledge, studies on green walls in regions with hot climates, such as Jordan, are limited.
2. Methodology
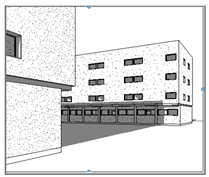
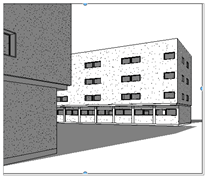
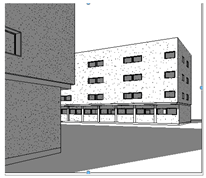
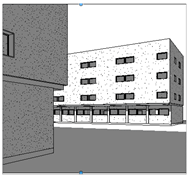
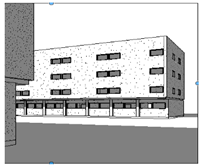
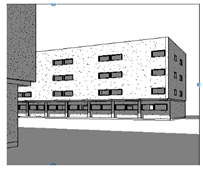
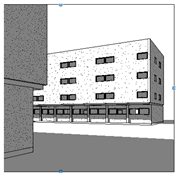
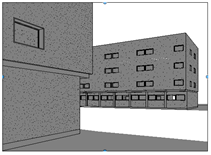
The current research was carried out using real experiment measurements and computer simulation to measure wall surface temperature (Ts), room air temperature (Ta), and daylighting rate in a space with green wall, and comparing the results to a base case without a green wall. In addition, the research studied relative humidity (RH) for the space between the VGS and masonry façade and the wind velocity (WV). A four-story students’ dorm building at the Jordan University of Science and Technology campus was selected as a case study, as seen in Figure 1. The building was constructed in the 1990s. Two identical rooms on the ground floor room with dimensions of (3.5 m × 4.5 m × 3 m in L-W-H), and two other identical dormitory rooms in first floor rooms with dimensions of (3.5 m × 5.1 m × 3 m in L-W-H)), the wall thickness of 350 mm, and constructed of concrete. The difference between the ground floor and the first floor was that on the ground floor the green wall cavity was 0.8 m, while on the first floor the green wall cavity was 0.2 m cavity, as seen in Figure 1. Building construction details used were typical to Jordanian building code for U-values and specifications, while the U-values for the plant and growing media was based on Feng and Hewage’ study [25], as seen in Table 1.
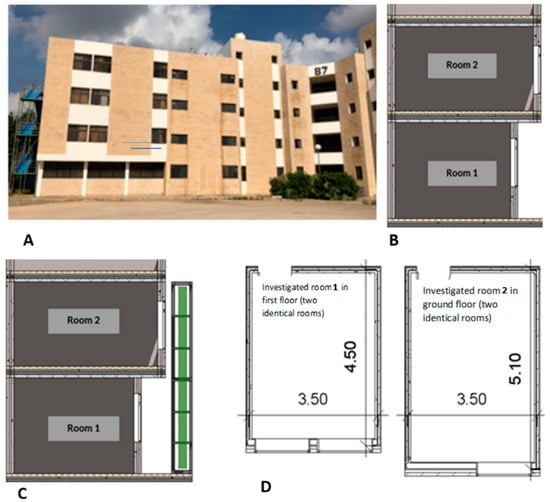
Figure 1.
(A) View the building under investigation, (B) section in the investigated rooms without GW, (C) section in the investigated rooms without GW, and (D) plan of the investigated rooms (two identical rooms in each floor).

Table 1.
Constructed building model details.
The shading efficiency of trees is a species-specific attribute, because of the varying crown structure and leaf density. The measurements proved that the Hedera helix is an evergreen climbing plant, growing to 20–30 m, and it was growing on some educational spaces at JUS, working as a shading device to block the sun and control the indoor temperature. The efficiency of these plants is directly dependent on the shape and density of leaves, (Porosity of the vegetative layer). Hedera helix was chosen for this study since it is prevalent, growing on the landscape on the JUST campus, and has rapid growth, quick vegetative mobility, wide leaf area, and climb ability [26]. The plant characteristics utilized in the green wall model were based on vertical vegetation parameters reported in the literature. The research studied variables are limited to the building type and plant species in addition to the Jordan climate.
2.1. Premlinary Field Measurements
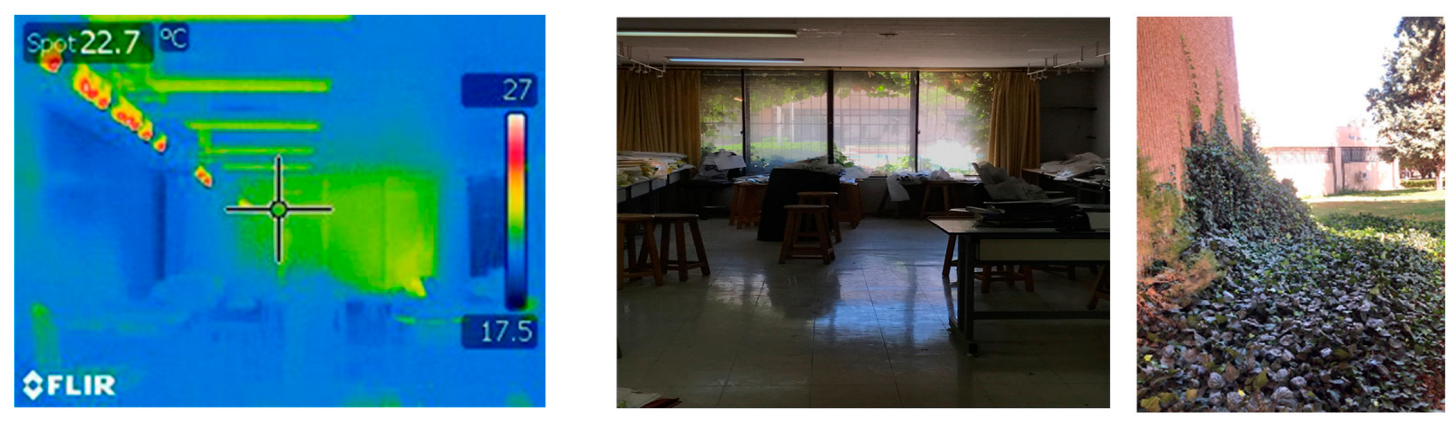
Field measurements of existing spaces at JUST campus with direct green wall show the positive effect of the direct green wall on the internal air temperature compared to the identical room without a direct green wall. Figure 2 shows the effect of these plantations on the educational space on the south façade with a recorded air temperature of 21.7 °C compared to 25.4 °C in the other identical spaces without a climbing green wall, with differences of around of 3.7 °C. Therefore, the potential result of the green wall helped to introduce the green wall as a climatic device at the university dorms, and as a climatic solution in hot climate regions.
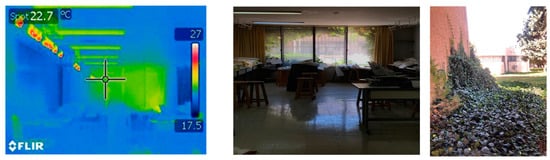
Figure 2.
Effects of climbing plants on indoor temperature.
The constructed green wall (6 m × 6 m × 1 m in L-W-H) of 36 m2, was made of a galvanized iron structure and covered with Hedera helix plant. At ground floor level, GW was fixed separately from the building as an indirect GW with 0.8 m cavity, while attached to the first-floor façade as GW with 0.2 m cavity. Each building was continually monitored for 15 days, from 23 November to 6 December 2020. During the measurements, all electrical devices were shut down, and the rooms were not occupied.
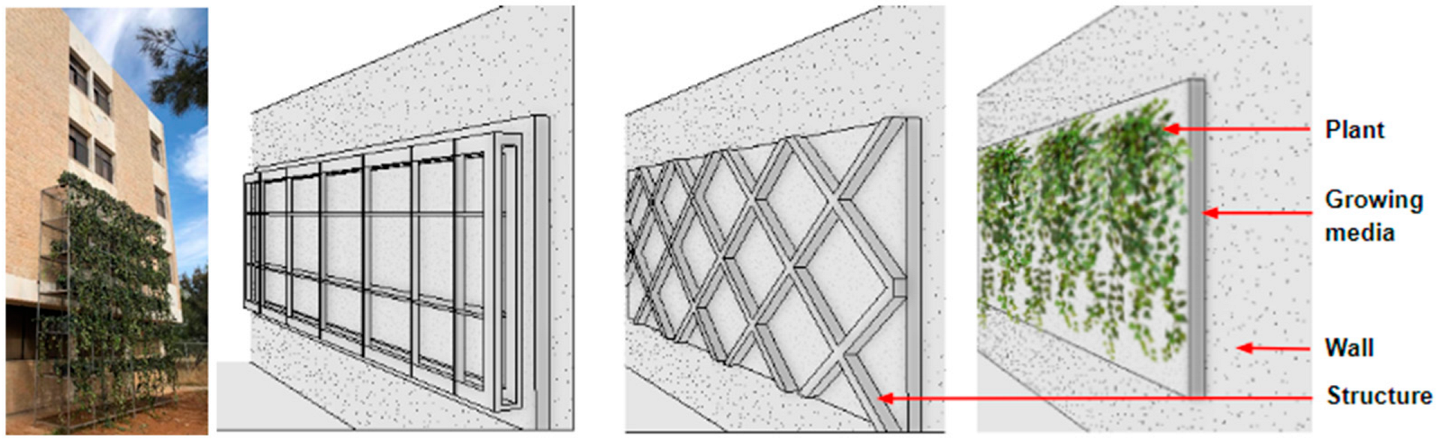
Figure 3 illustrates the cavity air depth, which is the distance between the building facade and a vegetative layer, which was 0.8 m at ground floor level and 0.2 m at the first floor. Figure 3 also shows the design types of different direct green walls to be used in the simulation as directly attached to the wall climbing plants or have a cavity of 0.10 m, with 0.02 m steps.
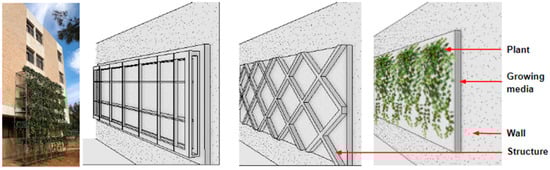
Figure 3.
Constructed green wall for field measurements and designed green wall for simulation studies.
During the measurement period (23 November to 6 December) the weather was mostly clear with some cloudy days. The mean ambient temperature (Ta) was 18.3 °C and the highest recorded Ta was 21 °C (Field measurements with Extech HD300 tool, manufactured by FLIR Commercial Systems Inc., Nashua, NH, USA, Table 2). The mean recorded relative humidity (RH) was 46%. During the measuring period, the ambient temperature of the cavity (the distance between the green wall and the building’s bare wall) was 0.2 °C lower than the ambient temperature of the location on average, and the relative humidity close to the green wall (within the cavity) was greater than the surrounding by an average of 4%.
Table 2.
Instrument specification was used for the field experiment.
2.2. Building and Green Wall Models
The model of the targeted building was created in Revit and DesignBuilder, and data were obtained from the JUST Engineering Project Unit. The simulation of green façade was based on four different simplified scenarios with different foliage coverage percentages, as shown in Table 3 and Figure 4, considering the wall as a layer with solid and void grid, the void presents porosity (air-filled gaps between leaves) to determine the most effective green facade scenario to reduce heat transfer and enhance indoor thermal comfort. The solid represents the green foliage layer of 70 mm thickness. Building 3 has the highest percentage of green wall porosity (void), with 45%, while Building 2 is similar to the green wall type that is used in field measurements.
Table 3.
Tested scenarios for the simulation and field experiment plant coverage percentage.
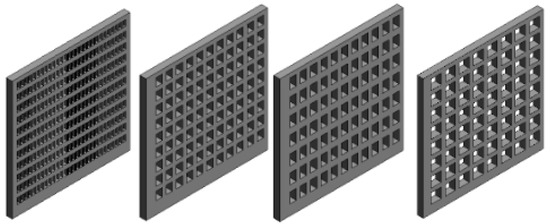
Figure 4.
Tested different foliage percentages scenarios; 1, 2, 3, and 4.
Based on previous studies, most researchers assumed that the green facade is a solid wall consisting of two layers, soil (or growing media) and plant, after studying the performance of green roof systems [25]. Sailor [27] created the “Eco-roof” which is a green roof energy model that can be embedded in the Energyplus software. The model could predict plant thermal characteristics such as evapotranspiration, convection, and conduction heat flow into the soil and plant layer. Researchers can define growing media thermal properties, depth, and plant properties such as height and Leaf Area Index (LAI). The thermal properties of the green plant layer were U value 0.529 W/m2·K, thermal conductivity was 0.239 W/m·K, and LAI was 0.61 m2 [2,28].
2.3. Validation of the Simulation Model
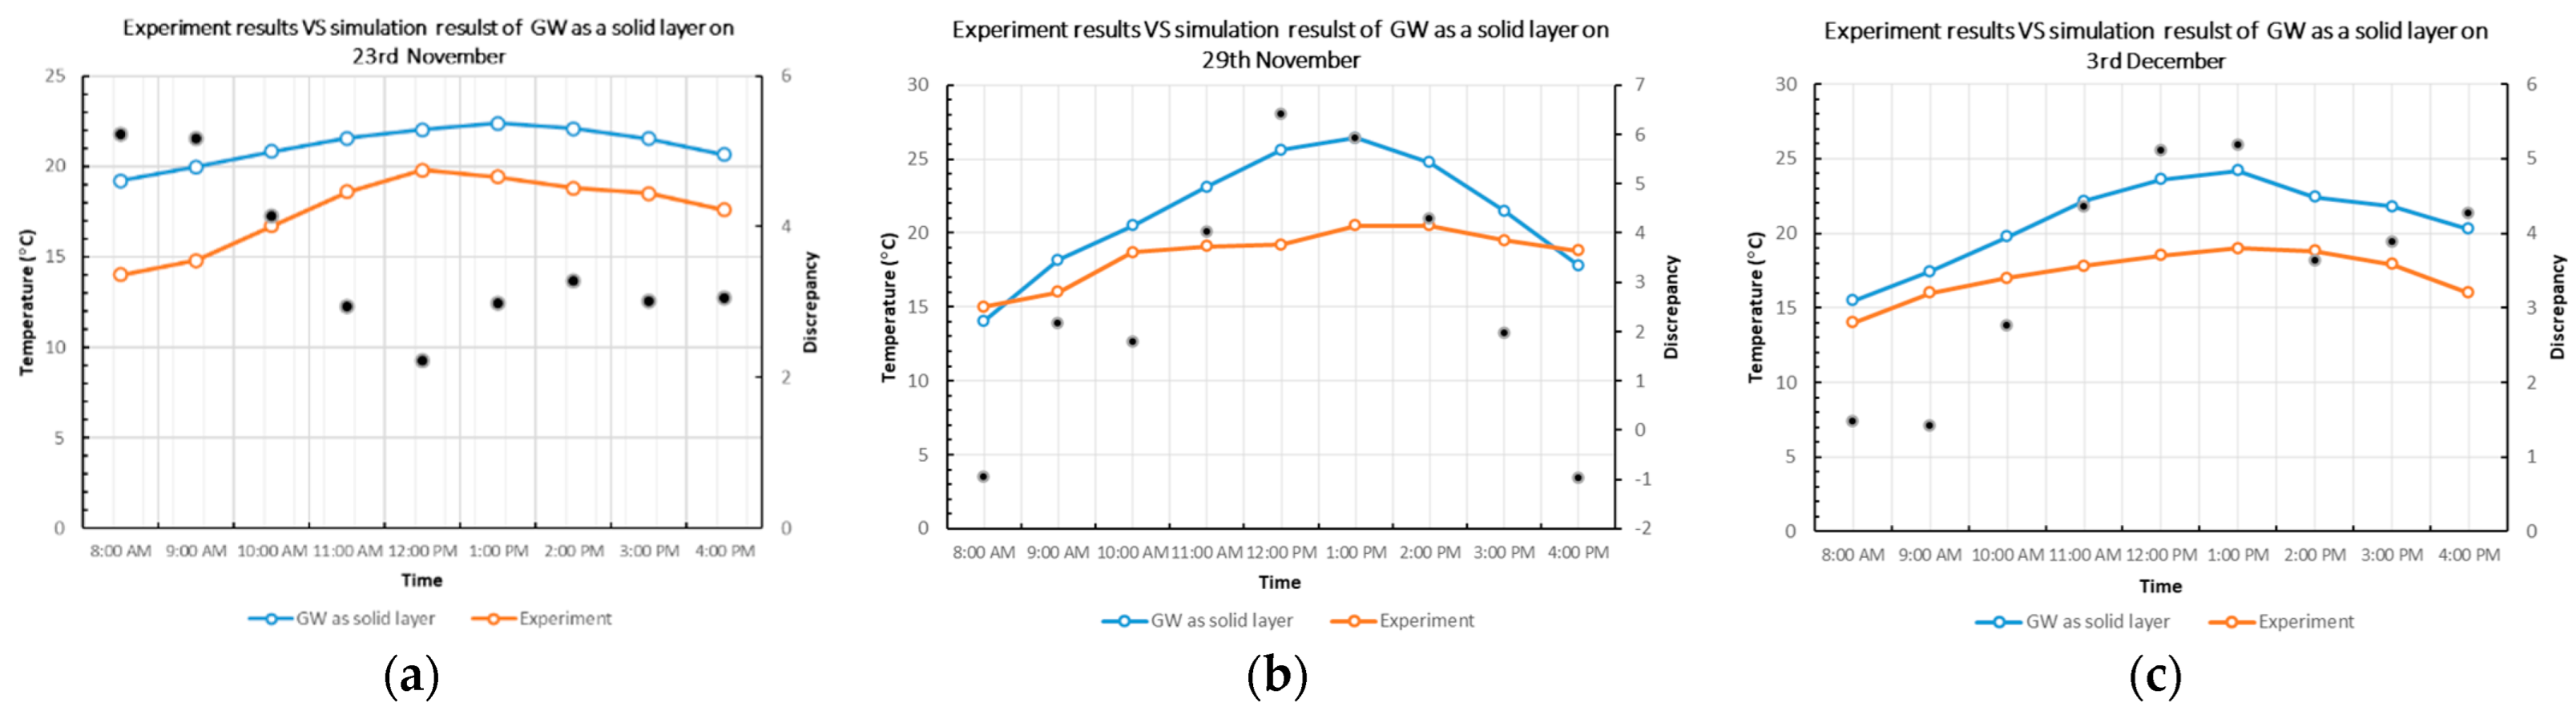
We aimed to simulate the green wall as a solid layer similar to that used in previous studies [25]. The result of this stage, as seen in Figure 5, showed that there is a difference between the simulated green wall as one layer (simulated exterior surface wall temperature with GW) and the experimental exterior surface wall temperature on 23 November, 29 November, and 3 December from 8:00 a.m. to 4:00 p.m., the absolute difference value was more than 7 °C (after 1:00 p.m.), and it could not predict the green wall thermal changes. On the other hand, a simulation of the base case rooms without green walls showed good agreement with real experiments, as seen in Figure 6. Therefore, the research developed more modules to simulate the real green wall and the structure of plants as solids and voids, which have significant impacts on the heat transfer process, airflow, and performance of the green wall. Therefore, four stages were developed based on the green wall structure presented in Figure 4. The green wall models were generated in DesignBuilder software. Considering the wall as a layer of solid and void grid, the void presents air-filled green wall porosity between leaves. The grid was designed after a void ratio determination process. Figure 4 shows the designed models studied in the current research that should be able to reliably predict the thermal performance of the green facade on the investigated building.
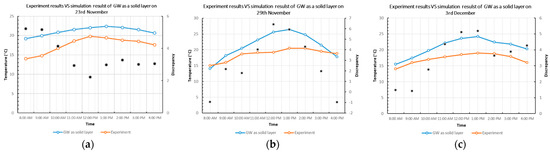
Figure 5.
Comparison of experiment results to simulation results of GW as a solid layer during the experiment period. (a) 23 November, (b) 29 November, (c) 3 December.
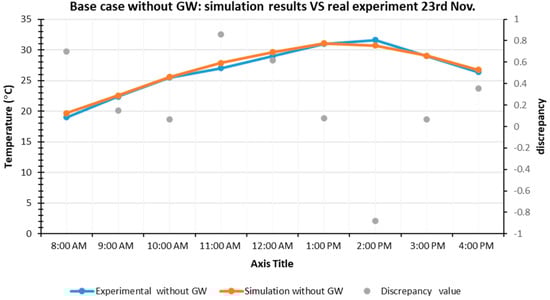
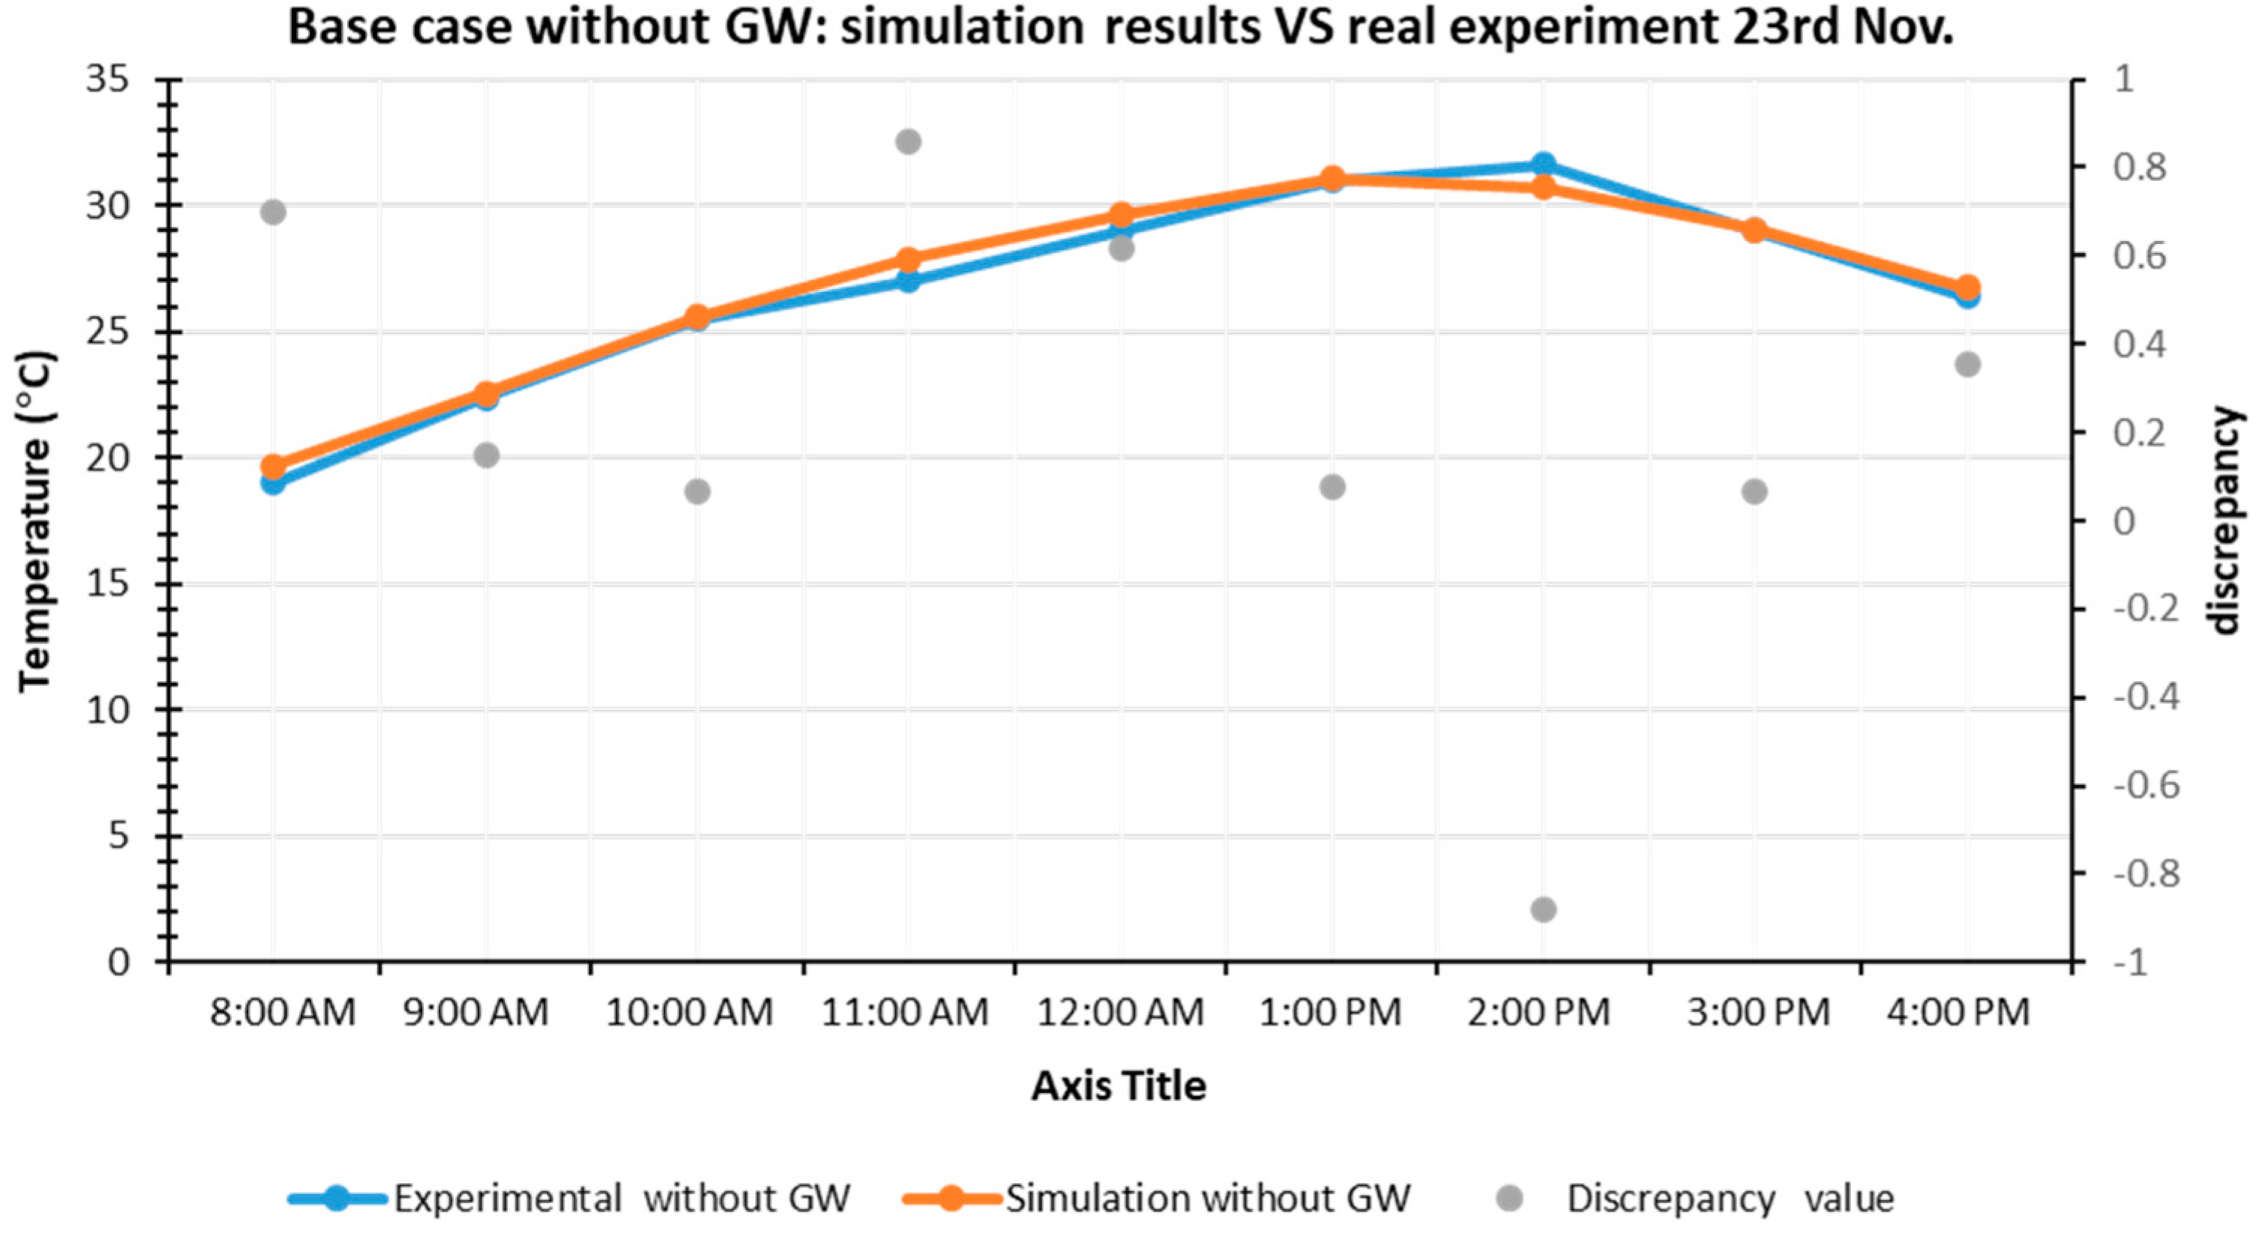
Figure 6.
Simulation results of the base case without GW compared to the experiment results.
In addition, simulation results of external surface temperature of the walls without GW were compared to the experimental exterior surface temperature of the base case in the studied period. The compared results show good agreement and the potential of the simulation setting to study new variables.
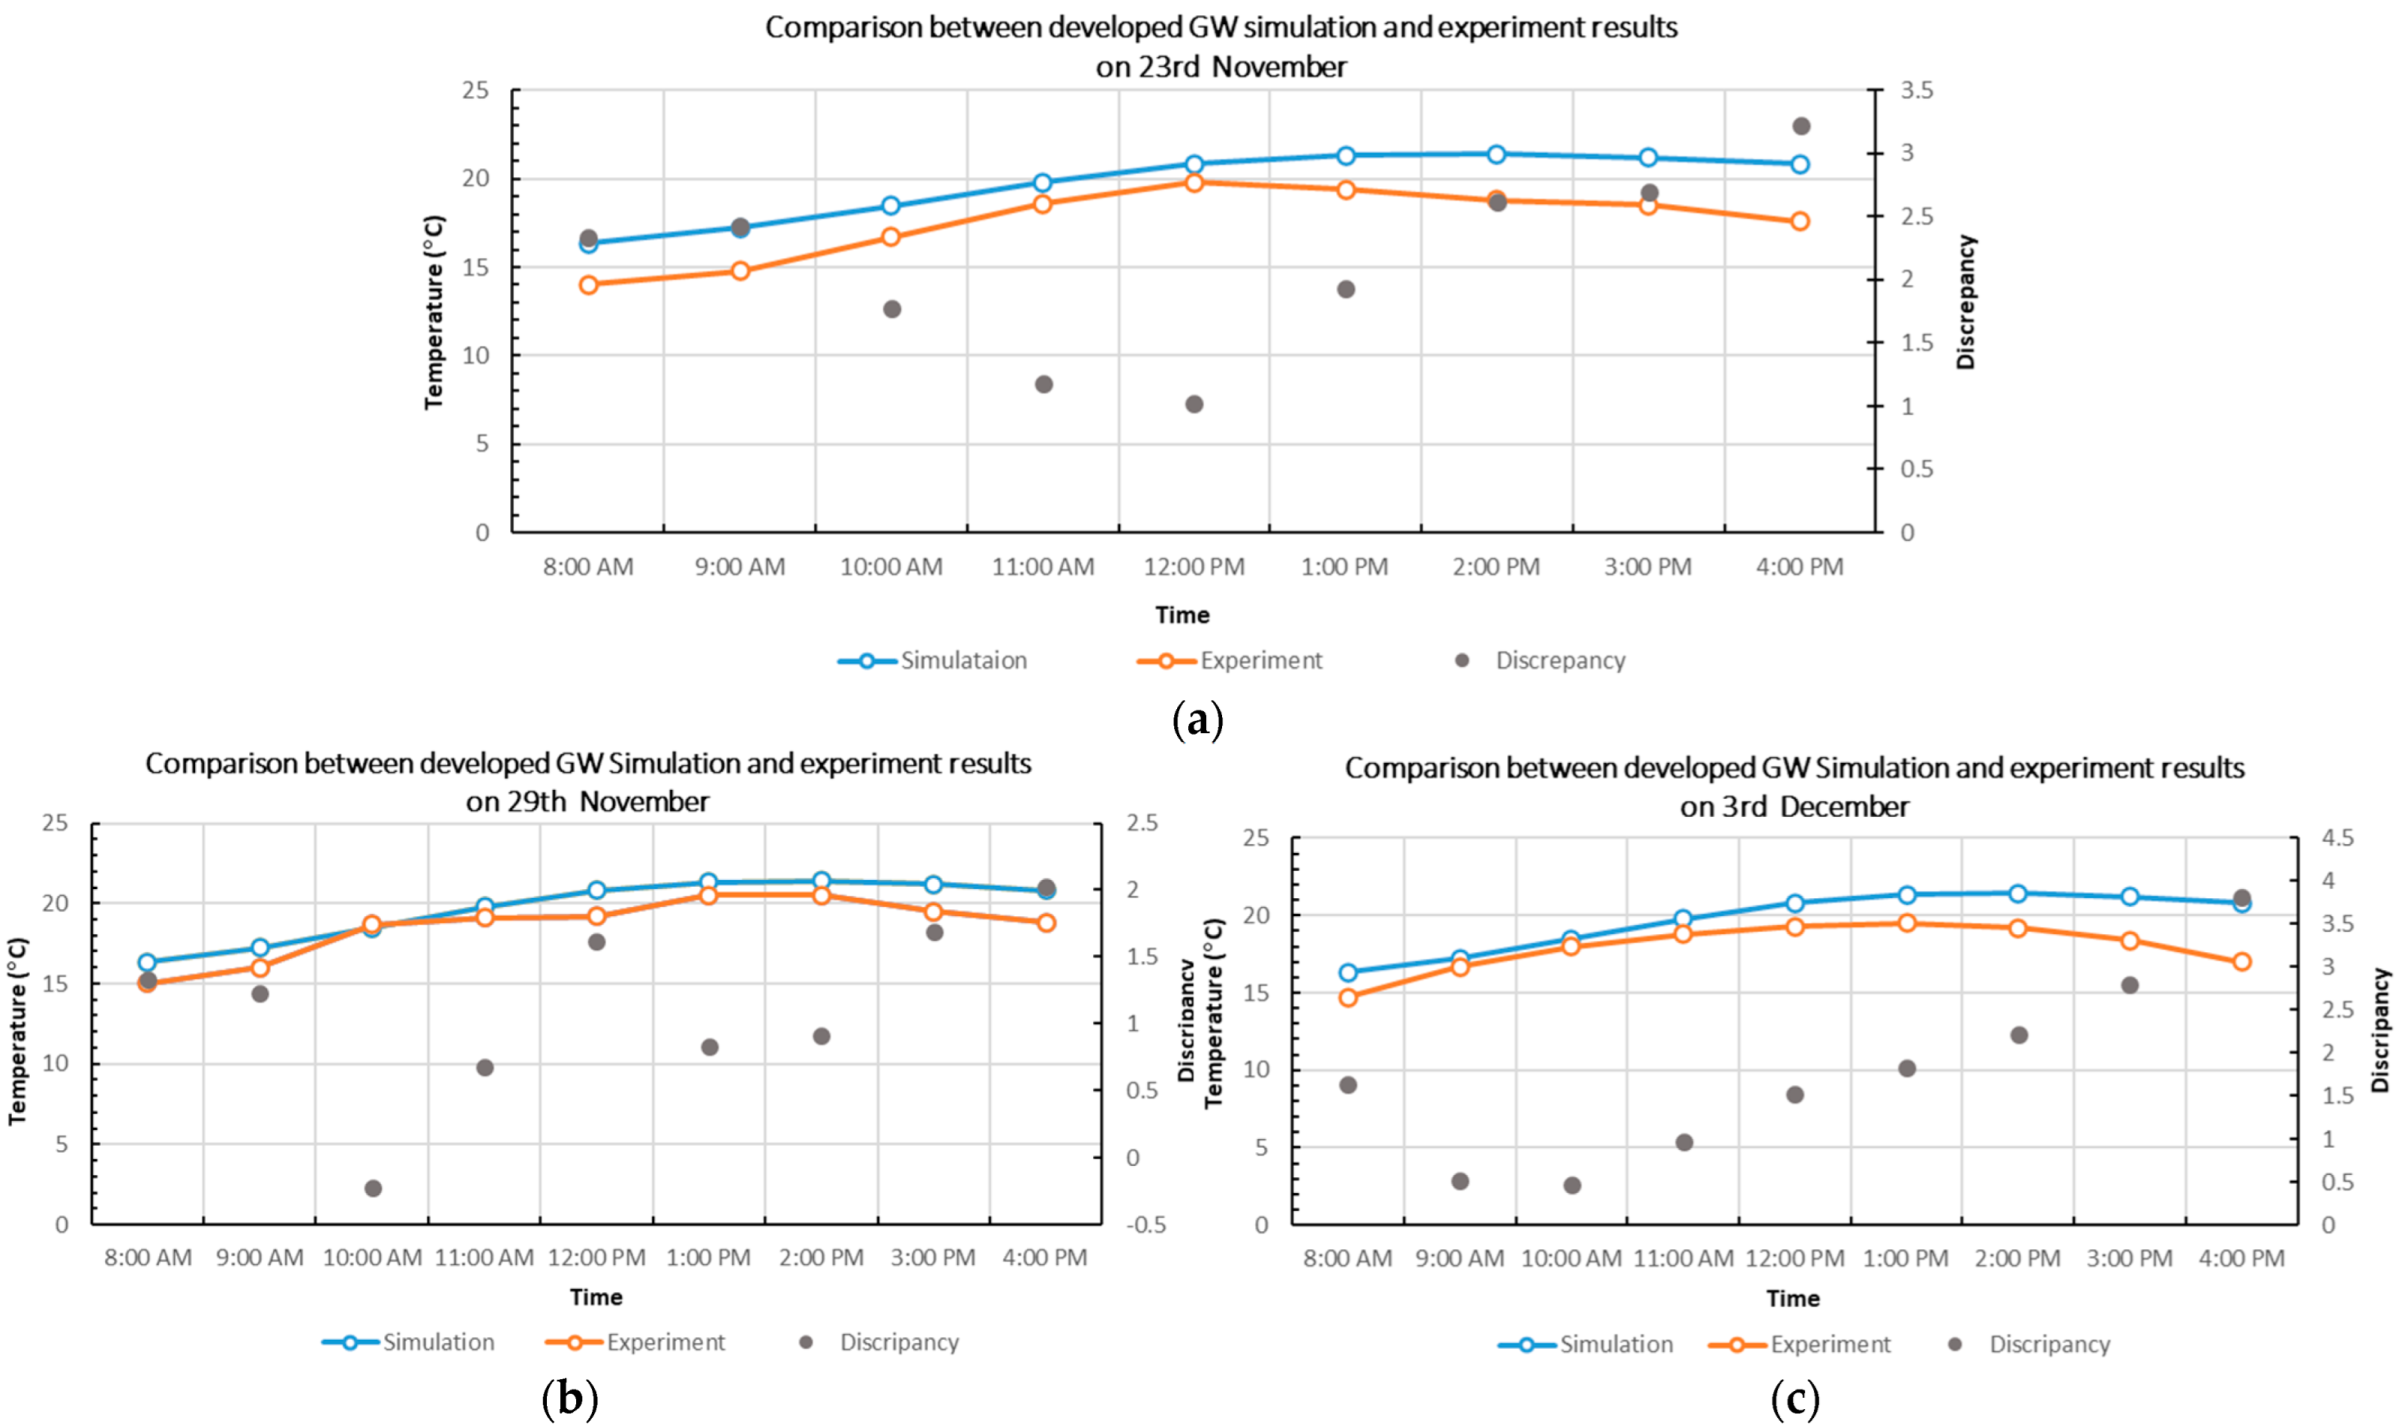
Figure 7 showed a comparison of the simulated exterior surface wall temperature with GW and to the real experimental exterior surface wall temperature on 23 November, 29 November, and 3 December from 8:00 a.m. to 4:00 p.m. witan h absolute difference less than 3.5, 2, and 4 on 23, 29 November, and 3 December, respectively. The total difference for all expected and recorded temperatures was around 2.1, which proved that the DesignBuilder model could be used to predict thermal changes in the investigated building. Results illustrate that there was a noticeable difference between the exterior surface wall that is covered with the green wall for both the simulation-based approach and experimental approach, related to the simplification process which does not take into account the biological processes of the plant. DesignBuilder assumes the green foliage as a layer similar to the building layers with different U-values. As a result, the same energy models were applied to analyze the other proposed scenarios of green wall installations, and scenario building 1 was proven to be the most reliable. In addition, discrepancy between DesignBuilder and measured data was calculated using mean bias error (Mean Bias Error Calculator, 2020) (MBE) giving as
where is the measured data from the physical model and is the DesignBuilder reading. The outcomes reveal a significant correlation between the experiment and the DesignBuilder findings, with a mean bias error of 1.501.
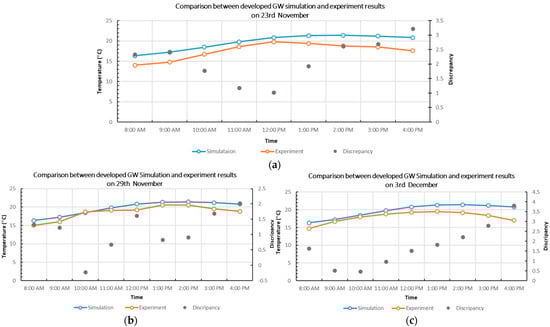
Figure 7.
Simulation with the developed new modules vs. experimental on (a) 23 November and (b) 29 November and (c) 3 December.
3. Results and Discussion
3.1. Real Experiment Results
During the measurement period (23 November to 6 December) the weather condition was mostly sunny and partially cloudy. The daily mean ambient temperature (Ta) was 18.3 °C, the highest recorded Ta was 21 °C, and the mean recorded relative humidity (RH) was 46%. The ambient temperature of the cavity between the green wall and building wall (which equals 1 m; depth of cavity area) was less than the ambient temperature of the site by an average of 1.2 °C during the measurement period, and the relative humidity near the green wall (within the cavity) was greater than the surrounding by an average of 4%. Many variables have been investigated and measured, such as interior- and exterior wall surface temperature, interior ambient temperature, and cavity temperature. The measured data are presented in the following sections.
3.1.1. Exterior Surface Wall and Cavity Temperature
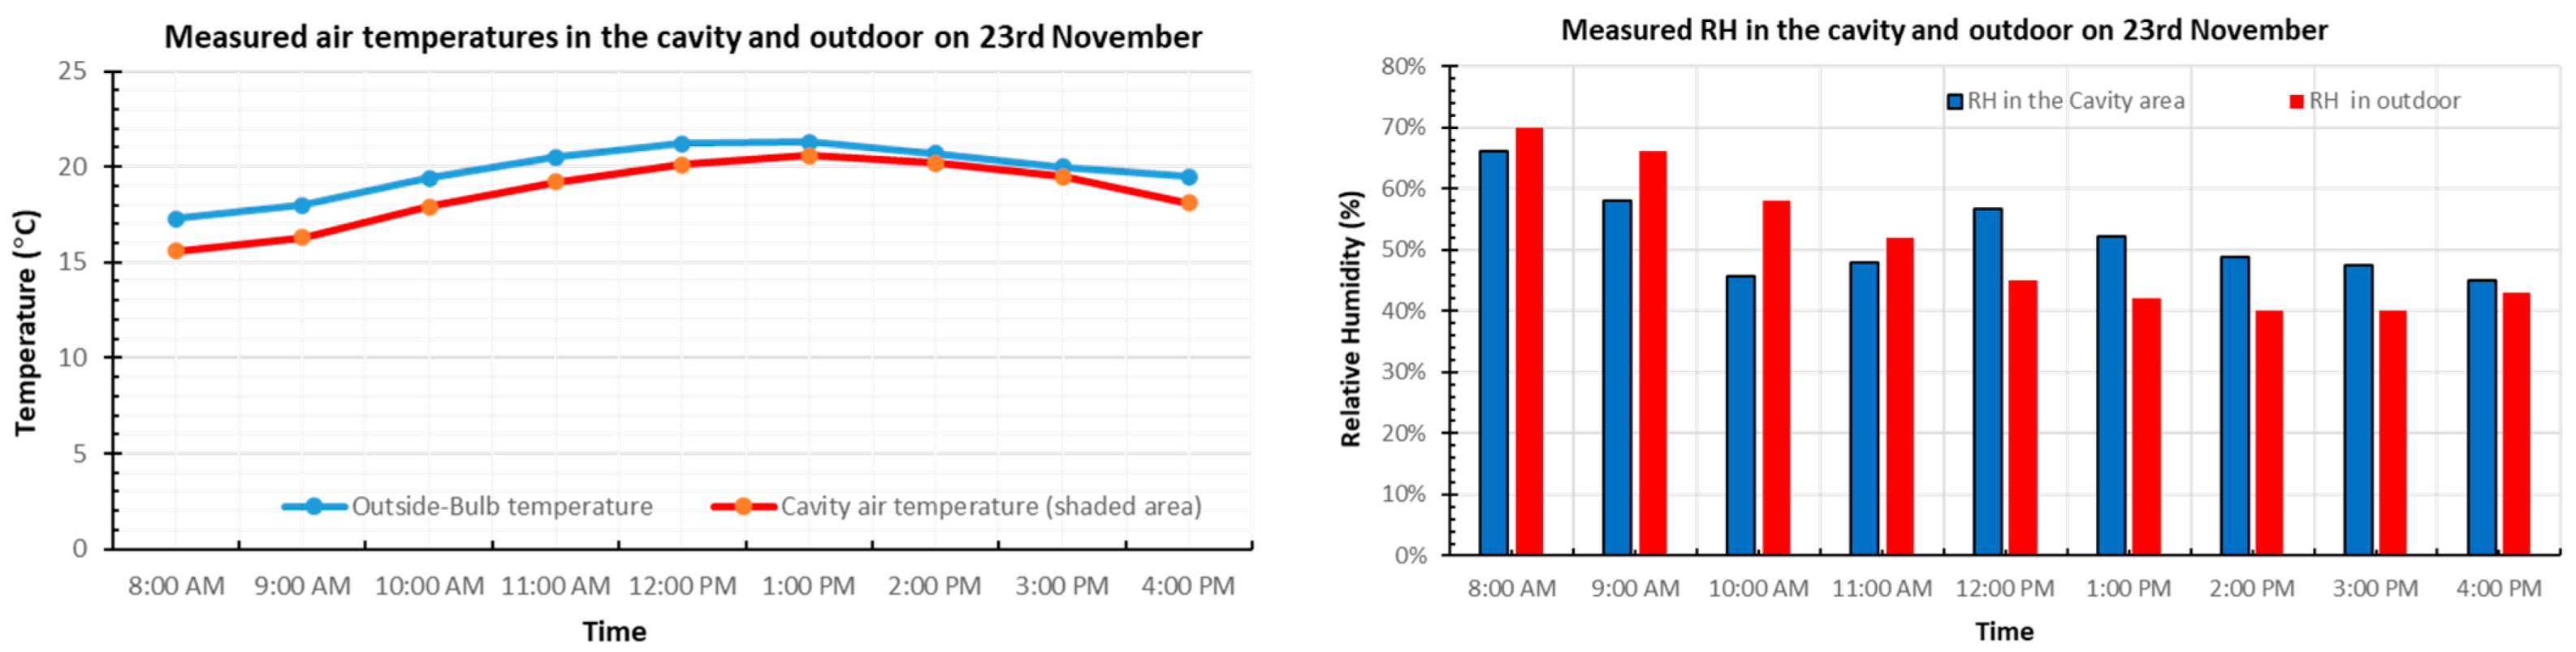
Field measurement results are shown below in Figure 8 and Figure 9. The results show that the average air temperature of the cavity area (shaded area between foliage layer and the masonry surface (bare wall)) was reduced by 1.1 °C in the daytime (8:00 a.m.–4:00 p.m.). Ta (temperature of the air) results revealed that the thermal environment of the cavity area was better than that of the outdoor and unshaded environment. Figure 8 also illustrates the relative humidity levels through 23 November with the highest levels at 8:00 a.m. and 4:00 p.m., and the only significant increase in RH occurred on “warm day” afternoons during high solar radiation, and high dry-bulb temperatures periods. In this situation, the increase in evaporation rates led to higher RH measured values behind the foliage layer, the RH was 11.4% higher than that measured by the ambient environment.
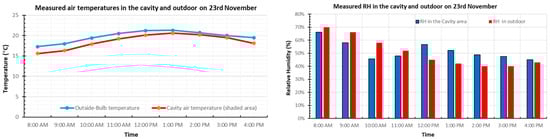
Figure 8.
(Left) Result of field measurement; outside-bulb temperature and cavity air temperature on 23 November, (Right) relative humidity in the cavity area and the outdoor.

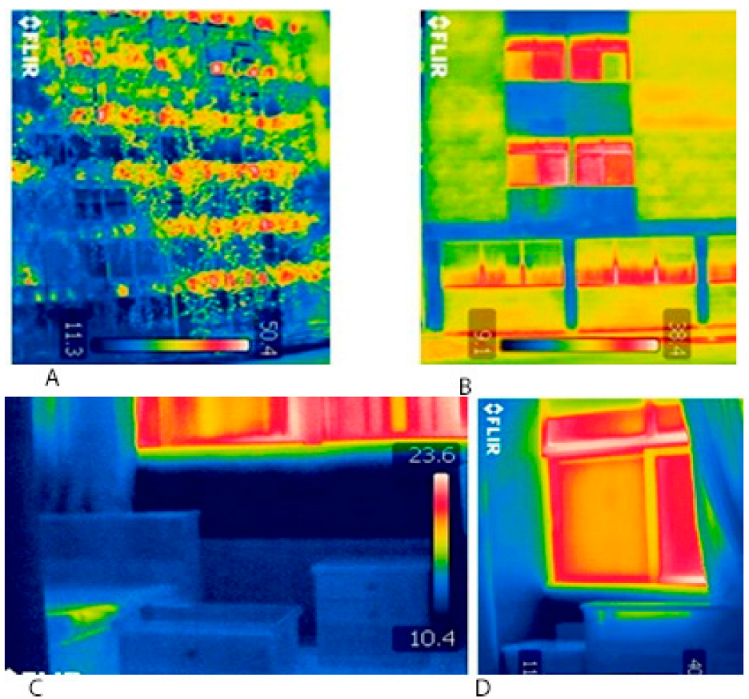
Figure 9.
Thermal image of Ts exterior wall for ground floor rooms, covered with green wall (A), without green wall (B), Thermal images for Ts interior walls, covered with green wall (C), and interior wall for ground floor rooms not covered with GW (D).
The exterior wall surface temperature of the southern façade with the green wall was lower than the base case wall without a green wall surface by an average of 7 °C, as seen in Figure 9. The green wall was effective in shading the building’s façade, by minimizing the surface temperature of the wall. There is a slight change in Ts exterior on the covered wall, while temperatures of Ts exterior of the base case wall changed continuously over time.
In thermal images of Figure 9, based on the colour of the temperature scale provided, the differences in surface temperatures for the covered wall (with foliage layer) and the base case wall are clear in thermal images taken by an infrared camera. Dark blue indicates low temperature, and red/white indicates high temperatures. These images were taken on 24 November 2020 at 1:00 p.m., Ts masonry wall reached 30 °C, while Ts covered wall was 16 °C.
3.1.2. Interior Surface Wall and Room Temperature
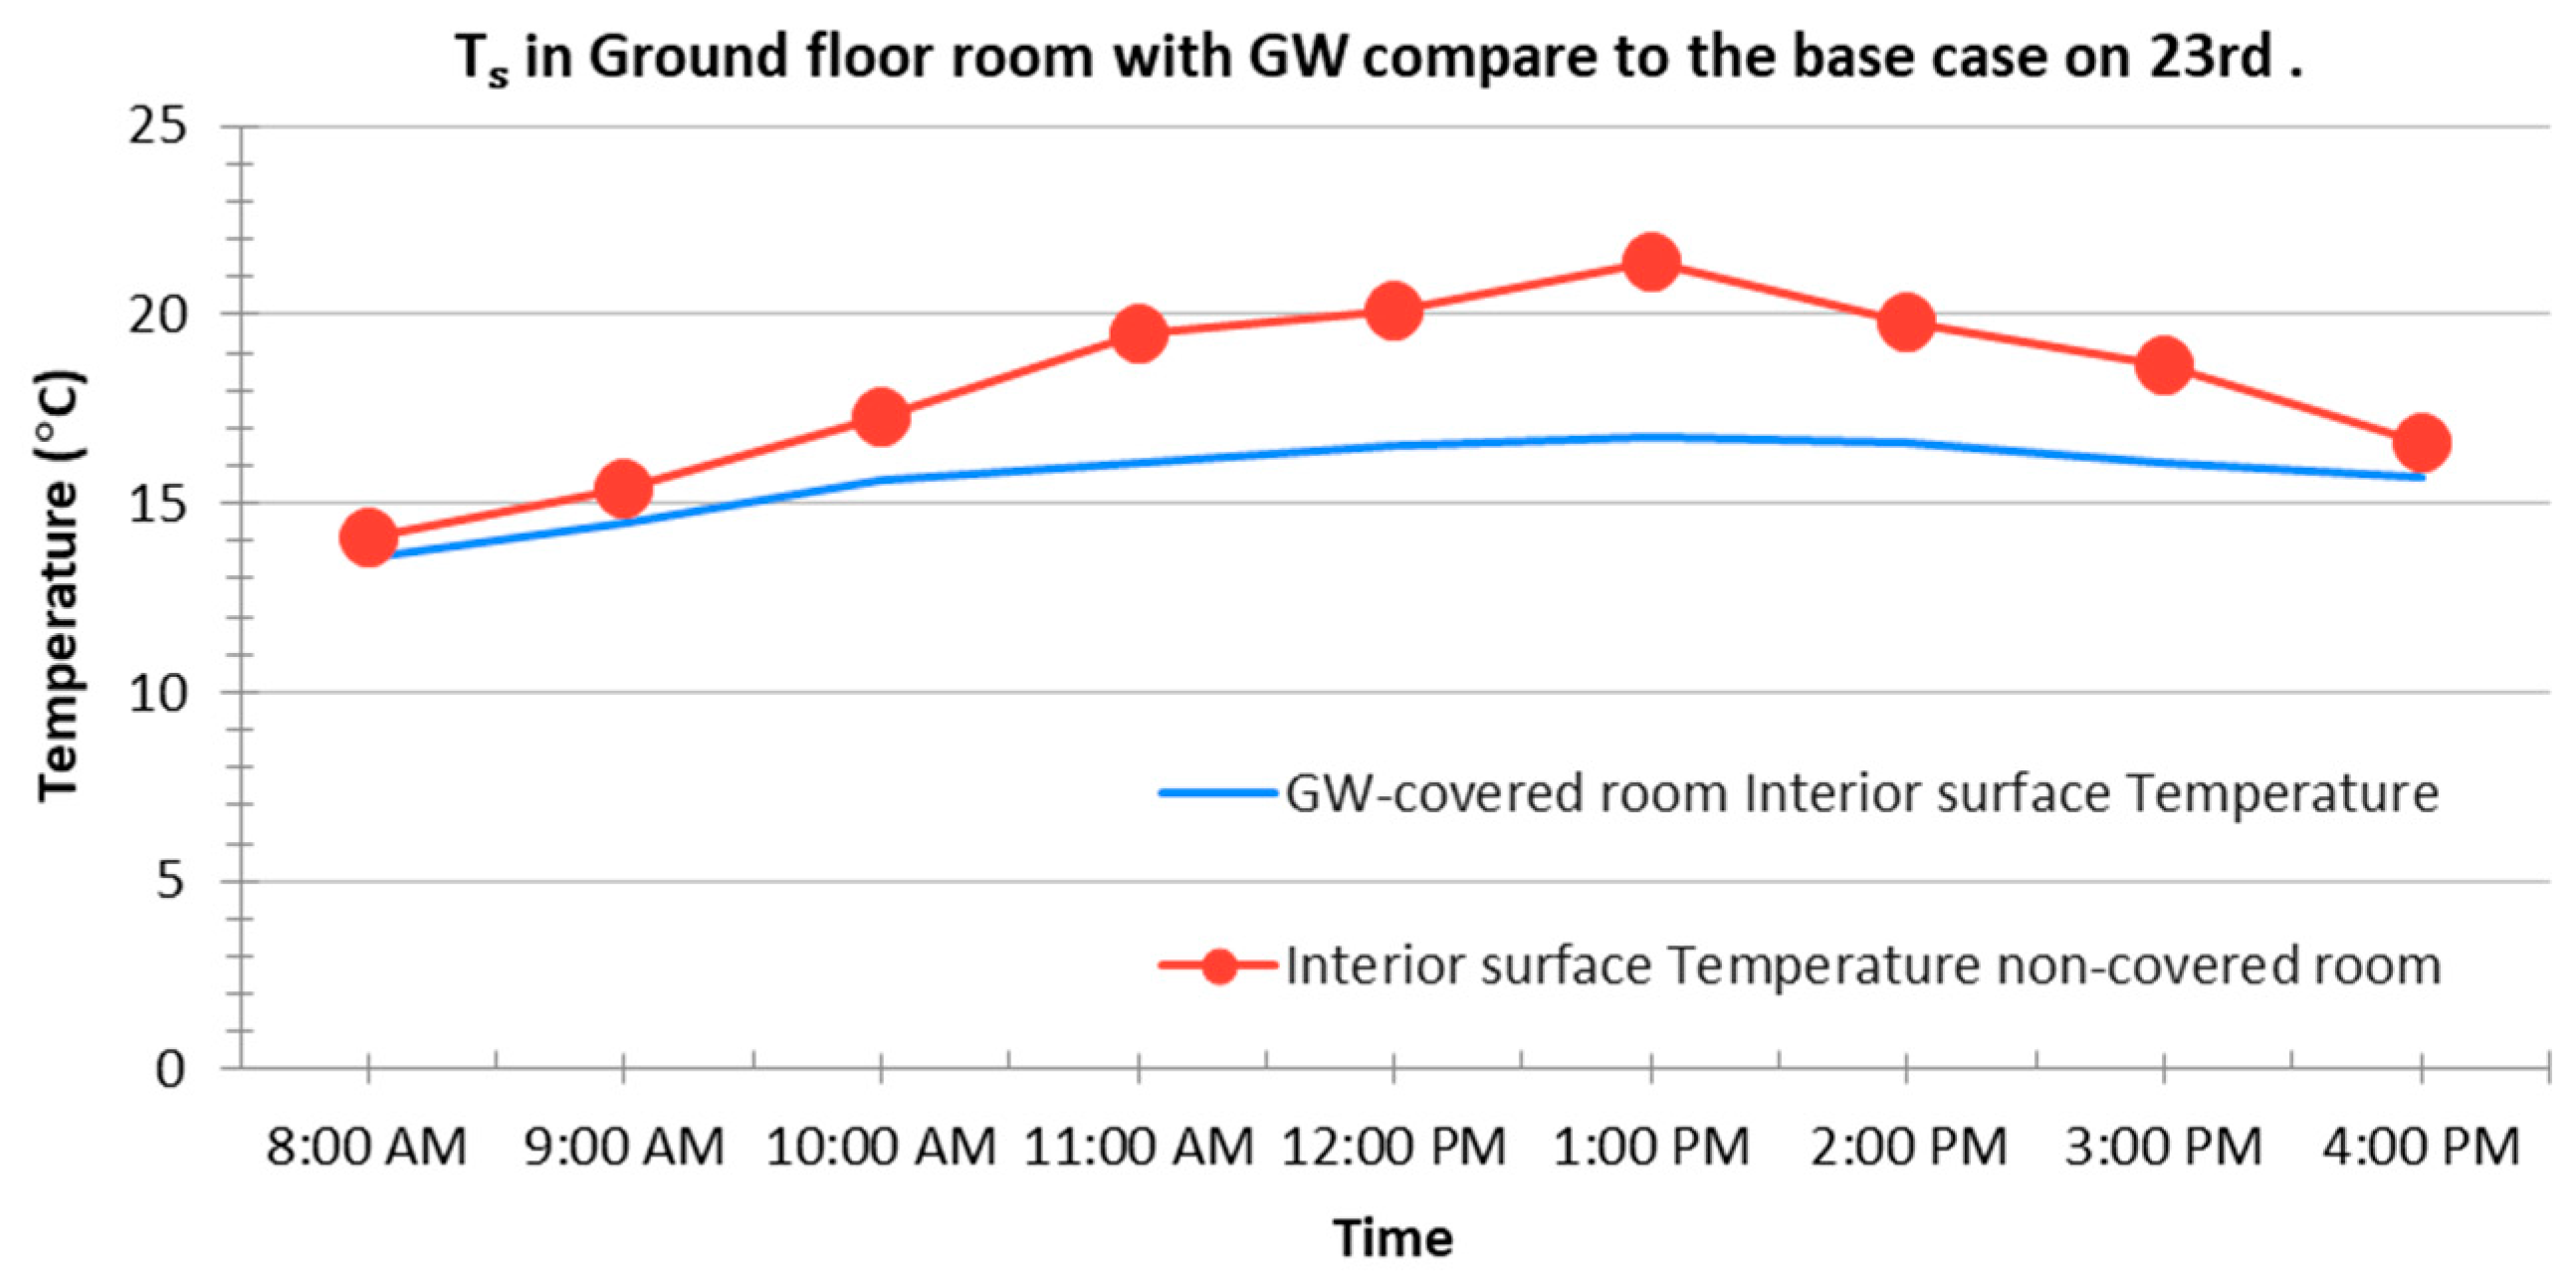
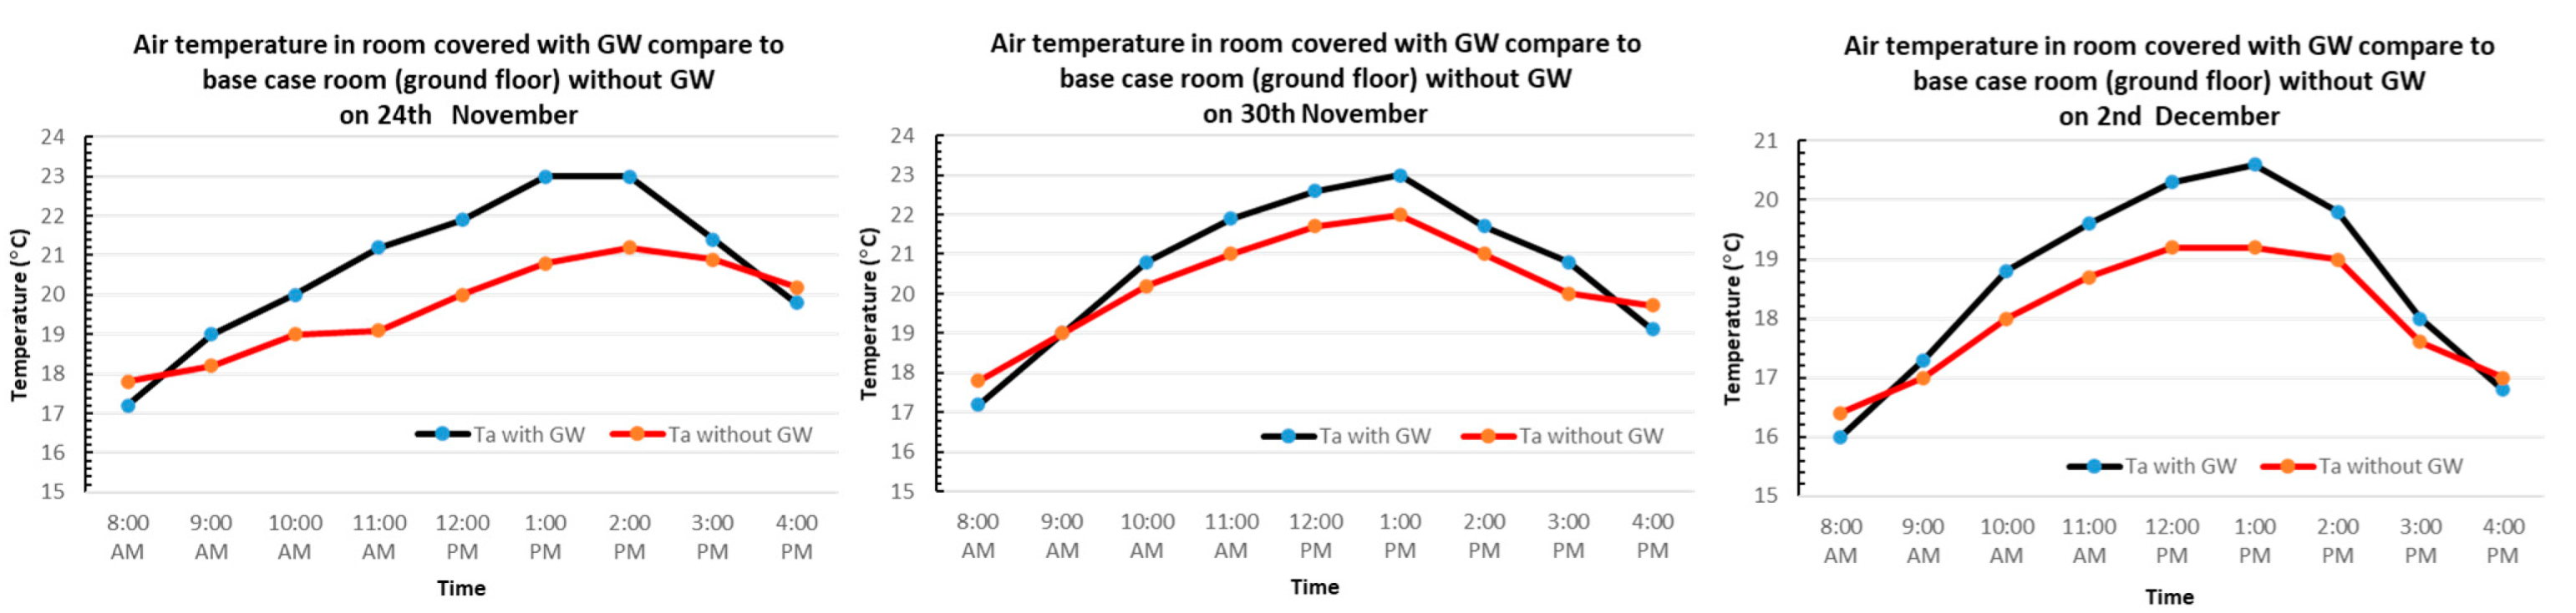
The indoor, thermal parameter, Ts interior of the wall, and illuminance level Ev were investigated. The shading effect of GW was clear between the investigated first floor rooms, Ts interior for the covered wall was less than Ts base case interior wall by (0.5 °C–4.6 °C) through the study period, as seen in Figure 10, on 23 of November. The difference in Ts interior on the ground floor was slightly smaller (0.1 °C–2 °C) due to the south façade being recessed by 0.6 m. Although there was a clear difference in Ta for ground floor investigated rooms, the room with the covered wall was cooler by 0.2 °C–1.9 °C from 9:00 a.m. to 3:00 p.m. in the study period, as seen in Figure 11, for days of 24 and 30 November and 2 December.
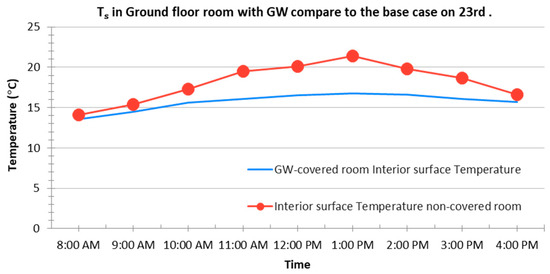
Figure 10.
Interior surface temperature Ts for GW-covered room compared to the interior surface of the base case on 23 November.
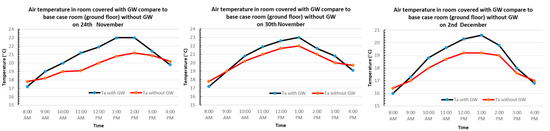
Figure 11.
Results of air temperature (Ta) for ground floor rooms (with GW and without GW) on 24 and 30 November and 2 December.
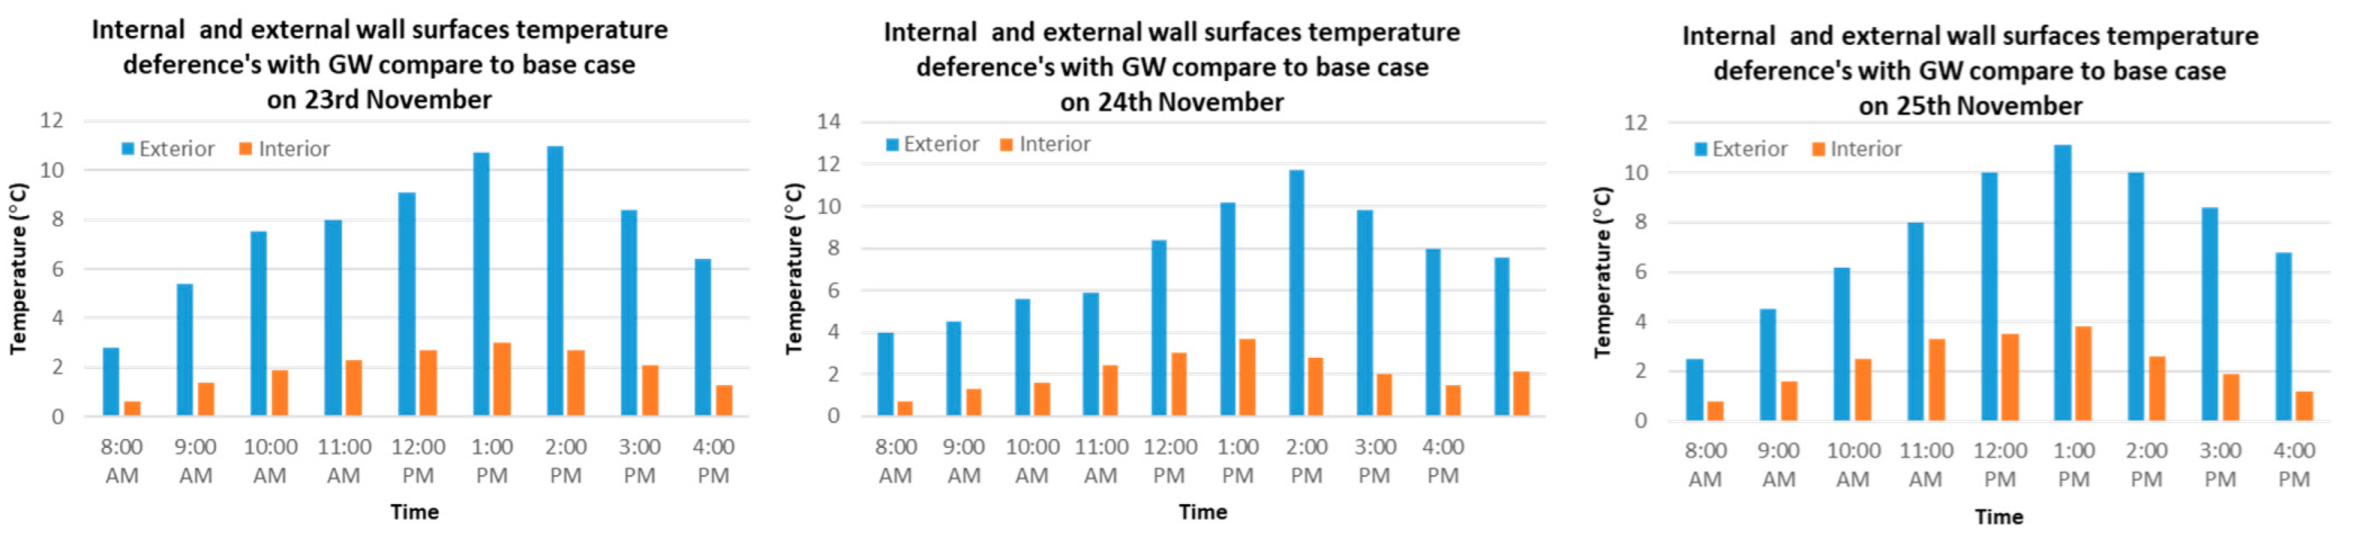
Based on the literature, a green wall significantly affects the heat transfer process, reduces heating of the wall by radiation, and reduces warming of the air temperature in the cavity area, therefore reducing heating of the building by radiation, convection, and conduction processes. The reduction in temperatures for exterior surfaces by green wall is higher than the reduction for interior surfaces. Figure 12 shows air temperature reduction as a result of using GW on both interior and exterior surfaces. The GW-covered exterior surface is cooler than the masonry exterior surface during daytime hours, the exterior Ts reduction by GW is between 2 °C to 12 °C on 23, 24, and 25 November with an average of 7.7 °C, 7.56 °C and 7.52 °C on 23, 24, and 25 November, respectively. On the other hand, the green wall helped to reduce the interior wall surface by 0.5 °C to 4 °C with an average of 2, 2.11, and 2.35 °C on 23, 24, and 25 November, respectively. The air was generally stable: the recorded air velocity did not exceed 1 m/s, because the prevailing wind in Jordan is northwest, while the orientation of the investigated façade was south, which means the winds pass along the façade and do not penetrate it.
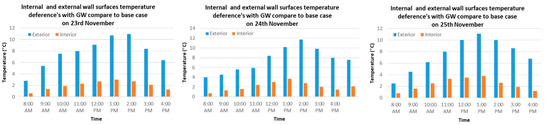
Figure 12.
Internal and external wall surfaces temperature differences in a room with GW compared to the base case without GW on 23, 24, and 25 November.
Long term real measurements during the nighttime and early morning showed that air temperature and surfaces temperature of the base case rooms on first and ground floors reduced faster compared to the rooms with green walls. The measurements recorded air temperature of base case rooms of 0.4 °C–0.6 °C less than the rooms with green walls early in the morning. A green wall acts as an additional thermal mass layer which reduces the heat-loss process and slows heat release and exchanges with the ambient air compared to the base case. On the first floor, the GW with a small cavity reduced heat loss more than that on the ground floor with a large cavity, which allowed for heat loss by convection and heat exchange between the cavity and exterior air, thus it helped to cool the interior spaces faster. Heat loss for the non-covered room was slightly faster in the afternoon period. Infrared imaging recorded a large difference in rooms’ interior surface temperatures without a green wall compared to that with a GW. Designing the green wall should take into consideration, besides the shading effects and cooling during the daytime, the cooling process and heat exchange during the nighttime, which depends on foliage ratio and cavity distance.
3.1.3. Daylight Results
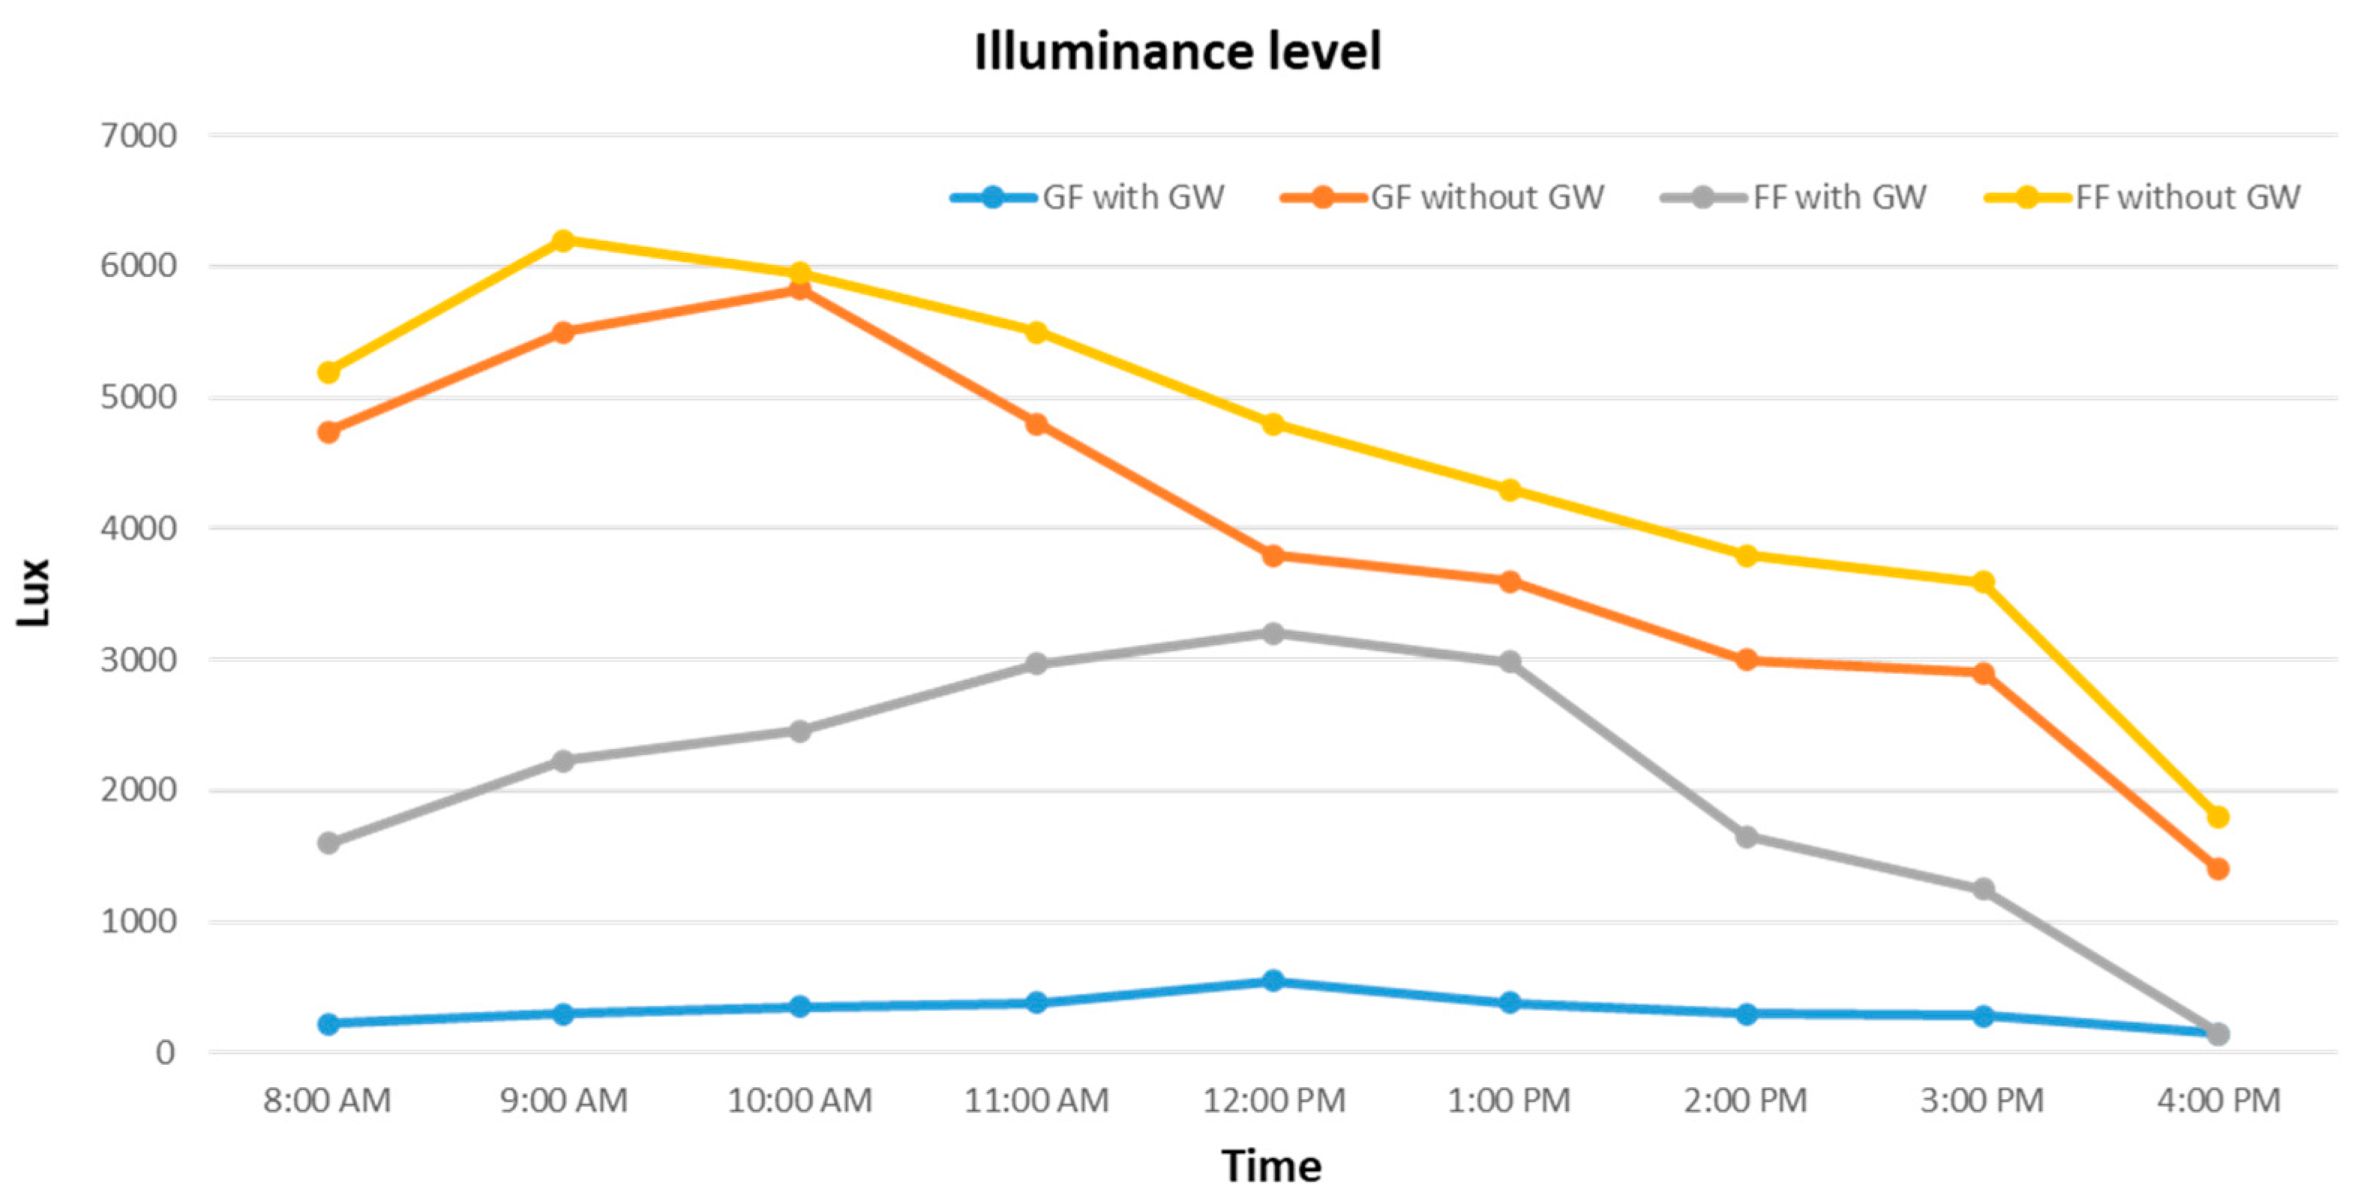
We investigated the impact of the green wall on daylight performance and shading performance by measuring hourly illuminance levels, as shown in Figure 13. The highest outdoor recorded illuminance level was at noon (12:00 p.m.) with 65,235 lux on a sunny day. Measured illuminance levels at the ground floor with GW did not exceed 500 lux due to the large cavity between GW and the building on the ground floor, while there was an illuminance level of about 3000 lux on the first floor with a GW with a small cavity. Recommended lighting levels are between 150 lux (general activity) and 500 lux (focused activity; reading) [29]. The green walls helped to control the high illuminance level in the study rooms compared to rooms without GW on both first floor and ground floor. It helped to reduce the illuminance level from around 600 lux to 3000 lux on the first floor and around 500 lux on the ground floor with a large cavity. Therefore, green walls helped to improve both the quantity and quality of daylight by improving the uniformity, minimum to maximum illuminance level, and thus reducing the glare and high level of daylight. Daylight study proved the importance of design of the green wall variables, such as foliage and cavity the distance between GW and the building, along with studying the shading effect of the other building or building elements, such as cantilevers, as seen in Table 4.
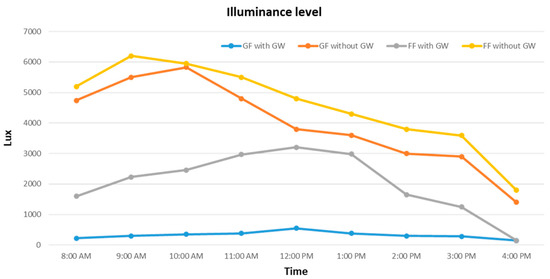
Figure 13.
Measured illuminance levels on 23 November in rooms on the ground and first floor.
Table 4.
Solar and Shading study of the studied building on 23 November from 8:00 a.m. to 4:00 p.m.
3.2. Simulation Results, Optimization Variables
3.2.1. Green Facade Foliage Scenarios
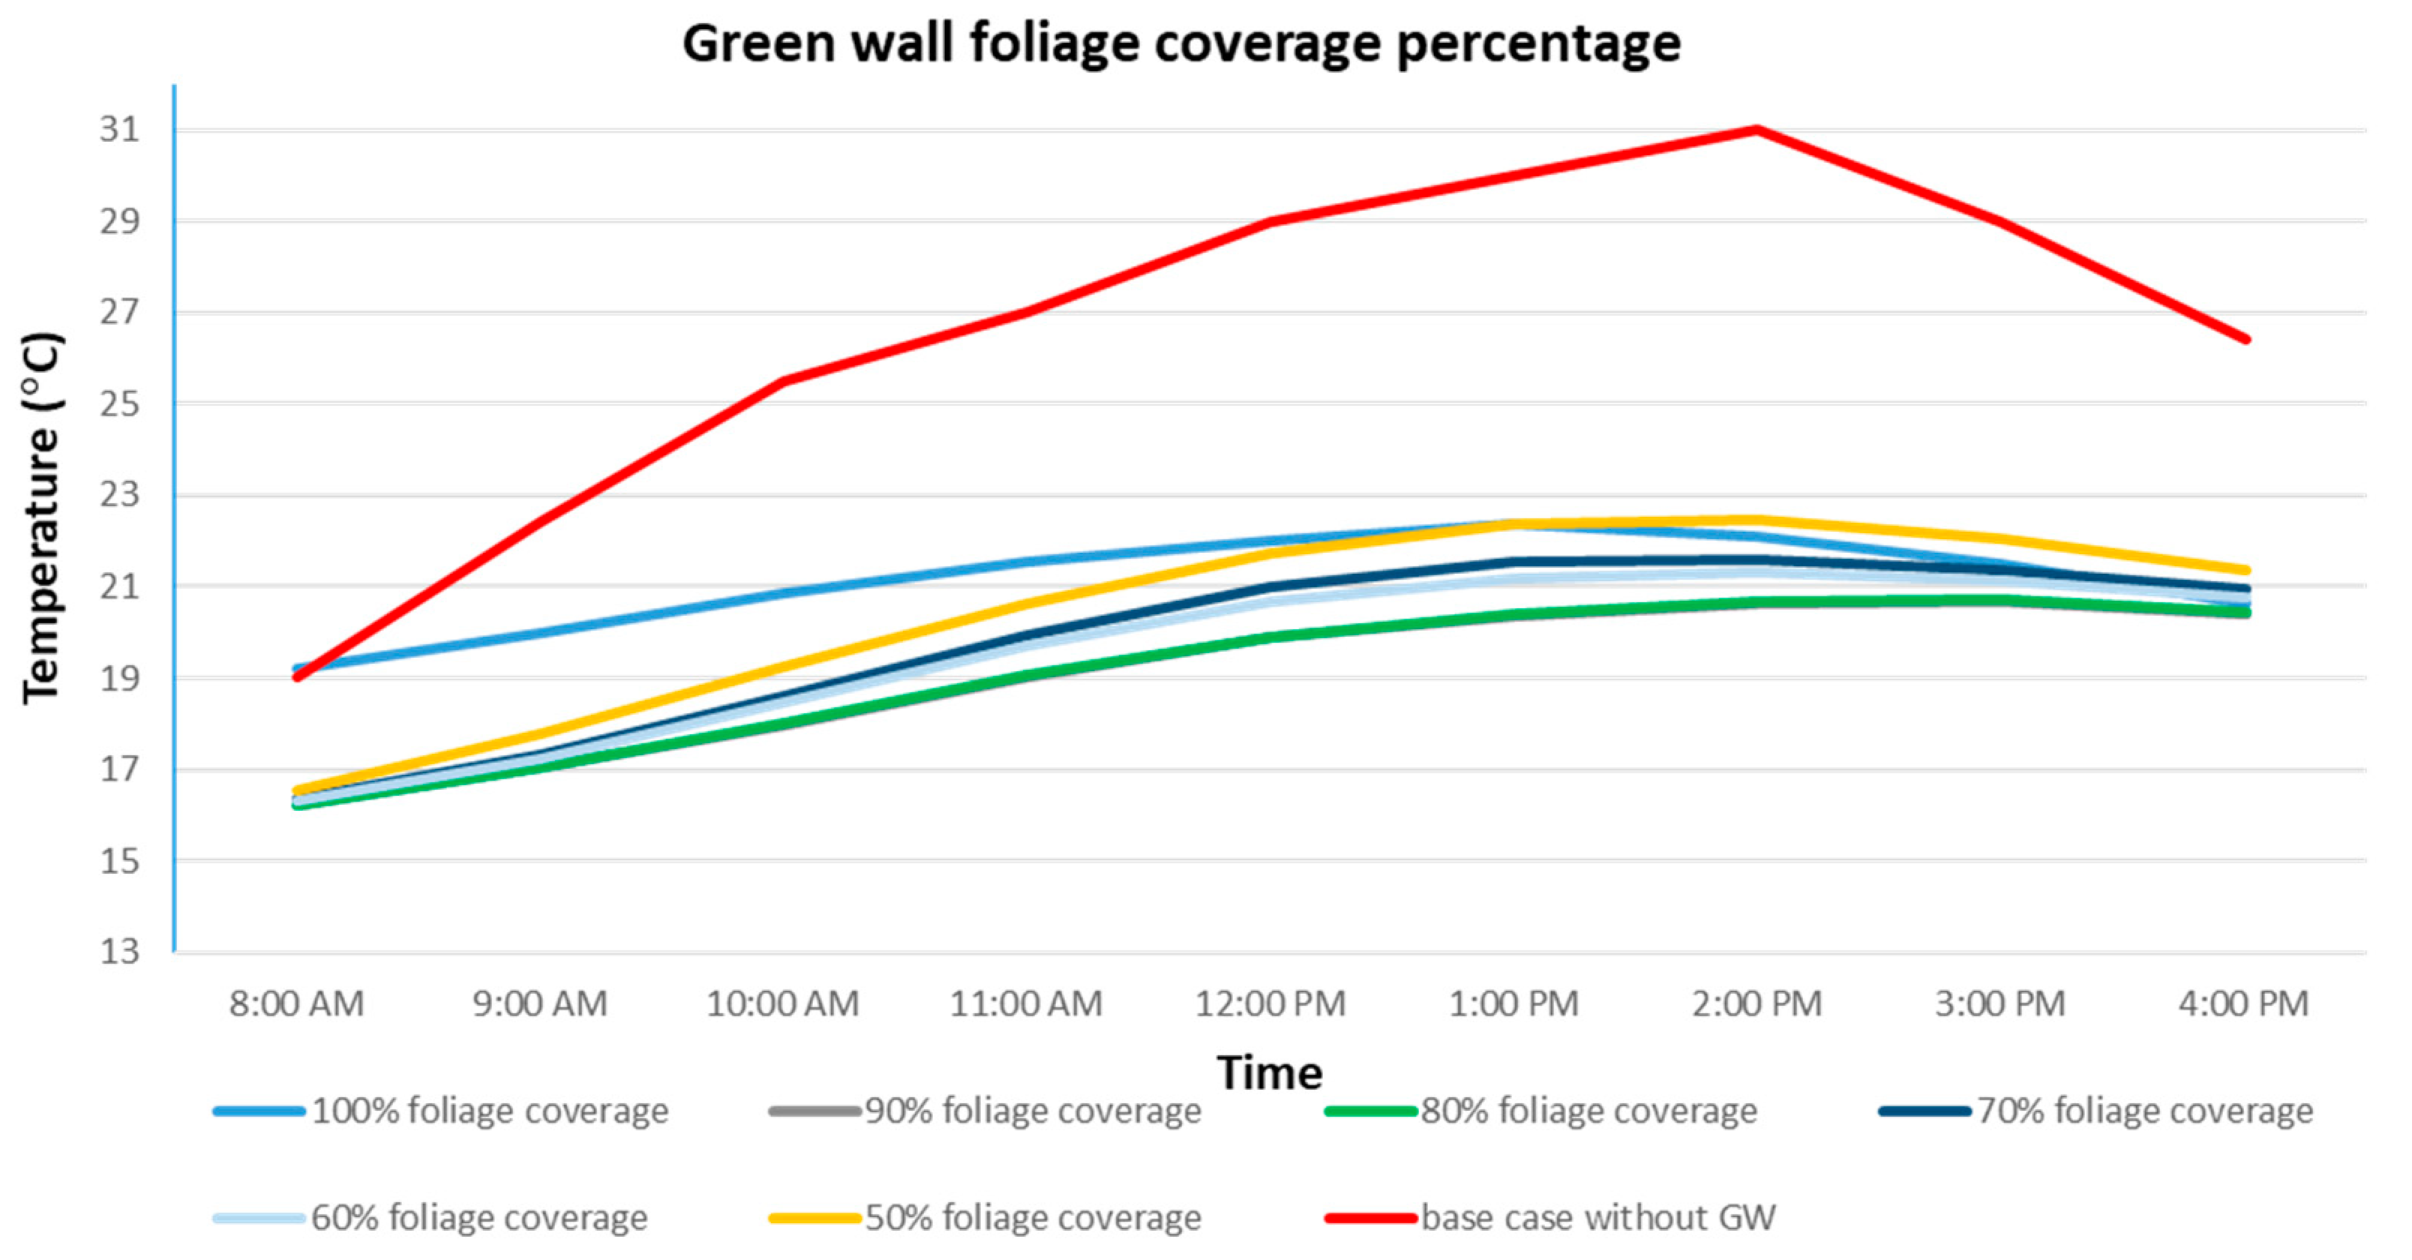
Different plant coverages and foliage parentage were investigated in order to optimize GW performance and develop design guidelines. The six studied scenarios with foliage percentage varied from 100% to 50%, and the impact of different foliage on surface wall temperatures, Ts, were recorded and compared to the field measurement of GW-covered wall surface temperature, as seen in Figure 14. The first scenario of around 50% foliage coverage had a low percentage of foliage coverage and recorded an average Ts reduction of 5 °C, while the green wall with around 60% foliage coverage recorded an average of 6.5 °C. It is obvious from Figure 14 that increasing foliage coverage increases the effectiveness of the GW shading effect, which means the thermal performance of the ambient environment. On the other hand, increasing the foliage coverage by more than 80% will slightly improve the heating gain and shading performance of the green wall in summer on account of the other indicators such as daylight and view. Moreover, high foliage coverage decreases the airflow rate, which reduces heat loss/gain through convection and covering the building’s opening will decrease the natural ventilation rate with the building’s surrounding environment. It also blocks solar radiation from reaching the building in winter, thus increasing the heating load, and blocks natural lighting and direct sun rays, besides the additional structural and cost issues. Therefore, around 60% converge, which is close to the real experiment percentage, represents the best average for thermal performance and shading, and it was used in the next section for further optimization in studying the air cavity.
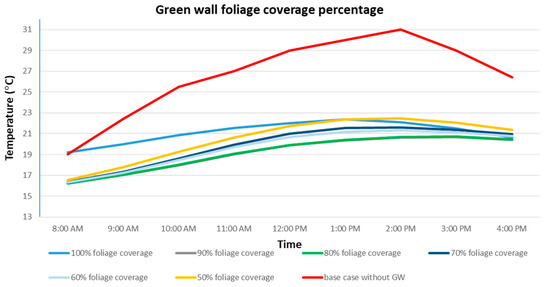
Figure 14.
Comparative study for 6 scenarios of green wall design configuration at 0.02 m cavity depth.
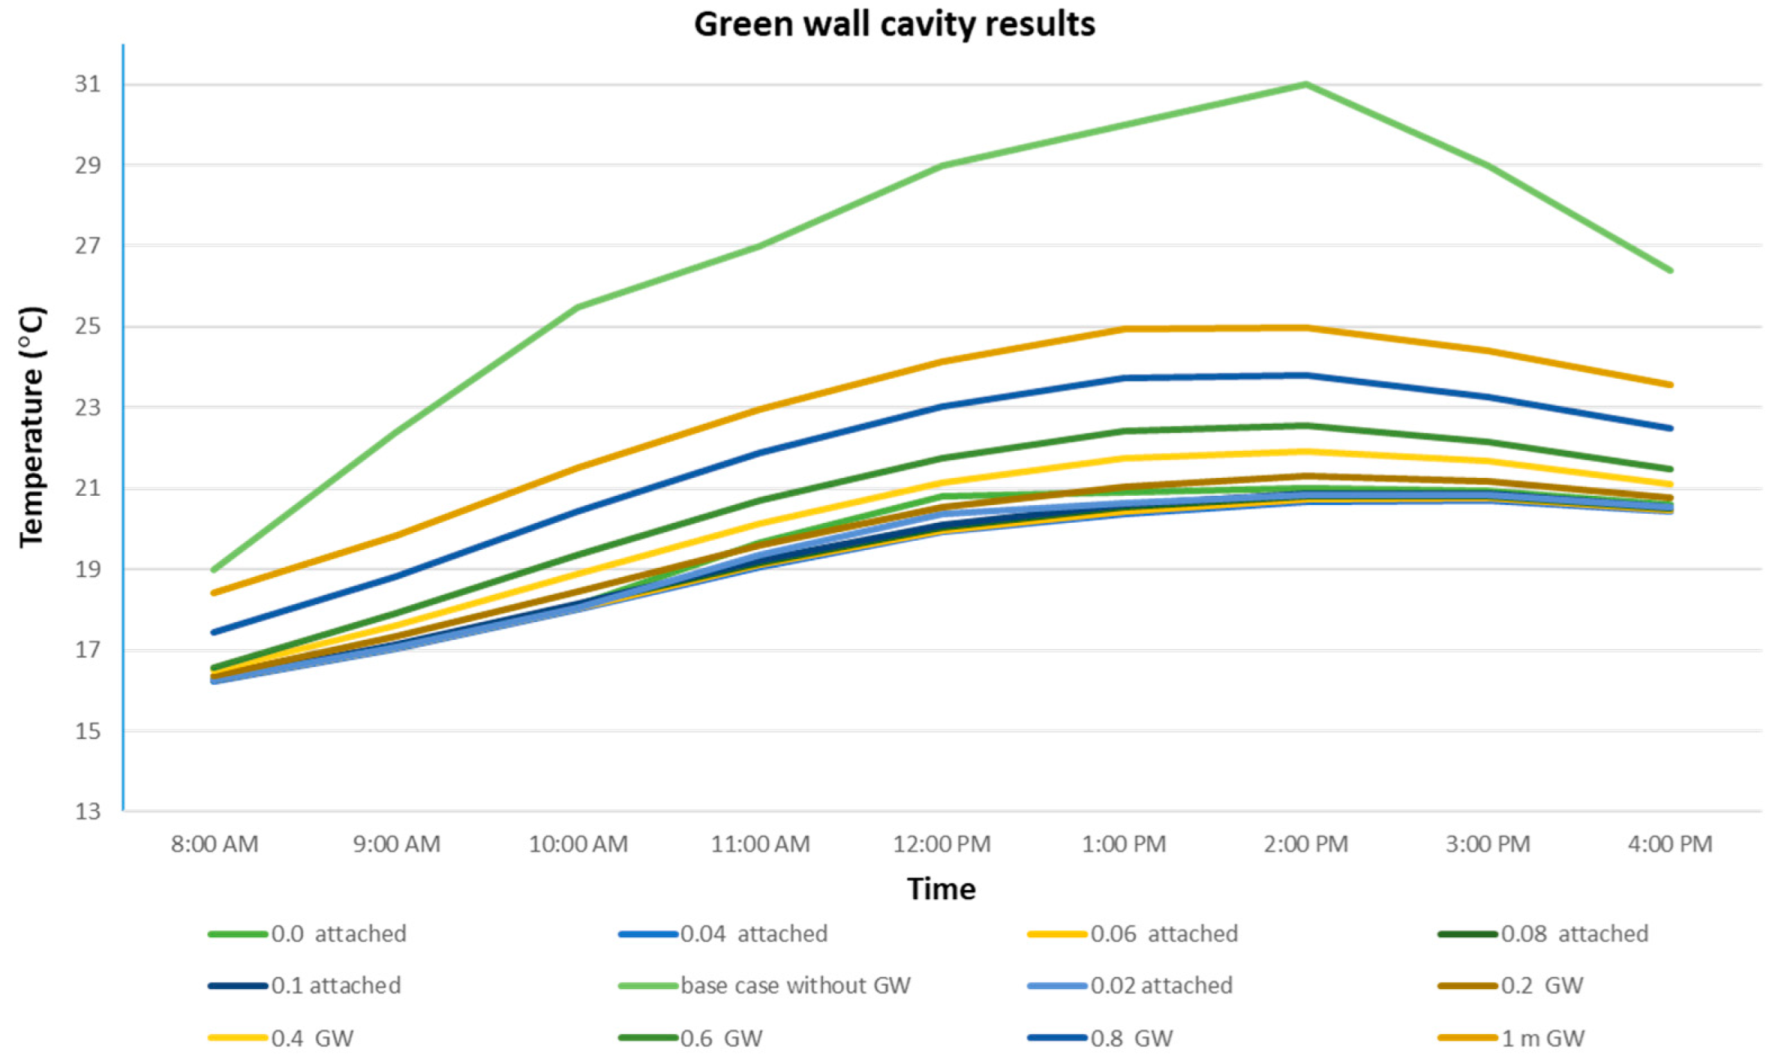
3.2.2. Optimal Cavity Depth
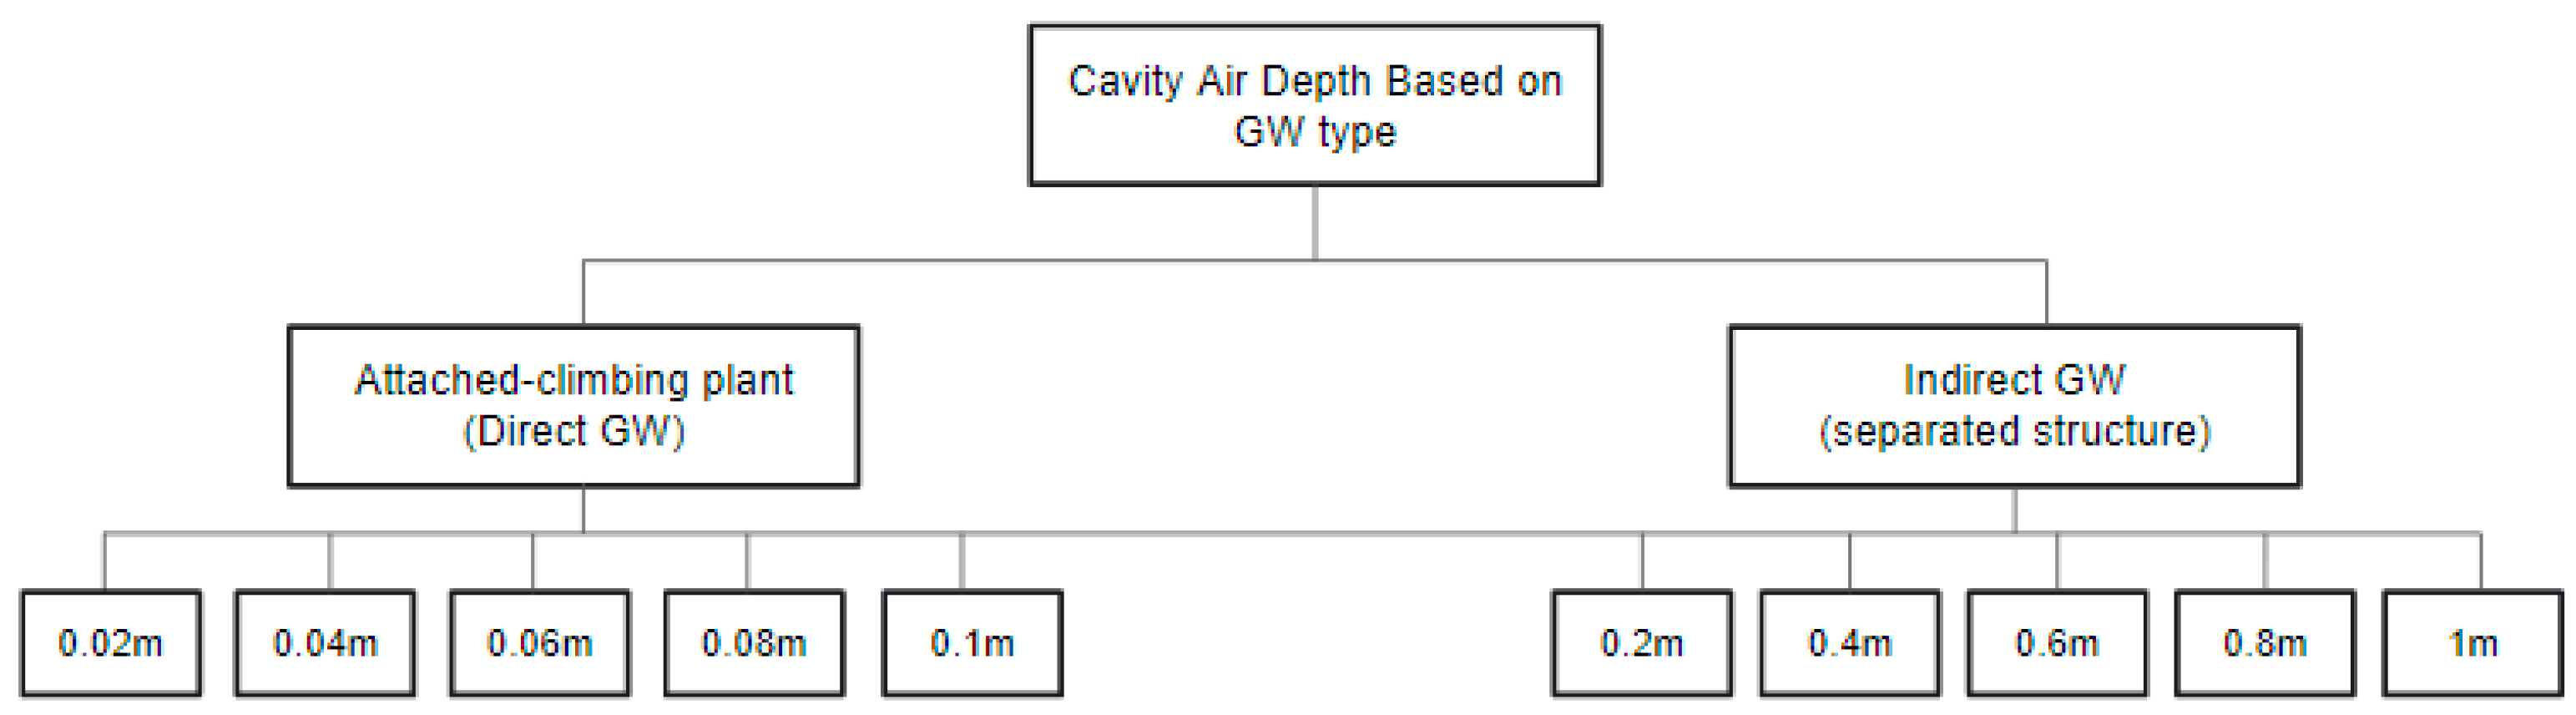
One of the most significant factors that affect green wall performance is the cavity air depth. In this Section, 10 scenarios of cavity depth were divided into two groups; the first one for direct GW with cavity of (0.02–0.1 m) were tested to find the most effective design for direct GW and the second one for indirect green wall with design configurations as double-skin facade (0.2–1 m cavity air depth), as seen in Figure 15.

Figure 15.
Ten scenarios for optimizing cavity air depth.
In the simulation process, the cavity for sceneries 0.0–0.1 m scenarios represent a green wall attached directly to the wall (direct green wall) by climbing plants, or on a mesh attached to the wall with distance varied from 0.02–0.1 m, while a green wall with a cavity of 0.2–1 m represents a green wall as a double skin façade. The cavity air depth for the attached GW from 0.04–0.1 m achieved the best temperature reduction with a slight change in values from 0.02 m to 0.1 m. On the other hand, indirect GW (as a double skin facade) with a cavity of 0.2–0.8 m achieved the best result for air temperature and surfaces. As a result, a wide cavity means the possibility of more direct heat gains, on the original façade, from the sun and sky vault and surrounding ambient environment. At the same time, very narrow widths mean less chance for good air circulation which helps to reduce the temperature of the wall (Figure 16).
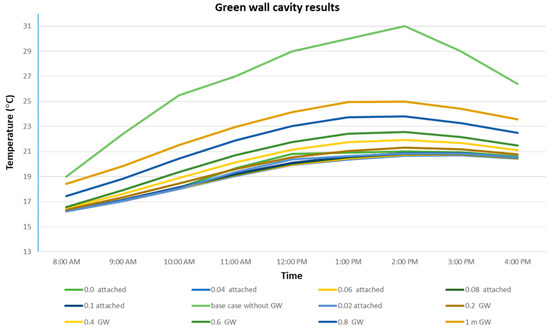
Figure 16.
Left: comparative study for 11 cavity depth scenarios discrepancy values. Right: discrepancies of green wall design configuration at 0.02 m, 0.1 m, and 1 m cavity depth.
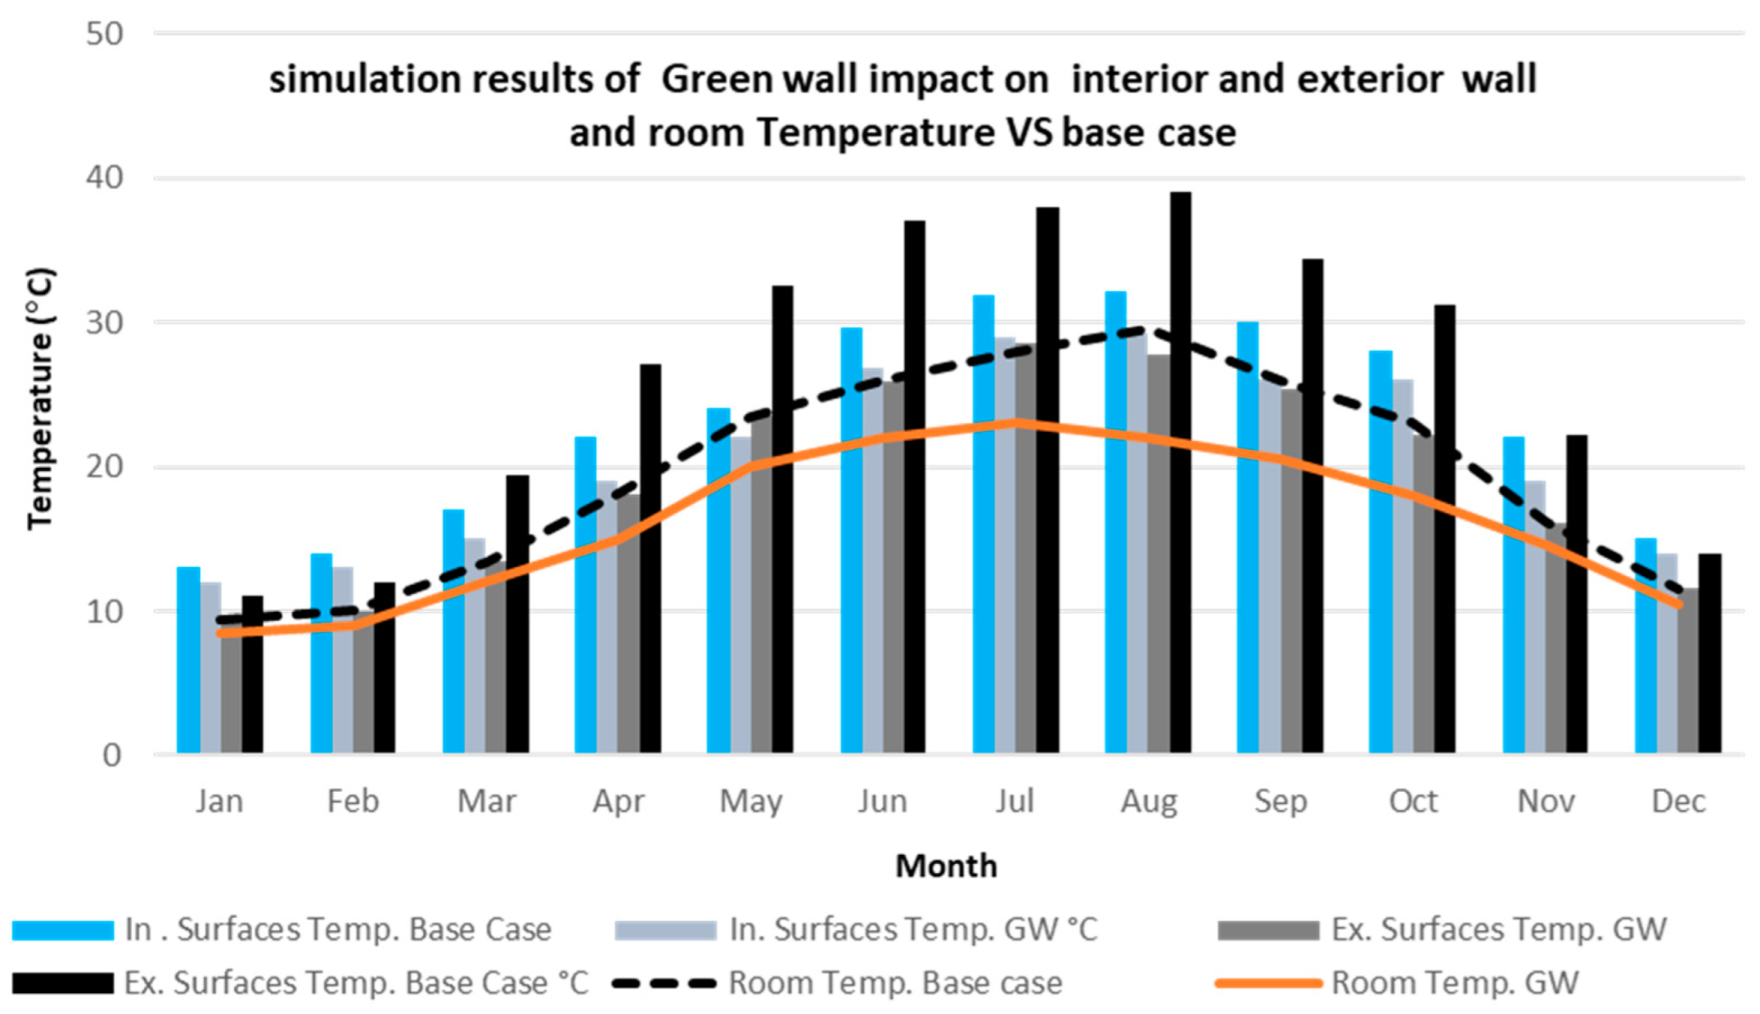
Figure 17 shows how the optimized variables for best wall cavity and green wall porosity, 0.6 m cavity, and foliage coverage of around 60%, helped to reduce surfaces temperature for both interior and exterior walls. In hot months the green wall performed well and helped to reduce the surfaces temperatures and thus the indoor air temperatures as well. Green wall helped to reduce the impact of hot summer rays in summer which helped to improve the indoor thermal environment.
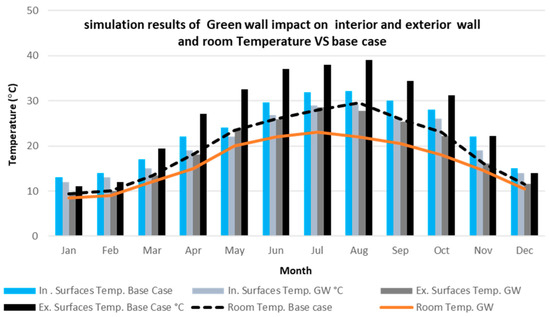
Figure 17.
Simulation results of optimized green wall for interior and exterior wall surface and room Temperature compared to the base case with GW.
Different foliage coverage cases and green wall porosity are integrated with the cavity air depth which varied from 0.02 m to 1 m were studied. The reduction in exterior surface temperature in the scenario of 60% foliage coverage was the highest, at 10.2 °C with 0.1 m to 0.6m cavity depth. In field measurements and simulation results, the effectiveness of green wall as shading had significant impacts on; interior surface temperature, interior air temperature, and exterior surface temperature for the investigated rooms. The heating loss/gain process was slower in the room covered with the green wall, and the additional thermal mass of the green wall delayed heat transfers between the masonry wall and the exterior ambient environment compared to the heat transfer rate in the non-covered room.
The daylight field measurements showed that the existence of the green wall affected the daylight inside the investigated room, and with a 60% foliage coverage percentage for the field measurements, the daylight rate was still within the standard value of 300 Lux and provided visual comfort for the users. Based on the finding, it has been confirmed that the shading effects of the green wall were determined by the green foliage coverage as well as the cavity air depth. The best performance as surface temperature reduction was with high foliage coverage of 60% and cavity up to 0.6m. The results from both the field experiment and simulations indicate that GW could help to improve the thermal and daylight environment. Nevertheless, the results could be taken as indicative for GW wall design for other areas or building types and are limited to south orientation.
4. Conclusions
Previous research has confirmed the significant effect of vegetation on buildings’ microclimatic parameters. In summer, vegetation provides cooling via evapotranspiration and shading. Additionally, in winder environments, vegetative layers provide an insulation effect via reduced airflow [30], especially in hot climatic regions. The current research illustrated the performance of green wall systems based on a simplified method for the simulation process. The simplified green wall model was studied to predict the shading effect of a green wall system prototype on a south-wall of a building in the climatic zone of Irbid city in the North of Jordan. The research demonstrated the effectiveness of green walls on buildings’ performance in the Jordanian context through field measurements and computer simulation by testing different scenarios with green wall design configuration. The criteria for choosing the best scenario were based on surfaces temperature and ambient air temperature reductions for the investigated building. The simulation results showed that 60% foliage coverage decreased exterior surface wall temperature by an average of 6.5 °C compared to the basic case with cavity varied from green direct wall to 0.6 m cavity. The research finding corresponds to the outcomes of Perini’s study [30], which investigated the thermal effect of vertical greening systems as a building envelope. The green wall showed as an effective daylight system as it helped to improve both daylight quality and quantity compared to the base case rooms.
The research investigated more than 100 scenarios with different green coverage foliage and various cavity air depth showed the best GW variables for Jordan, as presented in Table 5. The table shows the following best variable values:
Table 5.
100 cases of green walls with different cavity depth and foliage coverage.
- Direct green wall with foliage coverage between 50% to 70%.
- Indirect green wall with foliage coverage of around 60%, and cavity depth no more than 0.6 m.
- Using a high foliage ratio should consider other performance indicators such as daylight and view.
- In hot climates with more direct sun, the cooling process during the nighttime required less foliage and a large cavity to allow heat exchange by convection and heat release to the ambient air.
The research has a number of limitations. The analysis was limited to a hot climate, a south façade, and the building use and materials in the studied case.
Author Contributions
Conceptualization, A.A.F., N.M.J. and I.A.A.; methodology, A.A.F., N.M.J. and I.A.A.; software, N.M.J. and I.A.A.; validation, A.A.F. and N.M.J.; formal analysis, A.A.F., N.M.J. and I.A.A.; investigation, A.A.F., N.M.J. and I.A.A.; resources, A.A.F.; data curation, N.M.J. and I.A.A.; writing—original draft preparation, A.A.F., N.M.J. and I.A.A.; writing—review and editing, A.A.F. and N.M.J.; visualization, A.A.F., N.M.J. and I.A.A.; supervision, A.A.F.; project administration, A.A.F.; funding acquisition, A.A.F., N.M.J. and I.A.A. All authors have read and agreed to the published version of the manuscript.
Funding
This research was funded by Jordan University of Science and Technology, grant number [1/2020-345].
Institutional Review Board Statement
Not applicable.
Acknowledgments
The authors acknowledge the support of the research by Jordan University of Science and Technology.
Conflicts of Interest
The authors declare no conflict of interest.
References
- Andric, I.; Kamal, A.; Al-Ghamdi, S.G. Efficiency of Green Roofs and Green Walls as Climate Change Mitigation Measures in Extremely Hot and Dry Climate: Case Study of Qatar. Energy Rep. 2020, 6, 2476–2489. [Google Scholar] [CrossRef]
- Yang, F.; Yuan, F.; Qian, F.; Zhuang, Z.; Yao, J. Summertime Thermal and Energy Performance of a Double-Skin Green Facade: A Case Study in Shanghai. Sustain. Cities Soc. 2018, 39, 43–51. [Google Scholar] [CrossRef]
- Yazdanseta, A. Designing Green Walls: An Early-Design Framework to Estimate the Cooling Impact of Indirect Green Walls on Buildings in Six Different Climates. Ph.D. Thesis, Harvard University, Cambridge, MA, USA, October 2017. [Google Scholar]
- Hoelscher, M.-T.; Nehls, T.; Jänicke, B.; Wessolek, G. Quantifying Cooling Effects of Facade Greening: Shading, Transpiration and Insulation. Energy Build. 2016, 114, 283–290. [Google Scholar] [CrossRef]
- Xing, Q.; Hao, X.; Lin, Y.; Tan, H.; Yang, K. Experimental Investigation on the Thermal Performance of a Vertical Greening System with Green Roof in Wet and Cold Climates during Winter. Energy Build. 2019, 183, 105–117. [Google Scholar] [CrossRef]
- Susorova, I.; Azimi, P.; Stephens, B. The Effects of Climbing Vegetation on the Local Microclimate, Thermal Performance, and Air Infiltration of Four Building Facade Orientations. Build. Environ. 2014, 76, 113–124. [Google Scholar] [CrossRef]
- Larsen, S.F.; Filippín, C.; Lesino, G. Thermal Simulation of a Double Skin Façade with Plants. Energy Procedia 2014, 57, 1763–1772. [Google Scholar] [CrossRef] [Green Version]
- Cuce, E. Thermal Regulation Impact of Green Walls: An Experimental and Numerical Investigation. Appl. Energy 2017, 194, 247–254. [Google Scholar] [CrossRef]
- Teotónio, I.; Silva, C.M.; Cruz, C.O. Economics of Green Roofs and Green Walls: A Literature Review. Sustain. Cities Soc. 2021, 69, 102781. [Google Scholar] [CrossRef]
- Addo-Bankas, O.; Zhao, Y.; Vymazal, J.; Yuan, Y.; Fu, J.; Wei, T. Green Walls: A Form of Constructed Wetland in Green Buildings. Ecol. Eng. 2021, 169, 106321. [Google Scholar] [CrossRef]
- Viecco, M.; Jorquera, H.; Sharma, A.; Bustamante, W.; Fernando, H.J.S.; Vera, S. Green Roofs and Green Walls Layouts for Improved Urban Air Quality by Mitigating Particulate Matter. Build. Environ. 2021, 204, 108120. [Google Scholar] [CrossRef]
- Kenai, M.-A.; Libessart, L.; Lassue, S.; Defer, D. Impact of Green Walls Occultation on Energy Balance: Development of a TRNSYS Model on a Brick Masonry House. J. Build. Eng. 2021, 44, 102634. [Google Scholar] [CrossRef]
- Dede, O.H.; Mercan, N.; Ozer, H.; Dede, G.; Pekarchuk, O.; Mercan, B. Thermal Insulation Characteristics of Green Wall Systems Using Different Growing Media. Energy Build. 2021, 240, 110872. [Google Scholar] [CrossRef]
- Daemei, A.B.; Jamali, A. Experimental and Simulation Study on Thermal Effects and Energy Efficiency of a Green Wall in the Humid Condition of Rasht. J. Energy Manag. Technol. 2022, 6, 15–21. [Google Scholar]
- Ottelé, M.; Perini, K.; Haas, E.M. Life Cycle Assessment (LCA) of Green Façades and Living Wall Systems. In Eco-Efficient Construction and Building Materials; Elsevier: Amsterdam, The Netherlands, 2014; pp. 457–483. [Google Scholar] [CrossRef]
- Perini, K.; Magliocco, A. Effects of Vegetation, Urban Density, Building Height, and Atmospheric Conditions on Local Temperatures and Thermal Comfort. Urban For. Urban Green. 2014, 13, 495–506. [Google Scholar] [CrossRef]
- Šuklje, T.; Hamdy, M.; Arkar, C.; Hensen, J.L.M.; Medved, S. An Inverse Modeling Approach for the Thermal Response Modeling of Green Façades. Appl. Energy 2019, 235, 1447–1456. [Google Scholar] [CrossRef]
- Susorova, I.; Angulo, M.; Bahrami, P.; Stephens, B. A Model of Vegetated Exterior Facades for Evaluation of Wall Thermal Performance. Build. Environ. 2013, 67, 1–13. [Google Scholar] [CrossRef]
- Pérez, G.; Coma, J.; Martorell, I.; Cabeza, L.F. Vertical Greenery Systems (VGS) for Energy Saving in Buildings: A Review. Renew. Sustain. Energy Rev. 2014, 39, 139–165. [Google Scholar] [CrossRef] [Green Version]
- Lee, L.S.H.; Jim, C.Y. Transforming Thermal-Radiative Study of a Climber Green Wall to Innovative Engineering Design to Enhance Building-Energy Efficiency. J. Clean. Prod. 2019, 224, 892–904. [Google Scholar] [CrossRef]
- Raji, B.; Tenpierik, M.J.; van den Dobbelsteen, A. The Impact of Greening Systems on Building Energy Performance: A Literature Review. Renew. Sustain. Energy Rev. 2015, 45, 610–623. [Google Scholar] [CrossRef] [Green Version]
- UNICEF JORDAN. Climate Resilient Water Safety Plan; UNICEF: Amman, Jordan, 2020. [Google Scholar]
- Al-Widyan, M.I.; Soliman, I.A.; Alajlouni, A.A.; Zu’bi, O.I.A.; Jaradat, A.I. Energy Performance Assessment of a Non-Domestic Service Building in Jordan. Jordan J. Mech. Ind. Eng. 2018, 12, 69–75. [Google Scholar]
- Al-Hinti, I.; Al-Sallami, H. Potentials and Barriers of Energy Saving in Jordan’s Residential Sector through Thermal Insulation. Jordan J. Mech. Ind. Eng. 2017, 11, 141–145. [Google Scholar]
- Feng, H.; Hewage, K. Energy Saving Performance of Green Vegetation on LEED Certified Buildings. Energy Build. 2014, 75, 281–289. [Google Scholar] [CrossRef]
- Wang, Z.-Q.; Wu, L.-H.; Liu, T.-T. Revegetation of Steep Rocky Slopes: Planting Climbing Vegetation Species in Artificially Drilled Holes. Ecol. Eng. 2009, 35, 1079–1084. [Google Scholar] [CrossRef]
- Sailor, D.J. A Green Roof Model for Building Energy Simulation Programs. Energy Build. 2008, 40, 1466–1478. [Google Scholar] [CrossRef]
- Libessart, L.; Kenai, M.A. Measuring Thermal Conductivity of Green-Walls Components in Controlled Conditions. J. Build. Eng. 2018, 19, 258–265. [Google Scholar] [CrossRef]
- Cameron, R.W.F.; Taylor, J.; Emmett, M. A Hedera Green Façade—Energy Performance and Saving under Different Maritime-Temperate, Winter Weather Conditions. Build. Environ. 2015, 92, 111–121. [Google Scholar] [CrossRef] [Green Version]
- Perini, K.; Ottelé, M.; Fraaij, A.L.A.; Haas, E.M.; Raiteri, R. Vertical Greening Systems and the Effect on Air Flow and Temperature on the Building Envelope. Build. Environ. 2011, 46, 2287–2294. [Google Scholar] [CrossRef]


Publisher’s Note: MDPI stays neutral with regard to jurisdictional claims in published maps and institutional affiliations. |
© 2022 by the authors. Licensee MDPI, Basel, Switzerland. This article is an open access article distributed under the terms and conditions of the Creative Commons Attribution (CC BY) license (https://creativecommons.org/licenses/by/4.0/).