1. Introduction
Over the past several decades, comprehensive research studies on the seismic performance of RC shear wall structures have been conducted, and the advancements (e.g., extending the length of reinforcement along the cross-section of boundary elements and increasing the transverse reinforcement ratio to ensure sufficient deformation under high axial load ratios) cumulatively reflected in the current seismic design standards (ACI 318-19 [
1], Eurocode 8 [
2] and GB 50011-2010 [
3]). Despite these improvements, there is still a huge stock of RC shear walls constructed following the less stringent previous national design standards. Recent earthquakes (Wenchuan 2008 [
4], Chile 2010 [
5], and New Zealand 2011 [
6]) highlighted that existing RC shear wall structures were susceptible to severe damage or collapse due to insufficient shear reinforcement, deficient boundary elements, and no additional confinement at the ends [
7]. Among the various deficiencies, brittle shear behavior due to insufficient transverse reinforcement ratio is a serious concern that may lead to high socio-economic consequences. Therefore, strengthening of vulnerable existing RC shear walls is of utmost importance to prevent brittle shear failure of structures in future earthquakes.
Extensive research has been conducted in the past decade to improve the seismic performance of RC shear walls in terms of shear strength, ductility, and energy dissipation [
8,
9,
10,
11,
12,
13,
14,
15,
16]. Marini et al. [
8] strengthened the existing RC shear walls using high-strength concrete jackets and numerically verified the strengthening option. It was reported that the strengthening method significantly improved the ultimate load-carrying capacity, deformation capacity, and ductility of strengthened shear walls. Altin et al. [
9] and Christidis et al. [
10] utilized epoxy adhesives to fix steel strips on the surface of RC shear walls and observed that different steel strip configurations enhanced the lateral load behavior of the shear deficient RC wall. Recently, fiber reinforced polymer (FRP) has gained importance in strengthening of structural elements. To this date, a large number of studies have been carried out to evaluate the effectiveness and feasibility of FRP strengthening [
11,
12,
13,
14,
15,
16]. However, the major limitation of externally bonded strengthening methods is that they are susceptible to debonding, particularly under severe environments, and extensive application of adhesives impacted environmental protection.
The steel wire mesh (SWM) strengthening method has gained attention in recent years due to its advantages in terms of fire prevention [
17] and favorable mechanical characteristics [
18] compared to other externally bonding techniques. Few research studies have been dedicated to evaluate the effectiveness of the external steel wire mesh strengthening method in case of RC columns [
19], beams [
20,
21], and masonry walls [
22,
23]. Most of these studies [
19,
20,
21,
22,
23] demonstrated that SWM improved not only the load-carrying capacity but also the deformation capacity of the specimens to a particular extent. However, the application of the SWM strengthening method to improve the seismic behavior of shear deficient RC shear walls is not available. Henceforth, taking into account the advantages and further popularizing the application of this method, the authors adopted SWM to strengthen the existing RC shear wall structures. Further, polymer mortar has wide utilization prospects in seismic retrofitting and rehabilitation because of crack resistance, durability, and simple construction process [
24,
25]. Application of hanging SWM on the wall surface followed by smearing of polymer mortar over the surface was found to be the conventional strengthening methods [
26,
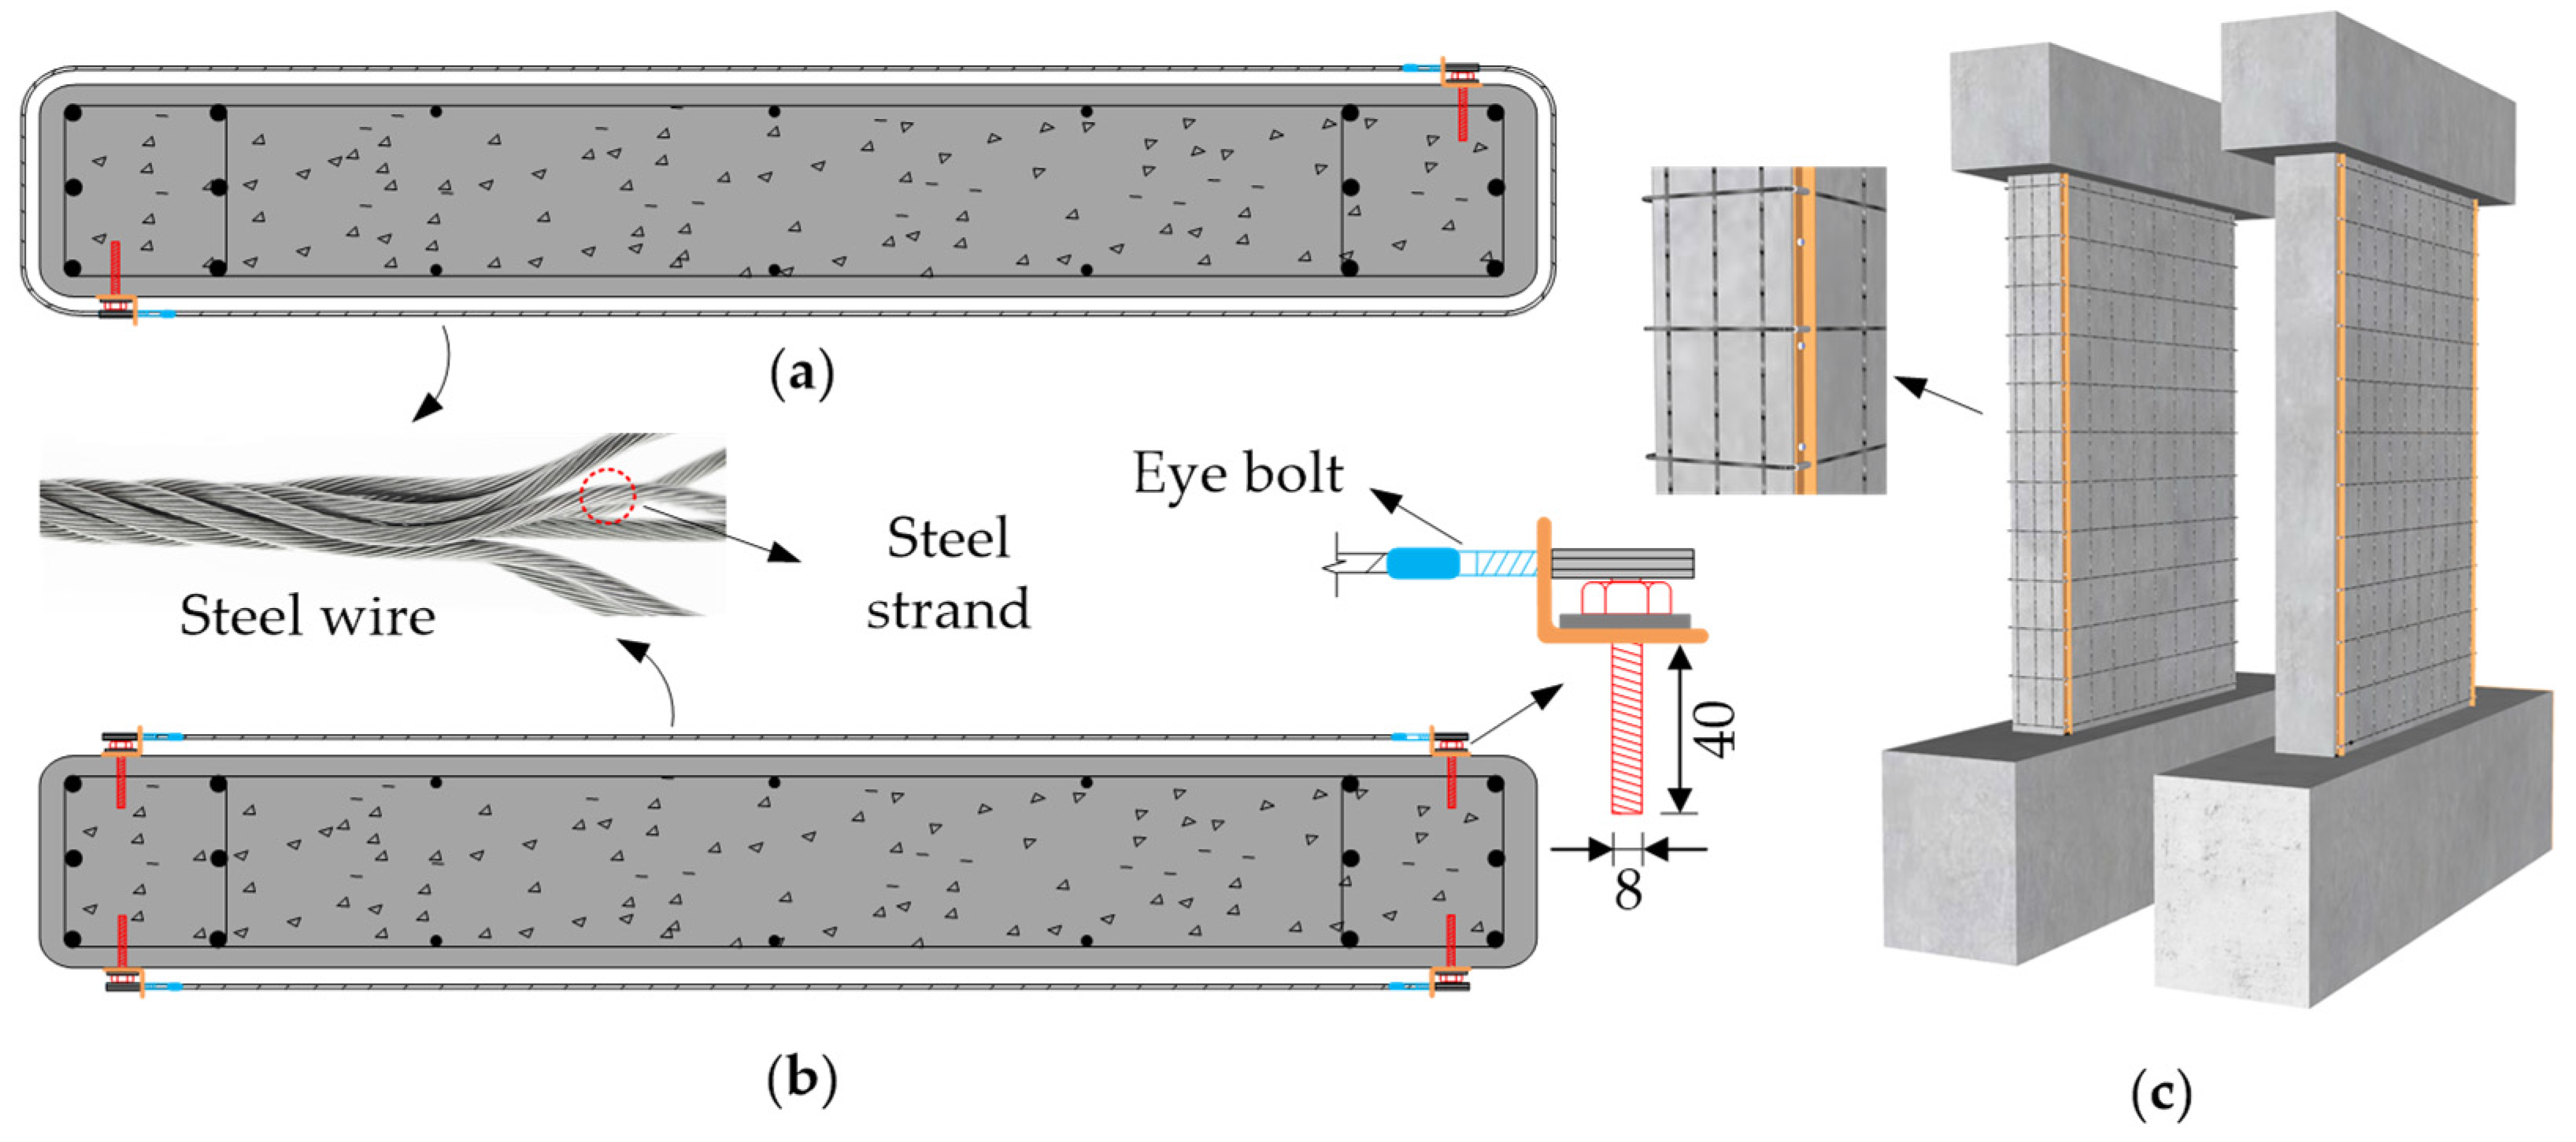
27], but such a technique may lead to the separation of strengthening layers under lateral loads. Therefore, to increase the utilization rate of materials and enhance the interface performance between the wall and strengthening layers, a novel reliable strengthening method was proposed by applying a moderate prestressing force so that the SWM remains in a tension state. Further, the steel wire mesh can be either wrapped around the surface of the wall along the height or applied on the exposed surfaces only based on the functional requirements, as shown in
Figure 1a. When the ends of the RC shear wall are inaccessible (e.g., flanged and L-shaped shear wall), which make it cumbersome to apply SWM around the wall, strengthening only on exposed surfaces can be adopted (
Figure 1b).
The research reported in the present article aims to: evaluate the effectiveness and feasibility of steel wire mesh and polymer mortar by testing one control and four strengthened RC shear wall specimens considering various configurations under cyclic lateral loads; study the failure progression, hysteretic and envelop lateral load-drift response, energy dissipation capacity and strain gauge recordings; analyze the influence of different parameters (steel wire mesh reinforcement ratio and wrapping method) on the behavior of shear walls; and propose an expression to predict the shear strength of the strengthened specimens.
2. Experimental Program
A total of five specimens, namely, one control specimen (SW1) and four strengthened specimens (SW2–SW5), were designed and tested in this experimental campaign. To simulate the deficiencies (e.g., insufficient shear reinforcement and low strength concrete) of existing shear walls, the specimens were designed based on the recommendations of less stringent previous national Chinese design standard JGJ 3-91 [
28]. According to this code, the minimum value of concrete strength and thickness of shear wall were C20 and 160 mm, respectively. Considering the shear strengthening as the research objective of this test and the constraints of the laboratory and facilities, the shear span (height to width) ratio and section length of the specimens were selected as 1.62 and 1.00 m, respectively. Further, JGJ 3-91 [
28] recommends the maximum spacing and the minimum diameter of horizontal and vertical reinforcement as 300 mm and 8 mm, respectively. Therefore, considering the reinforcement ratio limits, the horizontal- and vertical- reinforcement ratios were designed as 0.31% and 0.18%, respectively, to study the effectiveness and feasibility of the shear strengthening technique.
Figure 2 shows the reinforcement details and the dimensions of the specimens. The aspect ratio (height to width) and the slenderness ratio (height to thickness) of the specimens was about 1.62 and 9.19, respectively.
The test variables considered in the present study include the steel wire ratio and its application on the surfaces are given in
Table 1. Two types of steel wire mesh application methods were adopted in the present study, i.e., wrapping around the surface of the specimen using two anchor bolt systems and wrapping only on the exposed surfaces using four anchor bolt systems.
To quickly and effectively realize the two wrapping methods, the specific construction procedure was carried out in five stages. In the first stage, the corners of the specimens were chamfered to reduce the stress concentration phenomenon and the bolt hole locations required to fix the anchoring systems were determined. In the second stage, holes were drilled in the wall along the height near the corners and the wall surfaces were gouged to increase the interface adhesion (
Figure 3a). The wall surfaces and the bolt holes were cleaned to remove any loose material and dust. In the third stage, anchor bolts of 8 mm diameter were fixed into the holes, which were then further strengthened by using a strong commercially available marble glue. Later on, depending on the strengthening application, either two or four steel angles of size 30 × 20 × 3 mm were bolted to the shear wall as soon as the strength requirements were met (
Figure 3b).
In the fourth stage, horizontal steel wires of the previously weaved mesh (
Figure 3c) of required size and spacing (
Table 1) were connected to an eye bolt using aluminum fasteners. Later on, the eye bolts were properly placed in the steel angles (
Figure 3c) and were fastened with M8 hexagonal nuts using a torque wrench (
Figure 3d). The same torque (about 1 kNm) was used to tighten all the steel wire meshes. In the fifth stage, cement slurry was sprayed over the wall surface followed by smearing of polymer mortar in two layers. The first layer of 15 mm thick polymer mortar was applied to cover the steel wire meshes and steel angles (
Figure 3f). Environmental protection and smooth surface were ensured by plastering the second layer of 15 mm thick polymer mortar (
Figure 3g).
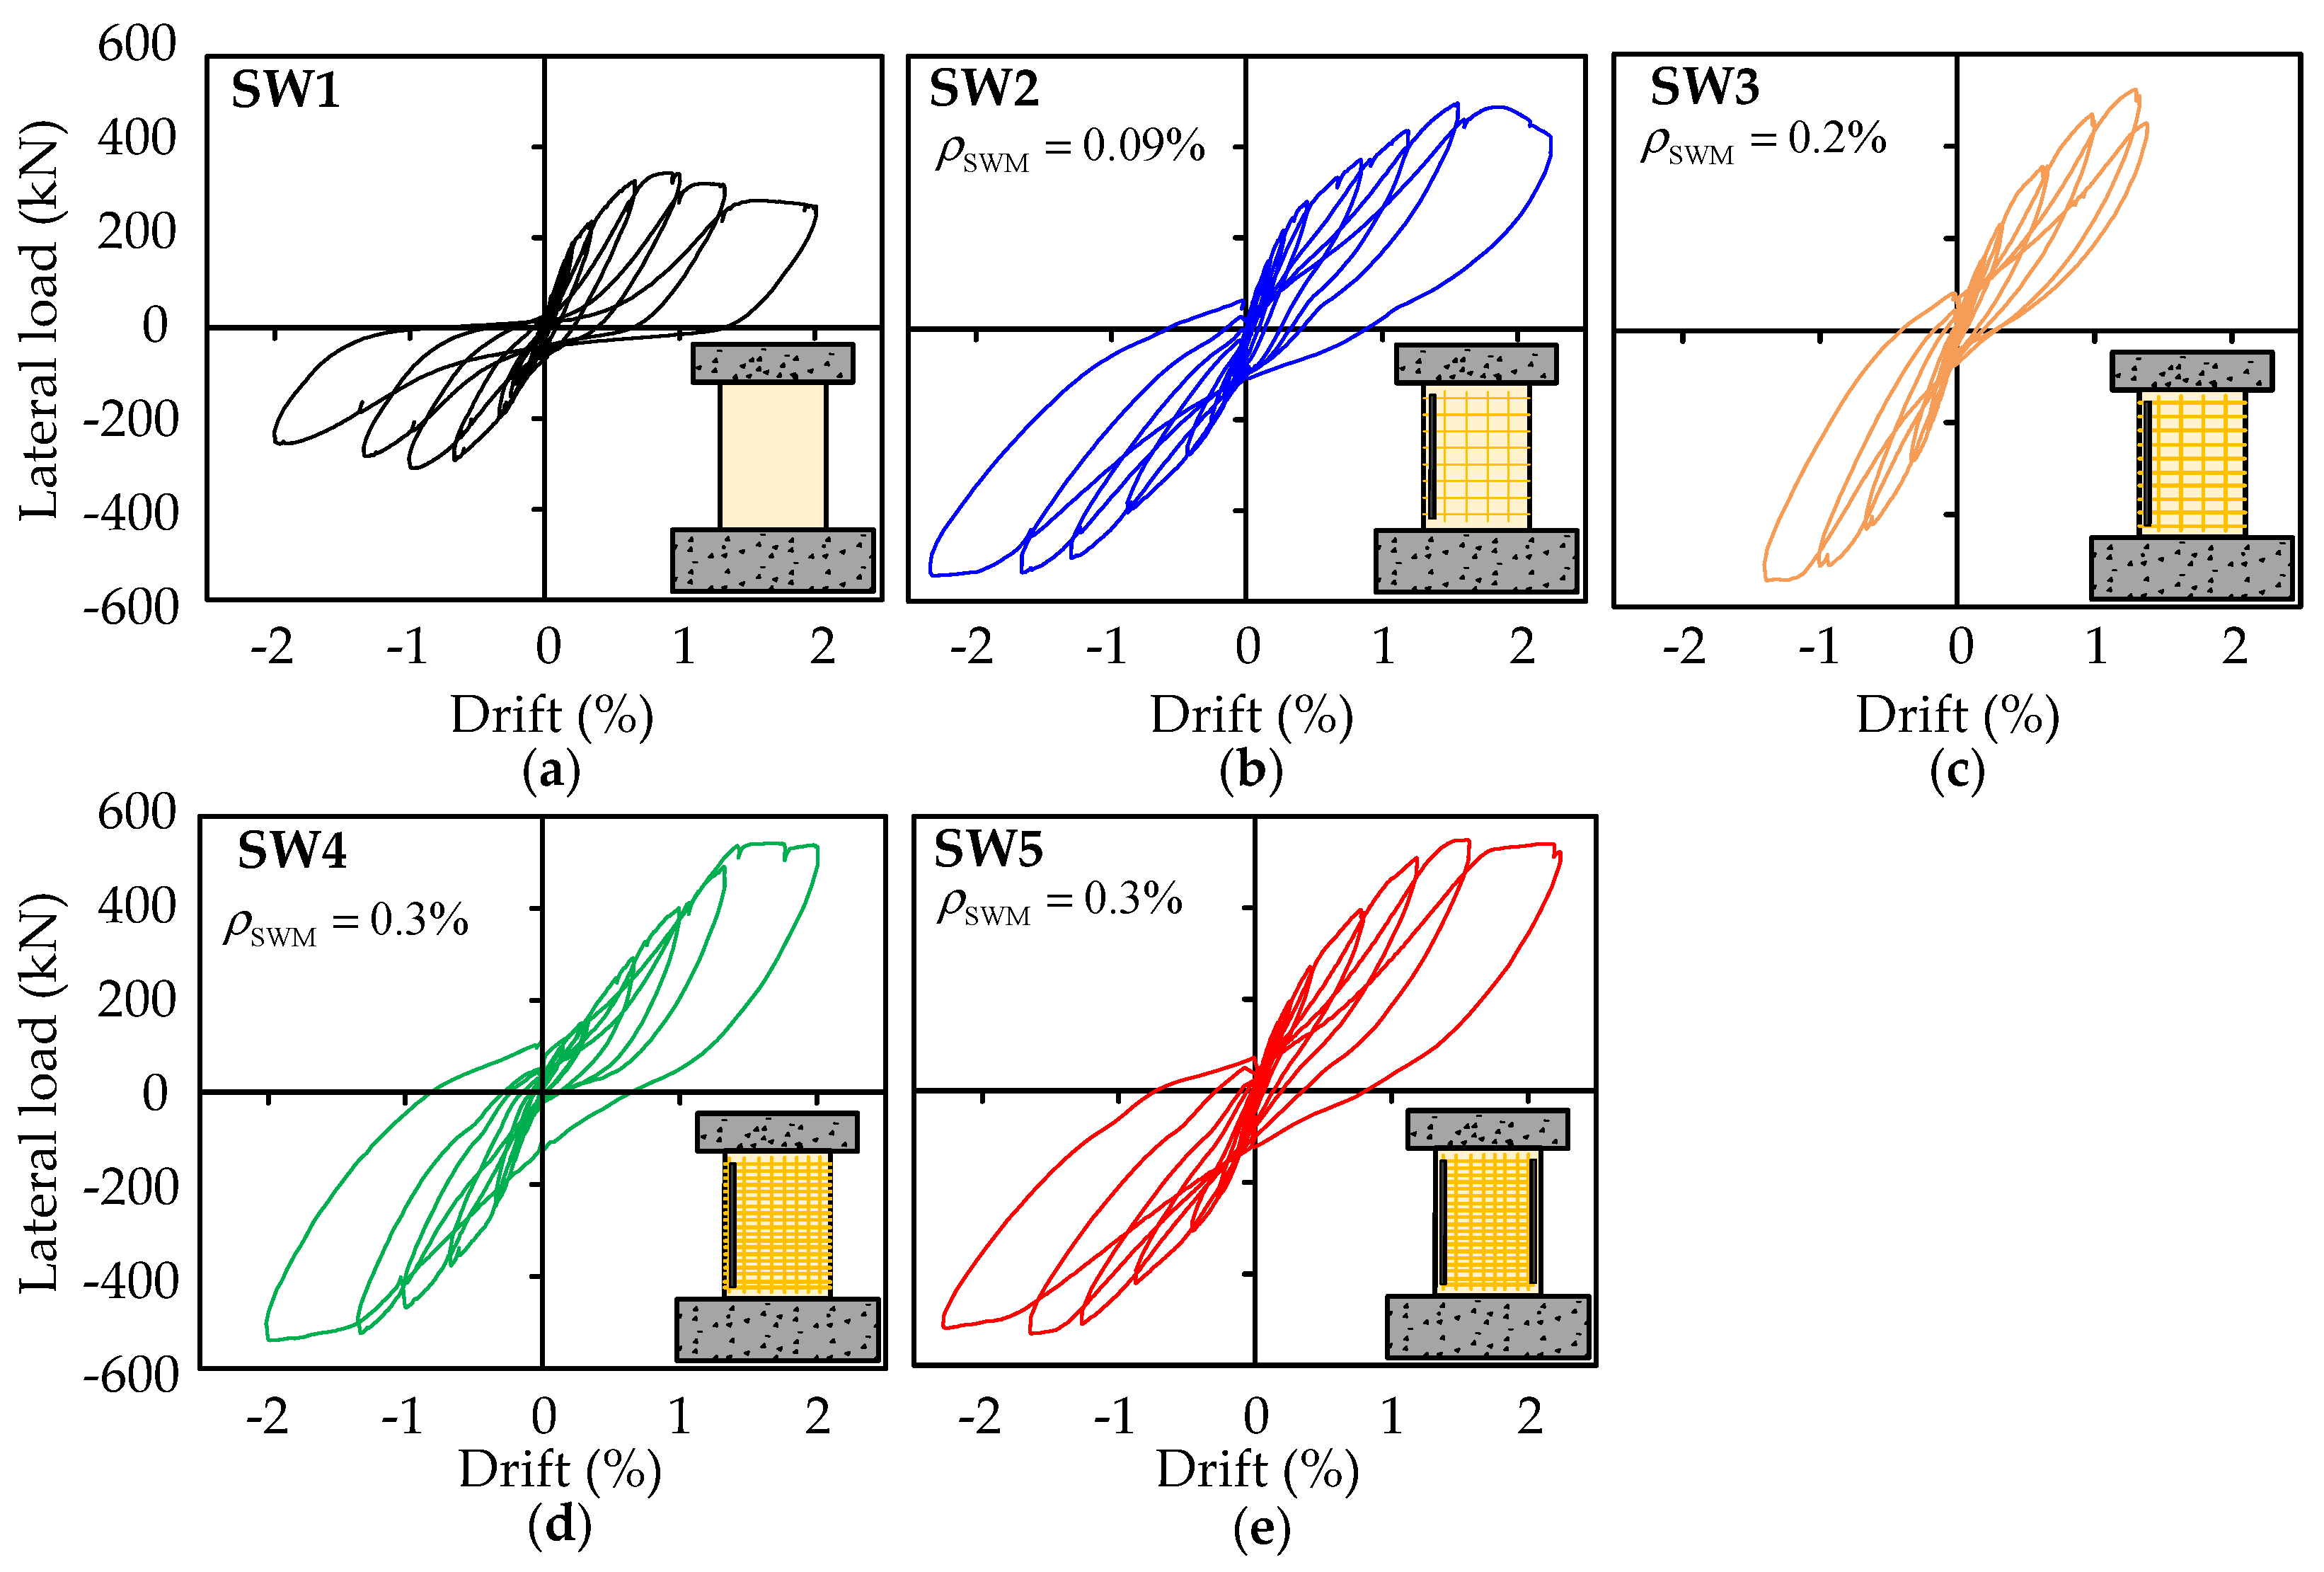
In the present study, three types of steel wire mesh ratios (
ρswm) were adopted in specimens SW2 (0.09%), SW3 (0.2%), SW4 (0.3%), and SW5 (0.3%) to evaluate the influence of the diameter (4 and 4.5 mm) and the spacing (100 mm, 60 mm, and 40 mm) of the steel wires. The details of the material characteristics of the shear wall specimens are given in
Table 2. To comply with the low-strength characteristics and seismic deficient buildings, the specimens were constructed using normal-grade concrete.
The average 28 days compressive strength of 150 mm concrete cubes tested following GB/T 50,081 [
29] was 19.6 MPa (COV 5.6%). Two-component polymer mortar was used in the present study and was obtained by mixing 1:6 ratio of emulsion and powder. The average compressive strength of polymer mortar cubes tested following JGJ/T 70 [
30] was 52 MPa (COV 10.5%). The modulus of elasticity of concrete and polymer mortar from compressive tests were found to be 2.55 × 10
4 MPa (COV 12.3%) and 3.3 × 10
4 MPa (COV 16.1%), respectively. The properties of steel reinforcement obtained from tensile tests are given in
Table 2. The ultimate tensile strength of the steel wire was found to be 1100 MPa (COV 6.1%).
Test Setup and Instrumentation
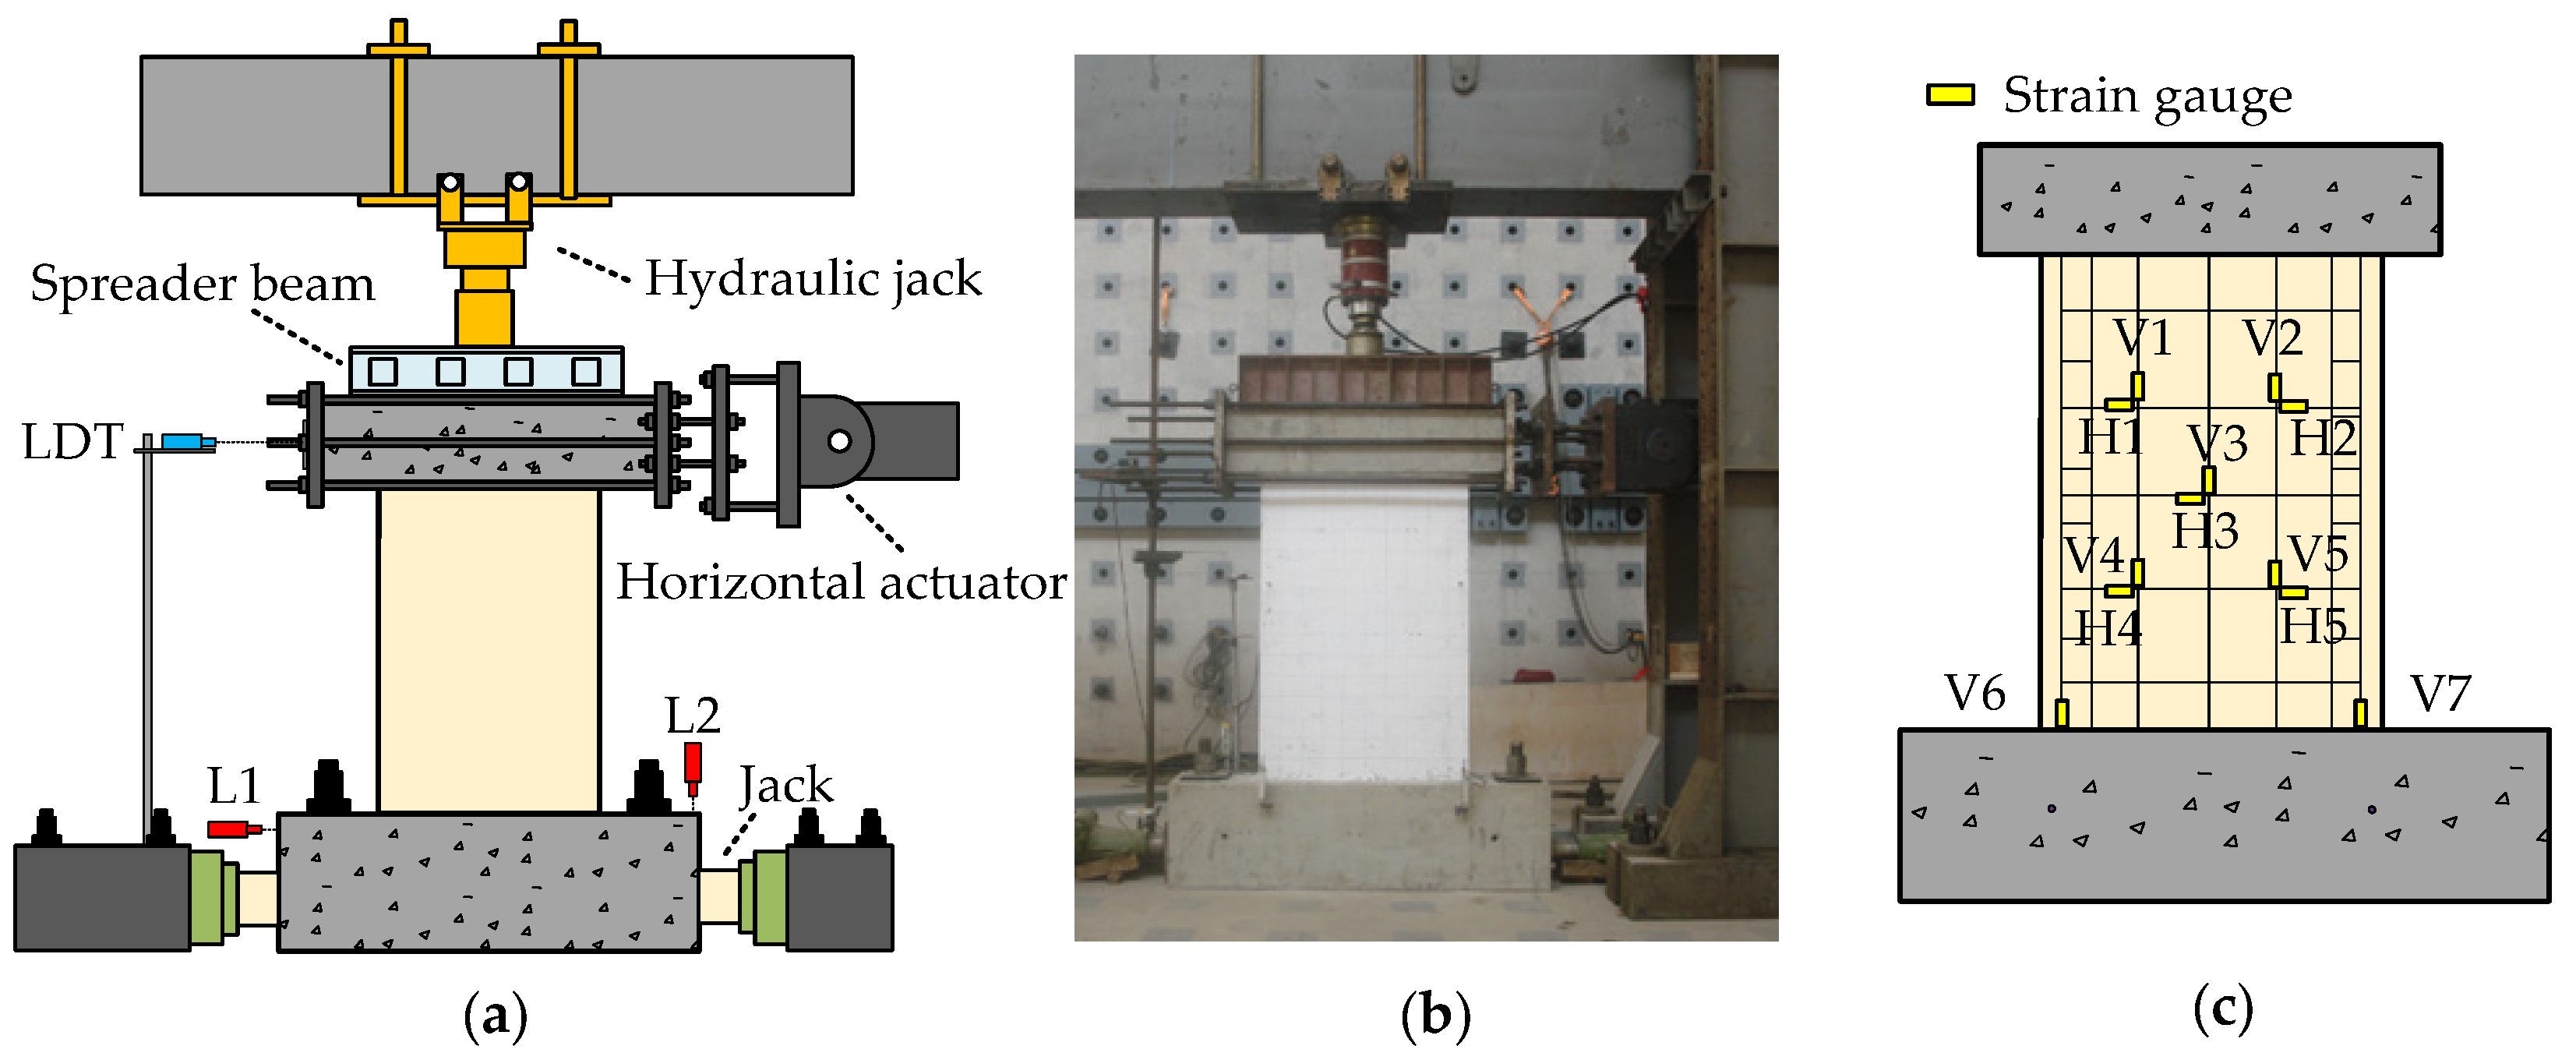
The schematic representation of the test setup is shown in
Figure 4. The specimens were tested in slow-cyclic lateral loading under constant vertical compression at a loading speed of 0.15 mm/s. The lateral load was applied using a 1000 kN capacity MTS servo-controlled hydraulic actuator connected to the top concrete stub beam using six stiffened steel rods and two steel plates. The vertical compressive load was applied by a hydraulic jack attached to a frictionless sliding cart onto a spreader beam to distribute the compressive load uniformly (
Figure 4a). The axial compression ratio
n (calculated as the ratio of axial force to the cross-sectional area multiplied by the compressive strength of concrete) of all specimens was calculated as 0.1 and maintained constant throughout the test. The loading protocol adopted in the present study was in accordance with guidelines suggested in JGJ 101-96 [
31]. A pre-compressive loading (0.33 of predetermined vertical load) was applied prior to the commencement of the test to check the pure axial compression state of the shear wall. Initially, the specimens were tested under force control mode consisting of one cycle for three different force levels of 50 kN, 100 kN, and 150 kN (
Figure 5). Later on, the shear walls were tested under displacement-control mode consisting of three cycles for each drift level (0.2%, 0.33%, 0.67%, 1%, 1.33%, and 2%).
The specimens were instrumented with linear variable displacement transducers (LVDTs), laser displacement transducer (LDT), strain gauges to monitor deformations and nonlinear behavior of the specimens. A LDT mounted near the mid-height of the top beam was used to calculate the drift of the specimens. LVDTs (L1 and L2) placed near the bottom beam were used to monitor the slip and warpage during the loading process (
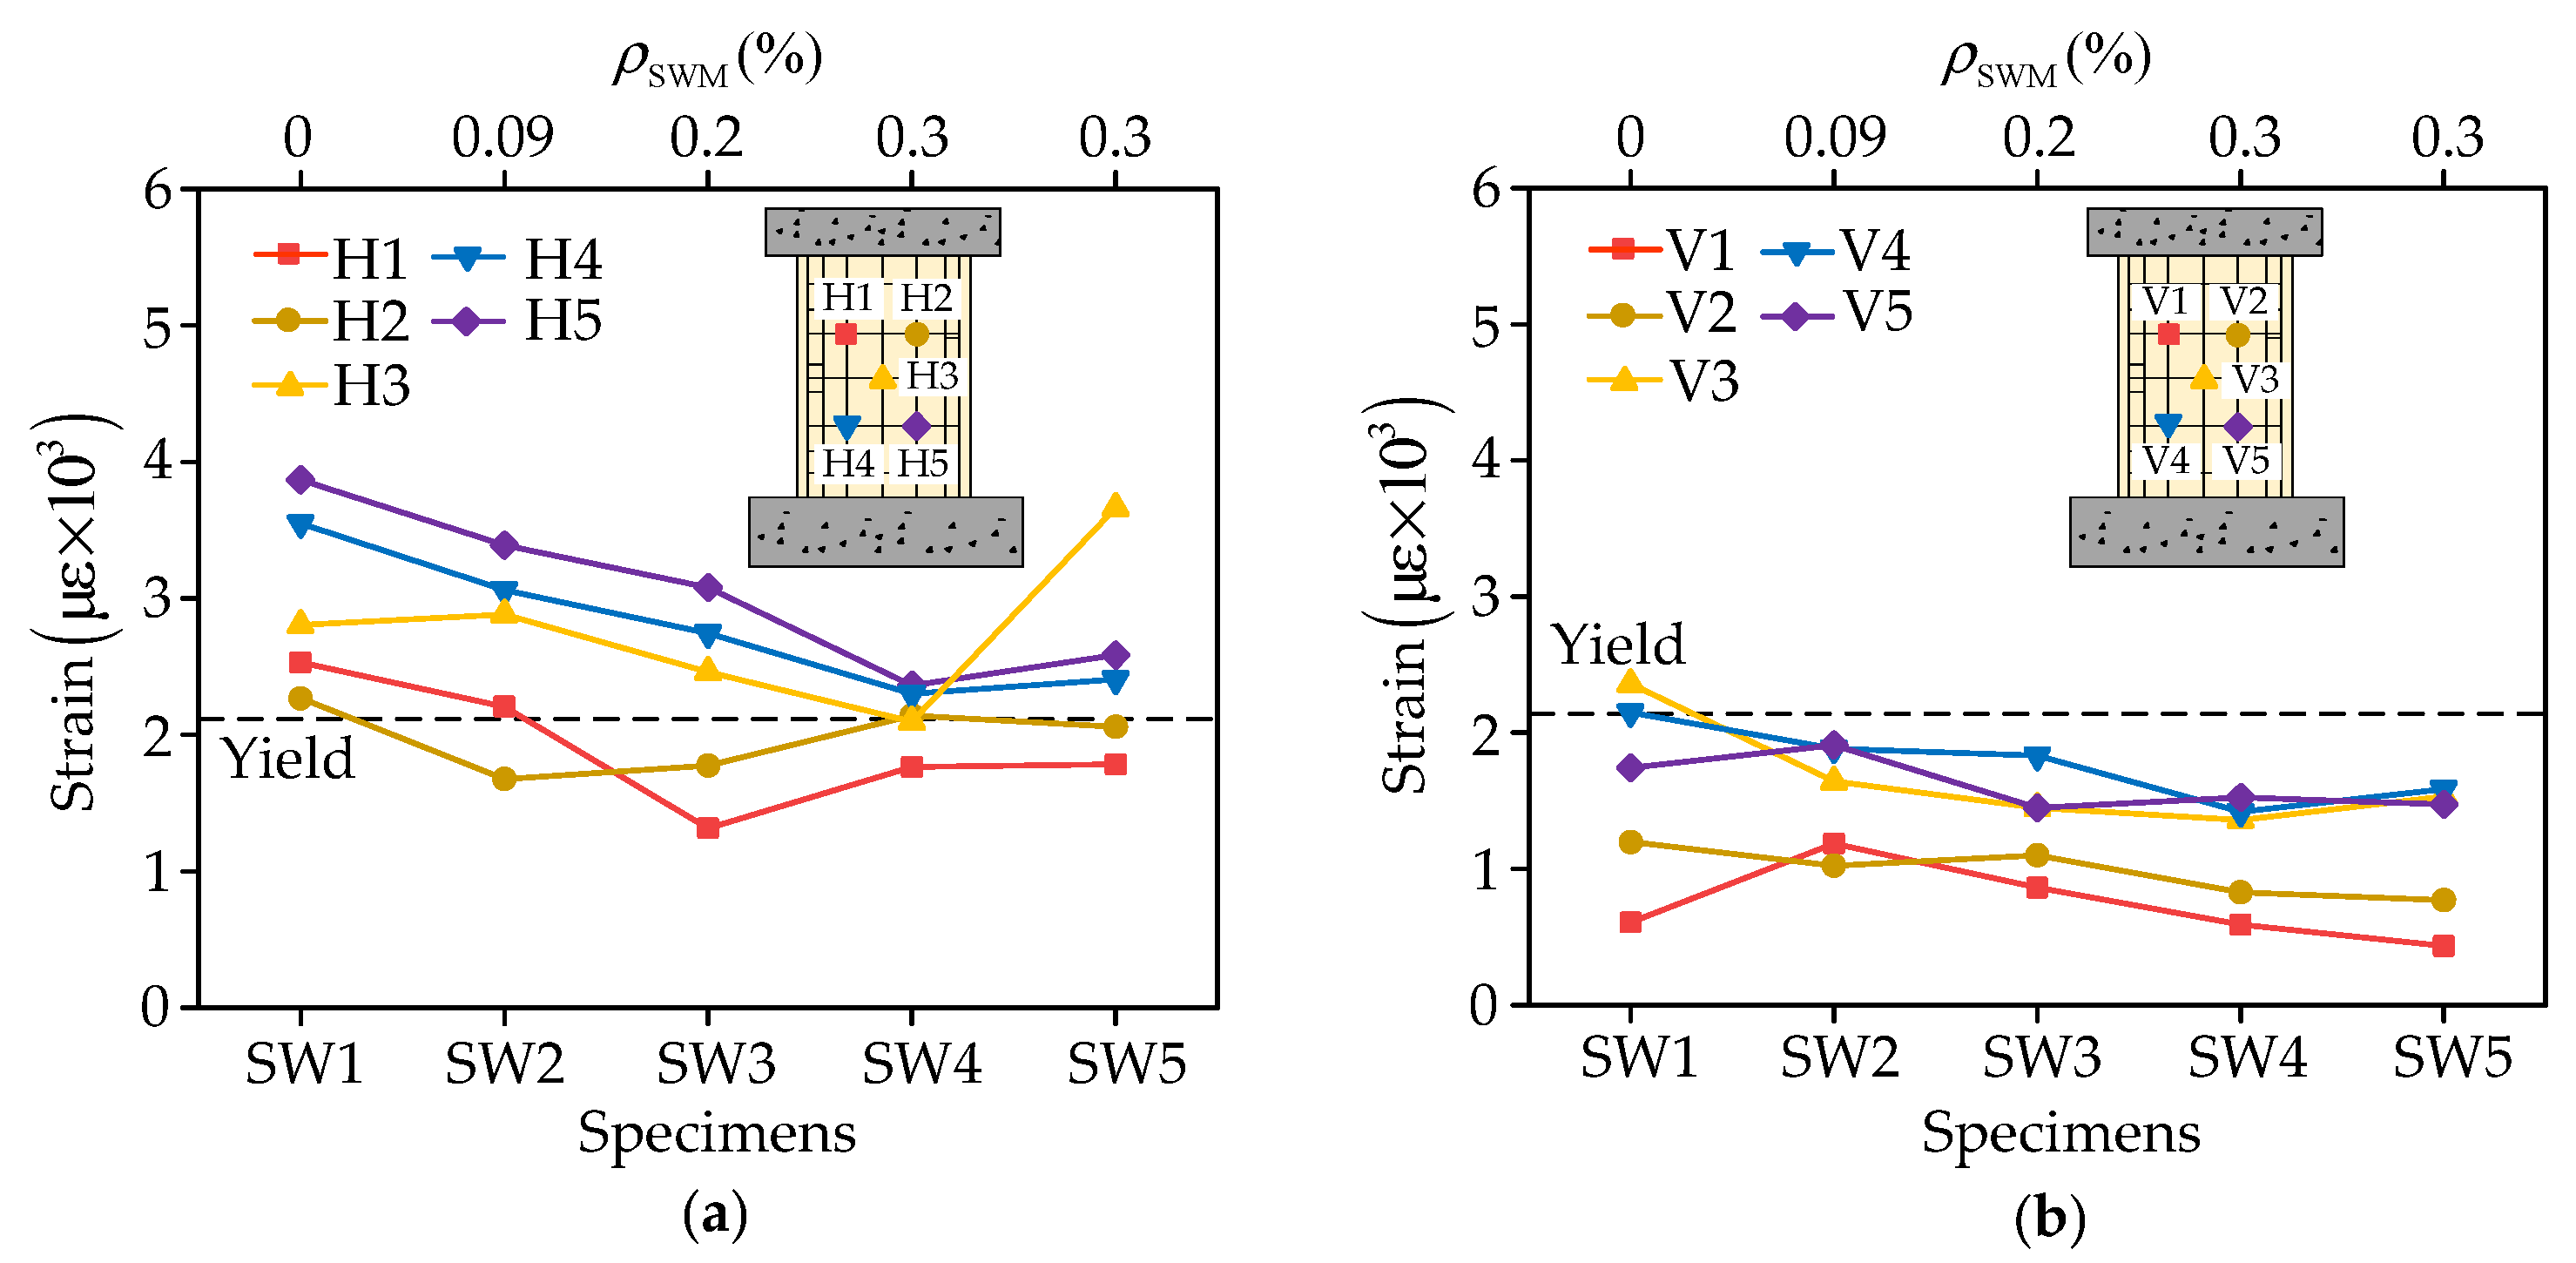
Figure 4). Strain gauges (V1 to V5, H1 to H5, and V6 to V7) were installed to monitor the development of the tensile strain in the specimens (
Figure 4).
3. Experimental Observations
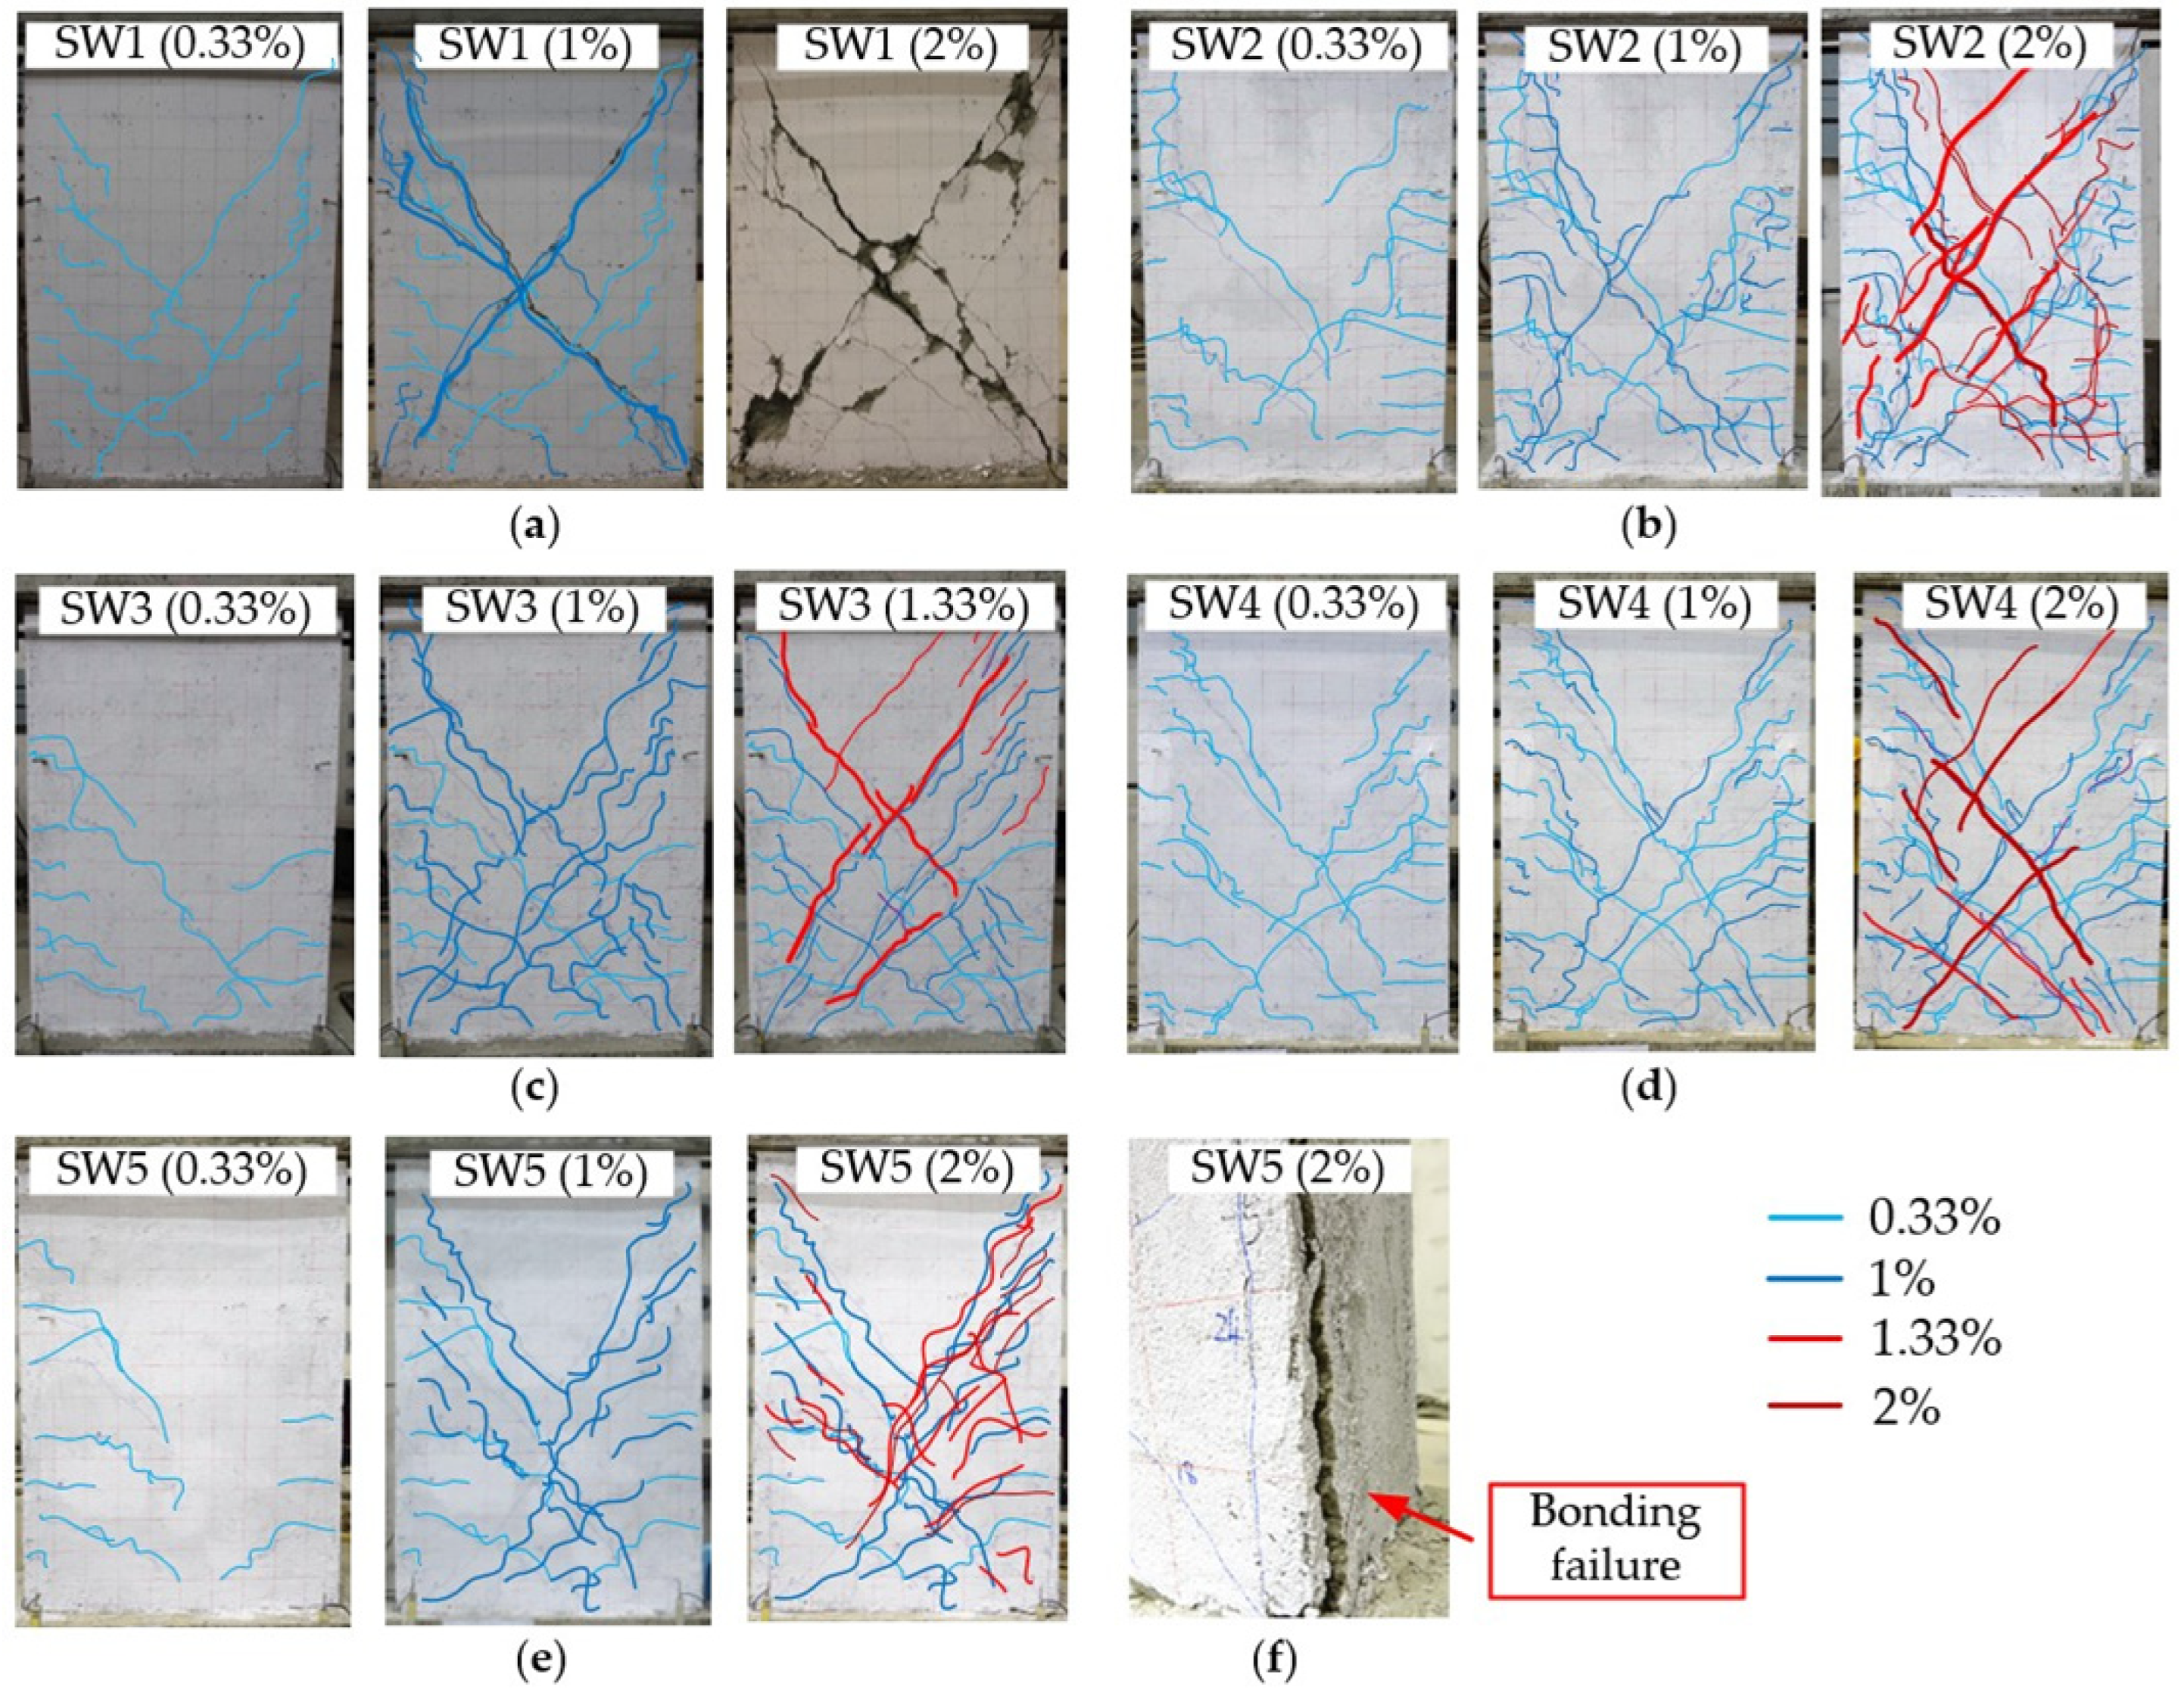
The experimental behavior of the strengthened shear wall specimens was discussed based on the initiation of major cracking followed by its propagation and subsequent failure mechanisms. As shown in
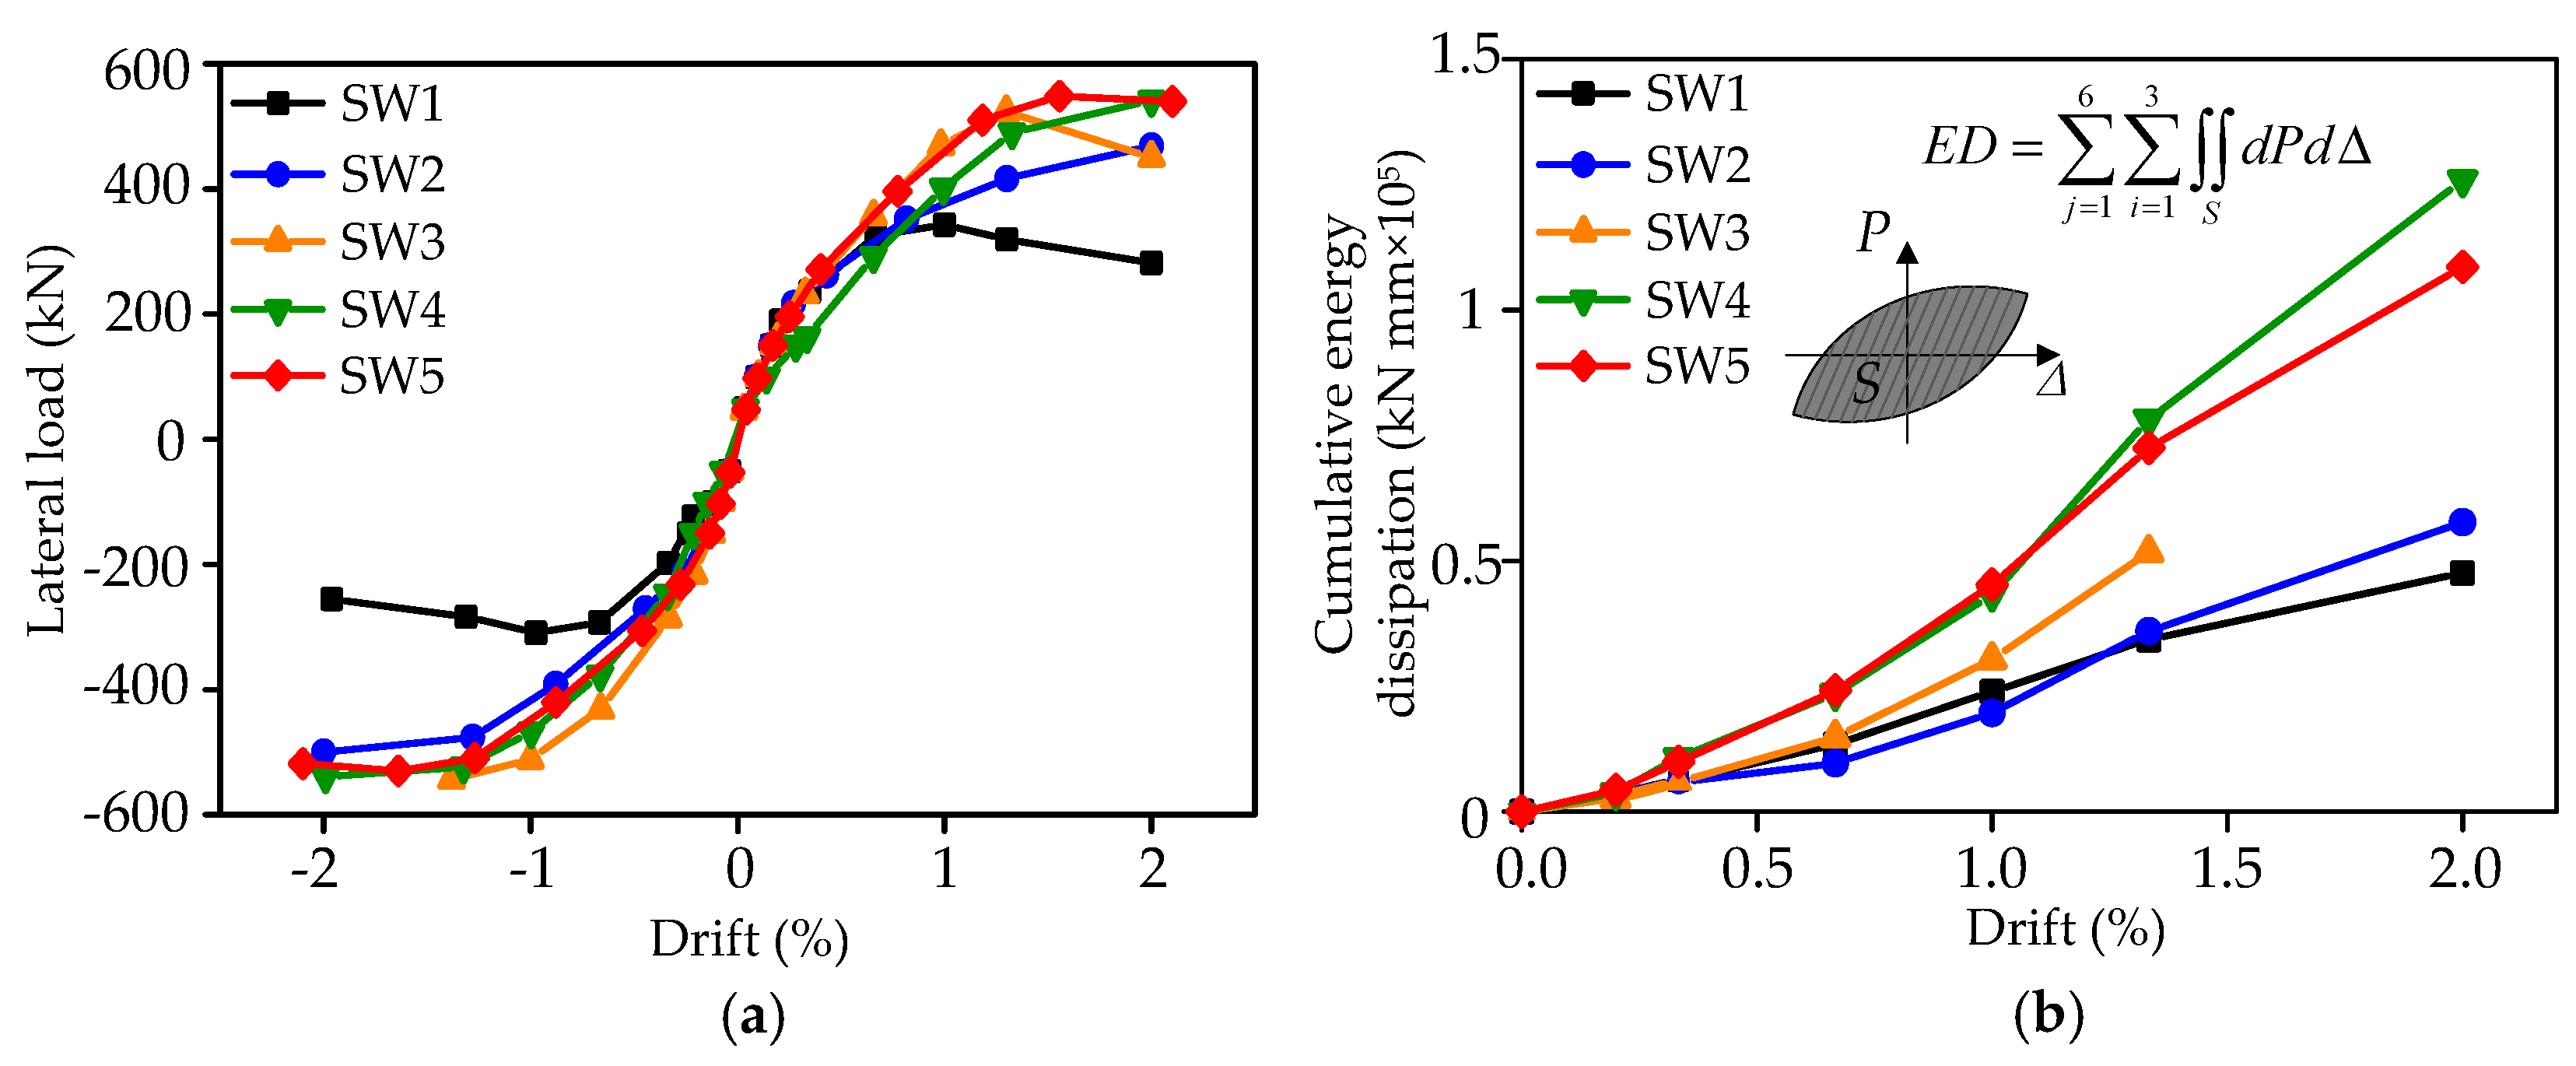
Figure 6, the formation of cracks and its propagation in control and strengthened specimens were found to be different. In the control specimen SW1, cracks were initiated as flexural cracks along the height of the specimen corresponding to a lateral load of 150 kN in the force control mode. Whereas in strengthened specimens, cracks were initiated in drift-controlled loading. In specimen SW2, flexural cracks were initiated at 0.2% drift (lateral load of 187 kN) slightly below the mid-height. Minor diagonal shear cracks were developed in specimen SW1 at 0.18% (178 kN) drift, whereas, in strengthened specimen SW2 shear cracks formed in the wall web at 0.27% (195 kN) drift. Multiple diagonal shear cracks were formed near the middle height of specimen SW1 corresponding to 0.33% (216 kN) drift. Subsequently, in specimen SW1, two major diagonal web-shear cracks in both the loading directions were formed at 1% (322 kN) drift and horizontal reinforcement started yielding (2212 με). Spalling and crushing of concrete were observed near the left bottom of the shear wall at a drift level of 2% (342 kN) and the test was terminated at the same drift level. In specimen SW2 multiple diagonal shear cracks developed at 1.33% (380 kN) drift, which were absent in control specimen SW1. Finally, two major diagonal web-shear cracks were formed at 2% drift (468 kN). The intense cracking on the surface of strengthened specimen SW2 was mainly due to the presence of steel wire meshes acting as horizontal reinforcement and restraining the development of major diagonal web-shear cracks. No debonding between polymer mortar layers and concrete surface was observed in specimen SW2.
In the case of higher SWM strengthening ratio specimens (SW3 and SW4), cracks were mainly originated either near the wall web or slightly below the mid-height of the shear wall. Flexural cracks formed initially near the mid-height of the shear wall at a drift of 0.25%. With increasing lateral drift (≥1%), flexural cracks propagated towards the opposite corners as flexure-shear cracks. Specimens (SW3 and SW4) observed flexure-shear cracks at 0.48% (311 kN) and 0.65% (342 kN) drift, respectively. Four major diagonal web-shear cracks were formed at 2% drift (541 kN) in specimen SW4. It was ascertained that the number of cracks in the shear wall web depends on the strengthening ratio of SWM. Minor flexure-shear cracks formed in the wall web in case of specimens SW3 and SW4 was found to be higher compared to specimen SW2. Most of the cracking was concentrated in the lower middle portion of the specimens. In specimen 3, at 1.33% drift, twisting near the loading stub beam was observed and the test was terminated due to experimental dysfunctionality. In case of specimen SW4 the test was terminated at 2% drift, when widening of the shear cracks was observed. Prior to the termination of the test, the specimens with a higher strengthening ratio observed significantly better behavior by delaying the formation of shear cracks and their propagation with the increase in drift levels. Further, most of the cracks were accumulated in the web region below the lower middle portion, attributing to the significant influence of steel wire mesh and polymer mortar. There was no debonding between polymer mortar layers and concrete surface in specimens SW3 and SW4 before the termination of the test.
In specimen SW5 (ρswm = 0.3%) with the wrapping of steel wire mesh only on exposed surfaces using four anchor systems, the flexure-shear cracks were found to be lesser than that of specimen SW4 (ρswm = 0.3%). Minor hairline flexural cracks initiated at 0.2% (192 kN) drift and with the increase in monitored drift, flexural cracks propagated towards the wall web at 0.66% (379 kN). In the subsequent drift levels, flexural cracks were connected with diagonal shear cracks and proliferated towards the loading and bottom corners of the specimen. After 2% (548 kN) drift level, debonding of polymer mortar layer along the height and crushing near the corners of walls was observed. The width of the cracks formed were found to be lesser than that of specimen SW3 (ρswm = 0.2%). From the comparison of crack patterns and failure mechanisms of specimens SW4 and SW5, it was comprehended that application of wrapping of steel wire mesh around the surface of the specimens was found to be beneficial compared to wrapping only on exposed surfaces as it confined the specimen and avoided debonding of mortar layers and crushing of core concrete of the shear wall.
5. Estimation of Shear Capacity of Strengthened Shear Walls
In the present study, theoretical analysis was carried out to predict the shear strength of strengthened shear walls. The effective coefficient of the steel wire mesh was derived based on the softened strut-and-tie model [
33]. The expression recommended in ACI 318 [
1] was modified to predict the capacity of the shear walls considering the influence of steel wire mesh reinforcement ratio and polymer mortar. The nominal shear capacity (
Vn) of the conventional shear wall estimated following ACI 318, and is calculated as the summation of the contribution of concrete and distributed transverse reinforcement, given in Equation (1).
where
αc is the coefficient to define the relative contribution of concrete strength to nominal wall shear strength, which linearly varied between 3 and 2 for 1.5 < H/L < 2.0;
λ is the modification factor to consider the reduced mechanical properties of lightweight concrete relative to normal weight concrete;
is the compressive strength of concrete;
fy is the yield strength of reinforcement;
Acv and
As are the gross area of concrete section and the transverse reinforcement, respectively. The capacity of the strengthened shear wall (
Vns) considering the contribution of steel wire mesh and polymer mortar is given in Equation (2).
where
Em and
Ec are the elasticity modulus of polymer and concrete, respectively (
Table 2);
Am is the area of polymer mortar layers;
β is the effective coefficient of the steel wire mesh;
fyw is the ultimate tensile strength of steel wire;
Ahw is the area of the horizontal SWM layers. In the present study, the effective coefficient (
β) was derived following the softened strut-and-tie model (STM). To finalize the resistance model following the principles of equilibrium, the differential expression of shear force can be written as
where
M and
V represent the bending moment and shear force, respectively;
T is the tensile force of longitudinal reinforcement;
L is the internal moment arm (
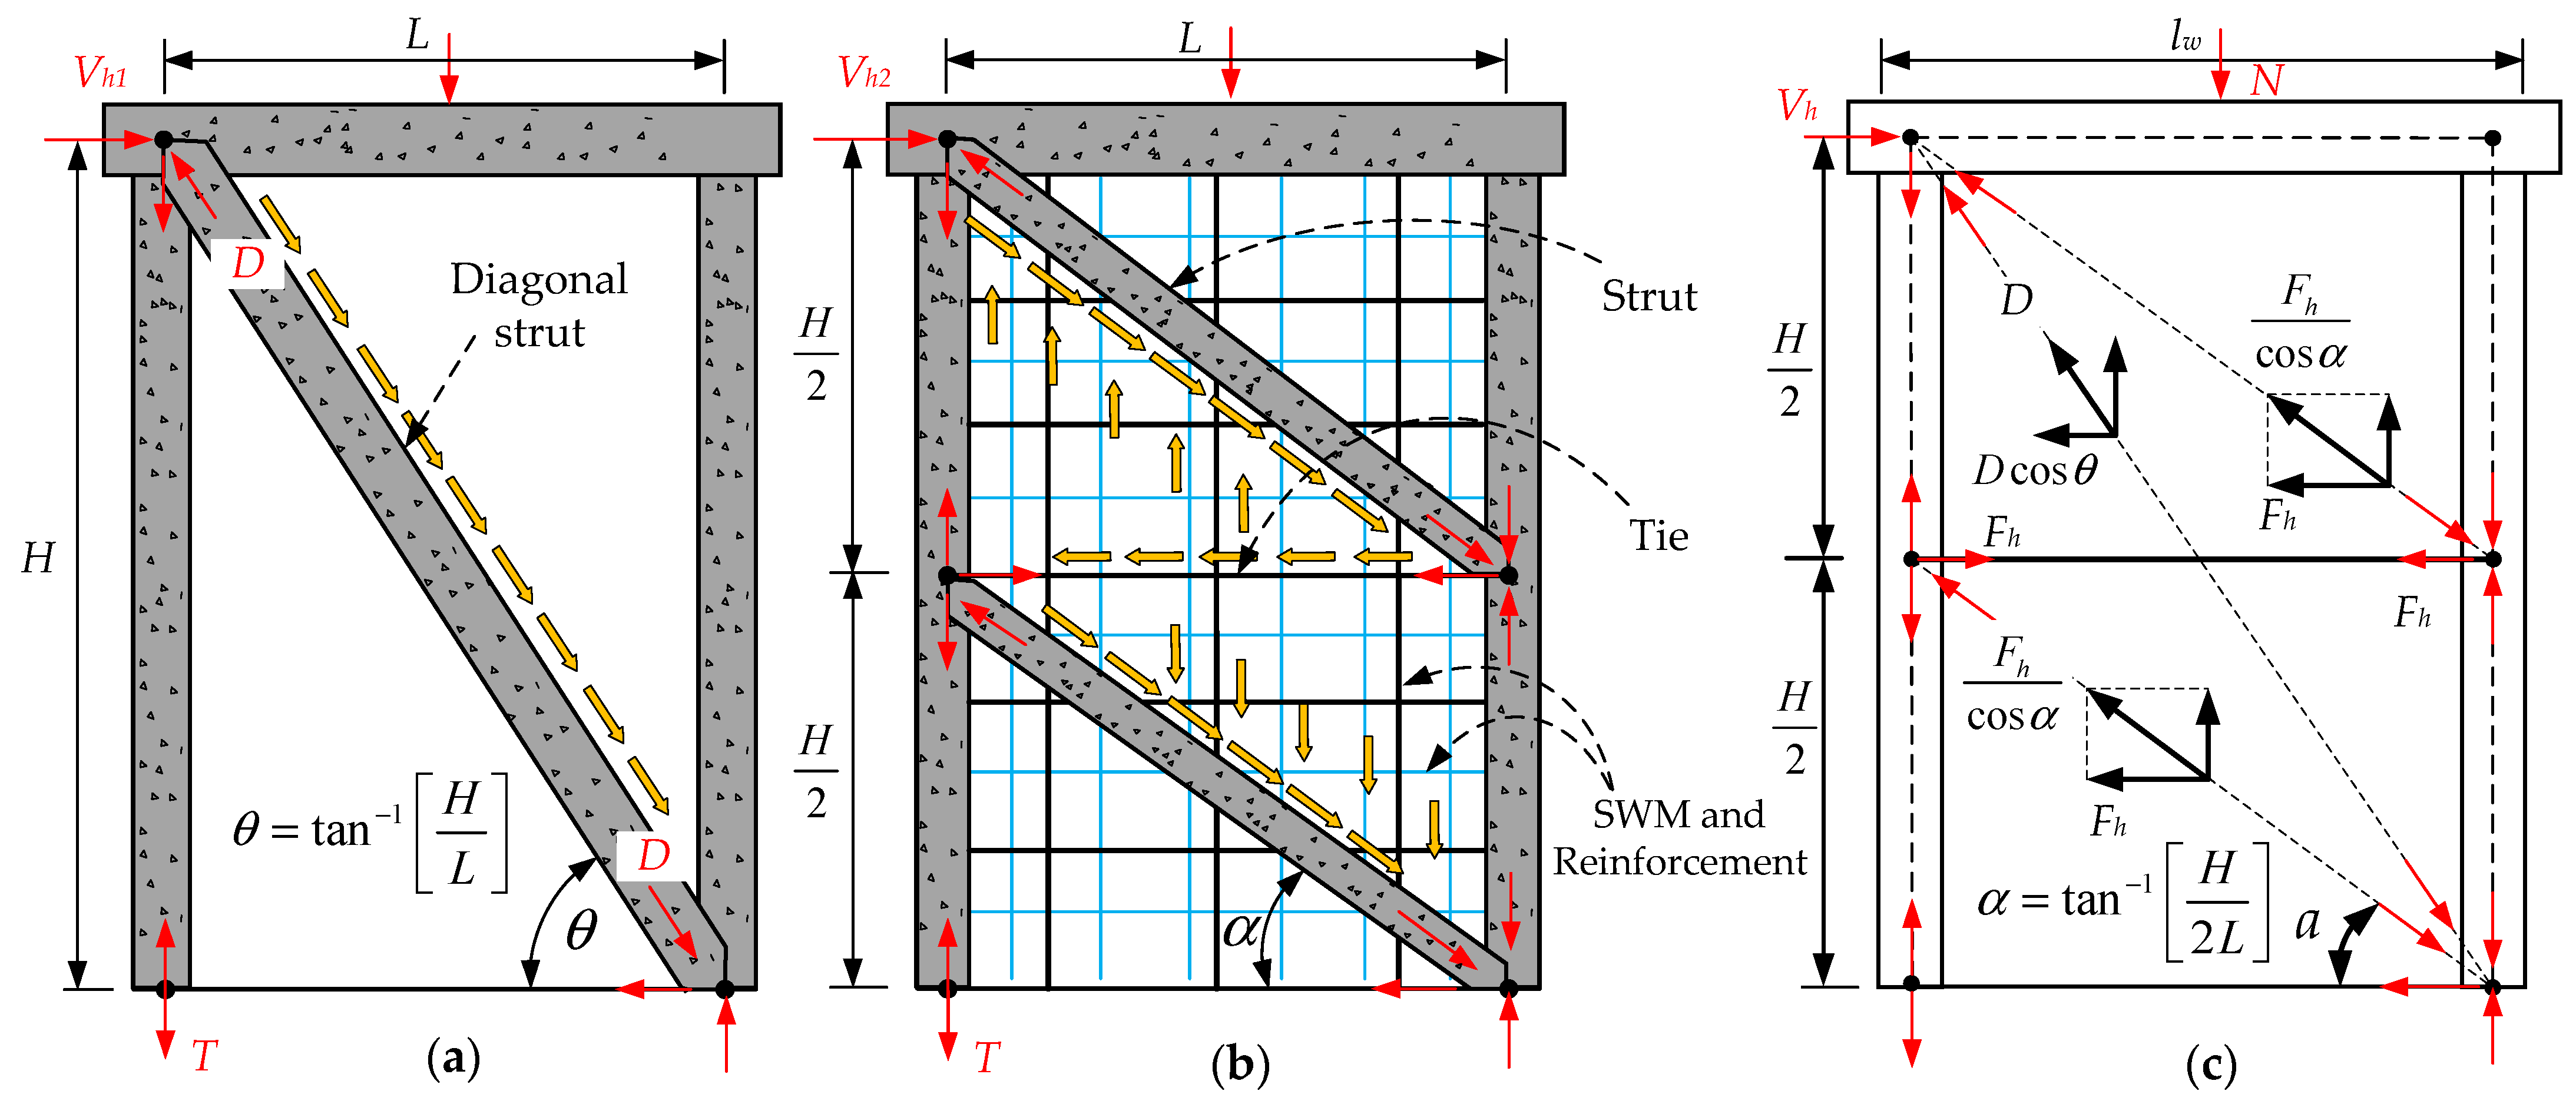
Figure 10). The two terms on the right-hand side of Equation (3) represent the arch (
Figure 10a) and truss (
Figure 10b) mechanisms by which the external shear force was resisted. Further, the combined force analysis of arch and truss mechanisms is shown in
Figure 10c.
The arch mechanism (
Vh1) was taken as diagonal compression force in the strut (
D cos
θ), whereas the truss mechanism (
Vh2) includes horizontal ties and two struts. During the tests, most of the horizontal strain gauges in the wall web exceeded yielding (2210 με), as shown in
Figure 9a, as soon as the specimens attained the peak load capacity. For this reason, the resistance provided by the horizontal ties was taken as a combination of the contribution of transverse reinforcement and steel wire mesh (Equation (5)).
According to Jennewein and Schafër [
34], the stiffness ratio between the truss mechanism and the arch mechanism to transfer the horizontal shear is given by
γh/(1 −
γh).
γh represents the fraction of horizontal shear transferred by the horizontal tie (Equation (6)). Therefore, the external lateral shear force (
Vh) must be apportioned to the truss and arch mechanisms as given in Equation (7).
Since the external lateral shear force (
Vh) is mainly transferred in the major stress direction of the wall web, the average principal compressive stress
σd is assumed to govern the failure [
33]. The combined truss and arch mechanisms can be estimated considering the compressive stress field distribution and cartesian transformation (
Figure 11), as shown in Equation (8).
where
σd represents the average principal compressive stress of concrete (here a positive sign represents tension) resulting from compressive forces from arch and truss mechanisms;
Astr represents the effective area of the diagonal strut;
φ is the angle between the principal stress and the horizontal direction.
The angle
φ was calculated as per eigenvalue calculation considering the average major horizontal (
εh) and vertical tensile (
εv), and diagonal compressive strains (
εd) as shown in
Figure 11. The shear strain (
γ) is an unknown parameter and is determined following the principles of similar matrices in Linear algebra (determinants of the similar matrices are equal). It is assumed that eigenvalue vector
x can be written as
x = (
a,
b)
T. The eigenvalue vector
x corresponding to strain matrix
A is the direction vector of principal strain direction. Using the trigonometric relationships, the angle
φ between the principal stress and the horizontal direction can be obtained. Hwang and Lee [
35] reported that the average principal compressive strain (
εd) was linearly varied from −0.001 to 0 for shear walls with shear span ratios of 1 to 3, respectively. The average principal compressive strain
εd in the present study was about −690 με as the shear span ratio of specimens was 1.62. The average principal tensile strain
εr was calculated as per the first strain invariant as follows.
The average horizontal tensile strain
εh and the average vertical tensile strain
εv were taken as +0.002 and +0.001 based on the observations of strain recordings, respectively. The unknown variable of effective area of the diagonal strut
Astr was defined in Equation (10).
where
aN is the equivalent width of the principal stress strut (
Figure 11) and can be approximated using Paulay and Priestley’s [
36] equation for the depth of the flexural compression zone of an elastic column as follows.
where
Aw is the net area of the concrete section bounded by the web thickness (
tw) and the length of the section in the direction of the shear force (
lw). It has to be noted that in the strut-and-tie model, the axial compression not only delayed the softening effect of concrete but also increased the cross-sectional area of the principal strut. The average principal compressive stress of concrete (
σd) was calculated based on the ascending branch of the softened stress-strain curve of the cracked concrete model proposed by Zhang and Hsu [
37] and is given in Equation (12).
where
ζ is the softening coefficient and
ε0 is the strain corresponding to the concrete cylindrical strength
which can be estimated using the Equation (14) proposed by Foster and Gilbert [
38].
The effectiveness coefficient (
β) of steel wire mesh is calculated using Equation (15), by solving Equations (4)–(14). The flowchart of the solution procedure to estimate the effectiveness coefficient (
β) is shown in
Figure 12.
Table 5 shows the comparison of the shear capacity of RC shear walls between the experimental (
Ve) and predicted (
Vt) results. It was observed that the influence of effectiveness coefficient (
β) decreased with an increase in steel wire mesh strengthening ratio. The effect of strengthening options wrapping around or only on exposed surfaces to estimate
β was not considered as the shear capacity of specimens (SW4 and SW5) was found to be very close. The mean value (
μ) and standard deviation (
σ) of
Ve/
Vt was found to be about 1.05 and 0.04, respectively. This clearly showed that the proposed expression accurately predicted the shear capacity of the shear wall strengthened with SWM.
In order to verify the suitability of the proposed expression, a comparative study was carried out to estimate the shear capacity of specimens tested in the previous study by Liao et al. [
39], and is given in
Table 5 and
Figure 13. The proposed expression reasonably estimated the shear capacity of the strengthened specimens as in the case of Liao et al. [
39], and the ratio was in the range of 0.85–0.99. The mean and the standard deviation of
Ve/
Vt were found to be about 0.92 and 0.08, respectively. Considering the maximum upper bound (17.3%) and lower bound (13.1%) deviations (
Figure 13), it was apprehended that the lateral load capacity of RC shear walls strengthened with steel wire meshes can be predicted fairly using the proposed expression.
The proposed expression Equation (15) to estimate the effectiveness coefficient is slightly complex in nature to be used in practical engineering purposes. Henceforth, multiple linear regression analysis was carried out and a simplified empirical expression (Equation (16)) was proposed to predict
β as a function of
n,
H/L, and
ρswm. The effectiveness coefficient
β is significantly influenced by the strengthening ratio (1.883) compared to the axial compression
n (0.6) and shear span ratio
H/L (0.687). The multiple linear regression expression with a favorable coefficient of determination (
R2 = 0.94) is presented in
Figure 13b, from which it can be ascertained that
β generally tends to decrease with an increase in
H/L and
ρswm. Conversely,
β was found to increase with an increase in
n, and this is likely due to the axial compression force, which increased the width of the strut in the strut-and-tie-model. Due to the limitation in the number of experimental investigations, further research needs to be conducted to provide a more reliable expression to estimate the effectiveness coefficient of the steel wire mesh.


