Abstract
The results of an experimental study of four infilled frames with brick masonry walls subject to reversal cyclic lateral load are presented. The variables studied were the height to length aspect ratio of the wall and the use of joint reinforcement. The investigation was motivated by the fact that the Mexican code establishes the same specifications about the use of joint reinforcement for infill walls as for confined walls, because there is not enough experimental evidence on joint reinforced infill walls. To investigate the possible interaction of the study variables in the seismic performance of the walls, two pairs of specimens, scaled 1:2, with different aspect ratios (H/L = 0.75, 0.41) were tested. The specimens in each pair were identical except that one of them included steel bars into the bed-joints as reinforcement leading to amount . The infill walls with H/L = 0.41 were included from a previous study. The behavior of the specimens was defined in terms of lateral strength, ductility, displacement capacity, deformation of the joint reinforcement and crack pattern. The results indicate that joint reinforcement increases the strength of the system; however, the increase was more pronounced in longer walls. Ductility was reduced with horizontal reinforcement and this behavior was more important for longer walls. As occurred in confined walls, the joint reinforcement generates a more distributed cracking and reduces the width of the cracks. The experiments are described and this and other results are discussed in detail.
1. Introduction
Load-bearing walls are those that support both vertical and lateral loads. Usually, when these type of walls are used, they constitute the main resisting elements in the system. Historically, unreinforced masonry was used for load-bearing walls around the world; however, it is rarely used now a days in seismic zones where it has been replaced by reinforced and/or confined masonry walls. Reinforced masonry is seldom used in developing countries, such as Mexico, mainly due to its high cost when compared to confined masonry [1]. For this reason, we will restrict our presentation to confined masonry walls.
On the other hand, infill walls are surrounded by beams and columns of a structural frame, to which they provide rigidity against lateral loads [2]. Unreinforced masonry is still the dominant masonry system for infill walls. Only recently, confined masonry was proposed as an alternative system for infill walls (Figure 1). It has been observed in experimental tests, that unreinforced masonry infill walls can fail out of plane once they have developed some type of cracking during an earthquake. Confining elements reduce the vulnerability of the wall to out-of-plane failure and improve the performance of in-plane walls [3]. The system was adopted in the Mexican code, while unreinforced masonry for infill walls is no longer allowed [2]. It is recognized that out-of-plane failure of infill walls is common during seismic action. If this failure is not properly prevented, any reinforcement for in-plane actions could be useless. However, only in-plane behavior of infill walls is included in this paper.
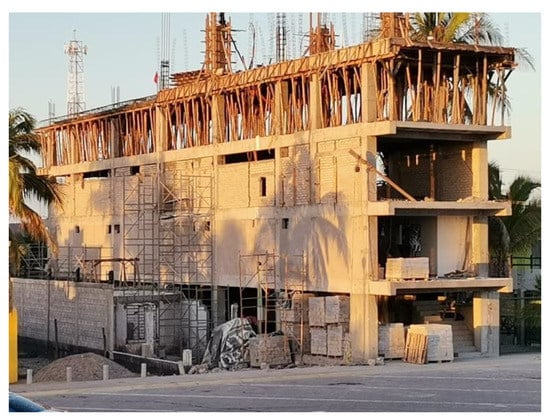
Figure 1.
Mexican construction practice of masonry infill walls.
Although, in appearance, a confined masonry construction and a reinforced concrete (RC) frame infilled with masonry walls may look alike, structurally they perform quite differently [4]. Figure 2 shows the main differences, which are related to the construction sequence and the manner in which they support vertical and lateral loads. A confined masonry wall consists of a nonreinforced masonry panel surrounded by concrete tie-columns, in the vertical direction, and tie-beams, in the horizontal direction, known as confining elements [5]. The masonry panel is built first and the confining elements are cast in place afterwards against the panel rough sides (toothed or with dowells). This construction sequence guaranties the full integration of the confining elements and the panel. The confining elements provide additional lateral strength after diagonal cracking and increase the displacement capacity of the walls. However, confining elements do not provide an effective frame action and, consequently, masonry walls support gravity loads [6].
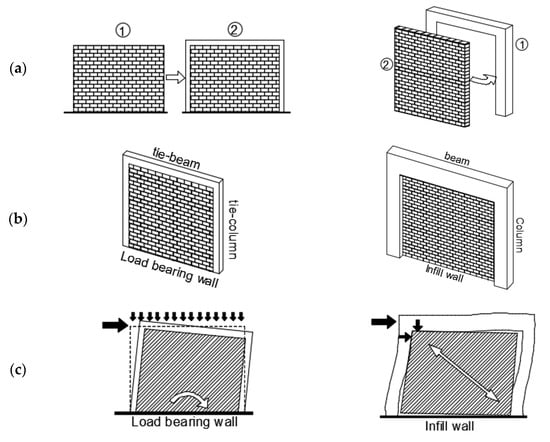
Figure 2.
A comparison of confined masonry construction and RC frames with masonry infills. (a) Construction sequence, (b) Size of concrete elements, (c) Seismic response.
Unlike confined masonry construction, in RC frame infilled with masonry walls, the columns and beams are built first and the wall later to fill the frame span. The result is that there is a lack of bond between the masonry infill and the RC frame (Figure 2a), especially when the wall is unreinforced and no confining elements are provided. When using confining elements and a careful construction process, full interaction between the frame and the infill wall could be achieved [3].
Other differences relative to confined masonry walls is that infill walls do not support vertical loads. The main reason for this fact is that the axial stiffness of the columns is much higher when compared to the axial stiffness of the infill walls (Figure 2b). Additionally, in infill wall construction, it is not uncommon to have gaps between the panels and the concrete beams. These gaps are created when the walls do not fit tightly to the underside of the beams. These gaps allow the beams to deflect without transferring the gravity loads to the wall below [4].
When subjected to lateral seismic loads, confined walls act as shear wall and infill walls act as diagonal strut (Figure 2c). In the case of infill walls, the masonry wall separates from the surrounding frame due to their different deformation characteristics and to a relative lack of bond. Separation occurs in two diagonally opposite corners while in the other two corners the masonry wall reacts against the frame over a certain length of contact extending from the loaded corners. Consequently, the system behaves approximately as a braced frame [7,8,9,10,11,12,13,14,15]. When the direction of the lateral load is reversed, the braced frame mechanism is developed along the direction of the other diagonal [16].
For mid-rise masonry constructions under seismic loading, the shear strength of the walls is commonly exceeded. In that case, steel bars within the mortar bed-joints may be provided as shear reinforcement. Another use of the joint reinforcement is for cracking control against volumetric changes in masonry walls or bonding of multiple wythes.
In Mexico, joint reinforcement consists of cold drawn steel wires with diameters of 5/32-in (3.97 mm), 3/16-in (4.76 mm) and 1/4-in (6.35 mm). The yield strength of this steel wires is 588 MPa. The wires should be properly anchored in RC elements or internal cells. Lapping is not allowed because the bond between the wire and mortar, and between the mortar and masonry units, gradually degrades with cracking [6].
For load-bearing walls, the use of reinforcement within bed-joints normally improves their behavior when they are subjected to lateral loads. Joint reinforcement significantly increases the lateral strength and displacement capacity of the walls.
It is generally accepted that the horizontal reinforcement does not affect the initial stiffness and cracking strength of masonry walls, since it is argued that the reinforcement is activated after the first diagonal crack appears. The reinforcement produces a distributed cracking and the crack width is smaller than in walls without joint reinforcement. In addition, it retards the shear strength degradation of the wall and increases its lateral deformation capacity [17,18,19]. In the 2004 edition of the Mexican code [20], Equation (1) to estimate the contribution of the joint reinforcement to the shear strength of confined masonry walls was included, for the first time:
In such equation, is the strength reduction factor, is the cross-section area of the wall, is the yield strength of joint reinforcement, is the percent of steel reinforcement, is the vertical spacing, is the thickness of the wall and is an efficiency factor which depended only on the amount of joint reinforcement given by .
In the 2017 version of the Mexican code [2], the expression for calculation was updated to include several new concepts. The contribution of the joint reinforcement was limited by the masonry compressive strength and the net area of the masonry units, while the masonry component was reduced by the percent ratio of joint reinforcement [6,21]. The efficiency factor was defined as in Equation (2):
where depends on the aspect ratio (H/L) of the wall Equation (3), is a factor to take into account the reduction of efficiency with the product Equation (4), is a reduction rate and is an efficiency factor depending on the compressive masonry strength Equation (5):
It is important to say that few information is found in the existing literature about the effects of joint reinforcement on the seismic behavior of infill masonry walls. Consequently, the Mexican code [2] establishes the same equations to estimate the contribution of joint reinforcement for both confined walls and infill walls.
Leal et al. [3] tested six infill walls subjected to cyclic lateral load, of which four included confining elements and the rest were of unreinforced masonry. All the walls had the same aspect ratio. Additional variables were wall/frame stiffness using different column sizes and the use of joint reinforcement. It was concluded that the contribution of horizontal reinforcement to the lateral load resistance of the system depends on the wall/frame stiffness ratio. For the specimens with smaller columns, the contribution of the reinforcement was greater. This result was attributed to the fact that in the specimens with larger columns, the failure in the wall was predominantly due to sliding shear along the bed-joints, preventing the proliferation of diagonal cracks needed for the activation of the joint reinforcement.
Due to the evident differences among confined walls and infill walls (for example, infill walls do not support vertical loads, and when subjected to lateral loads the wall separates from the concrete elements), and that in the RC infilled frame system includes variables that are not included in confined walls, such as the relative wall/frame stiffness, it is suggested that the contribution of the joint reinforcement is different than in the case of confined walls.
It is generally accepted that the shear strength of masonry walls increases with decreasing aspect ratio. To take into account this fact, several construction codes for reinforced masonry include a modification factor as a function of aspect ratio [22]. Based on experimental evidence from several authors, Alvarez and Meli [23] argued that aspect ratio affects the strength due to stress distribution changes in comparison with square walls (H/L = 1).
Later, this idea was confirmed for confined masonry walls in an experimental study in which seven walls with aspect ratios from 0.3 to 2.2 were tested [5]. In addition, it could be observed that for slender walls, diagonal tension was the main failure mode, while a combination of diagonal tension and sliding dominated as the aspect ratio decreased. Cruz and Pérez-Gavilán [24] confirmed that sliding is a mechanism that frequently appears in long walls after significant cracking due to tension. Consequently, joint reinforcement can be effective. However, once sliding appears, this inhibits the production of new inclined cracks, which are necessary to deform the joint reinforcement.
In this paper, new experimental evidence is presented about the contribution of the joint reinforcement on the behavior of RC frame infilled with masonry walls subject to in plane lateral load for different aspect ratios. For the analysis, two new specimens were tested and the results were complemented with previous tests using the same type of material presented by Leal et al. [3]. The hysteretic behavior of the walls is evaluated through standard structural parameters, such as the cracking strength, peak strength, displacement capacity, ductility and cracking patterns. In addition, the contribution of the joint reinforcement to the shear strength of the walls is analyzed in detail. For that purpose, stress in the wires was estimated using measurements of strain gauges from which the forces in the steel bars were calculated using classical plasticity theory. The importance of this investigation is attributed to the fact that there is not enough experimental evidence about the use of joint reinforcement on infill walls; consequently, the Mexican code [2] establishes the same specifications as those of confined walls. The test results here presented contribute to verify the Mexican code considerations on the topic.
2. Experimental Program
An overview of the specimens and tests is presented below. Detailed information regarding the design of the specimens, material properties, construction sequence, test setup, instrumentation and load sequence can be found on Leal et al. [3].
2.1. Specimens
Four specimens, scaled 1:2, were built and tested. A summary of characteristics of the specimens is presented in Table 1. All the specimens included tie-columns and tie-beams on the infill wall perimeter. The dimensions of these concrete confinement elements were 65 × 100 mm. The main reason to use confinement elements is to anchor the joint reinforcement.

Table 1.
Description of the specimens.
2.2. Material Properties
Mechanical properties of the material were investigated through the corresponding standard Mexican tests, similar to the ASTM tests. The average values for the compressive strength of masonry units (), compressive strength of mortar (), concrete strength () and elastic modulus (), compressive strength of masonry () and diagonal compressive strength () are shown in Table 2.
Table 2.
Material properties (MPa).
In all cases, the infill walls were made of brick units with nominal dimensions of 25 × 65 × 125 mm. All the units were obtained from the same production batch.
2.3. Reinforcement
2.3.1. Reinforcement in Reinforced Concrete Elements
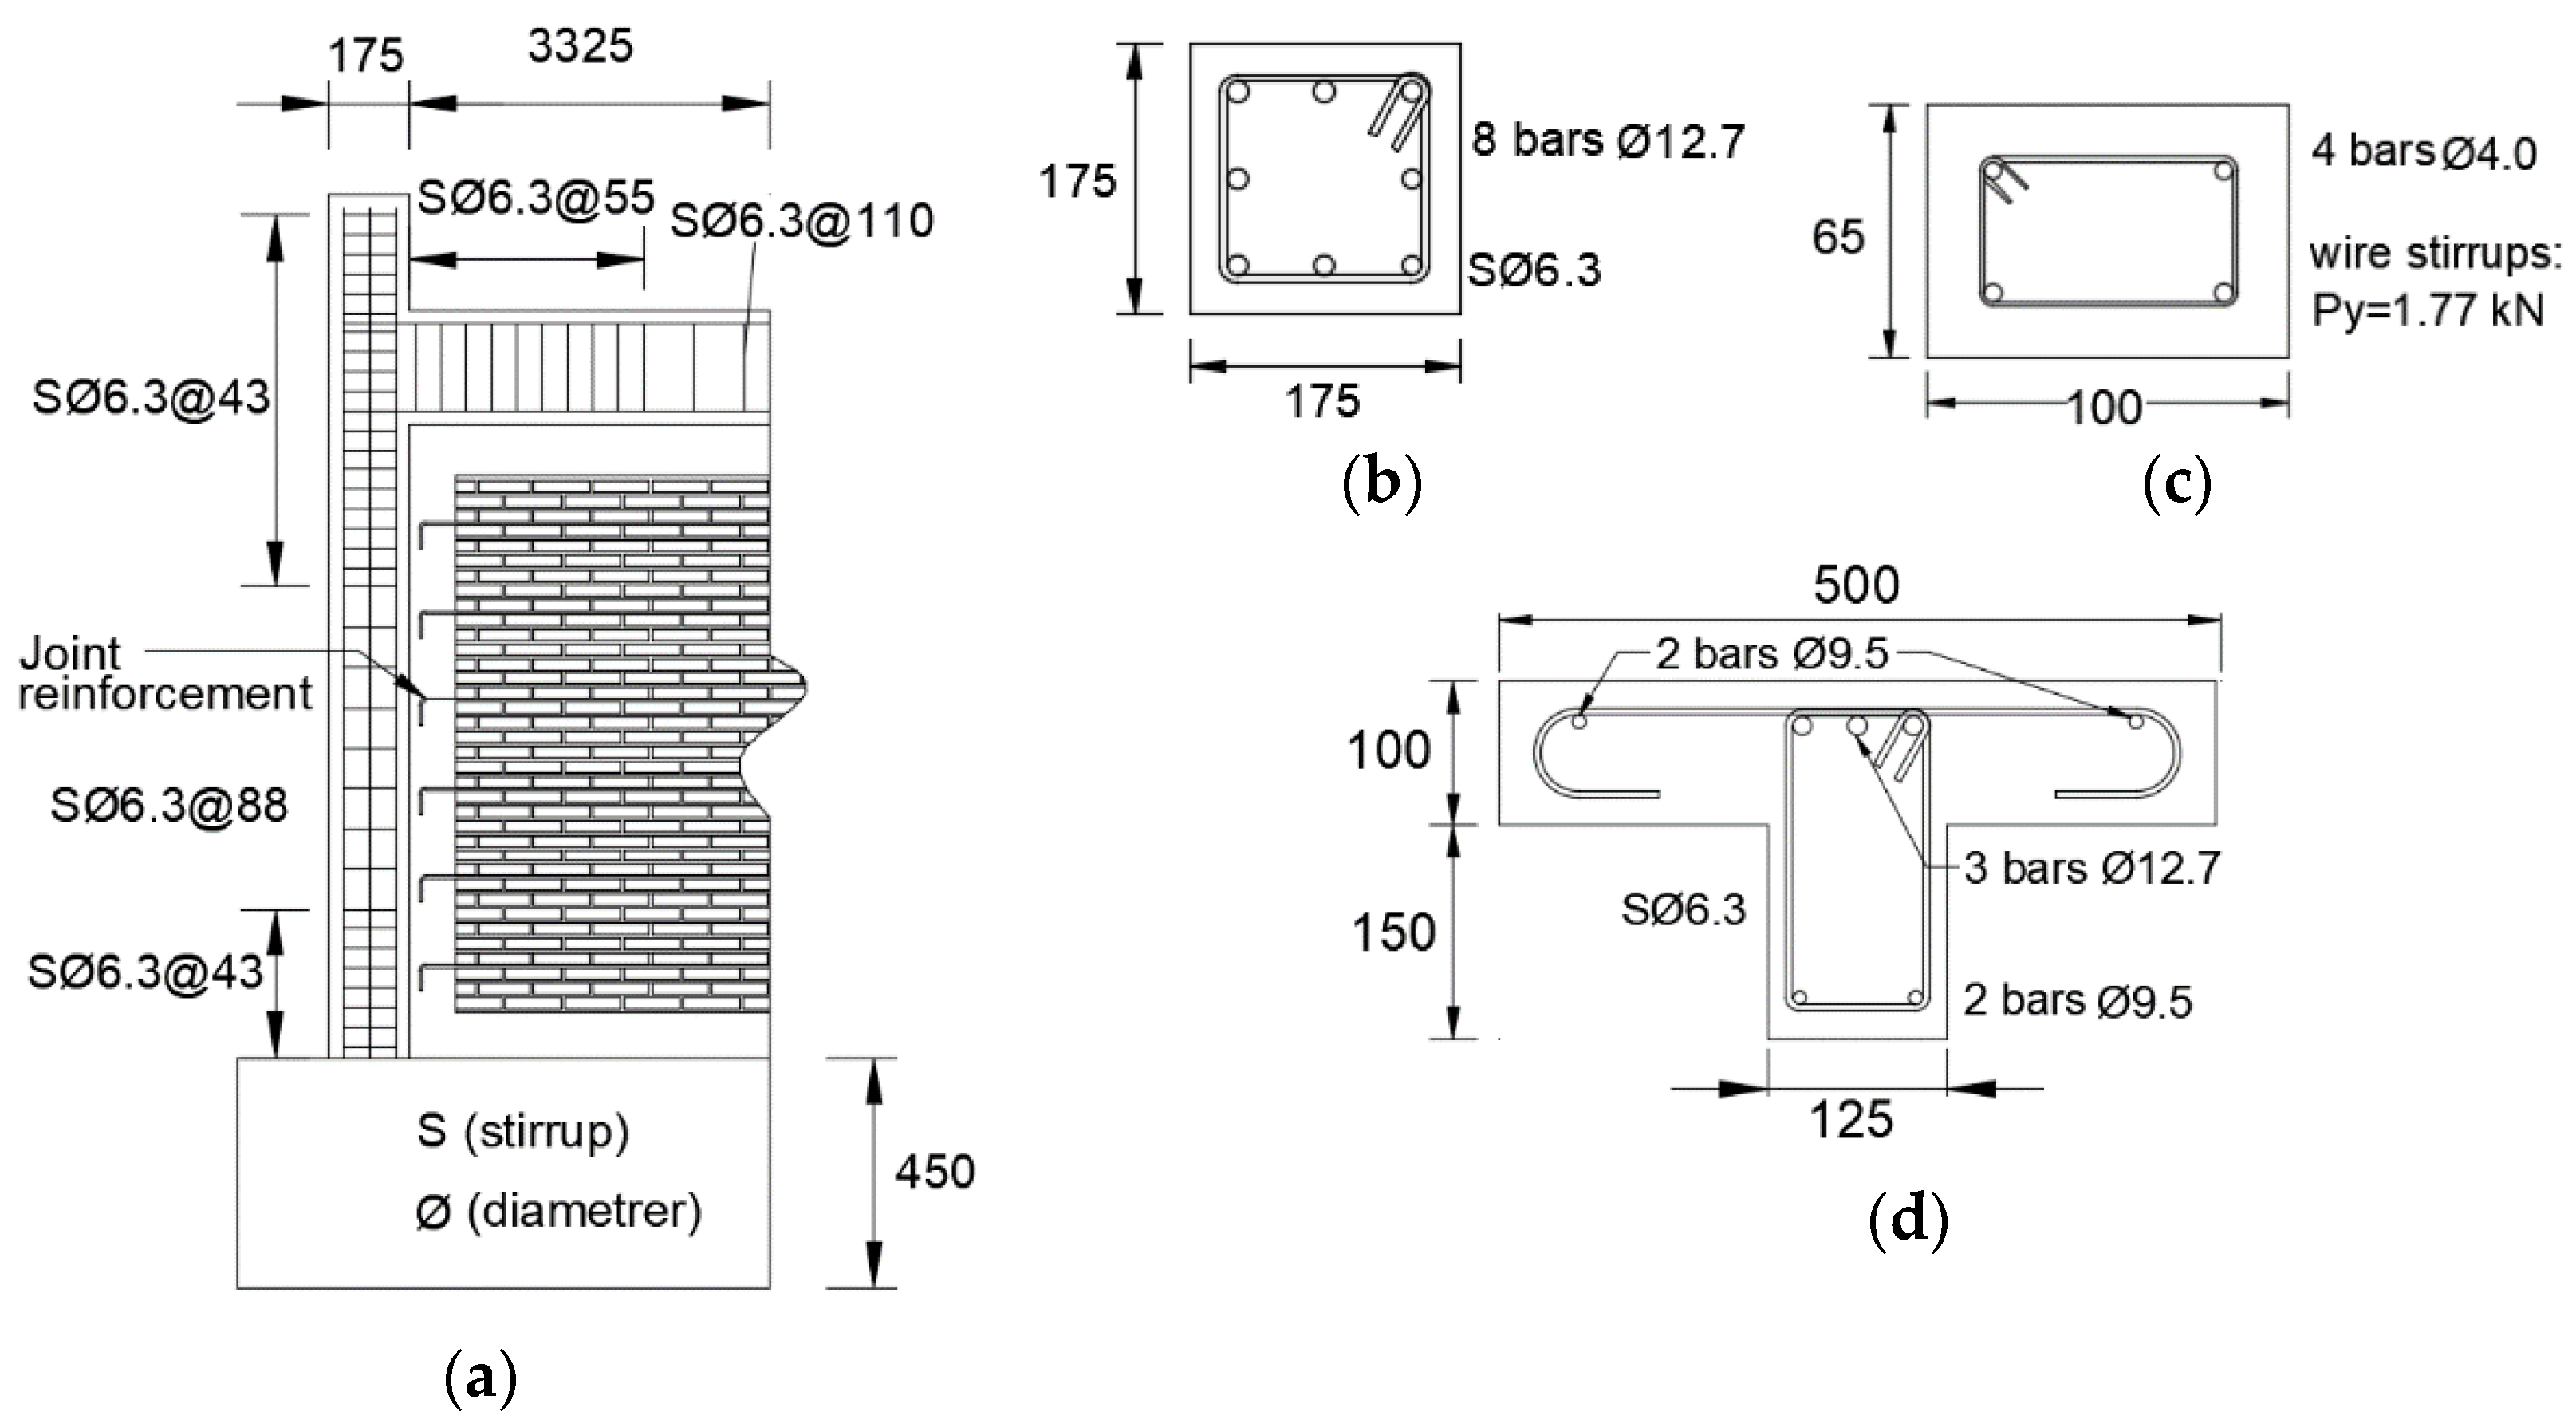
The longitudinal reinforcement in columns and beams consisted of rebars of 12.7 mm (1/2″) and 9.5 mm (3/8″) diameter with a nominal yielding stress 412 MPa. Transverse reinforcement consisted of rebars with 6.3 mm (1/4″) diameter stirrups with equal to 230 MPa. In the case of confining elements, 4 mm diameter bars were used for longitudinal reinforcement ( 588 MPa) and tie wire for transversal reinforcement. Figure 3 shows the details of the reinforcement in columns and beams, as well as tie-columns and tie-beams.
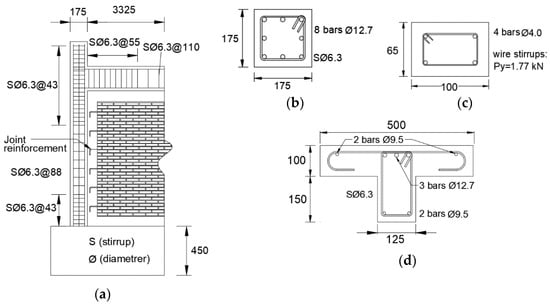
Figure 3.
Dimensions (in millimeters) and reinforcing details of specimens. (a) elevation view, (b) columns, (c) tie-columns and tie-beams, (d) beams.
2.3.2. Reinforcement in Bed-Joints
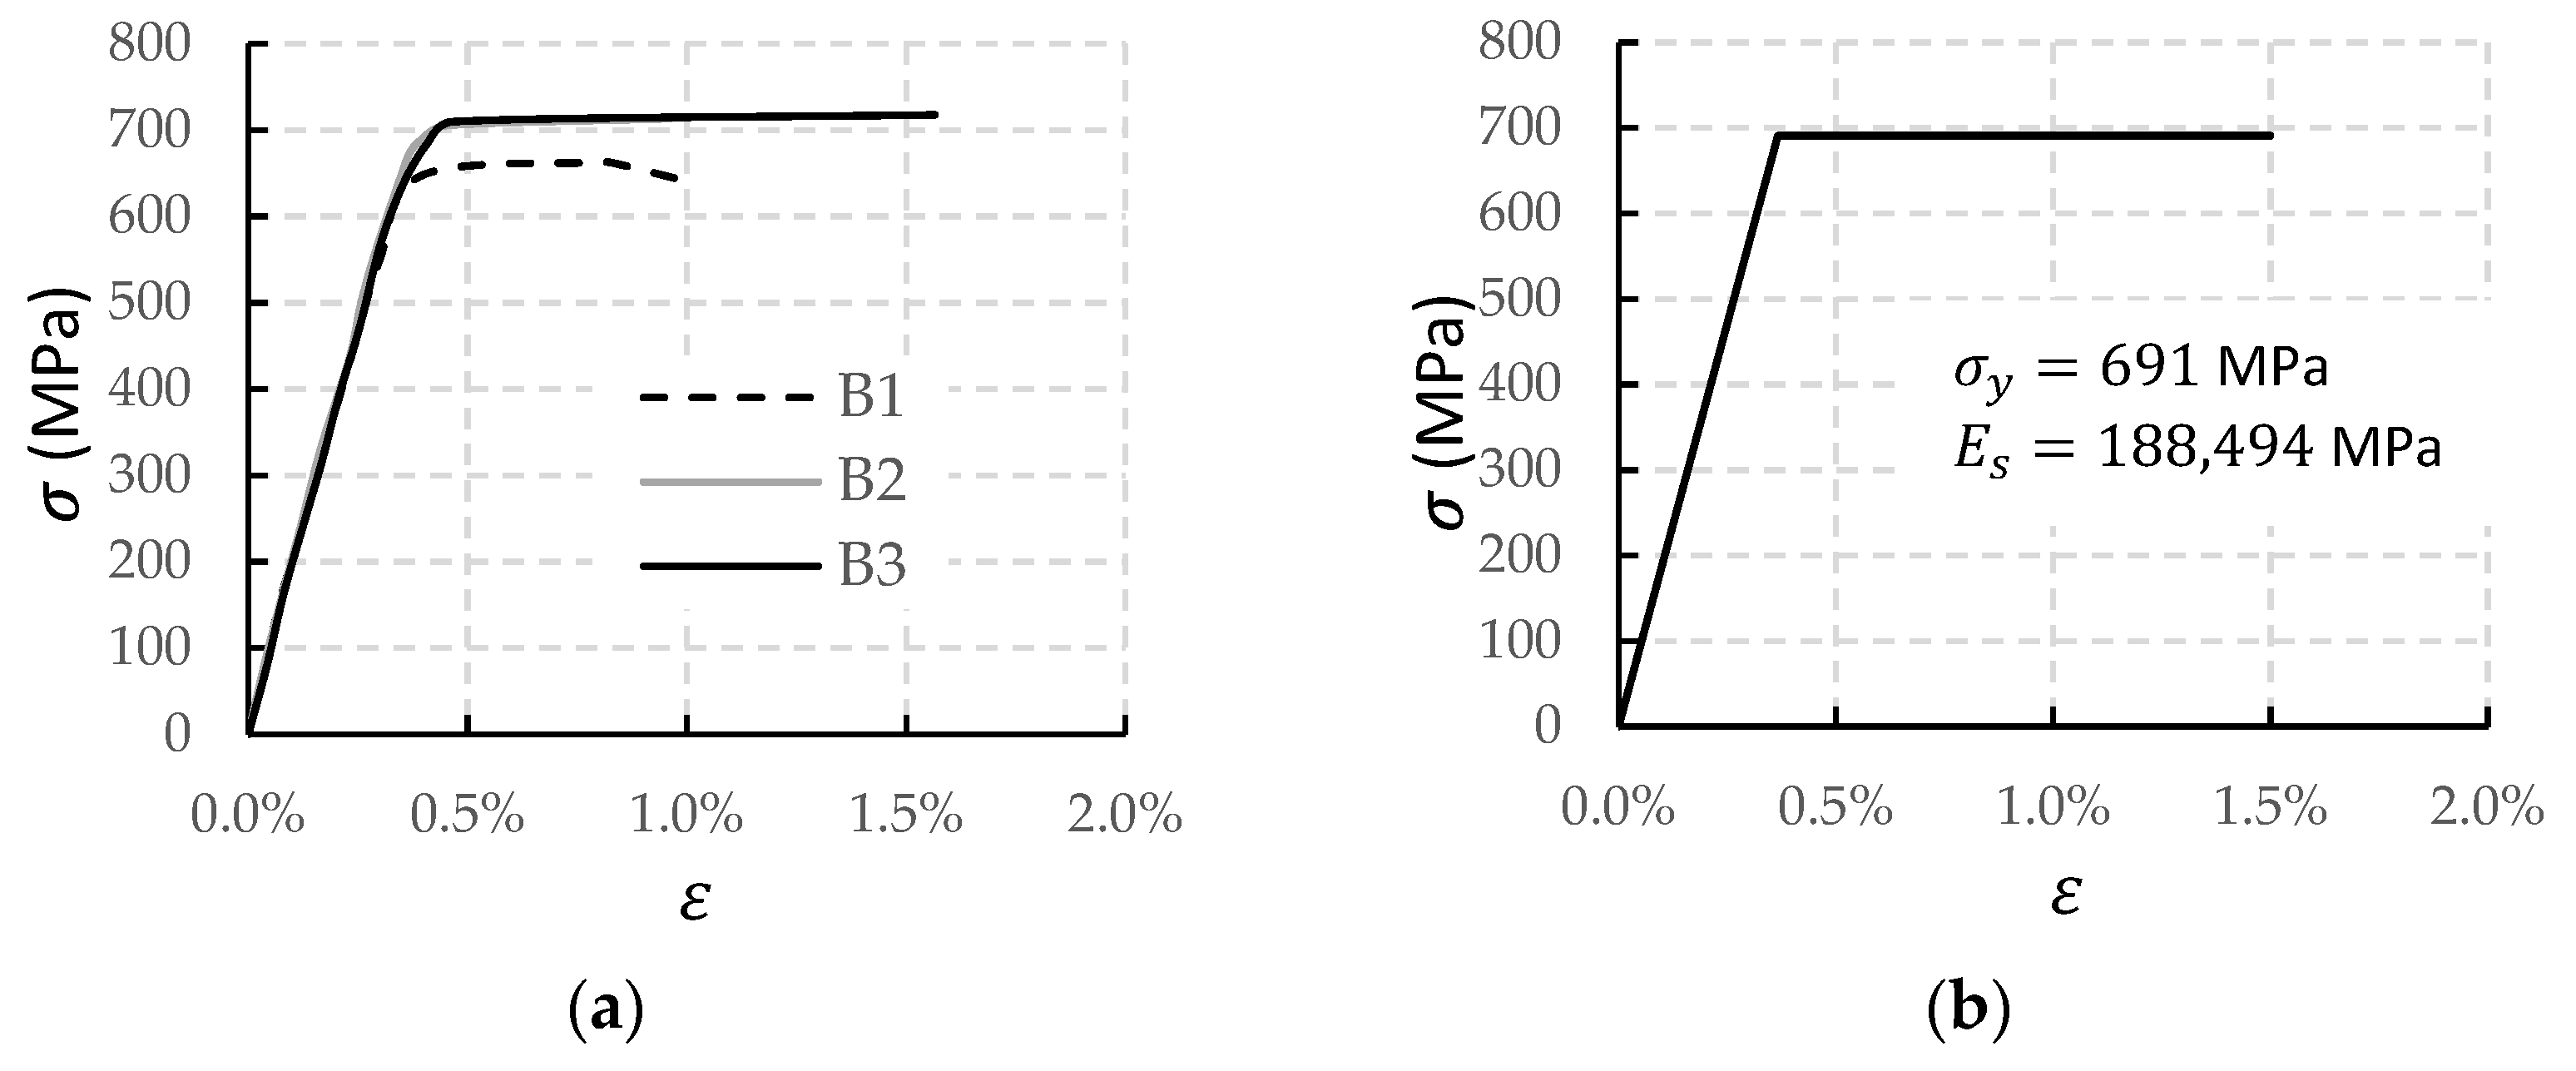
Joint reinforcement consisted of 4 mm (5/32″) diameter bars, which were investigated through three samples tested in tension (Figure 4a). The average values for yield stress () and elastic modulus () were 691 MPa and 188,494 MPa, respectively. The reinforcing bars were located every six courses, corresponding to a value for = 0.6 MPa. The diameter and spacing of joint reinforcement were selected in concordance with the requirements of the Mexican code [2] relative to the use of steel bars with smaller diameter than 0.75 thick bed-joint and spacing no larger than six courses. Details of the joint reinforcement are shown in Figure 3.

Figure 4.
Stress–strain curve of joint reinforcement. (a) curves of samples tested, (b) average curve.
In order to estimate the contribution of the joint reinforcement to the shear strength of the walls, an average stress–strain curve was obtained to characterize the reinforcing bars. This average curve was approximated to an elastoplastic curve (Figure 4b).
2.4. Test Setup and Load Sequence
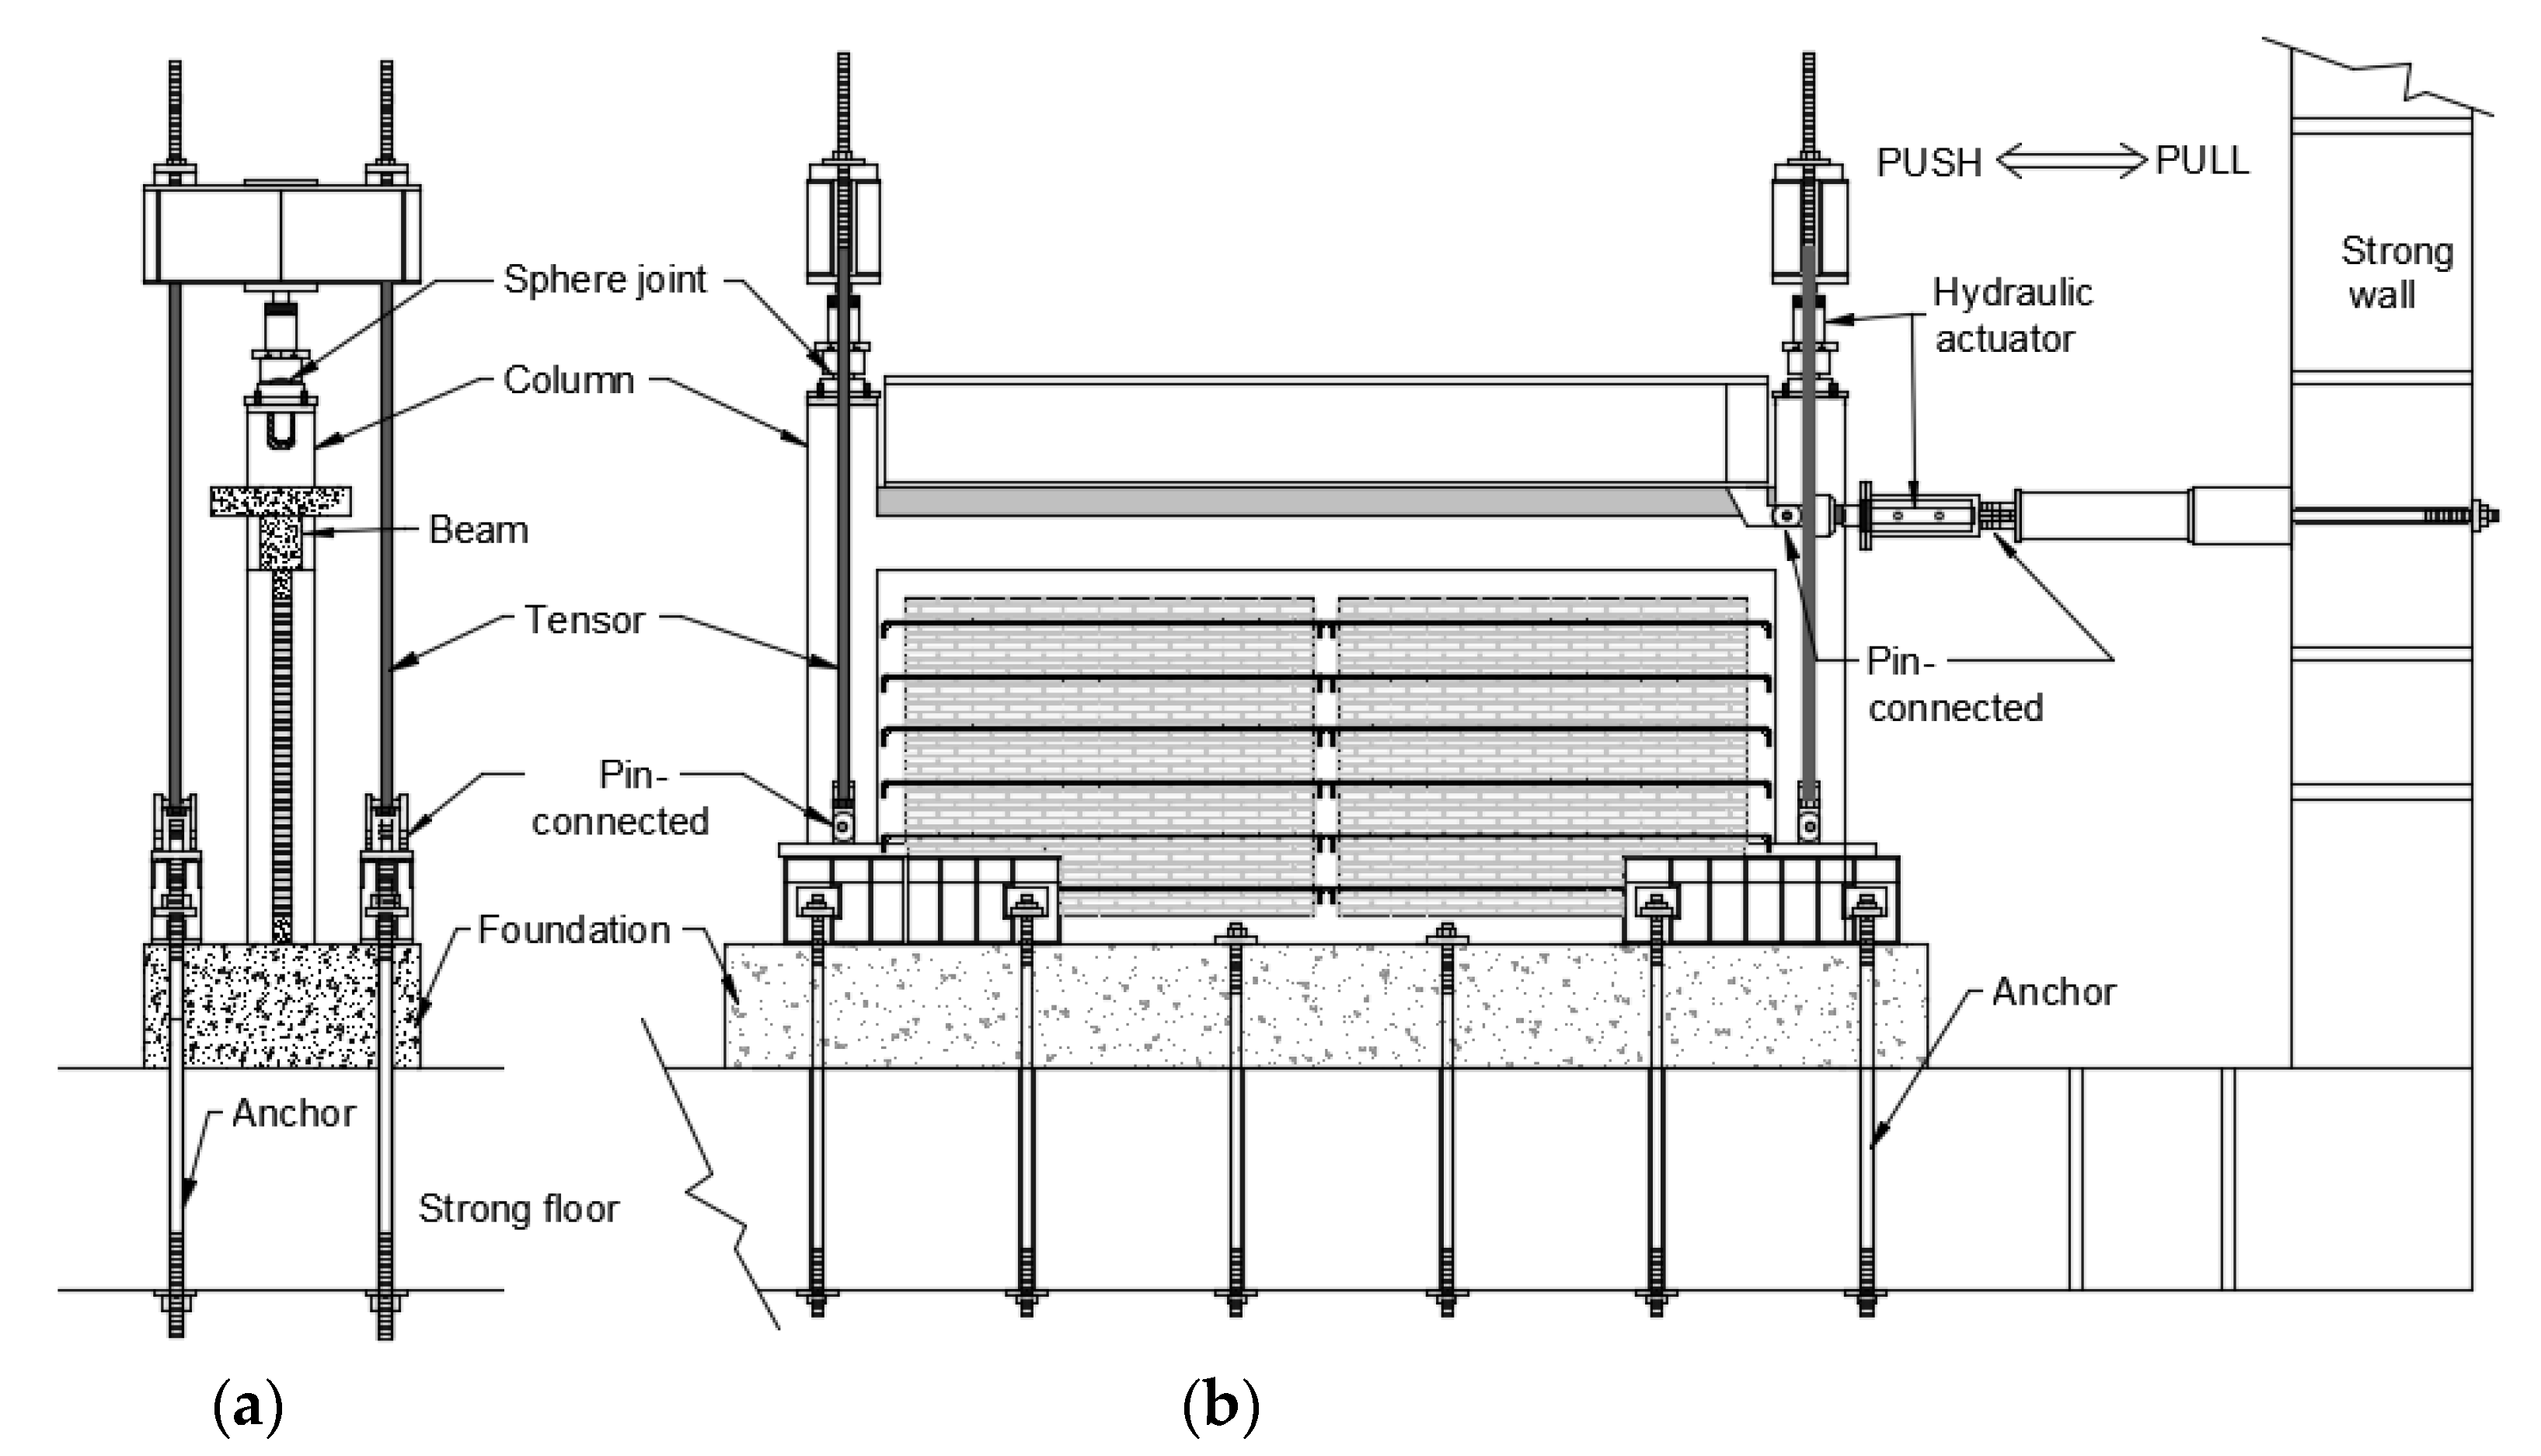
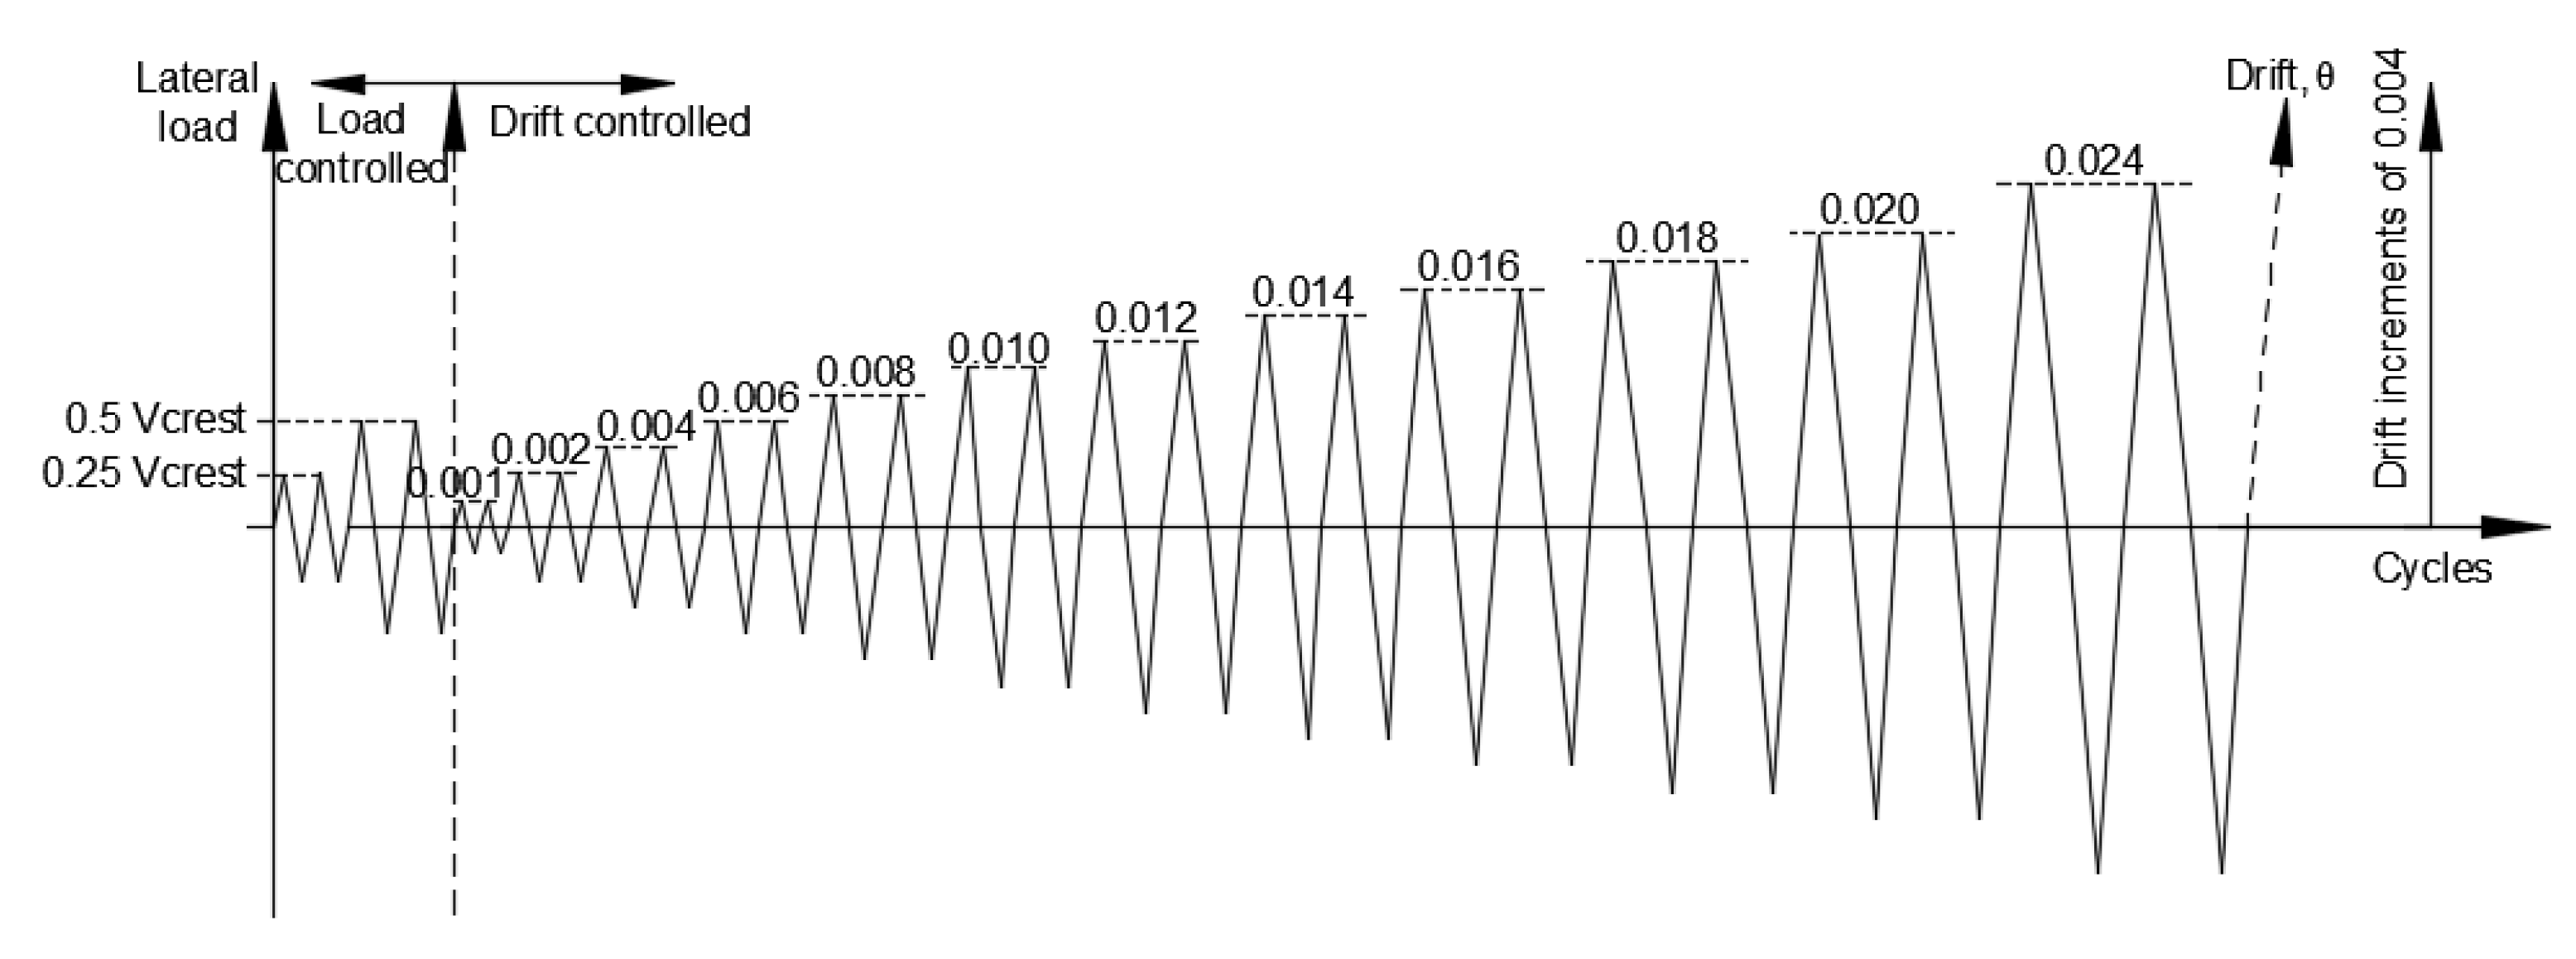
Figure 5 shows the test setup used to apply loads to the specimens. To simulate the gravity loads, vertical load was applied on the top of the columns. The vertical load was maintained constant during each test, equal to 120.17 kN, leading to a vertical stress on columns of 3.92 MPa. The specimens were subjected to cycles of quasi-statics alternated lateral load, simulating seismic action. The application of the lateral load followed the test procedure described in the Appendix A of Mexican code [2]. The first two cycles were load controlled up to 25% of the estimated cracking load, and the next two cycles up to 50% of the estimated cracking load. The estimated cracking lateral loads were 32.31 kN and 58.86 kN for specimens with H/L equal to 0.75 and 0.41, respectively. The sequence continued with displacement controlled cycles starting with deformations of 0.001 and 0.002. After that, drifts with increments of 0.002 were applied considering two cycles for each increment. When the specimen reached a deformation of 0.02, the drift increment changed to 0.004 (Figure 6).
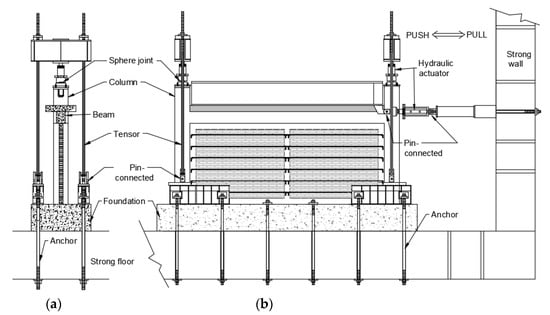
Figure 5.
Test setup. (a) transverse view, (b) elevation view.

Figure 6.
Lateral load sequence.
2.5. Instrumentation
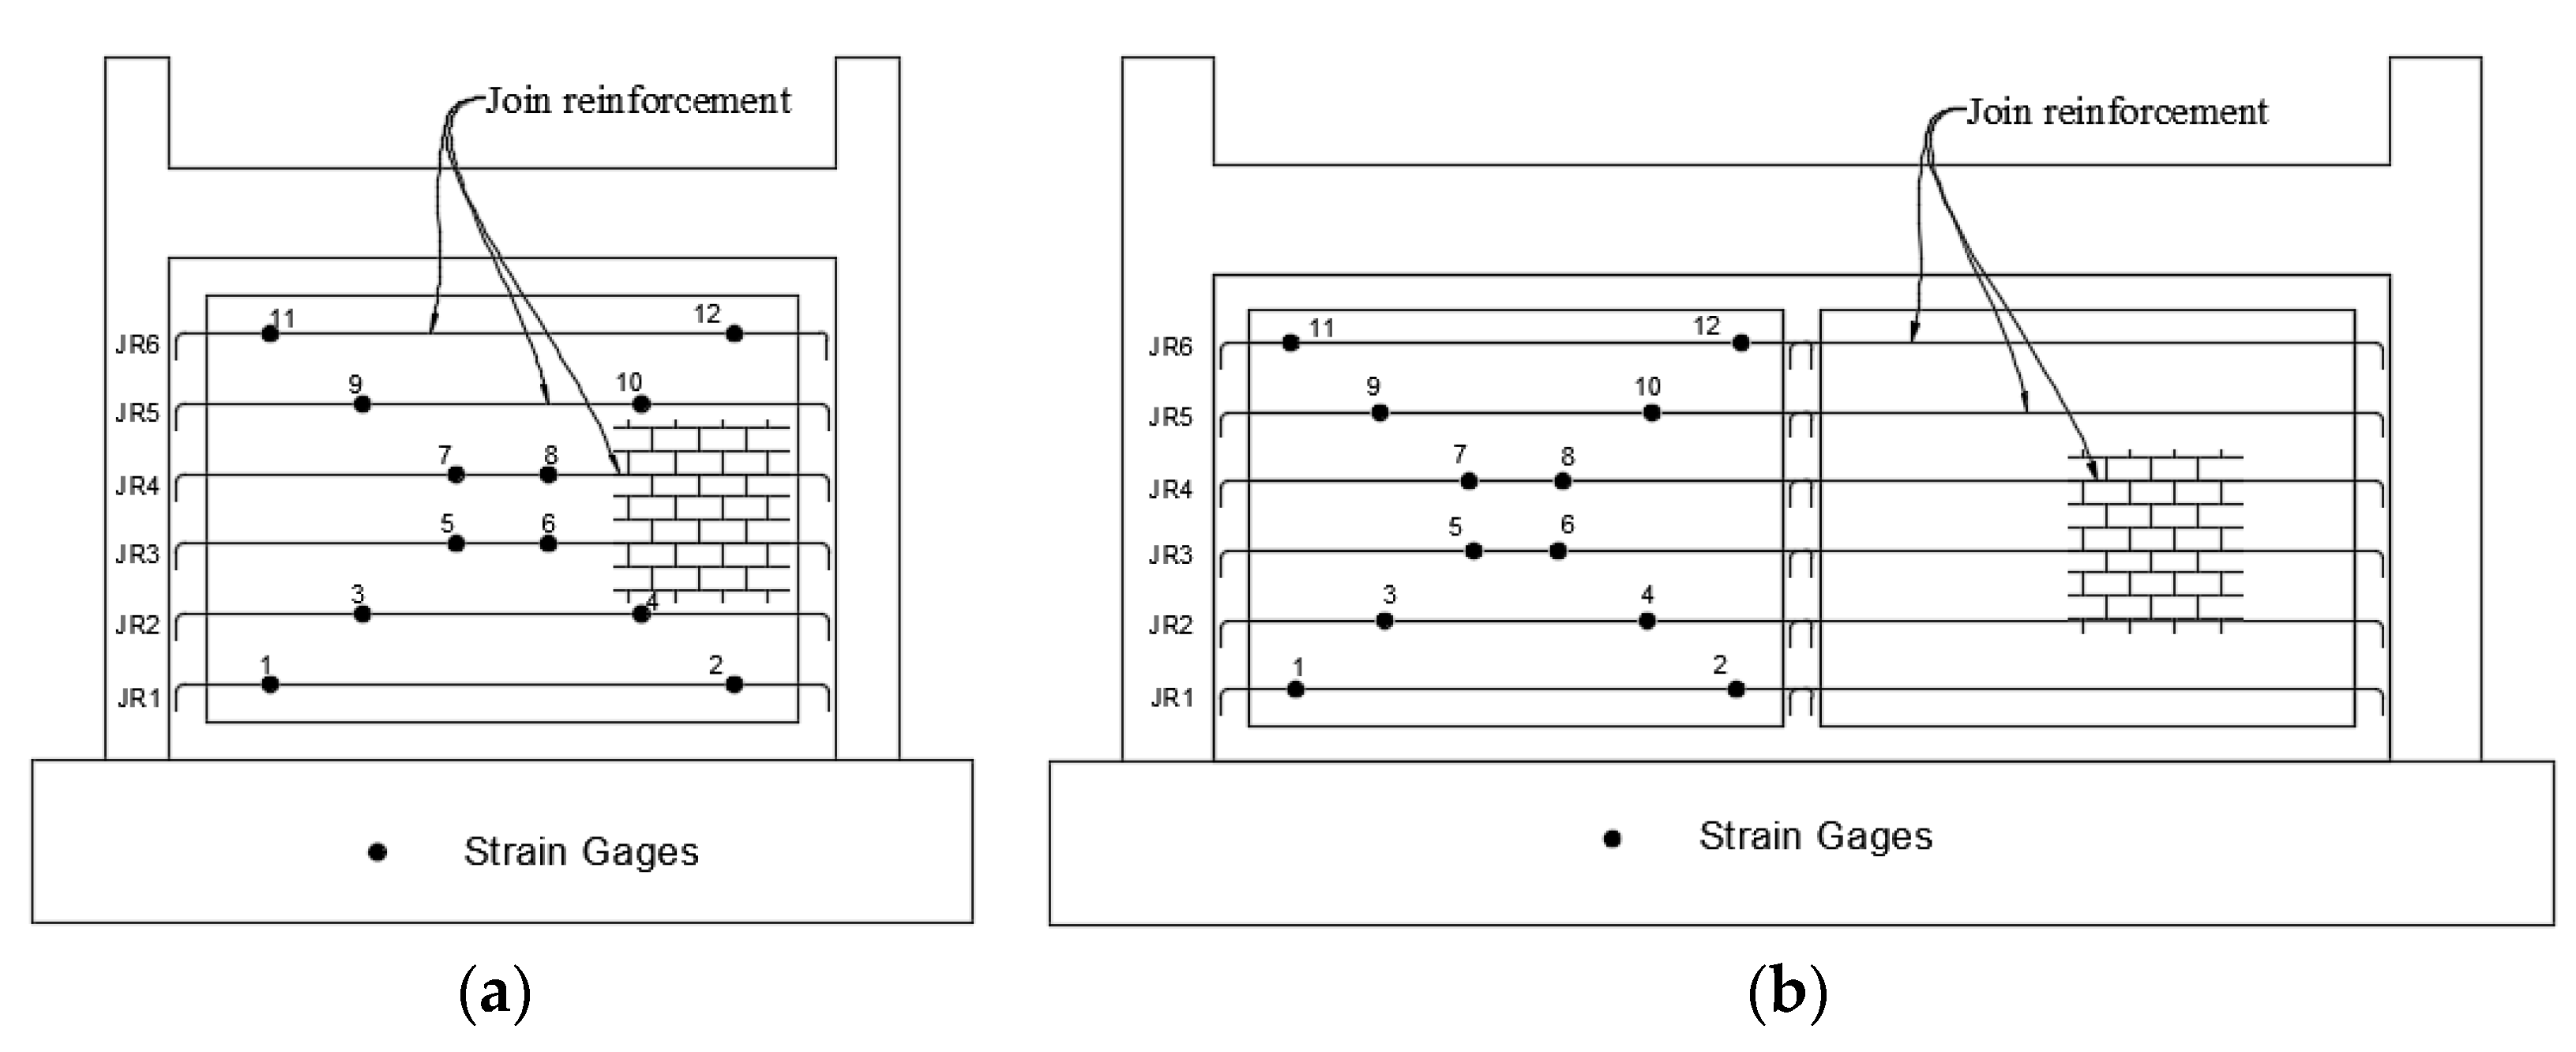
The applied loads and displacements in each specimen were measured during tests. Strain gauges were installed in the joint reinforcement, following a diagonal trajectory on the wall (Figure 7a). Due to the symmetry of the wall, for MD3NRH_L41, strain gauges were concentrated in one panel (Figure 7b).
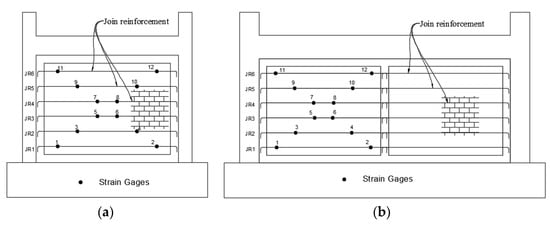
Figure 7.
Internal instrumentation. (a) specimens MD3NRH_L75, (b) specimens MD3NRH_L41.
3. Experimental Results
3.1. Hysteretic Curves and Crack Patterns
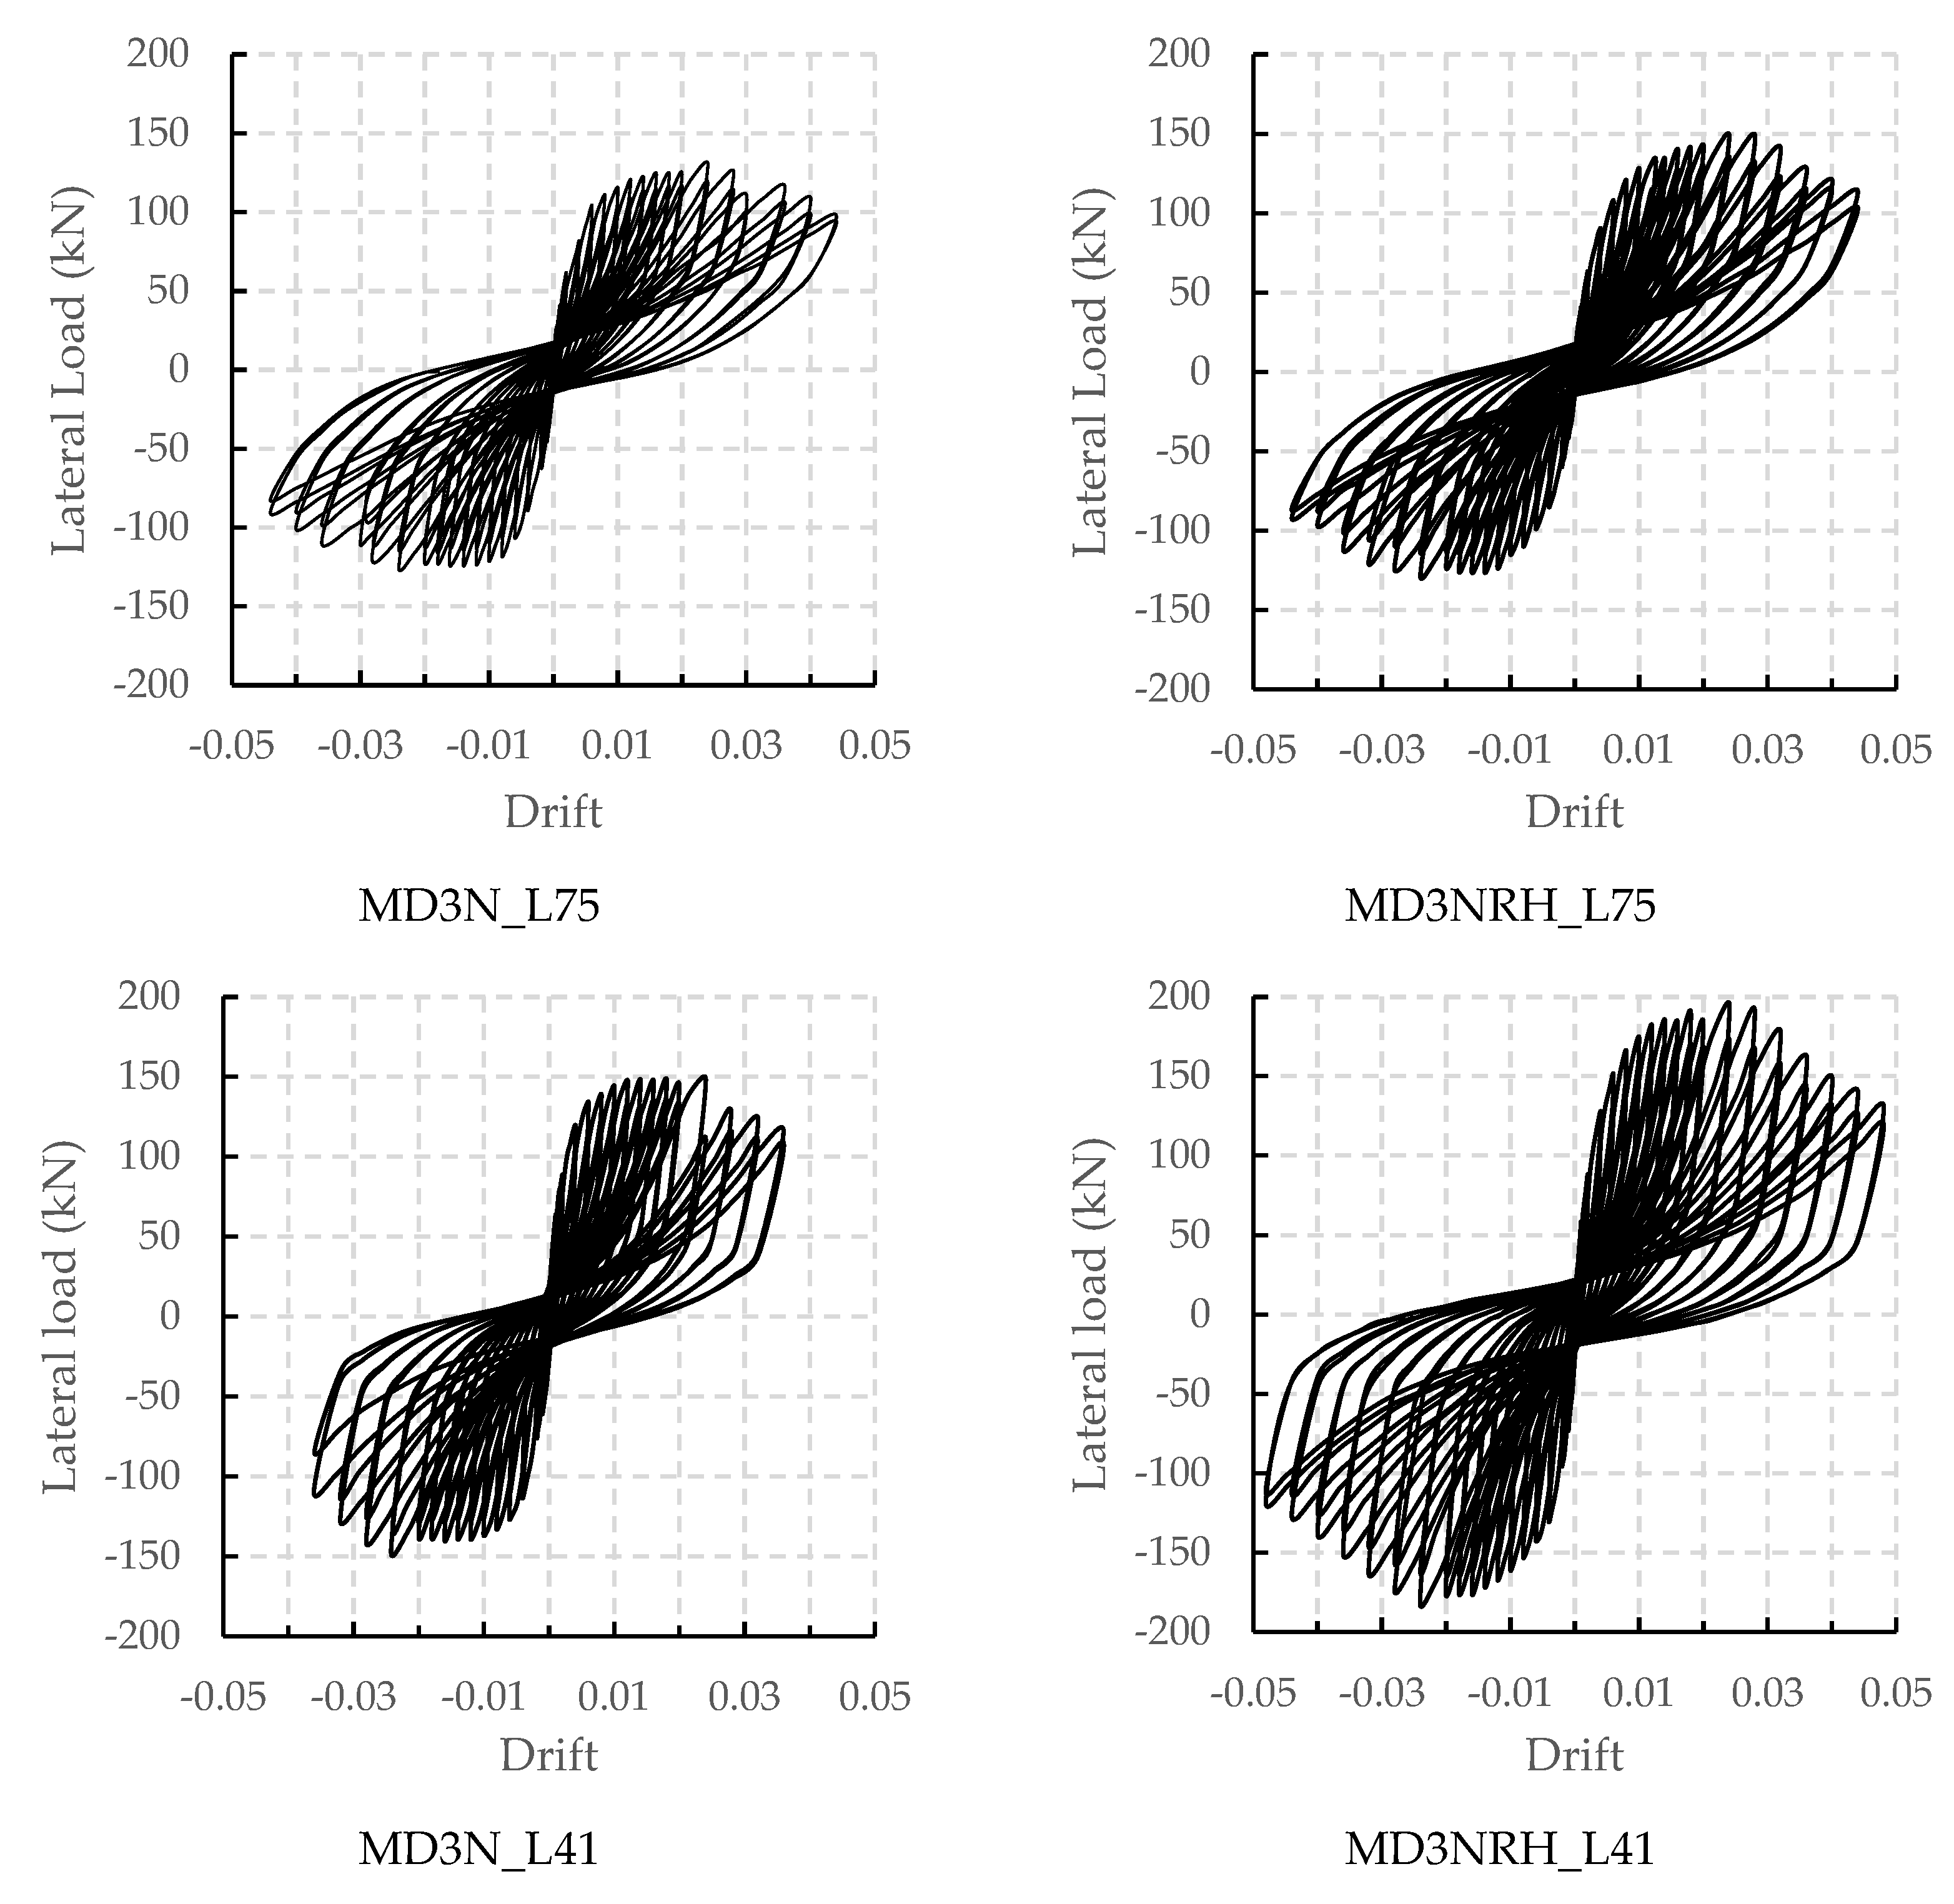
The lateral load–drift hysteretic curves of each specimen are presented in Figure 8. The drift is defined as the lateral displacement divided by the height of the wall. The final cracking patterns are shown in Figure 9. Both hysteretic curves and crack patterns evolution of each infill wall are described below. For a better understanding, it is important to note that positive lateral load occurred when the specimen was pulled towards the strong wall, and negative load occurred when the infill wall was pushed (Figure 5b).

Figure 8.
Lateral load–drift hysteretic curves.
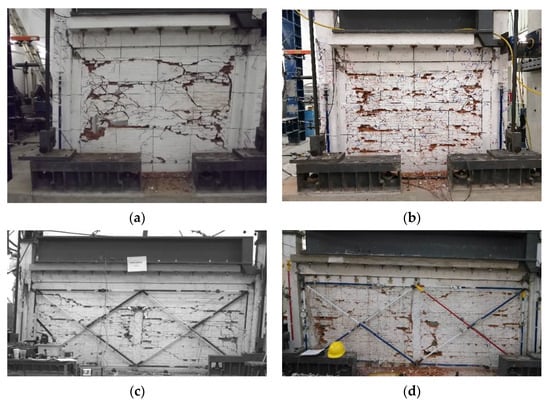
Figure 9.
Crack pattern. (a) MD3N_L75; (b) MD3NRH_L75; (c) MD3N_L41; (d) MD3NRH_L41.
In the case of the specimen MD3N_L75, the first diagonal cracking was registered in cycle 5 for a lateral load of 28.8 kN and a drift level of 0.0006. This crack started near the center top and descended towards the right tie-column with an angle of approximately 30 degrees from the horizontal (Figure 9a). In the same cycle, when the lateral load was negative, diagonal cracking occurred at the upper left corner of the wall. This second diagonal crack had a direction approximately orthogonal than the first one. The first cracking is usually associated with a change in the slope of the hysteretic curve; however, in these tests, the first cracking had no apparent effect on the load–drift curve. The first crack in the frame occurred in cycle 7 at the left end of the beam for 53.8 kN and 0.0016. When the lateral load acted upon the negative direction, the right end of the beam cracked. Cracking on the beam occurred when the wall and frame were in contact at that zone. In the same cycle, diagonal cracks forming an “X” at the central zone of the wall were registered. In cycle 9, corresponding to a lateral load of −88.8 kN and a drift of −0.0040, the first flexural crack appeared at the bottom of the right column. At the same time, a diagonal crack arose in the right beam–column connection. Change in the slope of the hysteretic curve (yielding) was reached at cycle 11 for a lateral load of 103.7 kN and a drift level of 0.0060. At this level of deformation, the damage of the specimen consisted of well-defined diagonal cracks on the infill wall, flexural cracks at both ends of beam and at the bottom of columns, and diagonal cracking at both beam–column connection. As the test progressed, some new diagonal cracks appeared in the wall and width of the old cracks increased significantly; new cracks at the beam did not appear; flexural cracking in the columns extended towards the center of the members; and damage at beam-column connections increased. The maximum strength of the specimen, 130.1 kN, was reached in cycle 27 for a drift of 0.0240. At this stage of the test, all the cracks on the specimen had already appeared, including crushing of the concrete at the bottom of the columns. In the descending part of the curve, the width of cracks increased and total separation of some portions of the wall occurred. Failure of the specimen occurred in cycle 37, reaching a lateral load of 97.1 kN and a drift of 0.0440.
The infill wall MD3NRH_L75 had the first diagonal cracks in cycle 5 for a lateral load of 31.5 kN and a drift of 0.0006. Unlike to MD3N_L75, the first cracking consisted of a set of three thin cracks distributed at the central zone of the wall. In this early stage of the test, new fine cracks appeared in each drift increment. Flexural cracking in the frame started in cycle 9 for 90.1 kN and 0.0040, located at the left end of the beam and the bottom of the left column. When lateral load acted in a negative direction, both beam and column cracked at the opposite zones. In cycle 11, corresponding to a lateral load of 107.5 kN and a drift of 0.0060, a vertical crack arose at the left bonding surface of beam–column, which represented the most significant damage in the frame at the last stage of the test. Yielding of the load–drift curve occurred in cycle 13 to a lateral load of 120.1 kN and a drift level of 0.0080. At this point, damage of the specimen consisted of distributed diagonal cracks on the infill wall, cracks at both ends of beam, flexural cracking at both ends of the columns and vertical cracks at both interphase beam–column surface. From yielding to maximum strength (cycle 27, 148.3 kN and 0.0240), flexural cracking in the columns extended towards the central zone, diagonal cracks at beam-column connections appeared on both directions forming an “X” and crushing of masonry occurred on dispersed zones of the wall. In the last stage of the test, which is characterized by the descending part of the hysteric curve, the vertical crack at interphases beam–column surface increased in width significantly, detachment of a portion of the left column occurred due to the diagonal cracking on beam–column connection and crushing on the infill wall was widespread (Figure 9b). Failure occurred in cycle 37, reaching a lateral load of 113.1 kN and a drift of 0.0440.
The first diagonal crack on specimen MD3N_L41 occurred at cycle 5 for 47.8 kN and 0.0006. It developed on the central zone of the left masonry panel. When lateral load changed direction ( −49.9 kN and −0.0006), a second diagonal crack appeared in the right panel. These two cracks did not cross each other. In the same cycle, a vertical crack between masonry and the right tie-column occurred. Cracking in the frame started in cycle 7 for a lateral load of 66.4 kN and a drift of 0.0012, located at the left end of the beam. In the same cycle, when load was negative, cracking appeared in the opposite end of the beam. Flexural cracks at the bottom of the left column appeared in cycle 9, corresponding to 119.4 kN and 0.0040. Additionally, other damages in the specimen consisted of new diagonal cracking in the wall, the previous diagonal cracks widened and their length increased towards the opposite panel, so they crossed each other and the cracks in the beam extended about 500 mm from the ends. In this point of the test, yielding of the hysteretic curve can be observed. Diagonal cracking at left beam–column connection was registered in cycle 11 for 133.7 kN and 0.0060. However, in cycle 16 ( 0.010), a shear cracking appeared near the upper part of the column, which absorbed the deformation of the frame in the last stage of the test. Flexural cracking on beam and columns extended towards the center of the members as the tests progressed. Unlike specimens with H/L = 0.75, the MD3N_L41 developed cracking along the complete beam. From yield point onward, a combination of inclined cracks and horizontal sliding developed on the wall. As the tests continued, horizontal sliding was predominant, meaning that few additional inclined cracks developed. The maximum strength, 148.2 kN, was reached in cycle 27 for a drift of 0.0240. At this point of the test, shear failure of the central tie-column occurred. The descending part of the curve was characterized by a combination of sliding and well-defined diagonal cracks in the wall, while in the frame, a shear damage produced failure of the left column (Figure 9c). In cycle 33, failure was registered. This cycle reached a lateral load of 115.6 kN and a drift of 0.0360.
For the specimen MD3NRH_L41, it was difficult to detect the first diagonal cracking on the wall. In cycle 6 for −39.2 kN and −0.0006, three thin cracks appeared on units located at the central zone of the right panel. However, apparently they were not connected. Two cracks with more defined diagonal trajectories appeared in cycle 7 ( 68.6 kN and 0.0014), although they had a small width and were distributed in both masonry panels. The first crack in the frame, located at the right end of the beam, occurred in cycle 7 for −80.9 kN and −0.0014. Change in the slope of the hysteretic curve (yielding) was defined at cycle 11 for a lateral load of 150.9 kN and a drift of 0.0060. Unlike specimen MD3N_L41, at this point of the test, diagonal cracking on the infill wall were of smaller width and distributed around the wall, and flexural cracks on the columns had not appeared yet. In cycle 13, for a lateral load of 165.2 kN and 0.0080, the first flexural crack at the bottom of the left column was registered. In the same cycle, when lateral load was −152.6 kN and drift −0.0080, a diagonal cracking at right beam–column connection occurred. As the test progressed, damage on the wall consisted of new thin diagonal cracks distributed in the panel. It was observed that the previous diagonal cracks did not increase in width. Sliding on bed-joints occurred approximately every six courses, which did not coincide with the courses where the horizontal reinforcement was placed and crushing of masonry developed on dispersed zones of the wall. Damage on the frame consisted of cracking at the ends of the beam located at an approximate length of 700 mm, flexural cracking extended towards the center of the columns and diagonal cracks at the beam–column connections increased. The maximum strength, 194.0 kN, was reached in cycle 27 for a drift of 0.0240. In the descending part of the hysteretic curve, crushing and sliding on the wall were predominant, while in the frame, crushing at the ends of the beam and diagonal cracking at the beam–column connection occurred when its zone was in contact with the wall (Figure 9d). Failure occurred in cycle 35, for a lateral load of 147.3 kN and a drift of 0.040.
In all cases, separation between the wall and the frame occurred early through cracks in the interface of these elements. This fact is due to the natural construction sequence of the system, in which the infill wall is built after the frame producing a cold joint between them. To avoid this early separation, integral infilled frames can be considered, where wall–frame separation is expected for lateral loads higher than 50% of the ultimate strength [16]. As the test progressed, separation between the wall and the column increased significantly, reaching a maximum of 18 mm. According to the lateral load, a diagonal strut developed, while separation of the wall and frame occurred at the opposite corners.
The hysteretic behavior of the specimens is investigated through the residual drift () after unloading in each cycle and the reloading/loading ratio () of two repeated cycles. Table 3 shows values for and corresponding to the cycles of first diagonal cracking, peak strength and failure.
Table 3.
Residual drift after unloading and reloading/loading ratio.
The joint reinforcement significantly reduced the residual drift at peak strength, reductions of 15.6% and 22% were observed for H/L = 0.75 and H/L = 0.41, respectively. In the walls with H/L = 0.41, the repeat cycle at peak strength reduced significantly less in the case with reinforcement (17.9% less).
The effect of aspect ratio was much more important. Walls with H/L = 0.41 had more than twice the residual drift after cracking than walls with H/L = 0.75 (2.19 without reinforcement and 2.16 with reinforcement). At peak strength, the residual drift was also significantly larger. The residual drift in walls with H/L = 0.41 compared to those with H/L = 0.75 was 1.42 and 1.31 times larger for the cases without and with reinforcement, respectively.
3.2. Envelope Curves
For each specimen, the envelope curve was obtained connecting the peak points of the hysteretic cycles. In Figure 10, the envelope curve corresponding to specimen MD3N_L75 is presented. The global behavior of the walls is described by four critical events, which are included in the envelope curves: first cracking (, ), yielding strength (, ), peak strength (, ) and failure (, ). In addition, the equivalent elastoplastic model is included in this figure, which was determined according with the procedure described by the Mexican code [2], similar to the one established in ASCE-SEI 41-13 [25], without considering hardening or strength degradation. The equivalent model has the same area under the curve as the experimental envelope and its first branch intersects the experimental envelope at 0.6, where is the resistance of the elastoplastic model.
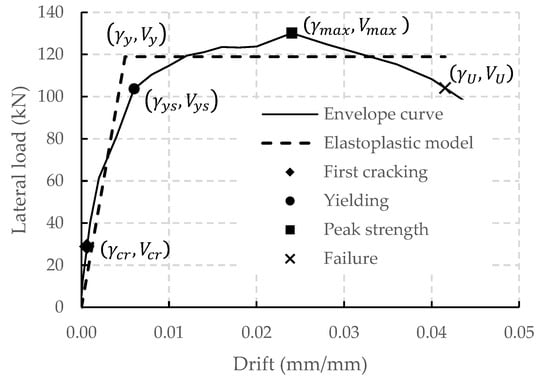
Figure 10.
Envelope curve and critical points.
3.2.1. Cracking Strength
The joint reinforcement did not have a significant effect on the cracking strength. Such an effect varies from one model to another. For the first pair (MD3N_L75 and MD3NRH_L75), the cracking strength of specimen with reinforced joints was 1.09 times that of the specimen without reinforcement. For the second pair (MD3N_L41 and MD3NRH_L41), the corresponding value was 0.89. Hence, on average, the specimens with steel bars in bed-joints had a value of equal to 0.99 times that of the non-reinforced specimen (Table 4). These results are consistent with those presented by Leal el at. [3] for infilled frames with larger size columns (denominated as MD6N and MD6NRH). The specimen with joint reinforcement had a cracking strength of 0.99 times that of the specimen without reinforcement.
Table 4.
Shear strength for the critical points of the envelope and elastoplastic model.
3.2.2. Yielding Strength
In each pair, the yielding strength of the specimen with joint reinforcement was larger than that of specimen without reinforcement. The most significant increase was found for the pair with H/L = 0.41, which was 26.4%; for the pair with H/L = 0.75, it was 15.8% (Table 4). Similarly, for the specimens with larger size columns (MD6N and MD6NRH), reported by Leal et al. [3], the joint reinforcement increased the yielding strength (10.0% increase).
Yielding of the load–drift curve did not occur when the first diagonal cracking was detected. Yielding strength was, on average, 2.79 times that of the cracking strength. The use of steel bars in bed-joints significantly affect the quotient . Pairwise comparison shows that the infill wall with joint reinforcement had, on average, a value of this quotient 19.5% larger than that of the non-reinforced specimen. However, this increase was not consistent. For the first pair, the effect of joint reinforcement was unimportant (only 5.8% increase); for the second pair, horizontal reinforcement had a strong impact (41.8% increase). In the case of specimens with larger size columns presented by Leal et al. [3], the joint reinforcement increased 11.1% the value of this quotient.
3.2.3. Peak Strength
In general, the use of horizontal reinforcement increased the maximum strength of the infill wall (Table 4). The specimen MD3NRH_L75 had a value of 14% larger than that of MD3N_L75; for the wall MD3NRH_L41, was substantially larger than for MD3N_L41, with a 30.9% increase. However, for specimens with larger size columns (MD6N and MD6NRH) reported in the literature [3], the joint reinforcement had no effect on the maximum strength.
In all cases, the lateral load continued increasing after achieving yielding strength, although at a rate substantially lower. On average, the maximum strength was 1.25 times that of the yielding strength. However, neither the joint reinforcement nor the aspect ratio had a significant effect on the quotient . For the first pair of specimens, the wall with reinforced bed-joints had a value of 1.6% smaller than the non-reinforced wall; for the second pair, the quotient was 3.6% larger. In the case of specimens with larger size columns presented by Leal et al. [3], the joint reinforcement decreased 8.5% the value of this quotient.
3.2.4. Failure
The ultimate strength of each specimen corresponds to 0.8 . Consequently, in each pair of specimens, the joint reinforcement contributed to the ultimate strength on the same level than it increased the maximum strength.
3.2.5. Displacement Capacity and Ductility
The displacement capacity of each specimen was evaluated through the drift at failure (Table 5). For the specimens with H/L = 0.41, the joint reinforcement had a slight effect on the displacement capacity (10% increase). In the case of infill walls with H/L = 0.75, the use of steel bars in the bed-joint was not significant on this parameter.
Table 5.
Drift at critical points and ductility.
The ductility developed by each specimen at peak strength () and at failure () was calculated as the ratio of the corresponding drift to that reached at the yield point of the elastoplastic model (). Ductility at peak strength had an average value of 5.48 and at failure it was 8.61 (Table 5).
In both pairs of specimens, the joint reinforcement consistently decreased the value of and . The quotients of ductility of specimens MD3N_L75 and MD3NRH_L75 at peak strength and at failure were 0.88 and 0.86, respectively; while for MD3N_L41 and MD3NRH_L41, the quotients were 0.60 and 0.66, respectively. The reason for this is that the specimen with joint reinforcement had a value for significantly larger than that of the unreinforced specimen.
3.3. Contribution of Joint Reinforcement and Infilled Frame to Lateral Load
It is considered that the applied lateral load () to the specimen is resisted by the joint reinforcement and the infilled frame. The contributions of each component are presented below.
3.3.1. Contribution of the Joint Reinforcement
As an indicator of the contribution of the joint reinforcement to the shear strength, the sum of the forces developed in the steel bars () was calculated. In a given course, the force in the rebar is obtained by multiplying the maximum calculated stress by the rebar area. The maximum stress is calculated from strain gauges installed in the joint reinforcement. To convert the measured strain by strain gauges to stresses, the average stress–strain curve of the joint reinforcement (Figure 4b) and the deformation history of each rebar were considered. For this purpose, the constitutive model of one-dimensional rate-independent plasticity was used, which is described in detail by Simo and Hughes [26]. In the case of MD3NRH_L41, only a panel was instrumented (Figure 7b). The total force in the joint reinforcement was obtained as the force in the instrumented panel multiplied by 2.
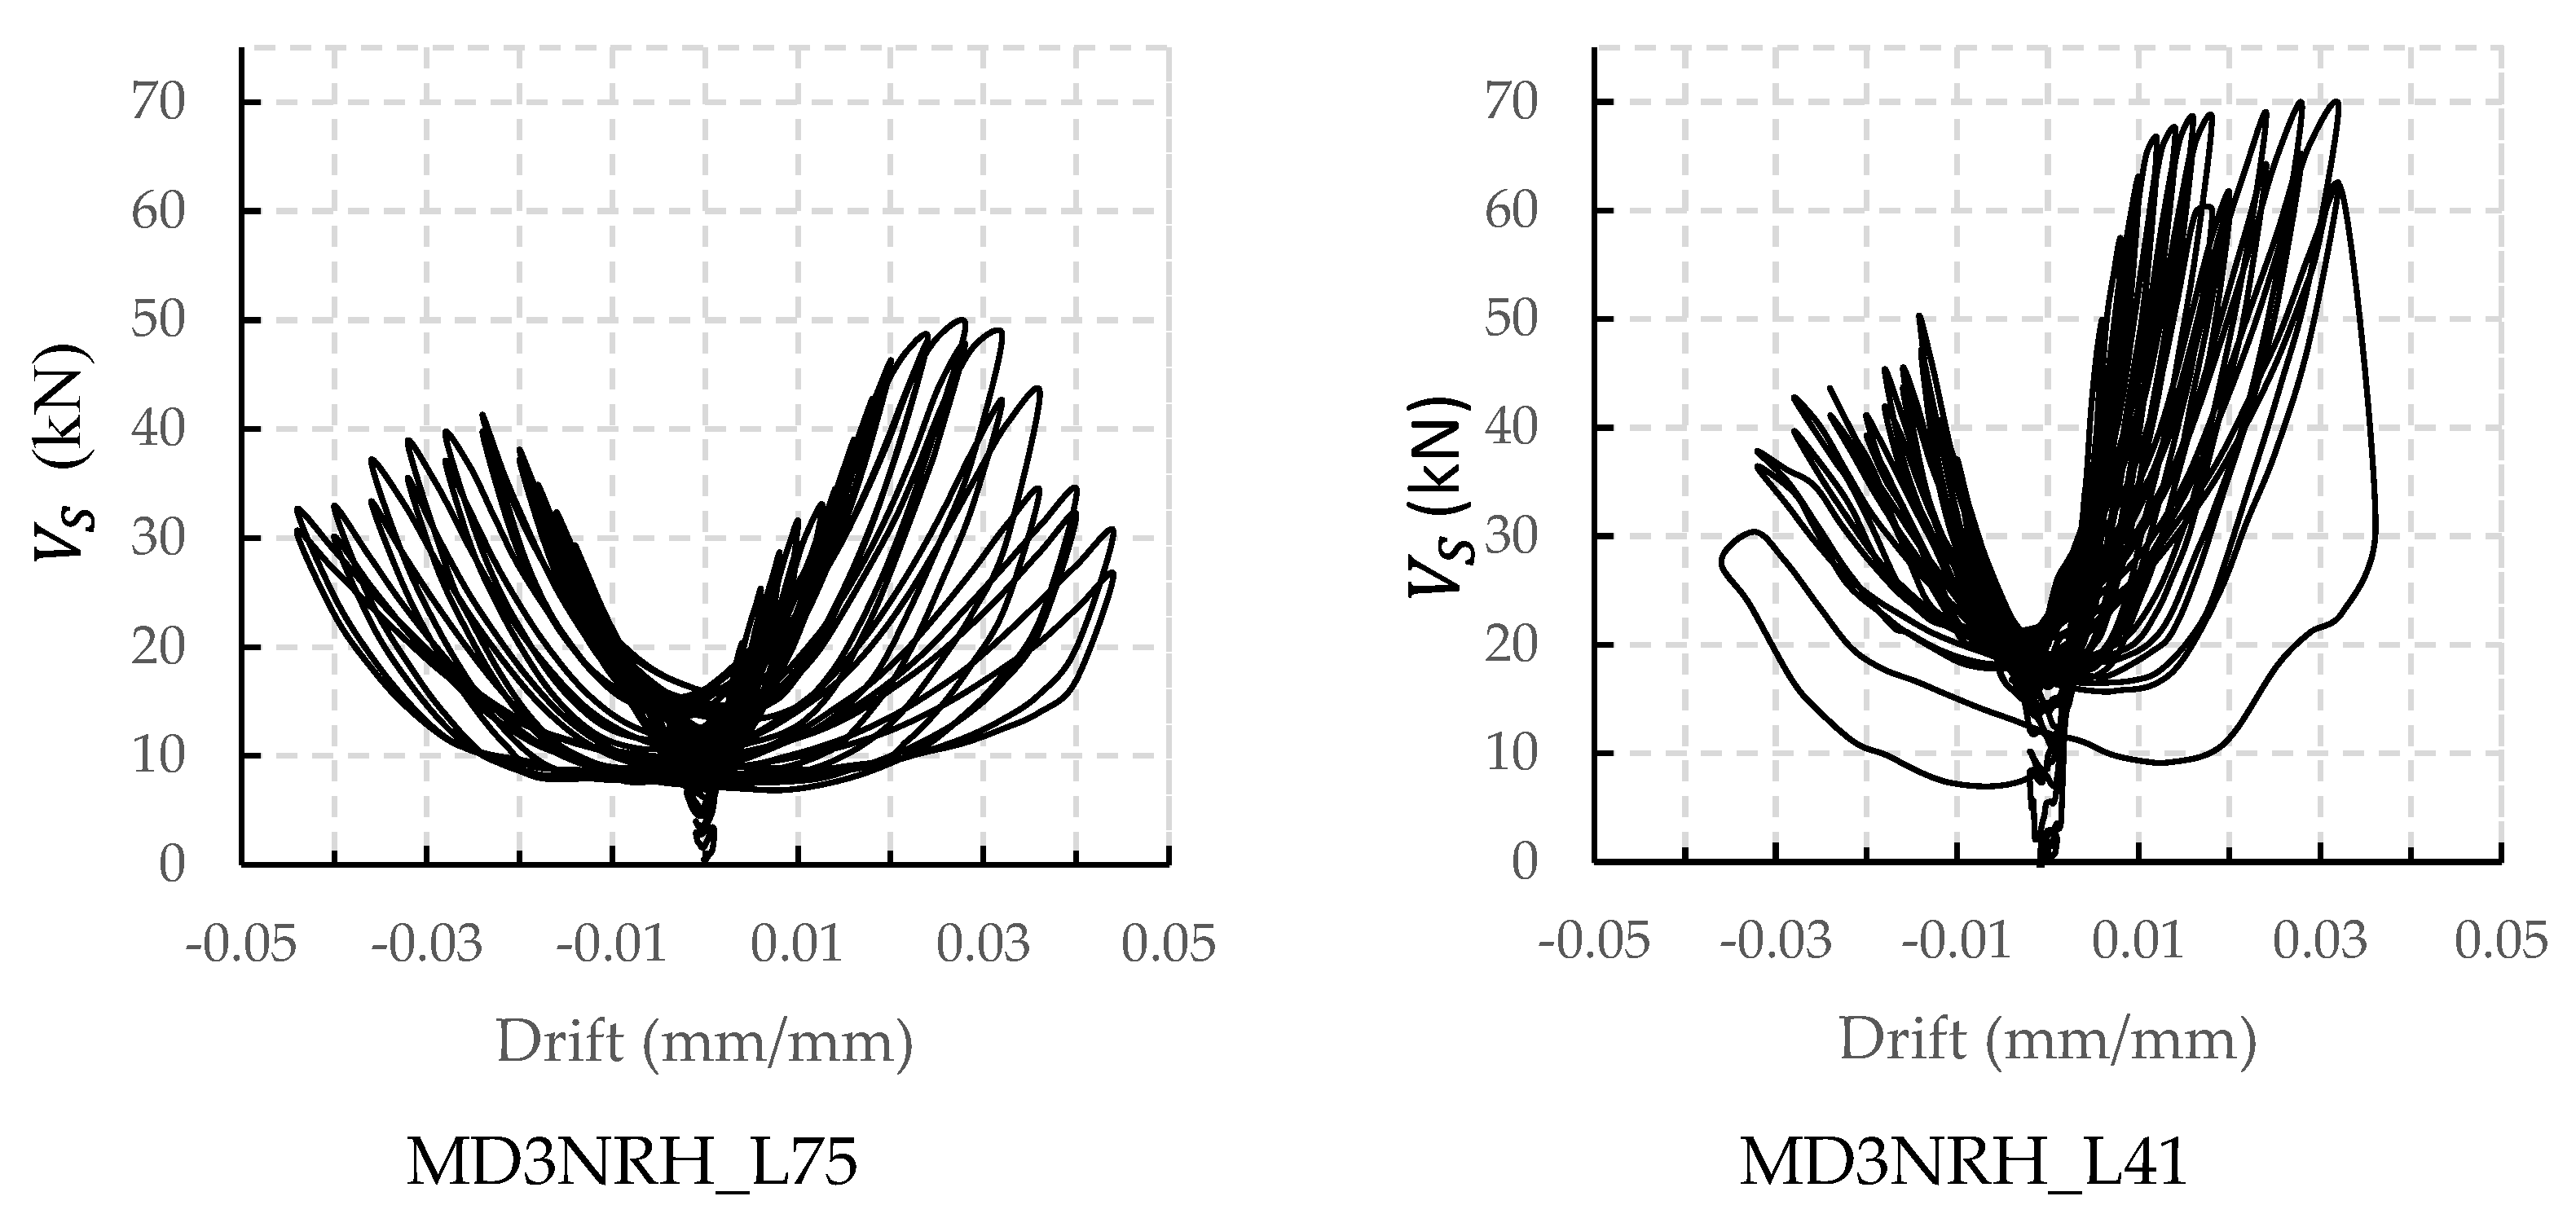
The variation of with drift for each specimen with joint reinforcement is shown in Figure 11. In both cases, it was observed that in the first stage of the test, the total force in the rebars was negligible and the shape of the cycle was undefined. It was until the first inclined cracking that the value of increased significantly and from the next cycle the loops adopted their typical asymmetric “U” shape. The shape of the cycles shows that the horizontal reinforcement works in tension during the test and the force in it is larger when drift is positive. Good repeatability of the cycles is observed until the maximum value for is reached, which indicates that cycles were stable.

Figure 11.
Contribution of joint reinforcement ()—drift curves.
For the specimen MD3NRH_L75, the maximum force in the joint reinforcement of 49.5 kN was registered in cycle 29 for a lateral load of 147.6 kN and a drift of 0.028. The descending part of the curve was stable, judging by the repeatability of the cycles.
The largest force in the joint reinforcement was found for the specimen MD3NRH_L41. The maximum value for 69.6 kN was registered in the cycle 29 for a lateral load of 190.3 kN and a drift of 0.028. In the next drift increment ( 0.032), practically kept its maximum value, reaching a value equal to 69.4 kN. However, in the cycle 33 corresponding to a maximum drift of 0.036, decreased suddenly its value from 61.6 kN to 30.8 kN. After this cycle the strain gauges measurements were significantly smaller and unstable, so the curve was cut at this point. A reduction in the maximum value of is observed to a drift equal to 0.02. This fact is consistent with the decrease of the lateral load observed in the hysteretic curve (Figure 8) for the same drift.
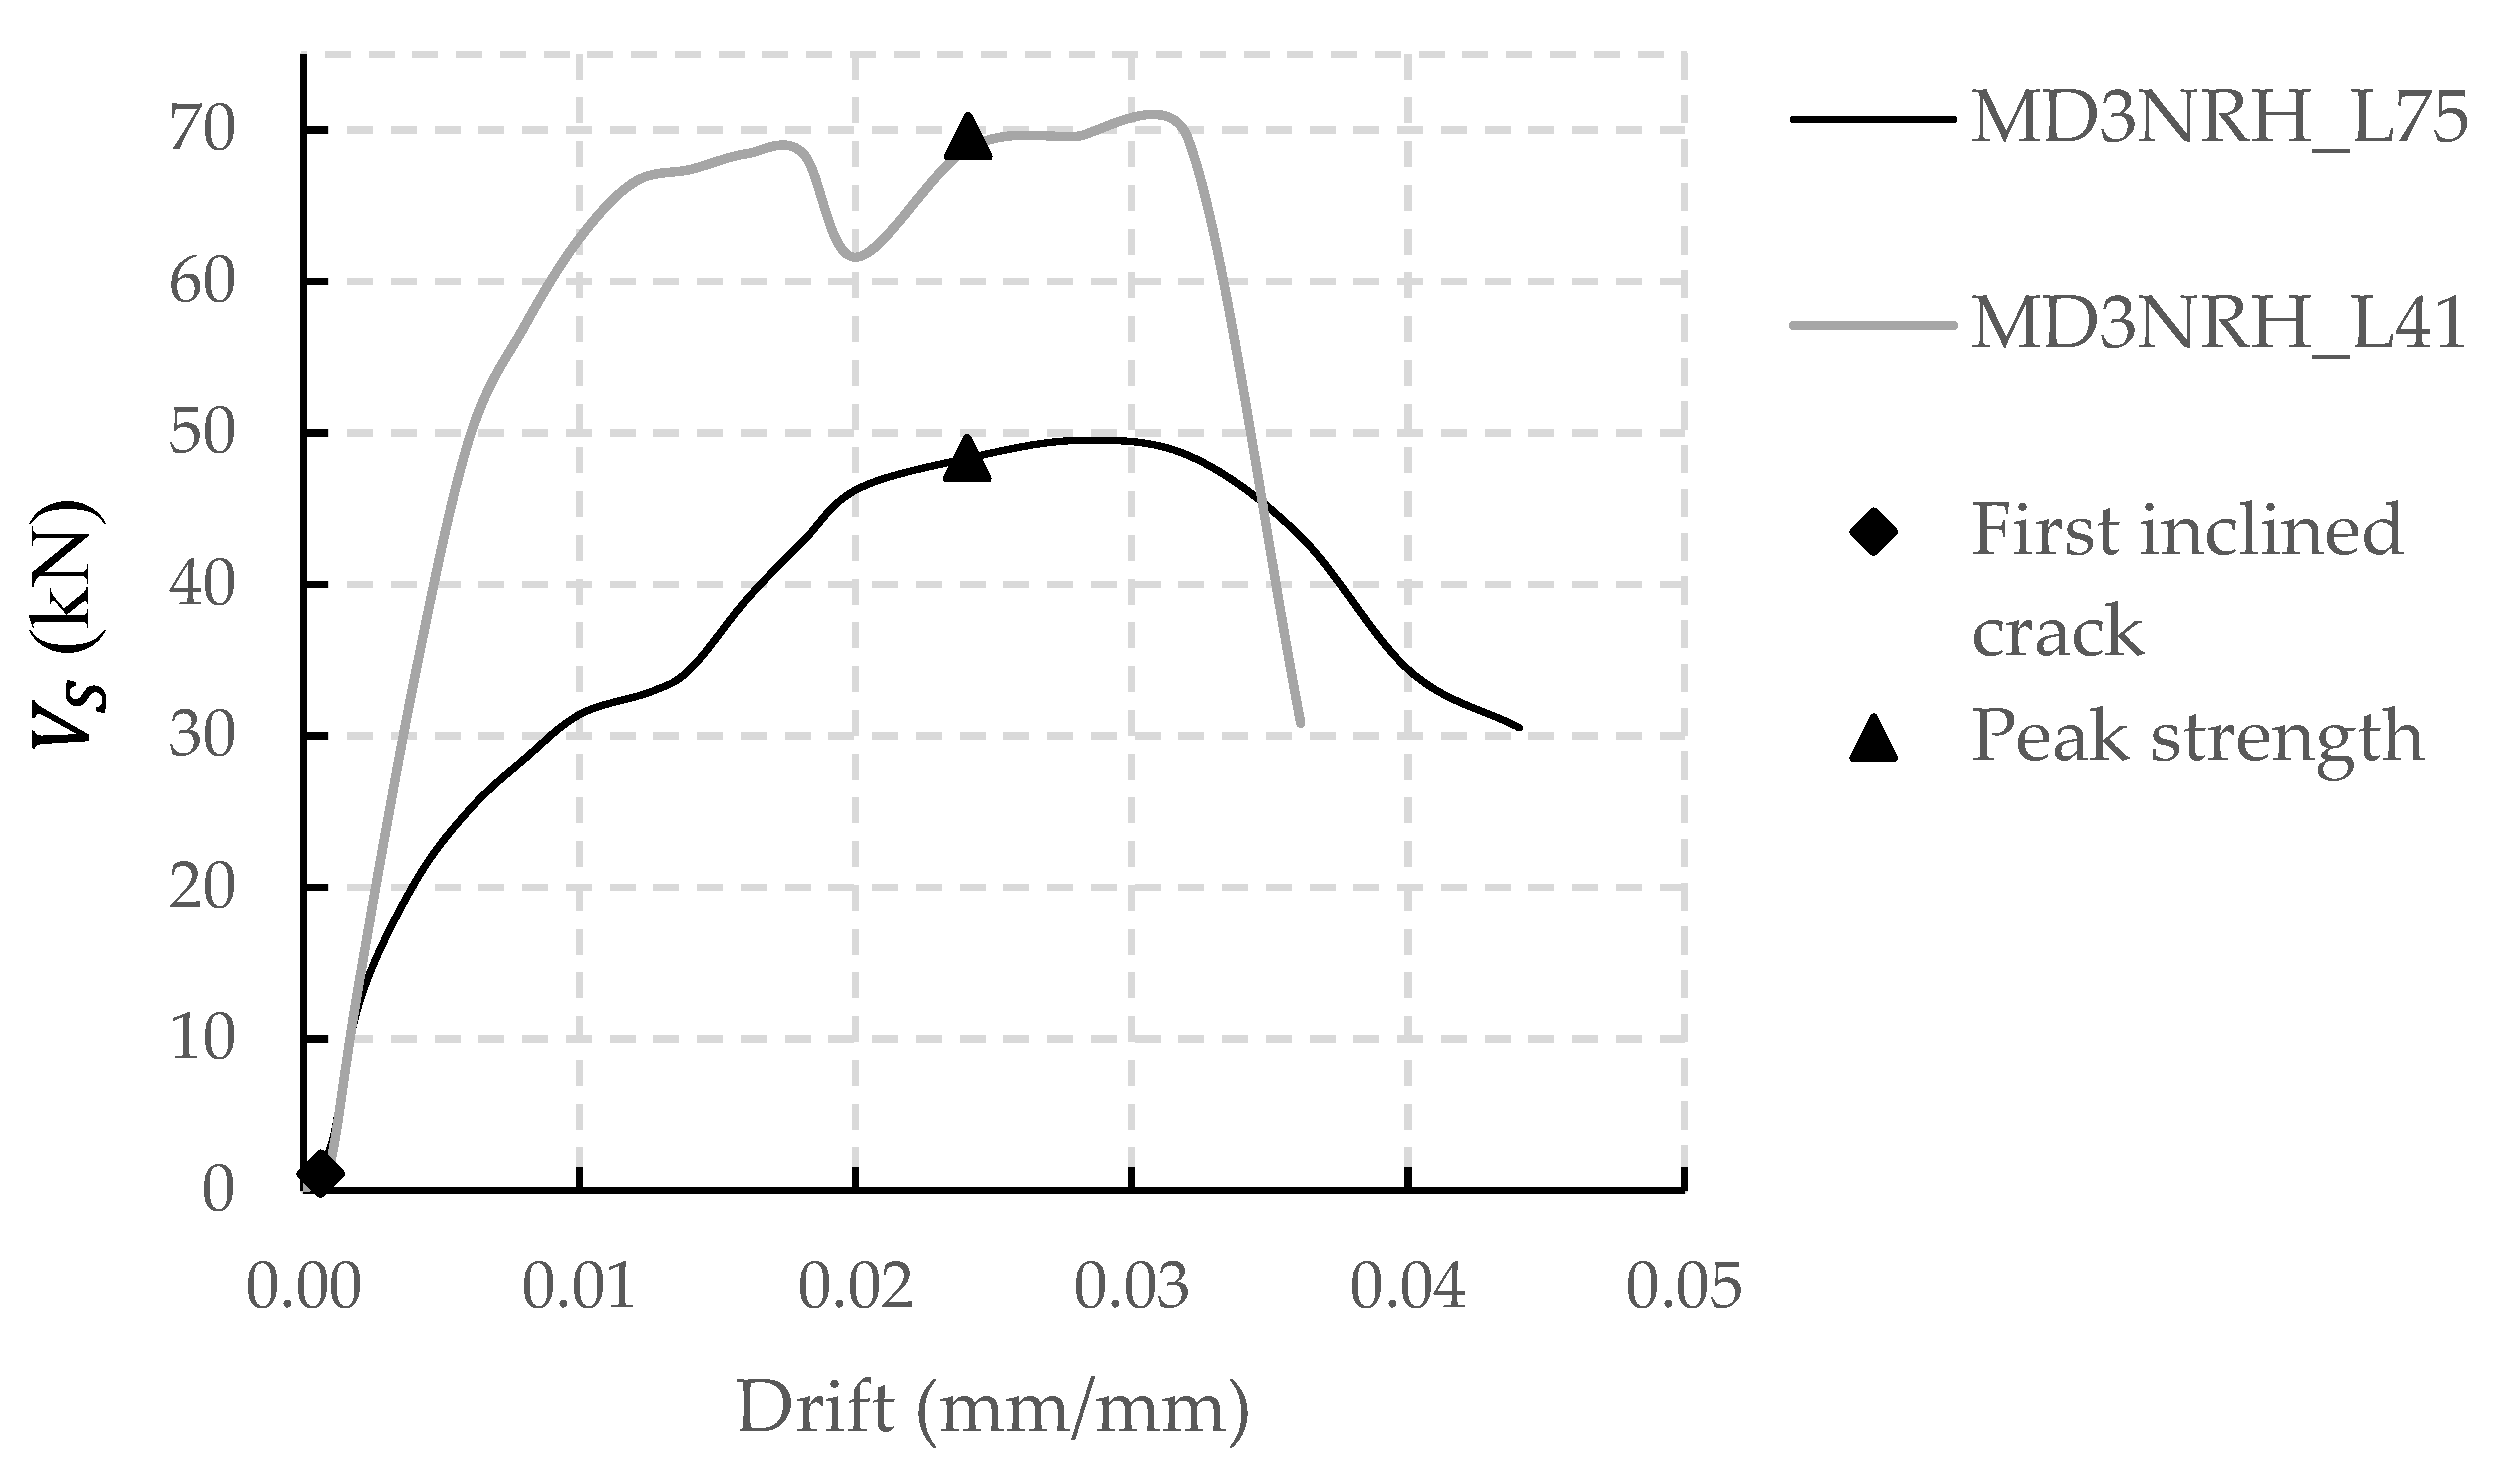
Figure 12 shows the contribution of joint reinforcement versus drift for each reinforced specimen. Similar to the envelope curve, this one connects the positive peak points of the cycles plotted in Figure 11. In addition, the values of at first cracking () and at peak strength () are indicated.

Figure 12.
Contribution of joint reinforcement.
Consistently, it is observed that the force contributed by joint reinforcement is negligible before first cracking (); after that, increases with drift until maximum force is reached. In both cases (MD3NRH_L75 and MD3NRH_L41), the maximum contribution of the joint reinforcement was reached for a larger drift than , although the value of corresponding to drift at maximum strength was very close to (98% on average).
3.3.2. Contribution of Infilled Frame
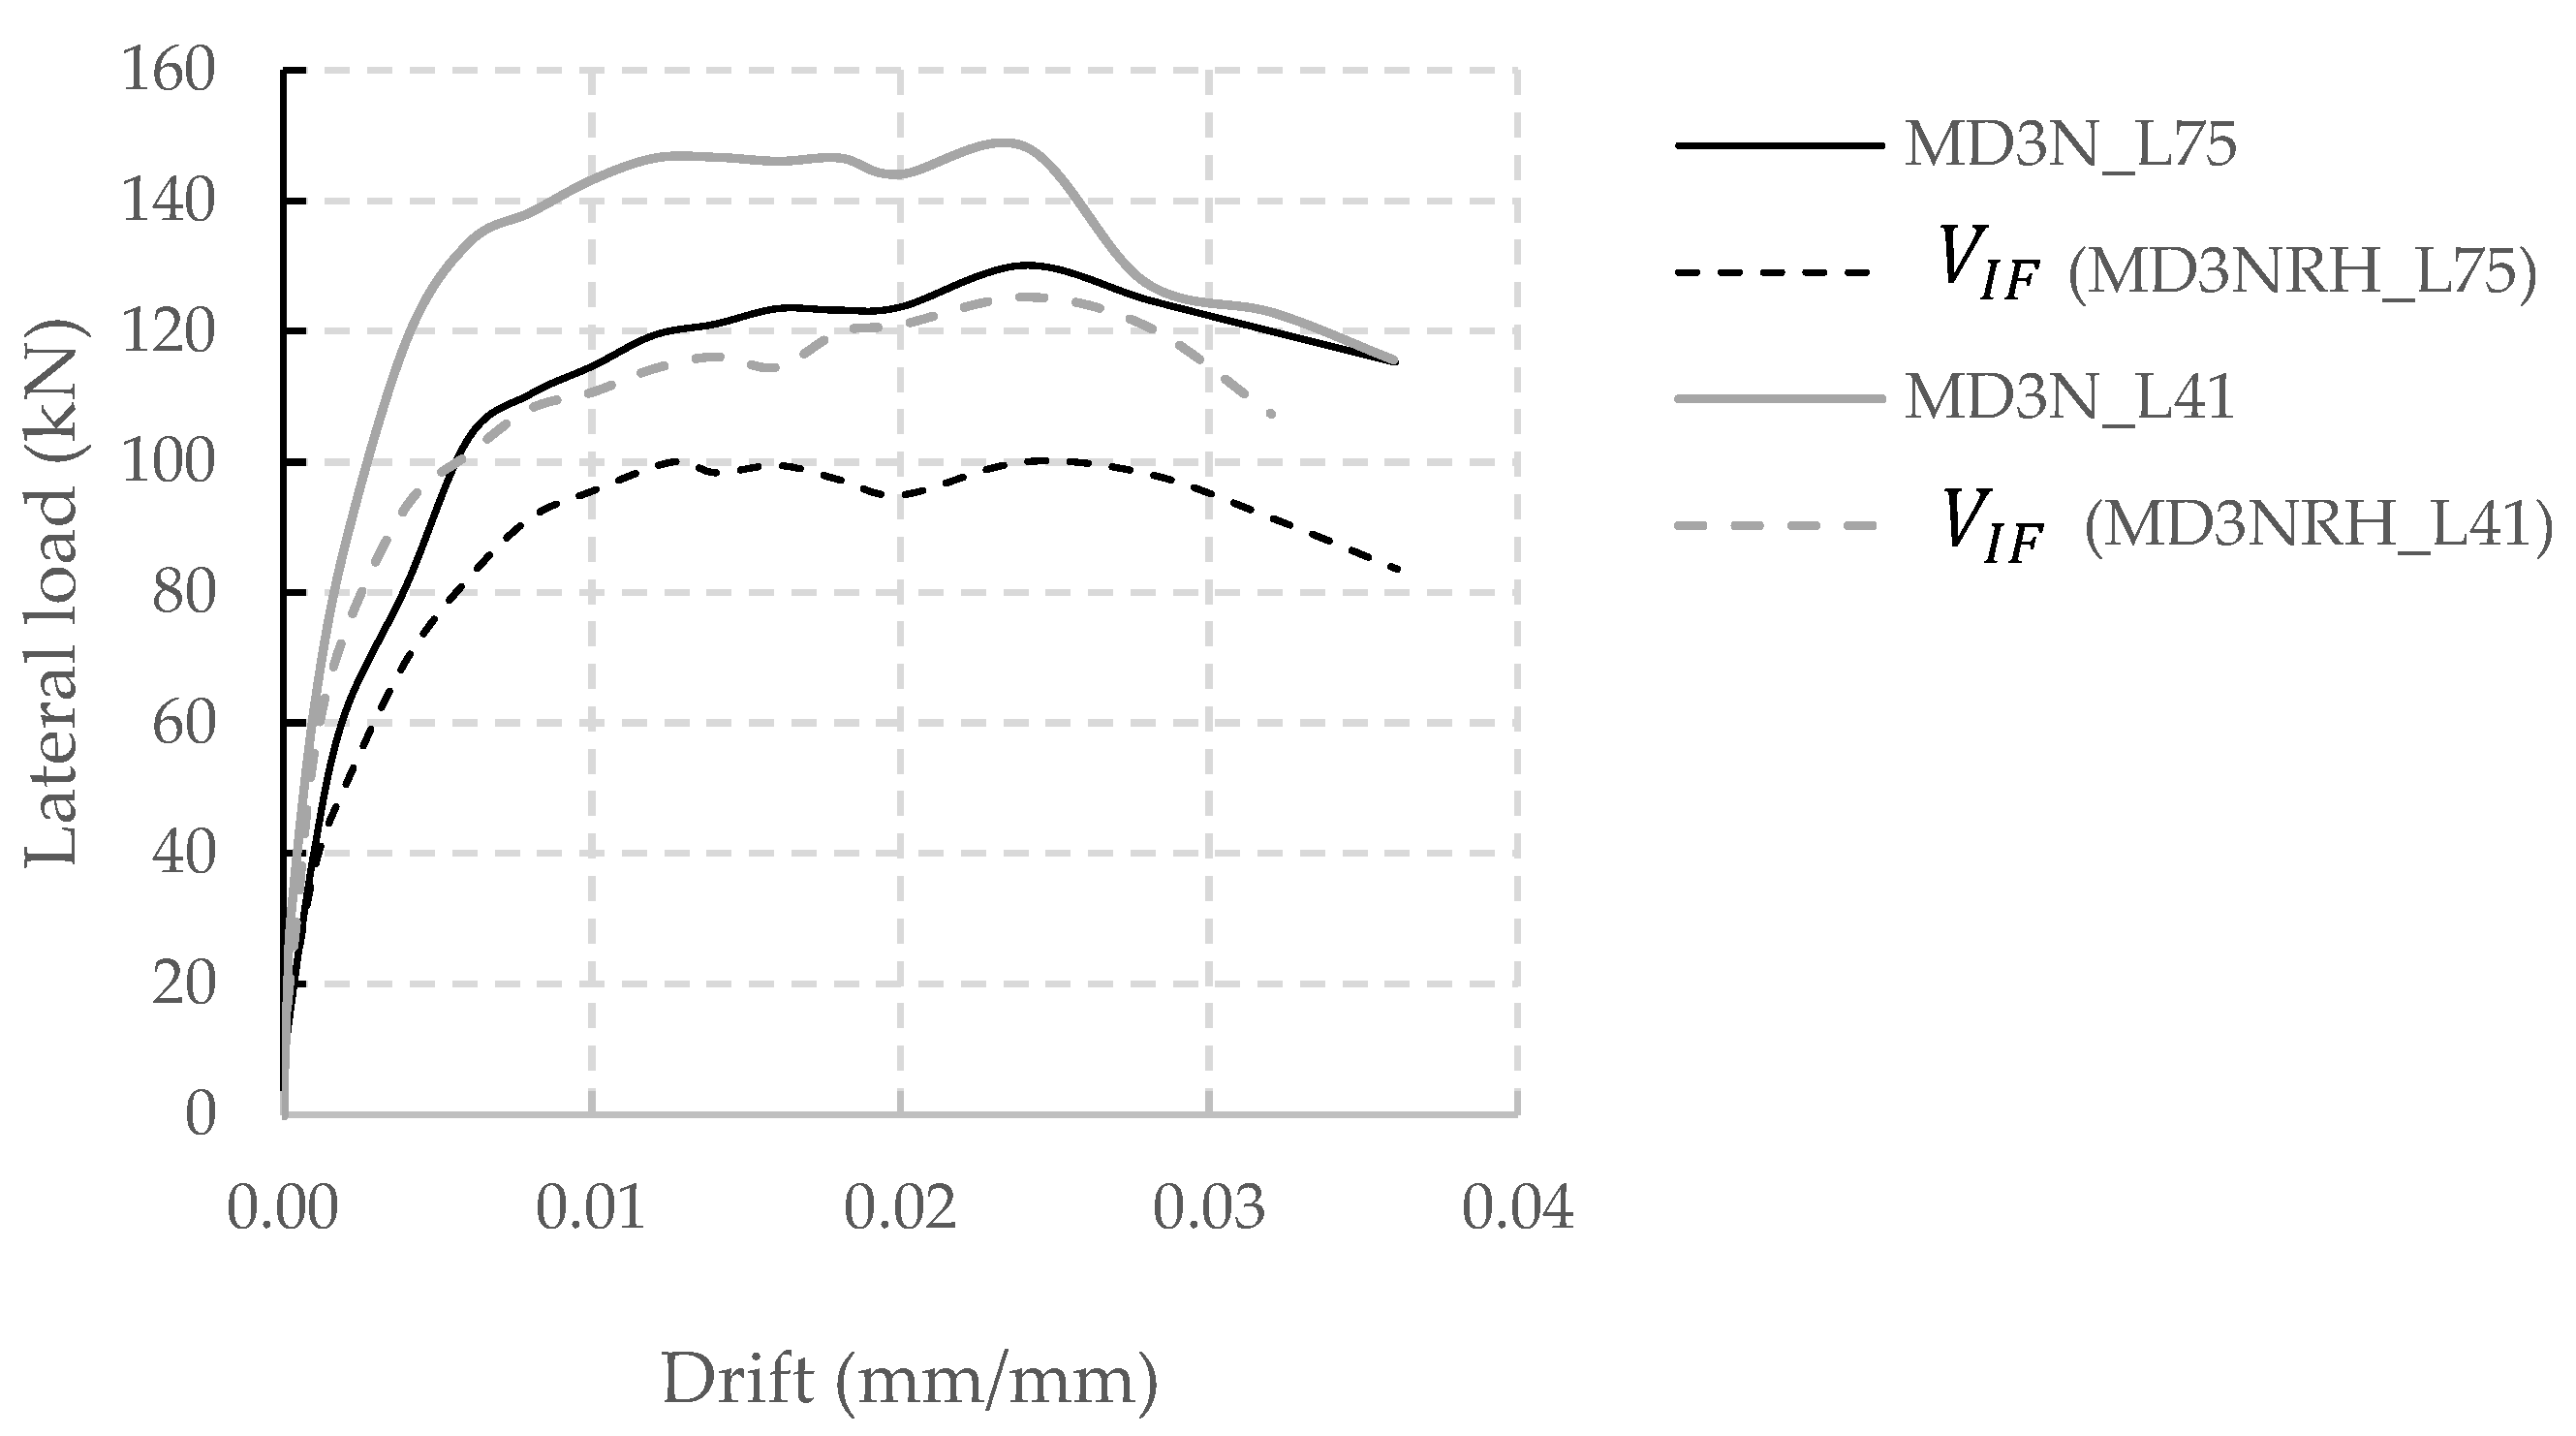
The contribution of infilled frame to lateral load () was calculated as the difference between the applied lateral load ( and the force of the joint reinforcement (. The value of versus drift at peak of each cycle is plotted in Figure 13. In addition, for each reinforced specimen, the envelope curve of the corresponding non-reinforced infill wall is included for comparison purposes. The envelope curves of the non-reinforced specimens are presented by continue lines, while the contribution of the infilled frames in reinforced specimens by discontinue lines.

Figure 13.
Contribution of infilled frame.
In Figure 13, it is observed that all cases presented a reduction of the contribution of infilled frame relative to the shear strength of non-reinforced specimen. This result is consistent with that reported in the literature for masonry load-bearing walls [24,27]. It is argued that the reason of this fact is that once the diagonal crack appears, the horizontal steel goes into tension at the points of intersection with the crack, causing the masonry across to lessen its resistance.
For the specimen MD3NRH_L75, the infilled frame contribution to the peak strength was equal to 76.9% of the lateral load reached by MD3N_L75 at the same drift (), and in the case of MD3NRH_L41 was 84.5% of the applied load to MD3N_L41.
4. Discussion
4.1. Cracking
The initial cracking in the MD3N_L75 wall was due to local interaction of the wall and the confinement elements and cannot be attributed to shear, which is probably the reason why it did not have an effect on the load–deformation curve.
Considering each pair of specimens, the joint reinforcement had no effect on the cracking strength. This result is consistent with the fact that the strain in the rebars was negligible before the first inclined crack appears.
As in confined masonry walls, the use of joint reinforcement in infill walls produces a more distributed cracking and a reduction of the width of the cracks. It was consistently observed in each pair of specimens that joint reinforcement inhibits cracking between tie-columns and masonry panel. The non-reinforced infill walls developed separation between these elements in the final stage of the tests. The facts mentioned before are attributed to the lateral confinement produced by the joint reinforcement, which is similar to a belt activated after first cracking appears.
In the case of the specimens with joint reinforcement, it is considered that the observed damage at peak strength is repairable through standard retrofit procedures. However, this remark is not relevant due to, in practice, infill walls of an edification are replaceable.
4.2. Strength
The joint reinforcement did not affect the cracking strength of the infill walls. As reported in the literature for load-bearing walls [17,18,19], this result is attributed to the fact that joint reinforcement is activated after inclined cracks cross it.
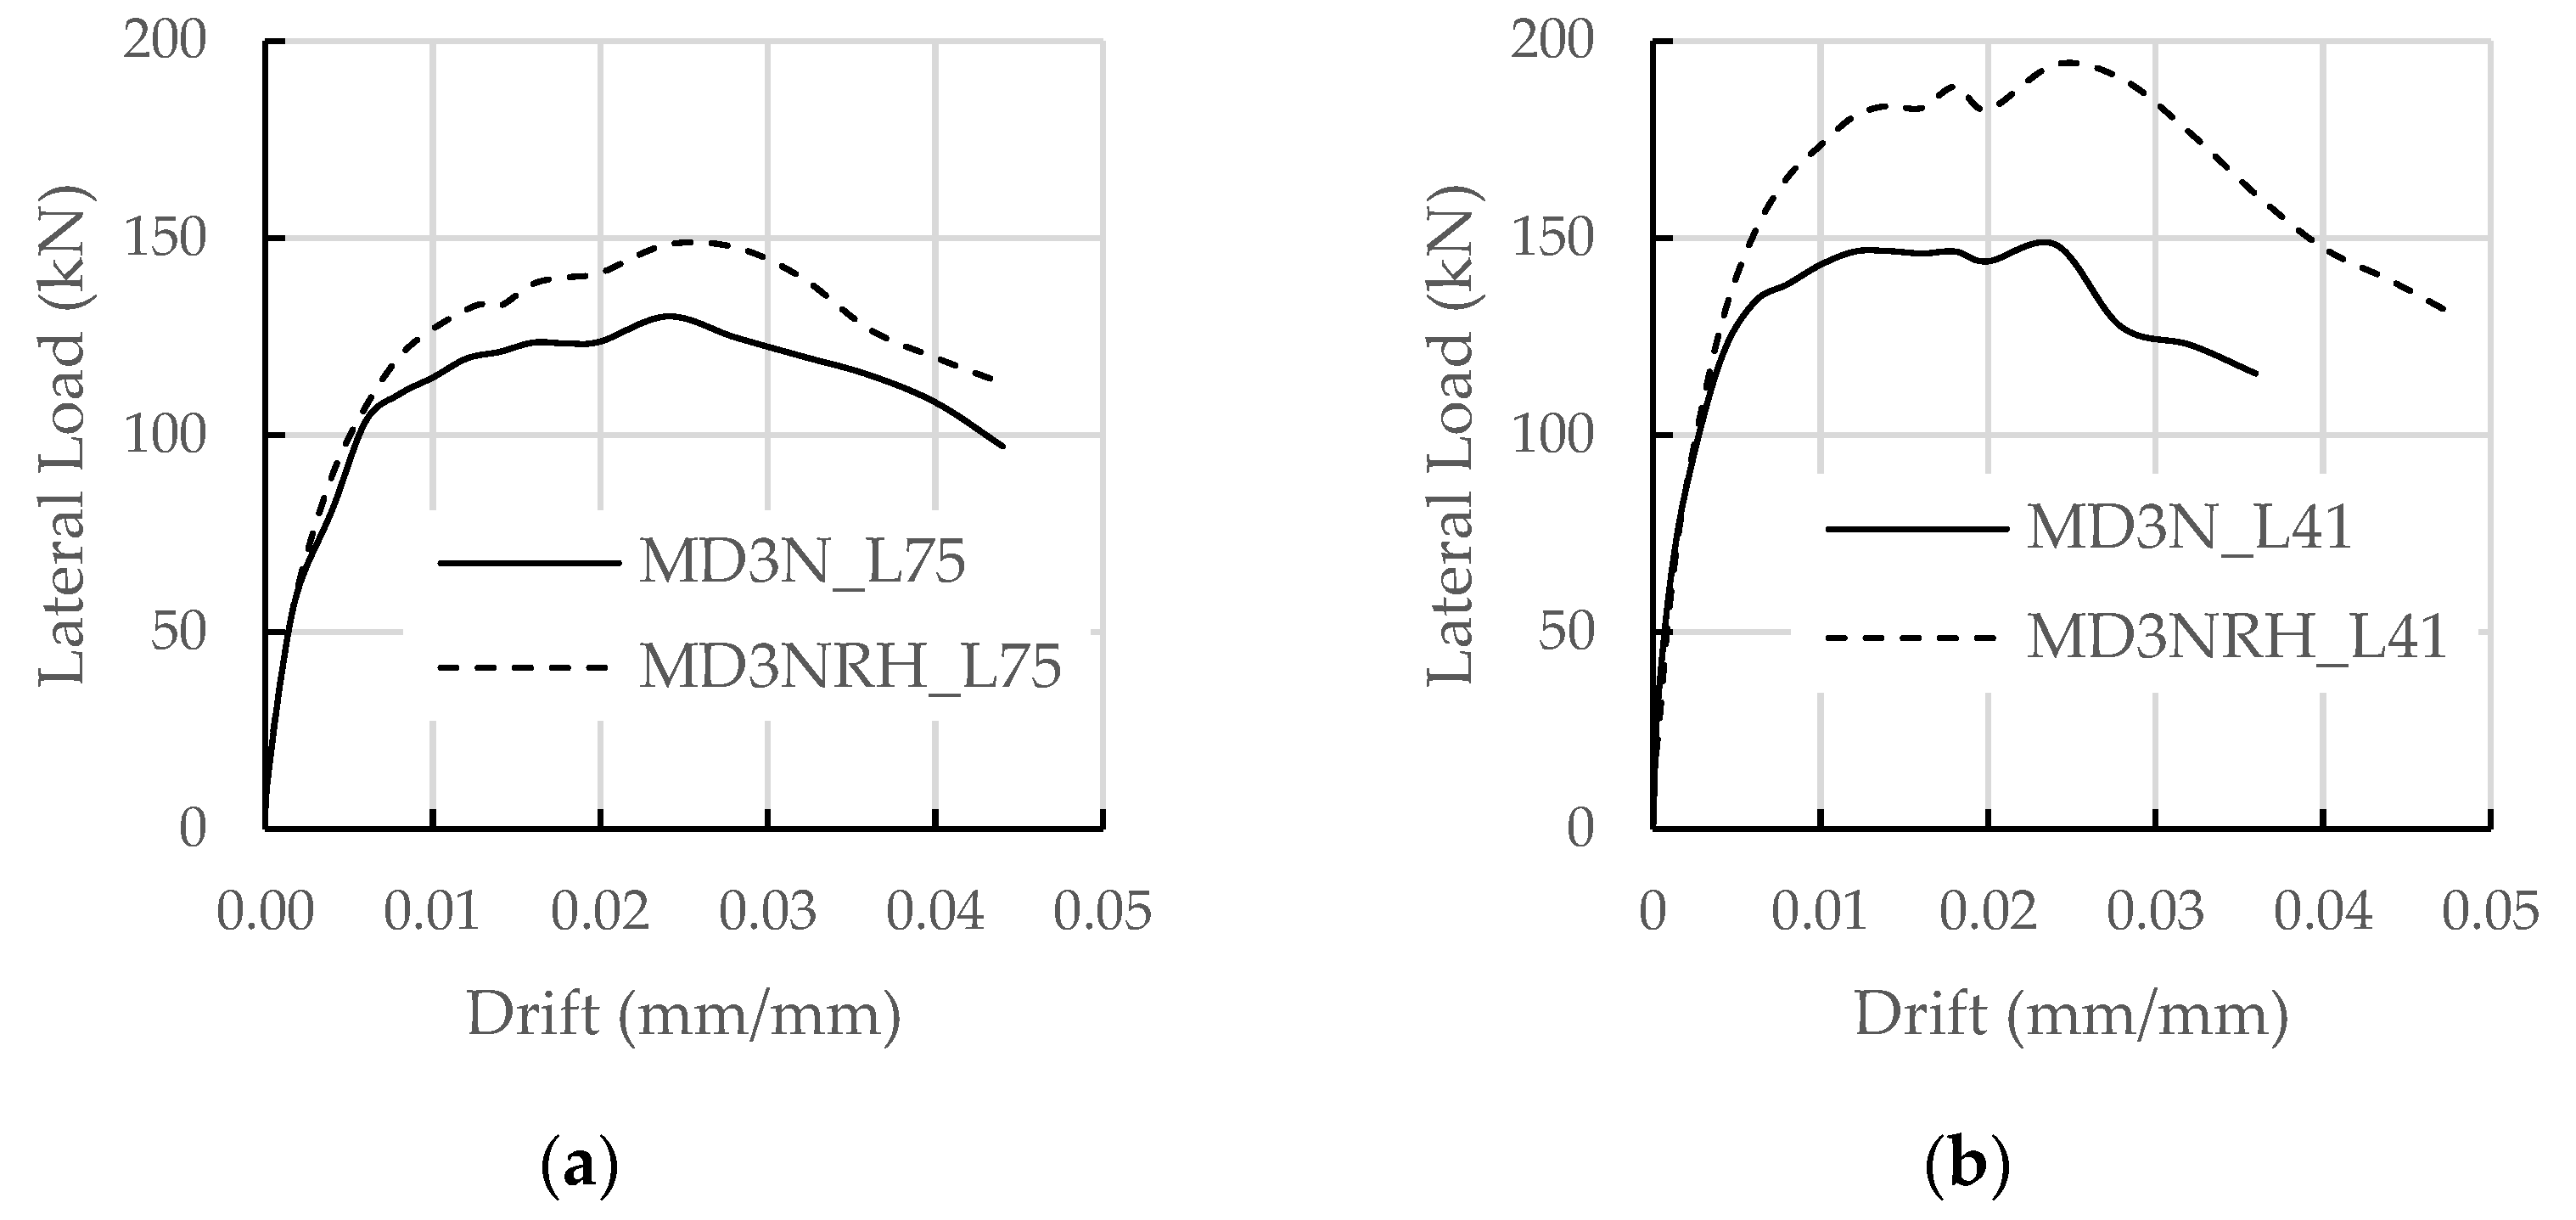
Judging by the load difference between the envelope curves of Figure 14, the contribution of the joint reinforcement started at drifts of 0.006 and 0.004 for the specimens with H/L = 0.75 and 0.41, respectively. Although the force in the steel bars () was already significant for these levels of deformation (approximately 50% of ), the differences between the envelope curves were not relevant yet.
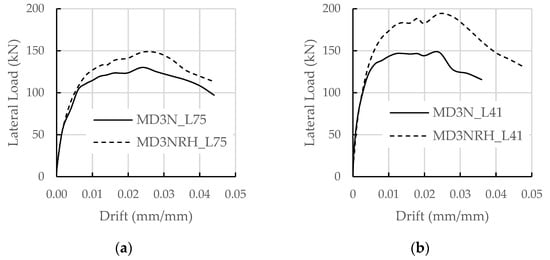
Figure 14.
Envelope curves comparison. (a) Specimens with H/L = 0.75, (b) specimens with H/L = 0.41.
For both cases, the largest load difference between envelope curves was for 0.028, which coincides with the drift of the maximum force in the joint reinforcement. For the two pairs of specimens, the maximum contribution of the joint reinforcement occurred at a drift larger than . The maximum contributions of the joint reinforcement were equal to 22.8 kN (46.1% of ) and 62.8 kN (90.2% of ) for specimens MD3NRH_L75 and MD3NRH_L41, respectively.
The specimen MD3NRH_L41 developed a larger force in the joint reinforcement than the MD3NRH_L75 one, which is consistent with the larger increment in the maximum strength. This fact is attributed to a larger cross-section area of the wall.
According to the Mexican code [2], the contribution of joint reinforcement to shear strength () of masonry walls must be included only if diagonal tension failure dominates. For all specimens, the Mexican code predicts sliding failure in the infill wall; however, experimental results show that diagonal tension occurred first and sliding appeared on the descending part of the envelope curve. The increment of shear strength estimated by the Mexican code due to joint reinforcement () was 37.69 kN and 68.24 kN, for the specimens with H/L = 0.75 and H/L = 0.41, respectively. Experimental results showed an increment of 18.2 kN and 45.8 kN, which is 48.3% and 67.0% of the analytical results, respectively.
4.3. Capacity of Deformation and Ductility
Regardless of the aspect ratio (H/L), the joint reinforcement did not have a significant effect on the displacement capacity of the system. This result is different than that observed for load-bearing confined masonry walls. For such walls, typically, it can be observed that the deformation at failure changes from 0.4% without reinforcement to nearly 1% [6]. Infill walls may undergo large deformations due to the frame that prevents the wall disintegration; however, for such large drifts, the infill wall may be considered that have already failed. Consequently, the beneficial effect of the reinforcement cannot be observed for such large deformations.
For both cases of H/L, the use of joint reinforcement reduced the ductility of the system. Ductility depends on the displacement capacity () and the drift at yielding of the elastoplastic model (). The reduction of ductility is attributed to the fact that, in each pair, the specimen with joint reinforcement had a value for significantly larger than that of the unreinforced specimen.
Even though the use of joint reinforcement increases the lateral strength, it could be detrimental to the seismic behavior of infill walls because it reduces the ductility of the system. A larger ductility leads to a better load redistribution and larger deformations after yielding. It allows people to exit the building and decrease the number of fatalities in case of collapse.
5. Conclusions
Based on the experimental results of four reinforced concrete infilled frames with brick masonry walls, with the variables of the joint reinforcement and the aspect ratio of the wall, the following conclusion can be drawn:
- (1)
- As occurs in confined walls, the joint reinforcement produces a more distributed cracking and a reduction of the cracking wide. In addition, the joint reinforcement had no effect on the initial lateral stiffness;
- (2)
- The joint reinforcement consistently increases the lateral strength of the system. However, this increase depends on the size of the wall as considered by the Mexican Code;
- (3)
- The joint reinforcement had no significant effect on the displacement capacity of the system. This result does not depend on the aspect ratio of the wall;
- (4)
- Ductility of the system is reduced with the use of joint reinforcement due to the fact that the drift at yielding of the elastoplastic model () increases with the reinforcement;
- (5)
- Sliding failure occurred after the inclined cracking. Consequently, the joint reinforcement is active, even if sliding is the dominant failure mode. A larger aspect ratio produces a greater inclined cracking;
- (6)
- The Mexican Code overestimates the join reinforcement contribution to shear strength of infill walls. For walls with H/L = 0.75 and 0.41, the prediction of the code was 2.07 and 1.49 times, respectively, larger than that of experimental results;
- (7)
- Results show that the estimation of the contribution of joint reinforcement to the shear strength in multiple panel infill walls is consistent with the current practice where the reinforcement in each panel is considered, although no previous evidence have been provided.
Author Contributions
J.M.L.-G.: Conceptualization, Methodology, Investigation, Formal analysis, Funding acquisition, Writing—original draft, Writing—review & editing. J.J.P.-G.: Conceptualization, Formal analysis, Writing—original. A.R.-S.: Formal analysis, Writing—review & editing. F.V.-B.: Investigation, Writing—review & editing. E.B.: Visualization, Writing—review & editing. J.B.: Formal analysis, Writing—review & editing. All authors have read and agreed to the published version of the manuscript.
Funding
This research was funded by Consejo Nacional de Ciencia y Tecnología (CONACYT) under Grant CB 2017-2018/A1-S-36643. The financial support given by the Universidad Autónoma de Sinaloa under Grant PROFAPI 2022 is appreciated.
Data Availability Statement
The data used to support the findings of this study are available from the corresponding author upon request.
Acknowledgments
Construction and testing of specimens were carried out at the Laboratory of Structures of the Autonomous University of Sinaloa. Many thanks are given to the students that participated during construction, instrumenting and testing: Yakiro Álvarez, Héctor Aispuro, Miguel Aispuro, Cuitláhuac Mendoza and Jazmín Campista.
Conflicts of Interest
The authors declare no conflict of interest.
References
- Marques, R.; Lourenço, P.B. Structural behavior and design rules of confined masonry walls: Review and proposals. Constr. Build. Mater. 2019, 217, 137–155. [Google Scholar] [CrossRef]
- NTCM. Normas Técnicas Complementarias para el Diseño y Construcción de Estructuras de Mampostería del Gobierno de la Ciudad de México; Gaceta Oficial de la Ciudad de México: Ciudad de México, Mexico, 2017. (In Spanish) [Google Scholar]
- Leal, G.J.M.; Pérez Gavilán, J.J.; Castorena, G.J.H.; Velázquez, D.J.I. Infill walls with confining elements and horizontal reinforcement: An experimental study. Eng. Struct. 2017, 150, 153–165. [Google Scholar] [CrossRef]
- Meli, R.; Brzev, S.; Astroza, M.; Beon, T.; Crisafulli, F.J.; Farsi, M.; Hart, T.; Mebarki, A.; Moghadam, A.; Quiun, D.; et al. Seismic Design Guide for Low-Rise Confined Masonry Buildings; EERI Confined Masonry Network: Oakland, CA, USA, 2011. [Google Scholar]
- Pérez Gavilán, J.J.; Flores, L.E.; Alcocer, S.M. An experimental study of confined masonry walls with varying aspect ratio. Earthq. Spectra 2015, 31, 945–968. [Google Scholar] [CrossRef]
- Cruz, O.A.I.; Perez Gavilan, J.J.; Flores, C.L. Experimental study of in-plane shear strength of confined concrete masonry walls with joint reinforcement. Eng. Struct. 2019, 182, 213–226. [Google Scholar] [CrossRef]
- Polyakov. Masonry in Framed Buildings (Godsudarstvenoe Isdatel’stvo Literatury Po Stroidal Stvui Architecture. Moscow, 1956); Cairns, G.L., Ed.; National Lending Library for Science and Technology: Boston, MA, USA, 1956. [Google Scholar]
- Holmes, M. Steel frames with brickwork and concrete infilling. Proc. Inst. Civ. Eng. 1961, 19, 473–478. [Google Scholar] [CrossRef]
- Stafford-Smith, B. Lateral stiffness of infilled frames. ASCE J. Struct. Div. 1962, 88, 183–199. [Google Scholar] [CrossRef]
- Stafford-Smith, B. Behavior of square infilled frames. ASCE J. Struct. Div. 1966, 92, 381–403. [Google Scholar] [CrossRef]
- Stafford-Smith, B. Methods for predicting the lateral stiffness and strength of multi-storey infilled frames. Build. Sci. 1967, 2, 247–257. [Google Scholar] [CrossRef]
- Stafford-Smith, B.; Carter, C. A method of analysis for infilled frames. Proc. Inst. Civ. Eng. 1969, 44, 31–48. [Google Scholar] [CrossRef]
- Mainstone, R.J. Supplementary Note on the Stiffness and Strengths of Infilled Frames; Building Research Station: Garston, UK, 1974. [Google Scholar]
- Bazán, Z.T.E. Muros de Mampostería ante Cargas Laterales. Ph.D. Thesis, National Autonomous University of Mexico, Ciudad de México, Mexico, 1980. [Google Scholar]
- Flanagan, R.D.; Bennett, R.M. In plane analysis of masonry infills material. J. Struc. Eng. 1990, 125, 590–599. [Google Scholar] [CrossRef]
- Crisafulli, F.J. Seismic Behavior of Reinforced Concrete Structures with Masonry Infills. Ph.D. Thesis, University of Carterbury, Christchurch, New Zealand, 1997. [Google Scholar]
- Aguilar, G.; Alcocer, S.M. Efecto del Refuerzo Horizontal en el Comportamiento de Muros de Mampostería Confinada ante Cargas Laterales; Universidad Nacional Autónoma de México: Mexico City, Mexico, 2001. (In Spanish) [Google Scholar]
- Pineda, C.J.; Alcocer, S.M. Comportamiento Ante Cargas Laterales de Muros de Mampostería Confinada Reforzada con Malla Electrosoldada; Technical Report; Centro Nacional de Prevención de Desastres (CENAPRED): Ciudad de México, Mexico, 2004. (In Spanish) [Google Scholar]
- Alcocer, S.M.; Zepeda, J.A. Behavior of multi-perforated clay brick walls under earthquake-type loading. In Proceedings of the 8th North American Masonry Conference, Austin, TX, USA, 6–9 June 1999. [Google Scholar]
- NTCM. Normas Técnicas Complementarias para Diseño y Construcción de Estructuras de Mampostería; Gaceta Oficial del Distrito Federal: Ciudad de México, Mexico, 2004. (In Spanish) [Google Scholar]
- Rubio, P.L. Contribución del Refuerzo Horizontal a la Resistencia a Corte de Muros Confinados de Piezas de Arcilla Extruida. Master’s Thesis, National Autonomous University of Mexico, Ciudad de México, Mexico, 2017. (In Spanish). [Google Scholar]
- Davis, C.L. Evaluation of Design Provisions for In-Plane Shear in Masonry Walls. Master’s Thesis, Washington State University, Washington, DC, USA, 2008. [Google Scholar]
- Aguilar, G.; Meli, R.; Díaz, R.; del Mercado, A.R.V. Influence of horizontal reinforcement on the behavior of confined masonry walls. In Proceedings of the 11th World Conference Earthquake Engineering, Acapulco, Mexico, 23–28 June 1996. [Google Scholar]
- Cruz, O.A.I.; Perez Gavilan, J.J. Seismic performance of confined masonry walls with joint reinforcement and aspect ratio: An experimental study. Eng. Struct. 2021, 242, 112484. [Google Scholar] [CrossRef]
- ASCE/SEI 41-13. Seismic Evaluation and Retrofit of Existing Buildings; ASCE: Reston, VA, USA, 2014. [Google Scholar]
- Simo, J.C.; Hughes, T.J.R. Motivation. One-dimensional plasticity and viscoplasticity. In Computational Inelasticity; Marsden, J.E., Sirovich, L., Wiggins, S., Eds.; Springer: New York, NY, USA, 1997; Volume 7, pp. 1–70. [Google Scholar]
- Anderson, D.; Priestley, M. In Plane Shear Strength of Masonry Walls. In Proceedings of the 6th Canadian Masonry Symposium, Sasketoon, SK, Canada, 15–17 June 1992. [Google Scholar]


Publisher’s Note: MDPI stays neutral with regard to jurisdictional claims in published maps and institutional affiliations. |
© 2022 by the authors. Licensee MDPI, Basel, Switzerland. This article is an open access article distributed under the terms and conditions of the Creative Commons Attribution (CC BY) license (https://creativecommons.org/licenses/by/4.0/).