Article

Relationships between Physical, Mechanical and Acoustic Properties of Asphalt Mixtures Using Ultrasonic Testing

1
College of Transportation Science and Engineering, Nanjing Tech University, Nanjing 210009, China
2
Department of Civil and Environmental Engineering, Washington State University, Pullman, WA 99164, USA
3
Ingram School of Engineering, Texas State University, San Marcos, TX 78666, USA
4
College of Civil Engineering and Architecture, Zhejiang University, Hangzhou 310058, China
*
Author to whom correspondence should be addressed.
Buildings 2022, 12(3), 306; https://doi.org/10.3390/buildings12030306
Submission received: 12 February 2022 / Revised: 28 February 2022 / Accepted: 2 March 2022 / Published: 4 March 2022
(This article belongs to the Special Issue Advances in NDT: Theories, Techniques, and Engineering Applications)

Abstract

:
Ultrasonic testing can be used for a nondestructive and rapid determination of material properties. In this study, twelve asphalt mixture samples of four different types were fabricated and used in conventional material property tests and two ultrasonic wave tests. Physical properties such as bulk specific gravity and air void content, mechanical properties such as dynamic modulus and phase angle, and acoustic properties such as wave velocity were measured. Relationships between these properties were established and analyzed as a tool for the future material property determination. In addition, the dynamic modulus and phase angle, measured in a standard laboratory test, were used to construct two master curve models to predict their values at arbitrary temperatures and frequencies. Furthermore, a theoretical model for wave velocity in a linear isotropic viscoelastic material was utilized with measured density, Poisson’s ratio, phase angle and ultrasonic wave velocity to predict the dynamic modulus. Good agreement has been achieved between laboratory measurements and model predictions. It indicates that ultrasonic testing can serve as a rapid method for material property determination.

1. Introduction

Asphalt pavement is widely used for its advantages such as comfortable driving, low noises, small vibrations and convenient maintenance [1]. Meanwhile, asphalt pavement is prone to multiple types of distresses due to the effects of traffic and the environment on the materials and structure [2,3]. As a result, the service life and maintenance cost of asphalt pavement are negatively affected and require timely prediction and management [4]. Traditional methods measuring the properties of asphalt layer materials and asphalt mixtures utilize large scale instruments in the laboratory. Their setup and loading are complicated and time-consuming, which cannot satisfy the demand for efficient damage detection and maintenance decision making. Furthermore, these methods have limitations including destruction in order to service asphalt pavements, wastage of manpower and materials, etc. [5] Therefore, it is necessary to develop and improve nondestructive testing (NDT) technology in the structural characterization and evaluation of pavement materials.
Currently, several NDT techniques are applied in the laboratory and field for asphalt mixtures and structures, among which the acoustic system is a widely used method. Acoustic pulses are generated at one position of the test sample by a transmitter device and then are received at the same or another position by a receiver senor. The system can be divided into sonic and ultrasonic, and the frequency of the mechanical vibration or acoustic pulse in the ultrasonic system can be higher than 20 kHz [6]. The pulse propagates through the test sample in the forms of three mechanical waves: a longitudinal wave, transverse wave and Rayleigh wave [7]. Defects between locations of the transmitter and receiver are reflected on the characteristics of received signals. As they come directly from the sample, properties reflecting the composition of the sample can be obtained as well. Simply speaking, material information is characterized from its effects on the external waves. An acoustic wave also occurs within the material as its internal structure changes due to aging, cracking, plastic deformation, etc. [8,9,10]. This is essentially caused by the release of localized stress energy [9]. Therefore, the development of material deterioration can be monitored by the continuous recording and analysis of received signals.
Accordingly, applications of ultrasonic testing in asphalt mixtures can be categorized into defect detection and property measurement. Maillard et al. [11] characterized the fracture and healing of asphalt binders in fracture tests by analyzing the signal evolution. The signal amplitude and intense alternation were utilized as indicators. Chang [12] monitored microdamage in asphalt thin films and microfractures in asphalt binders and asphalt/aggregate interfaces from received acoustic emission (AE) signals in mechanical tests. The occurrence, source and intensity of AE signals revealed the material state. Cheng et al. [13] conducted water–temperature–radiation (WTR) cycle tests on asphalt mixtures and evaluated the damage state of samples using the ultrasonic detection method. Damage degree was assumed to be reflected on the ultrasonic waveform, spectrum and velocity. Birgisson et al. [14], Cui et al. [15] and Dovom et al. [16] characterized the moisture damage of asphalt mixtures in the ultrasonic wave velocity test. Mallick et al. [17] detected the moisture-induced damage of fresh/recycled composite asphalt mixtures in the ultrasonic pulse velocity test. In these studies, moisture damage was believed to affect the material integrity, resulting in the wave velocity change. Pan et al. [18] and Qiu et al. [9,10] partitioned and characterized the continuous damage process of asphalt mixture samples in bending tests using the ultrasonic wave method. The first research team utilized wave velocity as the indicator, while the second research team calculated the AE energy and Felicity ratio from time histories of the load and AE signal. Meng et al. [19] quantified the freeze–thaw damage of asphalt mixtures in the Rayleigh wave test. Rayleigh wave velocity was utilized to describe the freeze–thaw damage along with natural frequency and damping ratio.
Representative studies on property measurement using ultrasonic testing are summarized in Table 1. Their main target is to develop a rapid testing method to replace traditional ones considering the operational time of ultrasonic testing. Different models and assumptions can be applied for the tested material according to the purpose of the test. For example, a traditional compression–tension test measures the dynamic modulus of viscoelastic materials. The material properties of asphalt mixtures obtained from the corresponding ultrasonic test are supposed to be frequency-dependent. However, for the properties applied in the deterioration determination or the quality assurance and control (QA/QC), simple and fast testing and analysis procedures showing the property variations with time and sample location are more important. Therefore, these properties can be simplified. For example, if a fixed frequency is applied throughout the study, single modulus values can be used to indicate the stiffness of asphalt mixtures of different types and conditions.
In this study, the second research direction was followed, in which asphalt mixture properties were efficiently determined using ultrasonic testing technology. Relationships between the ultrasonic wave velocity and density, air void content and dynamic modulus were established. In particular, master curve models of the dynamic modulus and phase angle were constructed, and the dynamic modulus measured in a conventional laboratory test and predicted by an analytical model were compared. The main reason is that current inspections and evaluations of in-service pavements are carried out intermittently. Constructed relationships between the physical, mechanical and acoustic properties can provide evidence for a potential transfer from acoustic information received from the field to material information [20]. Eventually, material deterioration can be revealed by the material information obtained at different stages of the pavement’s service life.
The rest of this paper is structured as follows: Section 2 describes the material selection and sample preparation for traditional material property measurements and ultrasonic wave tests; Section 3 introduces both traditional and ultrasonic testing methods on prepared samples; Section 4 presents the relationship construction for the ultrasonic wave velocity and material properties; Section 5 summarizes the conclusions from this study and recommendations for future research.
Table 1. Representative methods for material properties using ultrasonic testing technologies.
Material PropertyAuthorUltrasonic Testing DescriptionAnalytical MethodFindings/Contributions
Bulk Specific GravitySztukiewicz [21]Measure the propagation time/velocity of longitudinal ultrasonic wave at a constant frequency (500 kHz).Build a linear relationship between the bulk specific gravity ( ρ p m ) and wave propagation velocity ( c L ) as c L = a ρ p m + b
  • Effects of the temperature, volume fractions of asphalt mixture components and gradation of aggregates on model parameters a and b were characterized.
Air Void ContentZargar et al. [22]Measure the ultrasonic velocity of compressive wave at a constant temperature (25 °C) and frequency (54 kHz). Build a linear relationship between the air void content (AV) and ultrasonic velocity (UV) at the sample center as A V   =   a U V   +   b
  • An increase in the air void content resulted in a decrease in the ultrasonic velocity.
  • Model parameters a and b were calibrated for asphalt mixtures with different binder types.
  • Air void content variation with sample location was captured by the ultrasonic wave transmission techniques.
Lame’s Constants [23]Birgisson et al. [14]Produce compression (P-wave) and shear (S-wave) ultrasonic waves and measure their velocities V p and V s .
  • Apply the theory of elastodynamics and assume the asphalt mixture sample a homogenous and isotropic solid.
  • Determine Lame’s constants from their relations with wave velocities and other material properties as
    V p = ( 1 v ) E ( 1 +   v ) ( 1 2 v ) ρ
    V s = E 2 1 + ν ρ where E is Young’s modulus; ν and ρ are Poisson’s ratio and material density, respectively
  • Calculated Young’s modulus showed causal trends with the density and air void content.
  • Calculated Young’s modulus indicated the moisture damage degree of the material.
Tigdemir et al. [24]
  • Calculated Lame’s constants with other material properties were implemented into a regression model predicting the fatigue life of the material, which was calibrated using the repeated-loading indirect tensile test.
Norambuena-Contreras et al. [25]
  • Two correlation factors were calibrated using moduli measured from the standard dynamic modulus test and ultrasonic direct test at fixed frequencies (10 Hz and 65 kHz) and temperature (22 °C).
Di Benedetto et al. [26]
  • Extend the assumption to linear isotropic viscoelastic materials as
    V p = 1 cos φ / 2 1 ν E * 1 + ν 1 2 ν ρ
    V s = 1 cos φ / 2 E * 2 1 + ν ρ  
    where magnitude of the dynamic modulus E * and phase angle φ are both frequency dependent
  • Calibrate an analytical model (2S2P1D) for the dynamic modulus of asphalt mixtures from the compression–tension test.
  • Calculate the dynamic modulus using the analytical model at the temperature and frequency of the ultrasonic wave test.
  • The time–temperature principle (TTSP) was validated for high frequencies by comparing the dynamic modulus from two testing methods;
  • The ultrasonic wave test detected the anisotropy of the asphalt mixture sample and discrepancies between different compaction methods.
Mounier et al. [27]
  • Calculated Poisson’s ratio using V p and V s had different values. It was explained by the fact that the Poisson’s ratio is frequency dependent and wave velocities at different sample directions should be different.
  • The ultrasonic wave test overestimated the dynamic modulus.
Larcher et al. [28]
  • Some rheological parameters of the analytical model were clearly estimated by the ultrasonic wave test results.

2. Material Selection and Sample Preparation

Four different asphalt mixtures were prepared in this study including two dense graded asphalt mixtures with maximum aggregate sizes of 13 mm (AC-13) and 20 mm (AC-20), one semi-open graded gravel mixture with 20-mm maximum aggregate (AM-20) and one stone mastic asphalt mixture with 13-mm maximum aggregate (SMA-13). In AC-13 and SMA-13, basalt was used as the coarse aggregate and limestone was used as the fine aggregate, while in AC-20 and AM-20, limestone was used as both coarse and fine aggregates. The gradation design of mineral aggregates in asphalt mixture samples followed Technical Specifications for Construction of Highway Asphalt Pavements (JTG F40-2004) [29] and results are presented in Table 2. A styrene-butadiene-styrene (SBS) modified asphalt binder was used in all samples to hold aggregates together. Designed asphalt binder contents in AC-13, AC-20, SMA-13 and AM-20 mixtures were 5.0%, 4.4%, 5.9% and 3.8%, respectively. Laboratory tests on the binder followed Standard Test Methods of Bitumen and Bituminous Mixtures for Highway Engineering (JTG E20-2011) [30] and basic properties are presented in Table 2. Twelve (four mixture types × three duplicates) cylindrical asphalt mixture samples with 100 mm in diameter and 150 mm in height were prepared from compaction using the standard gyratory compaction method, then cut and cored [31]. They were subsequently used in laboratory tests on physical, mechanical and acoustic properties. Samples preparation is presented in Figure 1.

3. Laboratory Tests on Asphalt Mixtures

3.1. Physical Properties

Volumetric physical parameters such as bulk specific gravity, theoretical maximum specific gravity and air void content of asphalt mixture samples were measured. Bulk specific gravity is the ratio of the sample weight to an equal volume of water [32]. According to JTG E20-2011, two methods can be applied to measure bulk specific gravity based on the water absorption of the asphalt mixture sample. The water absorption ( S a ) is presented in Equation (1)
S a   =   m f     m a m f     m w   ×   100 %
where m f = mass of saturated surface dry (SSD) specimen; m a = mass of dry specimen in air; m w = mass of saturated specimen in water. Samples with water absorption less than and greater than 2% should be measured by the surface dry method and wax seal method, respectively. In this study, water absorptions of all specimens were less than 2%. Therefore, their bulk specific gravities ( γ f ) were calculated using Equation (2) from the surface dry method and are presented in Table 3.
γ f   =   m a m f     m w
Theoretical maximum specific gravity ( γ t ) was measured with the aid of a tared vacuum vessel. Residual pressure of the vessel containing the sample submerged by water was reduced and released to ensure air voids were excluded from the sample. Theoretical maximum specific gravity of all samples was calculated using Equation (3) and the average values of four mixture types are presented in Table 3
γ t   =   m a m a   +   m b     m c
where m b = mass of vacuum vessel filled with water at 25 °C; m c = mass of vacuum vessel, sample and water at 25 °C. Theoretical maximum specific gravity was supposed to be greater than bulk specific gravity for the absence of air voids, as shown in Table 3. Accordingly, air void content ( V V ) can be obtained from these two gravities as Equation (4).
V V   =   1     γ f γ t   ×   100 %

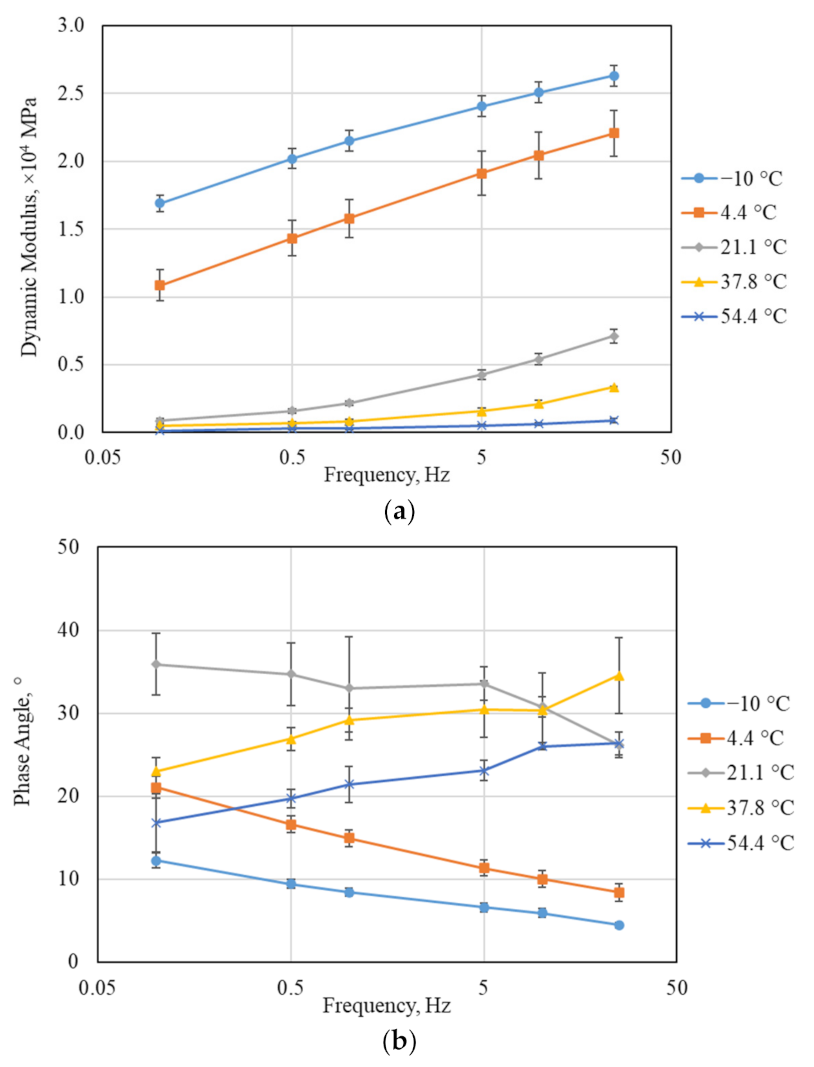
3.2. Mechanical Properties

The dynamic modulus is a fundamental property reflecting the viscoelasticity of asphalt mixtures under external excitations [33]. It can be measured in the laboratory from load and deflection time histories. According to AASHTO T 342 [34], the dynamic modulus test was carried out at five temperatures (−10 °C, 4.4 °C, 21.1 °C, 37.8 °C, 54.4 °C) and six frequencies (25 Hz, 10 Hz, 5 Hz, 1 Hz, 0.5 Hz, 0.1 Hz) in this study. A UTM-25 multifunctional testing machine developed by Australian IPC Company was used to apply sinusoidal uniaxial compressive loads on samples. Each sample underwent 25 loading conditions (five temperatures × five frequencies) in total, in which temperature and frequency were adjusted from low to high values. Time histories of applied loads and corresponding axial deflections were recorded to calculate the dynamic modulus as Equation (5)
E f   =   σ ε
in which magnitudes of applied stress σ and corresponding strains ε were calculated from the last five load cycles as Equations (6) and (7)
σ   =   p i A
ε   =   Δ i l
where E f = dynamic modulus magnitude at the test frequency f ; p i = averaged load magnitudes; A = averaged top and bottom surface areas of the sample; Δ i = averaged recoverable axial deflection magnitudes; l = distance between displacement sensors. As a viscoelastic material, the dynamic modulus magnitude of asphalt mixtures is frequency and temperature dependent. The effects of frequency and temperature on the dynamic modulus can be seen from Figure 2.
In addition to the dynamic modulus, the viscoelasticity of asphalt mixtures is reflected in the phase angle—a property defined from time histories of the load and deflection as well. This was calculated from Equation (8)
φ   =   t i t p   ×   360 °
where φ = phase angle in degree; t i = averaged time differences between load and deflection magnitudes; t p = averaged load cycles. The phase angle shows the lag of material responses to excitations as a material property. Meanwhile, the change in its value can indicate material deterioration with service time [35,36]. Figure 2 shows test results of the dynamic modulus and phase angle of AC-20 samples. It can be seen that as temperature increases or frequency decreases, the dynamic modulus decreases. However, neither frequency nor temperature has consistent effects on the phase angle, which matches the model provided in Section 4.3. The values and error bars were determined from the average and standard deviation of three replicate samples. Experimental data of individual samples was utilized to construct corresponding master curve models predicting the dynamic modulus and phase angle. Details are presented in Section 4.3.

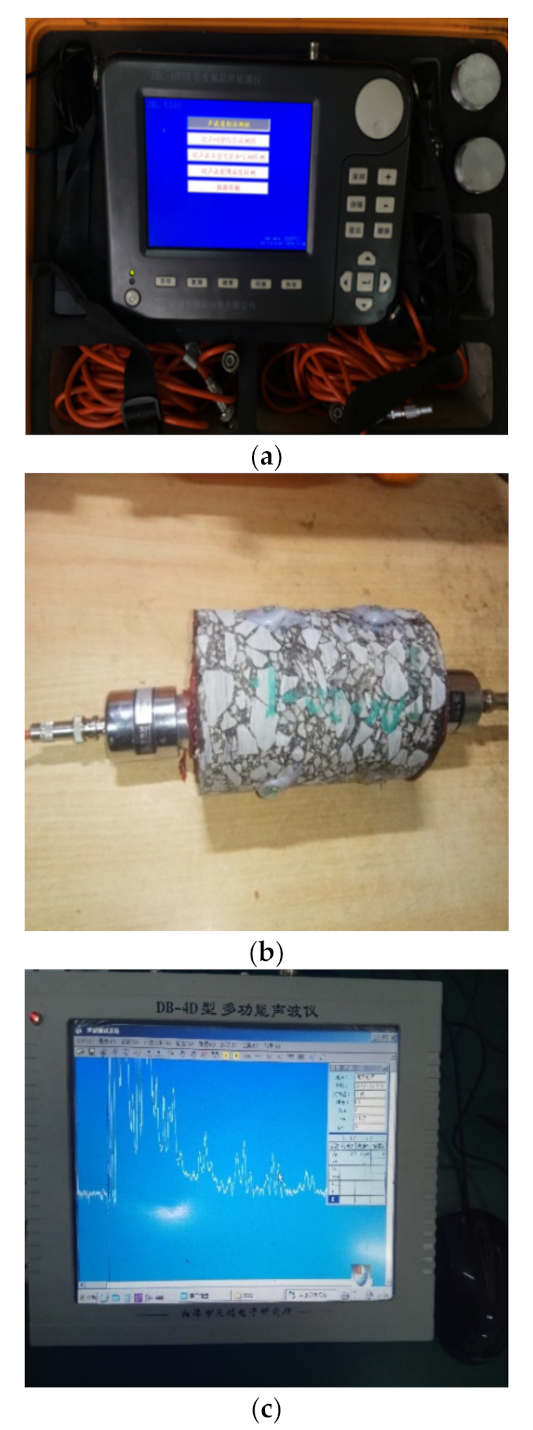
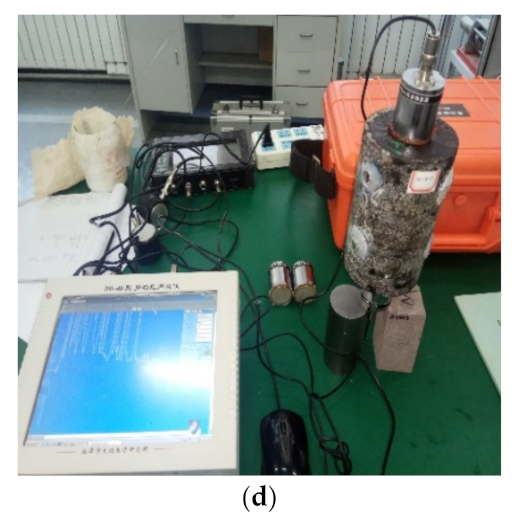
3.3. Acoustic Properties

Acoustic information such as wave velocity, wave amplitude, waveform and frequency were measured in two acoustic wave tests and recorded for developing relationships with the physical and mechanical properties of samples. A ZBL-U510 non-metallic ultrasonic detector shown in Figure 3a was used to conduct the ultrasonic wave test and DB-4D multifunctional sonic detector shown in Figure 3c was used to conduct the P-wave/S-wave test. Figure 3b,d show sample positions in two acoustic wave tests, in which transmitters and receivers were placed at two ends of the sample. Multiple trial tests were conducted on the effects of the coupling agent applied between the probe and sample surface, emission voltage and pulse width on test results. The values of instrument parameters were taken as those listed in Table 4.
Received signals in the ultrasonic wave test can be represented by a schematic diagram of the waveform shown in Figure 4. Prior to the test, the instrument was zeroed to eliminate the delayed time of previous ultrasonic wave propagations. In the test, information such as the initial point and peak of the head wave were extracted to calculate the wave velocity and attenuation, etc. Similarly, in the P-wave/S-wave test, propagation times of two waves were calculated by analyzing the emitted and received signals.
Table 5 shows averaged acoustic properties of four sample types. The propagation time, wave velocity, wave amplitude and frequency were obtained from the ultrasonic wave test. Wave velocities of P-wave and S-wave were obtained from the P-wave/S-wave test and calculated from the sample length ( L ) and measured wave propagation times ( T ) using Equation (9).
V   =   L / T
It can be seen from Table 5 that differences in wave amplitude and frequency between sample types are very small, which indicates desirable sample integrity. As a comparison, obvious variations can be observed in the wave propagation time and velocity. In addition to the effects of devices and data reading and analysis, sample properties such as gradation, density and air void content contribute to such variations significantly. For example, AC-20 and AC-13 are dense graded mixtures with high densities and low air void contents. An acoustic wave is supposed to propagate in such AC mixtures with less attenuation and more concentrated energy. On the contrary, the wave is prone to scattering and attenuation in SMA-13 and AM-20 samples resulting from their open/semi-open aggregate gradations and higher air void contents. Additionally, velocities of P-waves in Table 5 are higher than S-waves since particles in P-waves move in the same direction as wave propagations, while in S-waves, particles move perpendicularly to the wave propagation direction [24]. As a result, an S-wave can only propagate in solids and liquids with high viscosity, while a P-wave can propagate in solids, liquids and gases [37,38].

4. Relationships between Acoustic, Physical and Mechanical Properties

As introduced in Table 1, wave speed has causal relationships with the physical and mechanical properties of the material. In this study, data of individual samples were used to construct explicit equations of the relationships.

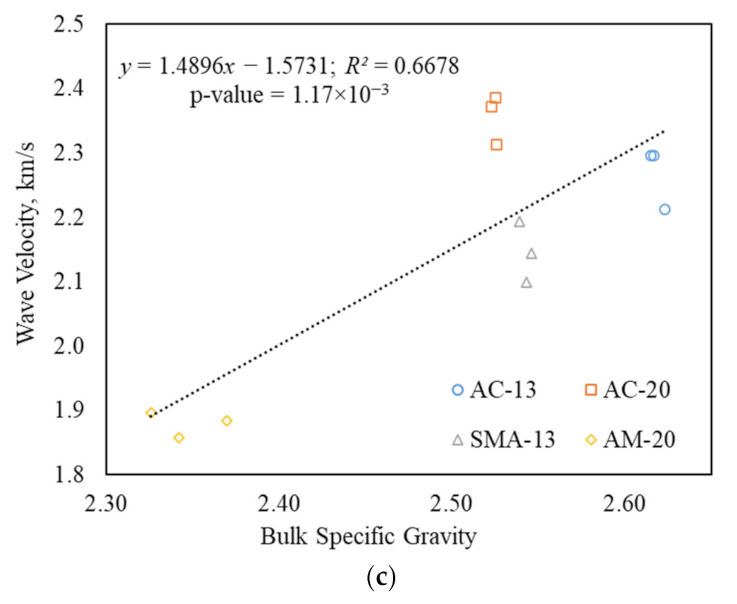
4.1. Wave Velocity vs. Bulk Specific Gravity

Figure 5 shows relationships between three wave velocities and bulk specific gravity including the performance of linear fitting functions. It can be found that wave velocities do not change very consistently with bulk specific gravity in individual and entire asphalt mixture types. For example, three ultrasonic wave velocities are higher in AC-20 samples than in AC-13 and SMA-13 samples, although AC-20 samples have lower bulk specific gravity. Considering the factors affecting wave velocity described in Section 3.3, it may be concluded that bulk specific gravity is not an ideal indicator for sample integrity since it does not have consistent effects on wave velocity.
However, linear regression analysis still indicates a strong positive correlation between wave velocity and bulk specific gravity from the R-squared (R2) and p-value shown in Figure 5. The R2 calculated by Equation (10) represents the prediction accuracy of the regression model
R 2   =   1     i y i     y ^ i 2 i y i     y ¯ 2
where y i = the observation (actual value) of the i-th outcome; y ^ i = the prediction of the i-th outcome; y ¯ = the mean of all observations. Specifically, in models with one predictor (x), as shown in Figure 5, R equals the Pearson correlation coefficient between the outcome and predictor [39]. Accordingly, the Pearson correlation coefficient between bulk specific gravity and three wave velocities are 0.83, 0.78 and 0.82, respectively, which are very high. Additionally, the p-value shown in Figure 5 indicates the fitting performance by using the predictor as opposed to eliminating it. All three p-values are smaller than the threshold of the significant level 0.05, which rejects the hypothesis that the predictor can be eliminated from the regression model.
Compared with the ultrasonic wave test, wave velocity and bulk specific gravity have lower correlations in P-wave and S-wave tests. This may result from greater measuring errors caused by higher transducer frequencies in P-wave and S-wave tests.

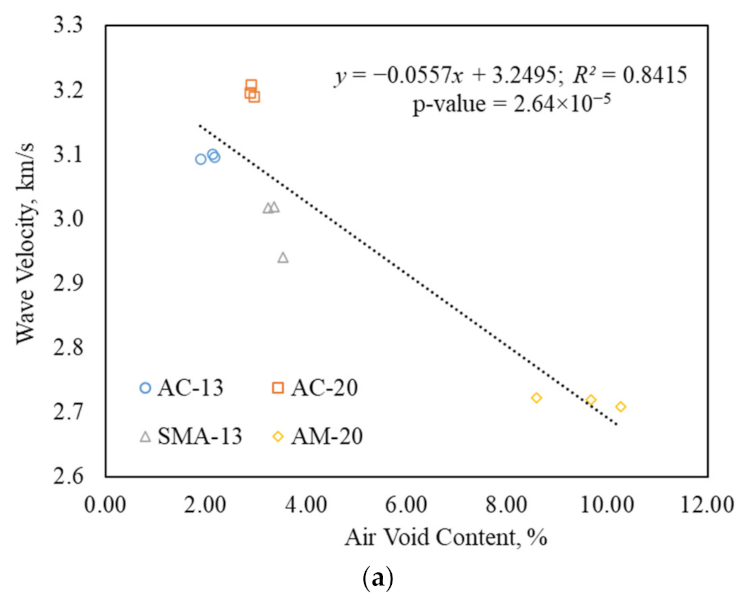
4.2. Wave Velocity vs. Air Void Content

Figure 6 shows relationships between three wave velocities and air void content. Since acoustic waves propagate more slowly in air than in solids, void content has a negative effect on wave velocity as opposed to bulk specific gravity. In addition, air void is a typical scatterer leading to wave dispersion and energy attenuation. Wave velocity in mixtures with higher air void contents is smaller accordingly. However, it can be observed that AC-13 with less air void content than AC-20 has smaller wave velocity. This may result from the fact that AC-20 contains more coarse aggregates as shown in Table 2. Contact interfaces between asphalt binders and aggregates are fewer in AC-20. Concentrated energy and high propagation velocity result from such a continuous and integrated matrix.
Similar to bulk specific gravity, air void content is not a comprehensive indicator for sample integrity either. However, the fitting performance and the correlation between wave velocity and air void content described by the R2 and p-value are better and higher than that between wave velocity and bulk specific gravity. Considering the tedious and time-consuming procedures of measuring air void content in the laboratory, ultrasonic testing is worth a trial in future research on asphalt mixtures.

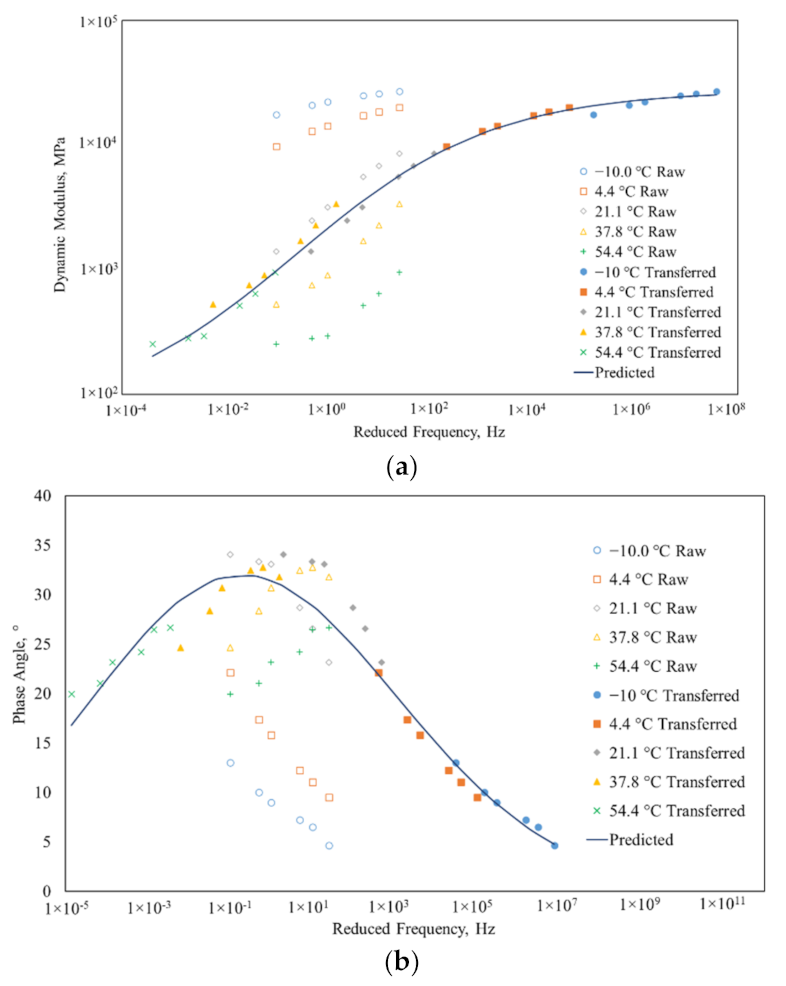
4.3. Wave Velocity vs. Dynamic Modulus

According to Figure 2, temperature and frequency are two major factors determining the dynamic modulus and phase angle of asphalt mixtures. In this study, master curve models were constructed for the dynamic modulus and phase angle using results obtained in 30 test conditions (five temperatures × six frequencies) and the time–temperature superposition [40]. Equations (11) and (12) present master curve models of the dynamic modulus and phase angle, respectively [41]
log E * f   =   δ   +   α 1   +   exp η     γ log f r
φ f   =   φ max exp 1   +   1 / β f 0 / f r β     1 f r / f 0 β   +   1
in which
f r   =   f   ×   10 a T 2   +   b T   +   c
where E * f and φ f = dynamic modulus magnitude and phase angle under the loading frequency f ; T = temperature; φ max and f 0 = maximum phase angle and corresponding frequency, respectively; α , β , δ , η , γ , a , b and c = fitting parameters, which have different values in the dynamic modulus and phase angle models. Figure 7 shows test results and model predictions of the dynamic modulus and phase angle of AC-20, Sample No.1. Model accuracies described by the R2 in Figure 7 are 0.992 and 0.950, respectively. Table 6 presents model parameter values of a total of 12 samples, with which the dynamic modulus and phase angle at arbitrary temperatures and frequencies can be obtained.
Correlations between the dynamic modulus and acoustic properties contribute to a rapid determination of the dynamic modulus from ultrasonic testing. As bulk specific gravity and air void content, regression functions can be built linking the dynamic modulus and wave velocity for different temperatures, frequencies and mixture types. These models require considerable test data and are easy in construction and application. Results are not presented in this paper since the methodology has been described in the previous two sections. Moreover, models built with data available in this study (12 sets) are not representative enough. Instead, a theoretical model for wave velocity in a linear isotropic viscoelastic material as Equation (14) was utilized to compare the dynamic modulus measured and predicted from different tests [26].
C p   =   1 cos φ / 2 1     ν E * 1   +   ν 1     2 ν ρ
where C p = velocity of a compression wave; φ = phase angle; ν = Poisson’s ratio; E * = dynamic modulus magnitude; ρ = material density.
Results of the ultrasonic wave test were used to calculate the dynamic modulus using Equation (15), which is revised from Equation (14).
E *   =   C p cos φ / 2 2 ρ 1   +   ν 1     2 ν 1     ν
The measured dynamic modulus and phase angle were obtained using calibrated Equations (10) and (11) at the corresponding temperature and frequency as in the ultrasonic wave test; measured density was extracted from Table 3. A typical value range 0.15–0.45 was taken for Poisson’s ratio [42].
Figure 8 shows the comparison between the measured and predicted dynamic moduli of a total of 12 samples. The predicted dynamic modulus with the error bar was drawn using the average and standard deviation of values calculated from Equation (15) with different Poisson’s ratio values. It can be observed from the plot that measured values are basically within the predicted ranges. This indicates that implemented with some material properties, the ultrasonic wave test can serve as a rapid method for the dynamic modulus. The accuracy can be further improved by a comprehensive consideration of Poisson’s ratio, which is temperature and frequency dependent as well [42]. Similar analysis and further research can be conducted on results from the P-wave/S-wave test since it records material responses in different directions. Advanced properties such as the anisotropy of asphalt mixtures are likely to be obtained.

5. Conclusions and Future Work

This study aims to build relationships between acoustic, physical and mechanical properties of asphalt mixtures. Traditional material property tests and ultrasonic wave tests were conducted on 12 asphalt mixtures of four different types. Regression models were established between wave velocity and material physical properties. A theoretical model was utilized to process the ultrasonic wave test results to predict the dynamic modulus specified in the traditional test. Main conclusions drawn in this study are summarized as follows:
  • Linear function can describe the positive correlation between ultrasonic wave velocity and bulk specific gravity. The R2 of the fitting function ranges between 0.60–0.70. This correlation is negatively affected by the increase in the test frequency.
  • Linear function can describe the negative correlation between ultrasonic wave velocity and air void content. The R2 of the fitting function ranges between 0.75–0.85.
  • The dynamic modulus of asphalt mixtures can be predicted from a theoretical model for wave velocity in a linear isotropic viscoelastic material. With density, Poisson’s ratio, phase angle and ultrasonic wave velocity, a similar dynamic modulus can be obtained as from the laboratory dynamic modulus test.
Results in this study indicate that ultrasonic testing can serve as a rapid tool to obtain the physical and mechanical properties of asphalt mixtures. For future research, more numbers and types of asphalt binders, aggregates and properties should be considered for a comprehensive investigation of the relationships between the physical, mechanical and acoustic properties of asphalt mixtures. Moreover, samples with different damage types and degrees can be characterized using ultrasonic testing to extend its applications in the laboratory and field.

Author Contributions

Methodology, S.H. and Y.D.; software, S.H., Y.D. and R.J.; validation, S.H., Y.D., R.J., X.S. and X.L.; formal analysis, S.H., Y.D., R.J., X.S. and X.L.; resources, S.H.; data curation, S.H. and Y.D.; writing—original draft preparation, S.H., Y.D. and R.J.; writing—review and editing, Y.D., X.S. and X.L.; supervision, S.H.; project administration, S.H.; funding acquisition, S.H. All authors have read and agreed to the published version of the manuscript.

Funding

This research was financially support by the Provincial Natural Science Foundation of Jiangsu (No. BK20191362).

Institutional Review Board Statement

Not applicable.

Informed Consent Statement

Not applicable.

Data Availability Statement

Some or all data, models or code that support the findings of this study are available from the corresponding author upon reasonable request.

Conflicts of Interest

The authors declare that they have no conflict of interest.

References

  1. Wu, H.; Li, P.; Nian, T.; Zhang, G.; He, T.; Wei, X. Evaluation of asphalt and asphalt mixtures’ water stability method under multiple freeze-thaw cycles. Constr. Build. Mater. 2019, 228, 117089. [Google Scholar] [CrossRef]
  2. Deng, Y.; Luo, X.; Zhang, Y.; Cai, S.; Huang, K.; Shi, X.; Lytton, R.L. Determination of flexible pavement deterioration conditions using Long-Term Pavement Performance database and artificial intelligence-based finite element model updating. Struct. Control. Health Monit. 2021, 28, e2671. [Google Scholar] [CrossRef]
  3. Deng, Y.; Luo, X.; Wang, H. Backcalculation of damage density of in-service asphalt pavements using artificial intelligence-based finite element model updating. Fatigue Fract. Eng. Mater. Struct. 2022, 45, 671–686. [Google Scholar] [CrossRef]
  4. Hassan, N.A.; Airey, G.D.; Hainin, M.R. Characterisation of micro-structural damage in asphalt mixtures using image analysis. Constr. Build. Mater. 2014, 54, 27–38. [Google Scholar] [CrossRef]
  5. Deng, Y.; Luo, X.; Zhang, Y.; Lytton, R.L. Determination of complex modulus gradients of flexible pavements using falling weight deflectometer and artificial intelligence. Mater. Struct. 2020, 53, 1–17. [Google Scholar] [CrossRef]
  6. Moavenzadeh, F.; McMaster, R.C. Potential Uses of Sonic and Ultrasonic Devices in Highway Construction; The Ohio State University: Washington, DC, USA, 1966. [Google Scholar]
  7. George, B.; Arfken, D.F.; Griffing, D.C.; Kelly, J.P. Mechanical Waves; University Physics, Academic Press: Cambridge, MA, USA, 1984; pp. 344–360. [Google Scholar]
  8. McGovern, M.E.; Behnia, B.; Buttlar, W.G.; Reis, H. Use of nonlinear acoustic measurements for estimation of fracture performance of aged asphalt mixtures. Transp. Res. Rec. 2017, 2631, 11–19. [Google Scholar] [CrossRef]
  9. Qiu, X.; Xu, J.; Xiao, S.; Yang, Q. Acoustic emission parameters and waveforms characteristics of fracture failure process of asphalt mixtures. Constr. Build. Mater. 2019, 215, 135–147. [Google Scholar] [CrossRef]
  10. Qiu, X.; Xu, J.; Xu, W.; Xiao, S.; Wang, F.; Yuan, J. Characterization of fatigue damage mechanism of asphalt mixtures with acoustic emission. Constr. Build. Mater. 2020, 240, 117961. [Google Scholar] [CrossRef]
  11. Maillard, S.; de la Roche, C.; Hammoum, F.; Gaillet, L.; Such, C. Experimental investigation of fracture and healing at pseudo-contact of two aggregates. In Proceedings of the 3rd Euroasphalt and Eurobitume Congress, Vienna, Austria, 12–14 May 2004; Foundation Eurasphalt: Ermelo, The Netherlands, 2004. [Google Scholar]
  12. Chang, W. Application of Acoustic Emission to Study the Cohesive and Adhesive Strength of Asphalt; University of Southern California: Washington, DC, USA, 1994. [Google Scholar]
  13. Cheng, Y.; Zhang, P.; Jiao, Y.; Wang, Y.; Tao, J. Damage simulation and ultrasonic detection of asphalt mixture under the coupling effects of water-temperature-radiation. Adv. Mater. Sci. Eng. 2013, 2013, 838943. [Google Scholar] [CrossRef] [Green Version]
  14. Birgisson, B.; Roque, R.; Page, G.C. Ultrasonic pulse wave velocity test for monitoring changes in hot-mix asphalt mixture integrity from exposure to moisture. Transp. Res. Rec. 2003, 1832, 173–181. [Google Scholar] [CrossRef]
  15. Cui, X.; Zhang, J.; Zhang, N.; Zhou, Y.; Gao, Z.; Sui, W. Laboratory simulation tests of effect of mechanical damage on moisture damage evolution in hot-mix asphalt pavement. Int. J. Pavement Eng. 2015, 16, 699–709. [Google Scholar] [CrossRef]
  16. Dovom, H.A.; Moghaddam, A.M.; Karrabi, M.; Shahnavaz, B. Improving the resistance to moisture damage of cold mix asphalt modified by eco-friendly Microbial Carbonate Precipitation (MCP). Constr. Build. Mater. 2019, 213, 131–141. [Google Scholar] [CrossRef]
  17. Mallick, R.B.; Nivedya, M.; Veeraragavan, R.; Nazarian, S.; Tirado, C. An alternative approach to testing of moisture susceptibility of recycled pavement materials. J. Clean. Prod. 2019, 224, 583–591. [Google Scholar] [CrossRef]
  18. Pan, W.; Sun, X.; Wu, L.; Yang, K.; Tang, N. Damage Detection of Asphalt Concrete Using Piezo-Ultrasonic Wave Technology. Materials 2019, 12, 443. [Google Scholar] [CrossRef] [PubMed] [Green Version]
  19. Meng, A.; Xu, H.; Feng, X.; Tan, Y. Feasibility of freeze-thaw damage analysis for asphalt mixtures through dynamic nondestructive testing. Constr. Build. Mater. 2020, 233, 117220. [Google Scholar] [CrossRef]
  20. Sirin, O.; Ohiduzzaman, M.; Kassem, E.; Hassan, W. Acoustic Performance Evaluation of Dense-Graded Asphalt Pavements in Qatar. Adv. Civ. Eng. 2021, 2021, 5520432. [Google Scholar] [CrossRef]
  21. Sztukiewicz, R. Application of ultrasonic methods in asphalt concrete testing. Ultrasonics 1991, 29, 5–12. [Google Scholar] [CrossRef]
  22. Zargar, M.; Banerjee, S.; Bullen, F.; Ayers, R. An Investigation into the Use of Ultrasonic Wave Transmission Techniques to Evaluate Air Voids in Asphalt. In Global Civil Engineering Conference; Springer: Singapore, 2017; pp. 1427–1439. [Google Scholar]
  23. Sadd, M.H. Elasticity: Theory, Applications, and Numeric; Academic Press: Cambridge, MA, USA, 2009. [Google Scholar]
  24. Tigdemir, M.; Kalyoncuoglu, S.F.; Kalyoncuoglu, U.Y. Application of ultrasonic method in asphalt concrete testing for fatigue life estimation. NDT E Int. 2004, 37, 597–602. [Google Scholar] [CrossRef]
  25. Norambuena-Contreras, J.; Castro-Fresno, D.; Vega-Zamanillo, A.; Celaya, M.; Lombillo-Vozmediano, I. Dynamic modulus of asphalt mixture by ultrasonic direct test. NDT E Int. 2010, 43, 629–634. [Google Scholar] [CrossRef]
  26. Di Benedetto, H.; Sauzéat, C.; Sohm, J. Stiffness of bituminous mixtures using ultrasonic wave propagation. Road Mater. Pavement Des. 2009, 10, 789–814. [Google Scholar] [CrossRef]
  27. Mounier, D.; di Benedetto, H.; Sauzéat, C. Determination of bituminous mixtures linear properties using ultrasonic wave propagation. Constr. Build. Mater. 2012, 36, 638–647. [Google Scholar] [CrossRef]
  28. Larcher, N.; Takarli, M.; Angellier, N.; Petit, C.; Sebbah, H. Towards a viscoelastic mechanical characterization of asphalt materials by ultrasonic measurements. Mater. Struct. 2014, 48, 1377–1388. [Google Scholar] [CrossRef]
  29. Ministry of Communication of PR China. Technical Specification for Construction of Highway Asphalt Pavements; China Communication Press: Beijing, China, 2004. [Google Scholar]
  30. Ministry of Communication of PR China. Standard Test Methods of Bitumen and Bituminous Mixtures for Highway Engineering; China Communication Press: Beijing, China, 2011. [Google Scholar]
  31. ASTM D6925-15; Standard Test Method for Preparation and Determination of the Relative Density of Asphalt Mix Specimens by Means of the Superpave Gyratory Compactor. ASTM International: West Conshohocken, PA, USA, 2015.
  32. Speight, J.G. Test Methods for Aggregate and Asphalt Concrete. In Asphalt Materials Science and Technology; Speight, J.G., Ed.; Butterworth-Heinemann: Oxford, UK, 2016; Chapter 5; pp. 205–251. [Google Scholar]
  33. Deng, Y.; Zhang, Y.; Shi, X.; Hou, S.; Lytton, R.L. Stress–strain dependent rutting prediction models for multi-layer structures of asphalt mixtures. Int. J. Pavement Eng. 2021, 1–18. [Google Scholar] [CrossRef]
  34. American Association of State Highway and Transportation Officials. Standard Method of Test for Determining Dynamic Modulus of Hot Mix Asphalt (HMA); American Association of State Highway and Transportation Officials: Washington, DC, USA, 2011. [Google Scholar]
  35. Deng, Y.; Luo, X.; Gu, F.; Zhang, Y.; Lytton, R.L. 3D simulation of deflection basin of pavements under high-speed moving loads. Constr. Build. Mater. 2019, 226, 868–878. [Google Scholar] [CrossRef]
  36. Deng, Y.; Luo, X.; Zhang, Y.; Lytton, R.L. Evaluation of flexible pavement deterioration conditions using deflection profiles under moving loads. Transp. Geotech. 2021, 26, 100434. [Google Scholar] [CrossRef]
  37. Greenwood, M.S.; Bamberger, J.A. Measurement of viscosity and shear wave velocity of a liquid or slurry for on-line process control. Ultrasonics 2002, 39, 623–630. [Google Scholar] [CrossRef]
  38. Tiab, D.; Donaldson, E.C. Petrophysics: Theory and Practice of Measuring Reservoir Rock and Fluid Transport Properties, 4th ed.; Gulf Professional Publishing: Waltham, MA, USA, 2015. [Google Scholar]
  39. Devore, J.L. Probability and Statistics for Engineering and the Sciences, 8th ed.; Cengage Learning: Boston, MA, USA, 2011. [Google Scholar]
  40. Findley, W.N.; Lai, J.S.; Onaran, K.; Christensen, R. Creep and Relaxation of Nonlinear Viscoelastic Materials with an Introduction to Linear Viscoelasticity; North Holland Publishing Company: Amsterdam, The Netherlands, 1977. [Google Scholar]
  41. Zhang, Y.; Birgisson, B.; Lytton, R.L. Weak form equation–based finite-element modeling of viscoelastic asphalt mixtures. J. Mater. Civ. Eng. 2016, 28, 04015115. [Google Scholar] [CrossRef] [Green Version]
  42. Ling, M.; Deng, Y.; Zhang, Y.; Luo, X.; Lytton, R.L. Evaluation of complex Poisson’s ratio of aged asphalt field cores using direct tension test and finite element simulation. Constr. Build. Mater. 2020, 261, 120329. [Google Scholar] [CrossRef]
Figure 1. Asphalt mixture sample preparation.
Buildings 12 00306 g001
Figure 2. Dynamic modulus and phase angle from mechanical test. (a) Dynamic modulus; (b) Phase angle.
Buildings 12 00306 g002
Figure 3. Acoustic wave test instruments: (a) ZBL-U510 non-metallic ultrasonic detector; (b) sample in the ultrasonic wave test; (c) DB-4D multifunctional sonic detector; (d) sample in the P-wave/S-wave test.
Buildings 12 00306 g003aBuildings 12 00306 g003b
Figure 4. Schematic waveform diagram in ZBL-U510.
Buildings 12 00306 g004
Figure 5. Wave velocity vs. bulk specific gravity: (a) ultrasonic wave test; (b) P-wave test. (c) S-wave test.
Buildings 12 00306 g005aBuildings 12 00306 g005b
Figure 6. Wave velocity vs. air void content: (a) ultrasonic wave test; (b) P-wave test; (c) S-wave test.
Buildings 12 00306 g006aBuildings 12 00306 g006b
Figure 7. Test results and master curve model predictions: (a) dynamic modulus at 18.8 °C; (b) phase angle at 23.1 °C.
Buildings 12 00306 g007
Figure 8. Measured and predicted dynamic modulus.
Buildings 12 00306 g008
Table 2. Information of aggregates and asphalt binder.
AggregatesPassing percentage of sieve size, %26.519.016.013.29.504.752.361.180.600.300.150.075
AC-131001001009576.5533726.51914106
AC-2010095837261413022.516118.55
SMA-131001001009562.52720.51916131210
AM-201009572.562.552.527.513.596.5542.5
Asphalt binderPenetration @ 25 °C, 100 g, 5 s (0.1 mm)Softening point (°C)Ductility @ 10 °C (cm)Density @ 25 °C (g/cm3)Flash point (°C)Kinematic viscosity @ 135 °C (Pa·s)
586258.71.0313212.603
Table 3. Physical properties of asphalt mixtures.
Gradation TypeSample no.Bulk Specific GravityMean ValueMean Value of Theoretical Maximum Specific GravityVoid Ratio (%)Mean Value (%)
AC-1312.6152.6182.6742.182.07
22.6172.13
32.6231.90
AC-2012.5252.5242.6012.912.92
22.5232.97
32.5262.88
SMA-1312.5432.5432.6323.363.38
22.5463.25
32.5393.53
AM-2012.3262.3462.59310.279.52
22.3429.68
32.3708.60
Table 4. Instrument parameters.
Instrument ParameterZBL-U510DB-4D
(Maximum) Sampling length (Kb)0.51232
Sampling period (µs)0.4-
Sampling interval (µs)-0.05
Sampling frequency (MHz)-20
Transducer frequency (KHz)50100
Pulse width (µs)0.040.2
Emission voltage (V)5001000
Number of channels24
Testing temperature (℃)21.8
Table 5. Averaged acoustic properties in two tests.
Sample TypeUltrasonic Wave TestP-Wave/S-Wave Test
T ¯ (µs) V ¯ (km/s) A ¯ (dB) F ¯ (KHz) V ¯ s (km/s) V ¯ p (km/s)
AC-1347.363.09630.2945.722.2683.666
SMA-1349.272.99226.6043.032.1463.536
AC-2045.863.19729.6244.821.9903.812
AM-2053.742.71127.4744.191.8793.245
Table 6. Master curve model parameters of dynamic modulus and phase angle.
PropertyParameterAC-13AC-20SMA-13AM-20
123123123123
Dynamic modulus δ 1.711.391.581.810.701.411.981.402.280.000.020.02
α 2.823.162.892.623.723.032.352.991.994.294.274.19
η −0.35−0.33−0.47−0.31−0.42−0.34−0.34−0.34−0.32−0.47−0.48−0.47
γ 0.570.480.620.520.530.520.590.500.720.470.530.50
a 1.34 × 10−31.18 × 10−31.14 × 10−31.31 × 10−31.35 × 10−31.18 × 10−31.40 × 10−31.13 × 10−32.04 × 10−37.82 × 10−31.06 × 10−31.32 × 10−3
b −0.91−0.83−0.79−0.90−0.92−0.83−0.95−0.79−1.35−0.58−0.73−0.91
c 152.86141.33133.26153.83155.77142.21157.16135.67219.89104.07123.90156.30
Phase angle φ max 35.5633.6022.0531.9631.4029.7229.4230.2630.1545.7736.4437.66
β 0.180.150.170.200.200.180.170.170.170.140.170.17
f 0 0.030.010.020.010.020.020.010.010.014.79 × 10−30.010.02
a 1.24 × 10⁻⁴−1.26 × 10−41.39 × 10−3−3.02 × 10⁻⁴−4.05 × 10⁻⁴−2.74 × 10⁻⁴−4.20 × 10⁻⁴−5.25 × 10−42.40 × 10−4−3.39 × 10−31.04 × 10−42.48 × 10⁻⁴
b −0.18−0.16−0.910.030.100.030.040.13−0.321.75−0.23−0.25
c 43.3058.81147.9717.597.7017.0025.649.3174.54−214.0160.4053.48
Publisher’s Note: MDPI stays neutral with regard to jurisdictional claims in published maps and institutional affiliations.

