
Seismic Wave Attenuation Characteristics from the Ground Motion Spectral Analysis around the Kanto Basin

Abstract
:1. Introduction
2. Methodology
3. Data Set
4. Results and Discussion
5. Conclusions
- (1)
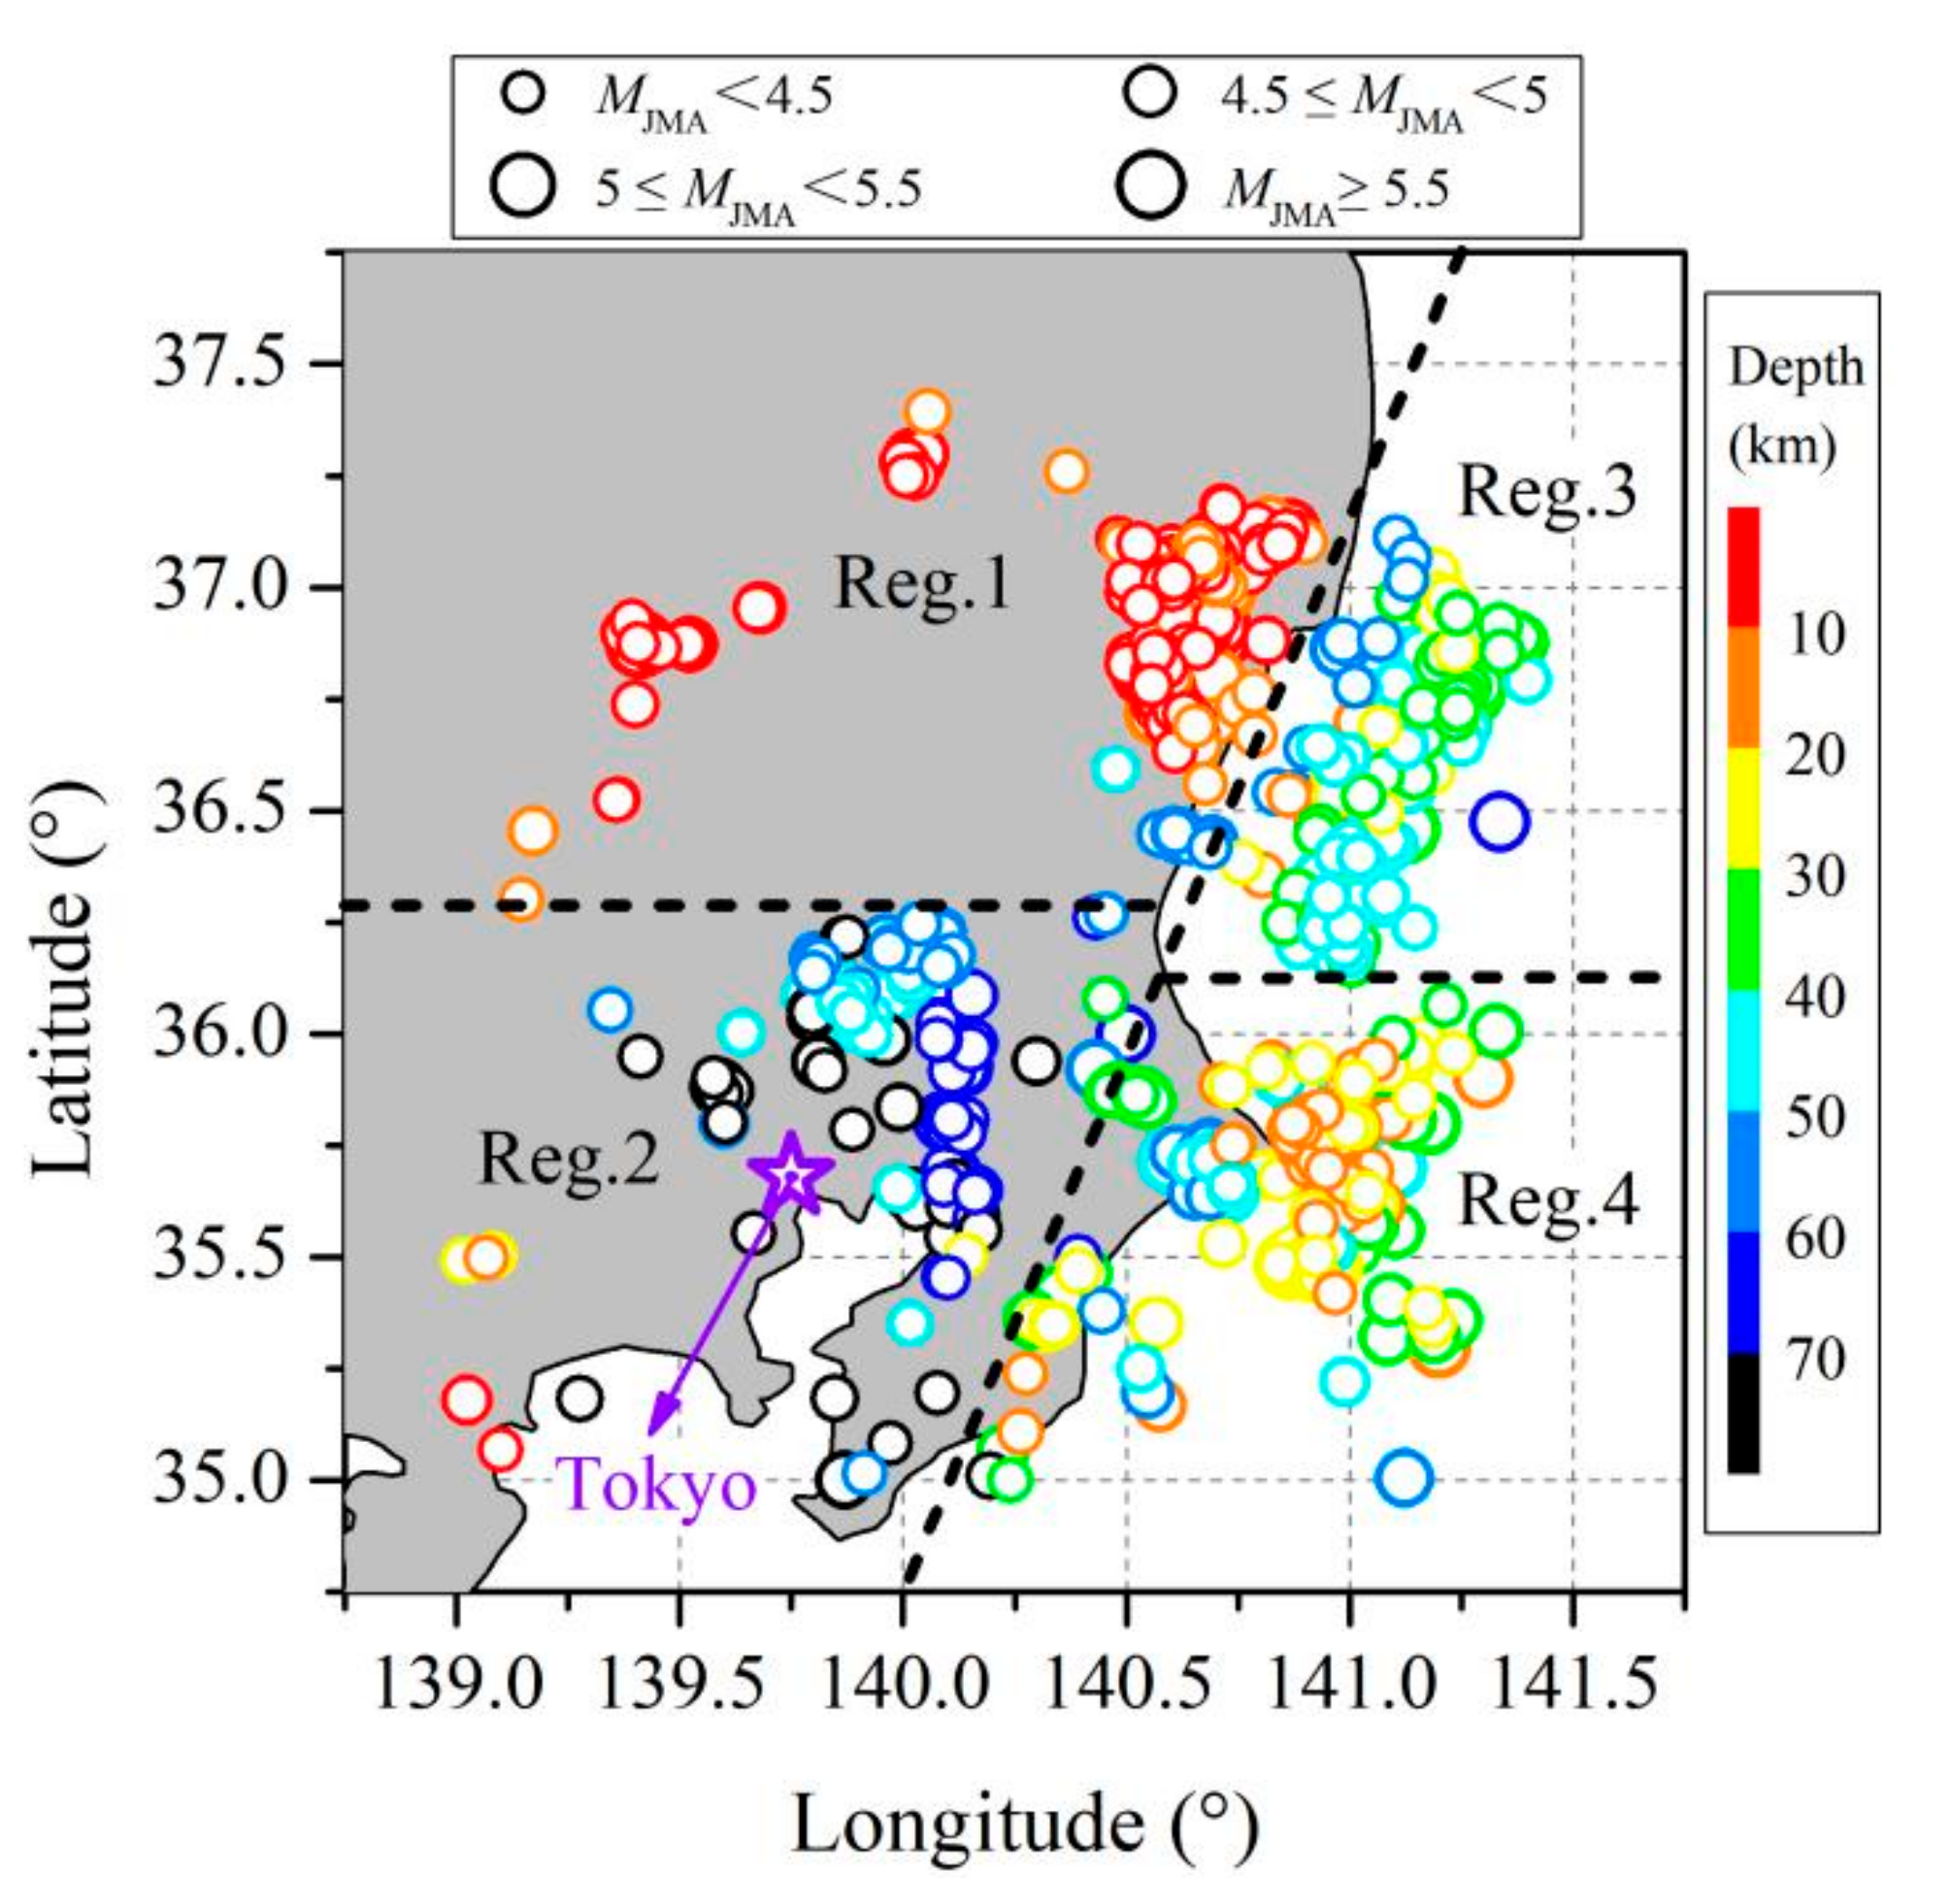
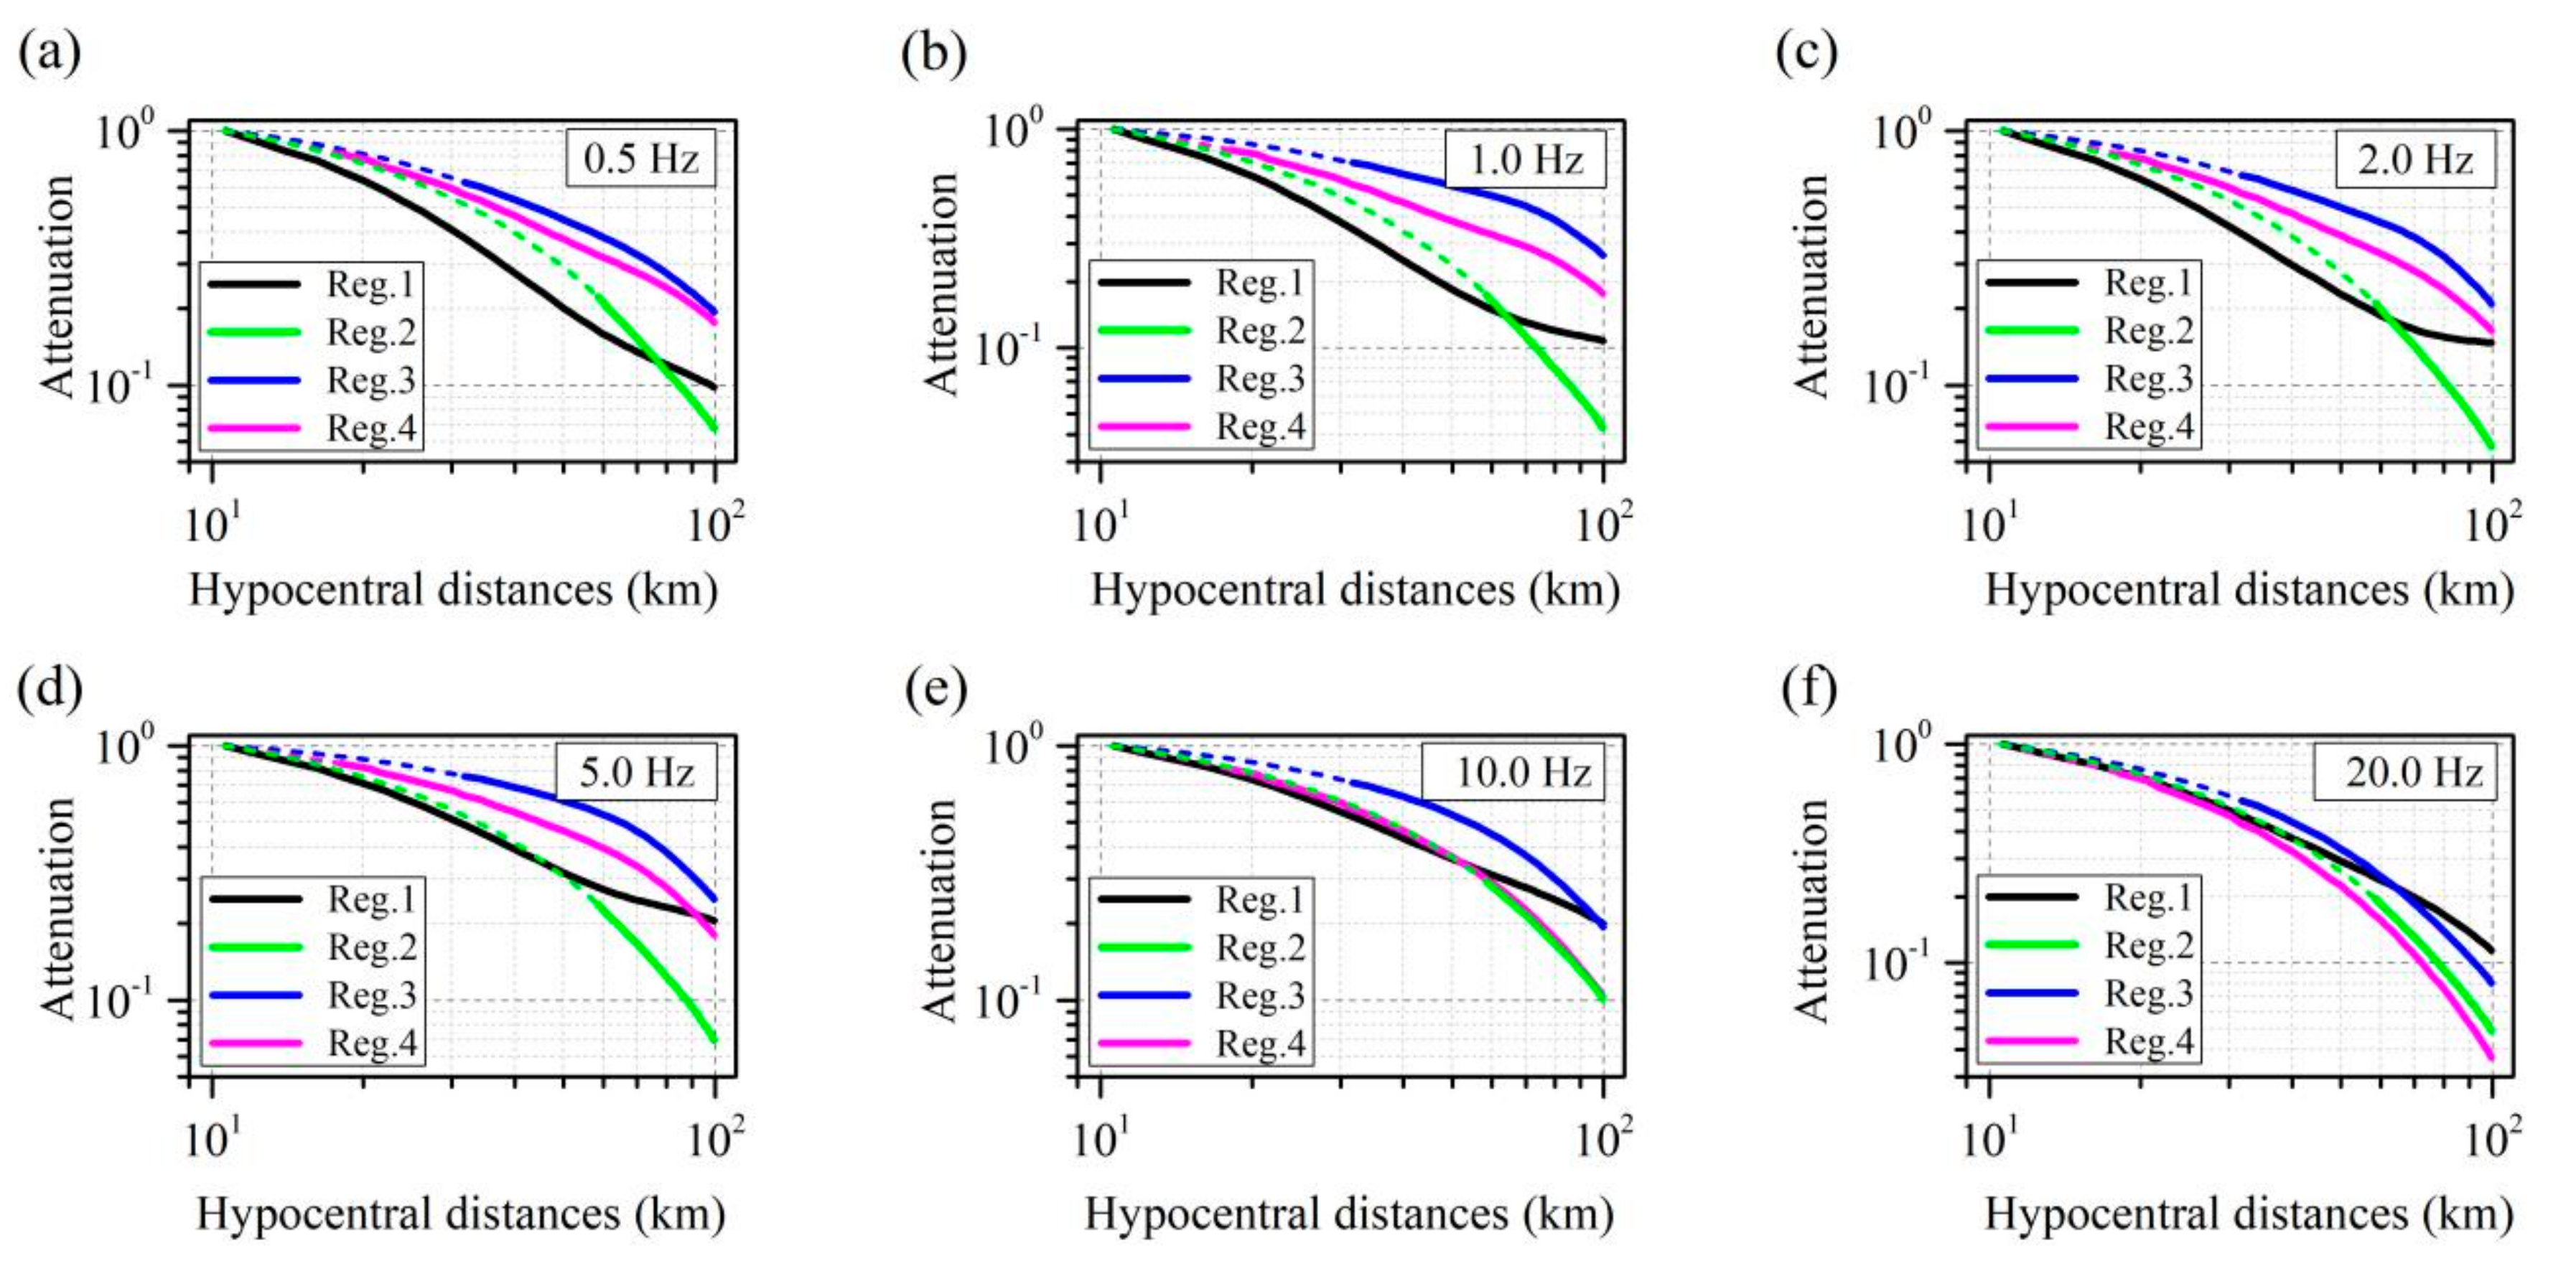
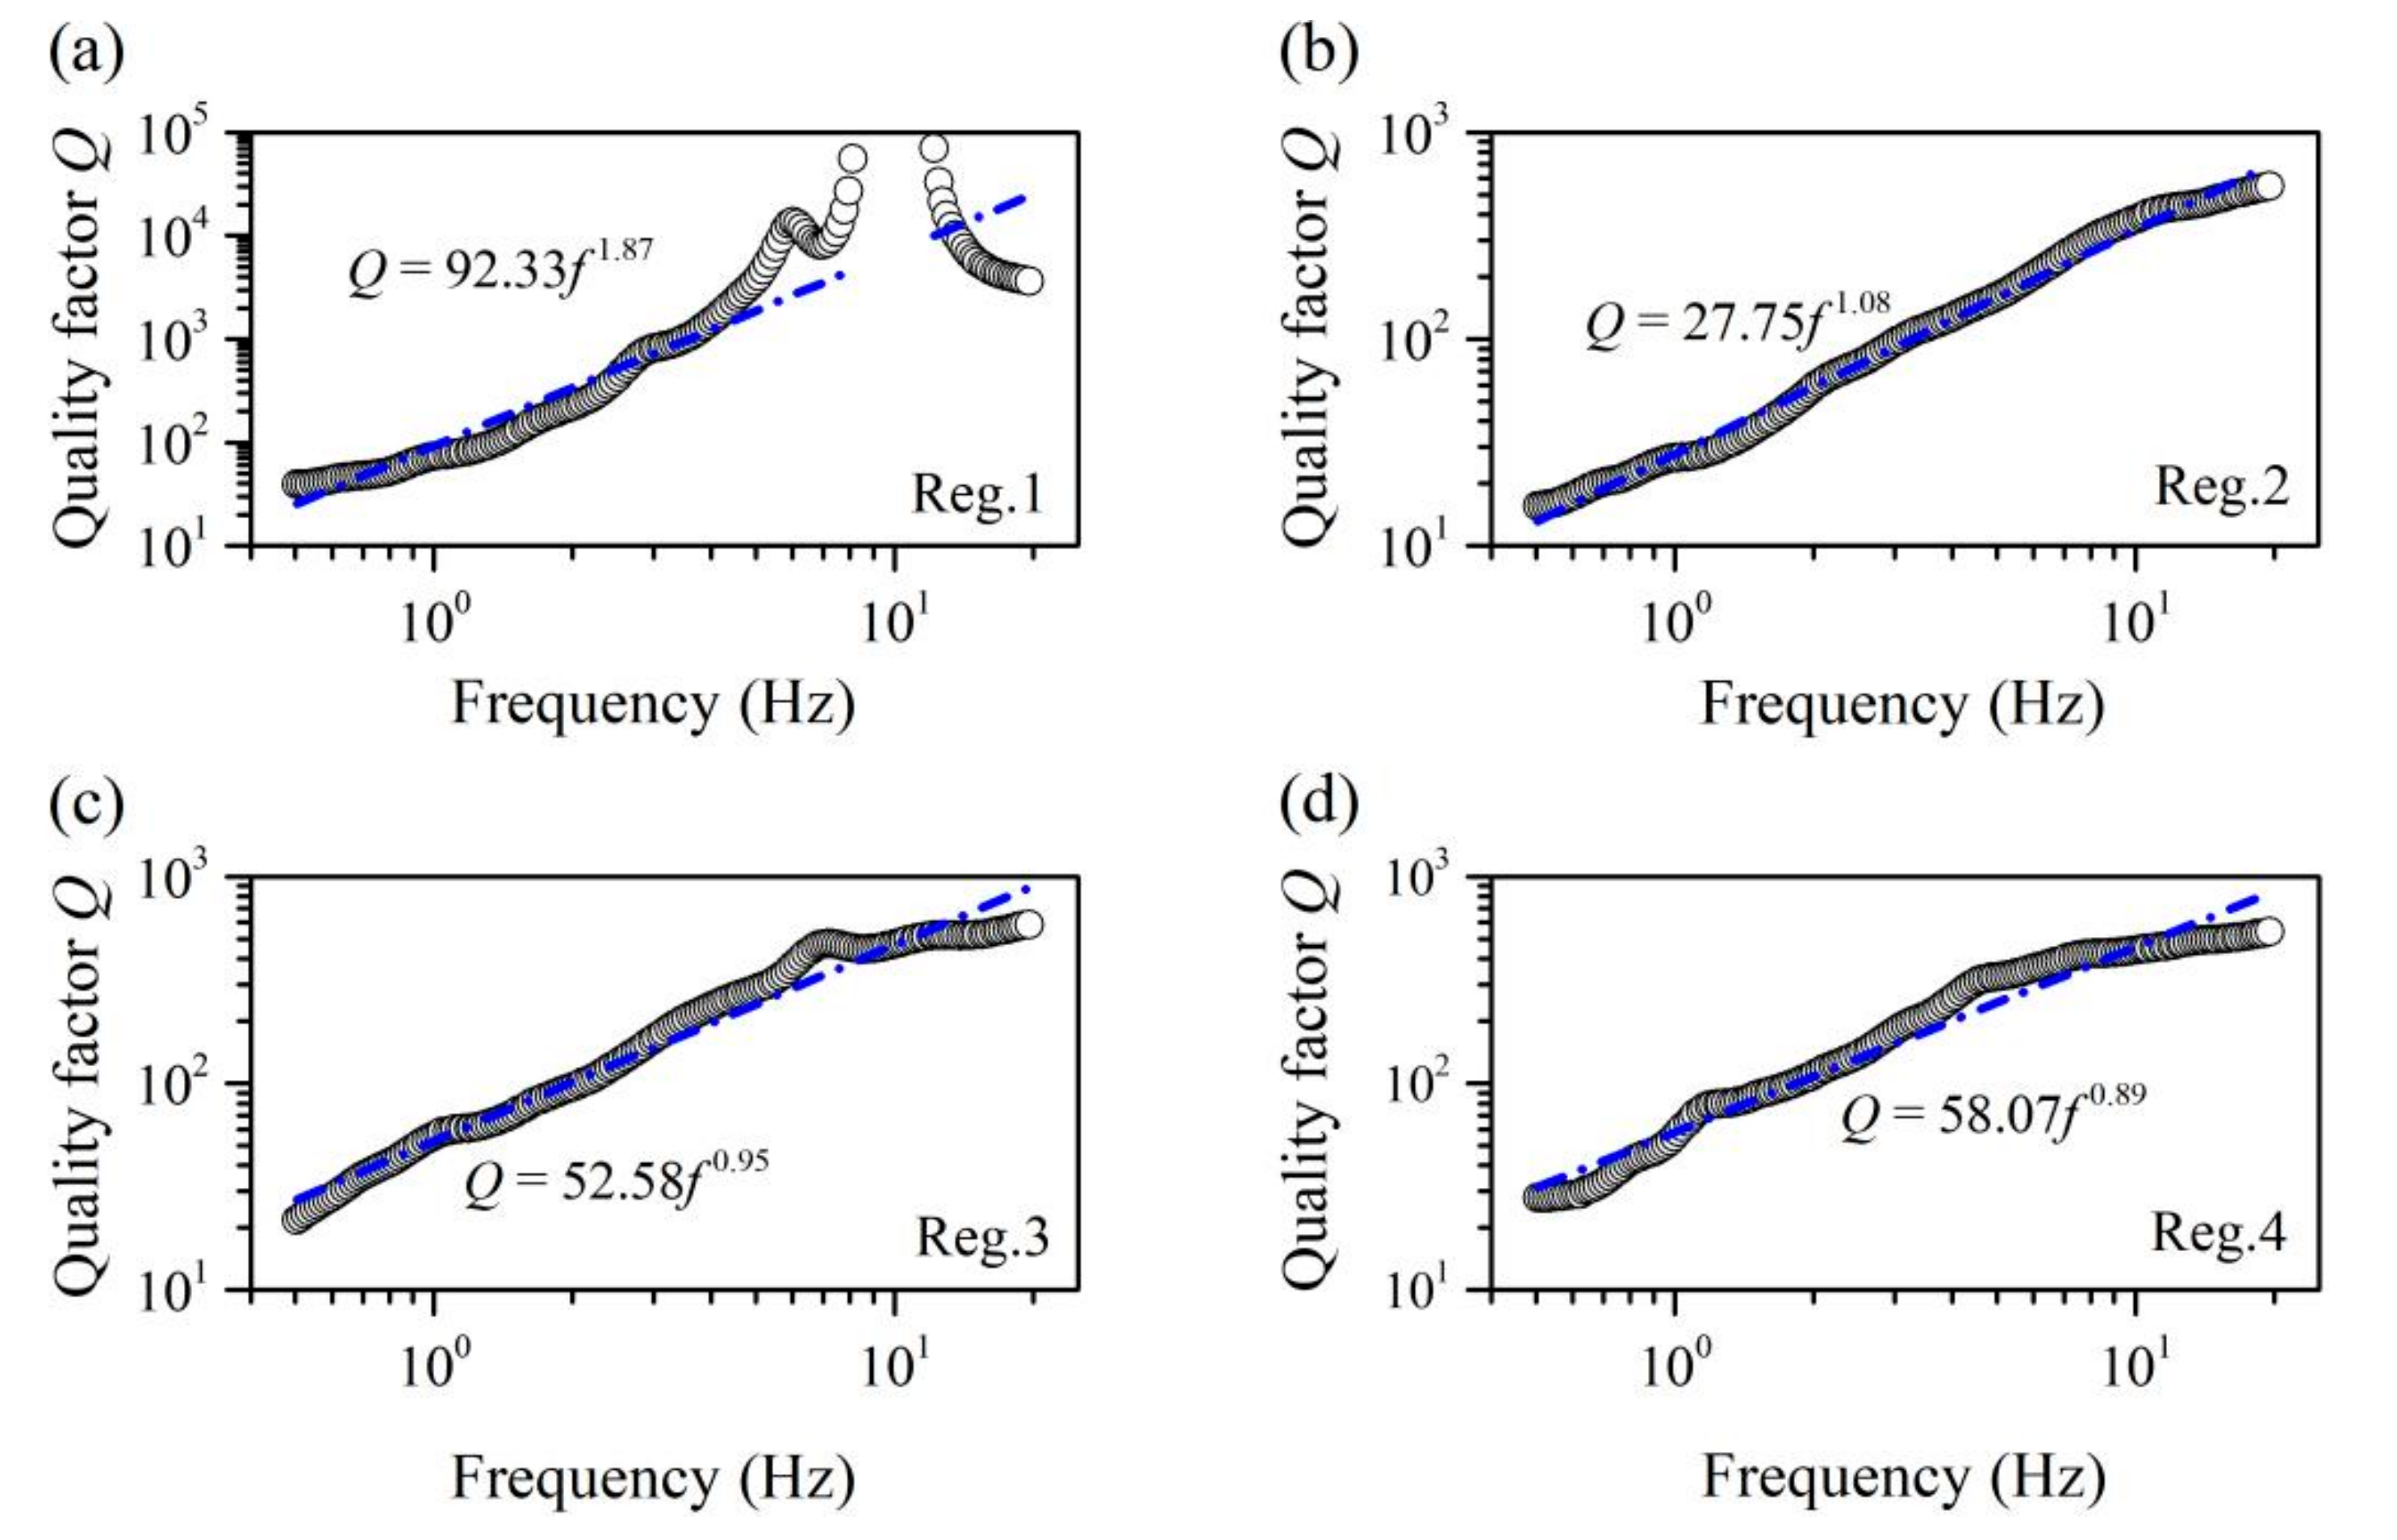
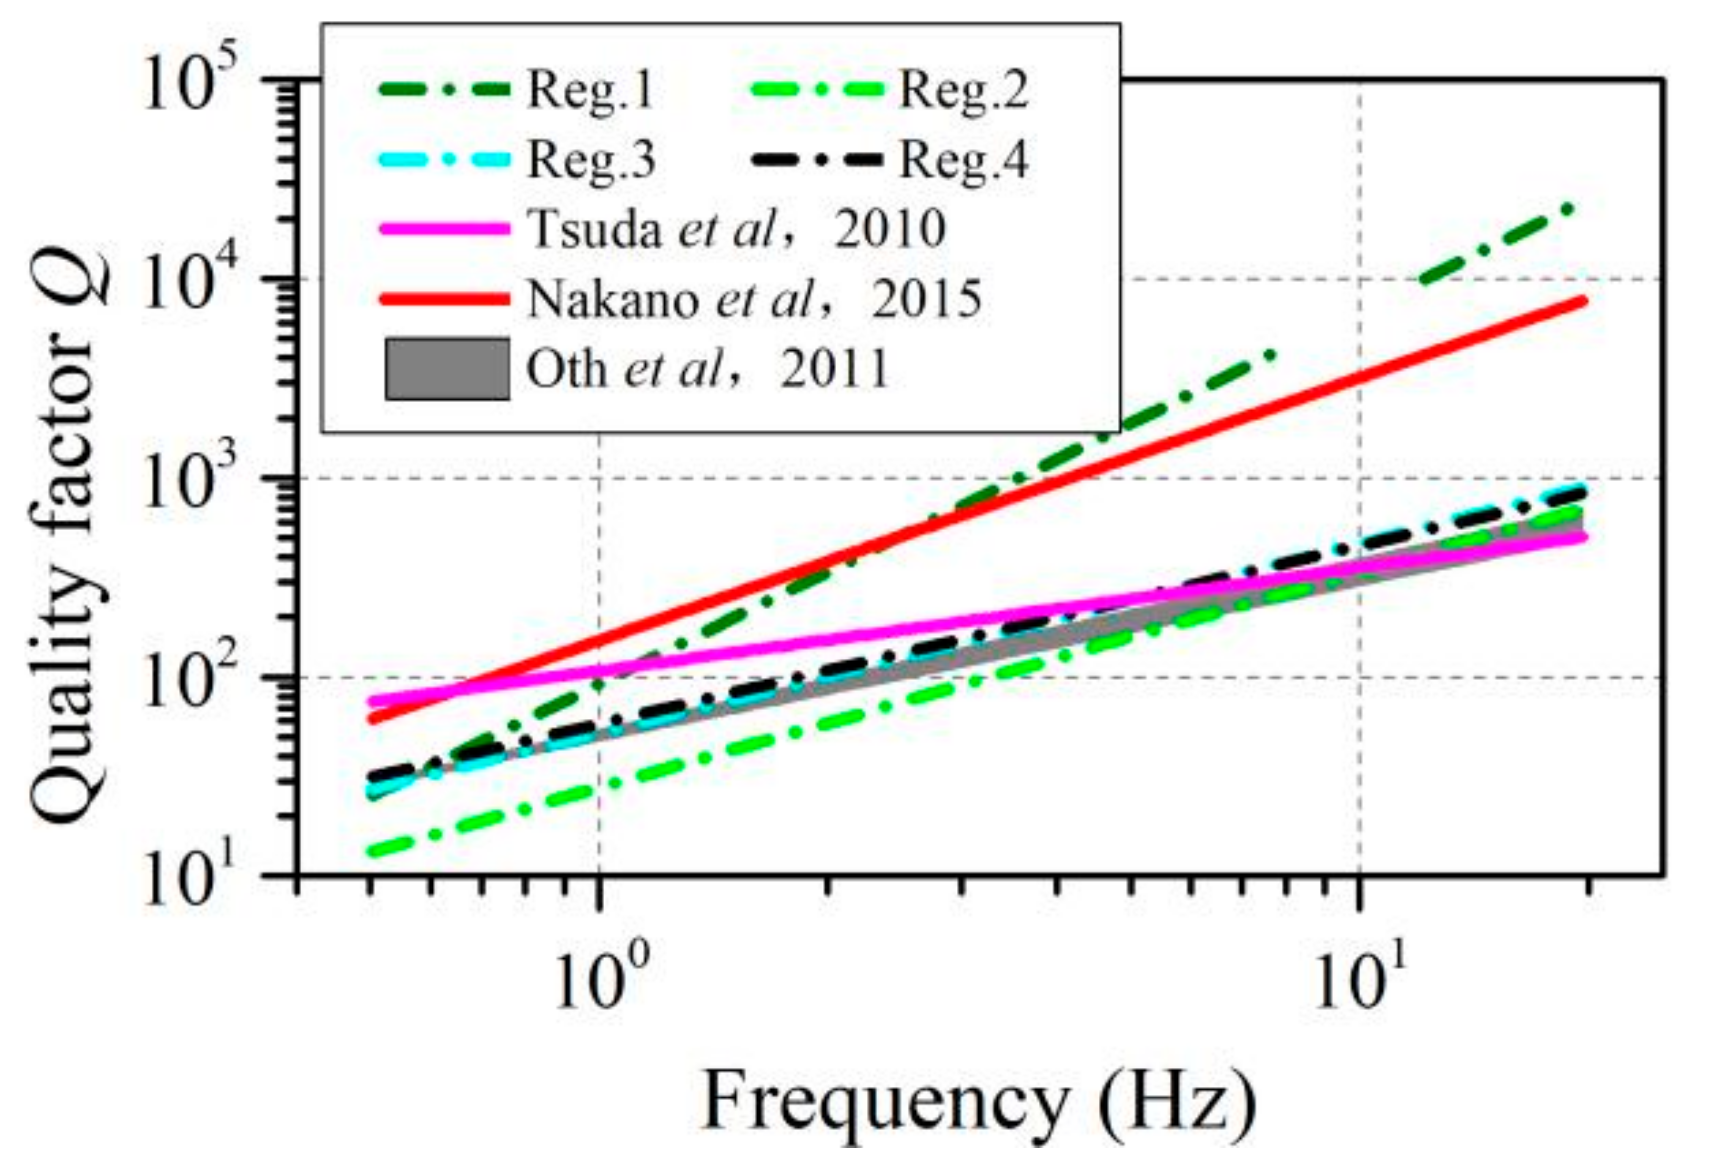
- The epicenter of the earthquake in Reg.1 is located in the shallow crust on the northeast land of the Kanto Basin. The seismic wave path attenuation in Reg.1 is relatively wake, and there is approximately no attenuation over a long distance (>60 km), which may be related to the seismic wave refraction at the crust–mantle boundary. The frequency–dependent inelastic attenuation is 0.5–20 Hz, i.e., quality factor Q = 92.33f1.87.
- (2)
- The epicenter of the earthquake in Reg.2 is located in the upper mantle in the Kanto Basin. Seismic waves generated by earthquakes in Reg2 travel through the upper mantle and crust as they are received by strong–motion stations, traveling a more complex and longer path than Reg.1, resulting in a stronger attenuation. The slope of the path attenuation curve is approximately parallel to R−2.0, and the small quality factor Q = 27.75f1.08.
- (3)
- Reg.3 and Reg.4 are located on the eastern coast of the Kanto Basin, and the earthquake types in the regions are complex, with typical subduction zone characteristics. The attenuation of seismic waves in the subduction zone has an obvious frequency correlation, that is, the higher the frequency, the faster the attenuation, indicating that the seismic attenuation of the subduction zone contains strong inelastic attenuation. The frequency–dependent inelastic attenuation Q of Reg.3 and Reg.4 are 52.58f0.95 and 58.07f0.89, respectively.
Author Contributions
Funding
Institutional Review Board Statement
Informed Consent Statement
Data Availability Statement
Acknowledgments
Conflicts of Interest
References
- Heki, K.; Miyazaki, S.; Tsuji, H. Silent fault slip following an interplate thrust earthquake at the Japan Trench. Nature 1997, 386, 595–598. [Google Scholar] [CrossRef]
- Tsuru, T.; Jin, O.P.; Takahashi, N.; Kodaira, S.; Kido, Y.; Kaneda, Y.; Kono, Y. Tectonic features of the japan trench convergent margin off sanriku, northeastern japan, revealed by multichannel seismic reflection data. J. Geophys. Res. Solid Earth 2000, 105, 16403–16413. [Google Scholar] [CrossRef] [Green Version]
- Yamanaka, Y.; Kikuchi, M. Asperity map along the subduction zone in northeastern Japan inferred from regional seismic data. J. Geophys. Res. Atmos. 2004, 109, 1–14. [Google Scholar] [CrossRef]
- Furlong, K.P.; Lay, T.; Ammom, C.J. A Great Earthquake Rupture across a Rapidly Evolving Three–Plate Boundary. Science 2009, 324, 226–229. [Google Scholar] [CrossRef] [Green Version]
- Hirose, H.; Asano, Y.; Obara, K.; Kimura, T.; Matsuzawa, T.; Tanaka, S.; Maeda, T. Slow Earthquakes Linked Along Dip in the Nankai Subduction Zone. Science 2010, 330, 1502. [Google Scholar] [CrossRef]
- Bilek, S.L.; Lay, T. Variation of interplate fault zone properties with depth in the japan subduction zone. Science 1988, 281, 1175–1178. [Google Scholar] [CrossRef]
- Koketsu, K.; Kikuchi, M. Propagation of seismic ground motion in the Kanto basin, Japan. Science 2000, 288, 1237–1239. [Google Scholar] [CrossRef]
- Nakata, N.; Snieder, R. Time-lapse change in anisotropy in Japan’s near surface caused by the 2011 Tohoku-oki earthquake. Geophys. Res. Lett. 2012, 39, L11313. [Google Scholar] [CrossRef] [Green Version]
- Ishitsuka, K.; Matsuoka, T.; Nishimura, T.; Tsuji, T.; ElGharbawi, T. Ground uplift related to permeability enhancement following the 2011 tohoku earthquake in the kanto plain, Japan. Earth Planets Space 2017, 69, 81. [Google Scholar] [CrossRef] [Green Version]
- Takahashi, M.; Yanagisawa, Y.; Hayashi, H.; Kasahara, K.; Ikawa, T.; Kawanaka, T.; Suda, S. Miocene Subsurface Half–Grabens in the Kanto Plain, Central Japan, International Workshop on Strong Ground Motion Prediction and Earthquake Tectonics in Urban Areas; Earthquake Research Institute, University of Tokyo: Tokyo, Japan, 2004; pp. 65–74. [Google Scholar]
- Sato, H.; Hirata, N.; Koketsu, K.; Okaya, D.; Ave, S.; Kobayashi, R.; Matsubara, M.; Iwasaki, T.; Ito, T.; Ikawa, T.; et al. Earthquake source fault beneath Tokyo. Science 2005, 309, 462–464. [Google Scholar] [CrossRef] [Green Version]
- Abrahamson, N.A.; Silva, W.J. Summary of the Abrahamson &Silva NGA ground–motion relations. Earthq. Spectra 2008, 24, 67–97. [Google Scholar]
- Boore, D.M.; Atkinson, G.M. Ground–motion prediction equations for the average horizontal component of PGA, PGV, and 5% damped PSA at spectral periods between 0.01 s and 10.0 s. Earthq. Spectra 2008, 24, 99–138. [Google Scholar] [CrossRef] [Green Version]
- Campbell, K.W.; Bozorgnia, Y. NGA ground motion model for the geometric mean horizontal component of PGA, PGV, PGD and 5% damped linear elastic response spectra for periods ranging from 0.01 to 10s. Earthq. Spectra 2008, 24, 139–171. [Google Scholar] [CrossRef]
- Chiou BS, J.; Youngs, R.R. An NGA model for the average of horizontal component of peak ground motion and response spectra. Earthq. Spectra 2008, 24, 173–216. [Google Scholar] [CrossRef] [Green Version]
- Atkinson, G.M.; Boore, D.M. Empirical ground–motion relations for subduction–zone earthquakes and their application to Cascadia and other regions. Bull. Seismol. Soc. Am. 2003, 93, 1703–1729. [Google Scholar] [CrossRef]
- McVerry, G.H.; Zhao, J.X.; Abrahamson, N.A. Crustal and subduction zone attenuation relations for New Zealand earthquakes. Bull. New Zeal. Soc. Earthq. Eng. 2006, 39, 1–58. [Google Scholar] [CrossRef] [Green Version]
- Abrahamson, N.A.; Gregor, N.; Addo, K. BC Hydro ground motion prediction equations for subduction earthquakes. Earthq. Spectra 2016, 32, 23–44. [Google Scholar] [CrossRef]
- Idini, B.; Rojas, F.; Ruiz, S.; Pastén, C. Ground motion prediction equations for the Chilean subduction zone. Bull. Earthq. Eng. 2017, 15, 1853–1880. [Google Scholar] [CrossRef]
- Kanno, T.; Narita, A.; Morikawa, N.; Fujiwara, H.; Fukushima, Y. A new attenuation relation for strong ground motion in Japan based on recorded data. Bull. Seismol. Soc. Am. 2006, 96, 879–897. [Google Scholar] [CrossRef]
- Zhao, J.X.; Zhang, J.; Asano, A.; Ohno, Y.; Oouchi, T.; Takahashi, T.; Ogawa, H.; Irikura, K.; Thio, H.K.; Somerville, P.G.; et al. Attenuation relations of strong ground motion in Japan using site classification based on predominant period. Bull. Seismol. Soc. Am. 2006, 96, 898–913. [Google Scholar] [CrossRef]
- Zhao, J.X.; Zhou, S.L.; Gao, P.J.; Long, T.; Zhang, Y.; Thio, H.K.; Lu, M.; Rhoades, D.A. An earthquake classification scheme adapted for japan determined by the goodness of fit for ground-motion prediction equations. Bull. Seismol. Soc. Am. 2015, 105, 2750–2763. [Google Scholar] [CrossRef]
- Zhao, J.X.; Jiang, F.; Shi, P.; Xing, H.; Huang, H.; Huo, R.; Zhang, Y.; Tu, P.; Lan, X.; Rhoades, D.A.; et al. Ground-motion prediction equations for subduction slab earthquakes in Japan using site class and simple geometric attenuation functions. Bull. Seismol. Soc. Am. 2016, 106, 1535–1551. [Google Scholar] [CrossRef]
- Zhao, J.X.; Liang, X.; Jiang, F.; Xing, H.; Zhu, M.; Huo, R.; Zhang, Y.; Lan, X.; Rhoades, D.A.; Irikura, K.; et al. Ground-motion prediction equations for subduction interface earthquakes in Japan using site class and simple geometric attenuation functions. Bull. Seismol. Soc. Am. 2016, 106, 1518–1534. [Google Scholar] [CrossRef]
- Zhao, J.X.; Zhou, S.L.; Zhou, J.; Zhao, C.; Zhang, H.; Zhang, Y.; Gao, P.; Lan, X.; Rhoades, D.; Fukushima, Y.; et al. Ground-motion prediction equations for shallow crustal and upper mantle earthquakes in Japan using site class and simple geometric attenuation functions. Bull. Seismol. Soc. Am. 2016, 106, 1552–1569. [Google Scholar] [CrossRef]
- Frankel, A.; Mcgarr, A.; Bicknell, J.; Mori, J.; Seeber, L.; Cranswick, E. Attenuation of high-frequency shear waves in the crust: Measurements from New York State, South Africa, and southern California. J. Geophys. Res. 1990, 95, 17441–17457. [Google Scholar] [CrossRef]
- Moya, A.; Aguirre, J.; Irikura, K. Inversion of Source Parameters and Site Effects from Strong Ground Motion Records using Genetic Algorithms. Bull. Seismol. Soc. Am. 2000, 90, 977–992. [Google Scholar] [CrossRef] [Green Version]
- Sharma, J.; Chopra, S.; Roy, K.S. Estimation of Source Parameters, Quality Factor (QS), and Site Characteristics Using Accelerograms: Uttarakhand Himalaya Region. Bull. Seismol. Soc. Am. 2014, 104, 360–380. [Google Scholar] [CrossRef]
- Ren, Y.F.; Zhou, Y.; Wang, H.; Wen, R. Source Characteristics, Site Effects, and Path Attenuation from Spectral Analysis of Strong-Motion Recordings in the 2016 Kaikōura Earthquake Sequence Source Characteristics, Site Effects, and Path Attenuation of Strong-Motion Recordings. Bull. Seismol. Soc. Am. 2018, 108, 1757–1773. [Google Scholar] [CrossRef]
- Castro, R.R.; Anderson, J.G.; Singh, S.K. Site response, attenuation and source spectra of S waves along the Guerrero, Mexico, subduction zone. Bull. Seismol. Soc. Am. 1990, 80, 1481–1503. [Google Scholar]
- Bindi, D.; Castro, R.; Franceschina, G.; Luzi, L.; Pacor, F. The 1997–1998 Umbria-Marche sequence (central Italy): Source, path, and site effects estimated from strong motion data recorded in the epicentral area. J. Geophys. Res. 2004, 109, B04312. [Google Scholar] [CrossRef]
- Ahmadzadeh, S.; Parolai, S.; Doloei, J.; Oth, A. Attenuation characteristics, source parameters and site effects from inversion of s waves of the march 31, 2006 silakhor aftershocks. Ann. Geophys. 2017, 60, 6. [Google Scholar] [CrossRef] [Green Version]
- Oth, A.; Bindi, D.; Parolai, S.; Wenzel, F. S-wave attenuation characteristics beneath the vrancea region in romania: New insights from the inversion of ground-motion spectra. Bull. Seismol. Soc. Am. 2008, 98, 2482–2497. [Google Scholar] [CrossRef] [Green Version]
- Oth, A.; Parolai, S.; Bindi, D. Spectral analysis of K-NET and KiK-net data in Japan, part i: Database compilation and peculiarities. Bull. Seismol. Soc. Am. 2011, 101, 652–666. [Google Scholar] [CrossRef]
- Yan, Y.; Hou, X.M.; Fei, H.L. Review of predicting the blast-induced ground vibrations to reduce impacts on ambient urban communities. J. Clean. Prod. 2020, 260, 121135. [Google Scholar] [CrossRef]
- Oth, A.; Bindi, D.; Parolai, S.; Di Giacomo, D. Spectral analysis of K-NET and KiK-net data in Japan, part ii: On attenuation characteristics, source spectra, and site response of borehole and surface stations. Bull. Seismol. Soc. Am. 2011, 101, 667–687. [Google Scholar] [CrossRef]
- Jeong, S.J.; Stump, B.W.; Deshon, H.R. Spectral characteristics of ground motion from induced earthquakes in the fort worth basin, texas, using the generalized inversion technique. Bull. Seismol. Soc. Am. 2020, 110, 5. [Google Scholar] [CrossRef]
- Goulet, A.C.; Kishida, T.; Ancheta, T.D.; Cramer, C.H.; Darragh, R.B.; Silva, W.J.; Hashash, Y.M.A.; Harmon, J.; Stewart, J.P.; Wooddell, K.E.; et al. PEER NGA-East Database, PEER Report No. 2014/17; Pacific Engineering Research Center, University of California: Berkeley, CA, USA, 2014. [Google Scholar]
- Husid, P. Gravity Effects on the Earthquake Response of Yielding Structures; California Institute of Technology: Pasadena, CA, USA, 1967. [Google Scholar]
- McCann, M.W.J.; Shah, H.C. Determining strong motion duration of earthquakes. Bull. Seismol. Soc. Am. 1979, 69, 1253–1265. [Google Scholar]
- Pacor, F.; Spallarossa, D.; Oth, A.; Luzi, L.; Puglia, R.; Cantore, L.; Mercuri, A.; D’Amico, M.; Bindi, D. Spectral models for ground motion prediction in the L’Aquila region (central Italy): Evidence for stress-drop dependence on magnitude and depth. Geophys. J. Int. 2016, 204, 697–718. [Google Scholar] [CrossRef] [Green Version]
- Wang, H.W.; Ren, Y.F.; Wen, R.Z. Source parameters, path attenuation and site effects from strong-motion recordings of the Wenchuan aftershocks (2008–2013) using a non-parametric generalized inversion technique. Geophys. J. Int. 2018, 212, 872–890. [Google Scholar] [CrossRef]
- Zhou, Y.; Wang, H.W.; Wen, R.Z. Insights on nonlinear soil behavior and its variation with time at strong-motion stations during the Mw7.8 Kaikōura, New Zealand earthquake. Soil Dyn. Earthq. Eng. 2020, 136, 106215. [Google Scholar] [CrossRef]
- Zucca, M.; Crespi, P.; Tropeano, G.; Simoncelli, M. On the Influence of Shallow Underground Structures in the Evaluation of the Seismic Signals. Ing. Sismica 2021, 38, 23–35. [Google Scholar]
- Büyüksaraç, A.; Bekler, T.; Demirci, A.; Eyisüren, O. New insights into the dynamic characteristics of alluvial media under the earthquake prone area: A case study for the Çanakkale city settlement (NW of Turkey). Arab. J. Geosci. 2021, 14, 2086. [Google Scholar] [CrossRef]
- Konno, K.; Ohmachi, T. Ground-motion characteristics estimated from ratio between horizontal and vertical components of microtremor. Bull. Seismol. Soc. Am. 1998, 88, 228–241. [Google Scholar] [CrossRef]
- Picozzi, M.; Oth, A.; Parolai, S.; Bindi, D.; De Landro, G.; Amoroso, O. Accurate estimation of seismic source parameters of induced seismicity by a combined approach of generalized inversion and genetic algorithm: Application to the geysers geothermal area, California. J. Geophys. Res. Solid Earth 2017, 122, 3916–3933. [Google Scholar] [CrossRef]
- Abrahamson, A.N.; Silva, W.J. Empirical response spectral attenuation relations for shallow crustal earthquakes. Seismol. Res. Lett. 1997, 68, 94–127. [Google Scholar] [CrossRef] [Green Version]
- Hayes, G.P.; Wald, D.J.; Johnson, R.L. Slab1.0: A three dimensional model of global subduction zone geometries. J. Geophys. Res. 2012, 117, 1–15. [Google Scholar] [CrossRef]
- Tsuda, K.; Koketsu, K.; Hisada, Y.; Hayakawa, T. Inversion analysis of site responses in the kanto basin using data from a dense strong motion seismograph array. Bull. Seismol. Soc. Am. 2010, 100, 1276–1287. [Google Scholar] [CrossRef]
- Nakano, K.; Kawase, H.; Matsushima, S. Statistical properties of strong ground motions from the generalized spectral inversion of data observed by K-NET, KiK-net, and the JMA shindokei network in Japan. Bull. Seismol. Soc. Am. 2015, 105, 2662–2680. [Google Scholar] [CrossRef]


| Region | Crustal | Upper Mantle | Interface | Slab | Unidentified |
|---|---|---|---|---|---|
| Reg.1 | 98 | - | - | - | - |
| Reg.2 | - | 69 | - | - | - |
| Reg.3 | 26 | 90 | 5 | 2 | 12 |
| Reg.4 | 64 | 21 | - | - | 9 |
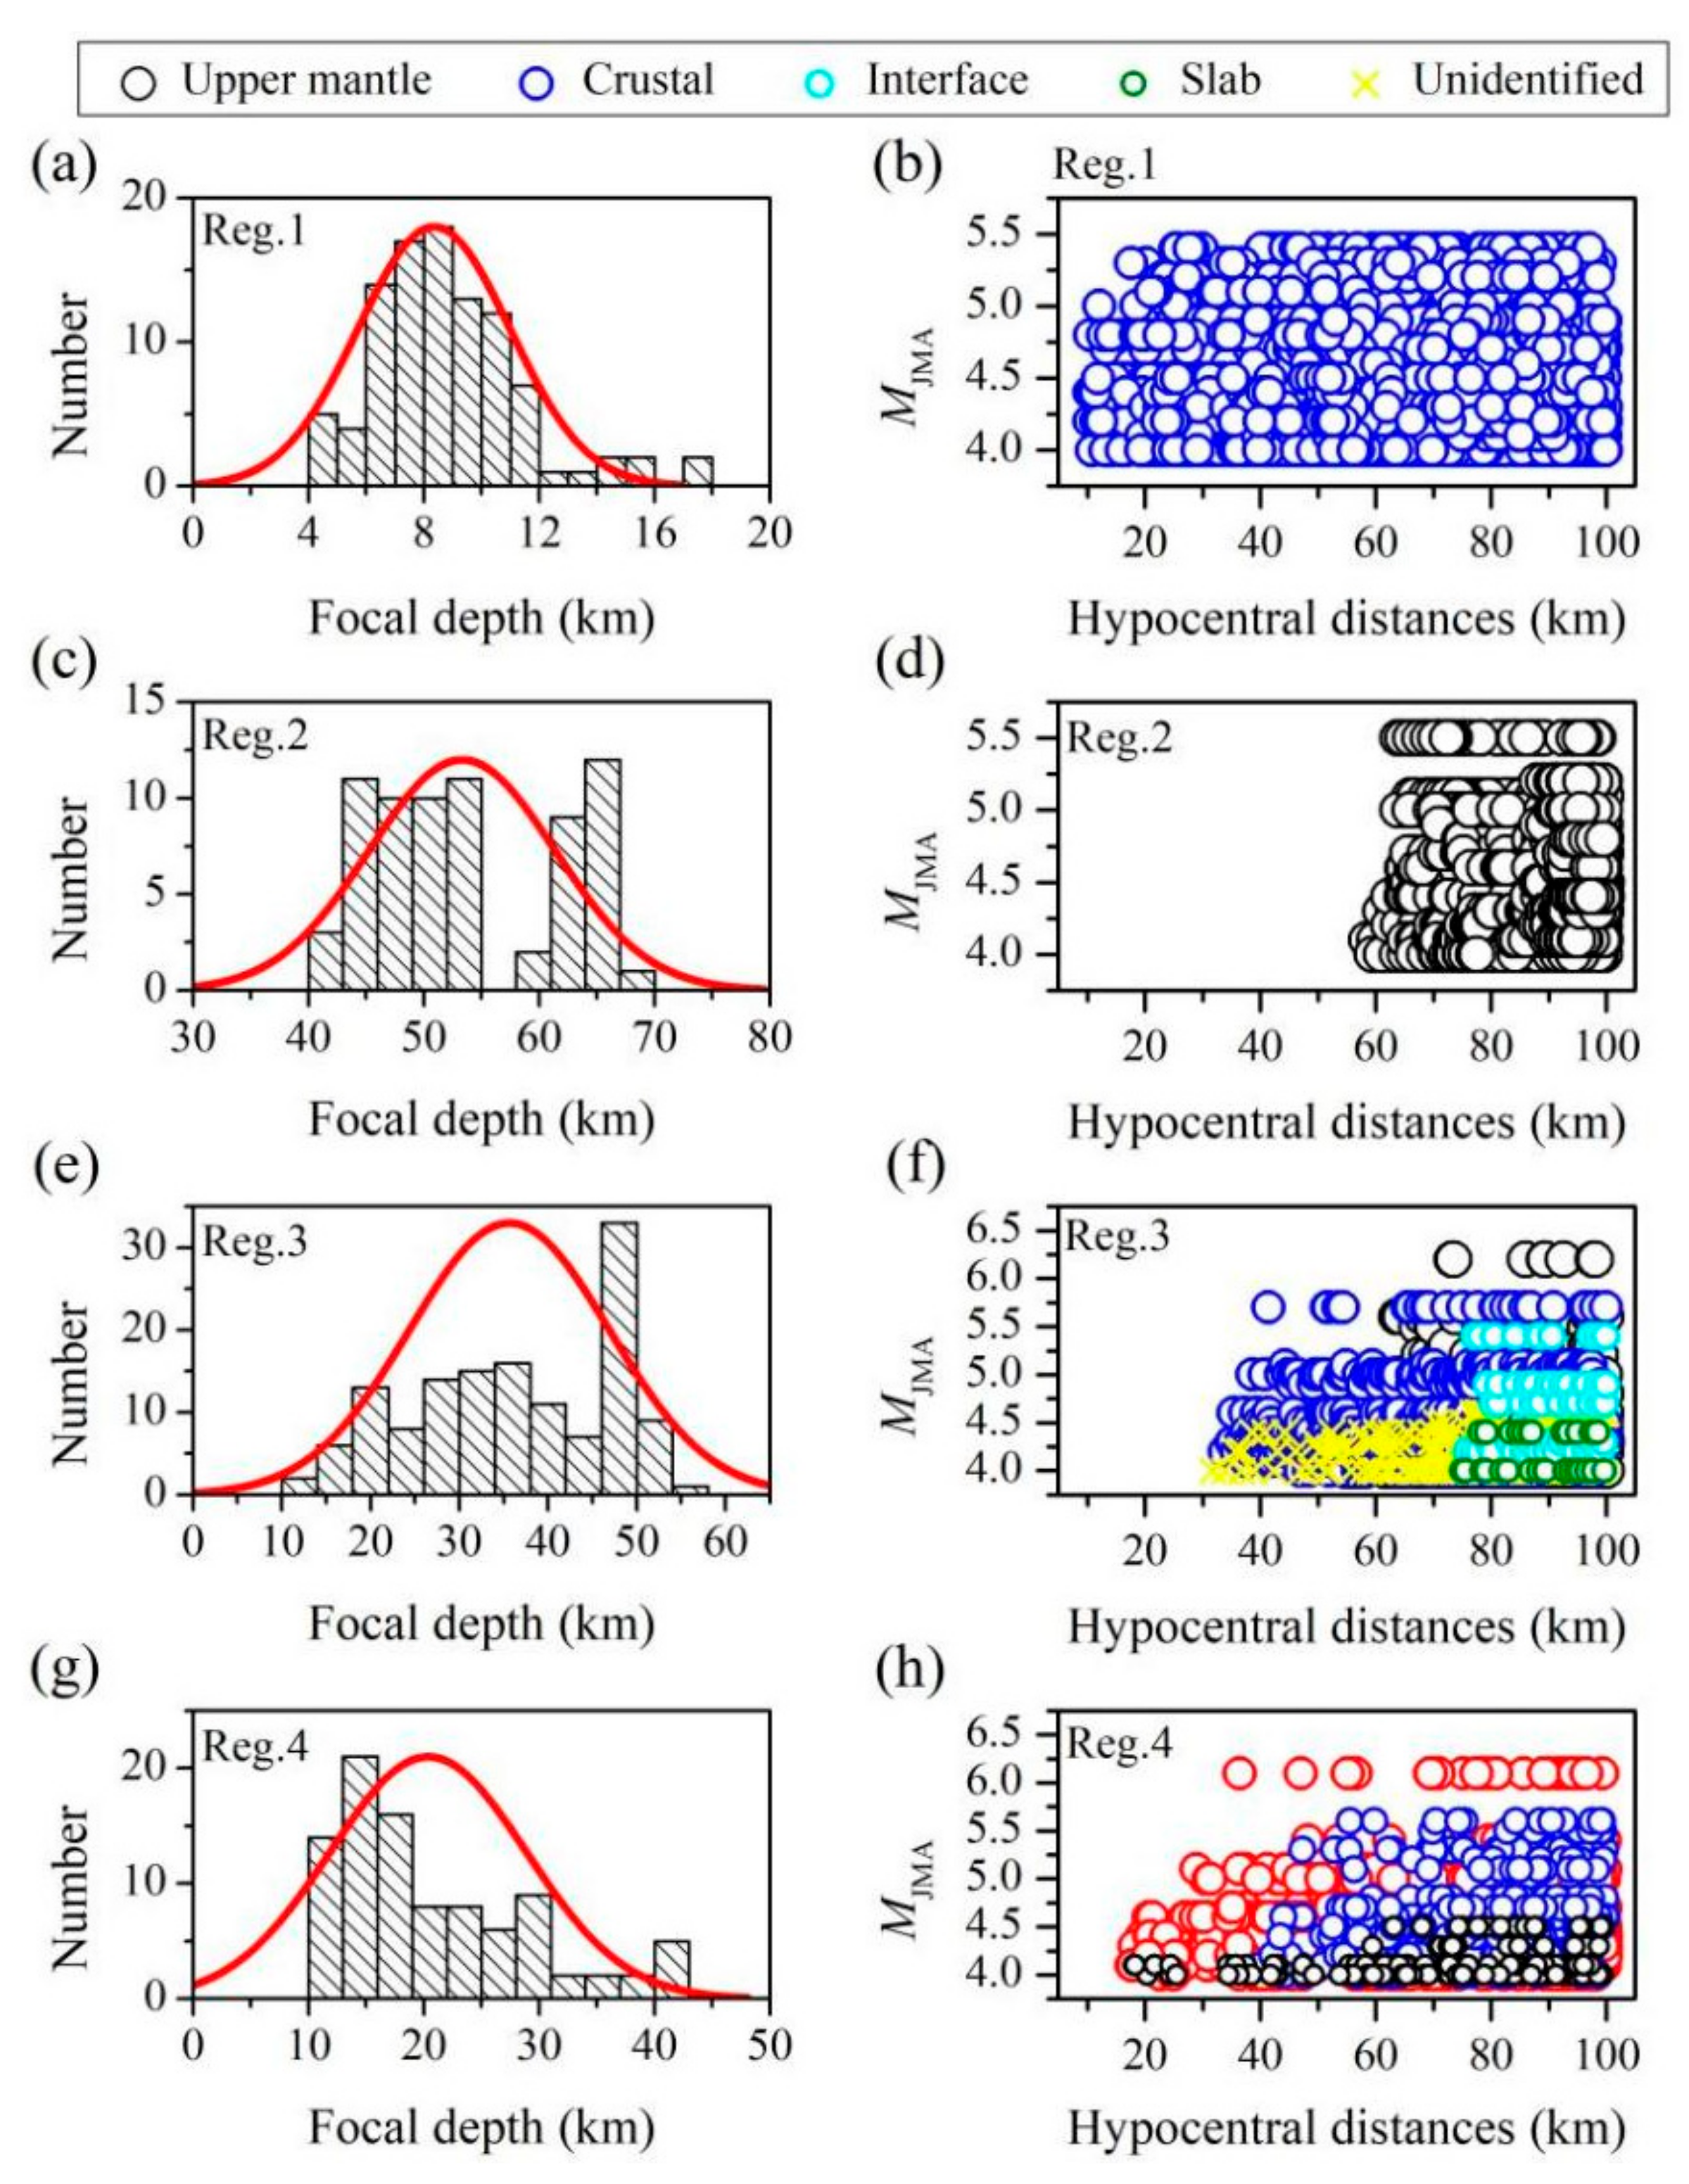
| Region | Number of Recordings | Number of Earthquakes | Magnitude | Focal Depth | Hypocentral Distance |
|---|---|---|---|---|---|
| Reg.1 | 4697 | 98 | MJMA 4–5.4 | 4–17 km | 10–100 km |
| Reg.2 | 2990 | 69 | MJMA 4–5.5 | 41–67 km | 59–100 km |
| Reg.3 | 2412 | 136 | MJMA 4–6.2 | 13–55 km | 10–100 km |
| Reg.4 | 2109 | 94 | MJMA 4–6.1 | 10–43 km | 18–100 km |
Publisher’s Note: MDPI stays neutral with regard to jurisdictional claims in published maps and institutional affiliations. |
© 2022 by the authors. Licensee MDPI, Basel, Switzerland. This article is an open access article distributed under the terms and conditions of the Creative Commons Attribution (CC BY) license (https://creativecommons.org/licenses/by/4.0/).
Share and Cite
Zhou, Y.; Miao, T.; Yang, J.; Wang, X.; Wang, H.; Zheng, W. Seismic Wave Attenuation Characteristics from the Ground Motion Spectral Analysis around the Kanto Basin. Buildings 2022, 12, 318. https://doi.org/10.3390/buildings12030318
Zhou Y, Miao T, Yang J, Wang X, Wang H, Zheng W. Seismic Wave Attenuation Characteristics from the Ground Motion Spectral Analysis around the Kanto Basin. Buildings. 2022; 12(3):318. https://doi.org/10.3390/buildings12030318
Chicago/Turabian StyleZhou, Ying, Tianming Miao, Jian Yang, Xiuli Wang, Hongwei Wang, and Wenzhong Zheng. 2022. "Seismic Wave Attenuation Characteristics from the Ground Motion Spectral Analysis around the Kanto Basin" Buildings 12, no. 3: 318. https://doi.org/10.3390/buildings12030318