
Post-Occupancy Evaluation of the Biophilic Design in the Workplace for Health and Wellbeing


Abstract
:1. Introduction
1.1. Biophilia and Biophilic Design
1.2. Post-Occupancy Evaluation
1.3. Significance of POE in Evaluating Design Impact
1.4. Objectives
2. Methodology
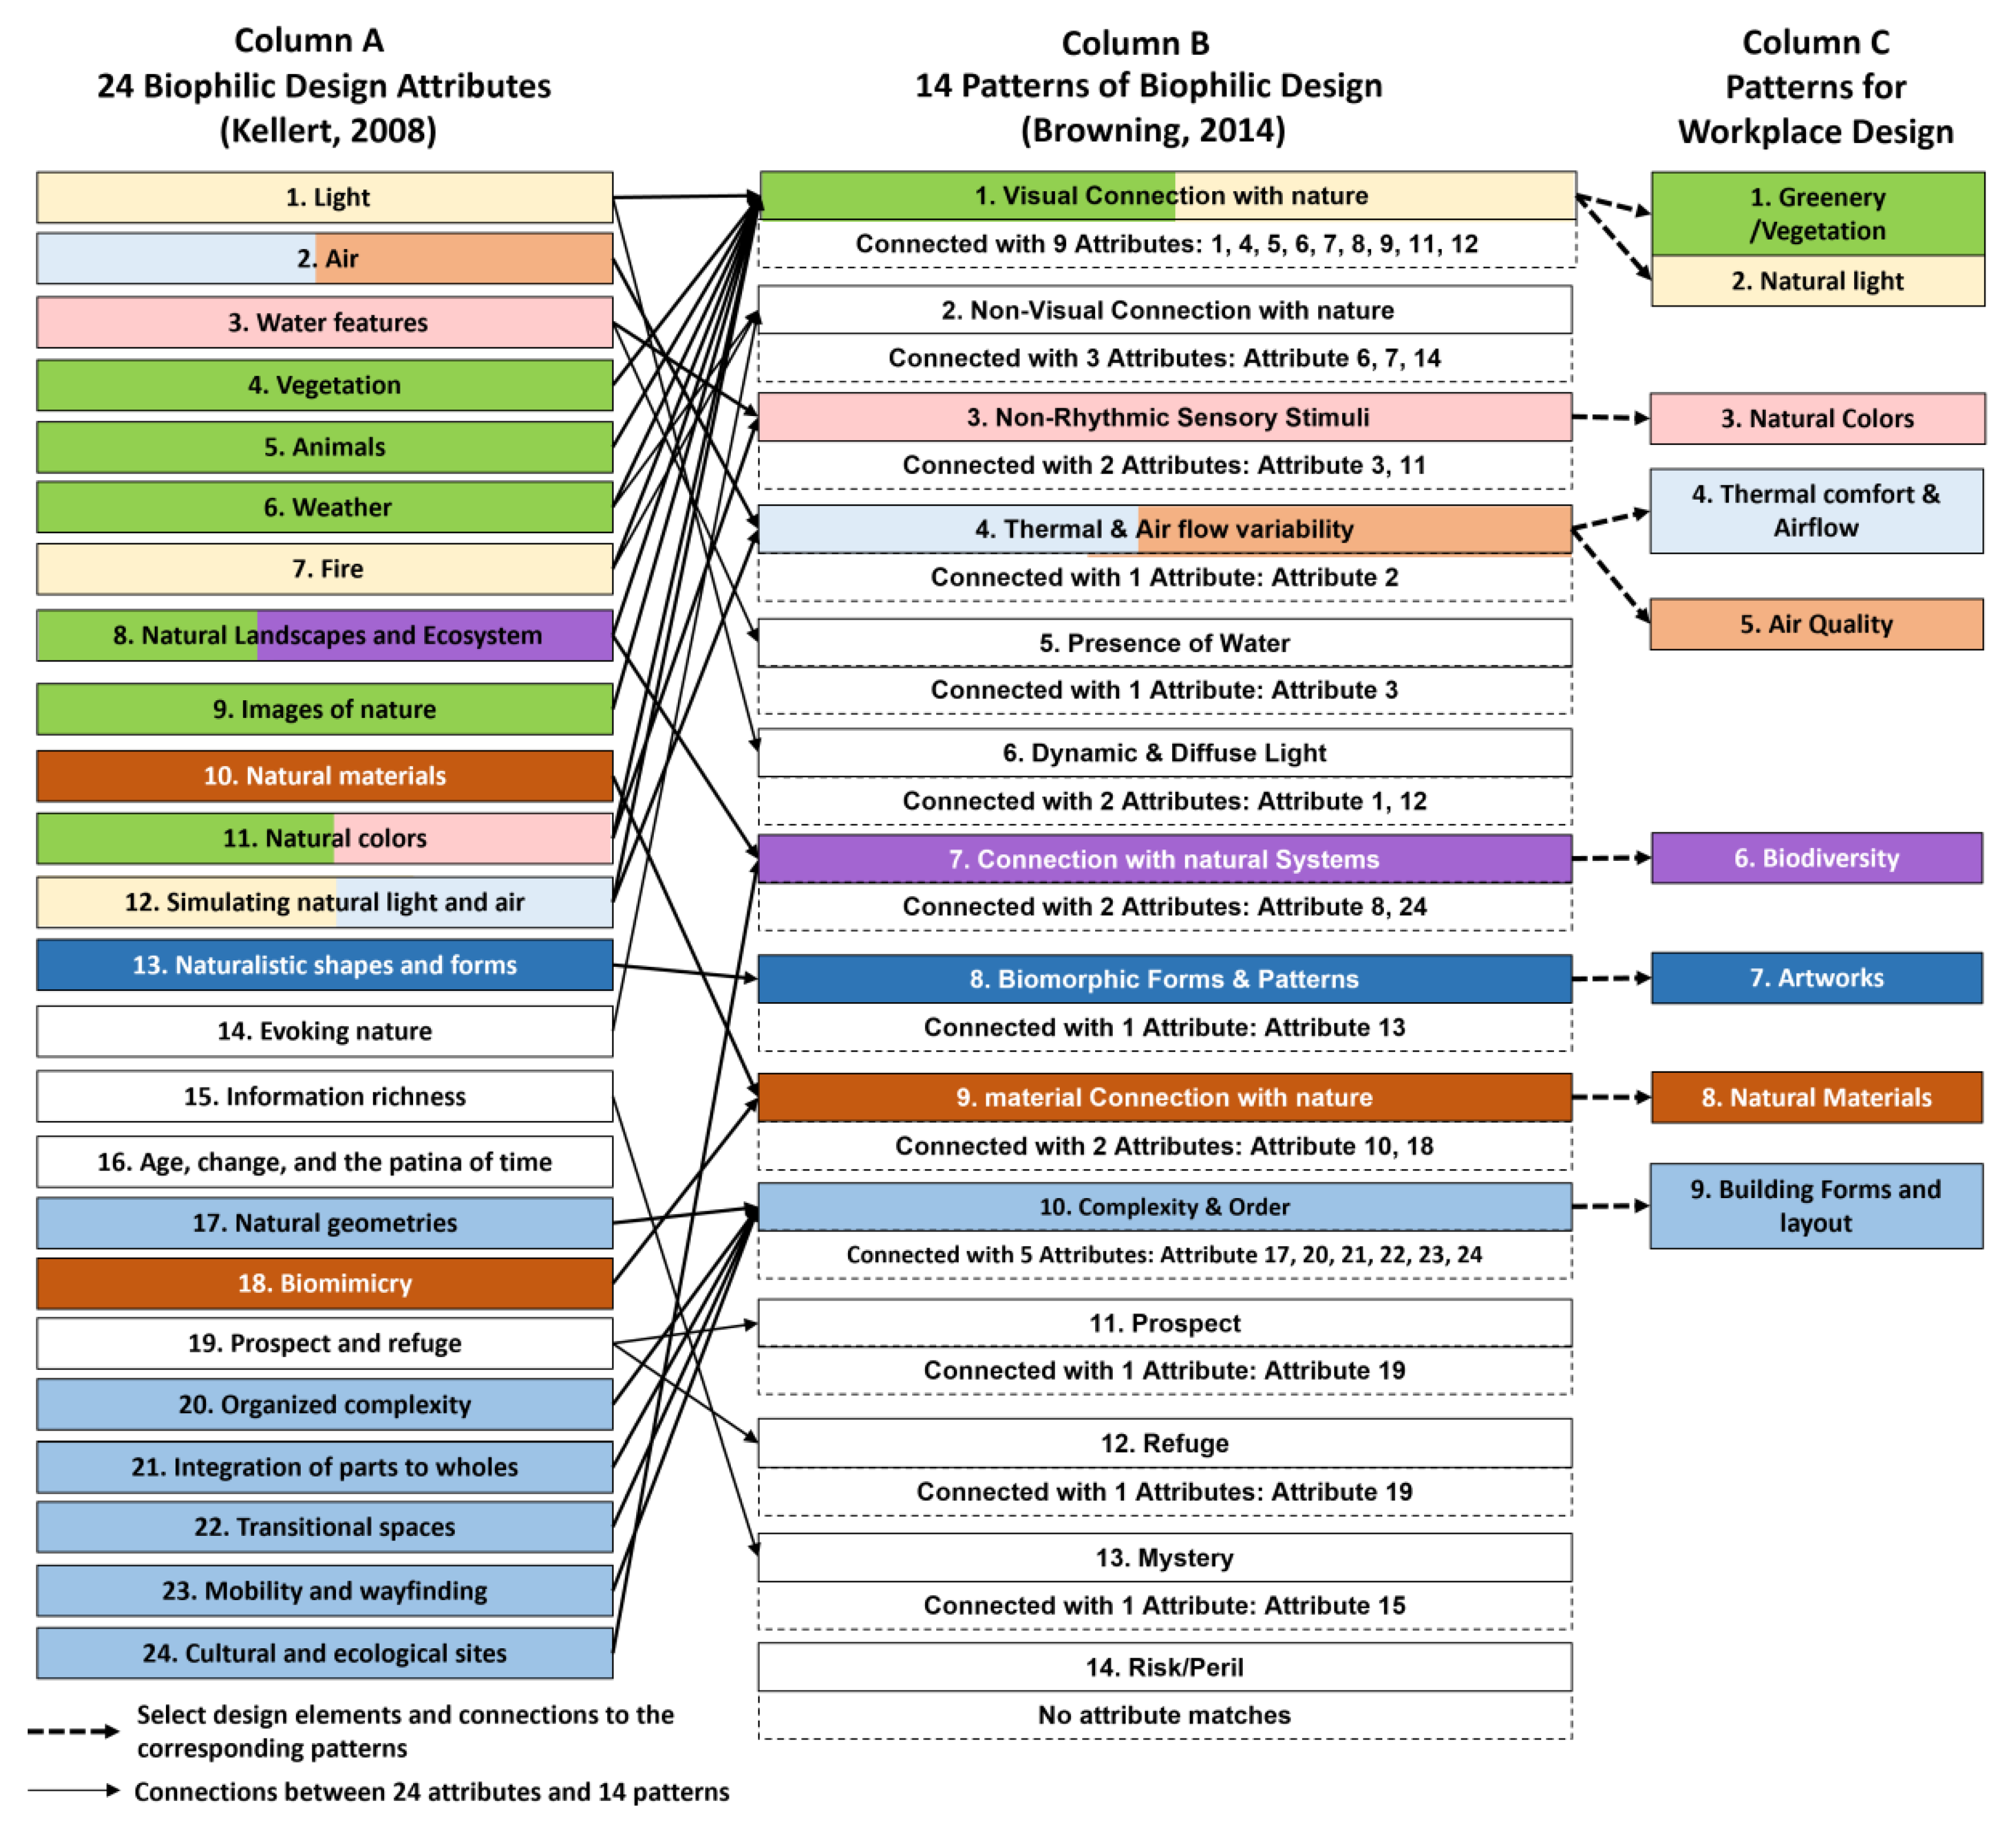
2.1. Biophilic Design Attributes for Workplace
2.2. Evaluation of Biophilic Design Attributes for Workplace by POE
Design Questionnaire for Biophilic Design Evaluation
2.3. Investigate POE Survey
2.3.1. Selected Offices
2.3.2. Observation—Biophilic Design Attributes in Selected Offices
Attribute 1: Greenery/Vegetation
Attribute 4: Thermal Comfort and Airflow and Attribute 5: Air Quality
Attribute 8: Natural Materials
3. Questionnaire Results
3.1. Demographic Information
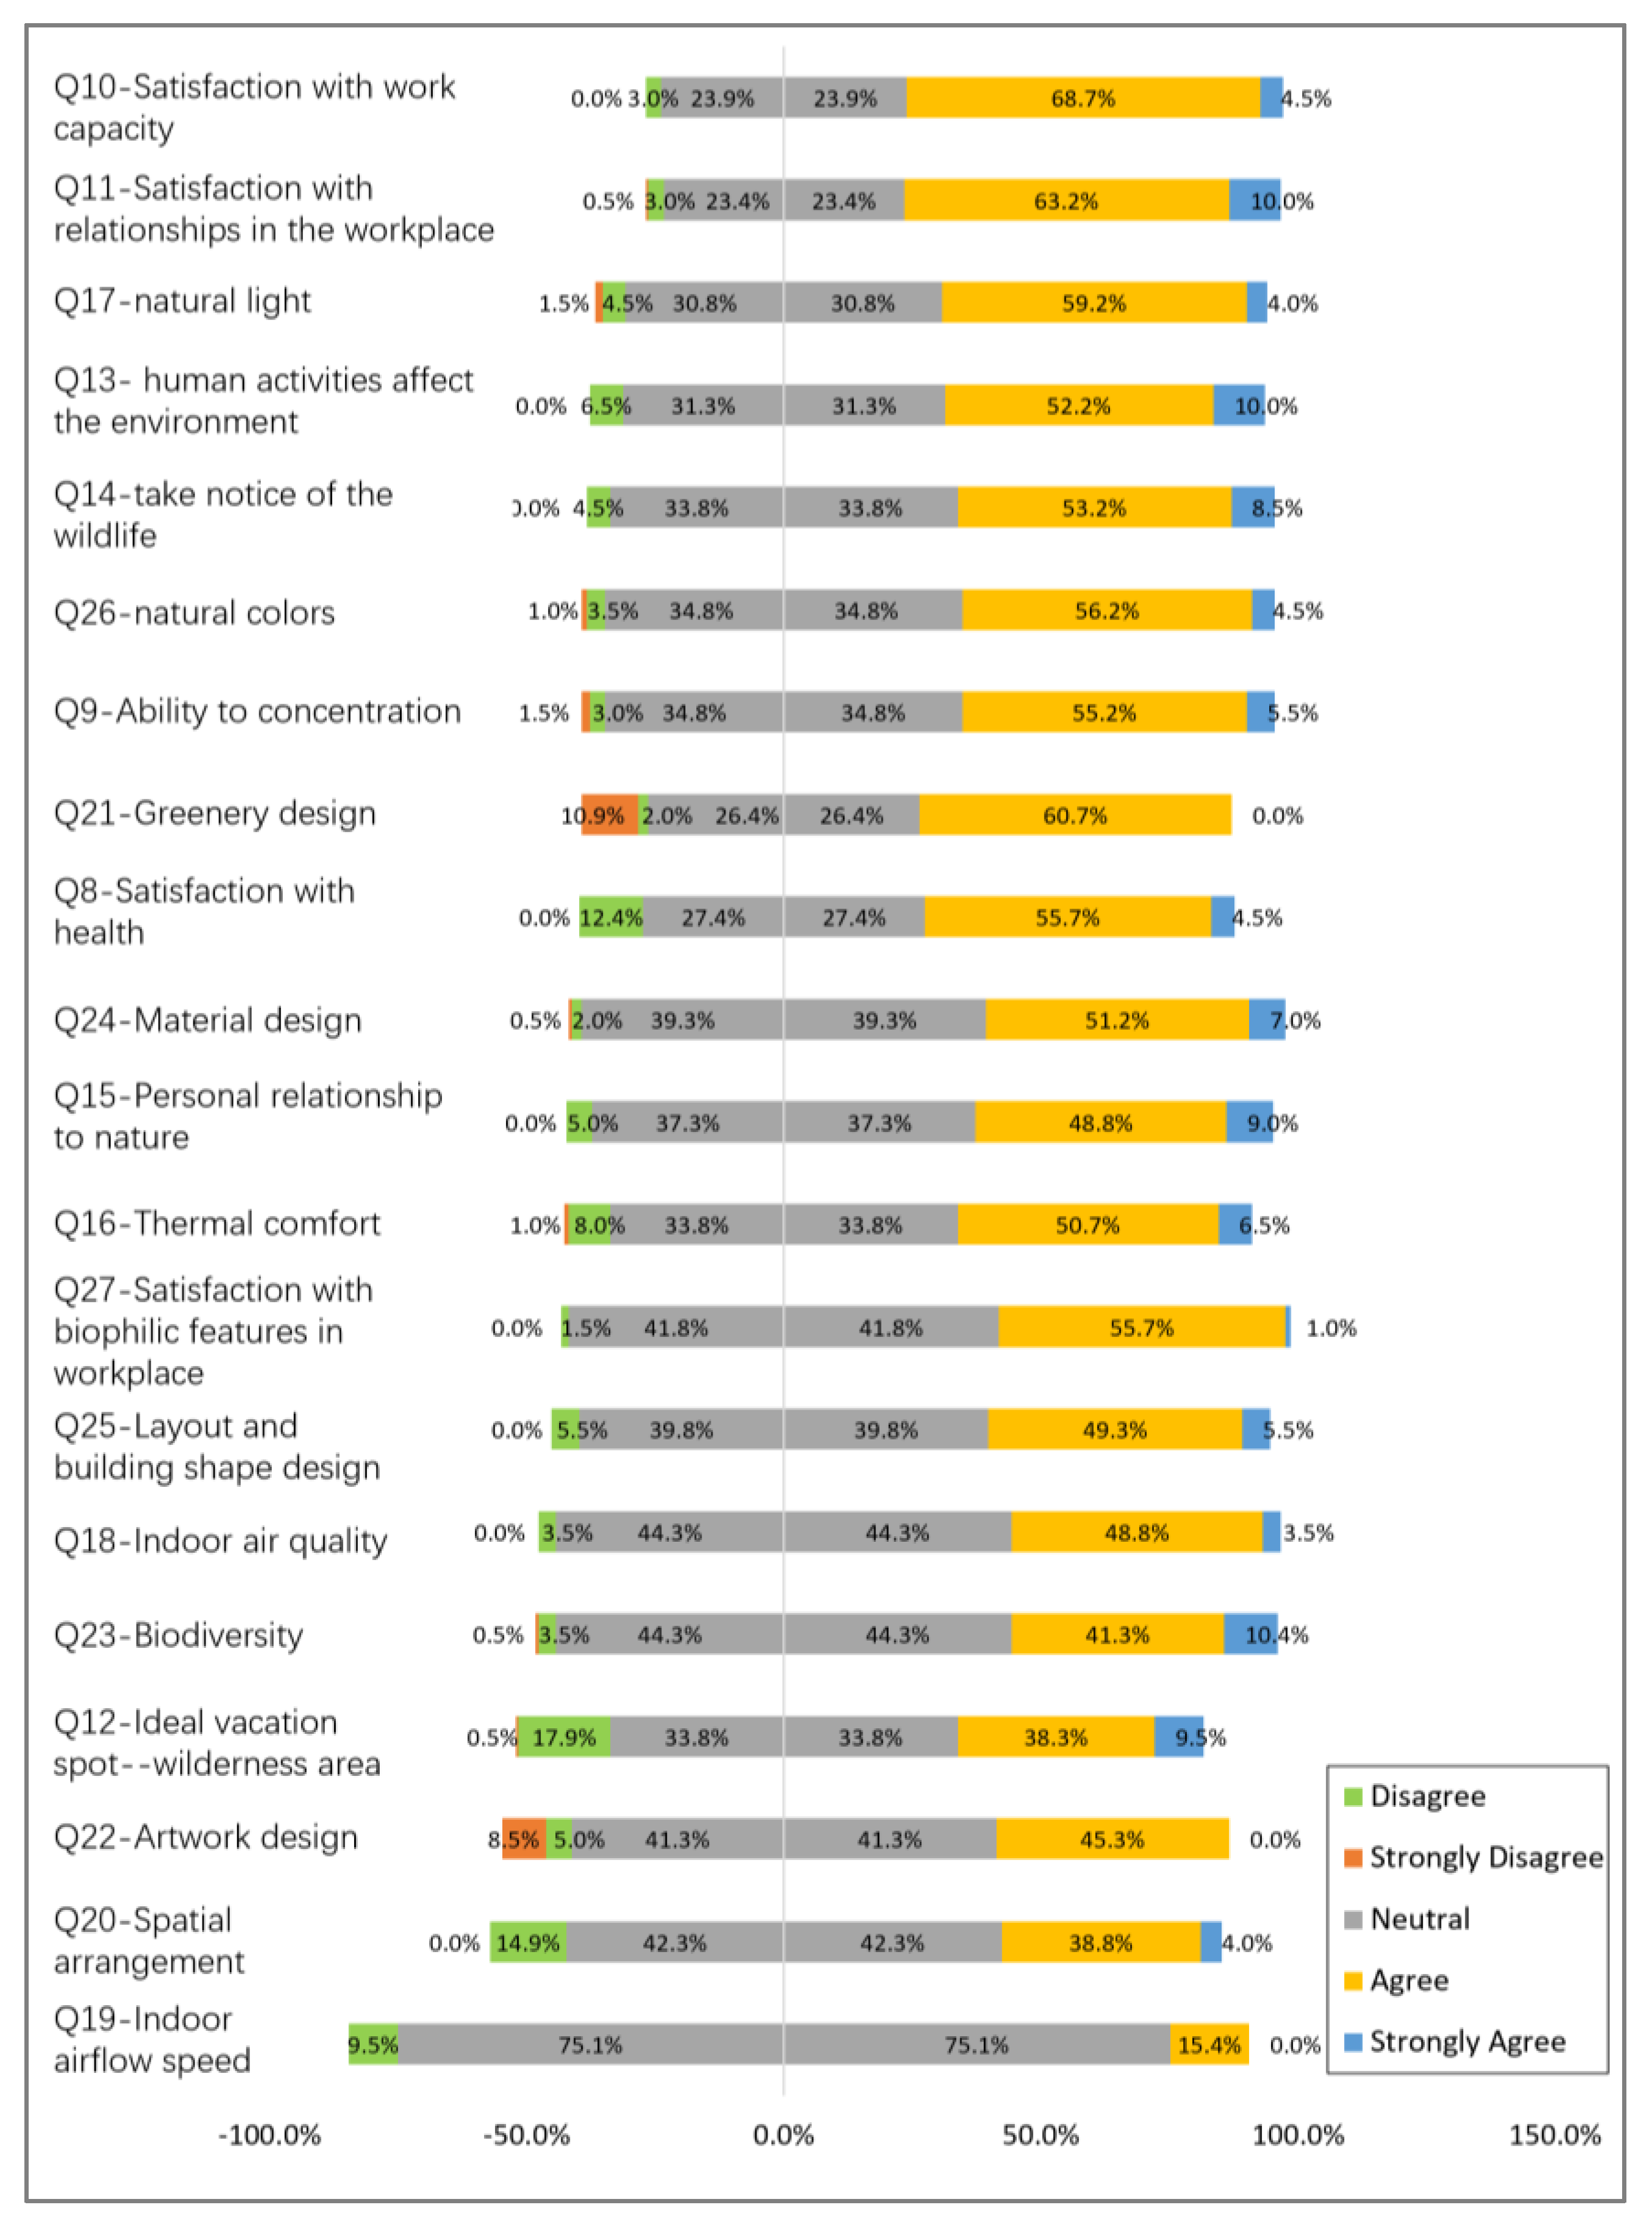
3.2. Quantitative Results of Impacts of Biophilic Design for Workplace
4. Data Analysis and Discussion
4.1. Cross-Comparison of Different Groups of Gender, Age, Educational Levels, Weekly Working Hours, Daily Sedentary Time, Work Desk Locations, Working Years, and Office Locations on Self-Reported GH, NR, and BDE
4.2. Intercorrelation between Three Subscales (GH, NR, BDE)
4.3. Weighting of Biophilic Design Attributes for Workplace by POE Results
5. Conclusions
6. Limitations and Future Studies
Author Contributions
Funding
Institutional Review Board Statement
Informed Consent Statement
Conflicts of Interest
Appendix A. Definitions of Biophilic Design Attributes and Patterns
| Column | Attributes/Patterns | Definition |
| Column A: 24 Biophilic Design Attributes (Kellert, 2008) | 1. Light | Glass walls and clerestories, reflecting colors and materials |
| 2. Air | Natural ventilation | |
| 3. Water features | Views of prominent water bodies, fountains, aquaria, constructed wetlands | |
| 4. Vegetation | Greenery | |
| 5. Animals | Representation of nonhuman animal life | |
| 6. Weather | Views to the outside, operable windows, porches, decks, balconies, colonnades, pavilions, gardens | |
| 7. Fire | Fireplaces and hearths, and simulated by the creative use of light, color, movement, and materials of varying heat conductance | |
| 8. Natural landscapes and ecosystem | Consists of interconnected plants, animals, water, soils, rocks, and geological forms | |
| 9. Images of nature | The image and representation of nature in the built environment—plants, animals, landscapes, water, geological features | |
| 10. Natural materials | Prominent natural building and decorative materials including wood, stone, wool, cotton, and leather, used in a wide array of products, furnishings, fabrics, and other interior and exterior designs | |
| 11. Natural colors | Emphasizes such appealing environmental forms as flowers, sunsets and sunup, rainbows, and certain plants and animals | |
| 12. Simulating natural light and air | - | |
| 13. Naturalistic shapes and forms | The shapes of plants on building facades and columns, animal facsimiles woven into fabrics and coverings | |
| 14. Evoking nature | Draw from design principles and characteristics of the natural world | |
| 15. Information richness | Rich sensory information | |
| 16. Age, change, and the patina of time | Naturally aging materials, weathering, a sense of the passage of time | |
| 17. Natural geometries | Hierarchically organized scales, sinuous rather than rigid artificial geometries, self-repeating but varying patterns | |
| 18. Biomimicry | Forms and functions found in nature, especially among other species | |
| 19. Prospect and refuge | Prospect: long views of surrounding settings Refuge: sites of safety and security | |
| 20. Organized complexity | Complex spaces tend to be variable and diverse, while organized ones possess attributes of connection and coherence | |
| 21. Integration of parts to wholes | Sequential and successional linking of spaces, as well as by clear and discernible boundaries | |
| 22. Transitional spaces | Hallways, thresholds, doorways, gateways, and areas that link the indoors and outdoors especially porches, patios, courtyards, colonnades | |
| 23. Mobility and wayfinding | Clearly understood pathways and points of entry and egress | |
| 24. Cultural and ecological sites | Local landscapes, indigenous flora and fauna, and characteristic meteorological conditions | |
| Column B: 14 Patterns of Biophilic Design (Browning et al., 2014) | 1. Visual connection with nature | A view to elements of nature, living systems and natural processes |
| 2. Non-visual connection with nature | Auditory, haptic, olfactory, or gustatory stimuli that engender a deliberate and positive reference to nature, living systems or natural processes | |
| 3. Non-rhythmic sensory stimuli | Stochastic and ephemeral connections with nature that may be analyzed statistically but may not be predicted precisely | |
| 4. Thermal and air flow variability | Subtle changes in air temperature, relative humidity, air ow across the skin, and surface temperatures that mimic natural environments | |
| 5. Presence of water | A condition that enhances the experience of a place through the seeing, hearing, or touching of water | |
| 6. Dynamic and diffuse light | Leveraging varying intensities of light and shadow that change over time to create conditions that occur in nature | |
| 7. Connection with natural systems | Awareness of natural processes, especially seasonal and temporal changes characteristic of a healthy ecosystem | |
| 8. Biomorphic forms and patterns | Symbolic references to contoured, patterned, textured or numerical arrangements that persist in nature | |
| 9. Material connection with nature | Material and elements from nature that, through minimal processing, reflect the local ecology or geology to create a distinct sense of place | |
| 10. Complexity and order | Adheres to a spatial hierarchy similar to those encountered in nature | |
| 11. Prospect | An unimpeded view over a distance for surveillance and planning | |
| 12. Refuge | A place for withdrawal, from environmental conditions or the main flow of activity, in which the individual is protected from behind and overhead | |
| 13. Mystery | The promise of more information achieved through partially obscured views or other sensory devices that entice the individual to travel deeper into the environment | |
| 14. Risk/Peril | An identifiable threat coupled with a reliable safeguard |
References
- Wilson, E.O. Biophilia; Harvard University Press: Cambridge, MA, USA, 1984. [Google Scholar]
- Fromm, E. The Heart of Man; Harper & Row: New York, NY, USA, 1964. [Google Scholar]
- Parsaee, M.; Demers, C.M.H.; Potvin, A.; Hébert, M.; Lalonde, J.-F. Window View Access in Architecture: Spatial Visualization and Probability Evaluations Based on Human Vision Fields and Biophilia. Buildings 2021, 11, 627. [Google Scholar] [CrossRef]
- Irons, W. Adaptively relevant environments versus the environment of evolutionary adaptedness. Evol. Anthropol. 1998, 6, 194–204. [Google Scholar] [CrossRef]
- Crawford, C.; Krebs, D. (Eds.) Handbook of Evolutionary Psychology: Ideas, Issues and Applications; LEA: New York, NY, USA, 1997. [Google Scholar]
- Julia Ayuso Sanchez, T.I. Sergio Vega Sanchez, Quantitative improvement in workplace performance through biophilic design: A pilot experiment case study. Energy Build. 2018, 177, 316–328. [Google Scholar] [CrossRef]
- Korpela, K.; De Bloom, J.; Sianoja, M.; Pasanen, T.; Kinnunen, U. Nature at home and at work: Naturally good? Links between window views, indoor plants, outdoor activities and employee well-being over one year. Landsc. Urban Plan. 2017, 160, 38–47. [Google Scholar] [CrossRef]
- Moksnes, U.K.; Espnes, G.A.; Haugan, G. Stress, sense of coherence and emotional symptoms in adolescents. Psychol. Health 2013, 29, 32–49. [Google Scholar] [CrossRef]
- Van Den Berg, A.E.; Hartig, T.; Staats, H. Preference for Nature in Urbanized Societies: Stress, Restoration, and the Pursuit of Sustainability. J. Soc. Issues 2007, 63, 79–96. [Google Scholar] [CrossRef] [Green Version]
- Wolhihill, I.A.F. (Ed.) Kaplan&Talbot, Psychological Benefits of a Wilderness Experience, in Human Behavior & Environment: Advances in Theory and Research; Human Behavior and Environment Series; Plenium Press: New York, NY, USA, 1983; pp. 163–203. [Google Scholar]
- Berman, M.G.; Jonides, J.; Kaplan, S. The Cognitive Benefits of Interacting with Nature. Psychol. Sci. 2008, 19, 1207–1212. [Google Scholar] [CrossRef]
- Kaplan, S. The restorative benefits of nature: Toward an integrative framework. J. Environ. Psychol. 1995, 15, 169–182. [Google Scholar] [CrossRef]
- Katcher, A.; Wilkins, G. Dialogue with Animals: Its Nature and Culture. In The Biophilia Hypothesis; Kellert, S.R., Wilson, E.O., Eds.; Island Press: Washington, DC, USA, 1993. [Google Scholar]
- Berman, M.G.; Kross, E.; Krpan, K.M.; Askren, M.K.; Burson, A.; Deldin, P.J.; Kaplan, S.; Sherdell, L.; Gotlib, I.H.; Jonides, J. Interacting with nature improves cognition and affect for individuals with depression. J. Affect. Disord. 2012, 140, 5. [Google Scholar] [CrossRef] [Green Version]
- Beute, F.; de Kort, Y. Natural resistance: Exposure to nature and self-regulation, mood, and physiology after ego-depletion. J. Environ. Psychol. 2014, 40, 167–178. [Google Scholar] [CrossRef]
- Ruth, K.; Raanaas, K.H.E. Debra Rich, Gunn Sjøstrøm, Grete Patil, Benefits of indoor plants on attention capacity in an office setting. J. Environ. Psychol. 2011, 31, 99–105. [Google Scholar]
- Chow, J.T.; Lau, S. Nature Gives Us Strength: Exposure to Nature Counteracts Ego-Depletion. J. Soc. Psychol. 2014, 155, 70–85. [Google Scholar] [CrossRef] [PubMed]
- Berto, R. Exposure to restorative environments helps restore attentional capacity. J. Environ. Psychol. 2005, 25, 249–259. [Google Scholar] [CrossRef]
- Chen, C.; Lai, Y.-H.; Wu, J.-P. Restorative affections about directed attention recovery and reflection in different environments. Chin. Ment. Health J. 2011, 25, 681–685. [Google Scholar]
- Laumann, K.; Gärling, T.; Stormark, K.M. Selective attention and heart rate responses to natural and urban environments. J. Environ. Psychol. 2003, 23, 125–134. [Google Scholar] [CrossRef]
- Browning, B.C.C. The Global Impact of Biophilic Design in the Workplace. In Human Spaces Global Report; Human Spaces; 2015; p. 48. Available online: https://greenplantsforgreenbuildings.org/wp-content/uploads/2015/08/Human-Spaces-Report-Biophilic-Global_Impact_Biophilic_Design.pdf (accessed on 8 September 2018).
- Harting, T.; Bringslimark, T.; Patil, G. Restorative Environmental Design: What, When, Where and For Whom? In Biophilic Design: The Theory, Science, and Practice of Bringing Buildings to Life; Stephen Kellert, J.H.A.M.M., Ed.; Hoboken: Wiley, NJ, USA, 2008; pp. 113–151. [Google Scholar]
- Mazuch, R. Salutogenic and Biophilic Design as Therapeutic Approaches to Sustainable Architecture. Des. Health Sustain. Approaches Ther. Archit. 2017, 87, 42–47. [Google Scholar] [CrossRef]
- Kellert, S. Biophilic Design: The Architecture of Life. 2011. Available online: http://www.biophilicdesign.net/ (accessed on 8 September 2018).
- Kellert, S.; Elizabeth, C. The Practice of Biophilic Design. 2015. Available online: https://www.biophilic-design.com/_files/ugd/21459d_81ccb84caf6d4bee8195f9b5af92d8f4.pdf (accessed on 8 September 2018).
- Mollazadeh, M.; Zhu, Y. Application of Virtual Environments for Biophilic Design: A Critical Review. Buildings 2021, 11, 148. [Google Scholar] [CrossRef]
- Gillis, K.; Gatersleben, B. A Review of Psychological Literature on the Health and Wellbeing Benefits of Biophilic Design. Buildings 2015, 5, 948–963. [Google Scholar] [CrossRef] [Green Version]
- Kellert, S.; Heerwagen, J.; Mador, M. Biophilic Design: The Theory, Science, and Practice of Bringing Buildings to Life; John Wiley: Hoboken, NJ, USA, 2008. [Google Scholar]
- Browning, W.D.; Ryan, C.O.; Clancy, J.O. 14 Patterns of Biophilic Design; Terrapin Bright Green LLC: New York, NY, USA, 2014. [Google Scholar]
- Ulrich. Biophilia, Biophobia, and Natural Landscapes. The Biophilia Hypothesis; Island Press: Washington, DC, USA, 1993. [Google Scholar]
- Grinde, B.; Patil, G.G. Biophilia: Does Visual Contact with Nature Impact on Health and Well-Being? Int. J. Environ. Res. Public Health 2009, 6, 2332–2343. [Google Scholar] [CrossRef] [Green Version]
- Ko, W.H.; Kent, M.G.; Schiavon, S.; Levitt, B.; Betti, G. A Window View Quality Assessment Framework. Leukos 2021, 1–26. [Google Scholar] [CrossRef]
- Derek, C.C. Environmental Quality and the Productive Workplace. In Innovative Developments in Architecture, Engineering and Contruction; Anumba, C.J., Ed.; Millpress Science Publishers: Rotterdam, The Netherlands, 2003. [Google Scholar]
- Lei, Q.; Yu, L.S.S.; Lau, S.S.Y. A quantitative study for indoor workplace biophilic design to improve health and productivity performance. J. Clean. Prod. 2021, 324, 129168. [Google Scholar] [CrossRef]
- Yin, J.; Zhu, S.; MacNaughton, P.; Allen, J.G.; Spengler, J.D. Physiological and cognitive performance of exposure to biophilic indoor environment. Build. Environ. 2018, 132, 255–262. [Google Scholar] [CrossRef]
- Yin, J.; Arfaei, N.; Macnaughton, P.; Catalano, P.J.; Allen, J.G.; Spengler, J.D. Effects of biophilic interventions in office on stress reaction and cognitive function: A randomized crossover study in virtual reality. Indoor Air 2019, 29, 1028–1039. [Google Scholar] [CrossRef] [PubMed]
- Yin, J.; Yuan, J.; Arfaei, N.; Catalano, P.J.; Allen, J.G.; Spengler, J.D. Effects of biophilic indoor environment on stress and anxiety recovery: A between-subjects experiment in virtual reality. Environ. Int. 2020, 136, 105427. [Google Scholar] [CrossRef] [PubMed]
- Jiang, B.; Song, Y.; Li, H.X.; Lau, S.S.-Y.; Lei, Q. Incorporating biophilic criteria into green building rating tools: Case study of Green Mark and LEED. Environ. Impact Assess. Rev. 2020, 82, 106380. [Google Scholar] [CrossRef]
- Max Paul, D.R.J. Dear, Green occupants for green buildings: The missing link? Build. Environ. 2012, 56, 21–27. [Google Scholar]
- Preiser, W.F.E. Post-occupancy evaluation: How to make buildings work better. Facilities 1995, 13, 19–28. [Google Scholar] [CrossRef]
- National Research Council; Board on Infrastructure and the Constructed Environment and Federal Facilities Council. Learning from Our Buildings: A State-of-the-Practice Summary of Post-Occupancy Evaluation; National Academies Press: Washington, DC, USA, 2001. [Google Scholar]
- Candido, C.; Chakraborty, P.; Tjondronegoro, D. The Rise of Office Design in High-Performance, Open-Plan Environments. Buildings 2019, 9, 100. [Google Scholar] [CrossRef] [Green Version]
- Jiboye, A.D. Post-occupancy evaluation of residential satisfaction in Lagos, Nigeria: Feedback for residential improvement. Front. Arch. Res. 2012, 1, 236–243. [Google Scholar] [CrossRef] [Green Version]
- Graham, L.T.; Parkinson, T.; Schiavon, S. Lessons learned from 20 years of CBE’s occupant surveys. Build. Cities 2021, 2, 166–184. [Google Scholar] [CrossRef]
- Kent, M.; Parkinson, T.; Kim, J.; Schiavon, S. A data-driven analysis of occupant workspace dissatisfaction. Build. Environ. 2021, 205, 108270. [Google Scholar] [CrossRef]
- Cheung, T.; Schiavon, S.; Graham, L.T.; Tham, K.W. Occupant satisfaction with the indoor environment in seven commercial buildings in Singapore. Build. Environ. 2021, 188, 107443. [Google Scholar] [CrossRef]
- Mlecnik, E.; Schütze, T.; Jansen, S.J.T.; de Vries, G.; Visscher, H.J.; van Hal, A. End-user experiences in nearly zero-energy houses. Energy Build. 2012, 49, 471–478. [Google Scholar] [CrossRef]
- OzgurGoçera, Y. Kenan Goçer, Completing the missing link in building design process: Enhancing post-occupancy evaluation method for effective feedback for building performance. Build. Environ. 2015, 89, 14–27. [Google Scholar]
- YingHua, Ö. Kenan Göçer, Spatial mapping of occupant satisfaction and indoor environment quality in a LEED platinum campus building. Build. Environ. 2014, 79, 124–137. [Google Scholar]
- USGBC. LEED Reference Guide for Building Design and Construction V4; USGBC: Washington, DC, USA, 2013. [Google Scholar]
- BRE Global Ltd. BREEAM International New Construction 2016 Technical Manual; BRE Global Ltd.: Watford, UK, 2016. [Google Scholar]
- BCA (Ed.) BCA-HPB Green Mark for Healthier Workplaces; BCA: Singapore, 2018. [Google Scholar]
- The WELL Building Standard V1; IWBI: New York, NY, USA, 2017.
- Yousef Al Horr, M.A. Amit Kaushik, Ahmed Mazroeic Marth, Katafygiotou, EsamElsarrag, Occupant productivity and office indoor environment quality: A review of the literature. Build. Environ. 2016, 105, 369–389. [Google Scholar] [CrossRef] [Green Version]
- Soebarto, M.S.A.V. Biophilia and Salutogenesis as restorative design approaches in healthcare architecture. Archit. Sci. Rev. 2019, 62, 195–205. [Google Scholar]
- Lee, H.C.; Park, S.J. Assessment of Importance and Characteristics of Biophilic Design Patterns in a Children’s Library. Sustainability 2018, 10, 987. [Google Scholar] [CrossRef] [Green Version]
- WHO. Development of the World Health Organization WHOQOL-BREF Quality of Life Assessment; Psychological Medicine: Cambridge, UK, 1998; Volume 28, p. 3.
- Zelenski, E.N.; Zelenski, J.M. The NR-6: A new brief measure of nature relatedness. Front. Psychol. 2013, 10, 813. [Google Scholar]
- Morgan, P.J.; Cleave-Hogg, D.; DeSousa, S.; Tarshis, J. High-fidelity patient simulation: Validation of performance checklists. Br. J. Anesth. 2004, 92, 388–392. [Google Scholar] [CrossRef] [Green Version]
- Cronbach, L.J. Coefficient alpha and the internal structure of tests. Psychometrika 1951, 16, 297–334. [Google Scholar] [CrossRef] [Green Version]
- Ulrich, R.S.; Simons, R.F.; Losito, B.D.; Fiorito, E.; Miles, M.A.; Zelson, M. Stress recovery during exposure to natural and urban environments. J. Environ. Psychol. 1991, 11, 201–230. [Google Scholar] [CrossRef]
- Rich, D. Effects of exposure to plants and nature on cognition and mood: A cognitive psychology perspective. Sci. Eng. 2008, 68, 4911. [Google Scholar]
- Shin, W.S.; Shin, C.S.; Yeoun, P.S.; Kim, J.J. The influence of interaction with forest on cognitive function. Scand. J. For. Res. 2011, 26, 595–598. [Google Scholar] [CrossRef]
- Annerstedt, M.; Jönsson, P.; Wallergård, M.; Johansson, G.; Karlson, B.; Grahn, P.; Hansen, Å.M.; Währborg, P. Inducing physiological stress recovery with sounds of nature in a virtual reality forest—Results from a pilot study. Physiol. Behav. 2013, 118, 240–250. [Google Scholar] [CrossRef] [PubMed]

| POE Method | Approaches | Features |
|---|---|---|
| Indicative POE | Interview or distribute questionnaires to key personnel | Rapidly collect evaluation data |
| Investigative POE | End-user surveys, interviews, field measurements, photographic recordings | Apply both occupant feedback and documenting environmental data |
| Diagnostic POE | Months or years of evaluation data collection | A long-term data collection procedure |
| Eight Physical Influential Factors for Office Satisfaction and Productivity | Overlapping Attributes in the Nine Biophilic Design Attributes for the Workplace |
|---|---|
| Factor 1: Indoor Air Quality and Ventilation | Attribute 4: Thermal Comfort and Airflow; Attribute 5: Air Quality |
| Factor 2: Thermal Comfort | Attribute 4: Thermal Comfort and Airflow |
| Factor 3: Lighting and Daylighting | Attribute 2: Natural Light |
| Factor 4: Noise and Acoustics | N.A. (not included as a biophilic feature) |
| Factor 5: Office Layout | Attribute 9: Building Form and Layout |
| Factor 6: Biophilia and Views (i.e., biodiversity, greenery, water features) | Attribute 1: Greenery/Vegetation; Attribute 6: Biodiversity |
| Factor 7: Look and Feel (i.e., colors, patterns, spatial settings) | Attribute 3: Natural colors; Attribute 7: Artworks; Attribute 8: Natural Materials |
| Factor 8: Location and Amenities | N.A. (not included as a biophilic attribute) |
| Section | Question Number and Description |
|---|---|
| Demographic information | (1) Gender |
| (2) Age | |
| (3) Education level | |
| (4) Weekly working hours | |
| (5) Daily sedentary time at the work desk | |
| (6) Work desk location | |
| (7) Working years |
| Scale | Construct | Item Number | Question Number and Description | Matched Biophilic Design Attributes for Workplace |
|---|---|---|---|---|
| Subscale 1 | General Health (GH) | GH 1 GH 2 GH 3 GH 4 | (Q8) Satisfaction with health (Q9) Ability to concentrate (Q10) Satisfaction with work capacity (Q11) Satisfaction with relationships in the workplace | - |
| Subscale 2 | Nature Relatedness (NR) | NR 1 | (Q12) Ideal vacation spot—wilderness area | - |
| NR 2 | (Q13) Personal actions affect the environment | |||
| NR 3 | (Q14) Take notice of wildlife | |||
| NR 4 | (Q15) Personal relationship with nature | |||
| Subscale 3 | Biophilic Design Evaluation (BDE) | BDE 1 | (Q16) Thermal comfort | Attribute 4 |
| BDE 2 | (Q17) Natural light quality | Attribute 2 | ||
| BDE 3 | (Q18) Indoor air quality | Attribute 5 | ||
| BDE 4 | (Q19) Indoor airflow speed | Attribute 4 | ||
| BDE 5 | (Q20) Spatial arrangement | Attribute 9 | ||
| BDE 6 | (Q21) Greenery design | Attribute 1 | ||
| BDE 7 | (Q22) Artwork design | Attribute 7 | ||
| BDE 8 | (Q23) Biodiversity features | Attribute 6 | ||
| BDE 9 | (Q24) Material design | Attribute 8 | ||
| BDE 10 | (Q25) Layout and building shape design | Attribute 9 | ||
| BDE 11 | (Q26) Color design | Attribute 3 | ||
| BDE 12 | (Q27) Satisfaction with biophilic features in workplace | - | ||
| Main Scale | Health and Wellbeing of Biophilic Offices | The sum of the subscales | Question number (8 to 27) | - |
| Dimension | Office A | Office B |
|---|---|---|
| Location | Singapore | Shenzhen, South China |
| Climate zone | Tropical monsoon climate | Sub-tropical climate |
| Coordinate | 1°16′ N, 103°5′ E | 22°55′ N, 114.1° E |
| Floor | 8 | 10 |
| Office ventilation type | Central air conditioned | Natural ventilation |
| Temperature in the office | 25 to 26 °C | 26 to 28 °C |
| No. of employees | Approx. 300 | Approx. 150 |
| Biophilic Design Attributes for Workplace | Office A | Office B |
|---|---|---|
| (1) Greenery/Vegetation | 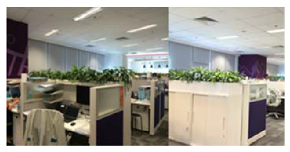 Potted plants, window view of natural scenes | 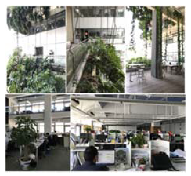 Potted plants, vertical greening, roof garden and green balconies; window view of natural scenes |
| (2) Natural Light | Daylight | Daylight |
| (3) Natural Colors | 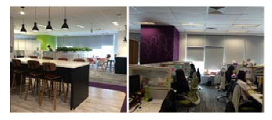 Natural color design | 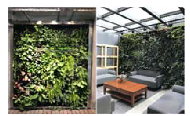 Natural color design |
|
(4) Thermal Comfort and Airflow (5) Air Quality | Thermal control (air-conditioning system) | 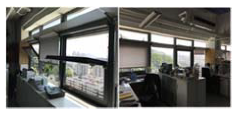 Openable windows for natural ventilation and thermal comfort |
| (6) Biodiversity | 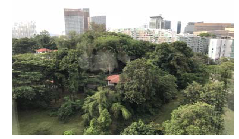 | 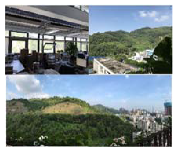 |
| (7) Artworks |  Paintings with natural images and interior biomorphic patterns | 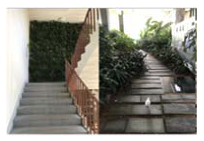 Natural patterns on façade and stairs |
| (8) Natural Materials | 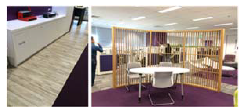 wooden floor and wooden screen | 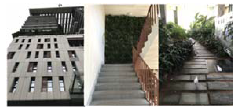 natural materials |
| (9) Building Form and Layout | Workstations are as close to windows as possible | Workstations are as close to windows as possible, balconies on each floor |
| Survey Measures | Items | Number of Persons | Percentage (%) |
|---|---|---|---|
| Gender | Male | 102 | 50.7 |
| Female | 99 | 49.3 | |
| Office Location | Singapore | 161 | 80.1 |
| Shenzhen, South China | 40 | 19.9 | |
| Age | 21–25 | 15 | 7.5 |
| 26–35 | 84 | 41.8 | |
| 36–45 | 64 | 31.8 | |
| 46–60 | 38 | 18.9 | |
| Educational level | Secondary school or equivalent | 7 | 3.5 |
| Bachelor’s degree | 97 | 48.3 | |
| Master’s degree or above | 97 | 48.3 | |
| Weekly working hours | 30 to 40 h | 29 | 14.4 |
| 41 to 50 h | 138 | 68.7 | |
| Over 50 h | 34 | 16.9 | |
| Daily sedentary time at the work desk | Less than 30 min | 13 | 6.5 |
| 30 min to 2 h | 19 | 9.5 | |
| 2 to 5 h | 59 | 29.4 | |
| 5 to 8 h | 86 | 42.8 | |
| Above 8 h | 24 | 11.9 | |
| Work desk location | Window seats with natural views | 65 | 32.3 |
| Window seats with urban views | 27 | 13.4 | |
| Aisle seats without window view | 109 | 54.2 | |
| Working years | 1 year or less | 47 | 23.4 |
| 1–3 years | 49 | 24.4 | |
| 3–5 years | 48 | 23.9 | |
| Over 5 years | 57 | 28.4 |
| Structure (Item) | Scale | Median (IQR) | Cronbach’s α |
|---|---|---|---|
| Main scale (1) | Health and Wellbeing of Biophilic Offices (HWBO) | 71.00 (8.00) | 0.72 |
| Subscales of main scale (3) | General Health (GH) | 15.00 (2.00) | 0.68 |
| Nature Relatedness (NR) | 14.00 (3.00) | 0.79 | |
| Biophilic Design Evaluation (BDE) | 42.00 (5.00) | 0.63 |
| Survey Measures | Category | GH | NR | BDE | |||
|---|---|---|---|---|---|---|---|
| Median (IQR) | Sig. | Median (IQR) | Sig. | Median (IQR) | Sig. | ||
| Gender | Male | 15.00 (2.00) | 0.024 * | 15.00 (2.00) | 0.000 * | 42.00 (5.00) | 0.950 |
| Female | 15.00 (3.00) | 14.00 (3.00) | 42.00 (6.00) | ||||
| Age | 21–25 | 16.00 (3.00) | 0.009 * | 15.00 (3.00) | 0.004 * | 43.00 (4.00) | 0.115 |
| 26–35 | 15.00 (2.00) | 15.00 (3.00) | 42.00 (5.00) | ||||
| 36–45 | 15.00 (4.00) | 13.50 (3.00) | 41.00 (6.00) | ||||
| 46–60 | 15.50 (2.00) | 15.00 (2.00) | 40.50 (6.00) | ||||
| Educational level | Secondary school or equivalent | 14.00 (4.00) | 0.384 | 14.00 (2.00) | 0.656 | 39.00 (6.00) | 0.391 |
| Diploma or college certificate | 15.00 (2.00) | 15.00 (3.00) | 42.00 (5.00) | ||||
| Master’s degree or above | 15.00 (2.00) | 14.00 (3.00) | 42.00 (5.00) | ||||
| Weekly working hours | 30 to 40 h | 14.00 (2.00) | 0.742 | 14.00 (3.00) | 0.445 | 41.00 (6.00) | 0.919 |
| 41 to 50 h | 15.00 (2.00) | 14.00 (3.00) | 42.00 (5.00) | ||||
| Over 50 h | 15.00 (3.00) | 15.00 (3.00) | 42.00 (5.00) | ||||
| Daily sedentary time | Less than 30 min | 15.00 (2.00) | 0.549 | 15.00 (2.00) | 0.216 | 42.00 (5.00) | 0.652 |
| 30 min to 2 h | 14.00 (3.00) | 13.00 (4.00) | 43.00 (5.00) | ||||
| 2 to 5 h | 15.00 (2.00) | 14.00 (4.00) | 42.00 (5.00) | ||||
| 5 to 8 h | 15.00 (2.00) | 15.00 (3.00) | 41.00 (5.00) | ||||
| Over 8 h | 15.00 (2.00) | 14.50 (4.00) | 41.00 (7.00) | ||||
| Work desk location | Window seats with natural views | 15.00 (3.00) | 0.751 | 14.00 (3.00) | 0.228 | 42.00 (5.00) | 0.703 |
| Window seats with urban views | 16.00 (2.00) | 14.00 (1.00) | 42.00 (5.00) | ||||
| Aisle seats without window view | 15.00 (2.00) | 14.00 (3.00) | 42.00 (5.00) | ||||
| Working years (in this company) | 1 year or less | 15.00 (2.00) | 0.218 | 15.00 (3.00) | 0.531 | 42.00 (5.00) | 0.458 |
| 1–3 years | 15.00 (3.00) | 14.00 (4.00) | 42.00 (7.00) | ||||
| 3–5 years | 15.00 (3.00) | 14.50 (3.00) | 42.00 (6.00) | ||||
| Over 5 years | 15.00 (2.00) | 14.00 (3.00) | 41.00 (6.00) | ||||
| Office location | Singapore | 15.00 (2.00) | 0.995 | 14.00 (3.00) | 0.701 | 41.00 (5.00) | 0.244 |
| Shenzhen, China | 15.00 (3.00) | 15.00 (3.00) | 43.00 (5.00) | ||||
| GH | NR | BDE | |
|---|---|---|---|
| General Health | - | 0.264 ** | 0.270 ** |
| Nature Relatedness | 0.264 ** | - | 0.135 |
| Biophilic Design Evaluation | 0.270 ** | 0.135 | - |
| Biophilic Design Attributes (Arranged from Highest to Lowest from Bottom to Top) | Subset | ||
|---|---|---|---|
| 1 (Lower Rank) | 2 (Medium Rank) | 3 (Higher Rank) | |
| Building Form and Layout | 4.299 | ||
| Artworks | 4.415 | 4.415 | |
| Air Quality | 4.910 | 4.910 | 4.910 |
| Biodiversity | 5.052 | 5.052 | 5.052 |
| Greenery | 5.167 | 5.167 | |
| Natural Materials | 5.234 | 5.234 | |
| Thermal Comfort and Airflow | 5.271 | ||
| Natural Light | 5.326 | ||
| Natural Colors | 5.326 | ||
| Adjusted Sig. (2-sided test) | 0.093 | 0.067 | 0.836 |
| Level 1 (Higher Rank) | Level 2 (Medium Rank) | Level 3 (Lower Rank) |
|---|---|---|
| Natural Colors | Natural Materials | Biodiversity |
| Natural Light | Greenery | Air Quality |
| Thermal Comfort and Airflow | Biodiversity | Artworks |
| Natural Materials | Air Quality | Building Form and Layout |
| Greenery | Artworks | |
| Biodiversity | ||
| Air Quality |
Publisher’s Note: MDPI stays neutral with regard to jurisdictional claims in published maps and institutional affiliations. |
© 2022 by the authors. Licensee MDPI, Basel, Switzerland. This article is an open access article distributed under the terms and conditions of the Creative Commons Attribution (CC BY) license (https://creativecommons.org/licenses/by/4.0/).
Share and Cite
Lei, Q.; Lau, S.S.Y.; Yuan, C.; Qi, Y. Post-Occupancy Evaluation of the Biophilic Design in the Workplace for Health and Wellbeing. Buildings 2022, 12, 417. https://doi.org/10.3390/buildings12040417
Lei Q, Lau SSY, Yuan C, Qi Y. Post-Occupancy Evaluation of the Biophilic Design in the Workplace for Health and Wellbeing. Buildings. 2022; 12(4):417. https://doi.org/10.3390/buildings12040417
Chicago/Turabian StyleLei, Qinghua, Stephen Siu Yu Lau, Chao Yuan, and Yi Qi. 2022. "Post-Occupancy Evaluation of the Biophilic Design in the Workplace for Health and Wellbeing" Buildings 12, no. 4: 417. https://doi.org/10.3390/buildings12040417
APA StyleLei, Q., Lau, S. S. Y., Yuan, C., & Qi, Y. (2022). Post-Occupancy Evaluation of the Biophilic Design in the Workplace for Health and Wellbeing. Buildings, 12(4), 417. https://doi.org/10.3390/buildings12040417