Article

Experimental and Numerical Study on the Shear Performance of Short Stud Shear Connectors in Steel–UHPC Composite Beams

1
School of Civil and Transportation Engineering, Guangdong University of Technology, Guangzhou 510006, China
2
Earthquake Engineering Research & Test Center, Guangzhou University, Guangzhou 510006, China
*
Authors to whom correspondence should be addressed.
Buildings 2022, 12(4), 418; https://doi.org/10.3390/buildings12040418
Submission received: 22 February 2022 / Revised: 22 March 2022 / Accepted: 29 March 2022 / Published: 31 March 2022

Abstract

:
Steel–ultra-high-performance concrete (UHPC) composite beams offer numerous advantages, such as structural self-weight reduction, bending stiffness improvement, and tensile cracking limitation in slabs. However, few studies have focused on the shear performance of short stud shear connectors in steel–UHPC composite structures. To this end, push-out tests were carried out to evaluate the effect of slab thickness, stud diameter, and casting method on the failure mode, load–slip relationship, ultimate shear strength, shear stiffness, and ductility. The test results indicate that by increasing the slab thickness from 50 to 75 mm, the stud shear capacity and initial shear stiffness were improved by 11.38% and 23.28%, respectively. The stud shear capacity and initial shear stiffness for specimens with stud diameters of 25 mm were 1.29 and 1.23 times that of their 22-mm-diameter counterparts. In addition, adopting precast UHPC slabs could achieve comparative shear resistance (94.91%) but a better slip capacity (108.94%) than those containing conventional monolithic cast slabs. Based on the experimental results, a finite element (FE) model was established to reflect the plastic behavior of the tests and the damage process in the short stud shear connectors. Based on the validated FE model, a parameter study was then performed to further explore the influence of the stud diameter, stud tensile strength, steel beam tensile strength, monolithic slab concrete strength, precast slab concrete strength, and shear pocket concrete strength on the shear performance of short studs in steel–UHPC composite structures.

1. Introduction

Ultra-high-performance concrete (UHPC), as an innovative cementitious-based composite material, has been increasingly utilized in steel–concrete composite beams in the past decade, owing to its excellent mechanical properties in terms of compressive strength, tensile strength, and ductility, as well as durability [1]. Compared to traditional steel–concrete composite beams, steel–UHPC composite beams exhibit several advantages, such as structural self-weight reduction, bending stiffness improvement, and tensile cracking limitation in slabs [2]. Furthermore, UHPC is an excellent alternative for slabs because of its lower permeability, competitive abrasion, and freeze–thaw resistance [3]. Therefore, a thinner UHPC slab can achieve the same load capacity as that of its conventional concrete counterparts. In this case, short stud shear connectors become an alternative for developing the monolithic action of steel–UHPC composite beams. However, few studies have focused on the shear performances of short stud shear connectors in steel–UHPC composite structures.
As a crucial component, the shear connector can ensure shear stress transfer between the slabs and beams to achieve a monolithic action of the composite beams [4]. Up to now, many types of shear connectors have been developed and applied in steel–concrete composite structures [5,6]. Because of the significant economic effects and convenient installation, stud shear connectors have become the most widely accepted [7]. For stud shear connectors in conventional steel–concrete composite beams, a minimum aspect ratio (height to diameter) of 4.0 and concrete covers of 50 mm over stud tops are recommended to ensure effective anchoring in the current design codes [8,9]. However, for stud shear connectors in steel–UHPC composite beams, these specifications might be too conservative.
Several studies have focused on the shear behavior of studs in UHPC slabs. As can be found in Kim et al. [10], stud raptures can be observed without any stud shear strength reduction at an aspect ratio (height to diameter) of 3.1. Additionally, no visible splitting crack was noticed on the UHPC slab surfaces when reducing the concrete cover thickness from 50 mm to 25 mm. From the more recent study by Cao et al. [11], stud shear connectors with a low aspect ratio of 2.7 in 50-mm-thick UHPC slabs exhibited ideal fracture of the stud shear connectors, with slight localized damage around the roots of the studs. Wang et al. [12] performed a series of push-out tests on demountable headed stud shear connectors in steel–UHPC composite structures. The tests showed that a minimum aspect ratio of 1.5 should be ensured to avoid breakout failure of the UHPC. Furthermore, it may be enough for the demountable shear connectors with a cover thickness of 10 mm in steel–UHPC composite structures. However, these investigations were mainly focused on the shear behavior of short stud shear connectors with a diameter smaller than 16 mm in steel–UHPC composite structures.
For large studs encased in UHPC slabs, stud fracture can be observed even with a small aspect ratio of 2.3 (diameter of 30 mm and height of 70 mm) [13]. The shear capacity of larger studs embedded in UHPC slabs improved by more than 10% of those in conventional concrete slabs [14]. Furthermore, the large stud shear capacity was not sensitive to the damage degree of studs if the damage occurred at the location of 2.3 d away from the stud roots [15]. Luo et al. [16] performed a series of push-out tests to investigate the effect of the stud arrangement in steel fiber-reinforced cementitious composite (SFRCC). Arranging studs densely with a longitudinal distance of 3.5 d (d represents the stud diameter) in SFRCC can possess a per-stud shear capacity of more than 90% of those in conventional concrete (with a longitudinal distance of 6 d). As for transverse directions, no reduction in the shear strength for each stud could be noted when the spacing was reduced from 6.9 d (a code-specified minimum) to 2.3 d (the lowest stud spacing for installation). In these cases, the UHPC slab thickness would be greater than 100 mm, even with a small cover thickness of 30 mm. When employing a large-diameter short stud with an aspect ratio of 2.0 in 75-mm-thick UHPC slabs, stud fracture with protruding UHPC can be noticed [17]. The reduction in the slab thickness led to little change in the shear capacity but an apparent splitting of the UHPC slabs.
Additionally, several studies have focused on composite beams containing full-depth precast slabs, with the shear pocket connections filled with UHPC [18,19]. In these cases, studs in the shear pockets should be arranged into groups. Owing to the superior mechanical properties of UHPC, the grouped stud effect was insignificant on the shear capacity [20]. The damaged portion nearly overlapped on the inner UHPC slabs with a spacing of 2.5 times the stud diameter [21]. The shear capacity of the grouped studs in the UHPC slabs was 10% larger than the conventional concrete slab counterparts [18]. The stud aspect ratio had no apparent influence on the shear performance of the studs in terms of shear capacity and initial shear stiffness [21]. Furthermore, almost equal ultimate shear strength and slip were obtained between specimens with precast and cast-in-place UHPC slabs [22]. Therefore, adopting a prefabricated UHPC slab would widen the UHPC applications in steel–UHPC composite beams for accelerated bridge construction.

2. Research Significance

As discussed previously, little research has been conducted on short stud shear connectors (with a diameter larger than 22 mm) in UHPC slabs thinner than 75 mm. The overall purpose of this paper is to extend the existing research and fill the literature gaps on steel–UHPC composite beams. In this study, experimental and numerical studies were carried out to investigate the shear performance of short stud shear connectors in steel–UHPC composite structures. To obtain the failure modes, ultimate shear strength, initial shear stiffness, and slip capacity, four push-out tests were conducted. In addition, finite element (FE) models were developed, based on the commercial software ABAQUS. The accuracy of the FE models was verified using the experimental results. A parameter study was also performed on the basis of the proposed models to study the effect of the stud diameter, stud tensile strength, steel beam tensile strength, monolithic slab concrete strength, precast slab concrete strength, and shear pocket concrete strength on the stud shear behavior. The results of this investigation are directed towards the application of short stud shear connectors in steel–UHPC composite structures.

3. Experimental Program
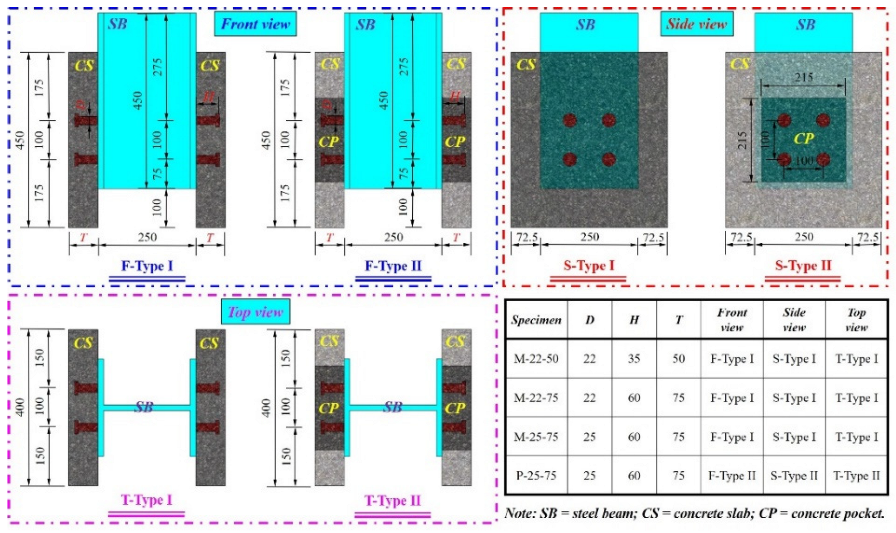
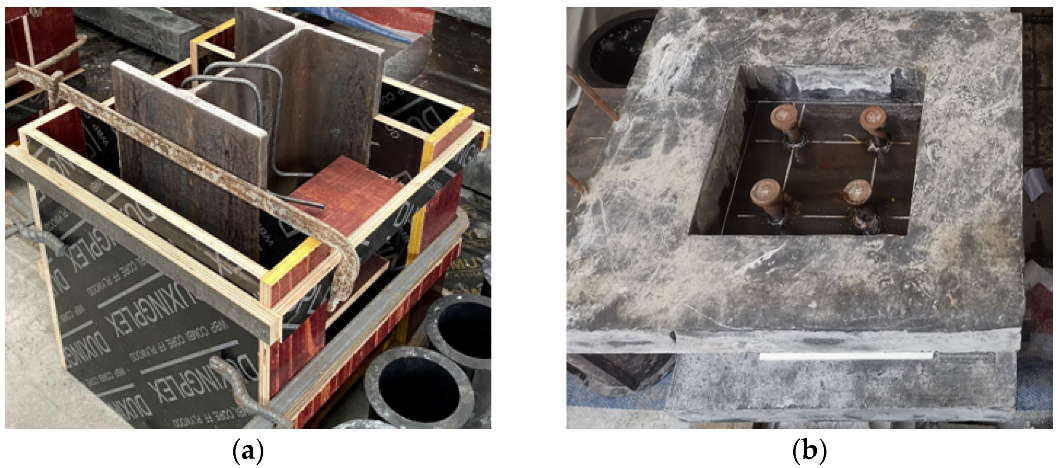
3.1. Test Specimens

To investigate the shear performance of short studs in steel–UHPC composite structures, four push-out tests were conducted in this study. The dimensions of the specimens were determined following those recommended in Clause B.2.2 of Eurocode 4 [9], as presented in Figure 1. The slab heights and widths were 450 and 400 mm, respectively. As a test parameter, the slab thickness T varied among the different specimens. In addition, identical 450-mm-length H-shaped beams with a cross-section of HW 250 × 250 were adopted to represent the steel components. To accommodate the steel–concrete slip, a gap of 100 mm was reserved between the steel beam and concrete slabs. Four short stud shear connectors were welded onto each steel flange, with a spacing of 100 mm in both the longitudinal and transverse directions. One specimen (P-25-75) with a 215 × 215 mm2 shear pocket in each precast slab was prepared to verify the validation of the short studs in full-depth precast UHPC slabs.
As depicted in Figure 1, the designations for the specimens were determined according to the test variables. The first letter corresponds to the casting methods, including specimens with the monolithic cast (M) and precast (P) slabs. Furthermore, two different stud diameters (22 and 25 mm) and slab thicknesses (50 and 75 mm) were chosen for this study. Particularly, all the specimens maintained an identical concrete cover thickness of 15 mm. As a result, three different stud aspect ratios were adopted in this study, that is, 1.59 for M-22-50, 2.40 for M-25-75/P-25-75, and 2.73 for M-22-75.
The fabrication procedure of the test specimens is shown in Figure 2. For convenience, the UHPC slabs for each monolithic test were poured simultaneously (Figure 2a). However, the precast concrete slabs for specimen P-25-75 were cast first. After a week of curing, one slab was placed horizontally on the steel beams, as done in practice. The steel–concrete interfaces were greased to prevent bonding, as specified in Clause B.2.3 of Eurocode 4 [9]. After achieving the expected concrete strength, the specimen was overturned to cast the shear pocket concrete on the opposite side (Figure 2b). For the sake of minimizing the influence of the concrete strength, the monolithic specimens were cast on the same day as the casting of the shear pocket. Subsequently, all the specimens were cured in moist conditions for two weeks and then naturally cured for another two weeks outside the laboratory.

3.2. Material Properties

The same type of commercial UHPC was utilized in this study. The mixture included 52.5 R Portland cement, 0–2.36 mm quartz sand, silica fume, and 60-nm-fineness nano-powder. Additionally, hooked-end steel fiber with a volume ratio of 2% and super-plasticizers with a water-reduced ratio of 40% were also adopted in the concrete. At least three Ф100 × 200 cylinder specimens in each series were prepared to determine the material properties of the hardened concrete on the test day, which were cast and cured under the same conditions as the push-out counterparts. As listed in Table 1, the cylinder compressive strength fc and splitting tensile strength ft for each batch were higher than 150 MPa and 10 MPa, respectively. The elastic modulus Ec and Poisson’s ratio v can also be found in Table 1.
In addition, the tensile performances of steel productions were also tested, as shown in Table 1. The same type of ML 15 stud was adopted in this study, with a measured elastic modulus Es, yield strength fy, and ultimate strength fu of about 205,000, 330, and 440 MPa, respectively. Furthermore, Q235B steel with an actual fy of 253.29 MPa and fu of 425.03 MPa was used for the steel beam.

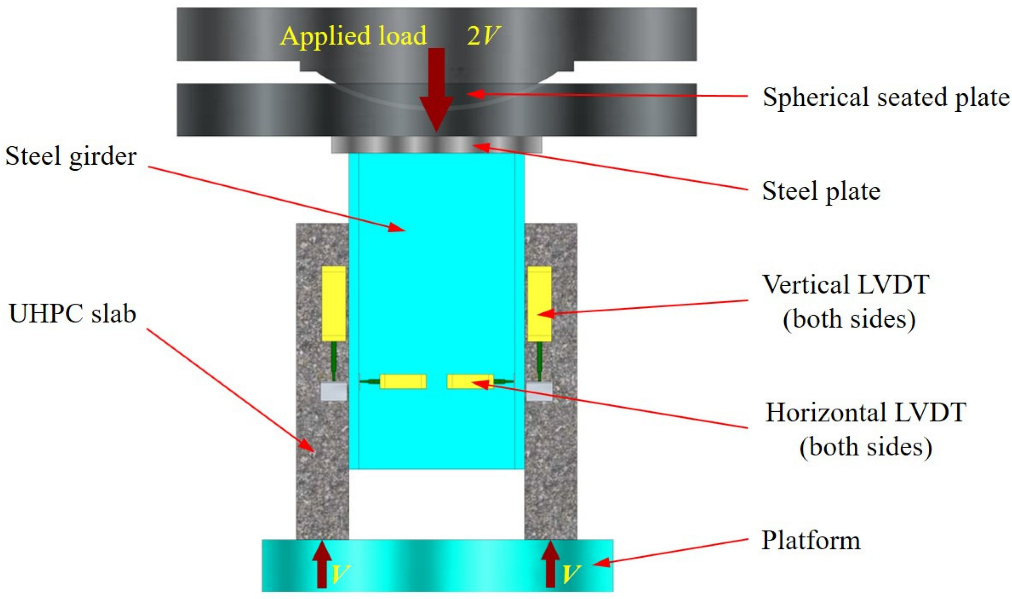
3.3. Test Setup and Loading Procedures

The test setup for the experiment is presented in Figure 3. To conduct the push-out test, a loading machine with a capacity of 500 T was utilized. A spherically seated plate was embedded in the machine to minimize the bending moments. Additionally, a steel plate was placed on the steel beam, guaranteeing uniform loading on each slab. Four vertical linear variable displacement transformers (LVDTs) were assembled at the half-slab height to record the steel–concrete slip, whereas four additional LVDTs were installed at the same height to measure the steel–concrete uplift.
A 25-cycle loading–unloading process with an amplitude ranging from 5% to 40% of the ultimate shear capacity was performed at a rate of 10 kN/s first, as recommended in Clause B.2.4 of Eurocode 4 [9]. In the testing stage, a displacement control loading process was adopted at a speed of 0.3 mm/min. The loading was paused at an interval of 0.05 mm to observe the crack patterns. The loading procedures were finished once the fracture of the studs occurred.

4. Experiment Results and Discussion
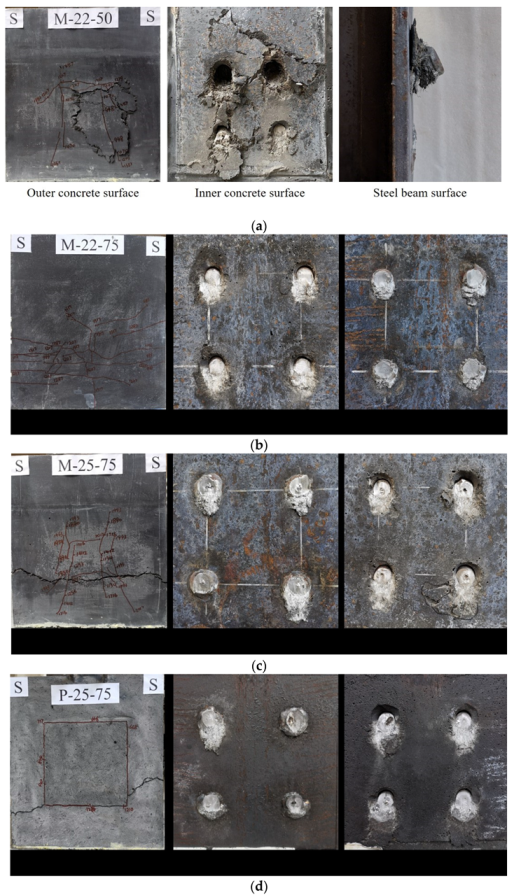
4.1. Failure Modes

The failure modes for the specimens are presented in Figure 4, which are also summarized in Table 2. Generally, all the specimens exhibited similar crack patterns. Taking specimen M-22-75 as an example, visible horizontal and vertical cracks were observed on the outer concrete surface. The horizontal cracks may have resulted from the combination of the out-of-plane bending moment and the stud punching action [23]. The vertical cracks may be related to the stud splitting action. Owing to the bridge effect of the steel fibers, only fine cracks could be observed until the end of the experiments. However, the push-out test failed in the stud fracture, with apparent concrete crushing adjacent to the roots of the shear connectors (as shown in Figure 4b). This indicates that the zones underneath the stud roots were in complex stress conditions.
For the specimen with a short stud in the thinnest slab (M-22-50), apparent concrete spalling was found on the outer slab surface. On the inner concrete surface, serious concrete crushing and spalling was noticed. Along with the stud fracture, a protruding stud can also be seen (Figure 4a). These observations mean that the 50-mm-thick UHPC slabs could not provide enough tensile resistance to prevent concrete failure. These phenomena also indicate that the aspect ratio of 1.59 might be too close to the critical value for short studs in thin UHPC slabs with a thickness of 50 mm. A significant horizontal crack can be observed on the outer slab surface of a monolithic specimen with a large stud 25 mm in diameter (M-25-75). Furthermore, small concrete spalling was found below the studs (Figure 4c). Thus, the tensile stress caused by the out-of-plane bending moment exceeded the tensile strength of the UHPC. Additionally, the concentrated stress below the stud roots for M-25-75 was higher than that of M-22-75. As for the specimen with precast concrete slabs (P-25-75), the cracking was first observed along the slab–pocket interface. This result demonstrates that the shear behavior of the specimens with the precast slab was limited to the properties of the pocket–slab interface. Similar to those observed in specimen M-25-75, an apparent horizontal bending crack on the outer concrete surface and minor concrete spalling near the shear connector roots can also be found, as depicted in Figure 4d.

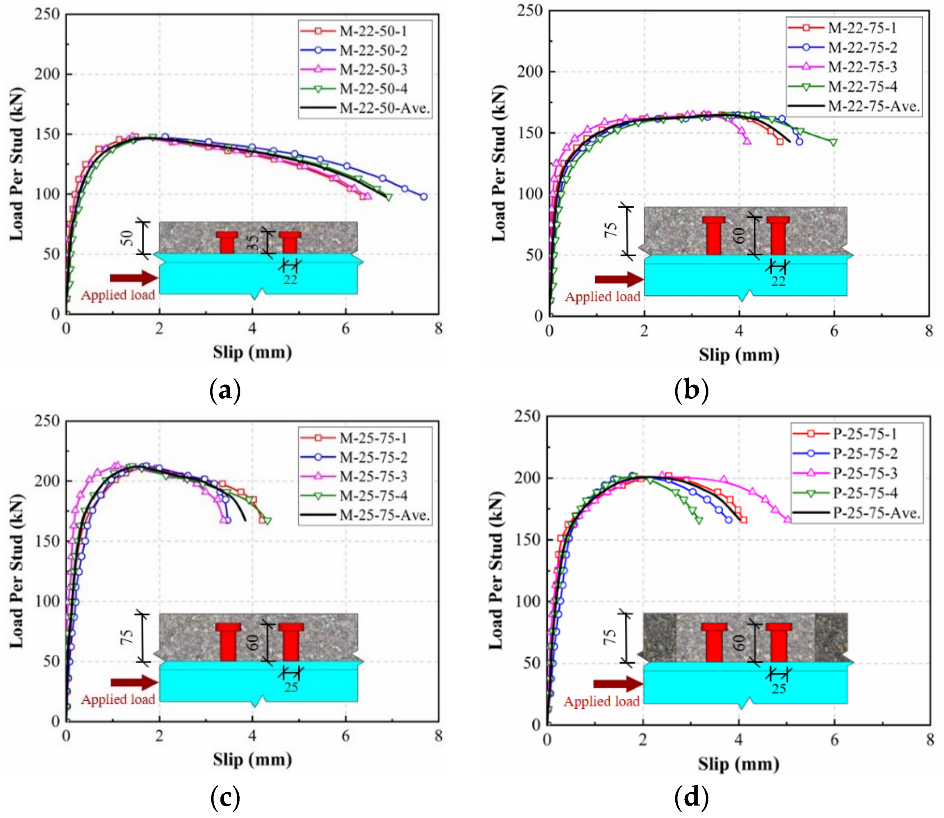
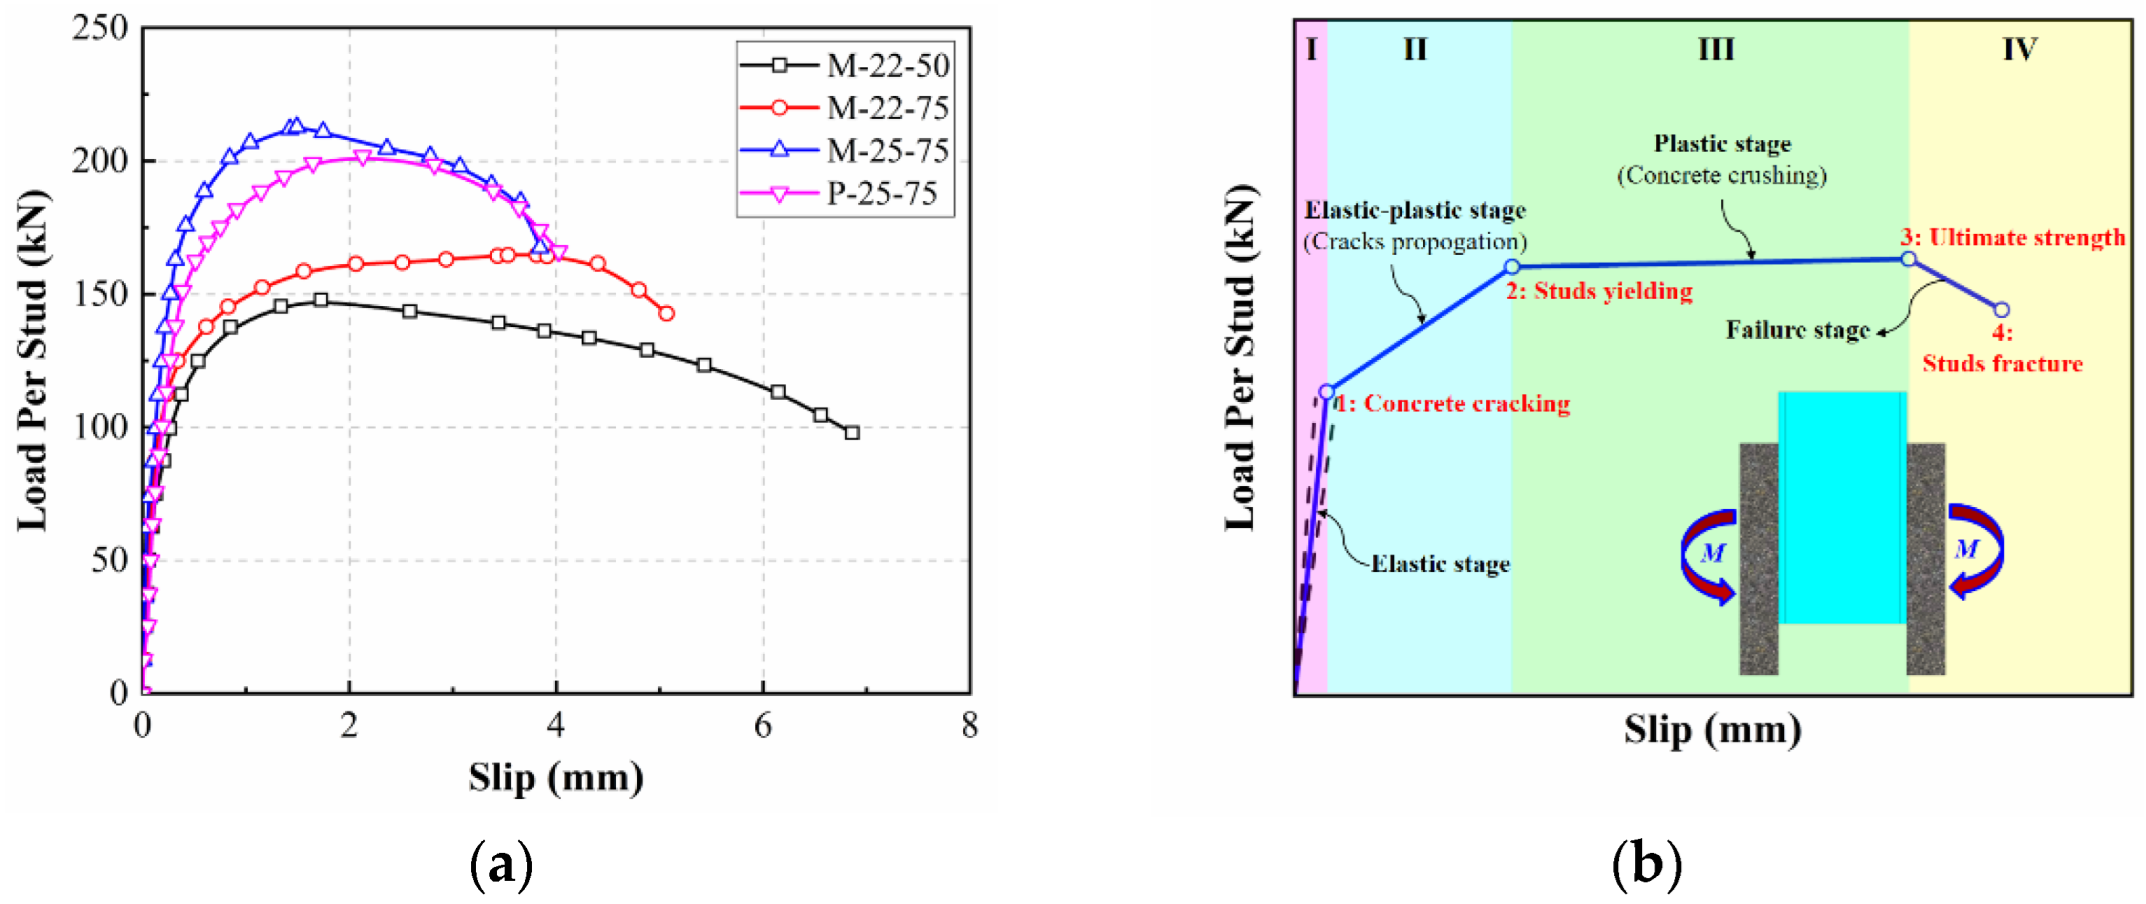
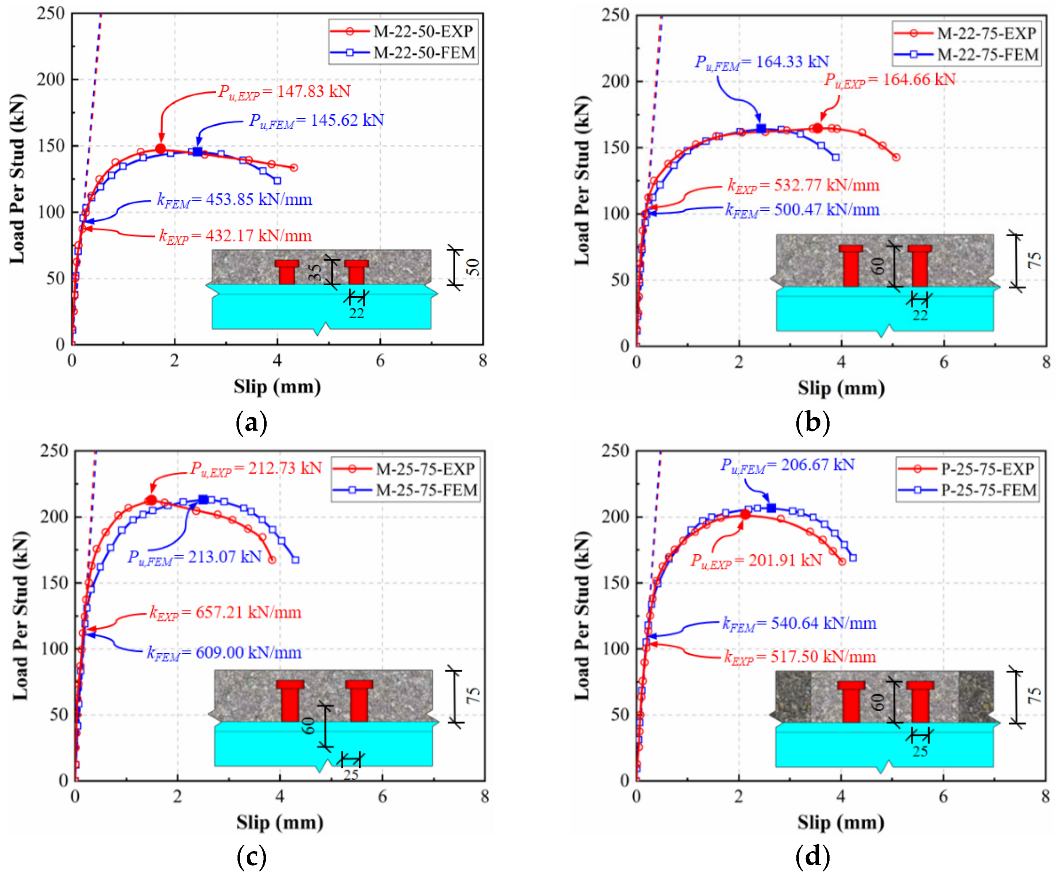
4.2. Load–Slip Curves

The load–slip curves recorded on different vertical LVDTs of each specimen are shown in Figure 5. Minor deviations can be observed among the results obtained from the various LVDTs. Thus, the average value of the four vertical LVDTs was adopted to represent the steel–concrete interface slippage of the push-out specimens in the following discussion. For comparison, the shear capacity of the connector herein was determined as the applied load divided by the number of shear connectors in a push-out specimen.
The comparison of average load–slip curves for all the specimens can be found in Figure 6a. As described by the continuous solid line in Figure 6b, all the curves exhibited high similarity. Before the cracking of concrete slabs, the specimens presented ideal linear elastic behavior. Once the out-of-plane bending moment M was larger than the tensile resistance, cracks were formed on the outer slab surface, corresponding to the beginning of the elastic–plastic stage. With an increasing load, the shear capacity of the push-out test increased constantly, with a diminishing slope. When reaching the yielding strength of the studs, the load–slip response presented a typical plastic performance. The shear capacity was kept constant even with a significant steel–concrete slip. After achieving the ultimate strength of the studs, the shear capacity of the push-out test decreased until the stud fracture occurred.

4.3. Shear Performance of Short Stud Shear Connectors

To further investigate the shear performance of short stud shear connectors in steel–UHPC composite structures, the ultimate shear strength Pu, initial shear stiffness k, and ductility were discussed in this section. In Table 2, the results for the individual stud shear connectors are summarized. The initial shear stiffness k was defined as the secant slope of the load–slip curve at a slip of 0.2 mm. For the ductility, both the slip capacity δu at 0.9Pu in the post-peak load stage and the characteristic slip capacity δuk (δuk = 0.9δu) are presented. If the δuk exceeds 6 mm, a shear connector can be regarded as ductile [9].
The ultimate shear strength, initial shear stiffness, and ductility for short studs in the steel–UHPC composite structures improved significantly as the slab thickness increased. Compared to the specimen containing a 50-mm-thick slab (M-22-50), the specimens with a 75-mm-thick slab showed increases of 11.38%, 23.28%, and 11.93% in the Pu, k, and δuk, respectively. Hence, sufficient thickness of the UHPC slab should be ensured to achieve superior structural performance.
Additionally, a variation in the stud diameter from 22 mm to 25 mm resulted in a higher shear capacity and stiffness, whereas it limited the development of the ductility. The ultimate shear capacity Pu and initial shear stiffness k for M-25-75 were 212.73 kN and 657.32 kN/mm, respectively, which were 1.29 and 1.23 times those for M-22-75. However, the characteristic slip capacity δuk for M-25-75 (3.02 mm) was only 68.48% for M-22-75 (4.41 mm). Thus, the deformation ability of a large-diameter short stud shear connector should be well considered.
Furthermore, the specimen with a precast slab showed a comparative shear resistance and initial shear stiffness, but a preferable slip capacity. Compared to specimen M-25-75, the decrease in the Pu for P-25-75 was only 10.82 kN, while the enhancement in the slip capacity for P-25-75 was 8.94% of that of M-25-75. Therefore, steel–UHPC composite structures with precast slabs can be considered for the sake of shortening the construction period.
Additionally, Eurocode 4 also provides shear predictions that correspond to the failure modes. For stud fracture, the shear strength was related to the stud ultimate tensile strength fu and the cross-section area As, considering a partial factor γv of 1.25 (Pcode-s = 0.8fu(πd2/4)/γv). For concrete crushing, the shear prediction was a function of the stud height h, stud diameter d, concrete strength fc, and elastic modulus Ec (Pcode-c = 0.058(h/d+1)d2(fc′Ec)1/2/γv). The comparisons between the shear prediction from Eurocode 4 and the experiments are presented in Table 2. For the tests in this study, the prediction for the Pcode-s was smaller than the Pcode-c, indicating that the predicting failure mode was stud fracture rather than concrete crushing. However, all the shear predictions for stud fracture presented conservative results, with the Pcode-s/Pu ranging from 0.64 to 0.71. Except for M-22-50, the calculated results for concrete crushing overestimated the shear strength, with the error varying from 17% to 29%.

5. Finite Element Analysis
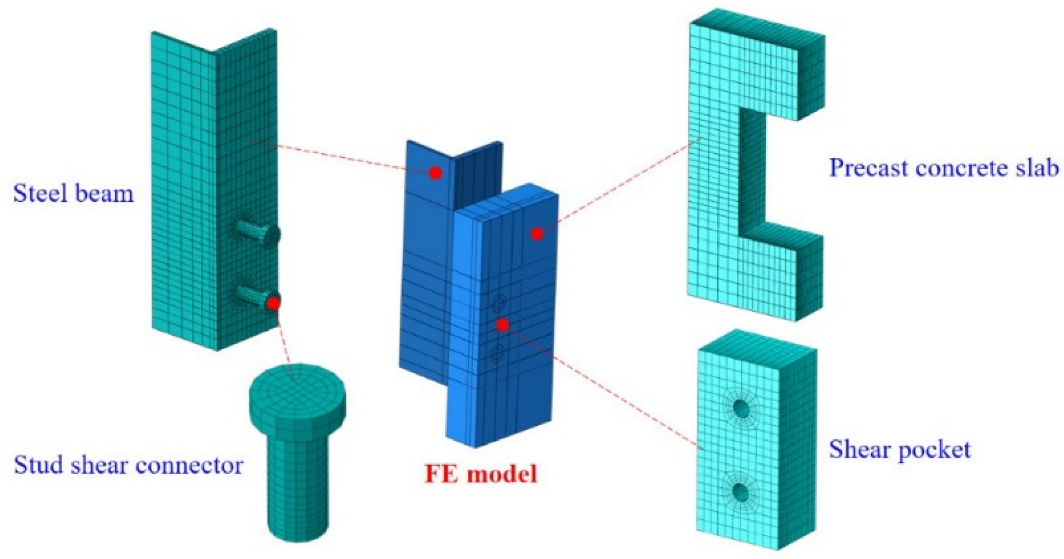
5.1. FE Model

To further investigate the shear performance of short studs in steel–UHPC composite structures, FE analysis was carried out with the commercial software ABAQUS. Considering the symmetry of the geometry and boundary conditions, only a quarter of the push-out test was established for the reduction in the computational effort, as presented in Figure 7. Taking specimens with precast slabs as an example, the main components of the FE model included the steel beam, stud shear connector, precast concrete slab, and shear pocket. Both geometric and material non-linearities were taken into account in the FE model. The element type and mesh, interaction and contact conditions, boundary conditions and load application, as well as the constitutive law for the materials are described in detail in the following sections.

5.1.1. Element Type and Meshing

Eight-node 3D solid elements with reduced integration (C3D8R) were employed to simulate the steel beam, stud, slab, and shear pocket. The C3D8R element can provide reasonable accuracy and prevent unexpected shear locking difficulties. To ensure a proper compromise between the computational speed and calculated accuracy, a sensitivity analysis was conducted for the FE model. Furthermore, identical mesh generations were adopted on the matching surface of the contact pair, which can obtain more accurate results and avoid the convergence problem as much as possible. The outline of the meshing for all the components is also presented in Figure 7. Due to the stress concentration and significance, a finer mesh with a mesh size varying from 2 to 5 mm was applied in the regions adjacent to the stud roots to achieve more accurate and detailed results. Correspondingly, coarser meshing with a local size of 10 mm for the shear pocket and an overall size of 20 mm for the precast slab and steel beam was adopted to further promote the calculated efficiency.

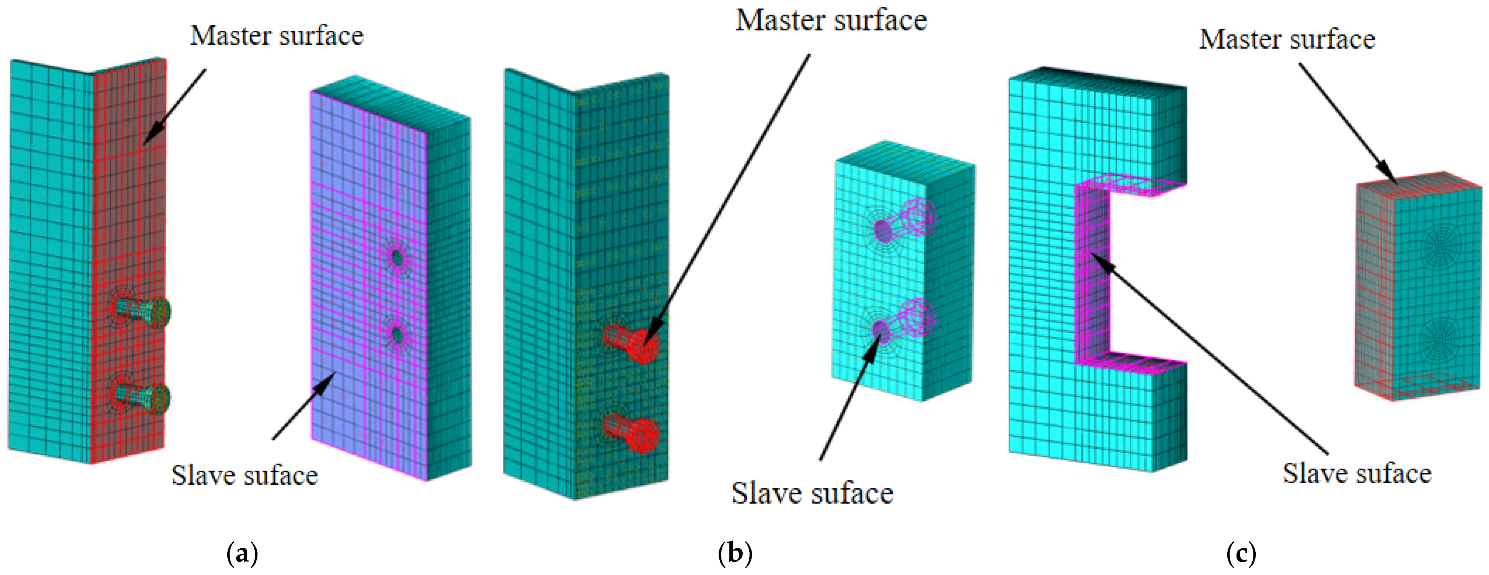
5.1.2. Interaction and Contact Conditions

The contact conditions of the FEM model are presented in Figure 8. The surface-to-surface contact provided in ABAQUS was taken into account to define the interactions of the contact pairs. Generally, the contact pairs included the steel beam-to-concrete slab and the head stud-to-concrete, whereas the precast slab-to-shear pocket interaction should also be considered for specimens with precast slabs. For the former contact pairs, the surfaces of the steel components (steel beam or head stud) were regarded as the master surface, and the corresponding concrete surfaces were selected as slave surfaces. For the precast slab-to-shear pockets interaction in the case of a specimen with precast slabs, the surface of the shear pocket was defined as the master surface.
Additionally, both the normal and tangential interaction properties were defined for each contact pair. The contact constraint in the normal direction was assumed to be “hard” contact, which could transmit normal contact stress, prevent penetration, and allow possible separation from each other. Moreover, to describe the interaction along the tangential direction, the frictional penalty formulation in ABAQUS was used. The friction coefficient for the contact pairs of stud-to-concrete and slab-to-pocket were 0.25 and 0.60, respectively [24,25]. Since the bonding between the slab and beam was prevented by greasing the steel–concrete interface and was broken at the pre-loading stage, it was assumed to be frictionless for the tangential behavior between the concrete slabs and steel girders.

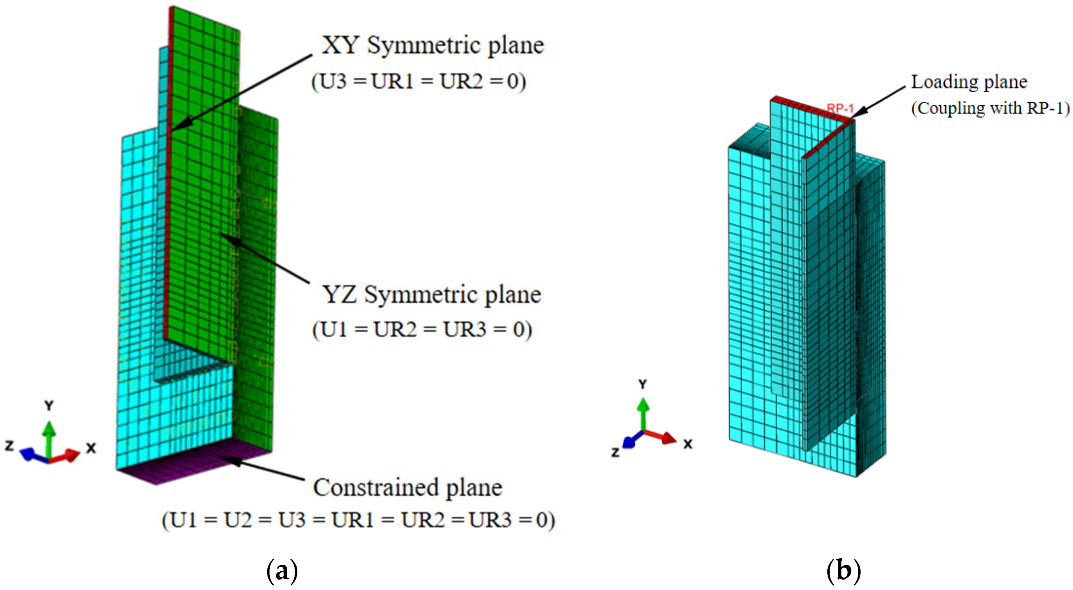
5.1.3. Boundary Conditions and Load Application

In order to accurately simulate the experimental results, appropriate load application and boundary conditions were applied for the FE model, as shown in Figure 9. For the nodes along the middle of the steel beam web (XY symmetric plane), the displacement along the Z directions (U3) and the rotations along the X and Y directions (UR1 and UR2) were restrained to allow for the loading application. Similarly, all the nodes of the steel beam, concrete slab, and the potential shear pocket that lay on the YZ symmetric plane were constrained from moving in the X direction (U1 = UR2 = UR3 = 0) due to the symmetry property, as presented in Figure 9a. In terms of the support conditions, all the translational degrees of freedom were restrained for the nodes of the bottom slab surface (the constrained plane in Figure 9a). Furthermore, a displacement loading along the negative Y direction was applied at the reference point (RP-1), which was coupled to the top surface of the steel beam, as depicted in Figure 9b. The loading was applied to employ a smooth amplitude to avoid fluctuations caused by discontinuous loading rates [26].

5.1.4. Material Modelling

1.
Concrete
Considering the concrete damage observed in the test, the concrete damage plasticity (CDP) model was selected to describe the UHPC behavior. The plasticity parameters in the CDP model of UHPC for the flow potential eccentricity, dilation angels, ratio of the bi-axial/uniaxial compressive strength, K, and viscosity coefficient were 0.1, 36°, 1.16, 0.6667, and 0.0015, respectively. To simulate the damage and failure process of concrete structures, the constitutive relationship of UHPC in compression and tension should be defined independently. As a widely accepted expression, the model suggested by Yang and Fang [27] was adopted to describe the constitutive relationship of UHPC in compression, as shown in Equation (1).
σ c = { f c n ξ ξ 2 1 + ( n 2 ) ξ ε ε 0 f c ξ 2 ( ξ 1 ) 2 + ξ ε > ε 0
where fc = the compressive strength of UHPC, which can be found in Table 1; ξ = the strain ratio, which can be determined as ξ = ε/ε0; ε0 = the strain at ultimate compressive strength, equal to 0.0035 in this study; n = the ratio of elastic modulus, which can be calculated as n = Ec/Ecs; Ec = the tangent modulus at the initial stage, which can be obtained in Table 1; Ecs = the secant modulus at the ultimate compressive strength.
The constitutive relationship of UHPC in tension was based on the model proposed by Zhang et al. [28], as can be seen in Equation (2). Taking into account the fiber bridge effect, the strain–hardening behavior of UHPC in tension was defined in this formula.
σ t = { f c t ε c a ε 0 ε ε c a f c t ε c a ε ε p c f c t 1 ( 1 + w / w p ) p 0 < w
where fct = the average tensile stress at the strain hardening stage, which can be found in Table 1; εca = the peak strain in the elastic stage corresponding to fct; εpc = the ultimate strain, equal to 0.0008; wp = the crack width corresponding to the stress of 2−pfct; p = the experimental fitting parameter, equal to 0.95.
To simulate the damage evolution process, the damage factor D should also be defined. The formula derived from the principle of energy equivalence proposed by Supartono and Sidoroff [29] was adopted to calculate the concrete damage index for UHPC, as presented in Equation (3).
D = 1 σ E 0 ε
2.
Stud shear connectors and steel beams
To define the material properties of the stud shear connectors and steel beams, classic metal plasticity based on the von Mises yield surface with the associated plastic flow was used. The commonly used trilinear model was employed to simulate the notable yielding behavior of the stud shear connector. The yield strength and ultimate strength can be determined through the material coupon tensile tests, which can be found in Table 1. According to the above discussion, no visible damage was observed on the steel beams. Therefore, in the FE analysis, the steel beams were assumed as ideal elastic–plastic materials. The elastic modulus and yield strength were respectively taken as 207,130 and 253.29 MPa in accordance with the material tensile test.

5.2. Verification of FE Modes

As mentioned previously, push-out tests were conducted to examine the effect of the slab thickness, stud diameter, and casting method on the shear performance of short stud shear connectors in steel–UHPC composite structures. The experimental failure modes and load–slip curves were taken into account to verify the FE modes.

5.2.1. Failure Modes

The failure modes from the push-out tests and FE analysis were compared, as depicted in Figure 10. Considering the most serious concrete damage, specimen M-22-50 was taken as an example. Both the contour plot of compressive (DAMAGEC) and tensile (DAMAGET) damage are presented in Figure 10a. The concrete crushing can be reflected by the apparent damage adjacent to the stud roots. Additionally, concrete tensile damage over the stud locations was observed, which was in good agreement with the observed crack patterns.
The Mises stress variation of the stud shear connectors can be obtained from the sliced section, as shown in Figure 10b. Similarly, taking specimen M-22-50 as an example, the root of the front stud yielded first at about 10% of the ultimate shear strength. Almost the whole cross-section reached the yield strength at about 50% of the peak load, resulting in the apparent non-linear behavior. As the applied load increased, the yielded areas further expanded. Finally, the stud fracture occurred at the stud roots, with an apparent reduction in the yielded regions. The Mises stress for the other push-out tests at peak load can also be found in Figure 10b. Due to the larger shear capacity, the overall Mises stress distribution of M-25-75 was more significant than that of M-22-75. Accordingly, it can be concluded that the FE analysis can replicate the failure mode of the push-out tests accurately.

5.2.2. Load–Slip Curves

The load–slip relationships from the FE analysis were compared with those obtained from the push-out tests, as illustrated in Figure 11. The load was obtained as the total reaction forces of RP-1 (see Figure 9b) in the negative Y direction divided by the stud numbers. The slips represent the relative displacement of the nodes on the steel beam and concrete slab, which were in an identical position located at mid-height of the slabs. An apparent coincidence can be noted between the test and simulated results. The variations in the ultimate shear strength between the experimental and analysis results varied from 0.33 to 4.76 kN, which is less than 3% of the corresponding test results. As for the shear stiffness, the differences ranged from 5.02% to 7.34%. A small difference in slip can also be noted. These deviations can be related to the ideal material composition for concrete and studs, neglection of the welded collars in the models, as well as experimental errors. However, the load–slip response can still be effectively captured from the FE analysis.

5.3. Parametric Study

The FE models were acceptable for simulating the mechanical behavior of short stud shear connectors in steel–UHPC composite structures based on the verified results. Parametric studies were then carried out using the FE models developed in this paper. The effects of the stud diameter, stud tensile strength, steel beam tensile strength, monolithic slab concrete strength, precast slab concrete strength, and shear pocket concrete strength on the stud shear behavior were investigated. More details of the FE models for the parametric study are given in Table 3. The load–slip relationships from the parameter study are presented in Figure 12.

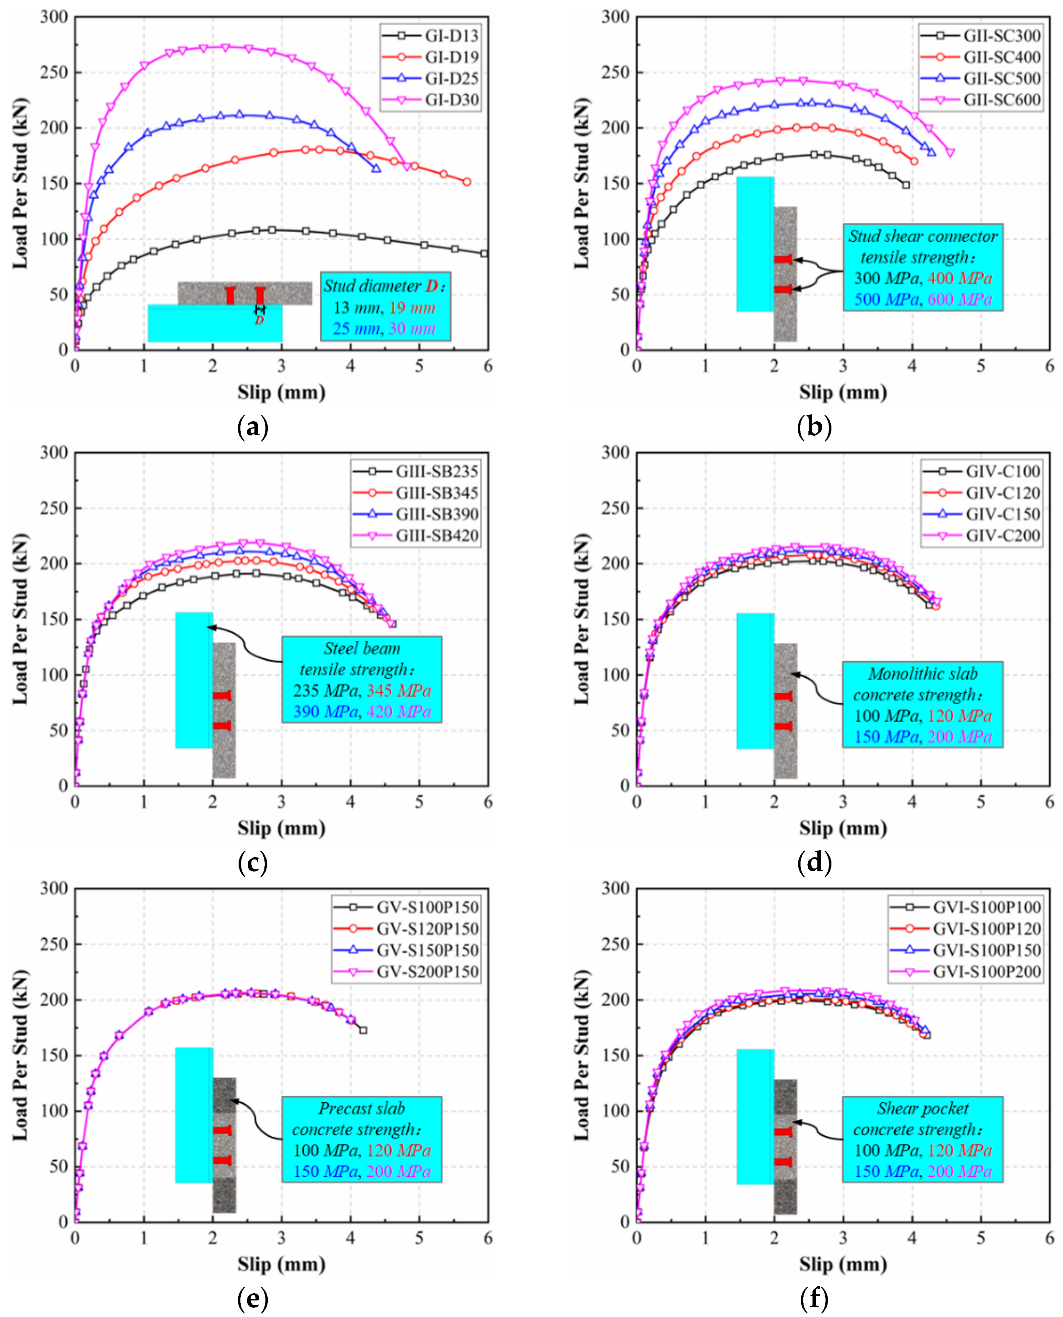
5.3.1. Effect of Stud Diameter

In steel–UHPC composite structures, the stud diameter played an essential role in the load–slip relationship of the short stud shear connectors, as shown in Figure 12a. When the stud diameter varied from 13 to 30 mm, the shear capacity and initial stiffness increased by 152.90% and 205.70%. Hence, it turned out that the stud diameter significantly improved the shear performances of the stud shear connectors in terms of shear capacity and shear stiffness. However, the slip capacity for specimens with stud diameters of 13, 19, 25, and 30 mm were 4.73, 5.13, 3.82, and 3.69 mm, respectively. Thus, there was an optimal stud diameter for achieving a favorable ductility of the stud shear connectors. This means that the choice of stud diameter during the design process should be considered synthetically so as to achieve a reasonable production in terms of strength, stiffness, and ductility.

5.3.2. Effect of Stud Tensile Strength

The effect of the stud tensile strength on the load–slip curves is illustrated in Figure 12b. The ultimate shear capacity and initial shear stiffness for GII-SC600 were 243.11 kN and 691.17 kN/mm, which were 1.38 and 1.42 times those for GII-SC300, respectively. Moreover, a larger slip capacity of 3.86 mm was obtained for GII-SC600 compared to GII-SC300 (3.68 mm). Therefore, adopting stud shear connectors with higher tensile strength might be another effective method to improve the structural performance of steel–UHPC composite structures.

5.3.3. Effect of Steel Beam Tensile Strength

The load–slip responses for specimens with different steel beam tensile strengths are presented in Figure 12c. The shear capacity increased with the increase in the steel beam tensile strength. Compared to GIII-SB235 (Pu of 191.47 kN), the enhancements in the ultimate shear capacity were 11.37, 19.87, and 27.62 kN for GIII-SB345, GIII-SB420, and GIII-SB500, respectively. However, a negligible effect of the steel beam tensile strength on the shear stiffness can be noted, with deviations of less than 2%. Additionally, a minor reduction in the ductility can be observed with the increase in the steel beam tensile strength. A variation in the steel beam tensile strength from 235 to 500 MPa led to a change in the slip capacity from 3.94 mm to 3.79 mm.

5.3.4. Effect of Monolithic Slab Concrete Strength

As depicted in Figure 12d, the monolithic slab concrete strength had a slight influence on the shear performance of the stud shear connectors in steel–UHPC composite beams. A 100% increase in the monolithic slab concrete strength (from 100 MPa to 200 MPa) resulted in only a 6.68% enhancement in the ultimate shear capacity, whereas that for the initial shear stiffness was 4.77%. Moreover, the difference in the slip capacity among the specimens in Group IV was less than 0.02 mm.

5.3.5. Effect of Precast Slab Concrete Strength

The influence of the precast slab concrete strength on the load–slip relationship is illustrated in Figure 12e. No observed deviation can be found for specimens with different precast slab concrete strengths. The difference in the ultimate shear strength was less than 1 kN, while those for the shear stiffness and slip capacity were less than 1 kN/mm and 0.02 mm, respectively.

5.3.6. Effect of Shear Pocket Concrete Strength

In Figure 12f, it can be concluded that the shear pocket concrete strength had a minor effect on the shear capacity and shear stiffness. Increasing the shear pocket concrete strength from 100 MPa to 200 MPa caused improvements in the ultimate shear strength and shear stiffness of approximately 4.64% and 5.01%, respectively. However, a slight decrease in the slip capacity from 3.55 mm to 3.53 mm can be noticed when the shear pocket concrete strength ranged from 100 MPa to 200 MPa.

6. Conclusions

As presented in this study, push-out tests and FE analysis were conducted to investigate the shear performance of short stud shear connectors in steel–UHPC composite structures. The failure modes, load–slip relationship, ultimate shear strength, initial shear stiffness, and slip capacity were experimentally and numerically described in detail. The results obtained in this study can provide design references for steel–UHPC composite structures in civil engineering, mid- or small–span steel–UHPC composite beams in bridge engineering, prefabricated steel–UHPC composite beams for accelerated bridge constructions, and so on. Based on the analysis, the main conclusions are as follows:
  • A stud height-to-diameter ratio larger than 1.59 (35/22) was required for steel–UHPC composite structures with thin UHPC slabs (50 mm thick) to achieve a stud fracture failure.
  • Adopting a thicker UHPC slab can improve the shear performance of short studs, in terms of strength, stiffness, and ductility. Specimens with larger studs can obtain more significant shear capacity and initial shear stiffness, but a smaller slip capacity. Specimens with precast UHPC slabs exhibited a comparative shear resistance and initial shear stiffness but a preferable slip capacity compared to the monolithic counterpart.
  • The FE analysis results agree well with the experimental results of the failure modes, load–slip curves, ultimate shear capacity, and shear stiffness, demonstrating the applicability of the FE models presented in this paper.
  • According to the parametric analysis results, it was indicated that the shear capacity of the short studs was enhanced when the stud diameter, stud tensile strength, and steel beam tensile strength increased. A higher shear stiffness can be obtained in specimens with a larger stud diameter and tensile strength. With an increase in the stud tensile strength, the slip capacity can be improved. The monolithic slab, precast slab, and shear pocket concrete strength had a negligible effect on the shear performance of the short stud shear connectors in steel–UHPC composite beams.

Author Contributions

Conceptualization, S.F. and F.L.; methodology, Z.F. and S.F.; software, Z.F.; validation, S.F. and F.L.; investigation, Z.F. and S.F.; resources, F.L.; data curation, S.F.; writing—original draft preparation, Z.F. and S.F.; writing—review and editing, S.F. and F.L.; visualization, Z.F. and S.F.; supervision, S.F. and F.L.; project administration, F.L.; funding acquisition, F.L. All authors have read and agreed to the published version of the manuscript.

Funding

This research was funded by the National Natural Science Foundation of China under grant No. 12032009 and the Key Special Project for Introduced Talents Team of Southern Marine Science and Engineering Guangdong Laboratory (Guangzhou) under grant No. GML2019ZD0503, in China.

Institutional Review Board Statement

Not applicable.

Informed Consent Statement

Not applicable.

Data Availability Statement

The data presented in this study are available upon reasonable request from the corresponding author.

Conflicts of Interest

The authors declare no conflict of interest.

References

  1. Graybeal, B.A. Structural Behavior of a Prototype Ultra-High Performance Concrete Pi-Girder; Report No. FHWA-HRT-10-027; Federal Highway Administration: McLean, VA, USA, 2009. [Google Scholar]
  2. Dieng, L.; Marchand, P.; Gomes, F.; Tessier, C.; Toutlemonde, F. Use of UHPFRC overlay to reduce stresses in orthotropic steel decks. J. Constr. Steel Res. 2013, 89, 30–41. [Google Scholar] [CrossRef]
  3. Tanarslan, H.M. Flexural strengthening of RC beams with prefabricated ultra high performance fibre reinforced concrete laminates. Eng. Struct. 2017, 151, 337–348. [Google Scholar] [CrossRef]
  4. Noel, M.; Wahab, N.; Soudki, K. Experimental investigation of connection details for precast deck panels on concrete girders in composite deck construction. Eng. Struct. 2016, 106, 15–24. [Google Scholar] [CrossRef]
  5. Jiang, H.B.; Fang, H.Z.; Liu, J.; Fang, Z.C.; Zhang, J.F. Experimental investigation on shear performance of transverse angle shear connectors. Structures 2021, 33, 2050–2060. [Google Scholar] [CrossRef]
  6. Fang, Z.C.; Liang, W.B.; Fang, H.Z.; Jiang, H.B.; Wang, S.D. Experimental investigation on shear behavior of high-strength friction-grip bolt shear connectors in steel-precast UHPC composite structures subjected to static loading. Eng. Struct. 2021, 244, 112777. [Google Scholar] [CrossRef]
  7. Fang, Z.C.; Jiang, H.B.; Chen, G.F.; Dong, X.T.; Shao, T.F. Behavior of grouped stud shear connectors between precast high-strength concrete slabs and steel beams. Steel Compos. Struct. 2020, 34, 837–851. [Google Scholar]
  8. American Association of State Highway and Transportation Officials (AASHTO). AASHTO LRFD Bridge Design Specifications, 7th ed.; American Association of State Highway and Transportation Officials: Washington, DC, USA, 2014. [Google Scholar]
  9. CEN Eurocode. 4: Design of Composite Steel and Concrete Structure: Part 1-1: General Rules and Rules for Buildings; European Committee for Standardization (CEN): Brussels, Belgium, 2004. [Google Scholar]
  10. Kim, J.S.; Kwark, J.W.; Joh, C.B.; Yoo, S.W.; Lee, K.C. Headed stud shear connector for thin ultrahigh-performance concrete bridge deck. J. Constr. Steel Res. 2015, 108, 23–30. [Google Scholar] [CrossRef]
  11. Cao, J.H.; Shao, X.D.; Deng, L.; Gan, Y.D. Static and fatigue behavior of short-headed studs embedded in a thin ultrahigh-performance concrete layer. J. Bridge Eng. 2017, 22, 4017005. [Google Scholar] [CrossRef]
  12. Wang, J.Y.; Guo, J.Y.; Jia, L.J.; Chen, S.M.; Dong, Y. Push-out tests of demountable headed stud shear connectors in steel-UHPC composite structures. Compos. Struct. 2017, 170, 69–79. [Google Scholar] [CrossRef]
  13. Wang, J.Q.; Qi, J.N.; Tong, T.; Xu, Q.Z.; Xiu, H.L. Static behavior of large stud shear connectors in steel-UHPC composite structures. Eng. Struct. 2019, 178, 534–542. [Google Scholar] [CrossRef]
  14. Hu, Y.Q.; Yin, H.G.; Ding, X.M.; Li, S.; Wang, J.Q. Shear behavior of large stud shear connectors embedded in ultra-high-performance concrete. Adv. Struct. Eng. 2020, 23, 3401–3414. [Google Scholar] [CrossRef]
  15. Qi, J.N.; Tang, Y.Q.; Cheng, Z.; Xu, R.; Wang, J.Q. Static behavior of stud shear connectors with initial damage in steel-UHPC composite bridges. Adv. Concr. Constr. 2020, 9, 413–421. [Google Scholar]
  16. Luo, Y.B.; Hoki, K.; Hayashi, K.; Nakashima, N. Behavior and strength of headed Stud–SFRCC shear connection. I: Experimental study. J. Struct. Eng. 2016, 142, 04015112. [Google Scholar] [CrossRef]
  17. Xu, Q.Z.; Lu, K.W.; Wang, J.Q.; Yao, Y.M. Performance of large-diameter studs in thin ultra-high performance concrete slab. Structures 2021, 34, 4936–4951. [Google Scholar] [CrossRef]
  18. Wang, J.Q.; Xu, Q.Z.; Yao, Y.M.; Qi, J.N.; Xiu, H.L. Static behavior of grouped large headed stud-UHPC shear connectors in composite structures. Compos. Struct. 2018, 206, 202–214. [Google Scholar] [CrossRef]
  19. Fang, Z.C.; Jiang, H.B.; Xiao, J.; Dong, X.T.; Shao, T.F. Shear performance of UHPC-filled pocket connection between precast UHPC girders and full-depth precast concrete slabs. Structures 2021, 29, 328–338. [Google Scholar] [CrossRef]
  20. Tong, L.W.; Chen, L.H.; Wen, M.; Xu, C. Static behavior of stud shear connectors in High-Strength-Steel–UHPC composite beams. Eng. Struct. 2020, 218, 110827. [Google Scholar] [CrossRef]
  21. Ding, J.N.; Zhu, J.S.; Kang, J.F.; Wang, X.C. Experimental study on grouped stud shear connectors in precast steel-UHPC composite bridge. Eng. Struct. 2021, 242, 112479. [Google Scholar] [CrossRef]
  22. Fang, Z.C.; Fang, H.Z.; Huang, J.X.; Jiang, H.B.; Chen, G.F. Static behavior of grouped stud shear connectors in Steel–Precast UHPC composite structures containing thin full-depth slabs. Eng. Struct. 2022, 252, 113484. [Google Scholar] [CrossRef]
  23. Ataei, A.; Zeynalian, M.; Yazdi, Y. Cyclic behaviour of bolted shear connectors in steel-concrete composite beams. Eng. Struct. 2019, 198, 109455. [Google Scholar] [CrossRef]
  24. Wang, S.D.; Fang, Z.C.; Chen, G.F.; Jiang, H.B.; Teng, S. Numerical analysis on shear behavior of grouped head stud shear connectors between steel girders and precast concrete slabs with high-strength concrete-filled shear pockets. J. Bridge Eng. 2021, 26, 04021030. [Google Scholar] [CrossRef]
  25. American Concrete Institute (ACI). 318-14. Building Code Requirements for Structural Concrete; American Concrete Institute: Farmington Hills, MI, USA, 2014. [Google Scholar]
  26. Zhuang, B.; Liu, Y.; Yang, F. Experimental and numerical study on deformation performance of rubber-sleeved stud connector under cyclic load. Constr. Build. Mater. 2018, 192, 179–193. [Google Scholar] [CrossRef]
  27. Yang, J.; Fang, Z. Research on stress-strain relation of ultra high performance concrete. Concrete 2008, 7, 11–15. [Google Scholar]
  28. Zhang, Z.; Shao, X.D.; Li, W.G.; Zhu, P.; Chen, H. Axial tensile behavior test of ultra high performance concrete. China J. Highw. Transp. 2015, 28, 50–58. [Google Scholar]
  29. Supartono, F.; Sidoroff, F. Anisotropic damage modeling for brittle elastic materials. Arch. Mech. 1985, 37, 521–534. [Google Scholar]
Figure 1. Details of specimens (unit: mm).
Buildings 12 00418 g001
Figure 2. Fabrication procedure of test specimens: (a) for monolithic casting specimen; (b) for precast slab specimen.
Buildings 12 00418 g002
Figure 3. Test setup for push-out tests.
Buildings 12 00418 g003
Figure 4. Fabrication procedure of test specimens: (a) specimen M-22-50; (b) specimen M-22-75; (c) specimen M-25-75; (d) specimen P-25-75.
Buildings 12 00418 g004
Figure 5. Load–slip curves for each specimen: (a) specimen M-22-50; (b) specimen M-22-75; (c) specimen M-25-75; (d) specimen P-25-75.
Buildings 12 00418 g005
Figure 6. Load–slip relationships: (a) comparison of load–slip relationships; (b) general load–slip response.
Buildings 12 00418 g006
Figure 7. Overall FE model of the push-out test.
Buildings 12 00418 g007
Figure 8. Contact conditions of the FEM model: (a) steel beam-to-concrete slab; (b) head stud-to-concrete; (c) precast slab-to-shear pocket.
Buildings 12 00418 g008
Figure 9. Boundary conditions and load application: (a) boundary conditions; (b) load application.
Buildings 12 00418 g009
Figure 10. Comparison of failure modes from experimental and FE analysis: (a) concrete damage (taking M-22-50 as an example); (b) stud Mises stress.
Buildings 12 00418 g010
Figure 11. Comparison of load–slip curves from experimental and FE analysis: (a) specimen M-22-50; (b) specimen M-22-75; (c) specimen M-25-75; (d) specimen P-25-75.
Buildings 12 00418 g011
Figure 12. Load–slip relationship from parameter study: (a) effect of stud diameter; (b) effect of stud tensile strength; (c) effect of steel beam tensile strength; (d) effect of monolithic slab concrete strength; (e) effect of precast slab concrete strength; (f) effect of shear pocket concrete strength.
Buildings 12 00418 g012
Table 1. Material properties.
Typesfc (MPa)ft (MPa)Ec (MPa)v
ConcretePrecast slab156.610.3428900.205
Shear pocket (former)159.110.8435680.206
Shear pocket (latter) and monolithic slab150.510.2425890.208
Typesϕ22 studϕ25 studSteel beam
SteelEs (MPa)205300208500207130
fy (MPa)331.28332.36253.29
fu (MPa)431.25451.82425.03
Table 2. Summary of test results.
SpecimenAspect
Ratio
Pu
(kN)
k
(kN/mm)
δu
(mm)
δuk
(mm)
Pcode-s
(kN)
Pcode-s/PuPcode-c
(kN)
Pcode-c/PuFailure Mode
M-22-501.59147.83432.174.383.94104.920.71147.261.00Stud fracture/pulling-out and concrete spalling
M-22-752.73164.66532.774.904.41104.920.64212.071.29Stud fracture
M-25-752.40212.73657.213.363.02141.940.67249.631.17Stud fracture
P-25-752.40201.91517.503.663.29141.940.70249.631.24Stud fracture
Note: Pu = ultimate shear strength; k = initial shear stiffness; δu = slip capacity; δuk = characteristic slip capacity.
Table 3. Summary of test results.
GroupSpecimenStud Diameter
(mm)
Stud Tensile Strength
(MPa)
Steel Beam Tensile Strength
(MPa)
Concrete StrengthCasting Method
Slab
(MPa)
Shear Pocket
(MPa)
IGI-D1313452425150-Monolithic
GI-D1919
GI-D2525
GI-D3030
IIGII-SC30025300425150-Monolithic
GII-SC400400
GII-SC500500
GII-SC600600
IIIGIII-SB23525452235150-Monolithic
GIII-SB345345
GIII-SB390390
GIII-SB420420
IVGIV-C10025452425100-Monolithic
GIV-C120120
GIV-C150150
GIV-C200200
VGV-S100P15025452425100150Precast
GV-S120P150120
GV-S150P150150
GV-S200P150200
VIGVI-S100P10025452425100100Precast
GVI-S100P120120
GVI-S100P150150
GVI-S100P200200
Publisher’s Note: MDPI stays neutral with regard to jurisdictional claims in published maps and institutional affiliations.

