1. Introduction
Obtaining accurate thermal resistance values for insulation products is important in the design of buildings which are thermally comfortable, durable, healthy, and energy efficient.
Closed-cell foam insulation materials, such as polyisocyanurate (PIR), extruded polystyrene (XPS) and spray polyurethane foam are the most widely used globally in the construction industry, due to their high thermal performance for a relatively low cost. These materials are designed to retain the gaseous, high molecular weight, blowing agents (BAs) used in their production. This BA provides a lower thermal conductivity than air resulting in a lower thermal conductivity. However, over time, air diffuses into the cell matrix, while the BA dissolves into the cell membranes and diffuses outwards, resulting in an increase in thermal conductivity.
Standards have been developed to measure this effect using an accelerated aging ‘slicing and scaling’ method (ASTM, 2012 [
1]; ULC, 2015 [
2]; ISO, 1999 [
3]), whereby thin slicing of foam specimens is used to accelerate gas diffusion. At present, these standards specify that thermal resistance be determined at one mean temperature only and aging of the material be conducted in laboratory conditions at a single temperature. However, it is well known that thermal resistance of insulation materials varies considerably with temperature. Moreover, some BAs undergo phase change within the in-service temperature range of the insulation material, which results in a non-linear relationship between thermal conductivity and temperature (Bomberg et al., 1991 [
4]; Bogdan et al., 2005 [
5]; Schumacher et al., 2014 [
6]), which is evident in PIR insulation.
Temperature dependent thermal resistance values are an important input parameter for Heat, Air, Moisture Transfer (HAMT) models, used to predict the response of building envelopes to climatic loads, and the impacts on building material durability, prediction of mould growth, and thermal performance. Finch et al. (2014) [
7] used EnergyPlus whole building energy modelling to compare the effect of using a single constant thermal conductivity against temperature dependent values for flat roof insulated with stone wool and PIR. The PIR system was found to have the lowest heating energy consumption when using constant values; however, stone wool had the lowest consumption with temperature dependency included. Berardi and Naldi (2017) [
8] used the HAMT software WUFI to compare the impact of using measured temperature dependent thermal conductivity values in comparison to a constant thermal conductivity based on measurements made at 24 °C and the linear default WUFI gradient of 0.0002 W/mK per unitary increase of temperature on heat flux through both typical wall and flat roof constructions in Toronto and Milan. The most significant differences were found for PIR insulation as a result of its non-linear temperature dependency. Moreover, designers rely on accurate R-values for specifying insulation type and thickness to provide occupant thermal comfort for a particular climate and for calculating heating and cooling loads for the correct sizing of HVAC systems. Having access to more accurate temperature dependent thermal resistance data will allow designers to provide more efficient and durable buildings and be in a stronger position to predict the effect of future climatic changes on buildings.
In-service temperature conditions of the insulation may also affect the aging process. The effect of elevated temperature on the aging of closed-cell foam insulation has been investigated as part of accelerated aging studies and found to not have a long-term effect (Bomberg and Gilbo, 1989 [
9]). Berardi (2019) [
10] investigated the impact of elevated temperatures, elevated humidity, and freeze thaw cycling on the aging of closed cell foam insulation. Freeze-thaw samples were exposed to high moisture levels following 150 cycles to compare the impact of moisture before and after freeze-thaw cycling. The isolated effect of low temperatures on aging (below the condensation point of BAs) has received little attention.
There are also limited data available for the long-term temperature dependent thermal conductivity of closed-cell foam materials and a need to consider its impact on whole building performance (Eleftheriadis and Hamdy, 2017 [
11]; de Wilde et al., 2011 [
12]; Waddicor et al., 2016 [
13]).
This study therefore aims to provide new data on the performance of closed-cell foam insulation performance: the impact of aging temperature on long term performance of the insulations including changes in the thermal conductivity versus temperature relationship. This study has focused on PIR and XPS insulations, two common closed cell foam insulations. This was done as part of a larger study on impact of climate change on the resiliency of buildings as well as impact of climate change on the building code requirements related to the performance of building materials.
2. Materials and Methods
Four materials were tested in this study: three paper faced, Type II Class I (ASTM, 2017b [
14]), PIR boards from different manufacturers and one, Type IV (ASTM, 2017a [
15]), XPS board (
Table 1).
The test procedures used in this study followed CAN/ULC-S770 (ULC, 2015 [
2]); however, additional elements were added to the procedure to account for the variation in thermal conductivity with temperature and the impact of temperature on aging of the foams. The thermal conductivities of full thickness boards were measured at 11 different mean temperatures within 2 weeks of manufacture; sliced specimens were measured at 11 different mean temperatures following the aging period, and three sets of specimens were created and laboratory conditioned at three different temperatures. Selection of mean temperatures was informed by those provided in ASTM C1058 (ASTM, 2010 [
16]), along with the inclusion of extra test points to improve capture of non-linear temperature dependent relationships, particularly for the PIR boards. Conditioning temperatures were achieved by placing specimens in a Precision Scientific 645 oven with a temperature of 50 ± 1 °C, a Wood Company WF20 freezer with a temperature of −10 ± 3 °C, and in laboratory conditions of 23 ± 1 °C. The test procedure was conducted as follows:
Insulation panels were delivered from the manufacturers within 1 week of production.
Panels were conditioned in the laboratory for approximately 2 days at 23 °C and 50%RH.
One specimen of 600 × 600 mm was cut from the centre of one panel using a vertical band-saw, and the thermal resistance determined using a Heat Flow Meter (HFM) at a mean temperature of 24 °C in accordance with ASTM C518 (ASTM, 2004 [
17]).
Following completion of the measurement, the 600 × 600 mm specimen was cut into quarters of 300 × 300 mm.
Three of the 300 × 300 mm specimens were sliced using a horizontal bandsaw to produce 10 mm thick specimens. One full thickness 300 × 300 mm specimen was retained.
Specimen thicknesses were measured using a Mitutoyo digimatic indicator with a resolution of 0.0005 in. (0.01 mm) in 9 places including the centre point and four corners.
Specimens were placed in sets of four core slices and four surface slices and tested simultaneously in accordance with ASTM C518 at a mean temperature of 24 °C (ASTM, 2004 [
17]).
Steps 3 to 6 were repeated for a further two panels.
The three retained 300 × 300 mm full thickness specimens were tested in accordance with ASTM C518 at eleven mean temperatures (
Table 2) (ASTM, 2004 [
17]).
Mean slice thickness (L1) and mean full product thickness (L2) were used to calculate the aging period of the sliced specimens (t1) which equates to an aging period of the full thickness product (t2) (Equation (1)).
Each set of core and surface slices and a full thickness specimen were conditioned at a different temperature, −10 ± 3 °C, 23 ± 1 °C and 50 ± 1 °C as indicated in the following steps.
Following conditioning for the calculated equivalent 5-year-period, the core and surface slices were tested in accordance with ASTM C518 at eleven mean temperatures (
Table 2) (ASTM, 2004 [
17]).
Following conditioning for the equivalent 15-year-period, the core and surface slices of PIR II and XPS I were retested in accordance with ASTM C518 at eleven mean temperatures (ASTM, 2004 [
17]).
The stacks of core and surface slices were only initially tested at a mean temperature of 24 °C, so as to not affect the aging process through large temperature changes and therefore conform to CAN/ULC-S770. The aging factors (Equation (2)) could therefore only be calculated at a mean temperature of 24 °C.
4. Results and Discussion
4.1. Effect of Conditioning Temperature on LTTR at Mean Test Temperature of 24 °C
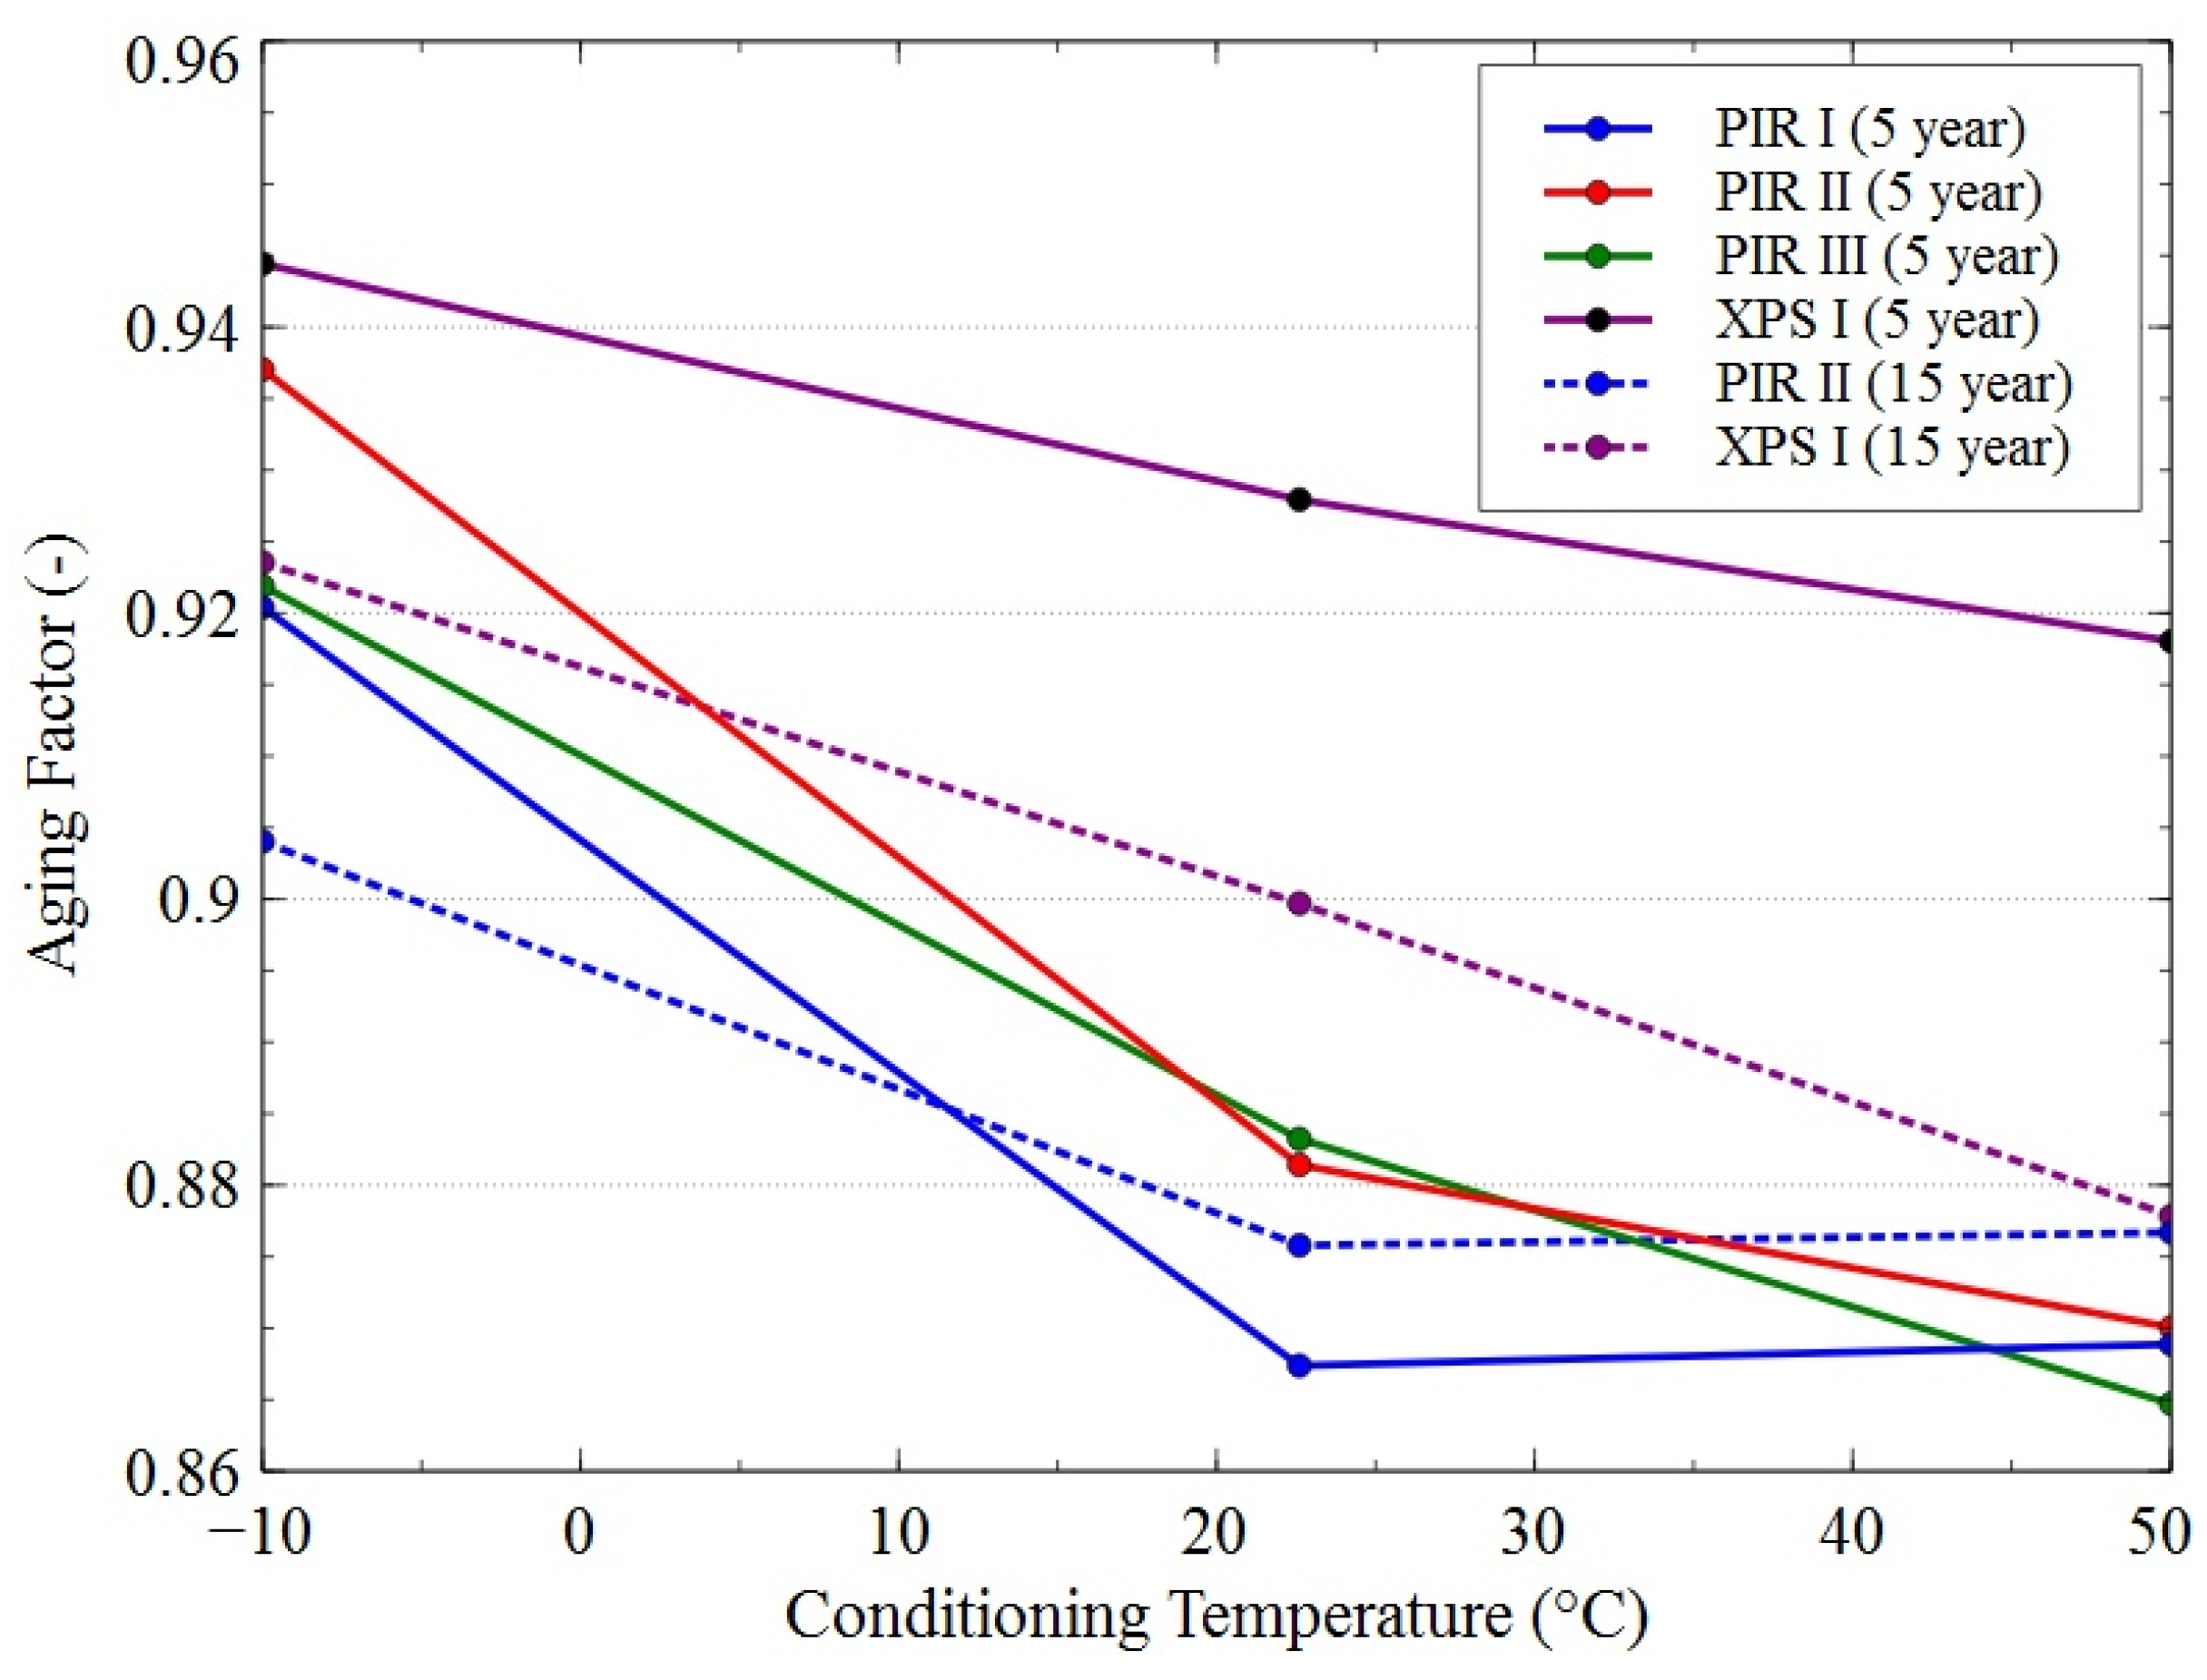
Figure 1 shows the effective aging factors (A
eff) for specimens conditioned at different temperatures for both the equivalent of 5 and 15 years. The PIR specimens followed a similar pattern, where the difference between conditioning at 23 °C and 50 °C was small in comparison to between −10 °C and 23 °C. Conditioning at −10 °C resulted in a 6% to 8% increase in thermal conductivity from the initial value at the 5-year point, whereas conditioning at 23 °C to 50 °C resulted in a 12% to 14% increase in thermal conductivity. For PIR II at the 15-year point, aging appeared to have ceased for specimens conditioning at 23 °C and 50 °C, while the specimens conditioned at −10 °C continued aging. The XPS underwent less aging at all temperatures over the 5-year equivalent period than the PIR specimens, with a maximum of 8% increase in thermal conductivity at 50 °C (
Figure 1). However, at the 15-year point aging had continued for all specimens, increasing a further 2% at −10 °C and 4% at 50 °C.
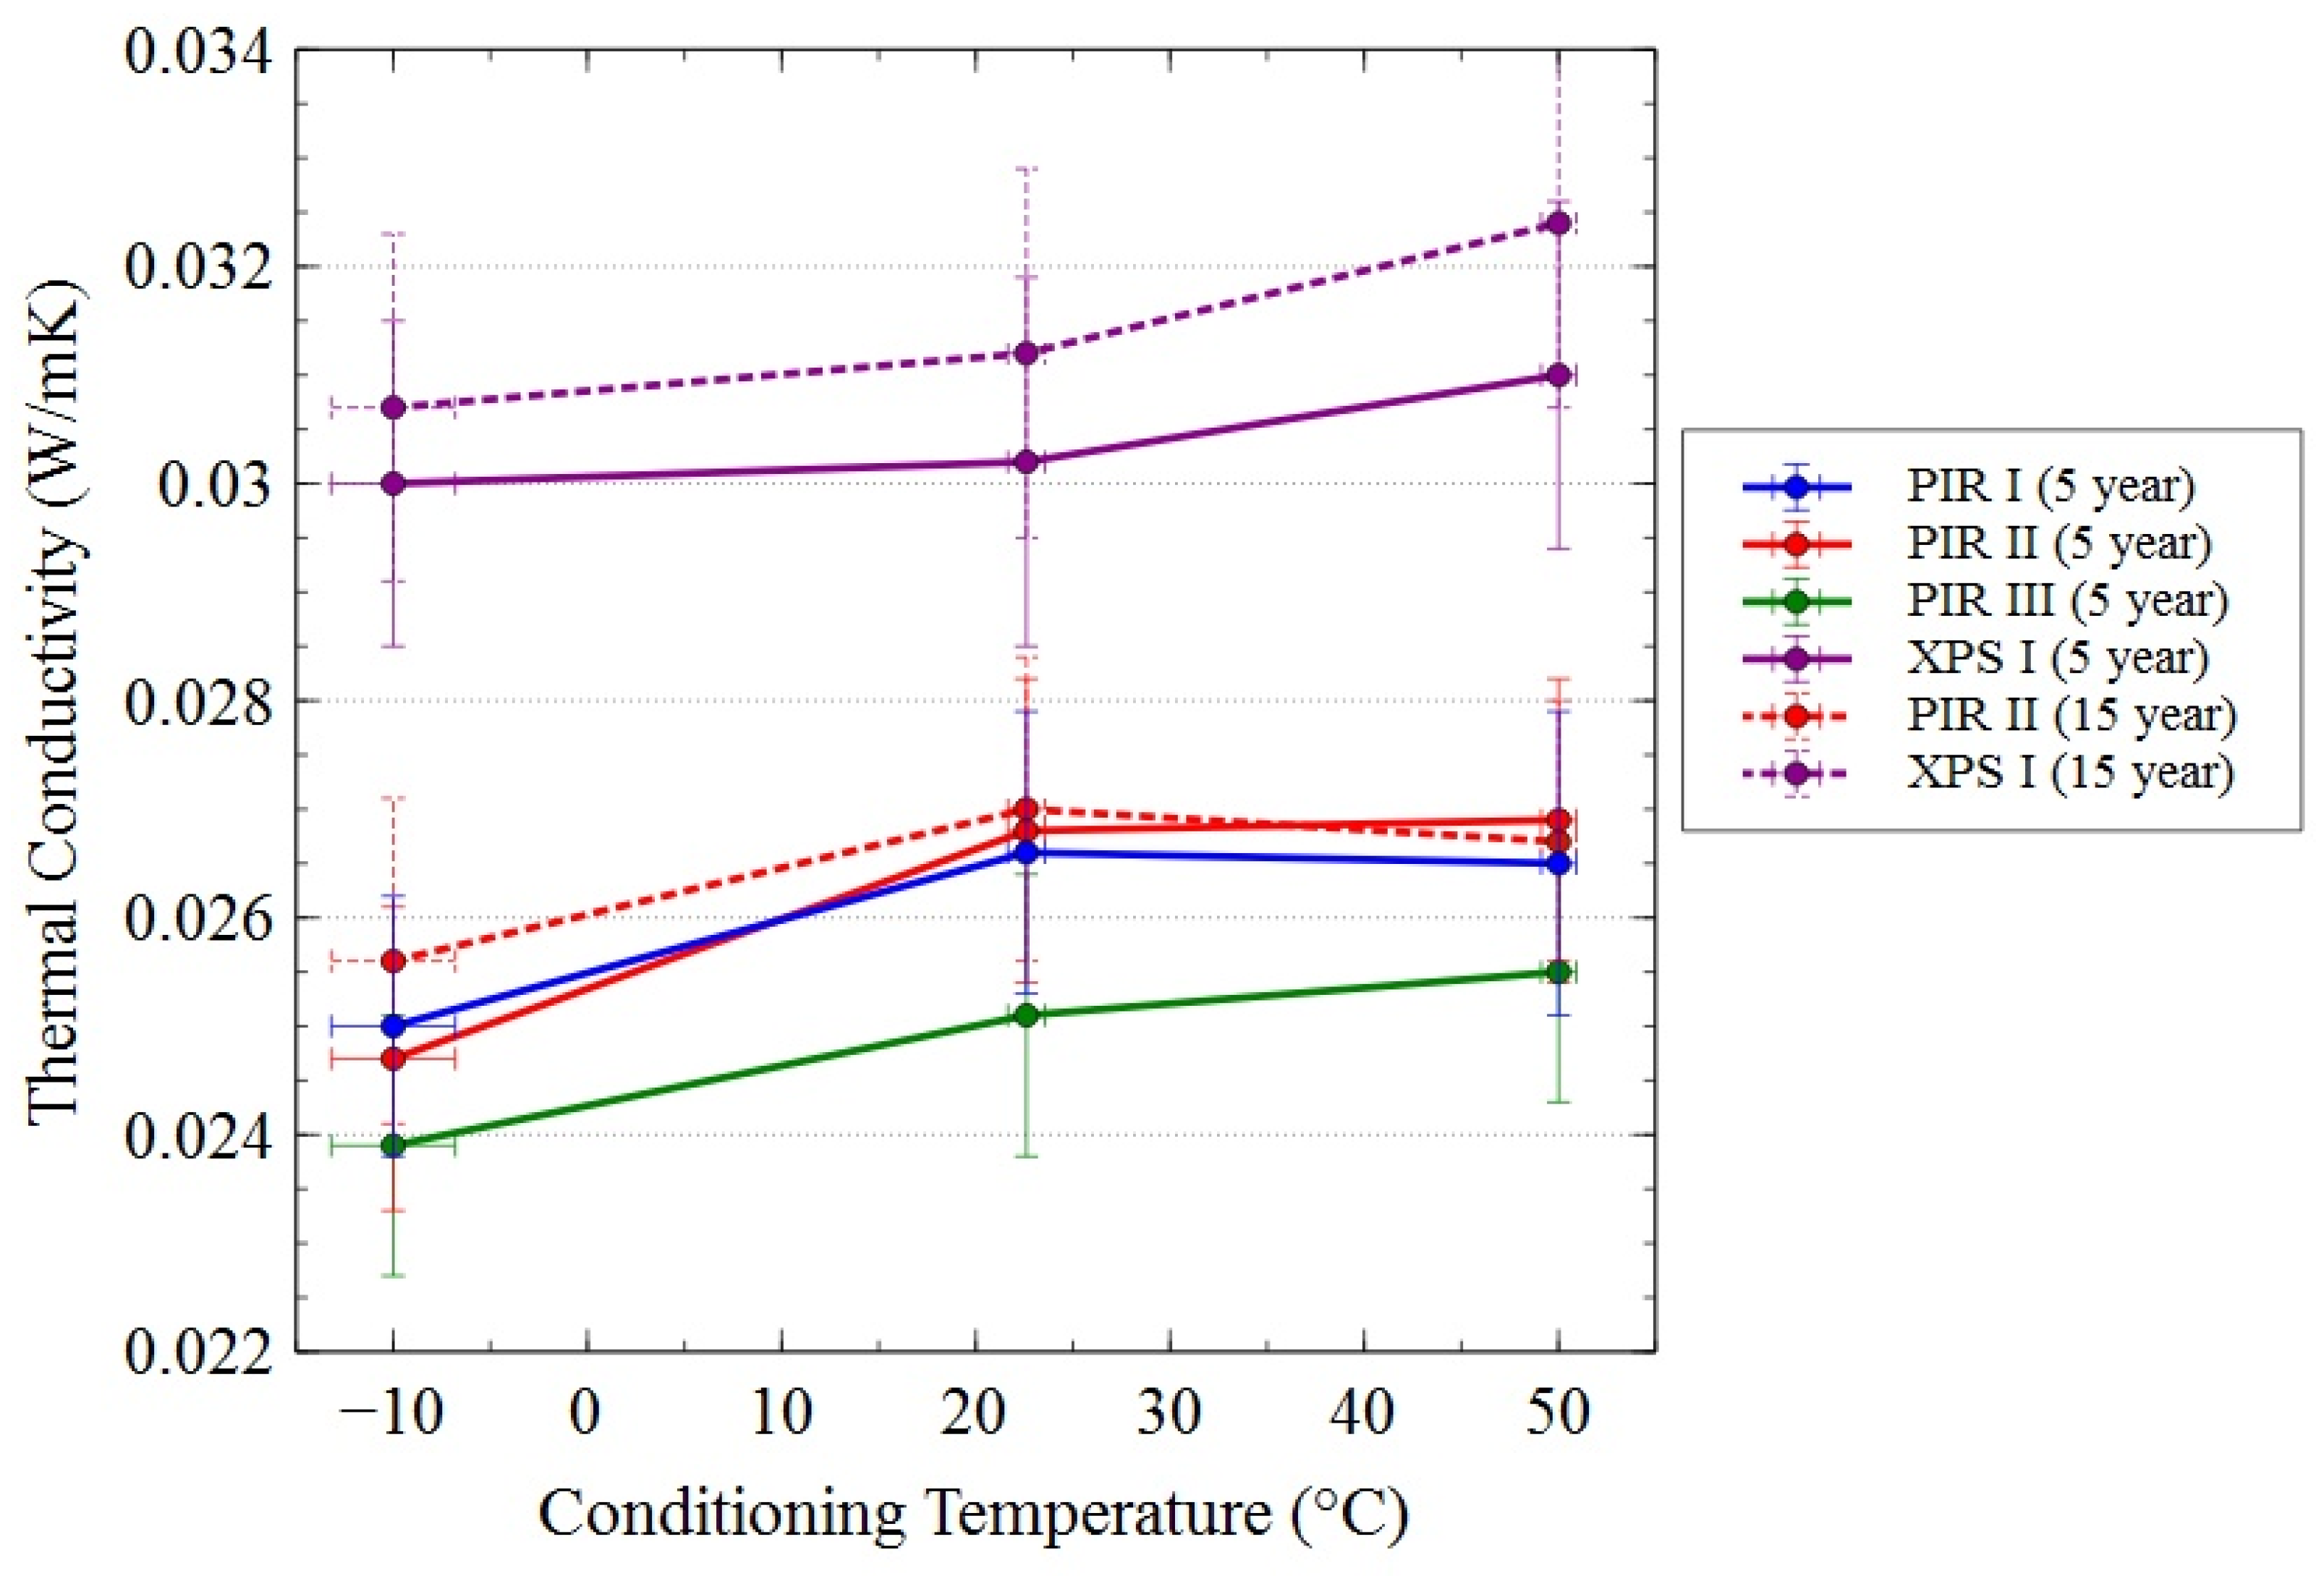
Figure 2 shows the effect of applying the aging factors to the initial thermal conductivity measurements (Equation (4)) following CAN/ULC-S770 (ULC, 2015 [
2]). PIR I and II gave almost identical results, whereas PIR III produced a thermal conductivity approximately 5% lower. XPS I had a thermal conductivity around 17% higher than PIR I and II. Between 5 and 15 years of aging, the thermal conductivity of XPS I continued to increase; however, as this was within the margin of error, it is unclear how significant this was. PIR II only increased at a conditioning temperature of −10 °C between 5 and 15 years.
Previous studies on the effects of elevated temperature on aging of closed-cell foam insulation have demonstrated that it initially results in a more rapid increase in thermal conductivity; however, over a longer period, increased temperature has little effect. Bomberg and Gilbo (1989) [
9] examined the effect of aging PIR specimens at 60 °C and 100 °C in comparison to laboratory conditions of 22 °C and found no long-lasting accelerating effect of elevated temperatures. Zarr and Nguyen found that, after 80 days, 27 mm thick PIR specimens conditioned at 60 °C had a 10% higher thermal conductivity that those conditioned at 22 °C; however, after 372 days, there was no difference in performance (Zarr and Nguyen, 1994 [
19]). This is in alignment with what would be expected from the physical processes as ultimately all BA will be replaced by air and aging due to gas diffusion will cease.
In cold climates, closed-cell insulation materials will be exposed to temperatures below laboratory conditions. However, the effect of exposure to temperatures below 22 °C has received little attention. For the PIR products tested in this study, condensation of the BA begins around 15–20 °C (
Figure 3), increasing as the temperature decreases, an effect which does not occur in the XPS over the temperature range tested. When conditioned at −10 °C, a significant proportion of the BA will be in liquid state, and therefore, additional latent heat will be required to evaporate blowing agent, which could be a factor in the non-linear relationship shown in
Figure 1 and
Figure 2 for PIR products. However, in the initial stages, aging of closed-cell foam insulation is primarily due to diffusion of air into the cellular matrix, as nitrogen and oxygen have a lower molecular mass than BA gases. Out flow of BA occurs at a slower rate, over a longer time, so it would be expected to have less impact initially.
4.2. Initial Temperature Dependent Thermal Conductivity of Full Thickness Specimens
Figure 3 shows thermal conductivity as a function of mean temperature expressed as a polynomial function when measured on full thickness specimens within 2 weeks of manufacture. Differences in the thermal conductivity of the PIR specimens increased as mean temperatures decreased from 3% at a mean temperature of 40 °C to a 17% difference between PIR I and II at −10 °C. Values begin to deviate at around 20 °C. This marks the beginning of condensation point; the point at which the typical linear relationship seen in materials with gas is trapped or restricted in a porous medium begins to curve due to condensation of the gas. Differences between PIR products are therefore most likely related to behaviour of the BAs. There was a significant difference between the maximum and minimum thermal conductivity across the range of mean temperatures tested for each material. For PIR I, the maximum (at −10 °C) was 30% higher than at the turning point (at 18.9 °C). For PIR II, the maximum (at 40 °C) was 13% higher than the turning point (at 11.4 °C), and for PIR III, the maximum (at −10 °C) was 18% higher than the turning point (at 11.5 °C). PIR II and III had similar turning points indicting that condensation began at a lower temperature than for PIR I.
The XPS specimen remained linear over the selected temperature range, as the point at which its trapped gases condense was not reached. However, its thermal conductivity was higher than for the PIR specimens above 0 °C. The maximum thermal conductivity at 40 °C was 26% higher than the minimum at −10 °C.
4.3. Temperature Dependent Thermal Conductivity of Laboratory Aged Specimens (5 Years)
Figure 4 shows thermal conductivity as a function of mean temperature for sliced specimens conditioned at −10, 23 and 50 °C for the equivalent of 5 years in comparison to full thickness specimens tested within 2 weeks of manufacture (initial).
Elevated conditioning temperature resulted in a greater increase in thermal conductivity for all specimens over the test period. However, the extent of the effect differed by product as well as by mean temperature. When tested at mean temperatures above the beginning of condensation point, there was a near linear relationship between conditioning temperature and change in thermal conductivity, with slightly smaller differences between 23 °C and 50 °C, as seen with the aging factors in
Figure 1. When tested at mean temperatures below the beginning of condensation point, there was a greater variability in responses of the materials. PIR I showed less change in thermal conductivity with decreasing mean temperatures, so that at −10 °C, no change was seen from the initial value. In comparison, PIR II displayed a 17% increase for specimens conditioned at 23 °C and 50 °C; however, it was only 8% when conditioned at −10 °C. The difference between conditioning at 23 °C and 50 °C was small, particularly at lower mean temperatures. For PIR III, the effect of conditioning temperature on change in thermal conductivity decreased with mean test temperature converging below 0 °C. For XPS I. The impact of conditioning temperature over the 5-year equivalent period was found to be small and within experimental error.
It is interesting to note that the turning points for PIR II and III changed little over time; however, PIR I moved from 19 °C when initially measured to 14 °C when conditioned at −10 °C, and 12 °C when conditioned at 23 °C and 50 °C. This may be a result of BA being absorbed into the polymer matrix (Bomberg et al., 1991 [
4]).
Over the 5-year equivalent time period, the variability in thermal conductivity between the PIR specimens at lower mean temperatures was found to diminish (
Figure 5). The initial 17% difference at −10 °C decreased to 3.0% to be within the experimental error for specimens conditioned at 23 °C. At mean temperatures above 10 °C, the maximum difference in thermal conductivity between specimens was unchanged over time, with mean temperatures around the turning point now showing the largest difference. The mean of the polynomial curves for the aged PIR specimens is given by the black dashed line. The maximum difference between the mean and the three curves was 3% at and mean temperature of 12 °C. Indeed, at the high and low ends of the temperature range differences are within experimental error. For specimens conditioned at −10 °C, maximum difference from the mean was 5.5% at a mean temperature of −10 °C, and for specimens conditioned at 50 °C, maximum difference was 3.8% at 40 °C. Therefore, in instances when full thermal characterization of a PIR product is not possible, these results suggest that a mean polynomial function of multiple aged products would provide a useful estimate.
For the mean polynomial function, the maximum thermal conductivity across the range of mean temperatures tested (at −10 °C) was 15% higher than the minimum (at 12 °C), which was similar to the initial differences displayed by PIR II and III (the difference was 18% and 12% for specimens conditioned at −10 °C and 50 °C, respectively). For XPS I conditioned at 23 °C, the maximum thermal conductivity at 40 °C was 23% higher than the minimum at −10 °C (
Figure 4), which was also similar to the initial difference of 26%.
Table 3,
Table 4 and
Table 5 provide the coefficients for Equation (5) in order to generate cubic polynomial curves for the closed-cell insulation materials included in this study. These are valid only between the experimental mean temperatures of −10 °C and 44 °C (
Table 2).
Following 5-year aging at 23 °C, the maximum difference in thermal conductivity due to mean temperature was showed by PIR I; 0.025 W/mK at 12 °C to 0.029 W/mK at −10 °C, a 17% increase. Other recent studies have, however, reported greater sensitivity of PIR to condensation of BA. Finch et al. (2014) reported a thermal conductivity for aged PIR of 0.036 W/mK at a mean temperature of −4 °C compared to 0.026 W/mK at 24 °C, a 38% increase, while Schumacher et al. (2014) reported 0.033 W/mK and 0.045 W/mK for two different PIR products at a mean temperature of −10 °C compared to 0.026 W/mK and 0.025 W/mK at 15 °C and 10 °C, a 27% and 80% increase, respectively. Differences from this study likely reflect the continuing development of improved formulas by manufacturers to resolve this issue.
The National Building Code currently gives the thermal conductivity of 50 mm thick permeably faced PIR insulation as a single value of 0.0278 W/mK (NRC, 2015) [
20]. For the PIR products in this study, this overestimates the mean thermal conductivity at a mean temperature of 12 °C by 12% and overestimates by 3% at −10 °C. However, the results presented by Finch et al. (2014) [
7] and Schumacher et al. (2014) [
6] showed a greater discrepancy, as much as 38%.
4.4. Temperature Dependent Thermal Conductivity of Laboratory Aged Specimens (15 Years)
The temperature dependent thermal conductivity of both PIR II and XPS I specimens was retested following the equivalent of 15 years of laboratory aging at the three temperatures. As would be expected, the rate of change in thermal conductivity decreased between 5 and 15 years for both materials, due to the rate of diffusion of gasses slowing over time as they approach equilibrium.
For PIR II, there was no significant change in the thermal conductivity curves for specimens conditioned at 23 °C and 50 °C (
Figure 6 and
Figure 7). A greater change for the specimens conditioned at −10 °C indicated that thermal conductivities were converging towards a similar final value irrespective of the conditioning temperature. This agrees with previous studies that have shown no long-term effect of conditioning temperature on aging of PIR (Bomberg and Gilbo, 1989 [
9]; Zarr and Nguyen, 1994 [
19]). Further measurements will confirm if a convergence occurs and the further effect of conditioning temperature on the rate of change in thermal conductivity.
The XPS specimens, although less affected by conditioning temperature than the PIR specimens at 5 years equivalent aging, showed a divergence in thermal conductivity over 15 years aging (
Figure 6 and
Figure 7). However, as the rate of change is small, differences are within experimental error. Further measurements will show if this trend continues or if values will eventually converge.
5. Conclusions
Four closed-cell foam insulation products designed to retain blowing agent within their cellular matrix were tested to determine the long-term thermal conductivity according to CAN/ULC 770, which uses thin slicing to accelerate aging via gas diffusion. To examine the effect of introducing temperature dependency into this procedure, full thickness specimens were initially tested within 2 weeks of manufacture at 11 mean temperatures between −10 °C and 44 °C and sliced specimens after the equivalent aging of 5 years and 15 years. Cubic polynomial functions of thermal conductivity against mean temperature were then calculated using the method described in ASTM C1045 [
18]. To examine the effect of conditioning temperature, specimens were also conditioned at −10, 23 and 50 °C.
The three polyisocyanurate (PIR) products displayed polynomial functions with turning points between 11 °C and 19 °C due to condensation of blowing agent. Following 5 years of equivalent aging, differences diminished so that the maximum difference from the mean of the three specimens was 3%. This finding suggests that it is acceptable to use a generic polynomial function for modelling purposes for new PIR products.
Lower conditioning temperatures were in general found to slow change in thermal conductivity over the aging period for all insulation products. This effect varied depending on product and mean test temperature. PIR II aged 7 to 8% less when conditioned at −10 °C compared to 50 °C. However, in some cases, there was no significant effect, particularly for PIR I and III at lower mean temperatures. Any impact of in-service temperature on aging will depend on the material’s position in the building envelope.
The extruded polystyrene (XPS) product displayed a linear relationship between thermal conductivity and mean temperature as there was no condensation of blowing agent. However, its thermal conductivity was greater than the PIR products except at temperatures below approximately −5 °C. After 5 years equivalent aging, conditioning temperature was found to have a small effect on thermal conductivity; however, after 15 years, a greater effect was seen, with higher conditioning temperatures increasing thermal conductivity.
Over the temperature range used in this study, thermal conductivity varied by 15% for the mean polynomial function for polyisocyanurate and 23% for the XPS. Besides a few exceptions such as ASTM C612 [
21], insulation material standards only stipulate measurement of thermal conductivity at a single mean temperature, and therefore, this is the only data made routinely available for all products (ASTM, 2014) [
21]. This lack of temperature-dependent thermal conductivity data presents a problem for designers when predicting building performance. Updating of standards to include their measurement would improve availability of this data.


