
Numerical Modeling of Concrete Deep Beams Made with Recycled Aggregates and Steel Fibers


Abstract
:1. Introduction
2. Research Objectives
- Establish tensile softening laws (tension functions) that can describe the post-cracking behavior of concrete made with RCAs and different steel fiber volume fractions.
- Develop numerical simulation models capable of predicting the shear behavior of steel fiber-reinforced recycled aggregates concrete deep beams.
- Validate the prediction of the numerical models through a comparative analysis with published experimental data.
- Investigate the effect of varying a/h, vf, and presence of a web opening on the shear capacity and strength gain caused by the addition of steel fibers.
3. Methodology and Material Characteristics
3.1. Properties of Concrete Mixtures
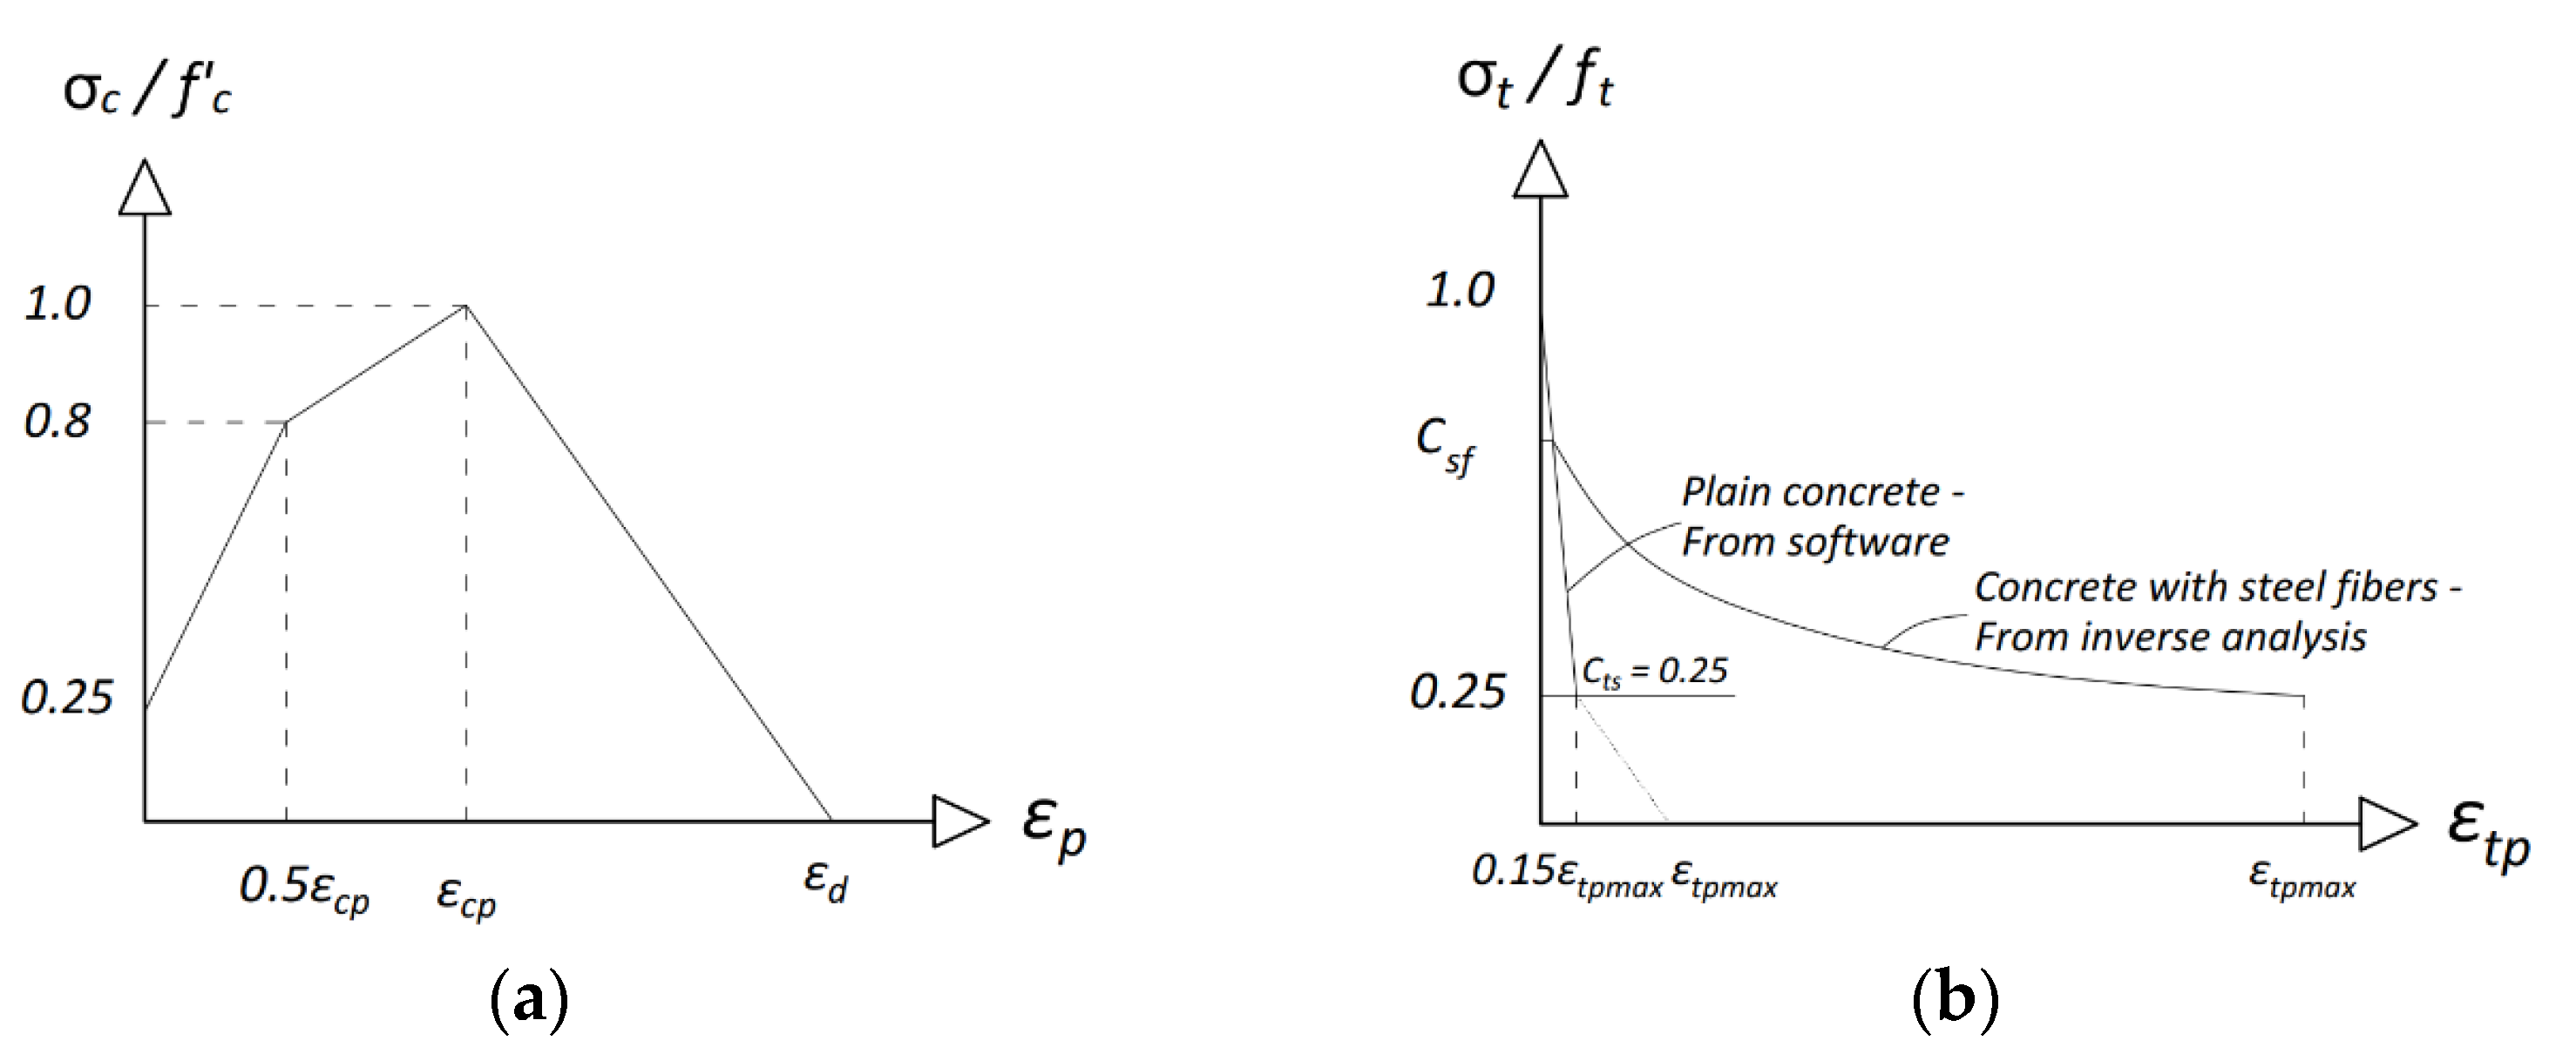
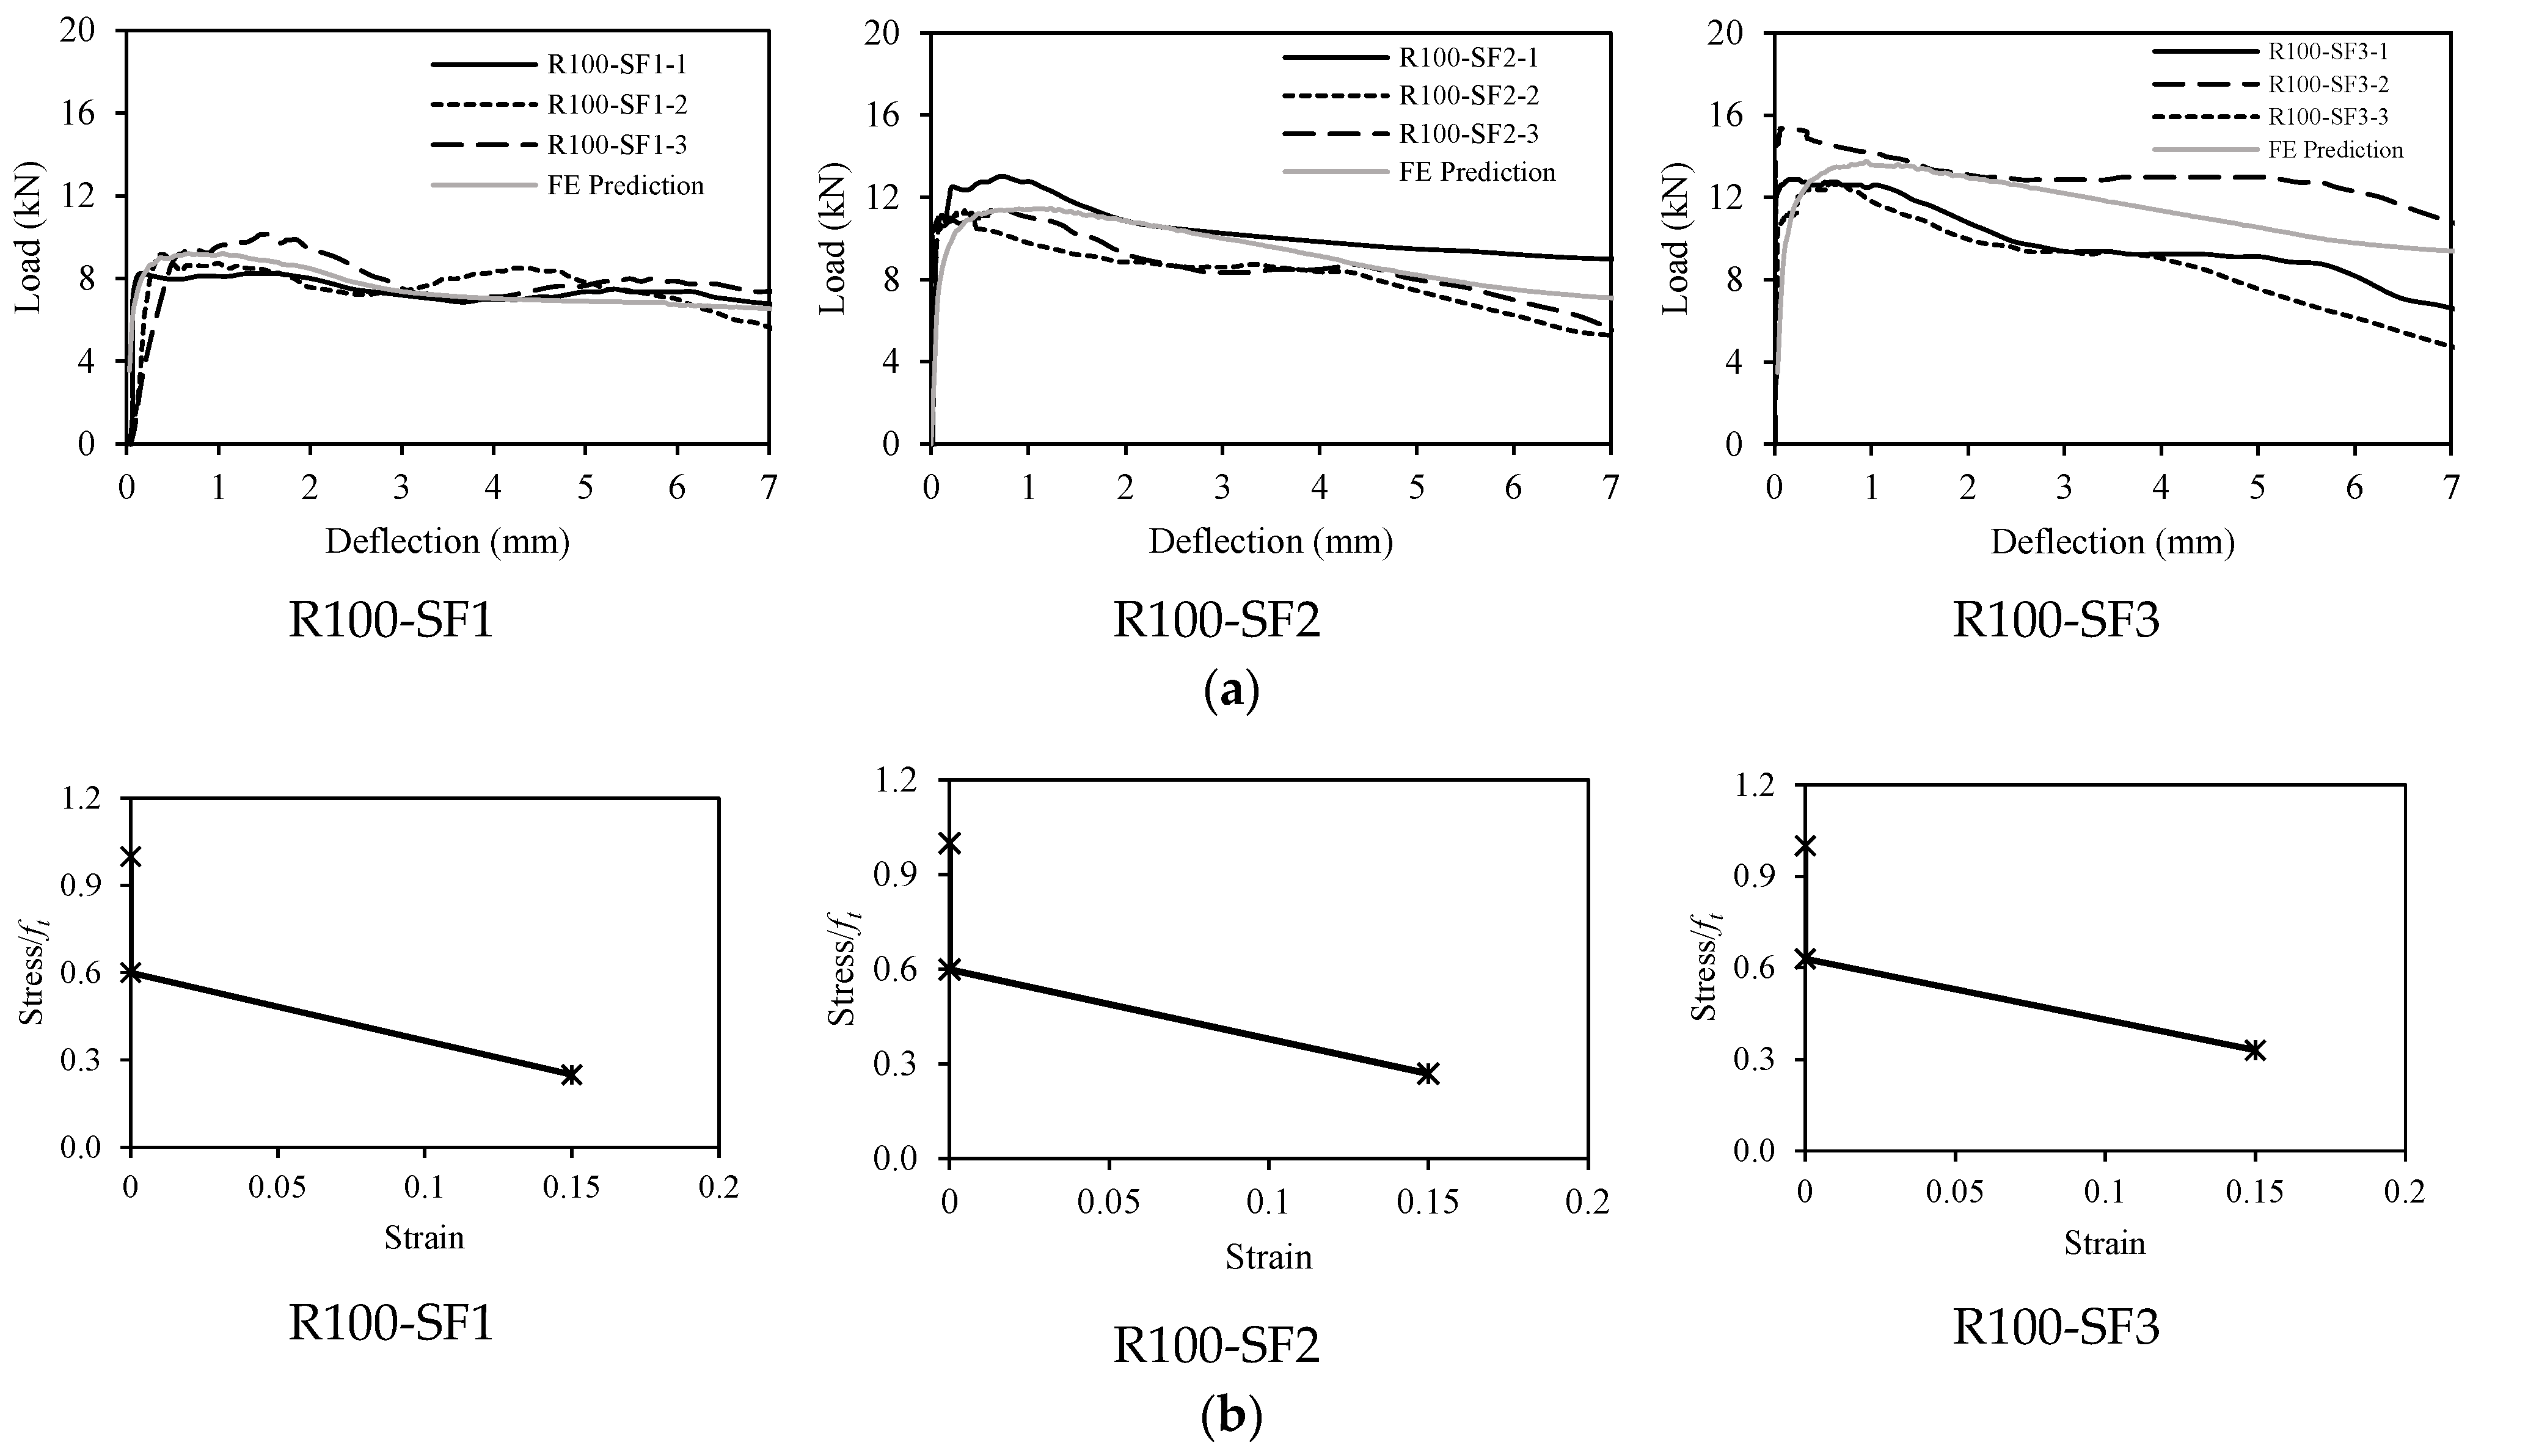
3.2. Tensile Softening Laws of Concrete Mixtures
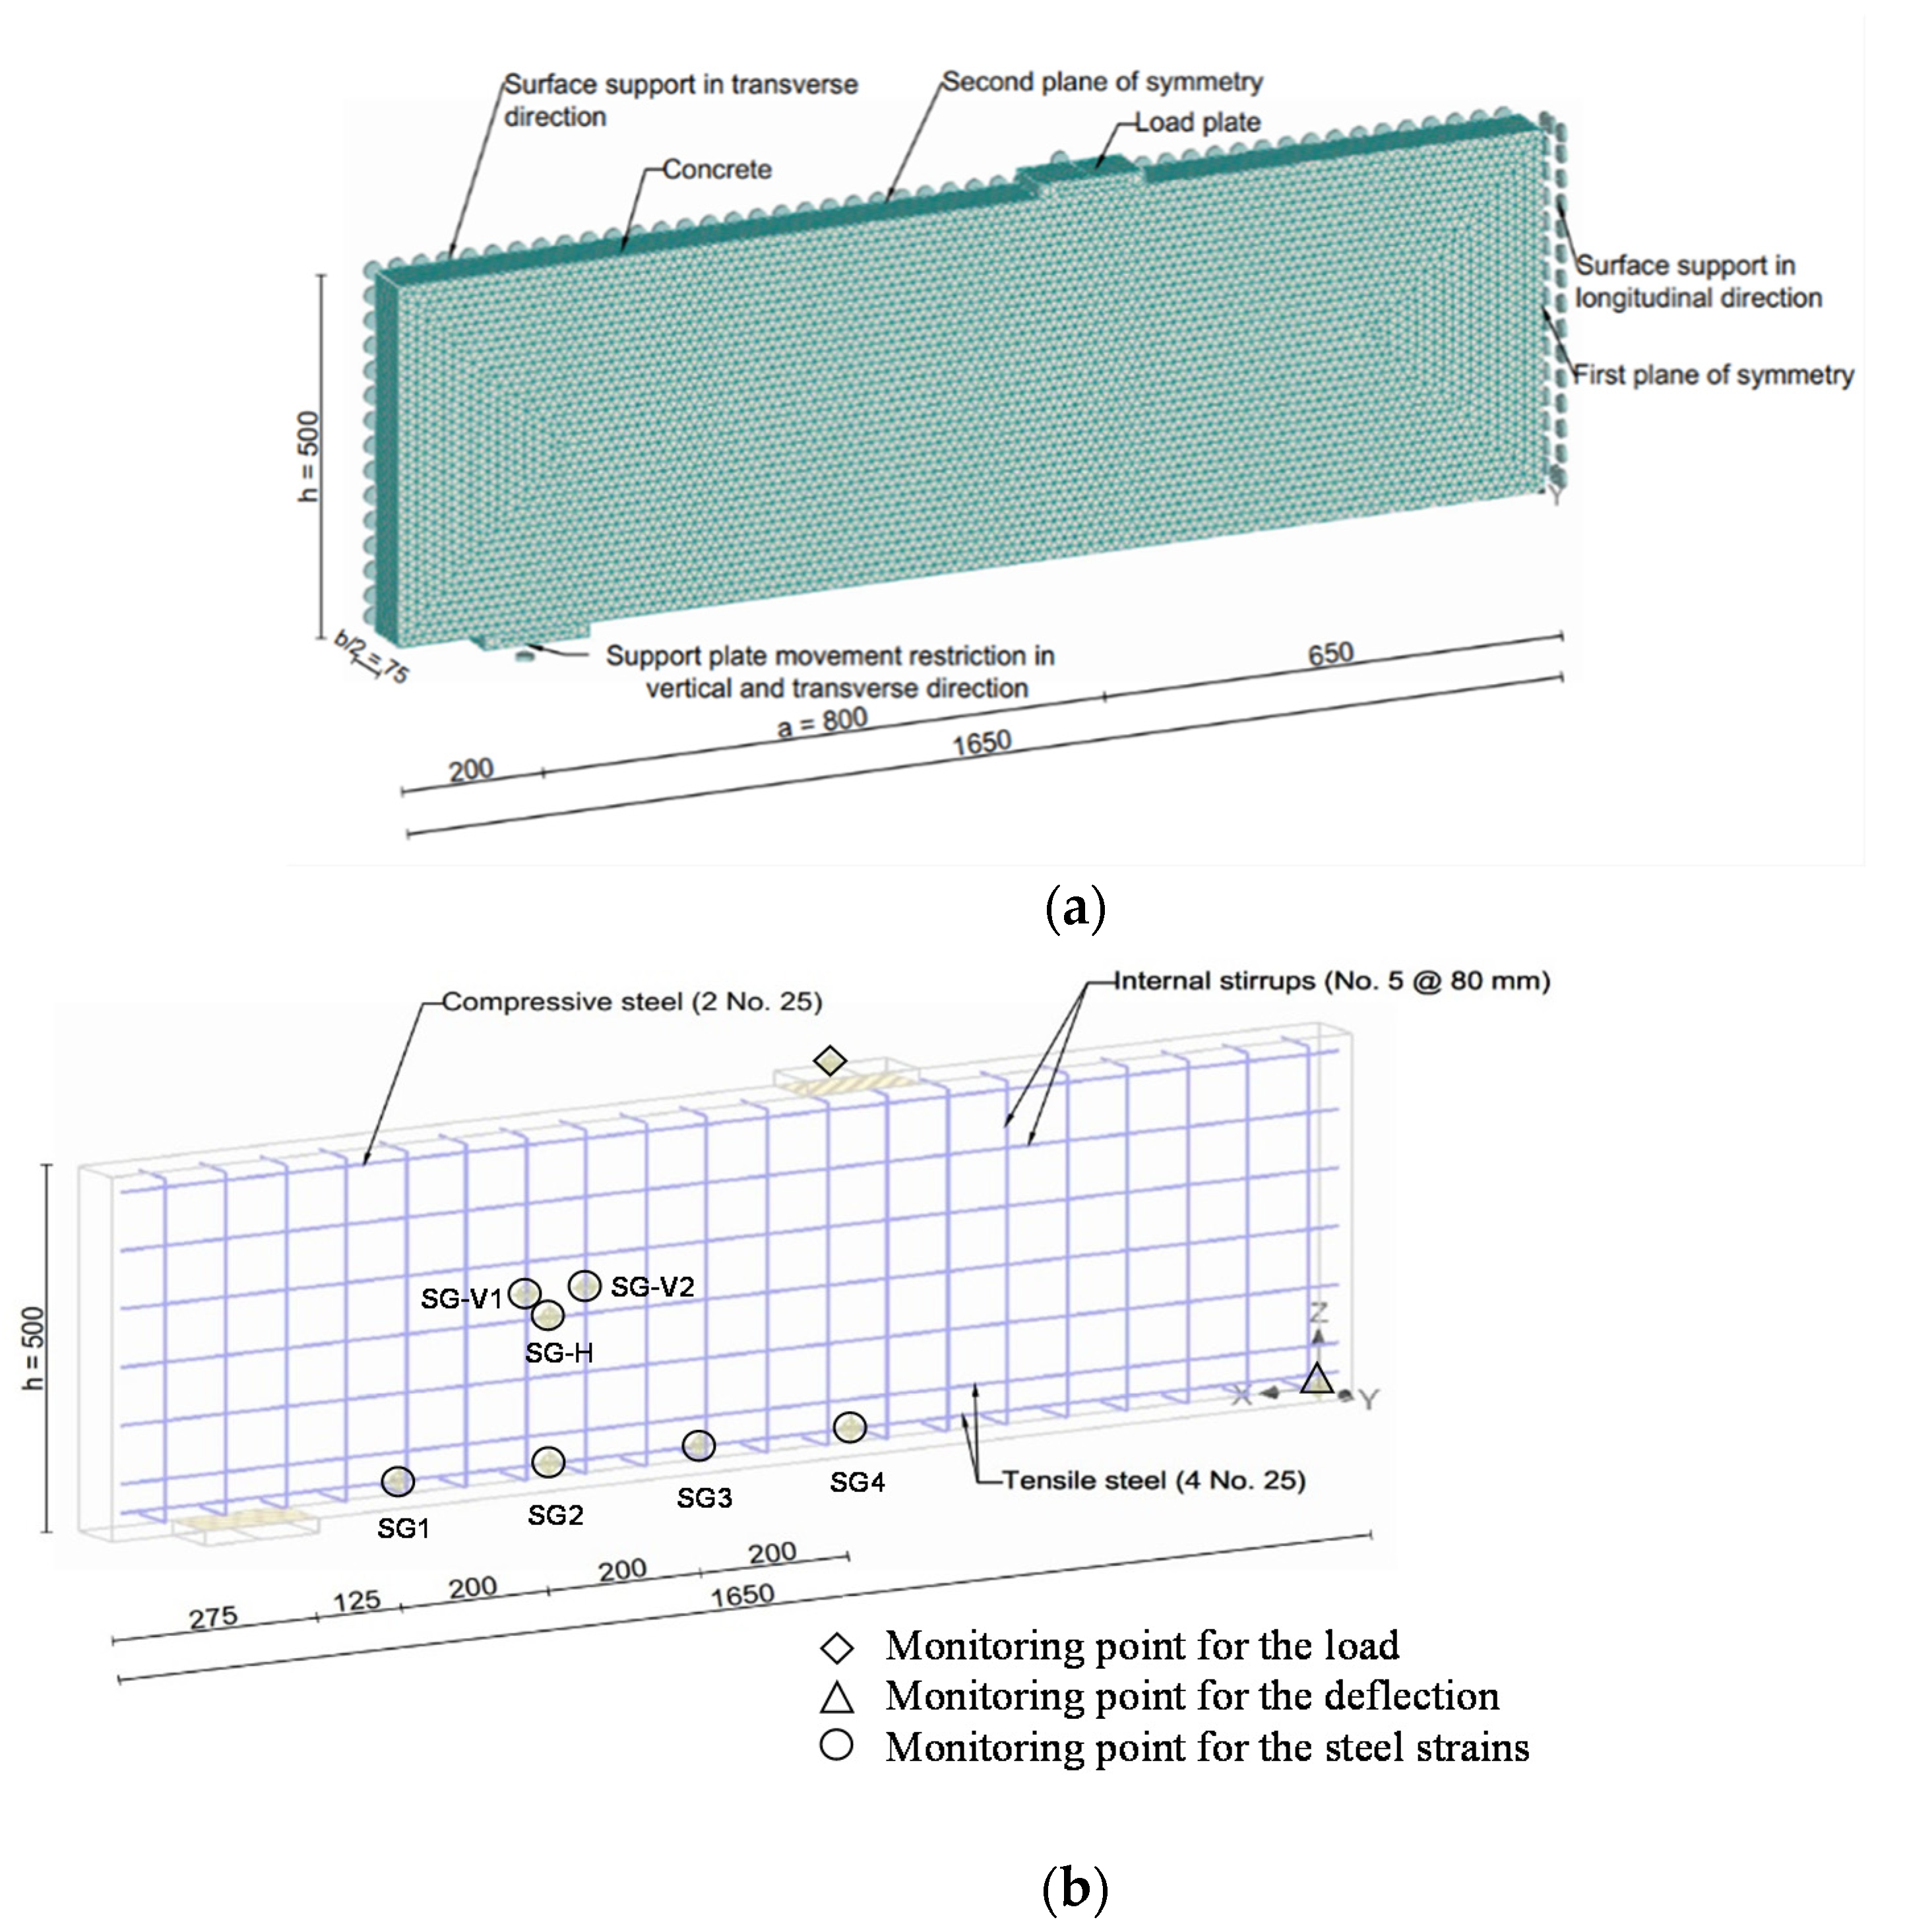
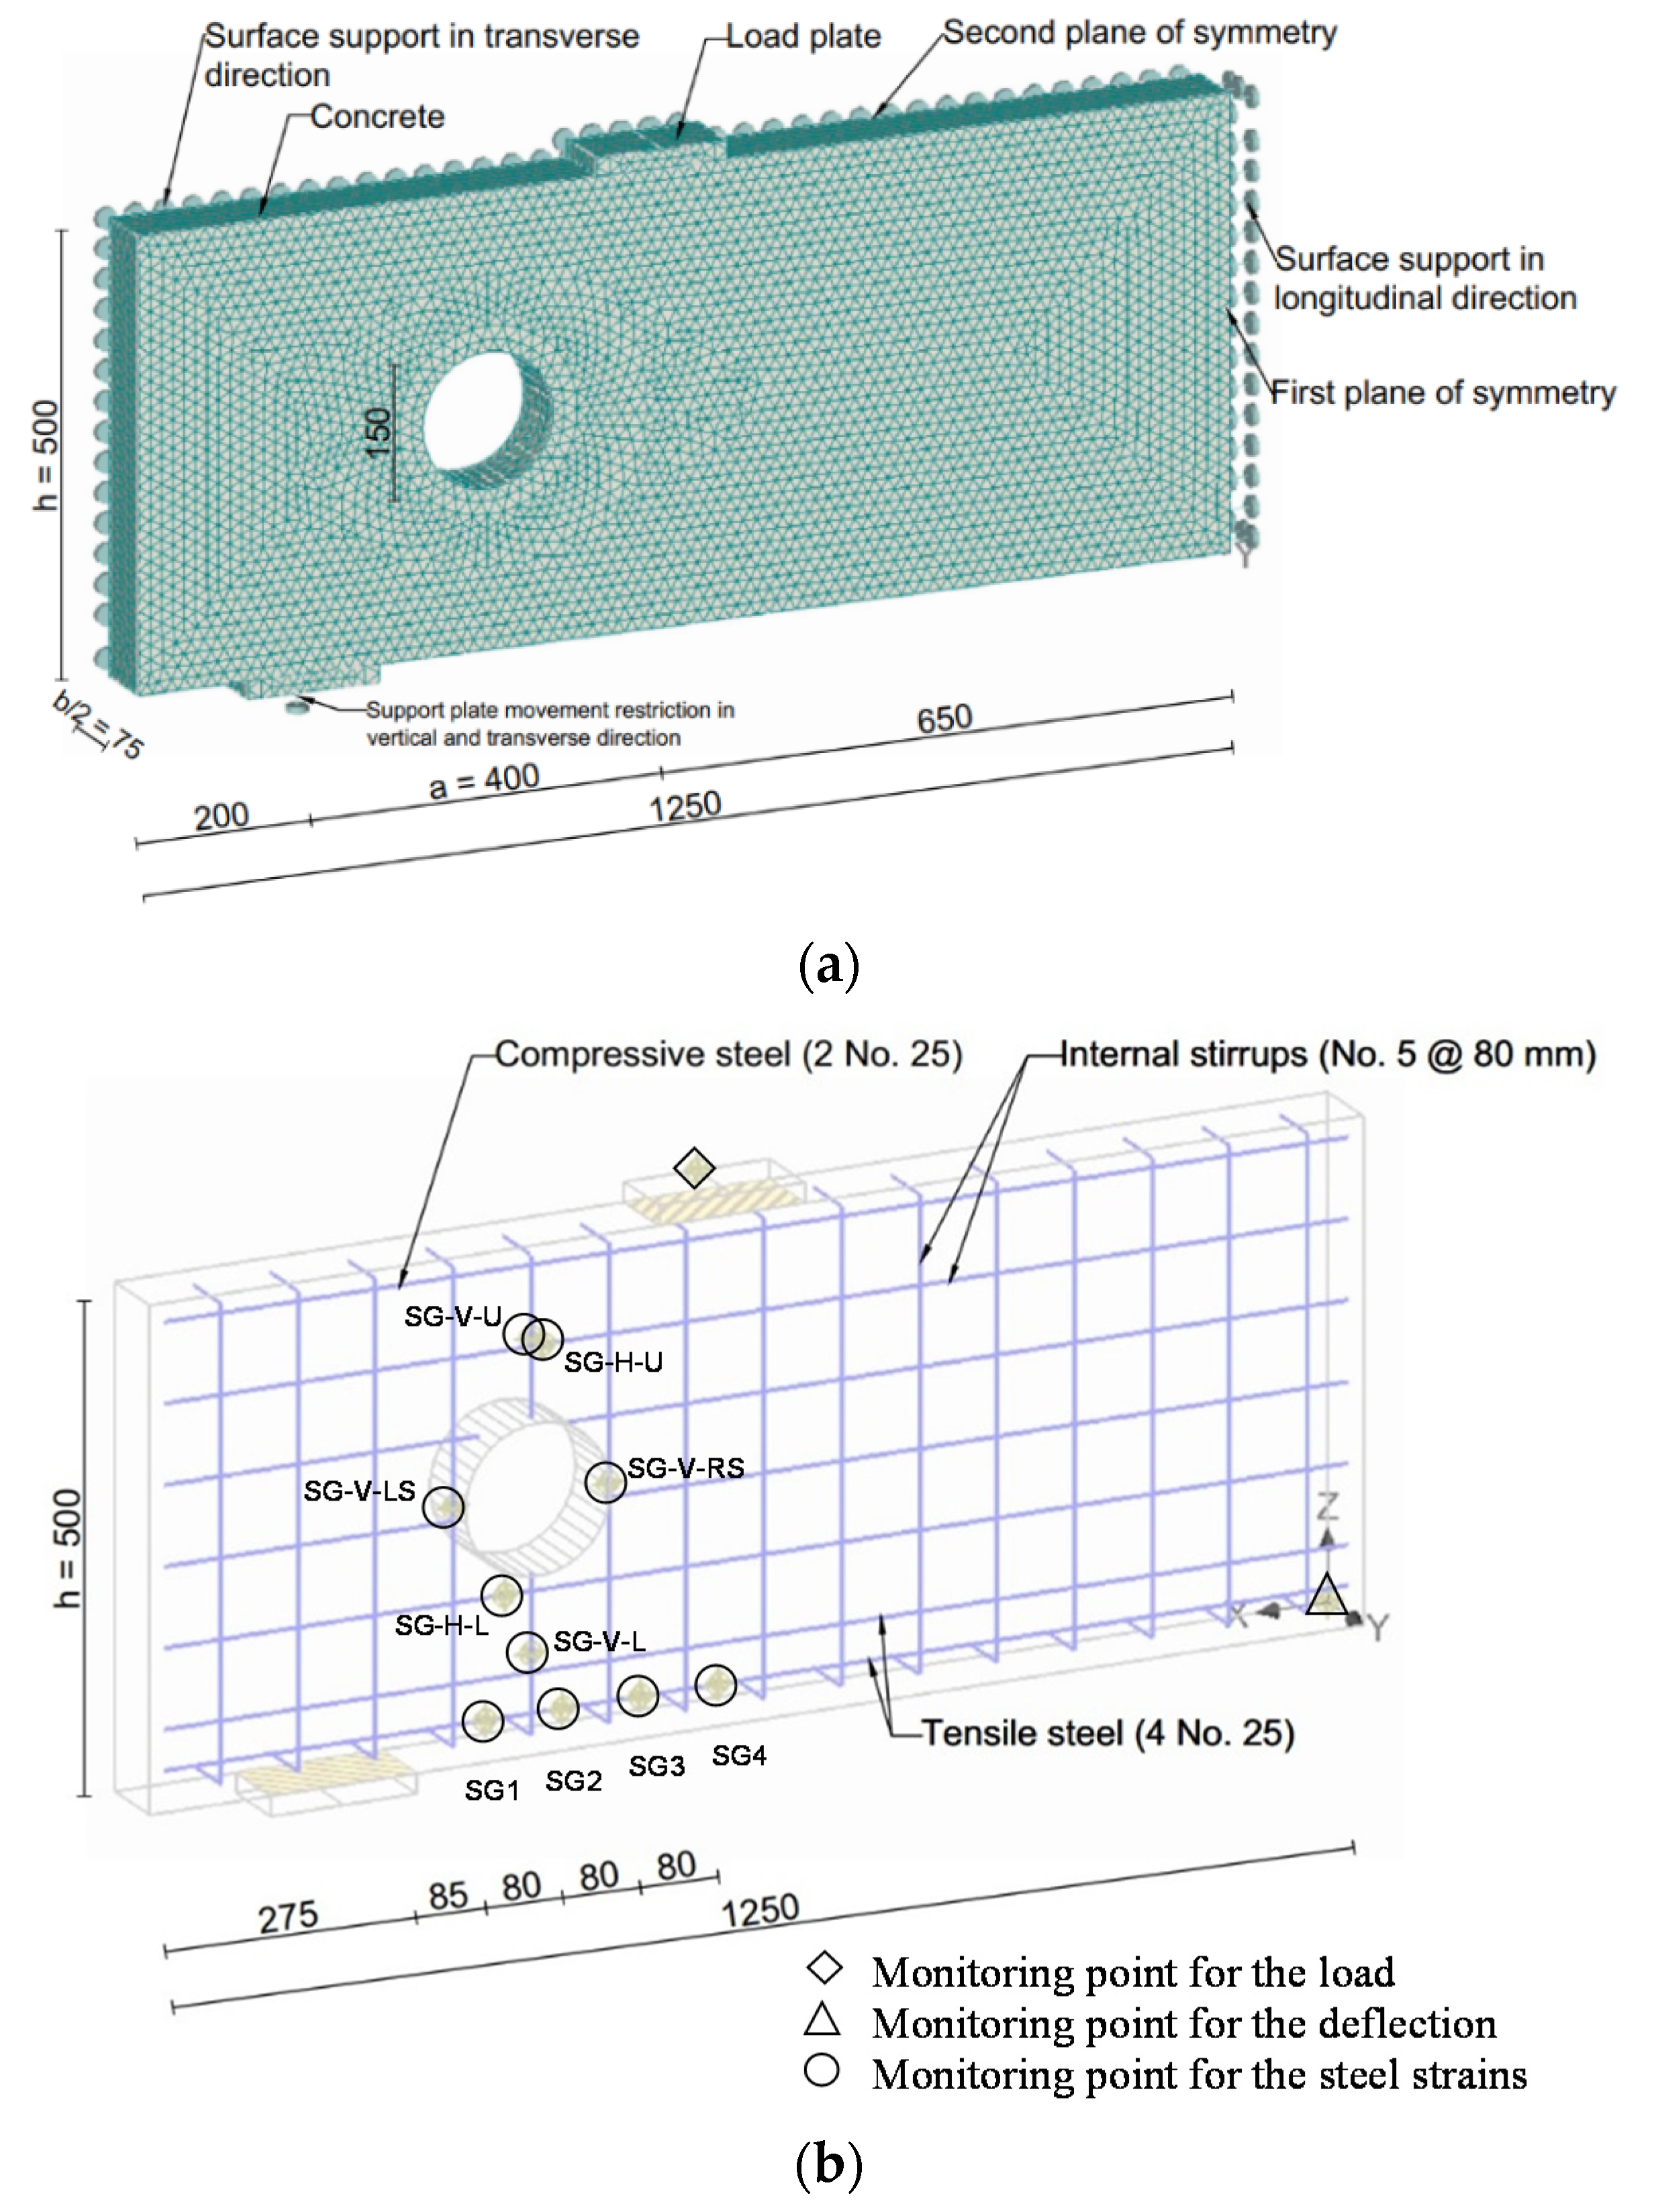
3.3. Large-Scale Deep Beam Numerical Models
4. Numerical Results and Validation of FE Deep Beam Models
4.1. Solid Deep Beam Models
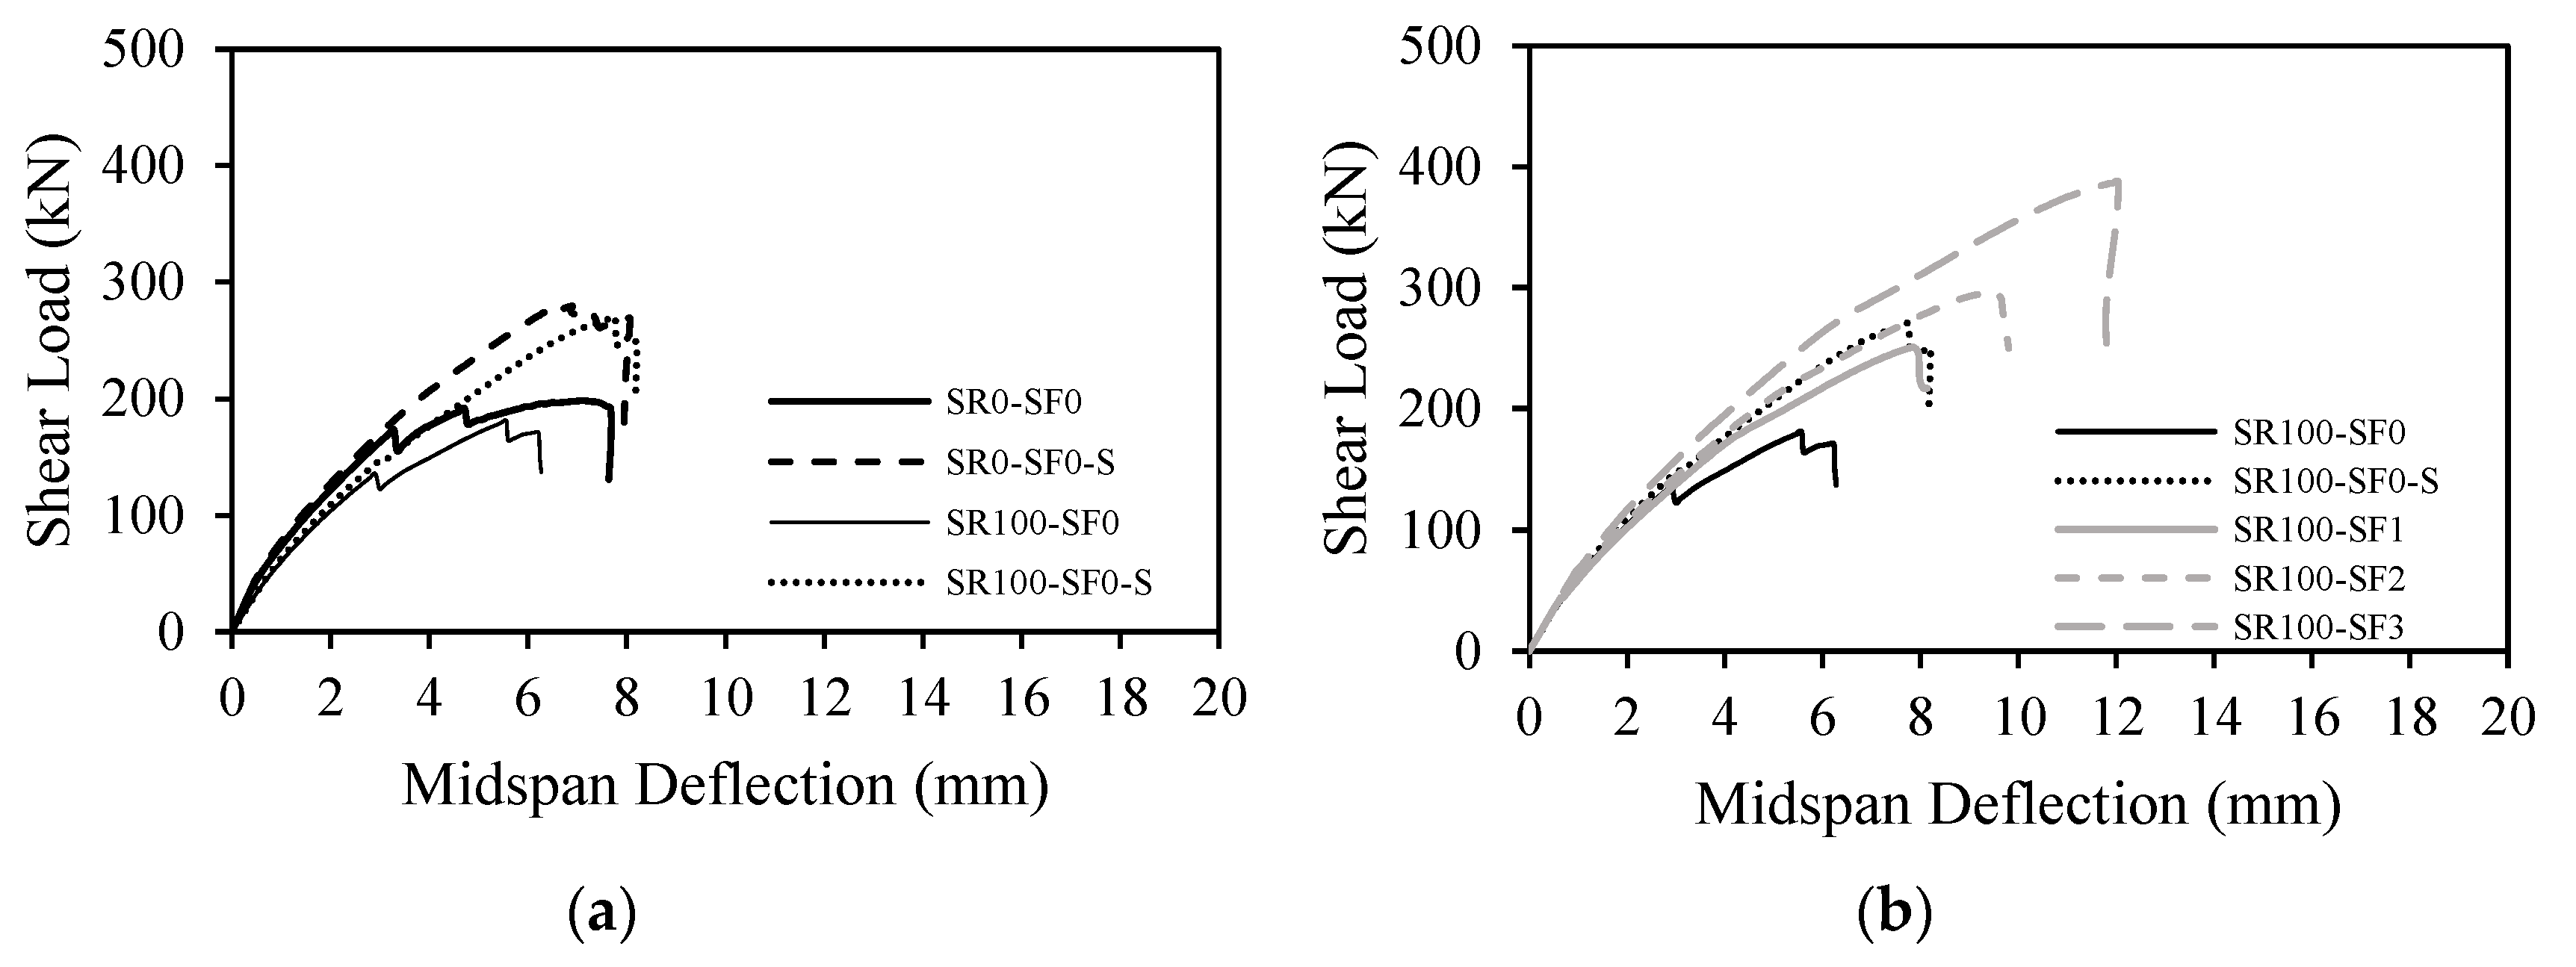
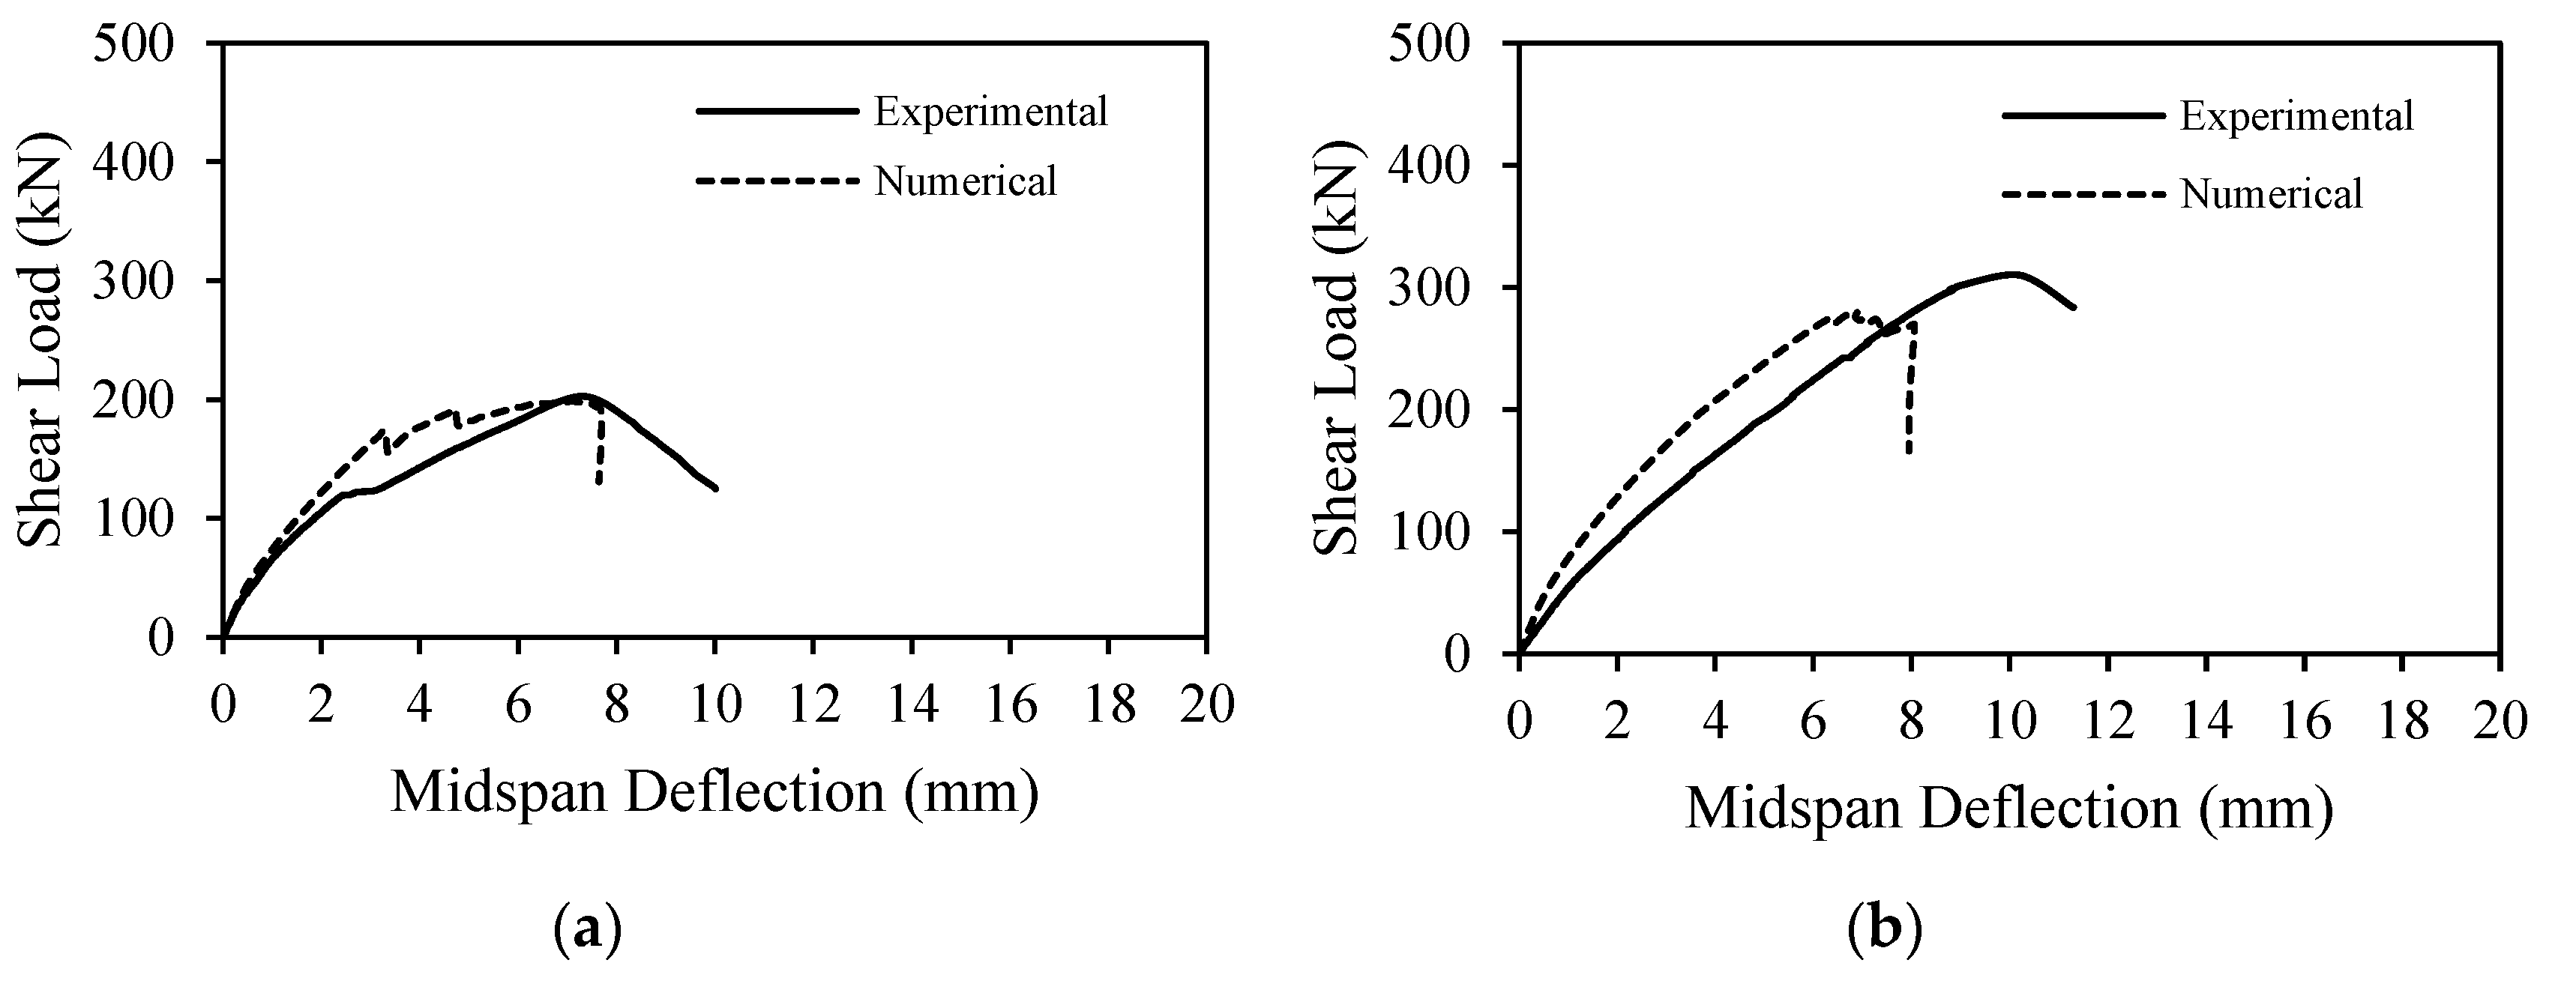
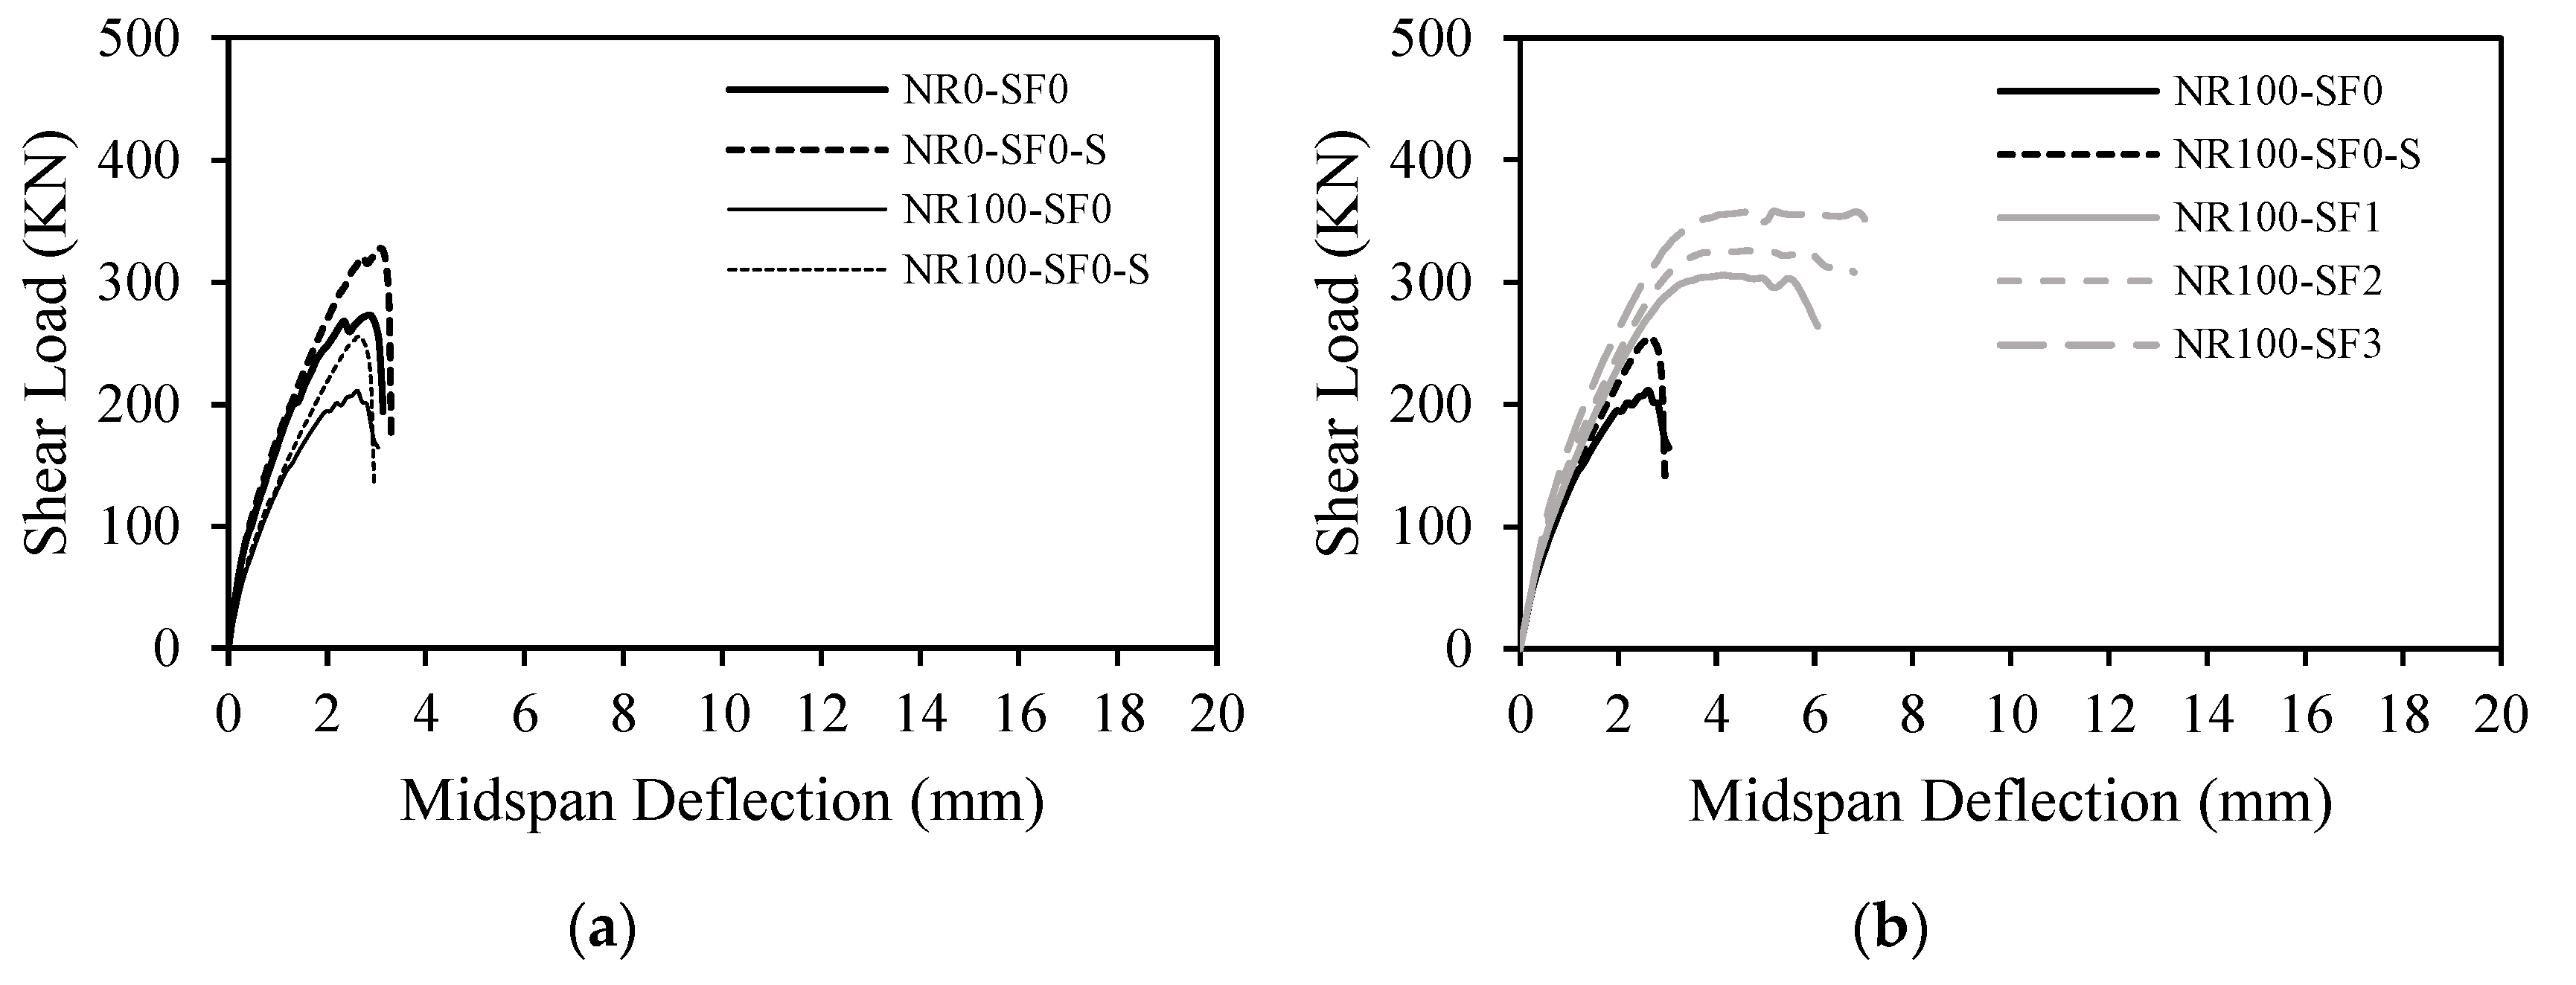
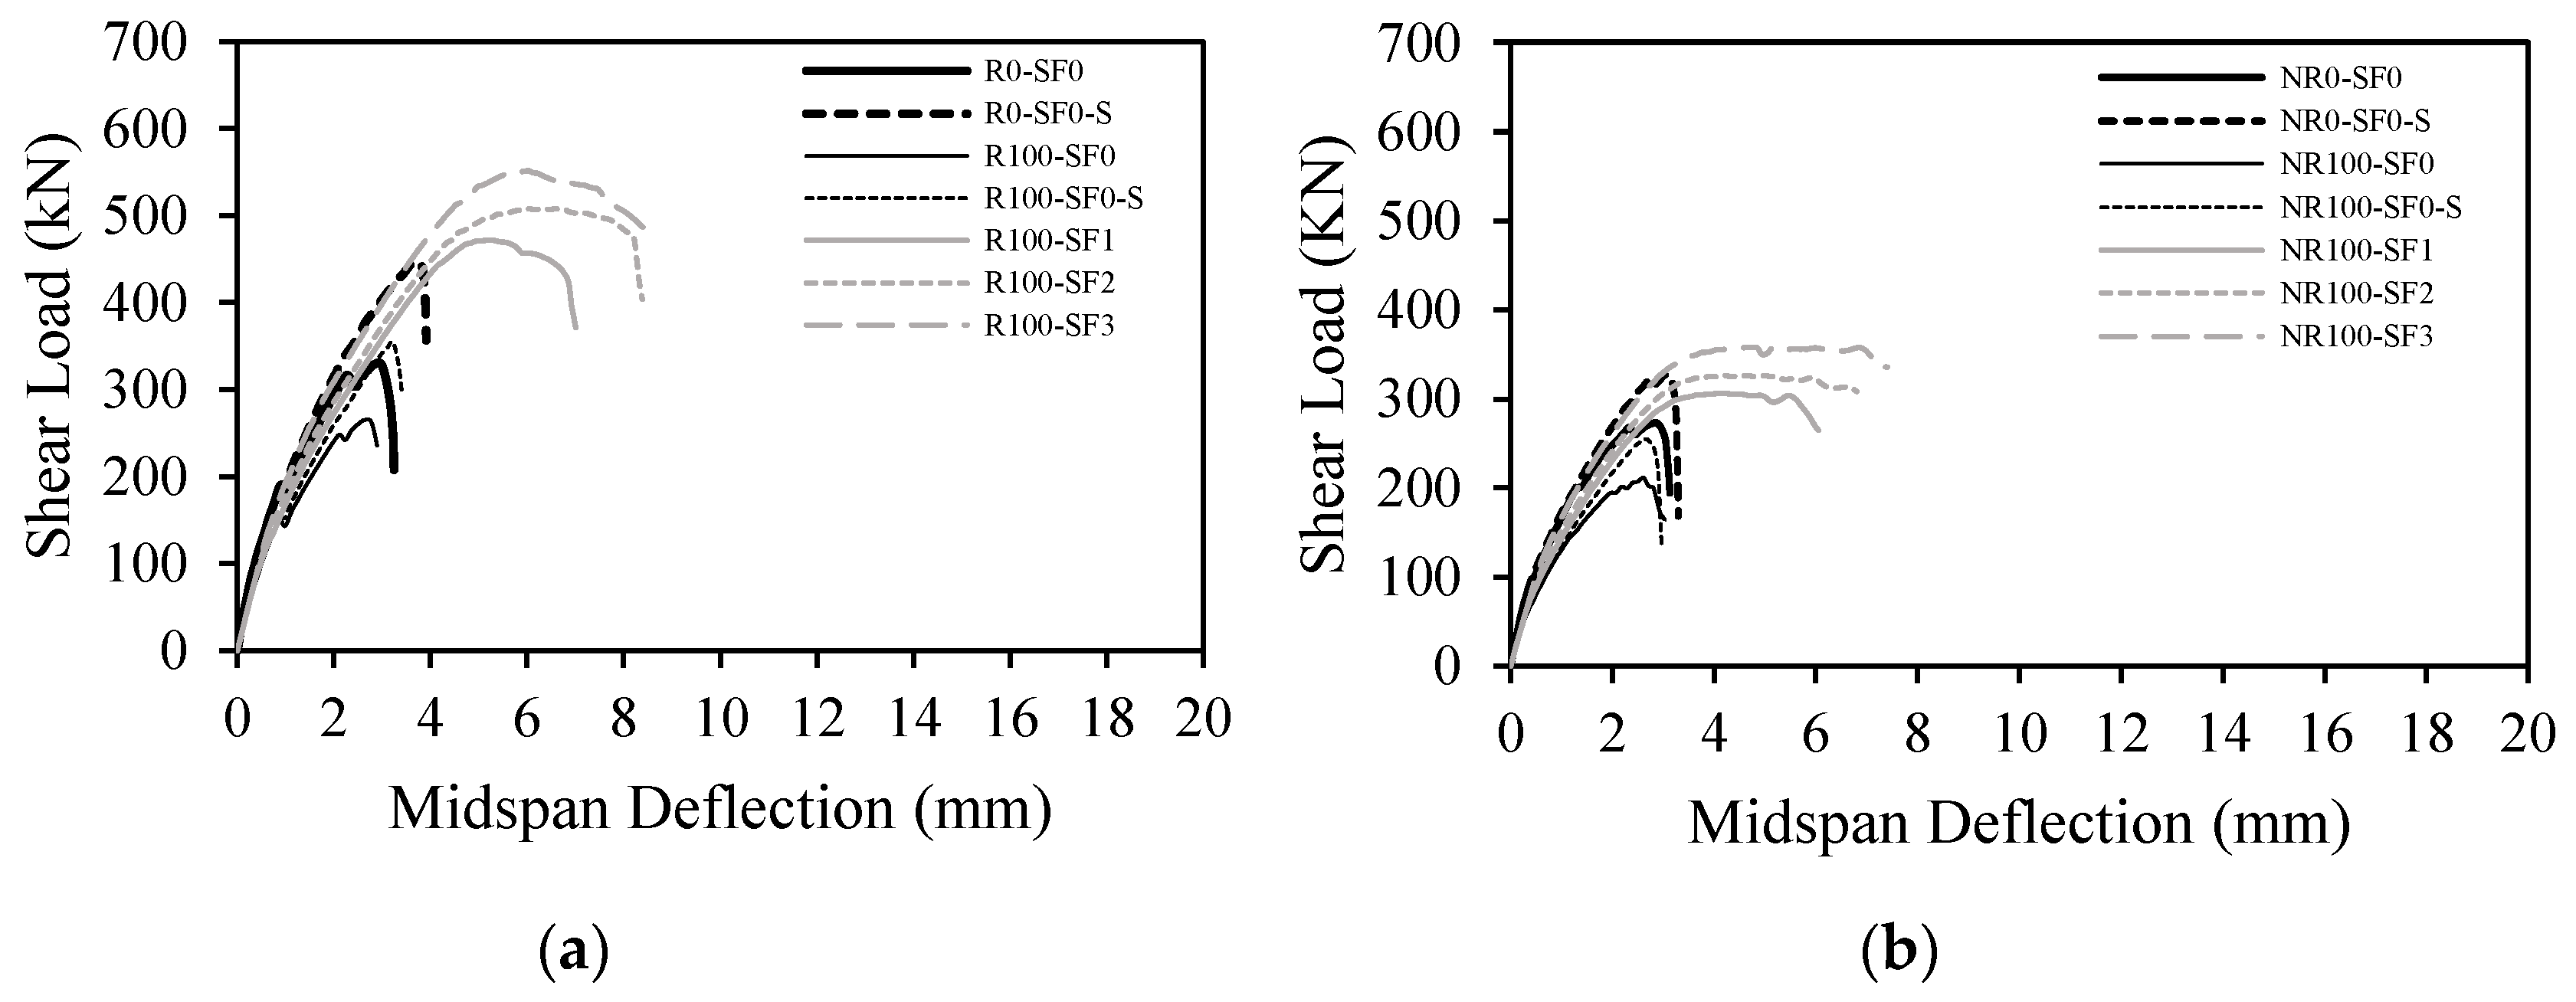
4.1.1. Shear Load–Deflection Response
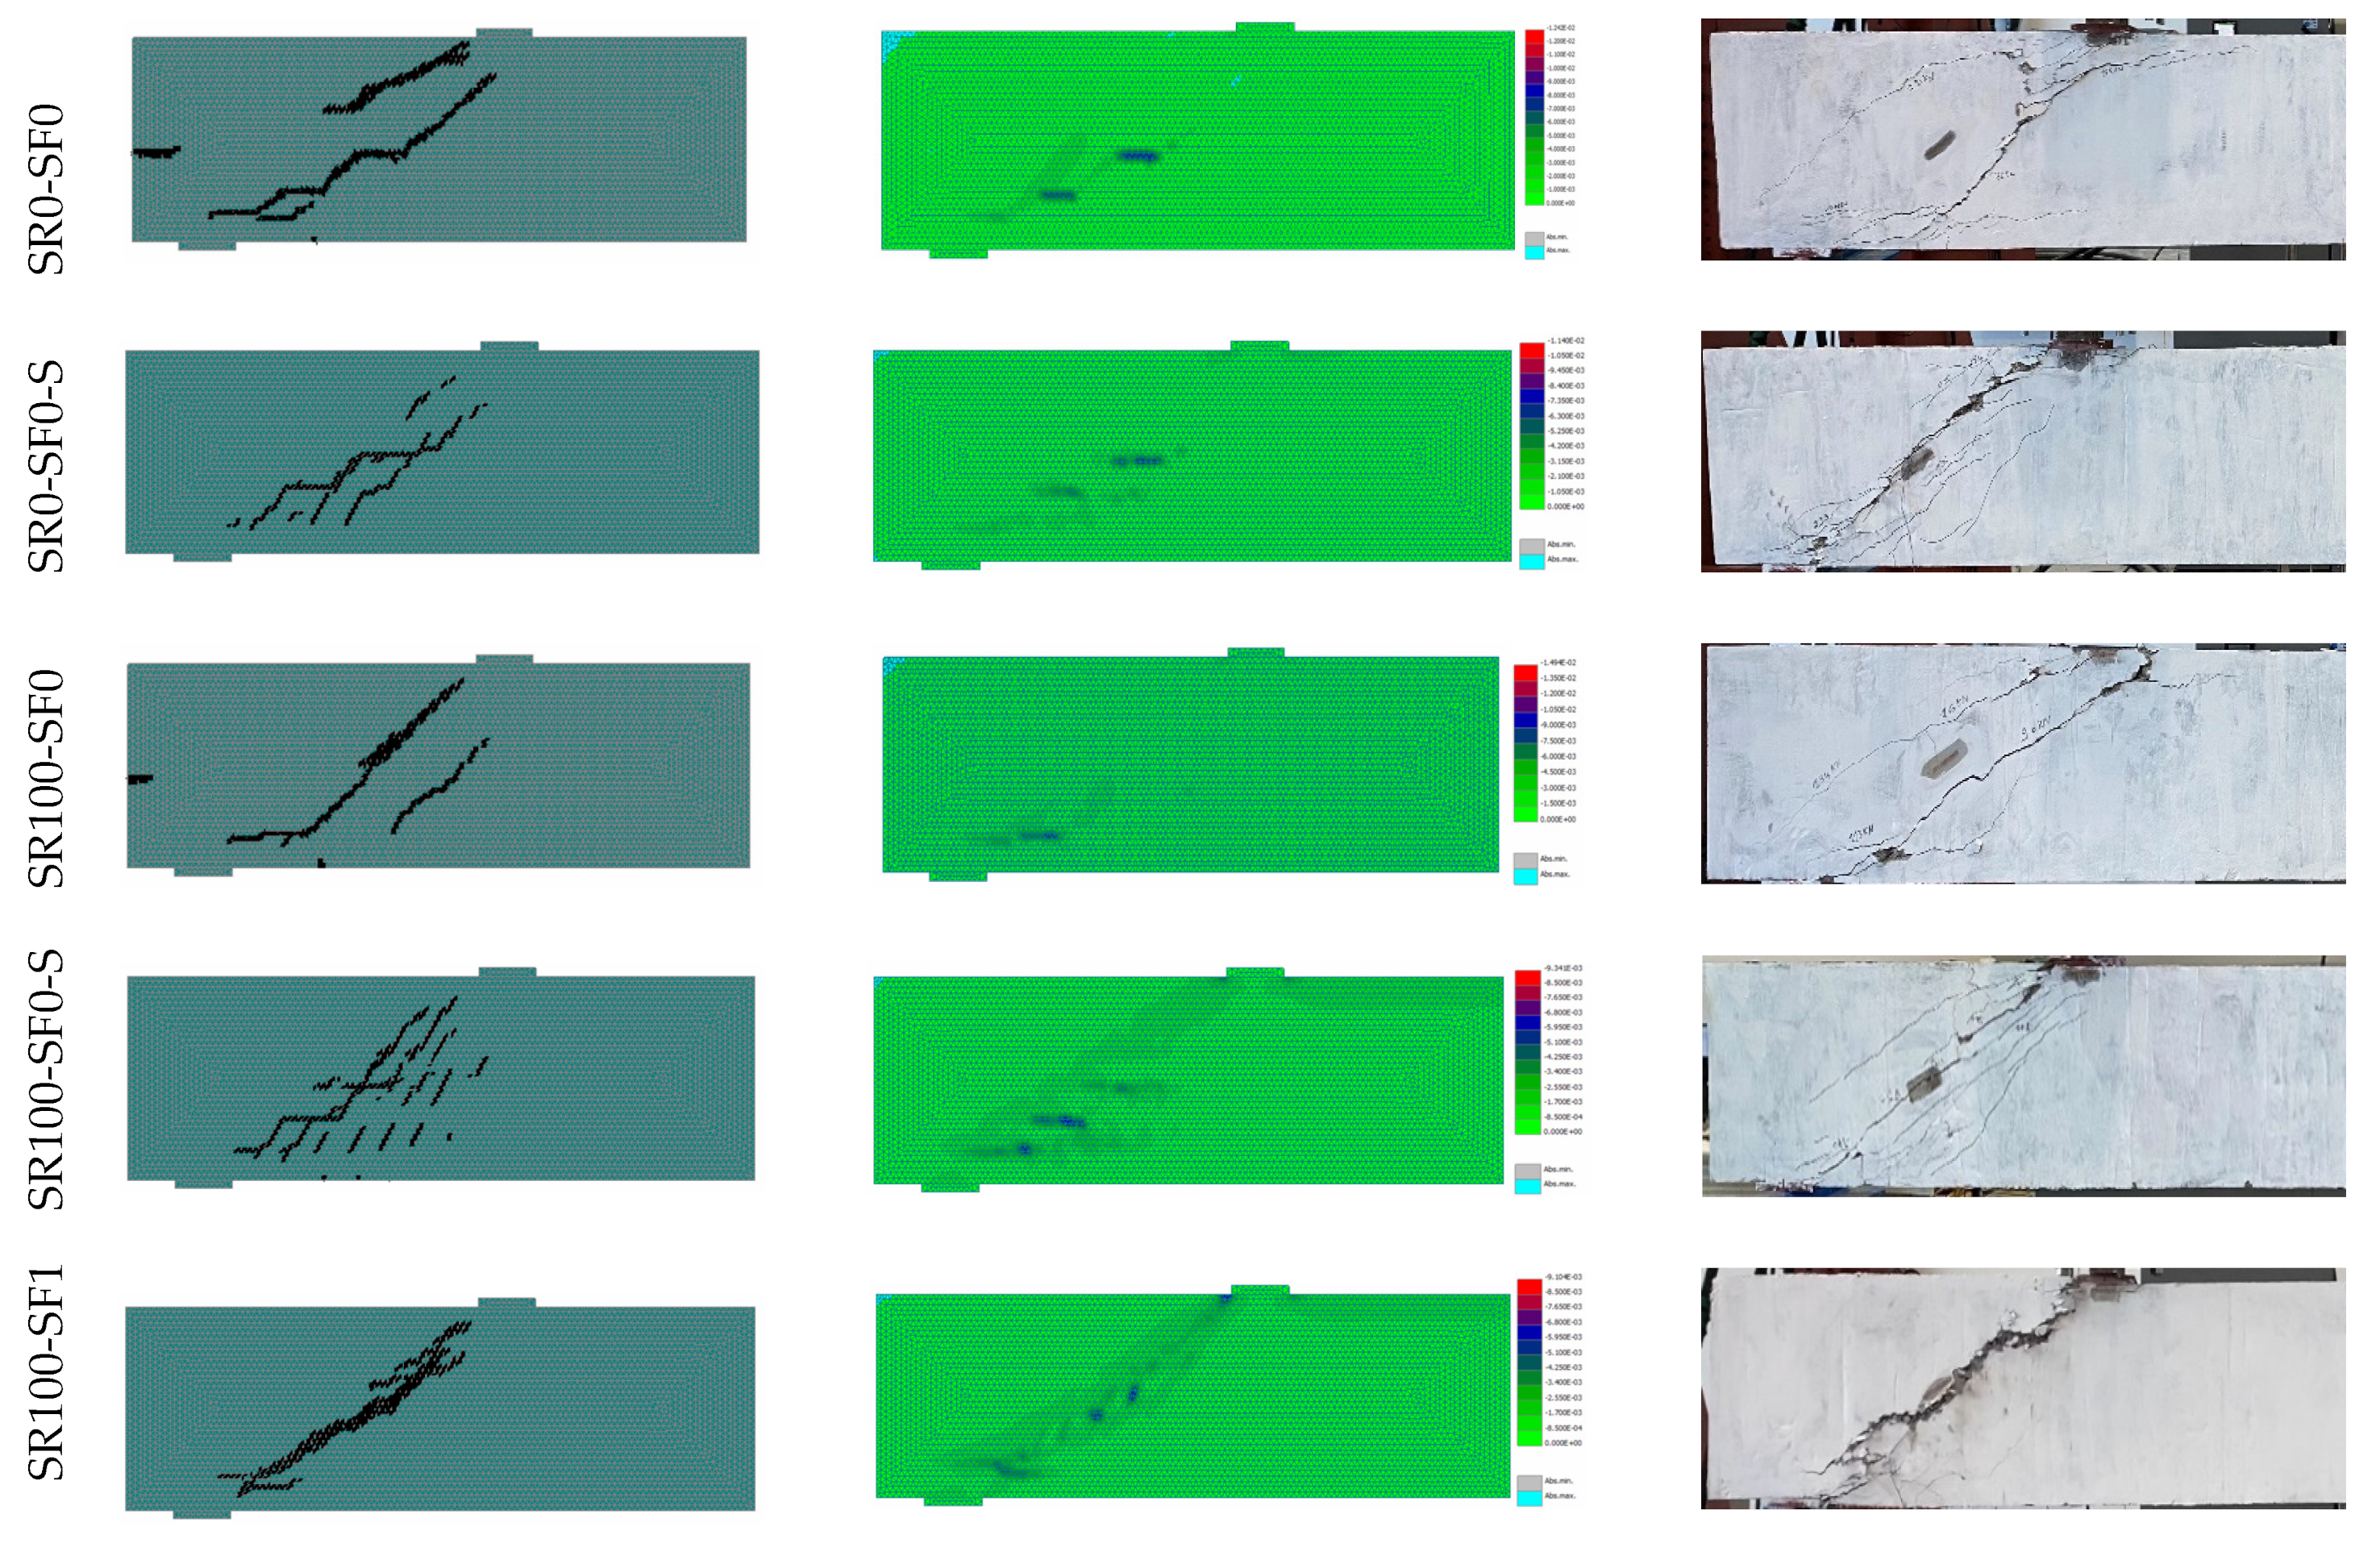
4.1.2. Crack Patterns
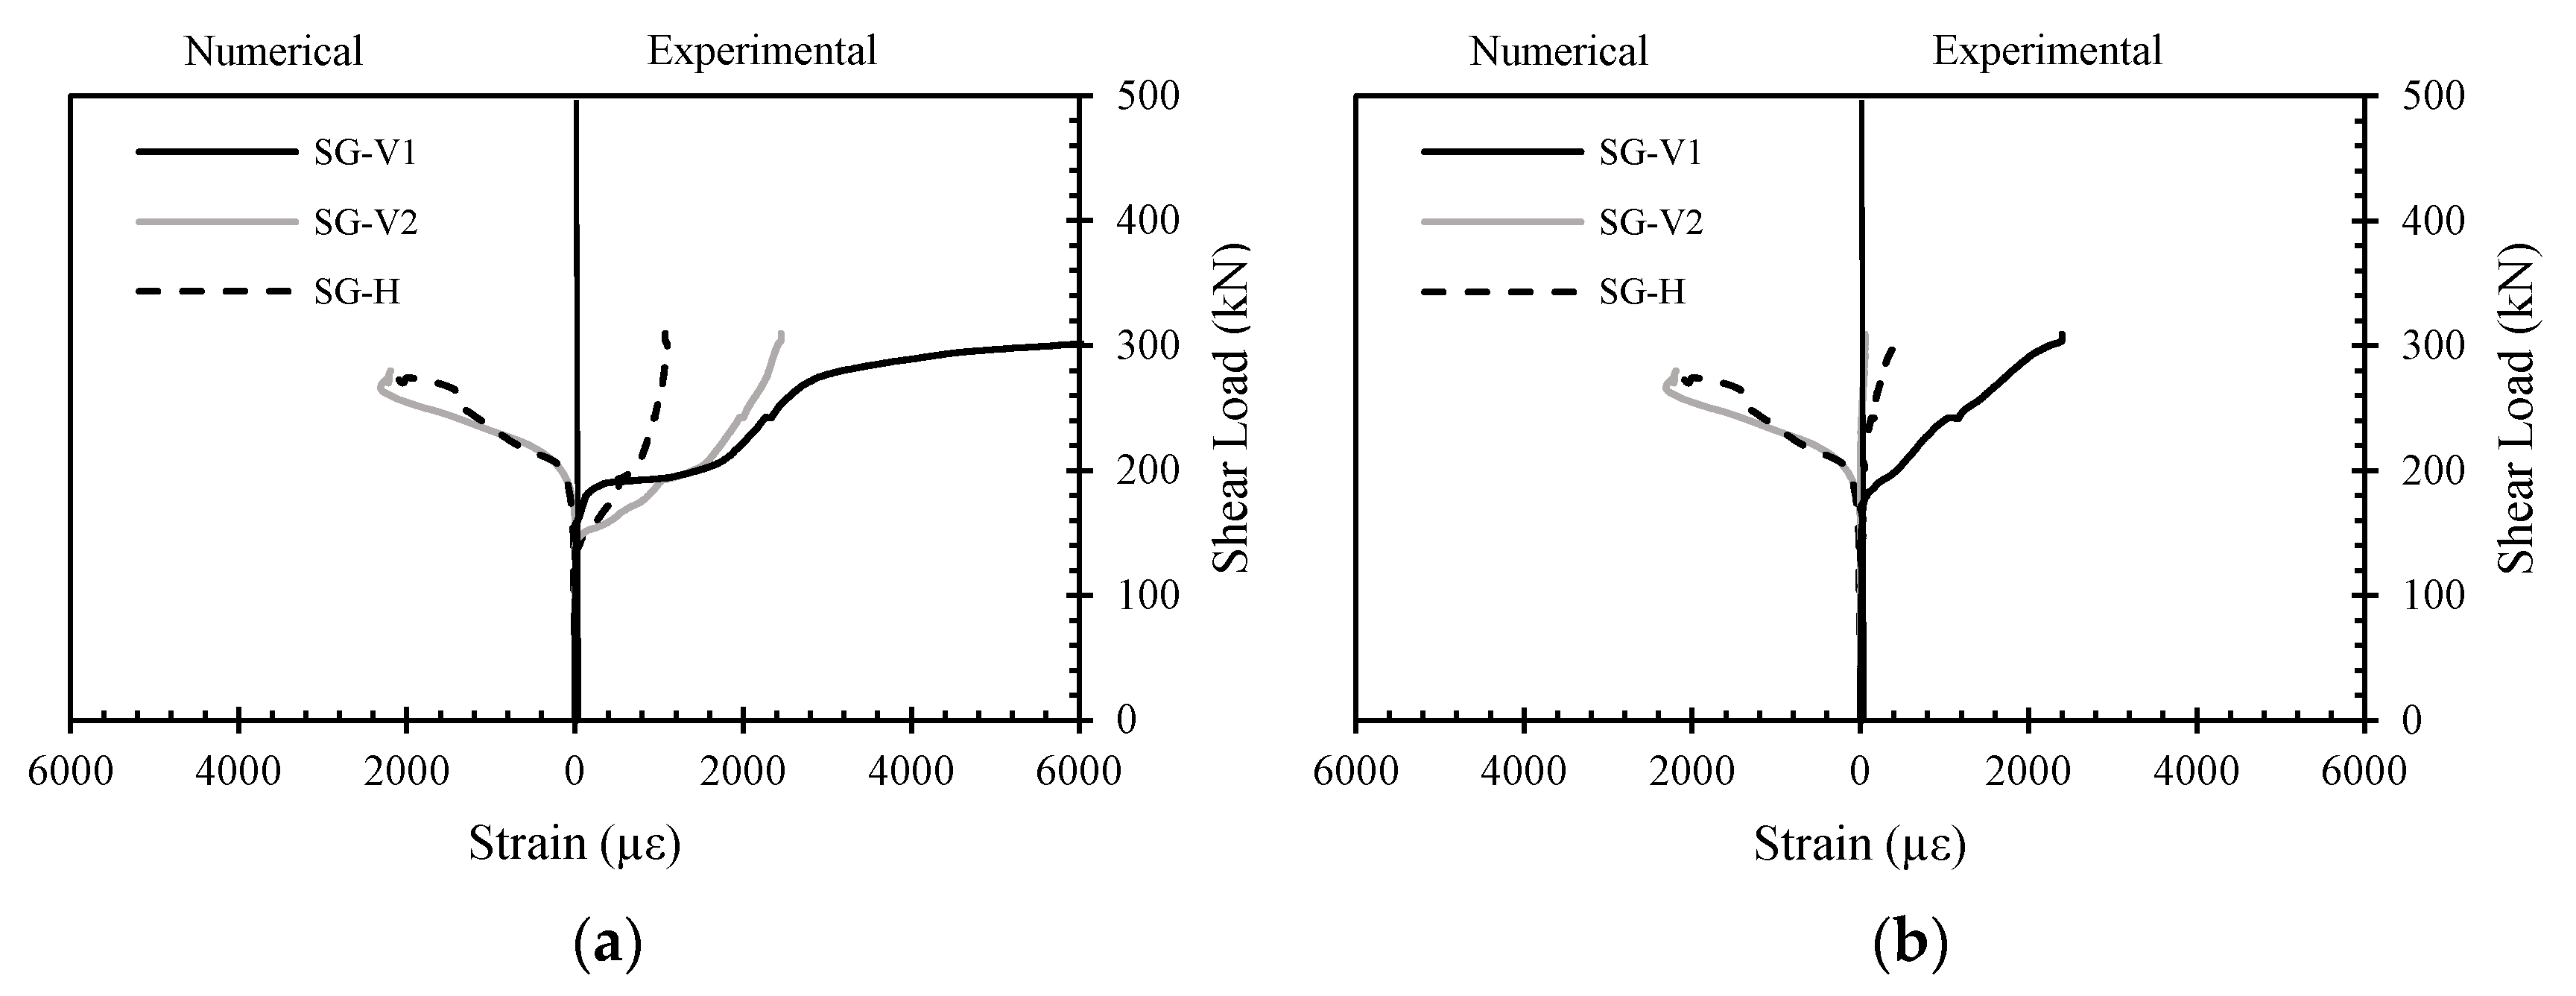
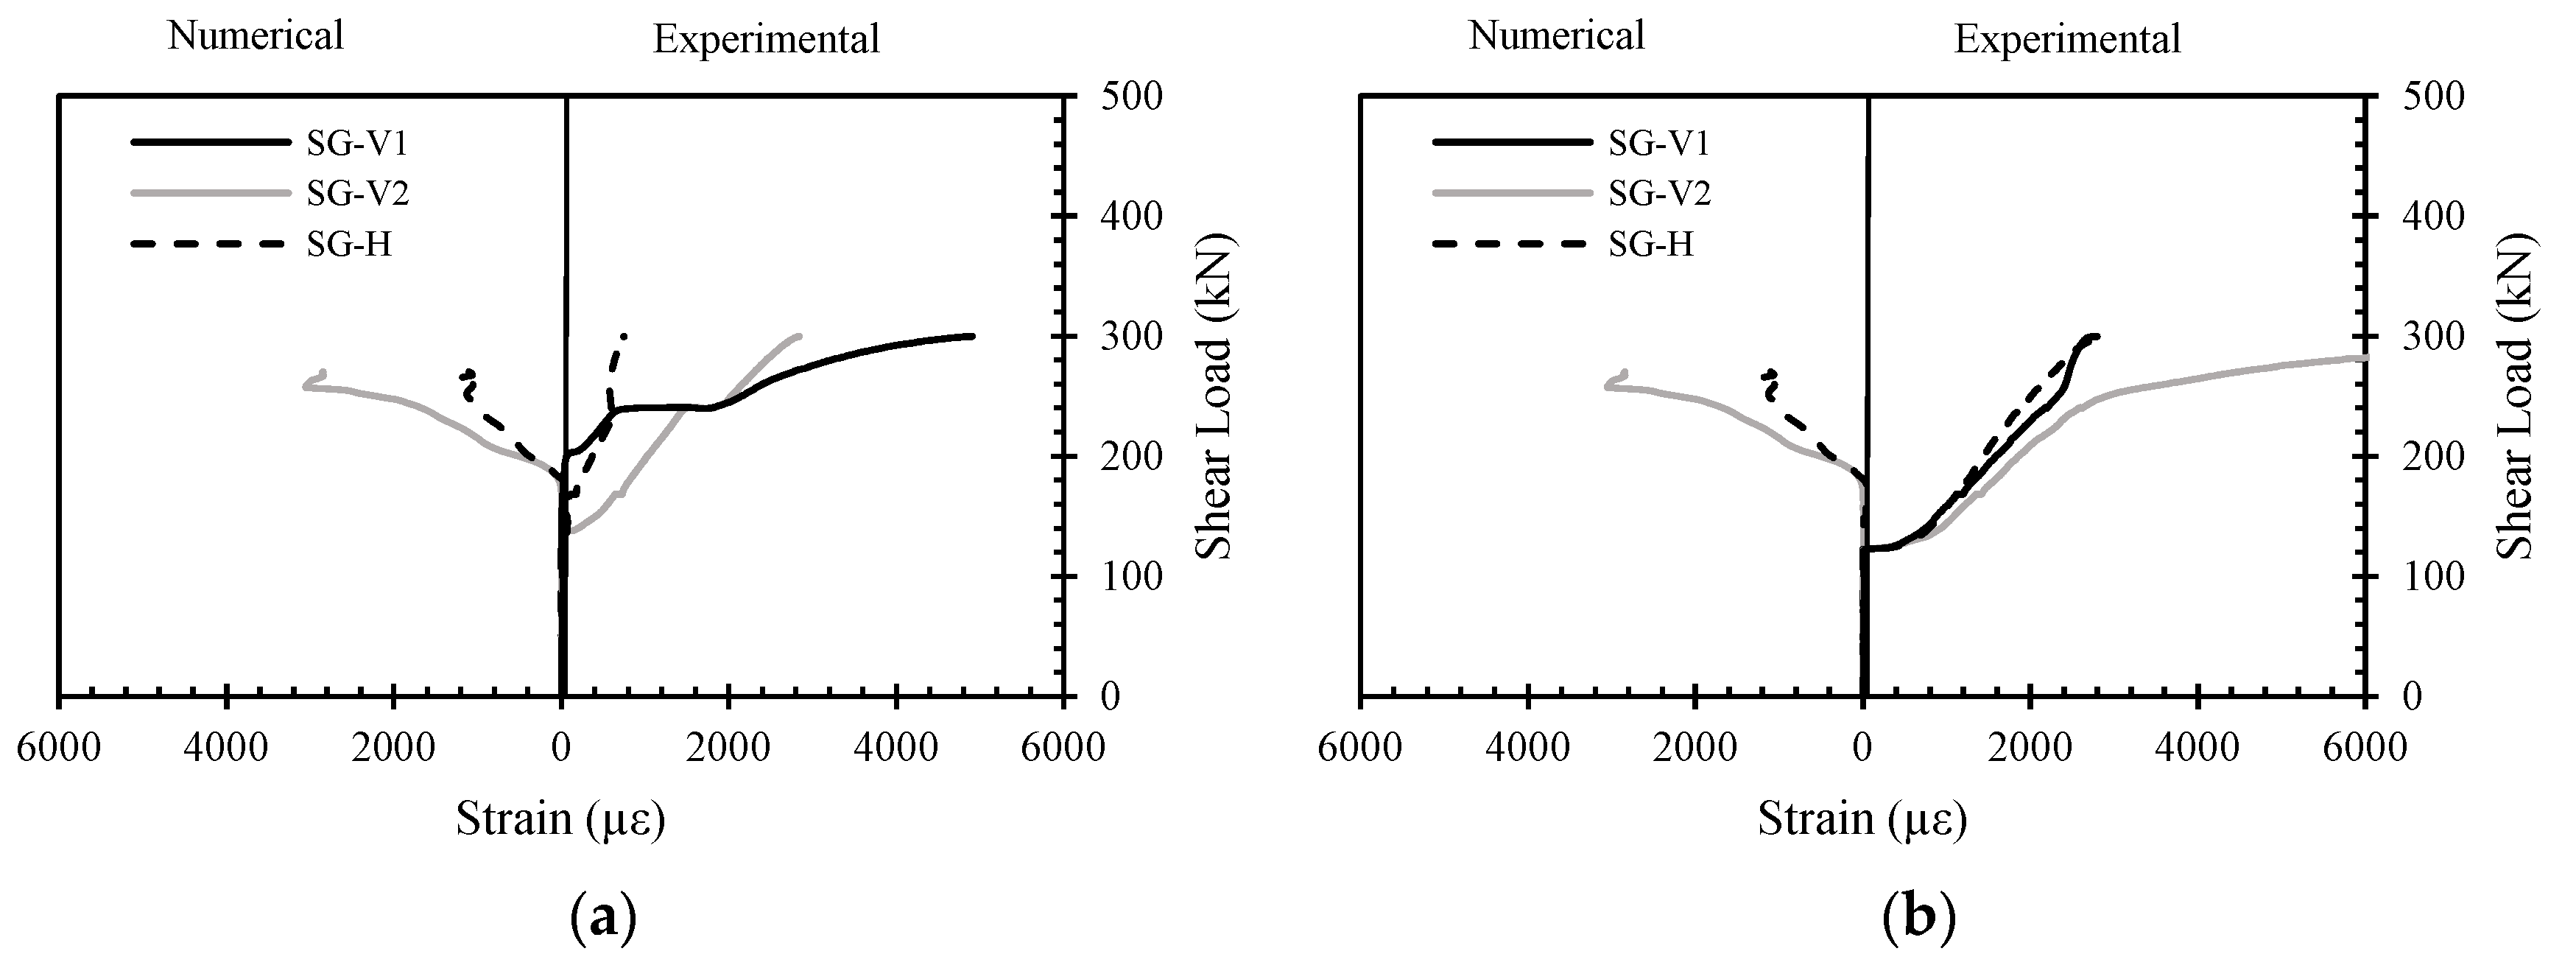
4.1.3. Stirrup Strains
4.1.4. Tensile Steel Strains
4.2. Deep Beam Models with Openings
4.2.1. Shear Load–deflection Response
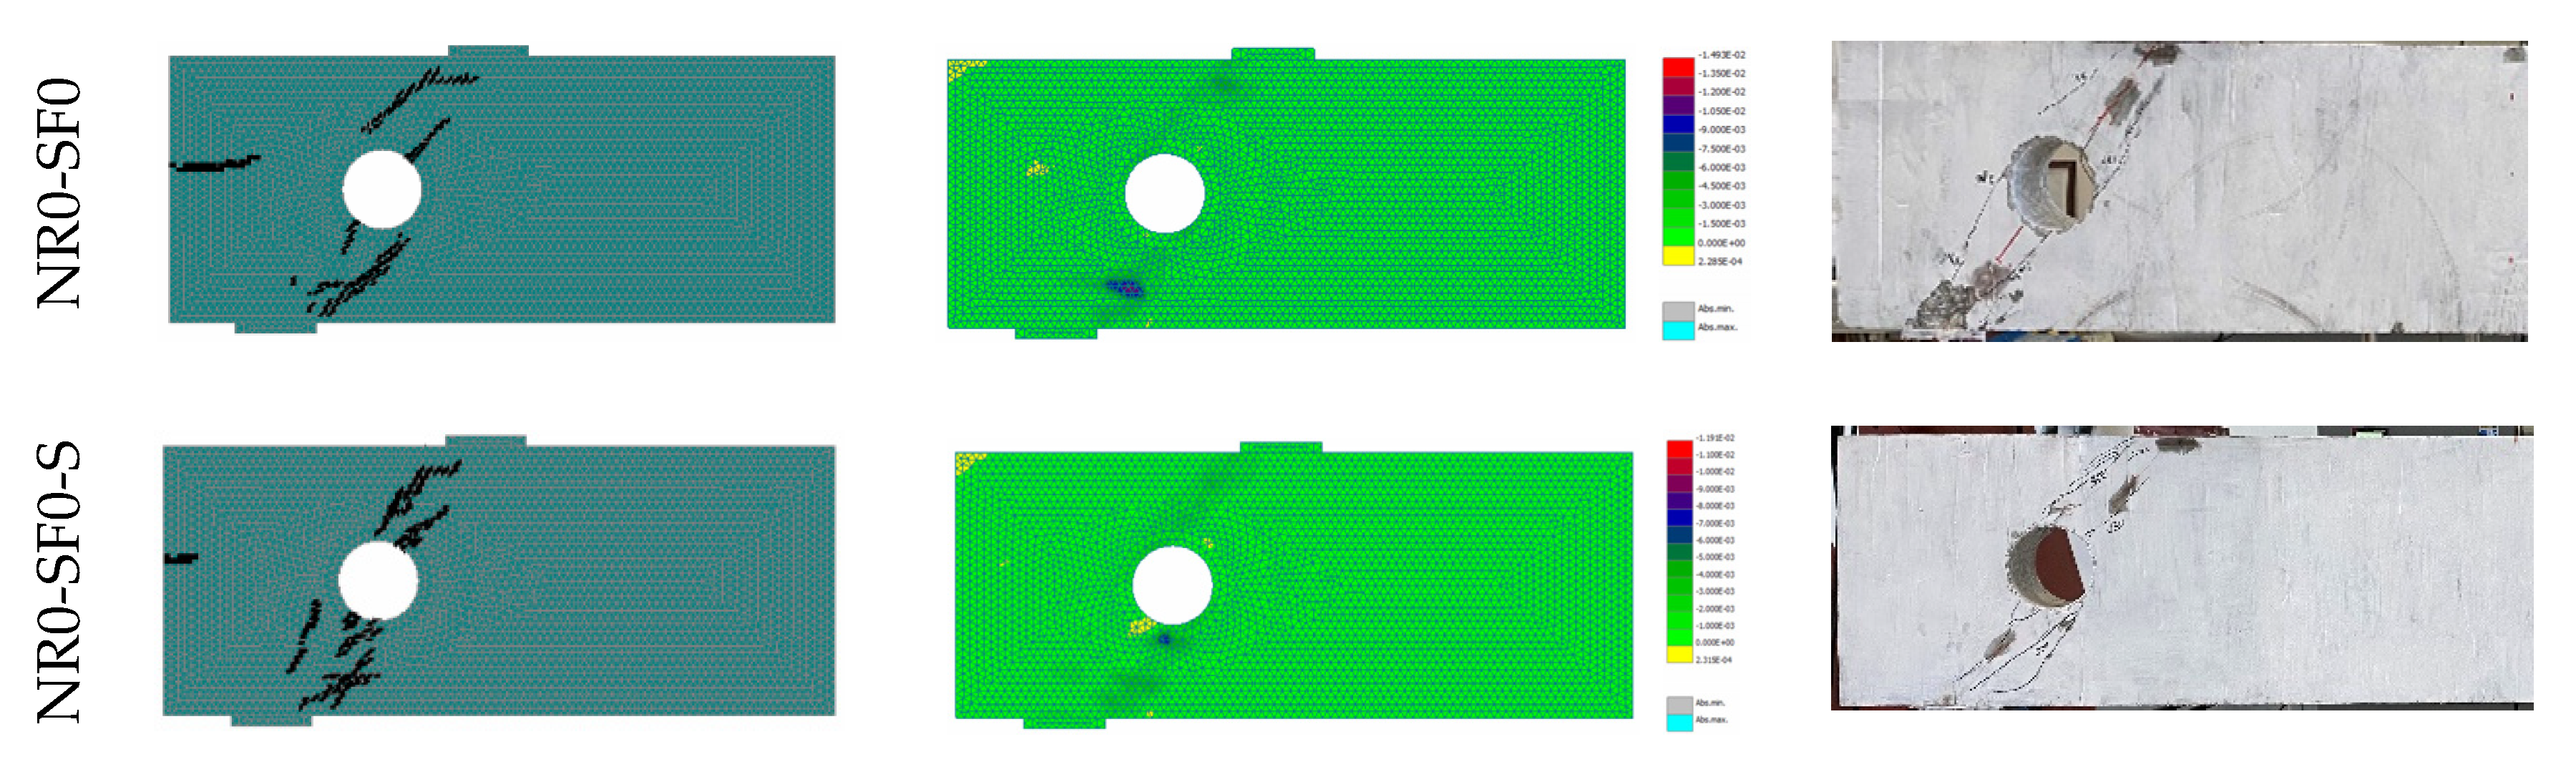
4.2.2. Crack Patterns
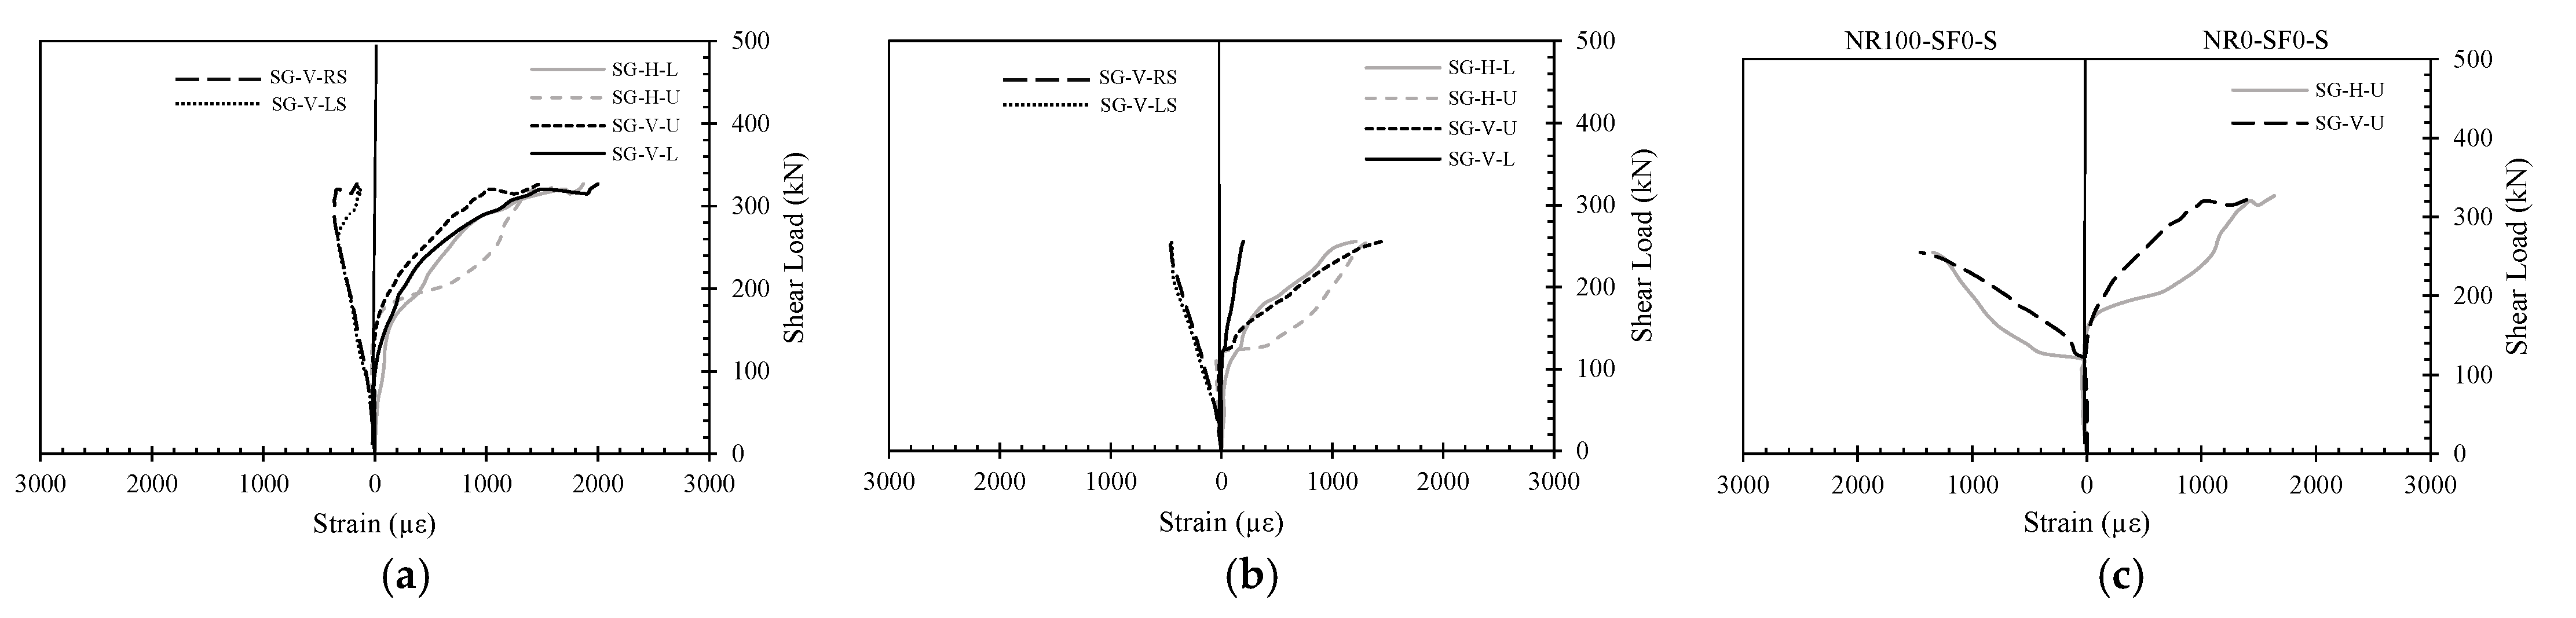
4.2.3. Stirrup Strains
4.2.4. Tensile Steel Strains
5. Parametric Study and Discussion
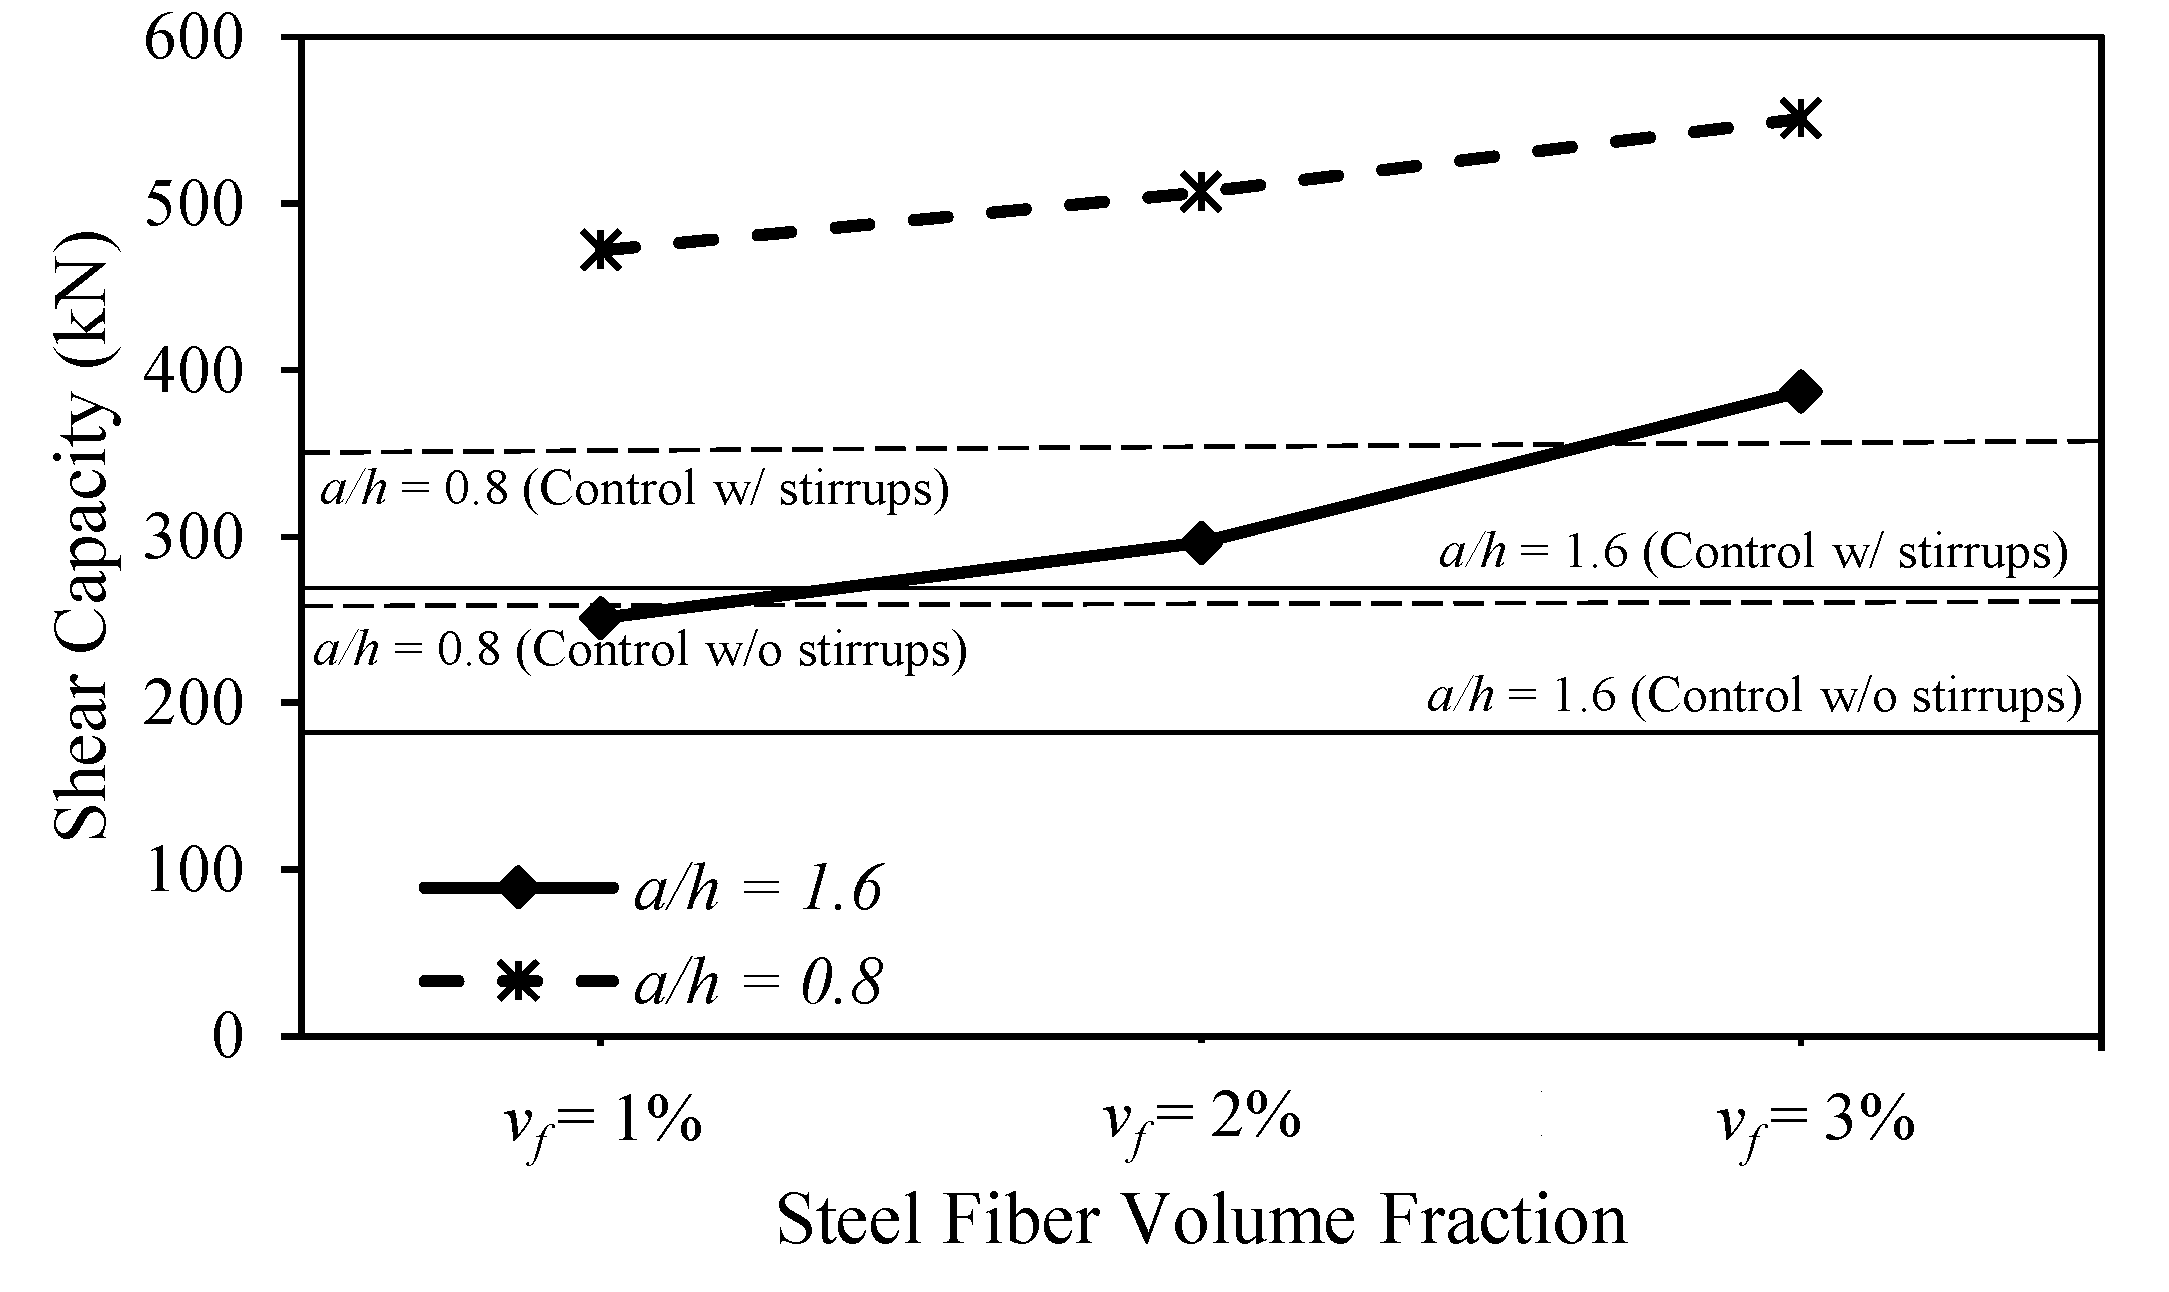
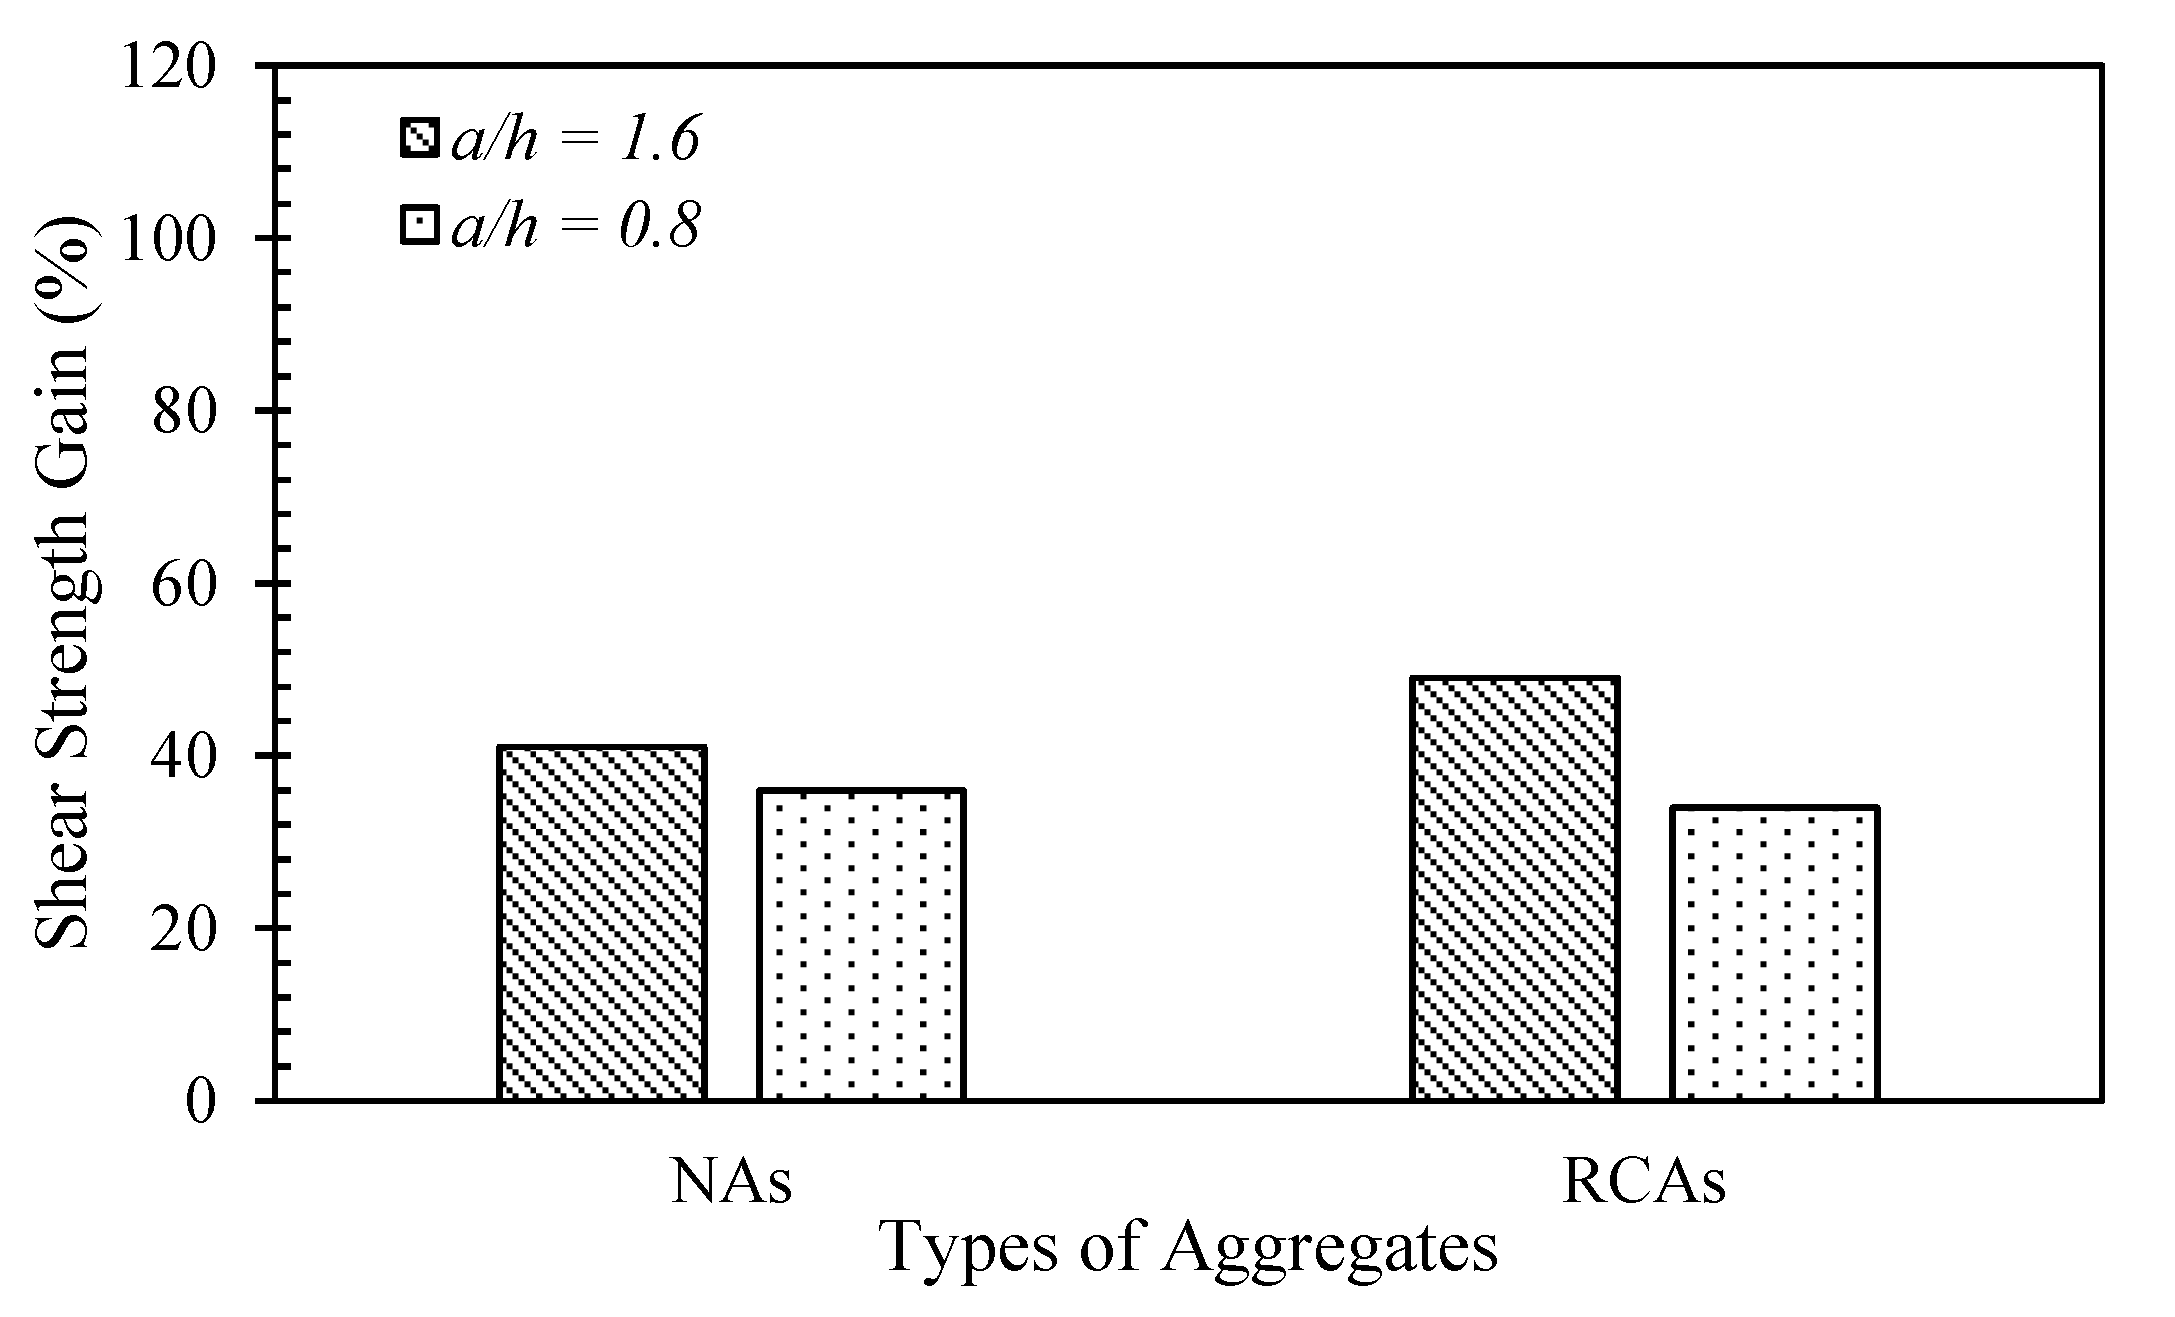
5.1. Effect of Shear Span-to-Depth Ratio
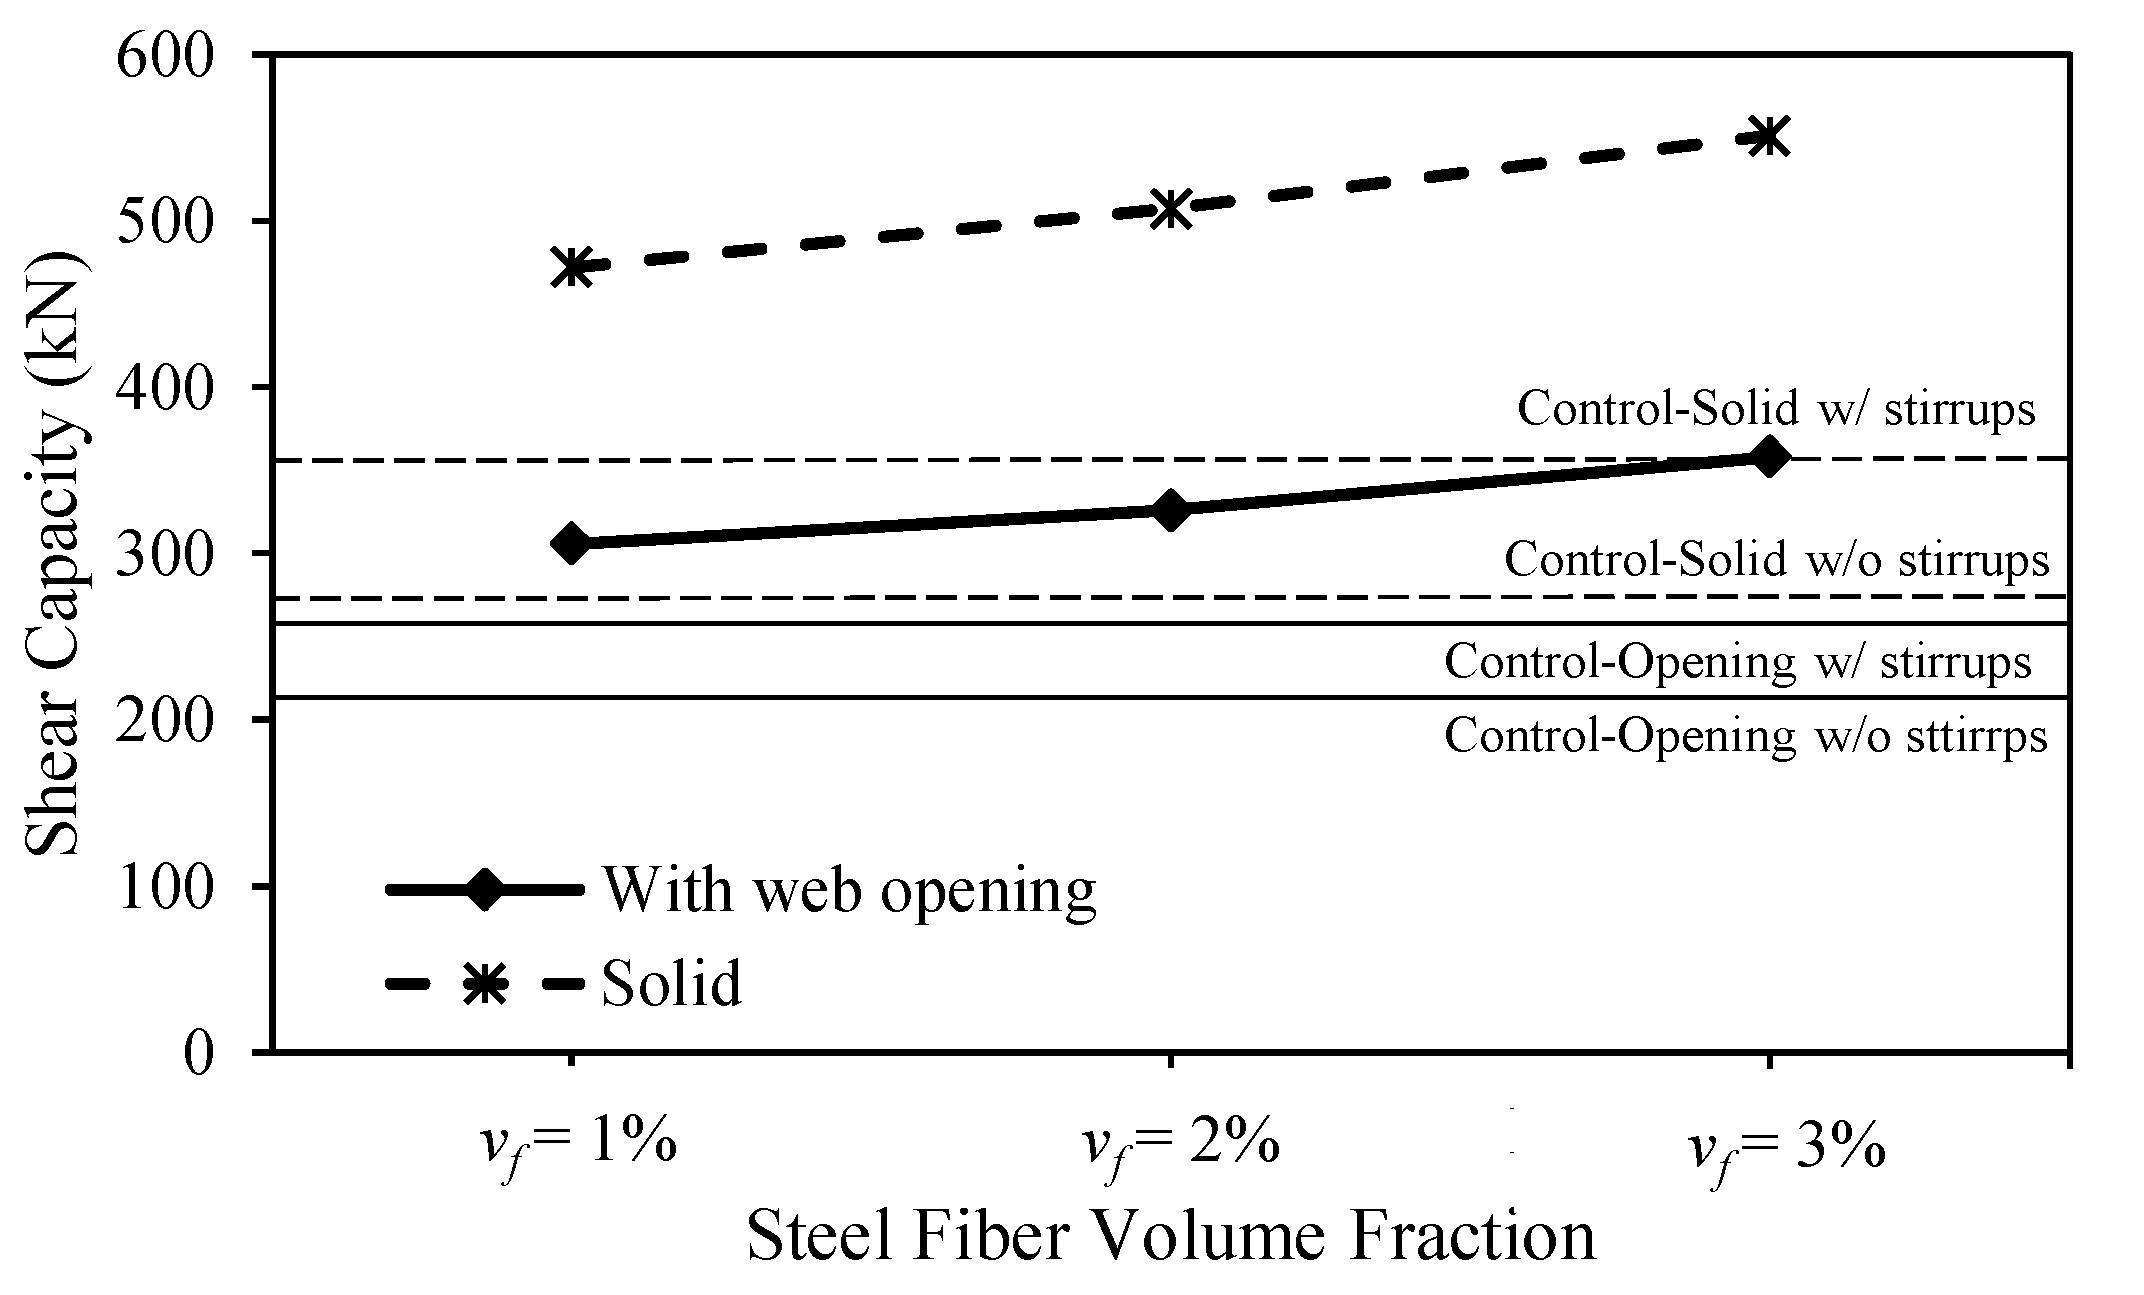
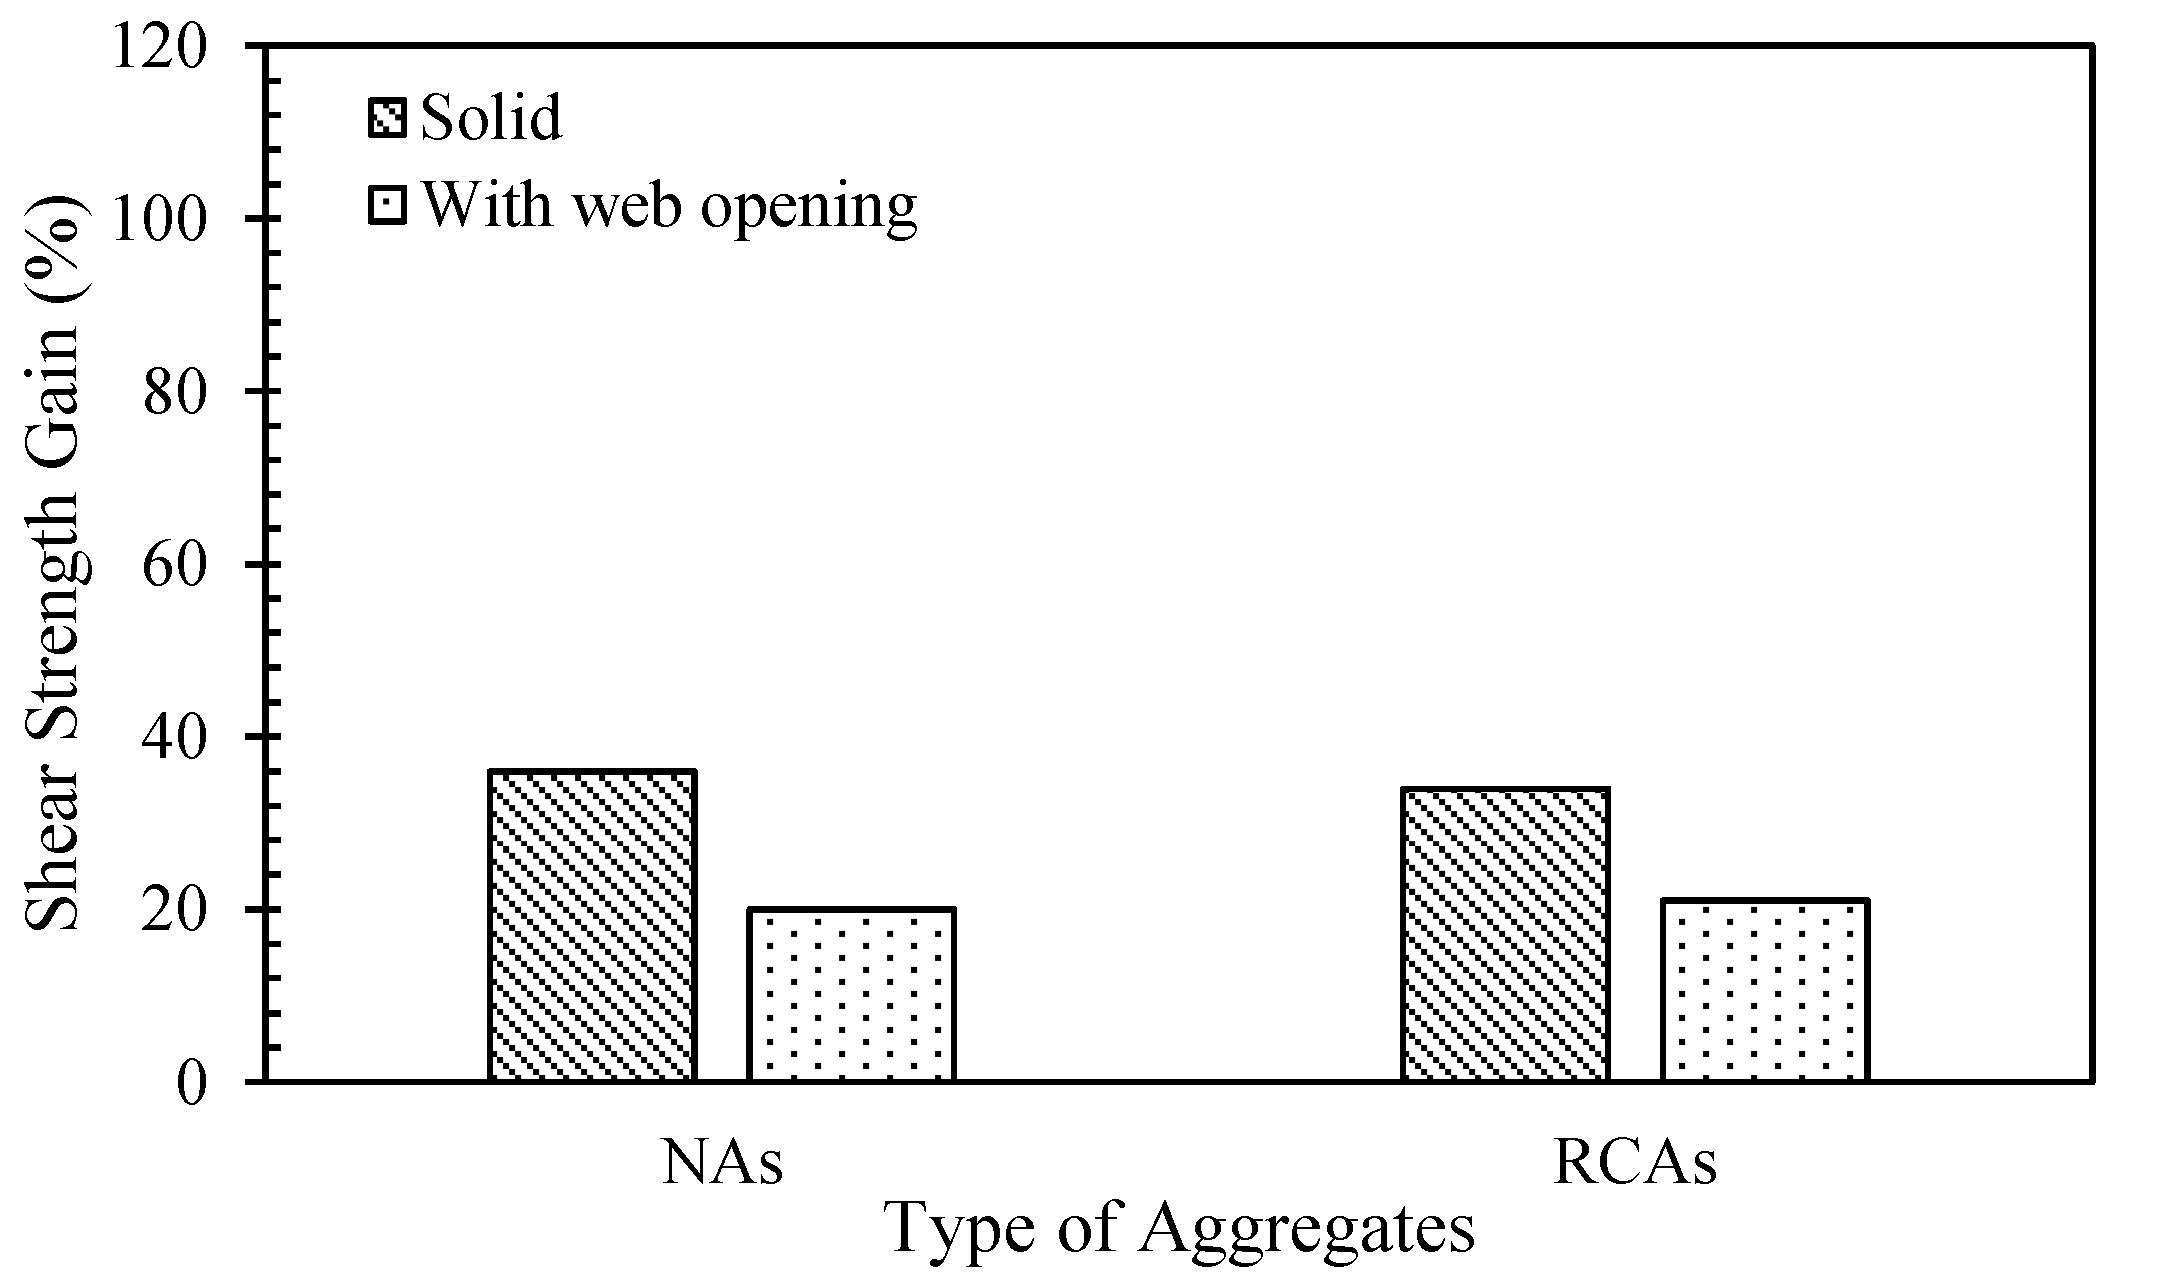
5.2. Effect of Web Openings
6. Conclusions
Author Contributions
Funding
Institutional Review Board Statement
Informed Consent Statement
Data Availability Statement
Conflicts of Interest
References
- Radonjanin, V.; Malešev, M.; Marinković, S.; Malty, A.E.S.A. Green recycled aggregate concrete. Constr. Build. Mater. 2013, 47, 1503–1511. [Google Scholar] [CrossRef]
- Debieb, F.; Kenaï, S.; Courard, L.; Degeimbre, R. Mechanical and durability properties of concrete using contaminated recycled aggregates. Cem. Concr. Compos. 2010, 32, 421–426. [Google Scholar] [CrossRef]
- Guo, M.; Grondin, F.; Loukili, A. Numerical analysis of the failure of recycled aggregate concrete by considering the random composition of old attached mortar. J. Build. Eng. 2020, 28, 101040. [Google Scholar] [CrossRef]
- Wagih, A.; El-Karmoty, H.; Ebid, M.; Okba, S. Recycled construction and demolition concrete waste as aggregate for structural concrete. HBRC J. 2013, 9, 193–200. [Google Scholar] [CrossRef] [Green Version]
- Hussain, H.K.; Abbas, A.M.; Ojaimi, M.F. Fiber-type influence on the flexural behavior of rc two-way slabs with an opening. Buildings 2022, 12, 279. [Google Scholar] [CrossRef]
- Khan, S.; Qing, L.; Ahmad, I.; Mu, R.; Bi, M. Investigation on fracture behavior of cementitious composites reinforced with aligned hooked-end steel fibers. Materials 2022, 15, 542. [Google Scholar] [CrossRef]
- Shi, C.; Li, Y.; Zhang, J.; Li, W.; Chong, L.; Xie, Z. Performance enhancement of recycled concrete aggregate-A review. J. Clean. Prod. 2016, 112, 466–472. [Google Scholar] [CrossRef]
- Gao, D.; Zhang, L.; Nokken, M. Mechanical behavior of recycled coarse aggregate concrete reinforced with steel fibers under direct shear. Cem. Concr. Compos. 2017, 79, 1–8. [Google Scholar] [CrossRef] [Green Version]
- Kachouh, N.; El-Hassan, H.; El-Maaddawy, T. Effect of steel fibers on the performance of concrete made with recycled concrete aggregates and dune sand. Constr. Build. Mater. 2019, 213, 348–359. [Google Scholar] [CrossRef]
- Kachouh, N.; El-Hassan, H.; El-Maaddawy, T. Influence of steel fibers on the flexural performance of concrete incorporating recycled concrete aggregates and dune sand. J. Sustain. Cem. Based Mater. 2021, 10, 165–192. [Google Scholar] [CrossRef]
- Lehner, P.; Horňáková, M. Effect of amount of fibre and damage level on service life of sfr recycled concrete in aggressive environment. Buildings 2021, 11, 489. [Google Scholar] [CrossRef]
- American Concrete Institute ACI. Building Code Requirements for Structural Concrete and Commentary on Building Code Requirements for Structural Concrete (ACI 318R-14); American Concrete Institute (ACI): Farmington Hills, MI, USA, 2014. [Google Scholar]
- El-Maaddawy, T.; Sherif, S. FRP composites for shear strengthening of reinforced concrete deep beams with openings. J. Compos. Struct. 2009, 60, 197–204. [Google Scholar] [CrossRef]
- Yang, K.H.; Eun, H.C.; Chung, H.S. The influence of web openings on the structural behavior of reinforced concrete high-strength concrete deep beams. Eng. Struct. 2006, 28, 1825–1834. [Google Scholar] [CrossRef]
- Yang, K.H.; Ashour, A.F. Effectiveness of web reinforcement around openings in continuous concrete deep beams. ACI Struct. J. 2008, 105, 414–424. [Google Scholar]
- Campione, G.; Minafo, G. Behaviour of concrete deep beams with openings and low shear span-to-depth ratio. Eng. Struct. 2012, 41, 294–306. [Google Scholar] [CrossRef]
- Hu, O.E.; Tan, K.H.; Liu, X.H. Behaviour and strut-and-tie predictions of high strength concrete deep beams with trapezoidal web openings. Mag. Concr. Res. 2007, 59, 529–541. [Google Scholar] [CrossRef]
- Laterza, M.; D’Amato, M.; Thanthirige, L.P.; Braga, F.; Gigliotti, R. Comparisons of codal detailing rules for curvature ductility and numerical investigations. Open Constr. Build. Technol. J. 2014, 8, 132–141. [Google Scholar] [CrossRef] [Green Version]
- ACI Committee 544.6R. Report on Design and Construction of Steel Fiber-Reinforced Concrete Elevated Slabs; American Concrete Institute: Farmington Hills, MI, USA, 2015. [Google Scholar]
- Senaratne, S.; Gerace, D.; Mirza, O.; Tam, V.W.Y.; Kang, W.H. The costs and benefits of combining recycled aggregate with steel fibres as a sustainable, structural material. J. Clean. Prod. 2016, 112, 2318–2327. [Google Scholar] [CrossRef]
- Awchat, G.D.; Kumthekar, M.B. Cost-benefit analysis of using recycled coarse aggregate in plain and fibre reinforced concrete. Adv. Sci. Technol. Res. J. 2021, 15, 233–242. [Google Scholar] [CrossRef]
- Tam, V.W.Y.; Mirza, O.; Senaratne, S.; Kang, W.H.; Kotrayothar, D. Shrinkage development of recycled aggregate concrete and future directions of using steel fibers as a reliable and cost-effective option. In Proceedings of the 38th Australasian Universities Building Education Association Conference 2013, Auckland, New Zealand, 20–22 November 2013. [Google Scholar]
- Ashour, S.A.; Hasanain, G.S.; Wafa, F.F. Shear behavior of high-strength fiber reinforced concrete beams. ACI Struct. J. 1992, 89, 176–184. [Google Scholar]
- Kwak, Y.K.; Eberhard, M.O.; Kim, W.S.; Kim, J. Shear strength of steel fiber-reinforced concrete beams without stirrups. ACI Struct. J. 2002, 99, 530–538. [Google Scholar]
- Al-Sarraf, S.; Al-Shaarbaf, I.A.S.; Diab, A.S. Effect of steel fiber on the behavior of deep beams with and without web opening. Eng. Tech. J. 2011, 29, 1–19. [Google Scholar]
- Zewair, M.S.; Hamoodi, A.Z.; Ojaimi, M. Effect of types of fibres on the shear behavior of deep beam with opening. Period. Eng. Nat. Sci. 2021, 9, 1086–1095. [Google Scholar] [CrossRef]
- Kachouh, N.; El-Maaddawy, T.; El-Hassan, H.; El-Ariss, B. Shear behavior of steel-fiber-reinforced recycled aggregate concrete deep beams. Buildings 2021, 11, 423. [Google Scholar] [CrossRef]
- Kachouh, N.; El-Maaddawy, T.; El-Hassan, H.; El-Ariss, B. Shear response of recycled aggregates concrete deep beams containing steel fibers and web openings. Sustainability 2022, 14, 945. [Google Scholar] [CrossRef]
- Narayanan, R.; Darwish, I.Y.S. Use of steel fibers as shear reinforcement. ACI Struct. J. 1987, 84, 216–227. [Google Scholar]
- Kong, F.K.; Sharp, G.R. Structural idealization for deep beams with openings. Mag. Concr. Res. 1977, 29, 81–91. [Google Scholar] [CrossRef]
- Shanmugam, N.; Swaddiwudhipong, S. Strength of fibre reinforced concrete deep beams containing openings. Cem. Concr. Compos. 1988, 10, 53–60. [Google Scholar] [CrossRef]
- Ray, S.P.; Reddy, C.S. Strength of reinforced concrete deep beams with and without opening is the web. Indian Concr. J. 1979, 54, 242–246. [Google Scholar]
- RILEM TC 162. Test and design methods for steel fibre reinforced concrete. Mater Struct. 2001, 34, 3–6. [Google Scholar] [CrossRef]
- Shi, X.; Park, P.; Rew, Y.; Huang, K.; Sim, C. Constitutive behaviors of steel fiber reinforced concrete under uniaxial compression and tension. Constr. Build. Mater. 2020, 233, 117316. [Google Scholar] [CrossRef]
- Sorelli, L.G.; Meda, A.; Plizzari, G.A. Bending and Uniaxial Tensile Tests on Concrete Reinforced with Hybrid Steel Fibers. J. Mater. Civ. Eng. 2005, 17, 519–527. [Google Scholar] [CrossRef]
- Yoo, D.Y.; Kang, S.T.; Yoon, Y.S. Effect of fiber length and placement method on flexural behavior, tension-softening curve, and fiber distribution characteristics of UHPFRC. Constr. Build. Mater. 2014, 64, 67–81. [Google Scholar] [CrossRef]
- Amin, A.; Foster, S.J.; Muttoni, A. Evaluation of the Tensile Strength of SFRC as Derived from Inverse Analysis of Notched Bending Tests. In Proceedings of the VIII International Conference on Fracture Mechanics of Concrete and Concrete Structures, Toledo, Spain, 10–14 March 2013. [Google Scholar]
- Fédération Internationale du Béton. Fib Model Code for Concrete Structures 2010; Ernst & Sohn: Lausanne, Switzerland, 2010. [Google Scholar]
- Mohamed, H.A. Experimental and Finite Element Analysis on the Steel Fiber Reinforced Concrete Deep Beams with Web Openings. Int. J. Eng. Innov. Technol. 2013, 3, 529–538. [Google Scholar]
- Amin, A.; Foster, S.J. Numerical modelling of large-scale steel fibre reinforced concrete beams failing in shear. In Proceedings of the FRC 2014 Joint ACI-fib International Workshop Fibre Reinforced Concrete: From Design to Structural Applications, Montreal, Canada, 24–25 July 2014. [Google Scholar]
- Khir Allah, N.; El-Maaddawy, T.; El-Hassan, H. Geopolymer- and cement-based fabric-reinforced matrix composites for shear strengthening of concrete deep beams: Laboratory testing and numerical modeling. Buildings 2022, 12, 448. [Google Scholar] [CrossRef]
- Khattak, N.; Mansour, M.; El-Maaddawy, T.; Ismail, N. Continuous reinforced concrete beams strengthened with fabric-reinforced cementitious matrix: Experimental investigation and numerical simulation. Buildings 2022, 12, 27. [Google Scholar] [CrossRef]
- El-Ariss, B.; Mansour, M.; El-Maaddawy, T. Effects of web height reduction and skew angle variation on behavior of RC inverted T-beams. Buildings 2021, 11, 451. [Google Scholar] [CrossRef]
- Mansour, M.; El-Maaddawy, T. Testing and modeling of deep beams strengthened with NSM-CFRP reinforcement around cutouts. Case Stud. Constr. Mater. 2021, 15, e00670. [Google Scholar] [CrossRef]
- Mansour, M.; El-Ariss, B.; El-Maaddawy, T. Effect of support conditions on performance of continuous reinforced concrete deep beams. Buildings 2020, 10, 212. [Google Scholar] [CrossRef]
- Abu Obaida, A.; El-Ariss, B.; El-Maaddawy, T. Numerical simulation of double-sided concrete corbels internally-reinforced with GFRP bars. Compos. Part C Open Access 2020, 2, 100040. [Google Scholar] [CrossRef]
- Alkhalil, J.; El-Maaddawy, T. Finite element modelling and testing of two-span concrete slab strips strengthened by externally-bonded composites and mechanical anchors. Eng. Struct. 2017, 147, 45–61. [Google Scholar] [CrossRef]
- Alkhalil, J.; El-Maaddawy, T. Nonlinear flexural response of continuous concrete slab strips strengthened with near-surface-mounted composites. ASCE J. Compos. Constr. 2017, 21, 04016071. [Google Scholar] [CrossRef]
- ATENA Computer Software, Červenka Consulting s.r.o.: Prague, Czech Republic. Available online: https://www.cervenka.cz/ (accessed on 25 March 2022).
- ACI Committee 211.1-91. Standard Practice for Selecting Proportions for Normal, Heavyweight and Mass Concrete; American Concrete Institute: Farmington Hills, MI, USA, 2009. [Google Scholar]
- Bekaert. Dramix 3D 65/35 Data Sheet. Bekaert, Belgium. Available online: https://www.bekaert.com/en/product-catalog/content/dop/~//-/media/Files/ImportFiles/DRAMIX-3D/Dramix-3D-6535BG-6535BG.pdf?sc_lang=en-US (accessed on 23 March 2022).
- ASTM C39; Standard Test Method for Compressive Strength of Cylindrical Concrete Specimens. ASTM International: West Conshohocken, PA, USA, 2015.
- British Standard; Testing Hardened Concrete—Compressive Strength of Test Specimens, BS EN 12390-3. British Standard: London, UK, 2009.
- ASTM C1609; Standard Test Method for Flexural Performance of Fiber-Reinforced Concrete. West Conshohocken. ASTM International: West Conshohocken, PA, USA, 2019.
- ASTM C469; Standard Test Method for Static Modulus of Elasticity and Poisson’s Ratio of Concrete in Compression. ASTM International: West Conshohocken, PA, USA, 2014.
- Nilson, A.; Darwin, D.; Dolan, C. Design of Concrete Structures, 14th ed.; McGraw-Hill Education: London, UK, 2009. [Google Scholar]


| Property | Standard | Sample Type and Dimensions (mm) | Characterization Test Results * | ||||
|---|---|---|---|---|---|---|---|
| R0-SF0 | R100-SF0 | R100-SF1 | R100-SF2 | R100-SF3 | |||
| f’c (MPa) | ASTM C39 [52] | Cylinder, 150 × 300 | 36.4 (1.5) | 23.6 (0.4) | 25.8 (0.3) | 25.6 (1.4) | 25.0 (0.8) |
| fcu (MPa) | BS 12390-3 [53] | Cube, 150 | 40.5 (1.8) | 24.7 (1.0) | 32.2 (0.6) | 30.0 (1.0) | 28.3 (0.7) |
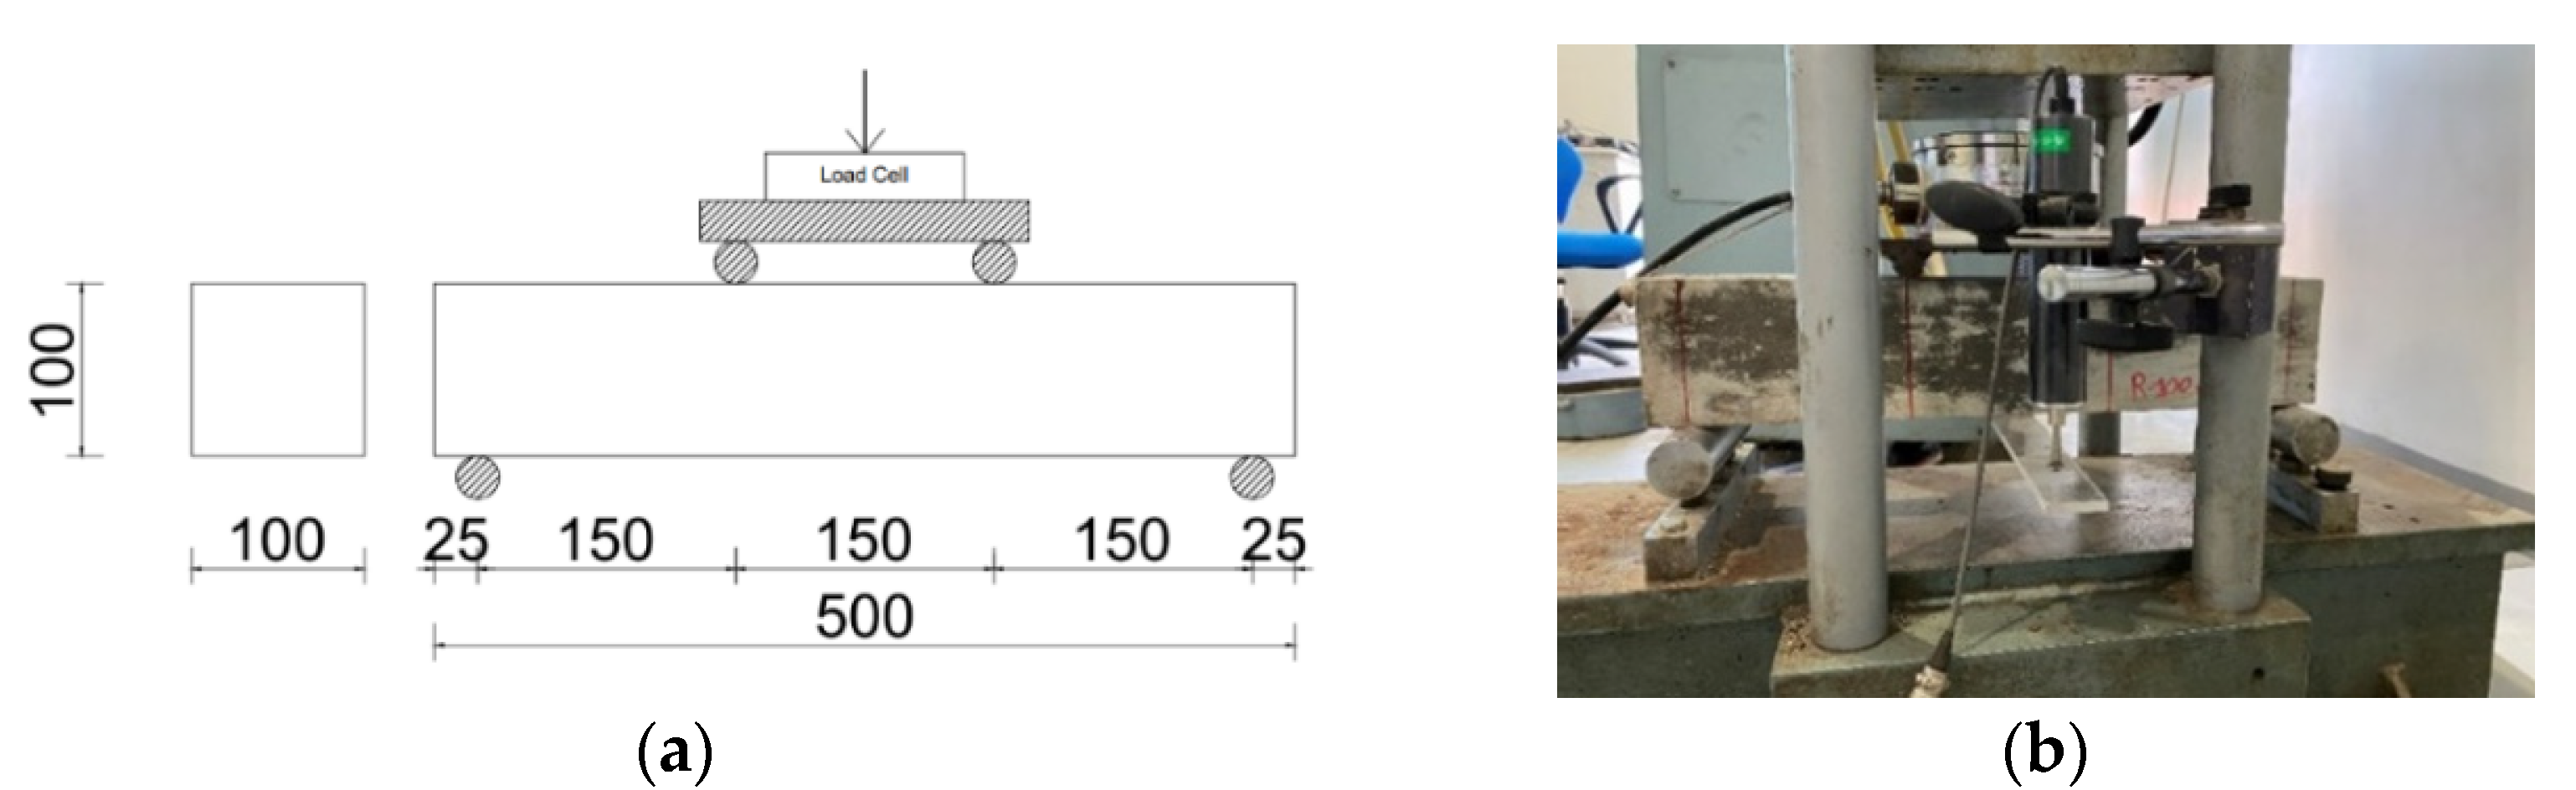
| fr (MPa) | ASTM C1609 [54] | Prism, 100 × 100 × 500 | 3.4 (0.2) | 2.4 (0.5) | 4.1 (0.4) | 5.4 (0.4) | 6.1 (0.7) |
| Ec (GPa) | ASTM C469 [55] | Cylinder, 150 × 300 | 34.7 (1.8) | 19.8 (2.4) | 21.5 (2.9) | 20.7 (2.5) | 21.1 (1.6) |
| Group | Model Designation | a/h | RCA (%) | vf (%) | Presence of Traditional Shear Reinforcement | Presence of Openings |
|---|---|---|---|---|---|---|
| S | SR0-SF0 | 1.6 | - | - | - | - |
| SR0-SF0-S | 1.6 | - | - | √ | - | |
| SR100-SF0 | 1.6 | 100 | - | - | - | |
| SR100-SF0-S | 1.6 | 100 | - | √ | - | |
| SR100-SF1 | 1.6 | 100 | 1 | - | - | |
| SR100-SF2 | 1.6 | 100 | 2 | - | - | |
| SR100-SF3 | 1.6 | 100 | 3 | - | - | |
| N | NR0-SF0 | 0.8 | - | - | - | √ |
| NR0-SF0-S | 0.8 | - | - | √ | √ | |
| NR100-SF0 | 0.8 | 100 | - | - | √ | |
| NR100-SF0-S | 0.8 | 100 | - | √ | √ | |
| NR100-SF1 | 0.8 | 100 | 1 | - | √ | |
| NR100-SF2 | 0.8 | 100 | 2 | - | √ | |
| NR100-SF3 | 0.8 | 100 | 3 | - | √ |
| Model | Shear Capacity | Deflection Capacity | VFE/VEXP | ΔFE/ΔEXP | ||
|---|---|---|---|---|---|---|
| VEXP (kN) | VFE (kN) | ΔEXP (mm) | ΔFE (mm) | |||
| SR0-SF0 | 203 | 198 | 7.3 | 7.1 | 0.98 | 0.97 |
| SR0-SF0-S | 309 | 280 | 10.3 | 8.0 | 0.91 | 0.78 |
| SR100-SF0 | 193 | 181 | 9.0 | 6.2 | 0.94 | 0.69 |
| SR100-SF0-S | 300 | 270 | 10.7 | 8.2 | 0.90 | 0.77 |
| SR100-SF1 | 235 | 251 | 8.3 | 7.9 | 1.07 | 0.95 |
| SR100-SF2 | 271 | 296 | 10.4 | 9.5 | 1.09 | 0.91 |
| SR100-SF3 | 401 | 387 | 15.8 | 12.0 | 0.97 | 0.77 |
| Average | 0.98 | 0.83 | ||||
| Std Dev | 0.07 | 0.10 | ||||
| COV (%) | 7.03 | 11.95 | ||||
| Model | Shear Capacity | Deflection Capacity | VFE/VEXP | ΔFE/ΔEXP | ||
|---|---|---|---|---|---|---|
| VEXP (kN) | VFE (kN) | ΔEXP (mm) | ΔFE (mm) | |||
| NR0-SF0 | 273 | 273 | 4.7 | 2.9 | 1.00 | 0.62 |
| NR0-SF0-S | 341 | 327 | 4.8 | 3.0 | 0.96 | 0.63 |
| NR100-SF0 | 237 | 211 | 4.9 | 2.6 | 0.89 | 0.53 |
| NR100-SF0-S | 279 | 255 | 5.3 | 2.7 | 0.91 | 0.51 |
| NR100-SF1 | 329 | 306 | 5.6 | 5.4 | 0.93 | 0.96 |
| NR100-SF2 | 362 | 326 | 6.0 | 5.9 | 0.90 | 0.98 |
| NR100-SF3 | 435 | 358 | 7.4 | 6.0 | 0.82 | 0.81 |
| Average | 0.92 | 0.72 | ||||
| Std dev | 0.05 | 0.18 | ||||
| COV (%) | 5.74 | 25.26 | ||||
Publisher’s Note: MDPI stays neutral with regard to jurisdictional claims in published maps and institutional affiliations. |
© 2022 by the authors. Licensee MDPI, Basel, Switzerland. This article is an open access article distributed under the terms and conditions of the Creative Commons Attribution (CC BY) license (https://creativecommons.org/licenses/by/4.0/).
Share and Cite
Kachouh, N.; El-Maaddawy, T.; El-Hassan, H.; El-Ariss, B. Numerical Modeling of Concrete Deep Beams Made with Recycled Aggregates and Steel Fibers. Buildings 2022, 12, 529. https://doi.org/10.3390/buildings12050529
Kachouh N, El-Maaddawy T, El-Hassan H, El-Ariss B. Numerical Modeling of Concrete Deep Beams Made with Recycled Aggregates and Steel Fibers. Buildings. 2022; 12(5):529. https://doi.org/10.3390/buildings12050529
Chicago/Turabian StyleKachouh, Nancy, Tamer El-Maaddawy, Hilal El-Hassan, and Bilal El-Ariss. 2022. "Numerical Modeling of Concrete Deep Beams Made with Recycled Aggregates and Steel Fibers" Buildings 12, no. 5: 529. https://doi.org/10.3390/buildings12050529