Essay

Vibration Test and Control of Factory a Building under Excitation of Multiple Vibrating Screens

1
School of Civil Engineering, Henan Polytechnic University, Jiaozuo 454003, China
2
Institute of Rock and Soil Mechanics, Chinese Academy of Sciences, Wuhan 430071, China
3
Jiaozuo Qianye New Materials Co., Ltd., Jiaozuo 454100, China
*
Authors to whom correspondence should be addressed.
Buildings 2022, 12(5), 607; https://doi.org/10.3390/buildings12050607
Submission received: 2 April 2022 / Revised: 29 April 2022 / Accepted: 30 April 2022 / Published: 6 May 2022
(This article belongs to the Special Issue Advanced Seismic Technologies in Underground Structures)

Abstract

:
In order to reduce the excessive vibration responses of a reinforced concrete frame structure induced by several vibrating screens working simultaneously, field vibration monitoring and some vibration reduction measures are carried out. The results of field vibration monitoring show that the maximum vertical vibration of the structure exceeds 106% of the limitation of building vibration. The results of the structural response analysis show that the excessive structural vibration is attributed to the resonance, as the frequency of the vibrating screens coincides with vertical natural frequency of the floors of the factory structure. Based on this fact, three vibration control measures, including damping, active vibration isolation of vibrating screens and structural vibration absorption, are proposed to mitigate the excessive vibration. In order to analyze the vibration control performance of the proposed schemes, the finite element dynamic model of the factory building structure is established, and the model is verified by the results of vibration and mode tests. Then, the damping system, vibration isolation system and vibration absorption system are set up in the models, and the vibration control performance of the three schemes are investigated. The results show that the measures, including vibration isolation and absorption, can reduce the vibration by more than 80%. Combined with the demand for a short construction period, the active vibration isolation of vibrating screens is finally selected. After the implementation of the scheme, the field monitoring data show that the structural vibration response is consistent with the finite element result and obviously weakened to meet the limitation. This study can provide a reference for the vibration control design for similar screening factory buildings.

1. Introduction

Vibrating screens are widely used to separate the material particles of different sizes in the ore mining and processing industry [1]. The vibrating screen plays an important role in realizing rational utilization of coal resources, protecting the environment and creating economic benefits for coal enterprises. The vibrating screens often cause excessive vibration of the factory building, which could be harmful to the safety of the factory building and the health of the operators [2].
Vibration is one of the methods of building structure monitoring, because vibration response can reflect the overall and local performance of building structure. A monitoring system based on vibration technology is an important work in seismic and wind resistant building structure research [3,4]. Destructive vibration of a building structure system can be caused by earthquakes, wind and industrial production. An assessment of structural health status through the use of structural health monitoring systems can determine the seismic vulnerability of a large portion of the existing reinforced concrete buildings [5]. Then, specific measures are taken to control vibration. Base isolation is one of the most used techniques for the seismic protection of buildings [6].
The vibration caused by machinery is a crucial issue in the design of industrial buildings. The evaluation of the static and dynamic performance of building structures is conducive to understanding the type and size of mechanical vibration sources and monitoring the reliability of building structure systems [7]. Load directly or indirectly acting on the structure may affect the stability and safety of the building structure. Vibration is transmitted through the foundation to the building structure [8,9,10], or load directly applied to the structure will cause structural vibration. Aiming at the vibration problems related to structure, some scholars have studied and put forward different vibration control measures [11,12,13]. Most scholars learn the reasons for strong structural vibration through structural vibration analysis [14,15,16] and field vibration monitoring [17,18,19,20,21], and some reasonable measures of structural vibration control are put forward combined with a numerical simulation [22,23,24,25]. However, few scholars have put forward a more systematic and comprehensive scheme to analyze the dynamic characteristics of a factory building with excessive vibration.
In view of this fact, excessive structural vibration is investigated through field structural vibration monitoring. Modal test analysis and numerical simulation are carried out to uncover the reasons for the excessive vibration of a factory building. The most unfavorable machine-induced vibration sources and operating conditions are characterized, and several vibration control schemes are presented and compared. The results can provide a reference for the vibration control design for the frame structure of similar screening factory buildings.

2. Field Vibration Monitoring and Modal Analysis of Factory Buildings

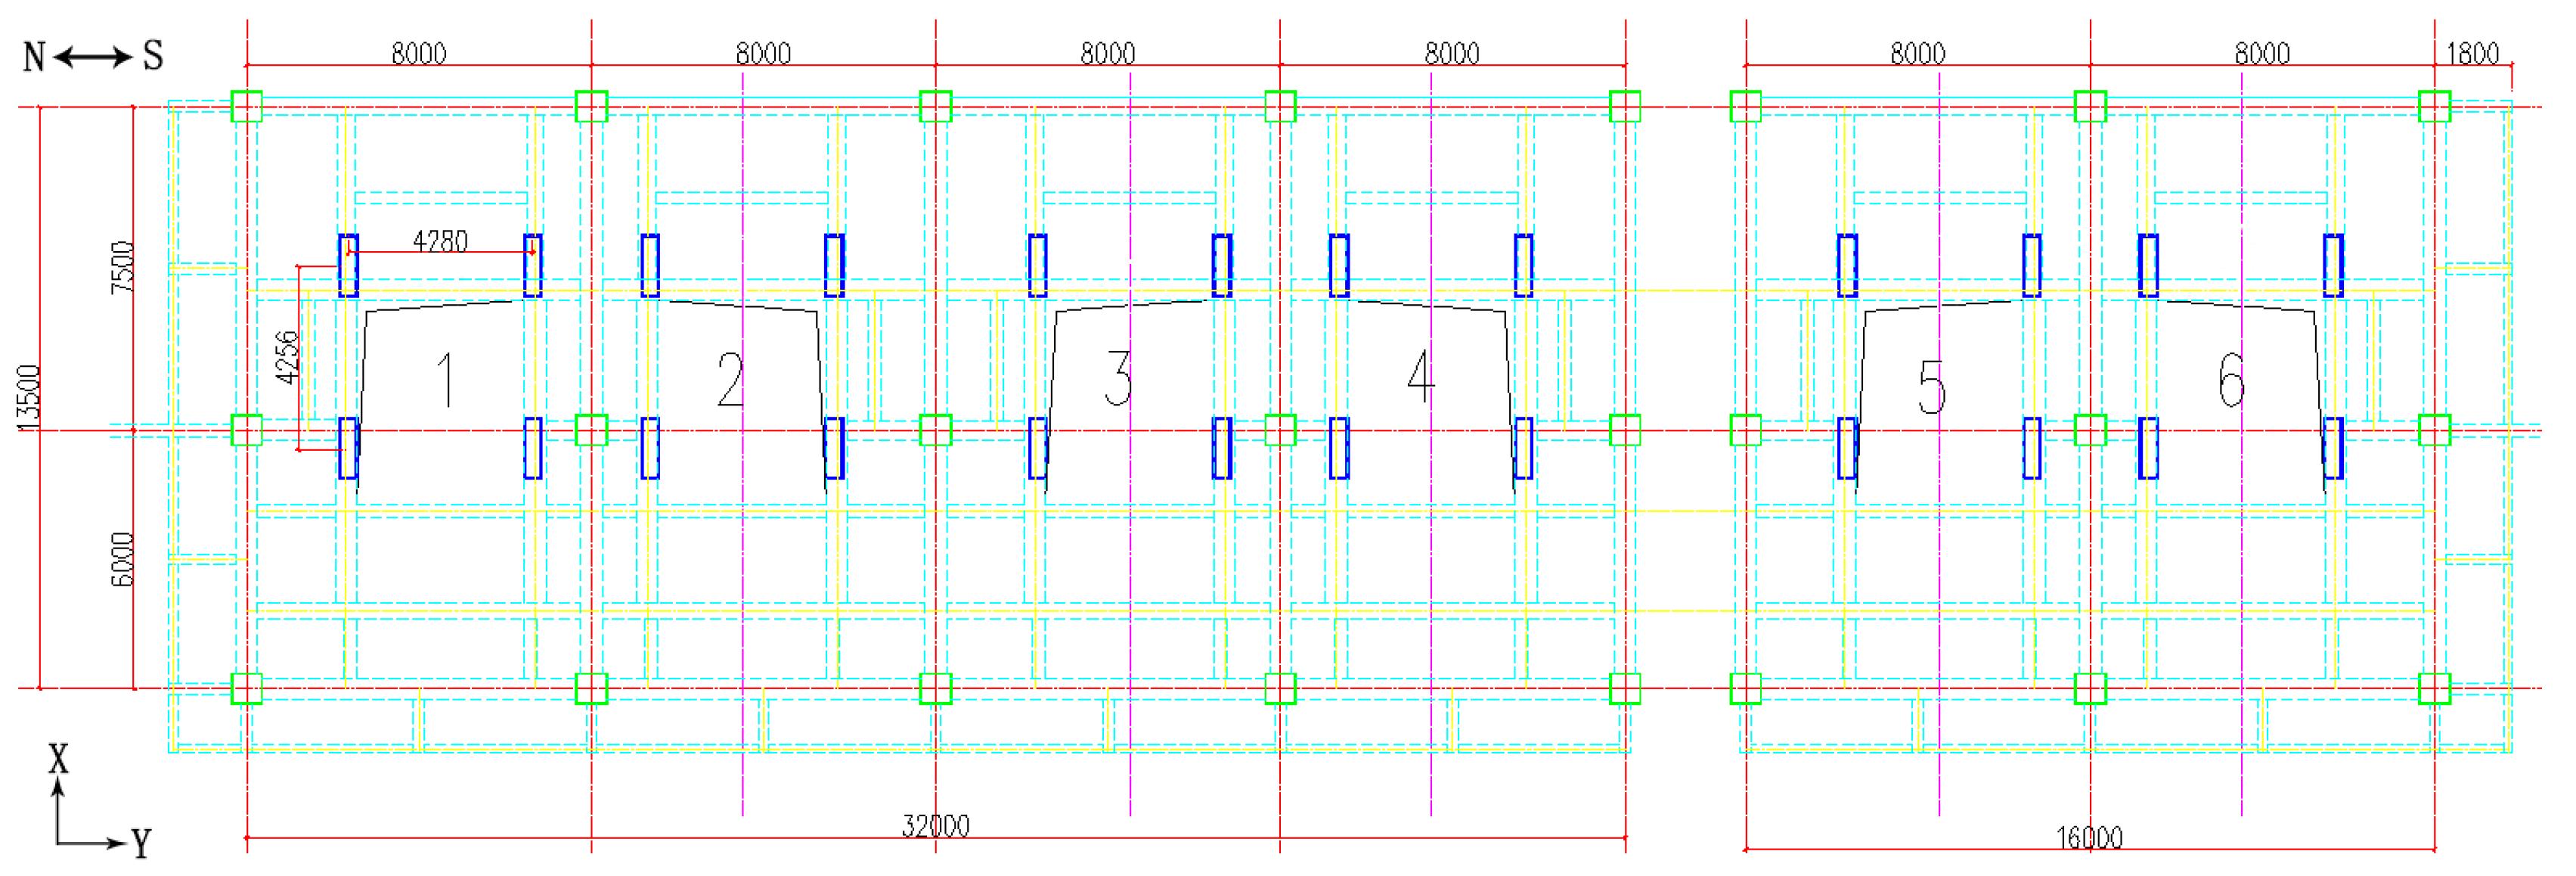
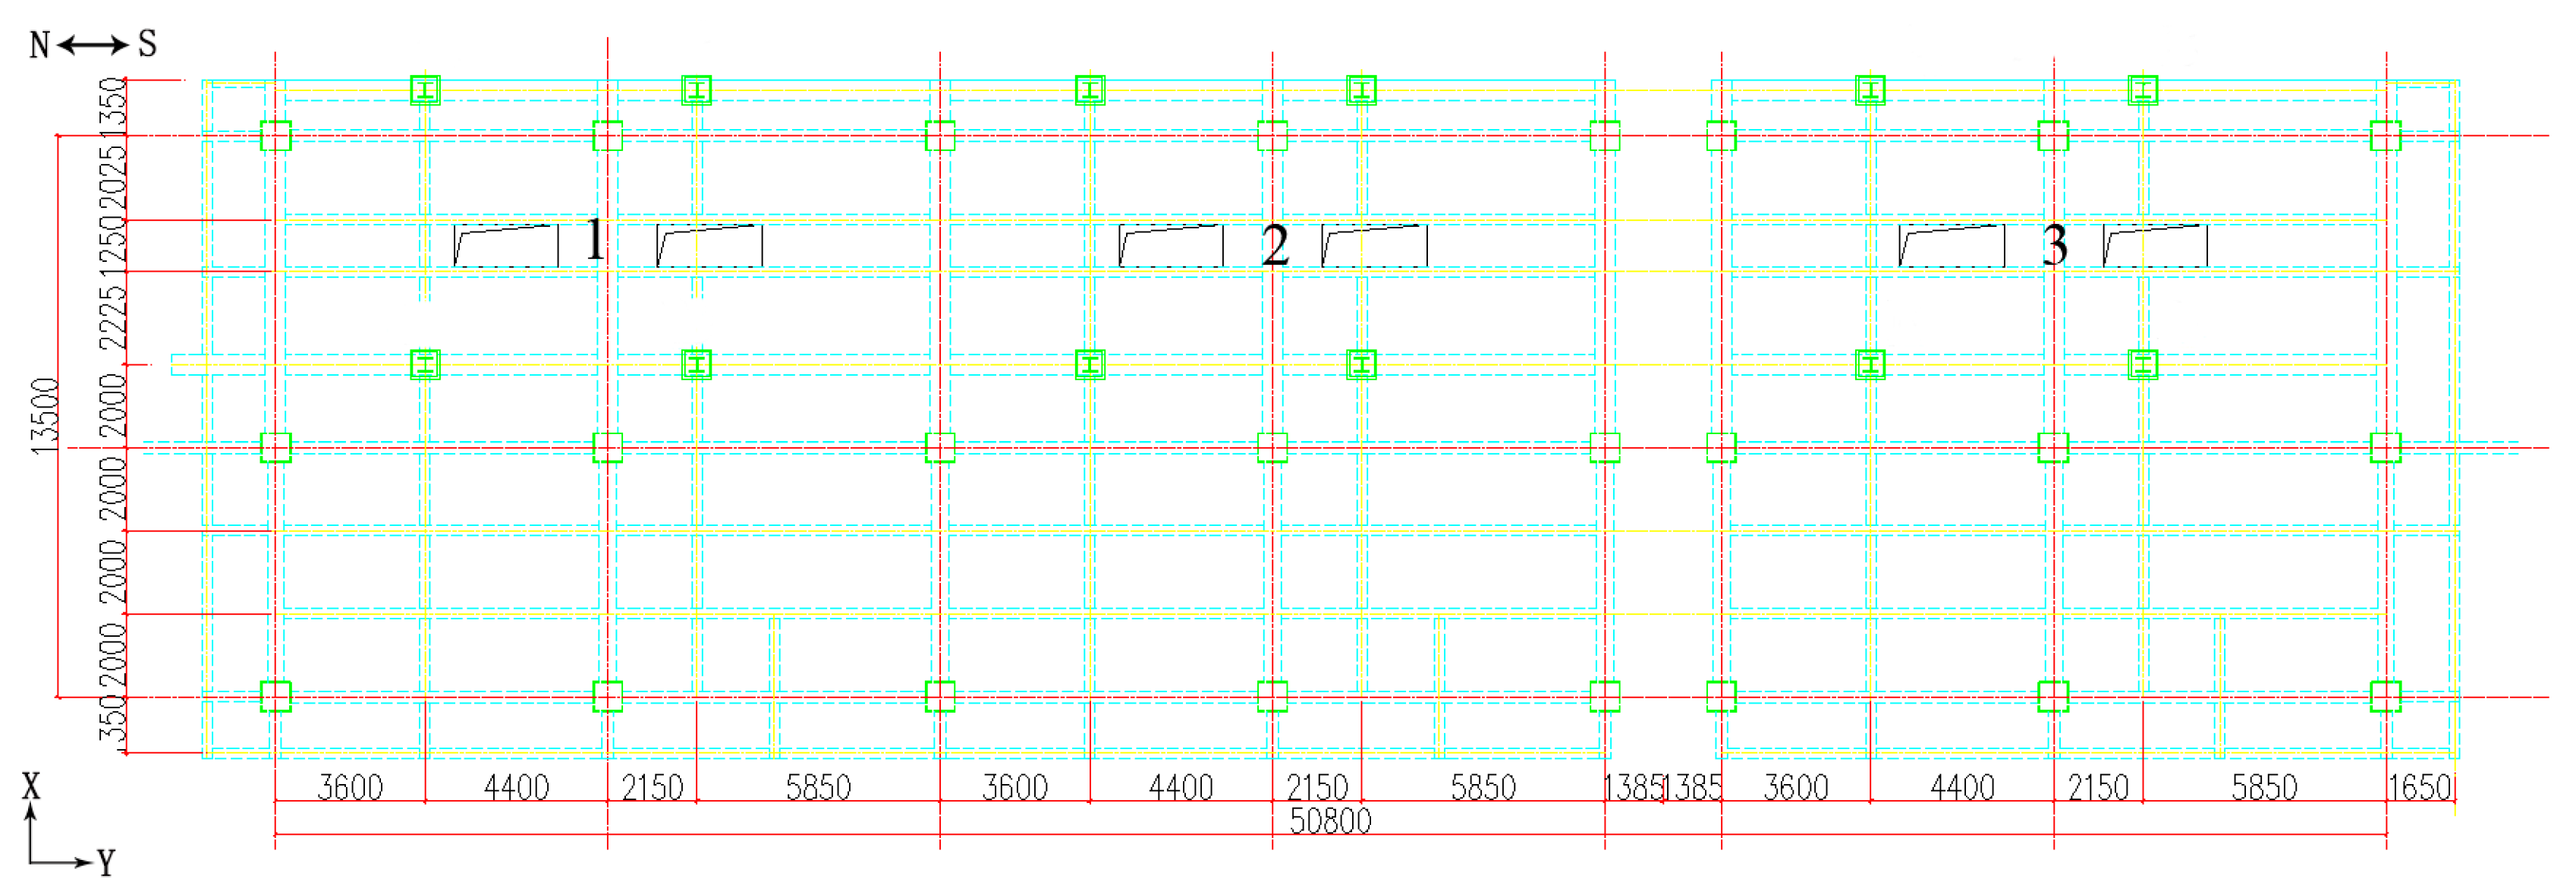
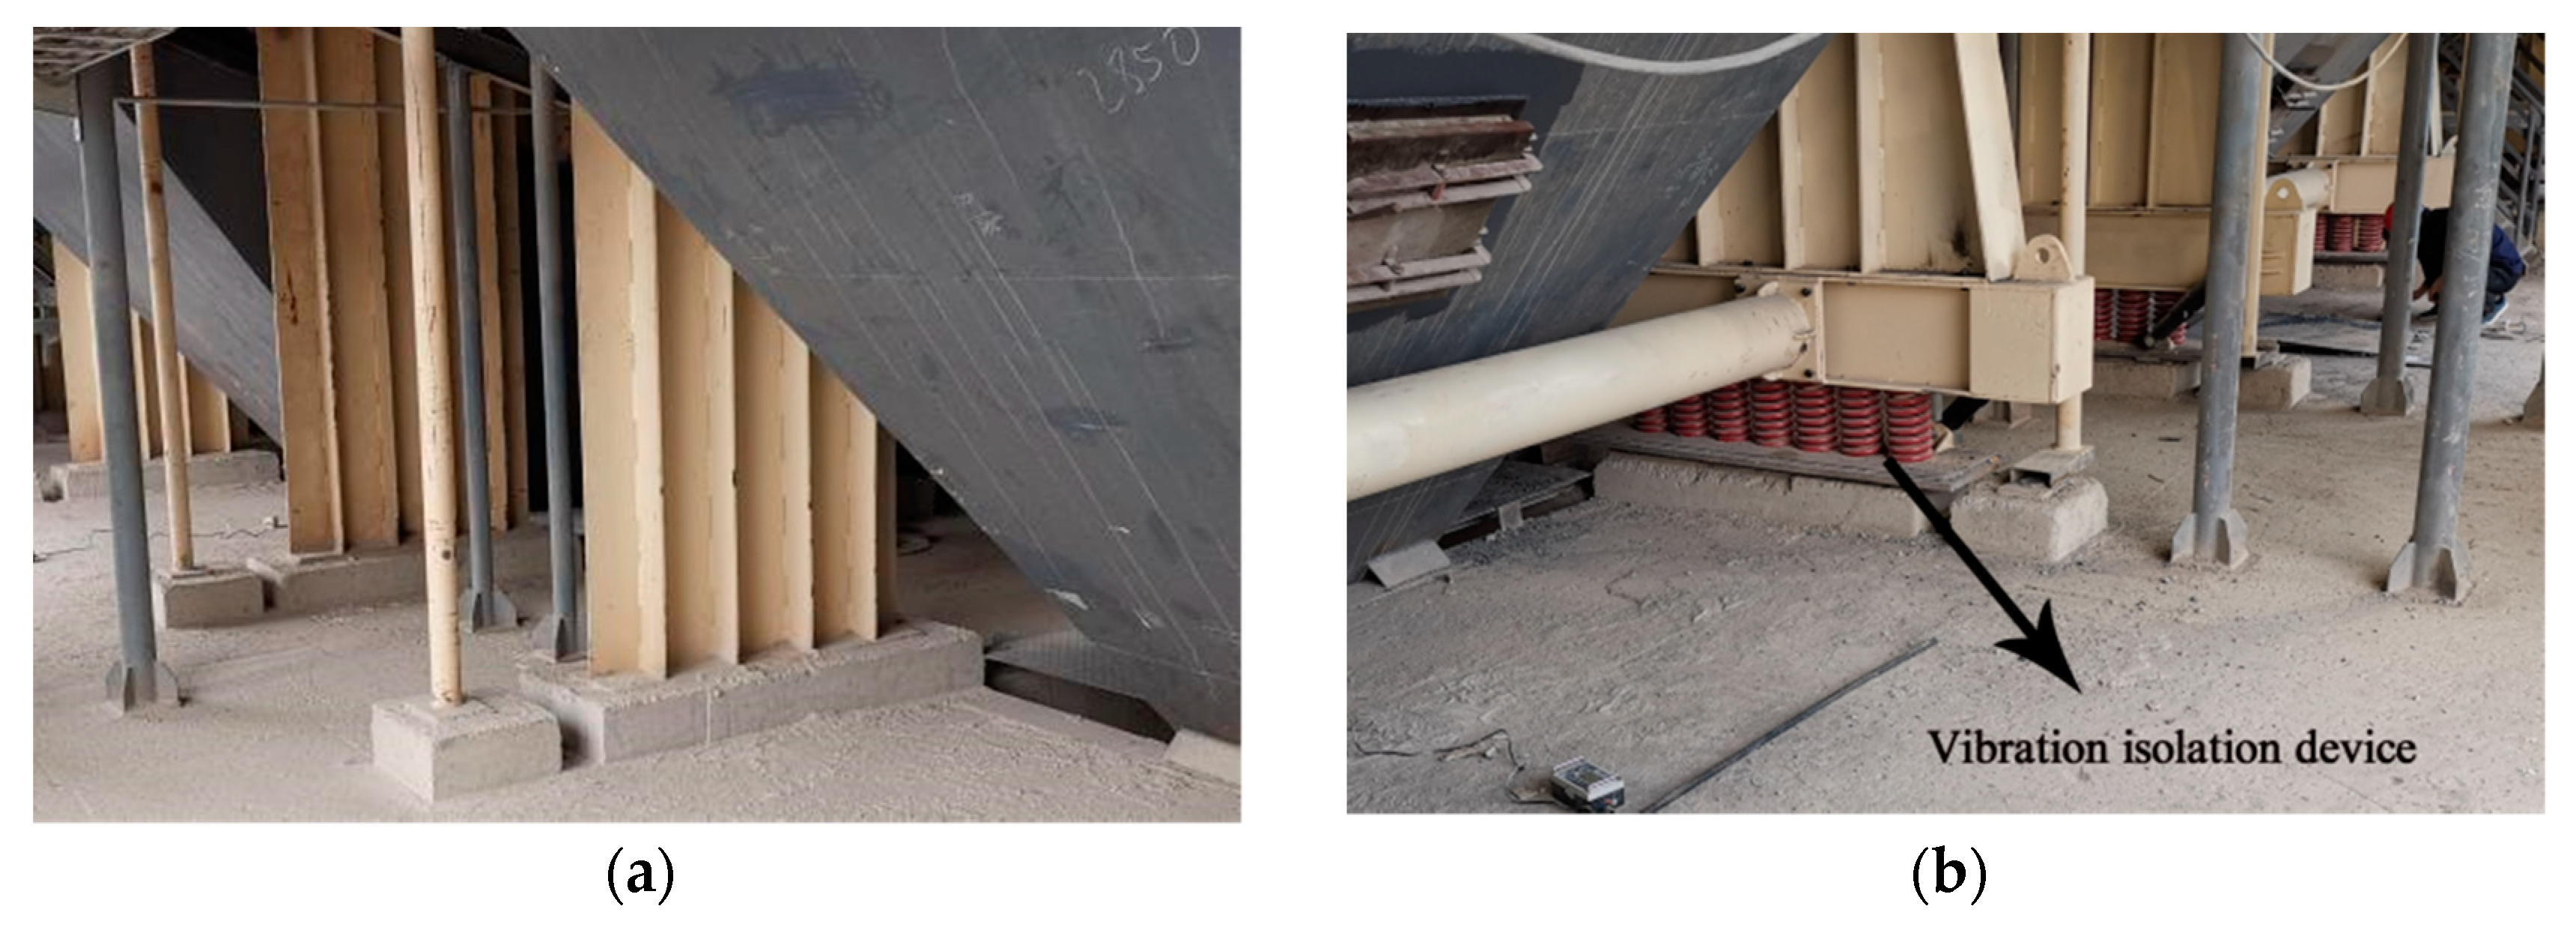
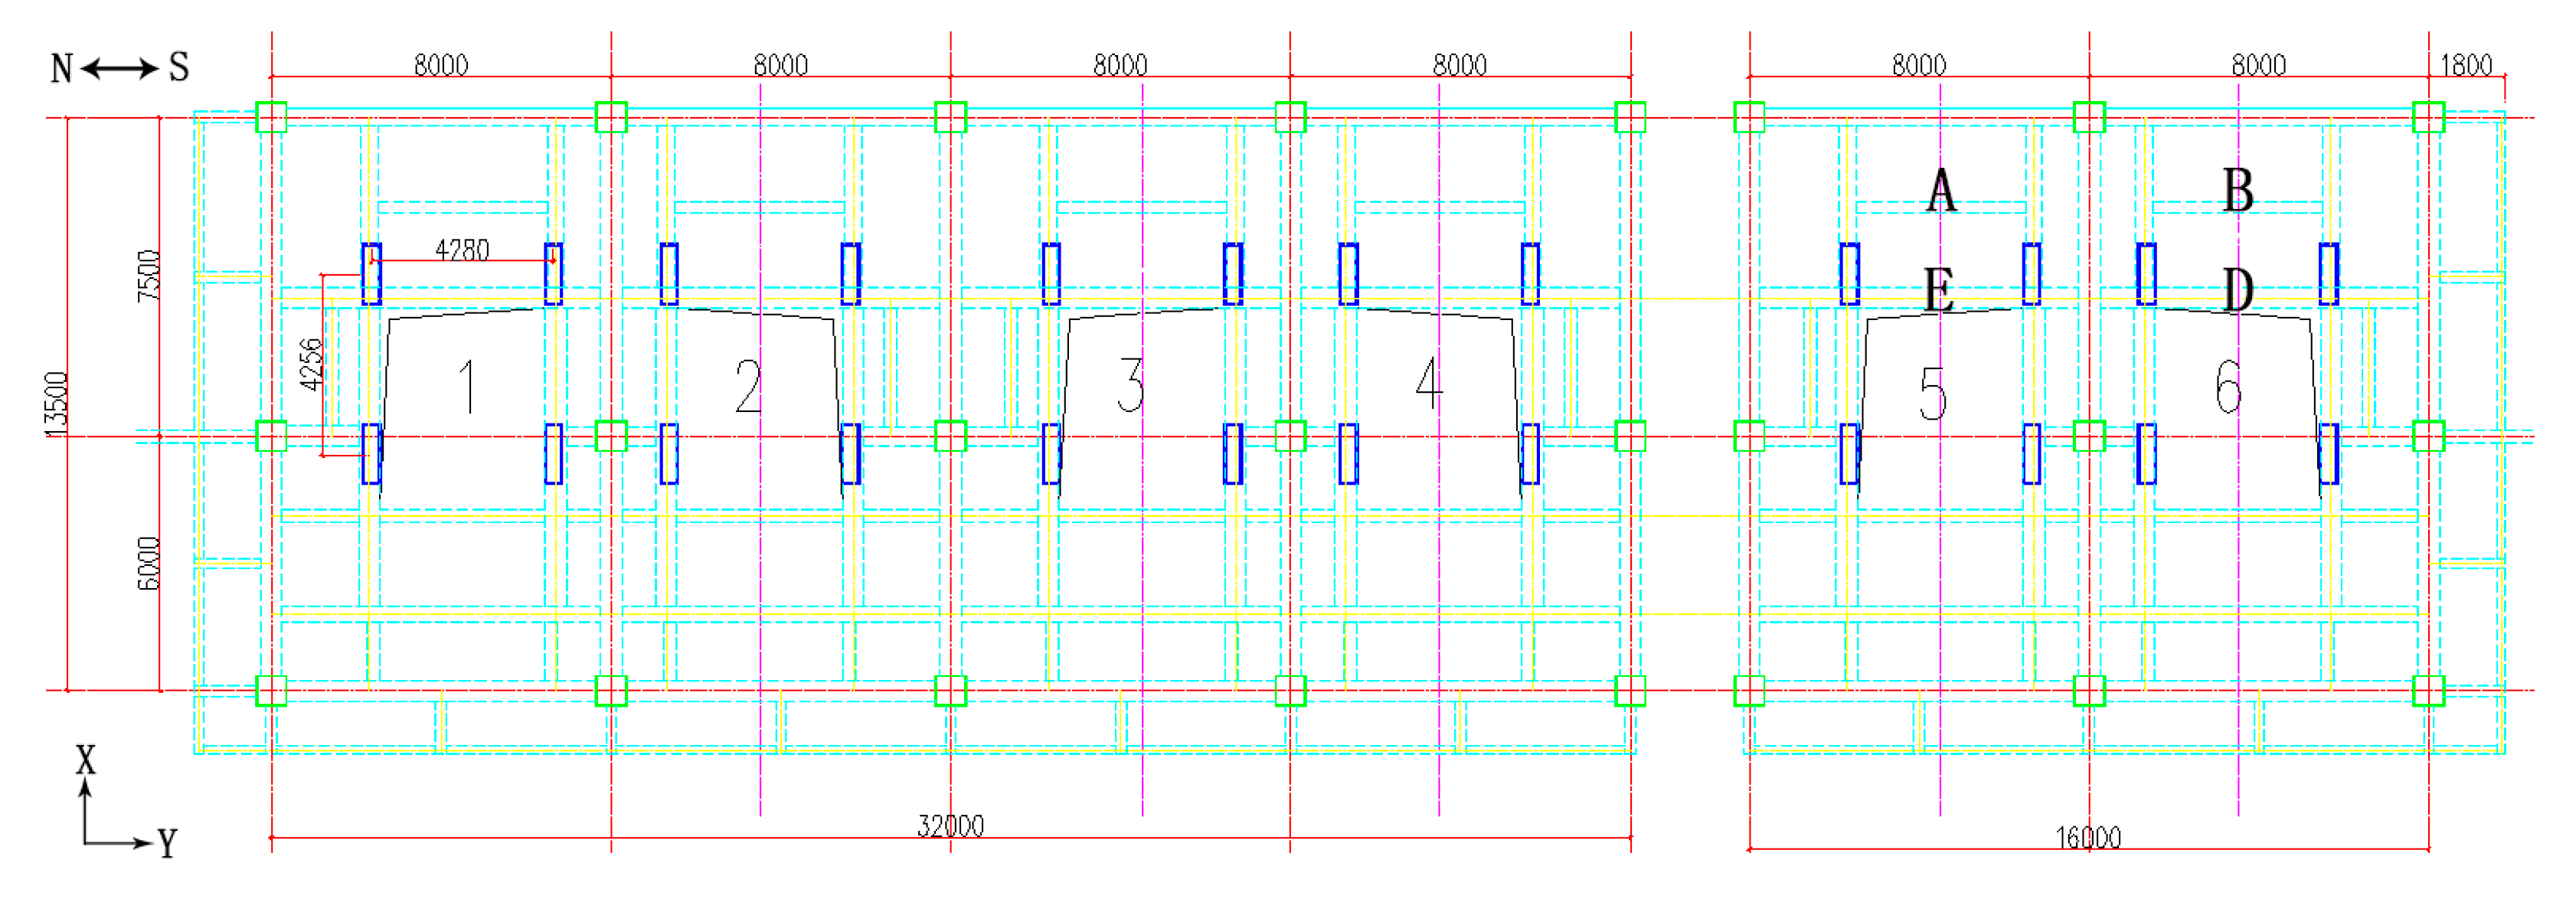
2.1. Engineering Background

The reinforced concrete frame structure of a vibrating screens factory building is shown in Figure 1. Six vibrating screens are fixed on the second floor of the structure, and the inlets are located on the third floor. The conveyor belt connects the second and third floors. The plane diagram of the second floor and the third floor is shown in Figure 2 and Figure 3, respectively. The main structure consists of the north and south parts. There are four vibrating screens in the north part and two in the south part. Six vibrating screens are arranged longitudinally in the north-south direction on the second floor of the structure. Three inlets are arranged longitudinally along the north–south direction on the third floor of the structure. The vibrating screens and the inlets are connected by the conveyor belt and fixed on the beam–plate of the second and third floors. The vibration of the second- and third-floor beam–plate structures vibrates violently when the working frequency of the vibrating screens is 14.28 Hz. The strong vibration could bring some threat to the production equipment and factory building structure. Therefore, it is necessary to find the reasons for the excessive vibration and measures to reduce the excessive vibration.

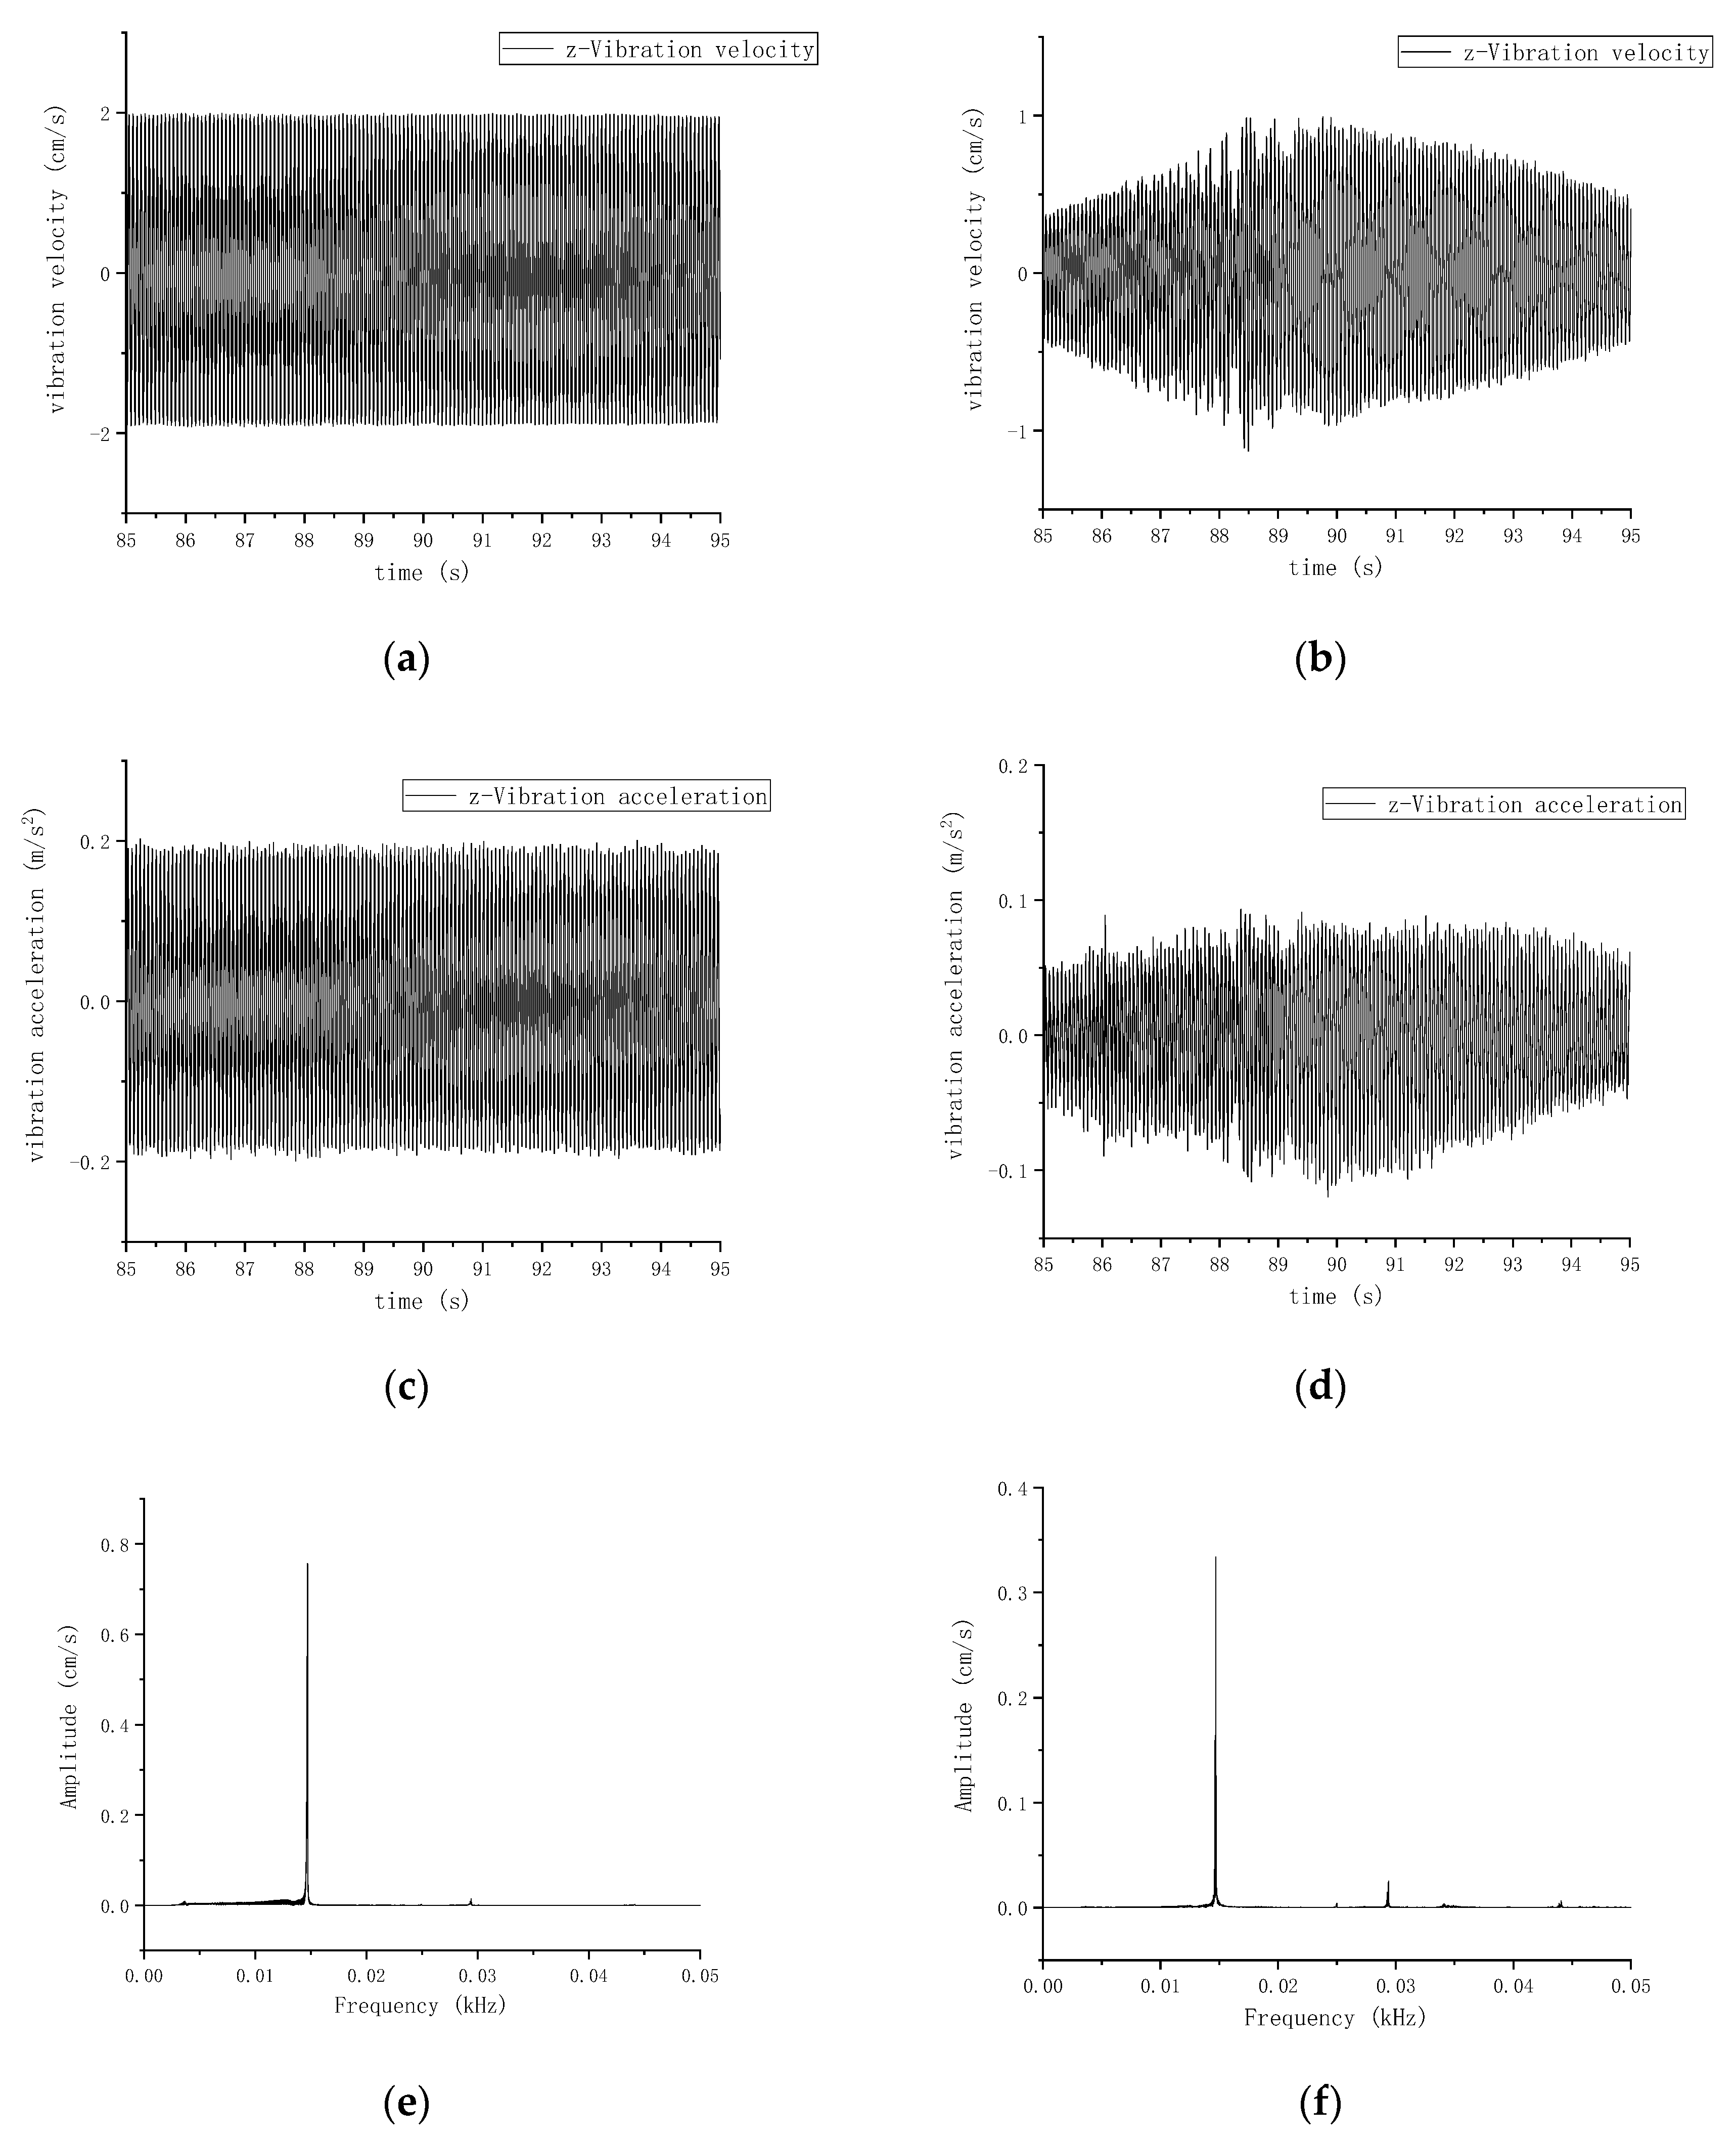
2.2. Field Vibration Monitoring

To analyze the vibration characteristics of the factory building and find out the reasons for the excessive vibration, the field tests were carried out by utilizing the vibration monitoring system. The monitoring system is composed of three-dimensional vibration sensors and a TC-4850 vibrometer [26]. The dynamic response characteristics of the key points of the south and north parts under different working conditions can be obtained. The X-direction of the sensor is set to the east–west direction of the structure, the Y-direction is set to the north–south direction and the Z-direction is vertical. The four vibrating screens in the north part are numbered as No.1 to No.4, and the two vibrating screens in the south part are numbered as No.5 and No.6. The vibration monitoring schemes are shown in Table 1 and Table 2. Through field monitoring schemes, the measured curve, frequency, vibration acceleration and other key data of three-dimensional vibration are collected and analyzed.
Through the analysis of different vibration monitoring schemes, it was found that the maximum vibration velocity of scheme 12 is 2.06 cm/s, the maximum vibration acceleration is 0.21 m/s2 in the vertical Z-direction and the frequency is 14.49 Hz, and they maintain a stable state as shown in Figure 4a,c,e. The maximum vibration velocity of scheme 6 is 1.22 cm/s, the maximum vibration acceleration is 0.13 m/s2 in the vertical Z-direction and the frequency is 14.70 Hz as shown in Figure 4b,d,f. A beating vibration phenomenon with periodic amplitude variation is observed in Figure 4, which is caused by the superposition of structural responses induced by multiple vibrating screens with similar working frequencies. According to the above results, the main frequency of each measuring point is between 13.16–15.62 Hz, the vibration acceleration of each measuring point is between 0.10–0.21 m/s2 and the vibration velocity of each measuring point is between 1.22–2.06 cm/s.
For structural safety vibration control standards, there are currently relevant standards or regulations in China and abroad. Due to differences between national standards, the engineering background belongs to China. So, according to the standards for allowable vibration in building engineering [27] and the vibration guide values for structure damage given by Japanese scholars [28], it is obvious that the peak vibration velocity of the structure caused by the vibrating screens is far greater than the allowable value, but the peak vibration acceleration values meet the requirements. Therefore, vibration reduction measures must be conducted to ensure the safety of the factory building structure.

2.3. Modal Testing

The modal tests of the south and north parts of the factory building were carried out under environmental excitation. The modal test equipment was a DH-5907N dynamic signal analyzer, with an acquisition frequency set to 50 Hz. The dynamic signal analysis was carried out by DHDAS software. The frequency spectrum was calculated by the Op.polylscf algorithm, and the vibration characteristics of the factory building structure were obtained. The structural coordinate system of the modal test system was established in three directions: X, Y and Z, in which X+ represents the north, Y+ represents the east and Z+ represents the vertical direction.
A total of 24 measuring points was selected in the north part and 16 measuring points in the south part, which is mainly located at the middle span of the main beam of the factory building structure. The No.1 measuring point was used as the reference point. The test was carried out in batches, and the test details are shown in Table 3. DHDAS modal analysis software was used to establish the simplified model, and the arrangement of the measuring points is shown in Figure 5.
The velocity signals of measuring points were imported into the model established by DHDAS. The peak frequency spectrum was extracted to calculate the vibration mode to obtain the damping ratio and frequency of each mode. The modal parameters are shown in Table 4 and Table 5. In the Z-direction, for example, the modes of the two parts are shown in Figure 6 and Figure 7. These provided field data for the numerical simulation.

3. Numerical Simulation of Vibration Response
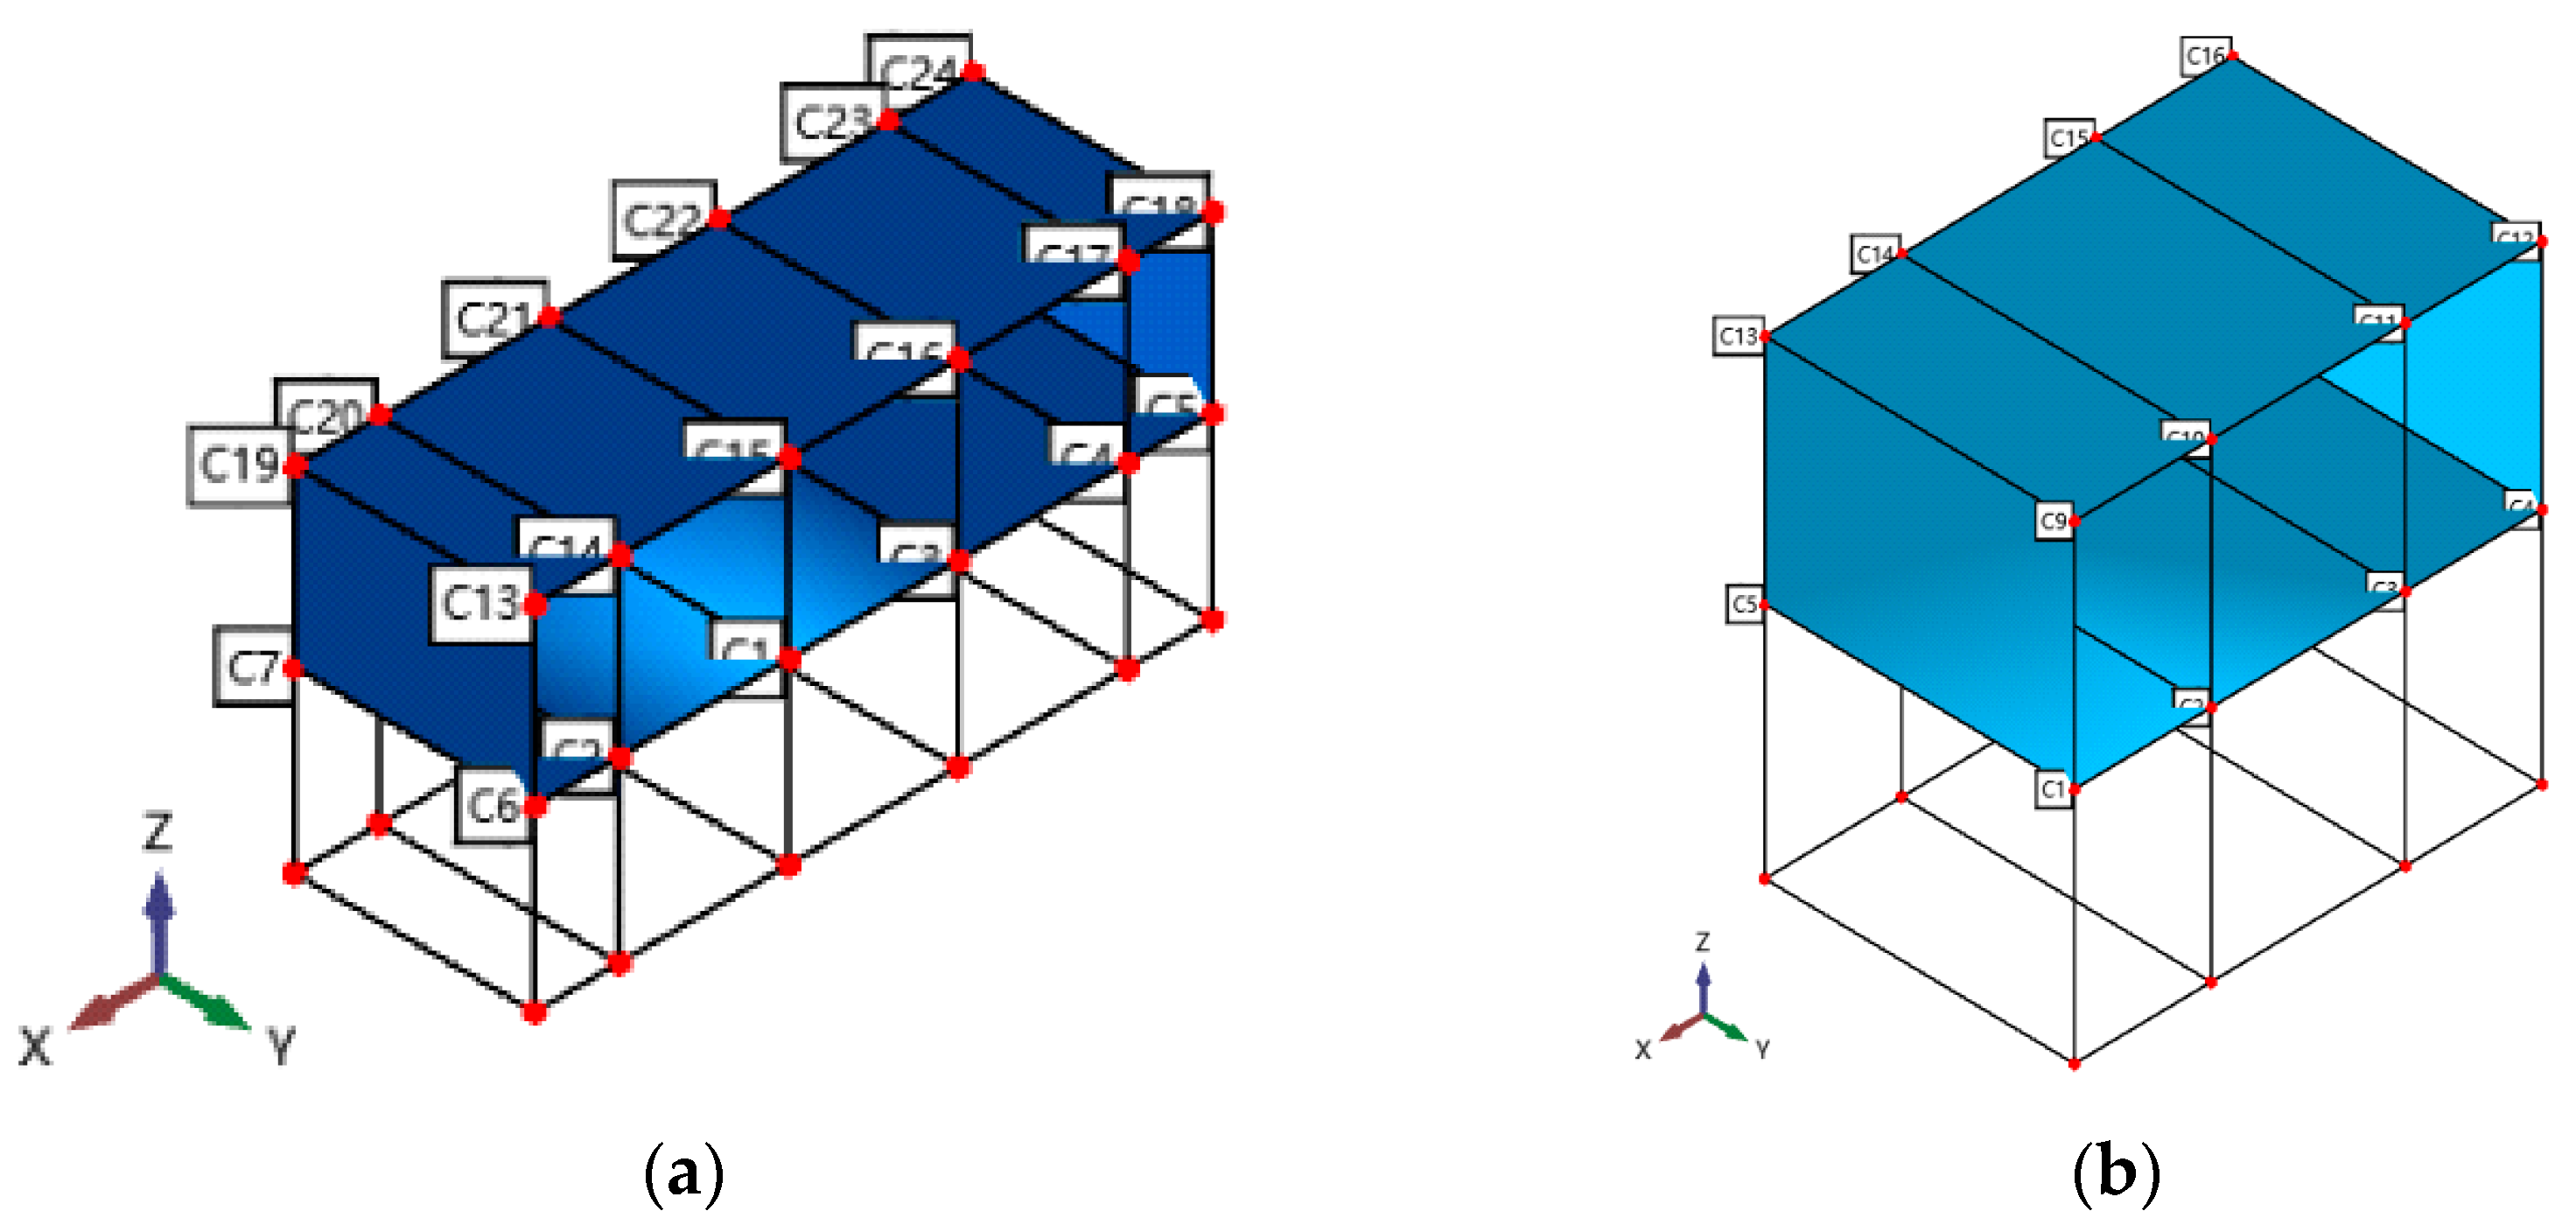
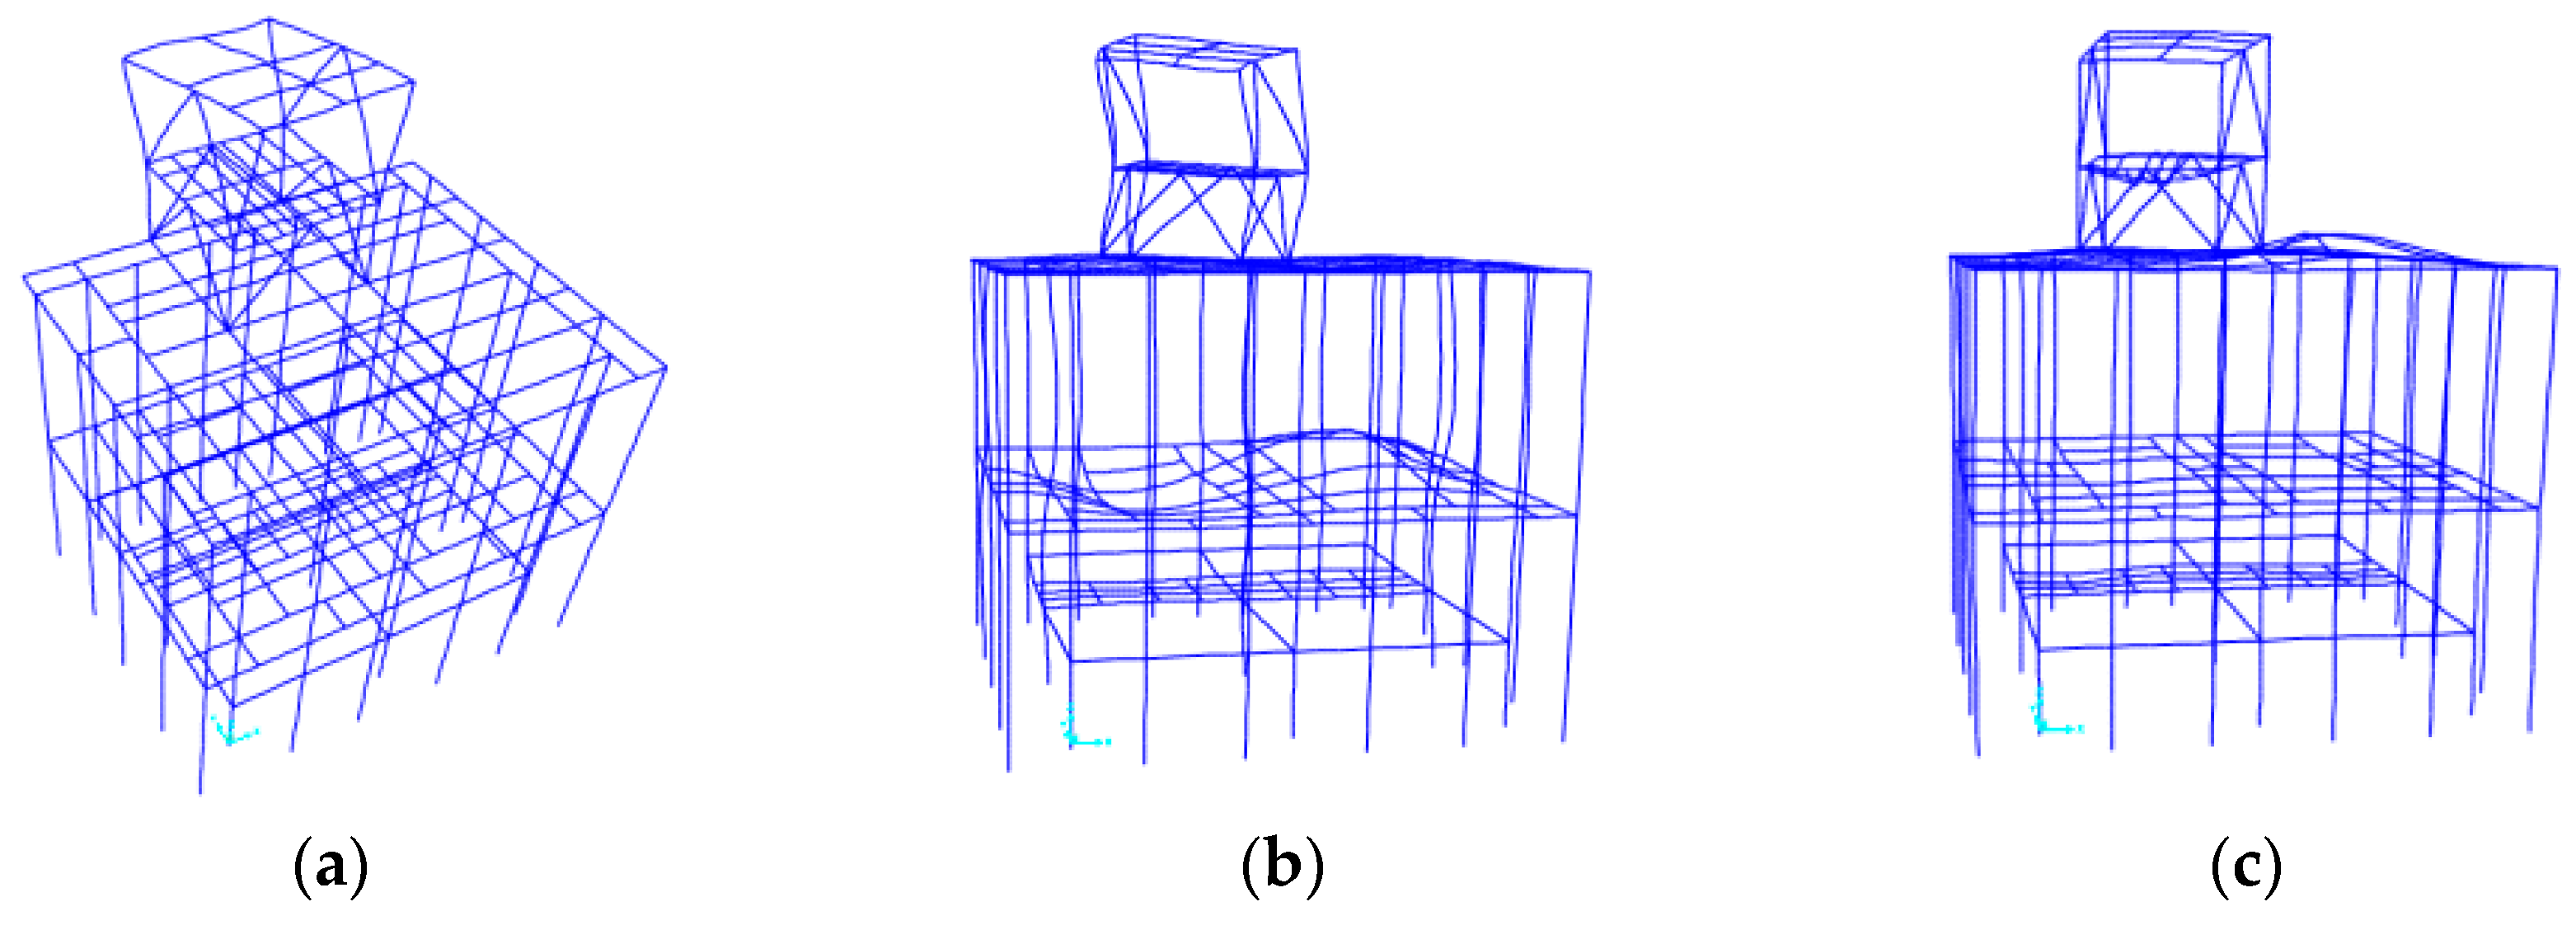
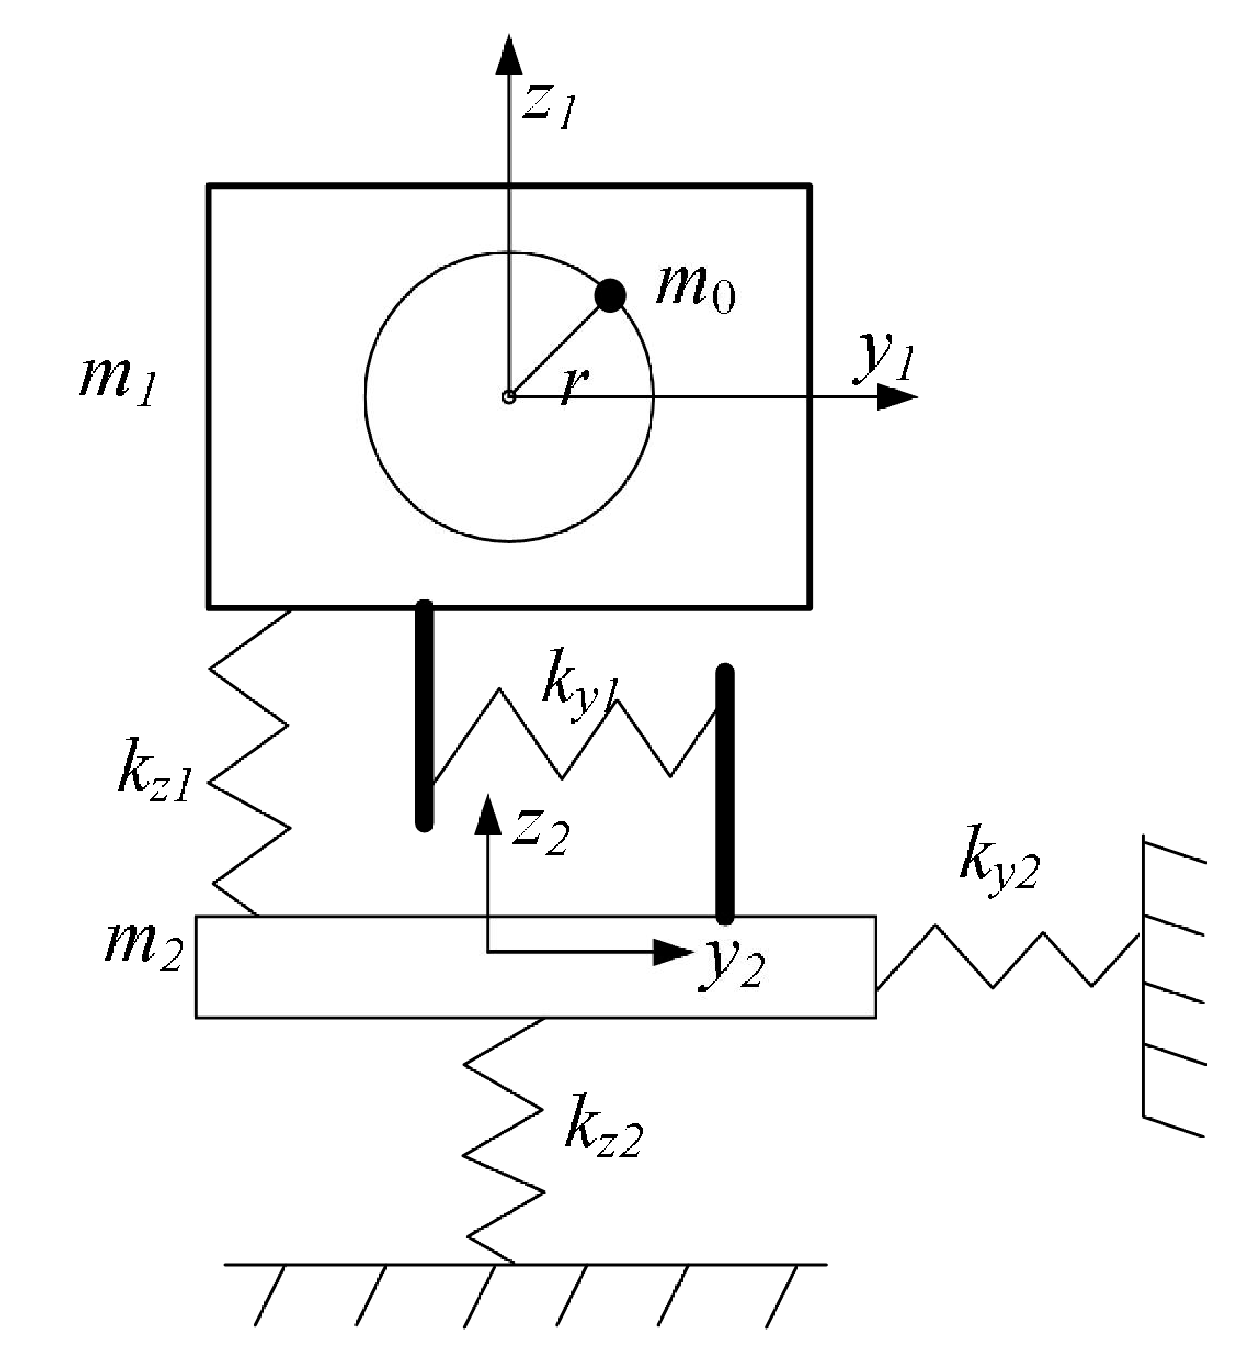
3.1. Model Building

The finite element model was established in SAP2000 software. The model was established by linear finite element elements, in which the frame beam, column and surface element are used to simulate the beam, column and floor of the structure. The column element simulates the column, and the membrane element simulates the beam–plate. The corresponding quiescent load and live load are applied on the second and third floors of the factory building structure, the computational force is applied to the model structure and the Newton iterative method is used to solve the simulation. The model is shown in Figure 8.

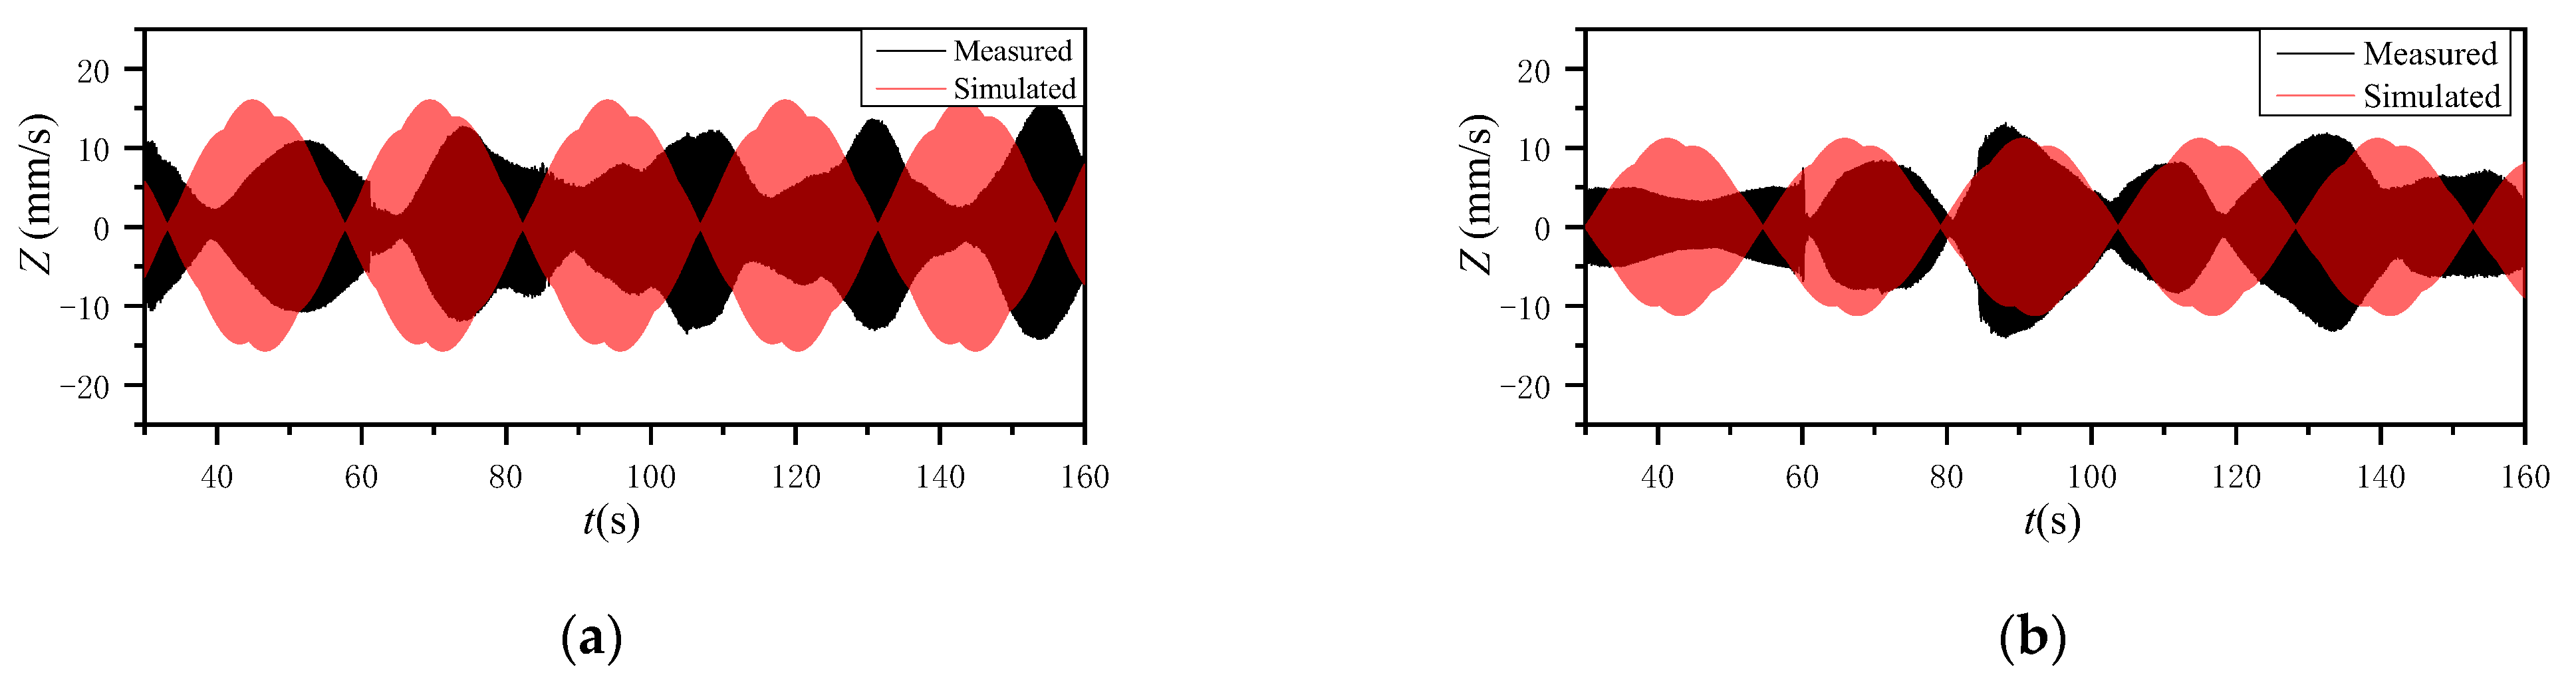
3.2. Finite Element Model Verification

The first 11 modes of the structure are calculated. The 9th, 10th and 11th modes of the two parts are shown in Figure 9 and Figure 10. The modal frequencies are compared with the field monitoring in Table 6 and Table 7. The results show that the finite element model has high calculation accuracy, which indicates that the finite model is reliable for conducting the following calculation for the structures with different vibration reduction measures.
The analysis shows that the 10th and 11th modes of the north part are mainly the local mode shapes of the second floor and third floor. The vertical modal frequencies are 12.55 Hz and 14.84 Hz, which is similar to the working frequency 14.28 Hz of the vibrating screens. Therefore, the larger vertical vibration responses of the second and third floors are mainly caused by the two order modes induced by the vibrating screens [29]. In the same way, the modal of the south part is analyzed, and the conclusion is similar to that of the north part. Therefore, the larger vertical vibration responses for the south part are also mainly caused by the structural resonance.
The vibration data of the key points of the structure in the finite element model are compared with the field test. Taking the vibration monitoring scheme 10 as an example, the comparison of the velocity response curves in the Z-direction between the measured and simulation is shown in Figure 11.
The comparative analysis shows that the finite element model is similar to the measured results in the vertical direction. In addition, the value of the vertical vibration is large and exceeds the allowable value of the national standards in China. So, the vertical vibration response of the factory building should be controlled for safety.

4. Vibration Control of the Structure

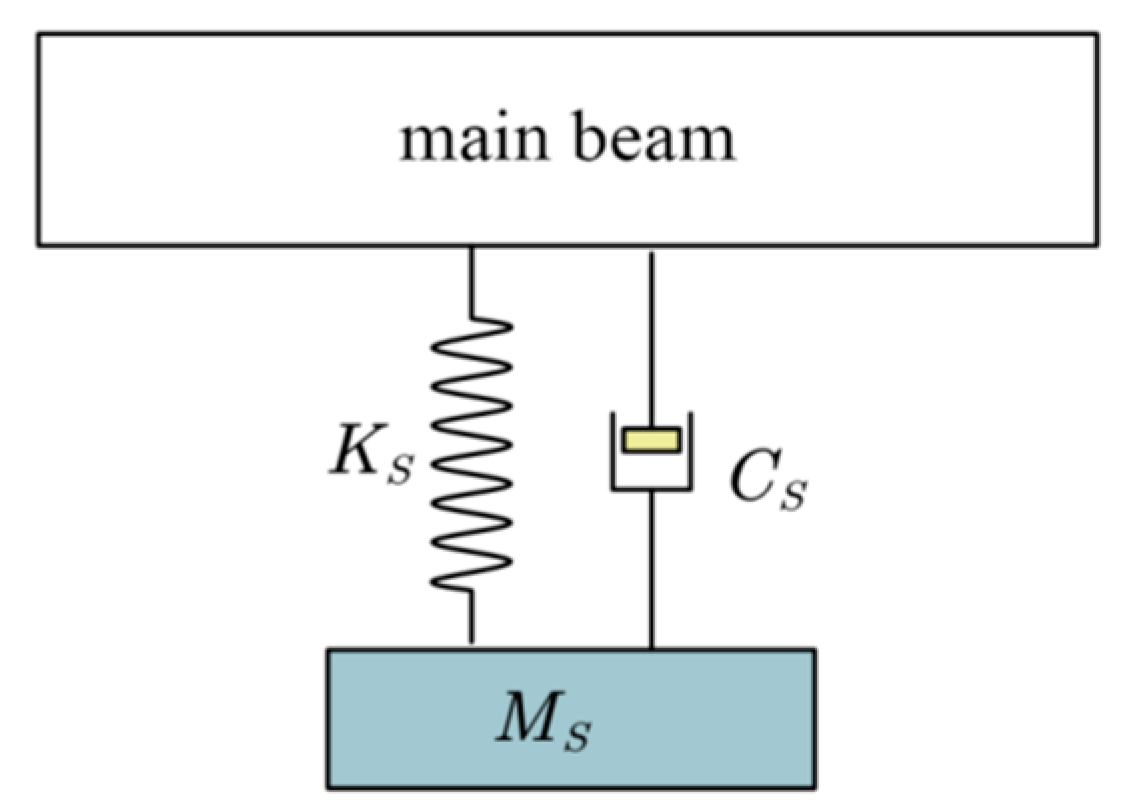
4.1. Vibration Reduction Scheme

According to the vibration monitoring and finite element simulation of the factory building, the maximum vibration velocity of the second floor is 2.06 m/s and of the third floor is 1.22 m/s. The maximum vibration acceleration on the second floor is 0.21 m/s2 and of the third floor is 0.13 m/s2. Measures must be taken to reduce the vibration of structures. So, three vibration control measures including damping, active vibration isolation of the vibrating screens and structural vibration absorption are proposed.
Damping scheme: one column is constructed below the beam of the second floor where the vibrating screens are fixed, and a damper is arranged between the supporting column and the beam. The optimized damping parameters of the damper are shown in Table 8.
Based on the established finite element model, the viscous damping element in the SAP2000 software is used to simulate the installation of the damper. According to the field vibration monitoring, excessive vibrating points of the second floor and third floor are selected as the measuring points. In addition, the velocity, acceleration and displacement in X, Y and Z directions of these points are obtained to calculate the vibration reduction rate.
Isolation scheme: A vibration isolation device is arranged between the vibrating screens and the structure beam–plate. The vibrating screens system can be simplified to the mechanical model shown in Figure 12 [30]. The dynamic balance equations of the isolation systems are expressed by Formulas (1)–(4).
m 1 z ¨ 1 + K z 1 ( z 1 z 2 ) = F 0 sin ω t
m 2 z ¨ 2 K z ( z 1 z 2 ) + K z 2 z 2 = 0
m 1 y ¨ 1 + K y 1 ( y 1 y 2 ) = F 0 cos ω t
m 2 y ¨ 2 K y ( y 1 y 2 ) + K y 2 y 2 = 0
In the formula: F 0 = m 0 r ω 2 , which is the exciting force of the vibrating screen. m 1 is the mass of the vibrating screen. m 2 is the mass of the vibration isolation frame. m 0 r is the mass moment of the eccentric block. ω is the working circle frequency of the vibrating screen. K y 1 is the horizontal stiffness of the spring for primary vibration isolation. K z 1 is the vertical stiffness of the spring for primary vibration isolation. K y 2 is the horizontal stiffness of the spring for secondary vibration isolation. K z 2 is the vertical stiffness of the spring for secondary vibration isolation.
The dynamic load is applied to the structure of the model, and the excessive vibrating points of acceleration, velocity and displacement can also be obtained by the simulation to calculate the vibration reduction rate.
Vibration absorption scheme: A vibration absorber is installed under the beams where the two supports of the vibrating screens are fixed, and the structure of the vibration absorber is shown in Figure 13. According to the principle of vibration absorption, the vertical natural frequency and the mass of the vibration absorber is 14.28 Hz and 800 kg, which is 1% of the main mass, which is 80 tons. According to the natural angular frequency, ω t = K s M s of the vibration absorber subsystem, the spring stiffness K s of the vibration absorber is 1600   k N / m and the damping coefficient can be obtained by the formula C s = 2 M s K s . Then, the vibration reduction rate can be calculated by SAP2000.
The three schemes of vibration absorber installation are listed in Table 9.
The vibration response reduction rates of the three schemes are compared. The results show that all the three schemes can be used to reduce vibration, and scheme three is the best.
After the implementation of the three vibration reduction schemes, the amplitudes of the structure key points are obtained. The vibration reduction rate is listed in Table 10.
The vibration reduction effect, construction cost and period of these three schemes are shown in Table 11. After comparative analysis, the active vibration isolation of the vibrating screens scheme is selected.

4.2. Analysis of Vibration Reduction Effect

After the vibration isolation technology is applied to the factory building structure, the field arrangement is shown in Figure 14. The three-direction vibration velocity of the key points of the structure is monitored. Taking monitoring scheme seven of the south part as an example, the arrangement of measuring points is shown in Figure 15, and the curves of vibration velocity before and after vibration reduction are shown in Figure 16.
It can be seen from Figure 16 that the maximum vibration velocity of the beam–plate on the second floor is 0.398 cm/s, which is 75% lower than the previous 1.58 cm/s. The vibration velocity of the other monitoring schemes can be similarly analyzed. The maximum vibration velocity of the beam–plate on the third floor is 0.359 cm/s in Z-direction under a no-load state, and the vibration reduction rate is 70–80%. The maximum vibration velocity of the beam–plate on the second floor is 0.470 cm/s in Z-direction under a heavy-load state, and the vibration reduction rate is 70–80%. The maximum vibration velocity of the beam–plate on the third floor is 0.609 cm/s in Z-direction under a heavy-load state, and the vibration reduction rate is 50–60%.

5. Discussion

According to different national standards, the effect of a vibrating screen’s vibration on the structure is evaluated, which is beneficial to the analysis and research of the same problem in different areas.
According to the building vibration control standard recommended by the international standard (ISO) [31], buildings with a peak vibration velocity (PPV) greater than 10 mm/s may be damaged. The German standard DIN 4150-3-1999 [32] is divided into three categories according to the sensitivity of buildings to vibration, and the vibration screening plant we studied belongs to the first category. The maximum vibration velocity on the building foundation is 5–15 mm/s (10–500 Hz), and the velocity limit of the top floor should not exceed 5 mm/s under continuous vibration. The British standard BS 7385-2 [33] has provisions in vibration velocity limits. In industrial buildings with reinforced concrete frame structures, the PPV = 50 mm/s at frequencies greater than or equal to 4 Hz. However, in the case of continuous vibration, structural resonance may occur, so the above value should be reduced by 50%, and the frequency of 4 Hz–15 Hz is PPV 25 mm/s.
British standard BS 5228-4 [34] has more stringent provisions, as the vibration damages the building structure and may cause damage to the appearance of buildings. The PPV = 10 mm/s for intermittent vibration and PPV = 5 mm/s for continuous vibration. The Swiss standard SN640-312-1992 [35] divides the building structure into four categories. When the reinforced concrete structure is subjected to the load generated by the mechanical vibration source, the frequency is 10–30 Hz, and the vibration velocity limit Vmax = 12 mm/s. The allowable vibration limit of buildings concluded by Japanese scholars [28] points out that the building was slightly damaged when the vibration velocity was greater than 10 mm/s, and the structure started to become damaged when the vibration acceleration was greater than 0.102 g (1.0 m/s2). According to China’s [27] GB 50868-2013 standard for acceptable vibration of building engineering and the vibration screen for the metallurgical industry, the peak allowable horizontal and vertical vibration velocity of the vibrating screen should be 10 mm/s.
Through the field vibration monitoring, it can be determined that the excessive vertical vibration velocity of the factory building structure is 2.06 cm/s, the maximum vibration acceleration is 0.21 m/s2 and the frequency is 14.49 Hz, which is larger than the allowable value of the national building vibration standard in China. So, vibration reduction technical measures must be taken to ensure the safety of the building.

6. Conclusions

Through the comparative analysis of the simulation and modal tests, the strong vibration of the factory building structure is caused by the structural resonance, which is excited by the vibrating screens, and the simulation model is verified to be reasonable.
Three schemes including damping, vibration isolation and vibration absorption are proposed. The vibration reduction rate of the vibration isolation scheme is more than 80%, the cost is moderate, and the construction period is relatively short.
A vibration isolation device is arranged between the vibrating screens and the structure beam–plate. The vibration velocity of the factory building structure is monitored when the vibration isolation scheme is implemented. The vibration reduction rate on the second floor is 70–80%, and on the third floor it is 50–60%. All the vibration velocities of the measuring points are less than the national building vibration tolerance standard in China.

7. Patents

This section is not mandatory but may be added if there are patents resulting from the work reported in this manuscript.

Author Contributions

Conceptualization, J.Y. and Z.L.; methodology, Z.Z.; validation, W.Z.; formal analysis, Z.L.; investigation, Z.N. and J.C.; writing—original draft preparation, J.Y. and Z.L.; writing—review and editing, Z.Z. and W.Z.; visualization, Z.L. and Z.Z.; supervision, J.Y.; project administration, Z.N. and J.C.; funding acquisition, Z.Z. All authors have read and agreed to the published version of the manuscript.

Funding

This research was funded by the National Natural Science Foundation of China, grant number 42107200 and the Key Science and Technology Program of Henan Province, grant number 202102310252.

Institutional Review Board Statement

Not applicable.

Informed Consent Statement

Not applicable.

Data Availability Statement

The data used to support the findings of this study are included within the article.

Acknowledgments

The authors would like to thank the workers in the factory who helped us during the monitoring process and Jiangsu Donghua Testing Technology Co., Ltd., they provided the devices and technicians for the modal test. The authors would also like to thank the researchers of past studies in the field for their excellent work and their help in providing references for this paper. Finally, we wish to thank the reviewers for critically reviewing the manuscript.

Conflicts of Interest

The authors declare that there is no conflict of interest regarding the publication of this paper.

References

  1. Ren, W. Research on diagnosis system for abnormal vibration of mine vibrating screen. Mech. Manag. Dev. 2021, 36, 167–169. [Google Scholar]
  2. Li, J.W.; Gu, Z.F.; Zhu, H.F.; Yu, J.X. Study on intense vibration of local structures of Zhanghewan pumped-storage powerhouse. IOP Conf. Ser. Earth Environ. Sci. 2019, 240, 8. [Google Scholar] [CrossRef]
  3. Fujino, Y.; Siringoringo, D.M.; Ikeda, Y.; Nagayama, T.; Mizutani, T. Research and Implementations of Structural Monitoring for Bridges and Buildings in Japan—A Review. Engineering 2019, 5, 1093–1119. [Google Scholar] [CrossRef]
  4. Wyjadlowski, M. Methodology of dynamic monitoring of structures in the vicinity of hydrotechnical works—Selected case studies. Studia Geotech. Mech. 2017, 39, 121–129. [Google Scholar] [CrossRef] [Green Version]
  5. Clemente, P.; Bongiovanni, G.; Buffarini, G.; Saitta, F. Structural health status assessment of a cable-stayed bridge by means of experimental vibration analysis. J. Civ. Struct. Health Monit. 2019, 9, 655–669. [Google Scholar] [CrossRef]
  6. Ponzo, C.F.; Di Cesare, A.; Telesca, A.; Pavese, A.; Furinghetti, M. Advanced Modelling and Risk Analysis of RC Buildings with Sliding Isolation Systems Designed by the Italian Seismic Code. Appl. Sci. 2021, 11, 1938. [Google Scholar] [CrossRef]
  7. Bergamo, E.; Fasan, M.; Bedon, C. Efficiency of Coupled Experimental–Numerical Predictive Analyses for Inter-Story Floors Under Non-Isolated Machine-Induced Vibrations. Actuators 2020, 9, 87. [Google Scholar] [CrossRef]
  8. Czech, K.; Gosk, W. Impact of the operation of a Tri-Band Hydraulic Compactor on the Technical Condition of a Residential Building. Appl. Sci. 2019, 9, 336. [Google Scholar] [CrossRef] [Green Version]
  9. Golik, V.I.; Kongar-Syuryun, C.B.; Michałek, A.; Pires, P.; Rybak, A. Ground transmitted vibrations in course of innovative vinyl sheet piles driving. J. Phys. Conf. Ser. 2021, 1921, 012083. [Google Scholar] [CrossRef]
  10. Ekanayake, S.; Liyanapathirana, D.; Leo, C. Influence zone around a closed-ended pile during vibratory driving. Soil Dyn. Earthq. Eng. 2013, 53, 26–36. [Google Scholar] [CrossRef]
  11. Oliveto, G.; Decanini, L.D. Repair and retrofit of a six story reinforced concrete building damaged by The earthquake in south-east Sicily on The 13th December 1990. Soil Dyn. Earthq. Eng. 1998, 17, 57–71. [Google Scholar] [CrossRef]
  12. Durucan, C.; Dicleli, M. Analytical study on seismic retrofitting of reinforced concrete buildings using steel braces with shear link. Eng. Struct. 2010, 32, 2995–3010. [Google Scholar] [CrossRef]
  13. De la Cruz, S.T.; López-Almansa, F.; Oller, S. Numerical simulation of the seismic behavior of building structures equipped with friction energy dissipators. Comput. Struct. 2007, 85, 30–42. [Google Scholar] [CrossRef]
  14. Caetano, E.; Cunha, Á.; Magalhães, F.; Moutinho, C. Studies for controlling human-induced vibration of the Pedro e Inês footbridge, Portugal. Part 1. Assess. Dyn. Behav. 2010, 32, 1069–1081. [Google Scholar]
  15. Živanović, S.; Pavic, A.; Reynolds, P. Modal testing and FE model tuning of a lively footbridge structure. Eng. Struct. 2006, 28, 857–868. [Google Scholar] [CrossRef] [Green Version]
  16. Zhi, B.; Ma, Z. Disturbance analysis of hydropower station vertical vibration dynamic characteristics: The effect of dual disturbances. Struct. Eng. Mech. 2015, 53, 297–309. [Google Scholar] [CrossRef]
  17. Fischer, O. Wind-excited vibrations-Solution by passive dynamic vibrating screens of different types. J. Wind. Eng. Ind. Aerodyn. 2007, 95, 1028–1039. [Google Scholar] [CrossRef]
  18. Li, Y.; Duan, Y.; Xiang, Y.; Luo, W.; Zhu, J. Vibration test and crack analyses on multi-story industrial factory buildings. Vib. Impact 2010, 29, 199–206. [Google Scholar]
  19. Okumura, K. Statistical analysis of field data of railway noise and vibration collected in an urban area. Appl. Acoust. 1991, 33, 263–280. [Google Scholar] [CrossRef]
  20. Ding, Y.; Fu, H.; Wang, Z.; Wang, Y.; Xie, W. Vibration test and comfort analysis of wooden building floor structure under environmental and impact excitation. Build. Struct. 2020, 50, 100–106. [Google Scholar]
  21. Saurenman, H. In-service tests of the effectiveness of vibration control measures on the BART rail transit system. J. Sound Vib. 2006, 293, 888–900. [Google Scholar] [CrossRef]
  22. Lombact, G.; Degrand, G. The control of ground-boune vibrations from railway traffic by means of continuous floating slab. J. Sound Vib. 2006, 297, 946–961. [Google Scholar] [CrossRef]
  23. Chen, J.; Wei, S.; Xin, L. Vibration analysis and treatment of the main building structure of a workshop of a coal preparation plant. Eng. Constr. Des. 2019, 10, 1–2. [Google Scholar]
  24. Zhou, J.; Fang, X.; Liang, Z. Evaluation of long-period seismic spectrum based numerical simulation and shaking-table test of assembly structures. J. Build. Struct. 2018, 39, 88–98. [Google Scholar]
  25. Xu, J. Numerical simulation analysis of structure optimization design on different beam of vibrating screen. Coal Technol. 2017, 36, 286–288. [Google Scholar]
  26. Lin, S. New equipment for blasting safety assessment TC-4850 blasting vibration meter. Blasting 2008, 4, 33. [Google Scholar]
  27. GB50868-2013; Standard for Allowable Vibration of Building Engineering. Nation Standard of the People’s Republic of China, China Planning Press: Beijing, China, 2014.
  28. Xu, J. Structure Vibration Engineering Manual; China Architecture & Building Press: Beijing, China, 2002; p. 55. [Google Scholar]
  29. Meng, W.; Feng, Y.; Shen, J.; An, X. Vibration test and reinforcement and design of beam and plate in Matou coal preparation plant. Coal Eng. 2018, 50, 133–136. [Google Scholar]
  30. Wang, X.; Bai, J.; Hu, Y.; Wang, S.; Han, Y. Determination of damping ratio in secondary vibration isolation design of vibration machinery. Coal Min. Mach. 2014, 35, 25–27. [Google Scholar]
  31. ISO 4866:2010; Mechanical Vibration and Shock—Vibration of Fixed Structures—Guidelines for the Measurement of Vibrations and Evaluation of Their Effects on Structures. International Organization for Standardization: Geneve, Switzerland, 2010.
  32. DIN 4150-3:1999; Structural Vibration. Part 3: Effects of Vibration on Structures. DIN Deutsches Institut für Normung: Berlin, Germany, 1999.
  33. BS 7385-2:1993; Evaluation and Measurement for Vibration in Buildings—Part 2: Guide to Damage Levels from Groundborne Vibration. British Standard Institution: London, UK, 1993.
  34. BS 5228-4:1992; Code of Practice for Noise and Vibration Control Applicable to Piling Operations. British Standard Institution: London, UK, 1992.
  35. VSS-SN640-312a:1992; Effects of Vibration on Construction. Swiss Consultants for Road Construction Association: Zurich, Switzerland, 1992.
Figure 1. Factory building structure and equipment.
Buildings 12 00607 g001
Figure 2. The structural plane diagram of the second floor.
Buildings 12 00607 g002
Figure 3. The structural plane diagram of the third floor.
Buildings 12 00607 g003
Figure 4. Measured curve of vibration velocity, vibration acceleration and curve of frequency amplitude. (a,c,e) Vibration monitoring scheme 12. (b,d,f) Vibration monitoring scheme 6.
Buildings 12 00607 g004
Figure 5. Arrangement of measuring points. (a) North part. (b) South part.
Buildings 12 00607 g005
Figure 6. The Z-direction vibration mode of the south part.
Buildings 12 00607 g006
Figure 7. The Z-direction vibration mode of the north part.
Buildings 12 00607 g007
Figure 8. Finite element model of factory building structure. (a) North part. (b) South part.
Buildings 12 00607 g008
Figure 9. Mode shapes of the north part. (a) 9th. (b) 10th. (c) 11th.
Buildings 12 00607 g009
Figure 10. Mode shapes of the south part. (a) 9th. (b) 10th. (c) 11th.
Buildings 12 00607 g010
Figure 11. Comparison of velocity response curves. Longitudinal beam–plate on the west side of the third floor of multiple vibrating screens under heavy-load state. (a) Measuring point B. (b) Measuring point D.
Buildings 12 00607 g011
Figure 12. Mechanical model of vibration isolation.
Buildings 12 00607 g012
Figure 13. Structure of the vibration absorber.
Buildings 12 00607 g013
Figure 14. The field arrangement of vibration isolation. (a) Before. (b) After.
Buildings 12 00607 g014
Figure 15. Arrangement of measuring points.
Buildings 12 00607 g015
Figure 16. Monitoring curves before and after vibration reduction. (a) Measuring point A. (b) Measuring point B. (c) Measuring point D. (d) Measuring point E.
Buildings 12 00607 g016
Table 1. Vibration monitoring schemes for the north part.
NumberDetails of Monitoring
1The peripheral beam–plate of single vibrating screen under no-load state
2The peripheral beam–plate of single vibrating screen under heavy-load state
3The peripheral beam–plate of multiple vibrating screens under no-load state
4The steel frame supports on the third floor of multiple vibrating screens under no-load state
5The west-half beam on the third floor of multiple vibrating screens under no-load state
6The longitudinal beam on the third floor of multiple vibrating screens under no-load state
7The east longitudinal beam on the second floor of multiple vibrating screens under no-load state
8Vibrating screen support of multiple vibrating screens under heavy-load state
9The east longitudinal beam–plate of multiple vibrating screens under heavy-load state
10Longitudinal beam–plate on the west side of the third floor of multiple vibrating screens under heavy-load state
Table 2. Vibration monitoring schemes for the south part.
NumberDetails of Monitoring
11Vibrating screen support of single vibrating screen under no-load state
12The peripheral beam–plate of single vibrating screens under no-load state
13The peripheral beam–plate of multiple vibrating screens under no-load state
14The steel frame supports on the third floor of multiple vibrating screens under no-load state
15The west-half beam on the third floor of multiple vibrating screens under no-load state
16The north–south longitudinal beam of the third floor of multiple vibrating screens under heavy-load state
Table 3. Test information of the north and south parts.
NumberMeasuring Points (North Part)Measuring DirectionNumberMeasuring Points (South Part)Measuring Direction
1123456Z+/Y+1123456Z+/X+
2123456Z+/X+2123456Z+/Y+
317891011Z+/Y+317891011Z+/X+
417891011Z+/X+417891011Z+/Y+
5112 Z+/X+/Y+511213141516Z+/X+
611314151617Z+/Y+611213141516Z+/Y+
711314151617Z+/X+
811819202122Z+/Y+
911819202122Z+/X+
1012324 Z+/X+/Y+
Table 4. Modal parameters in Z-direction of the south part.
Modality1234567
Frequency (Hz)0.7382.6733.1799.94812.46715.74816.591
Damping ratio (%)4.9531.7040.1861.4380.7300.3790.101
Table 5. Modal parameters in Z-direction of the north part.
Modality12345678
Frequency (Hz)1.9873.7294.4495.6446.35910.94412.55314.837
Damping ratio (%)0.0561.1731.0452.5961.5021.1580.4420.424
Table 6. Frequencies comparison of field test and the simulation of the north part.
ModeMode DescriptionFrequency (Hz)Error (%)
MeasuredSimulation
1Bending in Y-direction 1.961.970.10
2Bending in X-direction1.972.001.73
3Torsion in the X-Y plane 2.642.805.99
4Second-order bending in Y-direction 4.484.38−2.12
5Second-order bending in X-direction 4.624.57−1.00
6First-order bending of steel frame in X-direction on the third floor5.645.50−2.53
7Second-order bending in X-direction of the concrete/steel frame 5.815.78−0.48
8Second-order torsion in X-Y plane of the concrete/steel frame 6.366.30−0.90
9Torsion in X-Y plane of steel frame 10.9410.51−3.97
10First-order bending beam–plate in Z-direction 12.5511.84−5.68
11Second-order bending of beam–plate in Z-direction 14.8414.940.69
Table 7. Comparison between field test result and the finite element result of modal frequencies of the south part.
ModeMode DescriptionFrequency (Hz)Error (%)
MeasuredSimulation
1Bending in Y-direction 1.991.97−1.01
2Bending in X-direction1.992.15.53
3Torsion in the X-Y plane 2.622.9713.36
4Second-order bending in Y-direction 4.854.65−4.12
5Second-order bending in X-direction 5.064.77−5.73
6First-order bending of steel frame in X-direction of the third floor5.765.75−0.17
7Second-order torsion in X-direction of the concrete-steel frame6.426.978.57
8Bending of steel frame in X-direction of the second floor7.667.40−3.39
9Torsion in the X-Y plane of steel frame9.9510.556.03
10Bending in Z-direction of beam–plate of the second floor12.4712.05−3.37
11Bending in Z-direction of beam–plate of the third floor15.7414.69−6.67
Table 8. Parameters of the damper.
DirectionsDamping Coefficient (kN/(mm/s))Velocity Index
X101
Y101
Z281
Table 9. Installation schemes of the vibration absorber.
SchemeVibrating Screens NumberStructure Location
12, 3Under the beam of the east support of the vibrating screens
21, 4
31, 2, 3, 4
Table 10. Vibration reduction rate of different schemes.
PointAcceleration Vibration Reduction Rate (%)Velocity Vibration Reduction Rate (%)Displacement Vibration Reduction Rate (%)
DampingIsolationAbsorptionDampingIsolationAbsorptionDampingIsolationAbsorption
5682.5080.9884.7583.1280.9281.2883.5580.9977.03
6064.2280.9894.4966.6080.9494.7668.7980.9994.00
9674.6280.9884.0174.3980.9880.6775.5481.0377.58
49082.7180.9592.1483.8880.9692.6484.3580.9591.85
49178.5280.9792.8278.7780.9792.5778.5380.9790.37
49282.6280.9592.1083.7980.9492.5984.2680.9591.62
Table 11. Comparison of different schemes.
SchemeCostConstruction PeriodComprehensiveVibration Reduction Rate
Vibration dampingThe purchase of dampers and the design and construction of support columnsNeed to consider the design of the support column, the construction period and the purchase period of the damperModerate cost and long construction periodMore than 70%
Vibration isolationProcurement and installation of vibration isolation framePurchase and installation cycle of vibration isolation frameModerate cost and short construction periodMore than 80%
Vibration absorptionDesign and processing of vibration absorber (needs to be customized)Vibration absorber design, custom processing and installation cycleHigh cost and long construction periodMore than 90%
Publisher’s Note: MDPI stays neutral with regard to jurisdictional claims in published maps and institutional affiliations.

