
A Study on the Spatial Association Network of CO2 Emissions from the Perspective of City Size: Evidence from the Yangtze River Delta Urban Agglomeration


Abstract
:1. Introduction
- How do CO2 emissions trend in different city sizes?
- What are the spatial associations of CO2 emissions in different city sizes?
- What are the spatial structures of CO2 emissions in different city sizes?
2. Literature Review
3. Research Target Area, Methods, and Data Sources
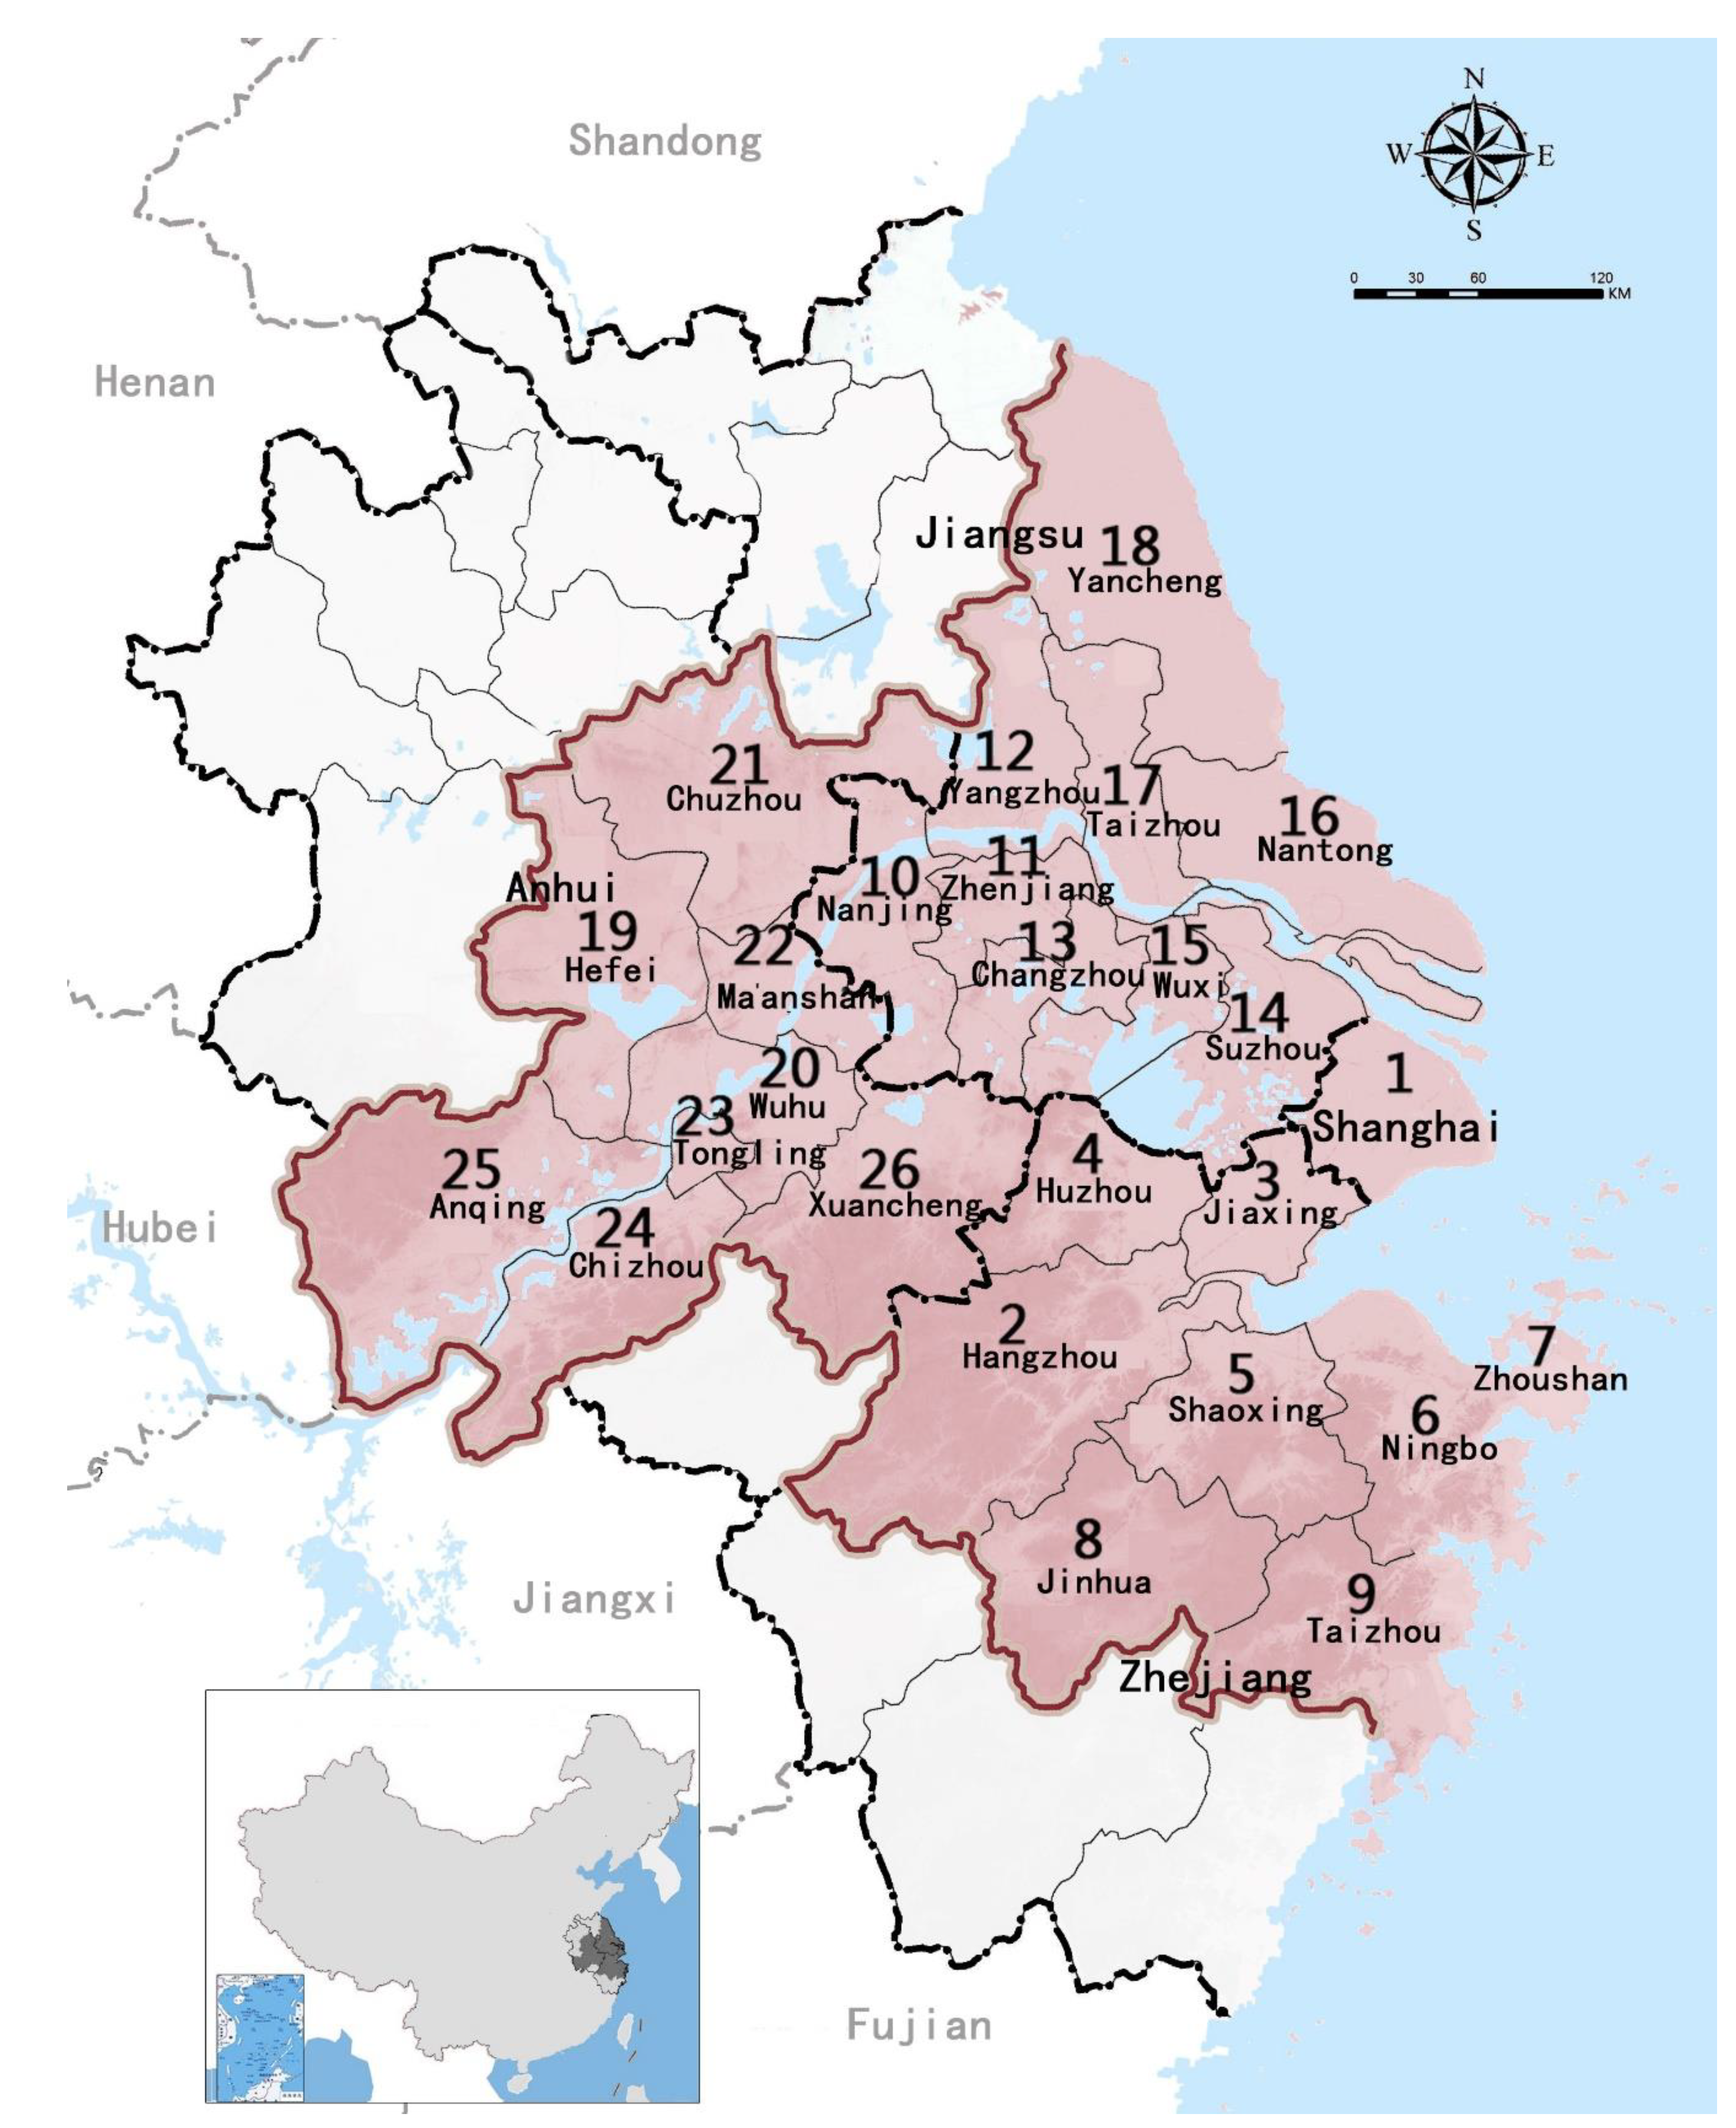
3.1. Research Target Area
3.2. Methods
3.2.1. A City-Size CO2 Emission Gravity Model
3.2.2. Spatial Association Network Characteristic Indicators
3.3. Data Sources
4. Results and Discussion
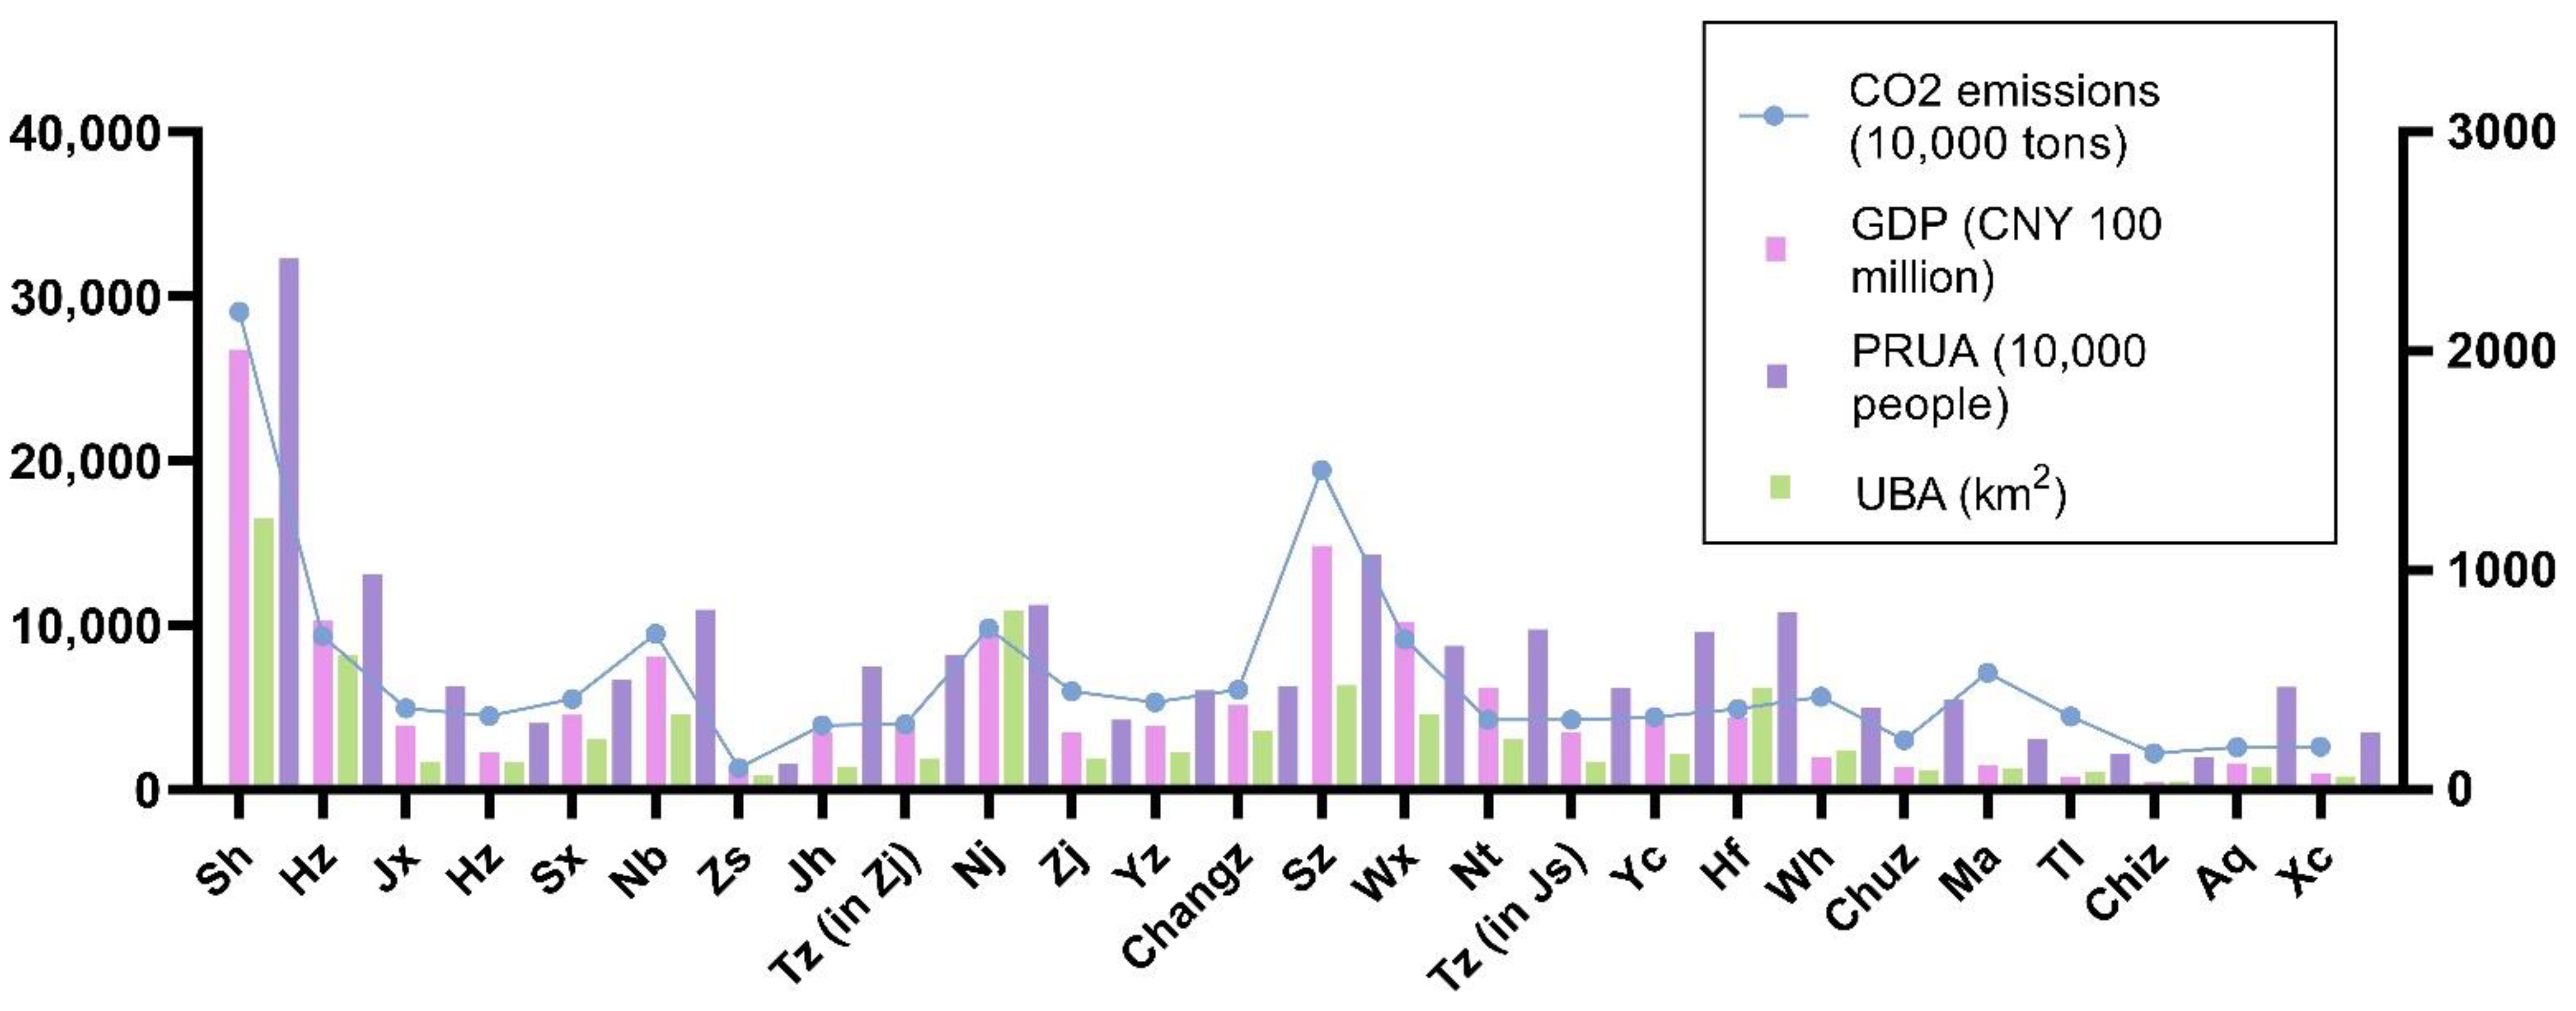
4.1. Temporal Change Tendency of CO2 Emission Intensity in Different City Sizes (2005, 2010, 2015, and 2018)
4.2. Spatial Association Networks of CO2 Emissions in Different City Sizes (2005, 2010, 2015, and 2018)
4.3. Structural Investigations of the Spatial-Association Networks
4.3.1. Whole Network Analysis
4.3.2. Spatial Clustering Analysis
4.3.3. Individual Analysis
5. Conclusions
- The CO2 emission intensity shows that there is an increasing trend of different city sizes in the time sequence. In terms of spatial distribution, the trend is high in the east and low in the west. There is a positive correlation between CO2 emissions and city-size hierarchy. The CO2 emission intensity of cities presents a normal distribution, with less at the two ends and more in the middle. Shanghai is the highest contributor to CO2 emissions in the YRDUA. In the spatial-association networks (2005, 2010, 2015, and 2018), there are ubiquitous spatial associations of CO2 emissions of the twenty-six cities in the YRDUA, and the spatial network associations have become tighter with the evolution of time.
- The whole network analysis reveals that the relational ties and the network density increased from 2005 to 2015 and experienced a slight decrease from 2015 to 2018. This provides that the various urban energy structure optimization policies implemented after 2016 effectively control CO2 emission intensity. The CO2 emissions of cities of different sizes in the YRDUA are generally associated. The networks have no isolated points and have apparent spatial-spillover effects. Meanwhile, the spillover relationship is not limited to geographically adjacent cities. The cities of different sizes in the YRDUA have no significant relationship level in CO2 emissions, and the network hierarchy is not strict. The degree of mutual influence of CO2 emissions in cities is very high. Over time, the whole network structures become more robust and complex with tighter associations.
- The spatial clustering analysis indicates that the CO2 emissions and production energy consumption of the two subgroups headed by Shanghai and Nanjing are larger than the surrounding areas. Their industrial agglomeration is apparent, and the city size is large. Other subgroups have significant spillovers on these two subgroups’ CO2 emissions. The other two subgroups in Anhui Province and some cities in Zhejiang Province have relatively simple industrial structures, rich energy reserves, and relatively slow economic development. Therefore, they have spillovers of CO2 emissions to other subgroups and have spillovers of geographical characteristics. Subgroup 4 includes all the cities in Anhui Province, proving that the eight cities in Anhui Province have the characteristics of spatial clustering.
- The individual analysis shows that Nanjing, Hangzhou, and Wuxi have more direct CO2 emission associations than other cities and are located in the center of networks. Nantong surpasses Shanghai in terms of network centrality. Only Hefei as the provincial capital and Wuhu as a subcenter city have strong network centrality in Anhui Province, and the remaining six cities are all at the fringes of networks. Shanghai, Hangzhou, Zhoushan, Jinhua, Nantong, and Hefei have become more central over time. On the contrary, Huzhou, Nanjing, Yancheng, etc., have a downward trend in degree centrality. Yangzhou, Suzhou, Wuxi, Tongling, and Xuancheng experienced a significant decrease in degree centrality compared with 2015. Therefore, energy-conservation and emission-reduction policies have a specific inhibitory effect on the network node centers. Nanjing plays the paramount “bridge” role in the networks. Hangzhou, Wuxi, Nantong, Shanghai, and Changzhou have good synergy functions. By focusing on these cities and controlling CO2 emissions, blocking the exchange of CO2 emissions in other cities can be achieved. It has formed a network form, with Nanjing and Hangzhou as the primary regional nodes and Wuxi as the auxiliary center node. Moreover, Shanghai, Changzhou, Suzhou, Nantong, and Hefei are node cities in each coverage area. Nanjing has the highest closeness centrality, indicating that Nanjing’s status as a central city in the networks is unshakable. Hangzhou, Wuxi, Shanghai, Changzhou, Suzhou, Nantong, and Hefei are high regional node centers. These cities will be the critical areas for carbon reduction in the future.
- The CO2 emissions of different city sizes should be studied from more perspectives of urban agglomerations. This paper focused on the impact indicators of different city sizes and introduced the spatial indicator. The impact of more city-size indicators on CO2 emissions will be explored in the future. It is necessary to comprehensively assess the CO2 emission spatial structure at the urban aspect and explore the impact of more city-size indicators on CO2 emissions. The QAP regression analysis in social network analysis can also be considered.
- A city is a complex system. The spatial-clustering analysis in this paper only covers a part of that system. The spatial-clustering analysis of urban networks includes methods such as cliques, k-cores, and lambda sets [46], which can reveal the hierarchical characteristics of the spatial association strength of urban networks at different levels. The quantitative analysis of the influencing indicators of cohesive subgroups can be carried out from various perspectives.
Author Contributions
Funding
Institutional Review Board Statement
Informed Consent Statement
Data Availability Statement
Conflicts of Interest
Abbreviations
| YRDUA | Yangtze River Delta Urban Agglomeration |
| SNA | Social Network Analysis |
| CHRED | China High Resolution Emission Gridded Data |
| PRUA | Permanent Residents in An Urban Area |
| GDP | Gross Domestic Product |
| UBA | Urban Built-up Area |
| CONCOR | Convergence of Iterated Correlation |
| UCINET | University of California at Irvine NETwork |
References
- Wu, X.X.; Huang, Y.; Gao, J. Impact of industrial agglomeration on new-type urbanization: Evidence from Pearl River Delta urban agglomeration of China. Int. Rev. Econ. Financ. 2022, 77, 312–325. [Google Scholar] [CrossRef]
- Fragkias, M.; Lobo, J.; Strumsky, D.; Seto, K.C. Does Size Matter? Scaling of CO2 Emissions and U.S. Urban Areas. PLoS ONE 2013, 8, e64727. [Google Scholar] [CrossRef] [PubMed]
- Ma, M.D.; Ma, X.; Cai, W.; Cai, W.G. Low carbon roadmap of residential building sector in China: Historical mitigation and prospective peak. Appl. Energy 2020, 273, 115247. [Google Scholar] [CrossRef]
- Mi, Z.; Zhang, Y.; Guan, D.; Shan, Y.; Liu, Z.; Cong, R.; Yuan, X.-C.; Wei, Y.-M. Consumption-based emission accounting for Chinese cities. Appl. Energy 2016, 184, 1073–1081. [Google Scholar] [CrossRef] [Green Version]
- Ma, M.; Rozema, J.; Gianoli, A.; Zhang, W. The Impacts of City Size and Density on CO2 Emissions: Evidence from the Yangtze River Delta Urban Agglomeration. Appl. Spat. Anal. Policy 2021, 1–27. [Google Scholar] [CrossRef]
- Sun, Z.; Ma, Z.; Ma, M.; Cai, W.; Xiang, X.; Zhang, S.; Chen, M.; Chen, L. Carbon Peak and Carbon Neutrality in the Building Sector: A Bibliometric Review. Buildings 2022, 12, 128. [Google Scholar] [CrossRef]
- Li, K.; Ma, M.D.; Xiang, X.W.; Feng, W.; Ma, Z.L.; Cai, W.G.; Ma, X. Carbon reduction in commercial building operations: A provincial retrospection in China. Appl. Energy 2022, 306, 118098. [Google Scholar] [CrossRef]
- Cheng, S.L.; Fan, W.; Meng, F.X.; Chen, J.D.; Cai, B.F.; Liu, G.Y.; Liang, S.; Song, M.L.; Zhou, Y.; Yang, Z.F. Toward low-carbon development: Assessing emissions-reduction pressure among Chinese cities. J. Environ. Manag. 2020, 271, 111036. [Google Scholar] [CrossRef]
- Fang, C.L.; Yu, D.L. Urban agglomeration: An evolving concept of an emerging phenomenon. Landsc. Urban Plann. 2017, 162, 126–136. [Google Scholar] [CrossRef]
- Liang, L.W.; Wang, Z.B.; Li, J.X. The effect of urbanization on environmental pollution in rapidly developing urban agglomerations. J. Clean. Prod. 2019, 237, 117649. [Google Scholar] [CrossRef]
- Teaford, J.C.; ProQuest. The Metropolitan Revolution: The Rise of Post-Urban America; Columbia University Press: New York, NY, USA, 2006; 306p. [Google Scholar]
- Yao, F.; Zhu, H.S.; Wang, M.J. The Impact of Multiple Dimensions of Urbanization on CO2 Emissions: A Spatial and Threshold Analysis of Panel Data on China’s Prefecture-Level Cities. Sustain. Cities Soc. 2021, 73, 103113. [Google Scholar] [CrossRef]
- Ou, J.P.; Liu, X.P.; Wang, S.J.; Xie, R.; Li, X. Investigating the differentiated impacts of socioeconomic factors and urban forms on CO2 emissions: Empirical evidence from Chinese cities of different developmental levels. J. Clean. Prod. 2019, 226, 601–614. [Google Scholar] [CrossRef]
- Wang, S.; Fang, C.; Wang, Y. Spatiotemporal variations of energy-related CO2 emissions in China and its influencing factors: An empirical analysis based on provincial panel data. Renew Sust. Energ. Rev. 2016, 55, 505–515. [Google Scholar] [CrossRef]
- Wang, Y.N.; Chen, W.; Kang, Y.Q.; Li, W.; Guo, F. Spatial correlation of factors affecting CO2 emission at provincial level in China: A geographically weighted regression approach. J. Clean. Prod. 2018, 184, 929–937. [Google Scholar] [CrossRef]
- Outline of the Yangtze River Delta Regional Integrated Development Planning; People’s Publishing House: Beijing, China, 2019; pp. 7–9.
- Shen, W.R.; Liang, H.W.; Dong, L.; Ren, J.Z.; Wang, G.J. Synergistic CO2 reduction effects in Chinese urban agglomerations: Perspectives from social network analysis. Sci. Total Environ. 2021, 798, 149352. [Google Scholar] [CrossRef]
- Energy Development Strategic Action Program: 2014–2020; People’s Publishing House: Beijing, China, 2014.
- Cui, Y.F.; Li, L.; Chen, L.Q.; Zhang, Y.; Cheng, L.; Zhou, X.S.; Yang, X.Y. Land-Use Carbon Emissions Estimation for the Yangtze River Delta Urban Agglomeration Using 1994–2016 Landsat Image Data. Remote Sens. 2018, 10, 1334. [Google Scholar] [CrossRef] [Green Version]
- Zhang, S.F.; Ma, M.D.; Li, K.; Ma, Z.L.; Feng, W.; Cai, W.G. Historical carbon abatement in the commercial building operation: China versus the US. Energ. Econ. 2022, 105, 105712. [Google Scholar] [CrossRef]
- Huo, T.F.; Li, X.H.; Cai, W.G.; Zuo, J.; Jia, F.Y.; Wei, H.F. Exploring the impact of urbanization on urban building carbon emissions in China: Evidence from a provincial panel data model. Sustain. Cities Soc. 2020, 56, 105712. [Google Scholar] [CrossRef]
- Xiang, X.W.; Ma, X.; Ma, Z.L.; Ma, M.D.; Cai, W.G. Python-LMDI: A Tool for Index Decomposition Analysis of Building Carbon Emissions. Buildings 2022, 12, 83. [Google Scholar] [CrossRef]
- Gao, J.X.; Zhong, X.Y.; Cai, W.G.; Ren, H.; Huo, T.F.; Wang, X.; Mi, Z.F. Dilution effect of the building area on energy intensity in urban residential buildings. Nat. Commun. 2019, 10, 4944. [Google Scholar] [CrossRef]
- Zhang, S.F.; Xiang, X.W.; Ma, Z.L.; Ma, M.D.; Zou, C.C. Carbon Neutral Roadmap of Commercial Building Operations by Mid-Century: Lessons from China. Buildings 2021, 11, 510. [Google Scholar] [CrossRef]
- Xiang, X.W.; Ma, X.; Ma, Z.L.; Ma, M.D. Operational Carbon Change in Commercial Buildings under the Carbon Neutral Goal: A LASSO-WOA Approach. Buildings 2022, 12, 54. [Google Scholar] [CrossRef]
- Wang, B.; Sun, Y.F.; Wang, Z.H. Agglomeration effect of CO2 emissions and emissions reduction effect of technology: A spatial econometric perspective based on China’s province-level data. J. Clean. Prod. 2018, 204, 96–106. [Google Scholar] [CrossRef]
- Shi, K.F.; Chen, Y.; Li, L.Y.; Huang, C. Spatiotemporal variations of urban CO2 emissions in China: A multiscale perspective. Appl. Energy 2018, 211, 218–229. [Google Scholar] [CrossRef]
- Liu, B.Q.; Tian, C.; Li, Y.Q.; Song, H.H.; Ma, Z.X. Research on the effects of urbanization on carbon emissions efficiency of urban agglomerations in China. J. Clean. Prod. 2018, 197, 1374–1381. [Google Scholar] [CrossRef]
- Su, W.S.; Liu, Y.Y.; Wang, S.J.; Zhao, Y.B.; Su, Y.X.; Li, S.J. Regional inequality, spatial spillover effects, and the factors influencing city-level energy-related carbon emissions in China. J. Geogr. Sci. 2018, 28, 495–513. [Google Scholar] [CrossRef] [Green Version]
- Yu, X.; Wu, Z.Y.; Zheng, H.R.; Li, M.Q.; Tan, T.L. How urban agglomeration improve the emission efficiency ? A spatial econometric analysis of the Yangtze River Delta urban agglomeration in China. J. Environ. Manag. 2020, 260, 110061. [Google Scholar] [CrossRef]
- Han, F.; Xie, R.; Lu, Y.; Fang, J.Y.; Liu, Y. The effects of urban agglomeration economies on carbon emissions: Evidence from Chinese cities. J. Clean. Prod. 2018, 172, 1096–1110. [Google Scholar] [CrossRef]
- Zhang, W.; Feng, P.F. Differentiation research of CO2 emissions from energy consumption and their influencing mechanism on the industrial enterprises above designated size in Chinese industrial cities: Based on geographical detector method. Nat. Hazards 2020, 102, 645–658. [Google Scholar] [CrossRef] [Green Version]
- Miao, Z.; Balezentis, T.; Tian, Z.H.; Shao, S.; Geng, Y.; Wu, R. Environmental Performance and Regulation Effect of China’s Atmospheric Pollutant Emissions: Evidence from “Three Regions and Ten Urban Agglomerations”. Environ. Resour. Econ. 2019, 74, 211–242. [Google Scholar] [CrossRef]
- Barthélemy, M. Spatial networks. Phys. Rep. 2011, 499, 1–101. [Google Scholar] [CrossRef] [Green Version]
- Pflieger, G.; Rozenblat, C. Introduction. Urban Networks and Network Theory: The City as the Connector of Multiple Networks. Urban Stud. 2010, 47, 2723–2735. [Google Scholar] [CrossRef] [Green Version]
- Wolfe, A.W. Social Network Analysis: Methods and Applications. Contemp. Sociol. 1995, 91, 219–220. [Google Scholar] [CrossRef]
- Bai, C.Q.; Zhou, L.; Xia, M.L.; Feng, C. Analysis of the spatial association network structure of China’s transportation carbon emissions and its driving factors. J. Environ. Manag. 2020, 253, 109765. [Google Scholar] [CrossRef] [PubMed]
- He, Y.Y.; Wei, Z.X.; Liu, G.Q.; Zhou, P. Spatial network analysis of carbon emissions from the electricity sector in China. J. Clean. Prod. 2020, 262, 121193. [Google Scholar] [CrossRef]
- Su, Y.; Yu, Y.Q. Spatial association effect of regional pollution control. J. Clean. Prod. 2019, 213, 540–552. [Google Scholar] [CrossRef]
- Barthelemy, M. Morphogenesis of Spatial Networks; Lecture Notes in Morphogenesis; Springer: Berlin/Heidelberg, Germany, 2018; pp. i–xix, 319–331. [Google Scholar] [CrossRef]
- Song, J.; Feng, Q.; Wang, X.; Fu, H.; Jiang, W.; Chen, B. Spatial Association and Effect Evaluation of CO2 Emission in the Chengdu-Chongqing Urban Agglomeration: Quantitative Evidence from Social Network Analysis. Sustainability 2018, 11, 1. [Google Scholar] [CrossRef] [Green Version]
- Notice on Printing and Distributing the Development Planning of the Yangtze River Delta Urban Agglomeration. Available online: https://www.ndrc.gov.cn/xxgk/zcfb/ghwb/201606/t20160603_962187.html?code=&state=123 (accessed on 1 June 2016).
- The State Council issued the “Notice on Adjusting the Criteria for City Size Division”. Jiangsu Urban Plan. 2014, 11, 47–47.
- Reilly, W.J. Methods for the Study of Retail Relationships; The University of Texas Bulletin: Austin, TX, USA, 1929; 50p. [Google Scholar]
- Ullman, E.L.; Boyce, R.R. Geography as Spatial Interaction; University of Washington Press: Seattle, WA, USA, 1980; p. xix. 231p. [Google Scholar]
- Wasserman, S.; Faust, K. Social Network Analysis: Methods and Applications; Cambridge University Press: Cambridge, UK, 1994; p. xxxi. 825p. [Google Scholar]
- Chen, R.C.S.; Yang, S.J.H. Applying DNA computation to intractable problems in social network analysis. Biosystems 2010, 101, 222–232. [Google Scholar] [CrossRef]
- Tsvetovat, M.; Kouznetsov, A. Social Network Analysis for Startups; O’Reilly: Beijing, China; Farnham, UK, 2011; p. xi. 174p. [Google Scholar]
- Scott, J. Social network analysis: A Handbook; SAGE Publications: London, UK; Newbury Park, CA, USA, 1991; p. x. 210p. [Google Scholar]
- Freeman, L.C. Centrality in social networks conceptual clarification. Soc. Netw. 1978, 1, 215–239. [Google Scholar] [CrossRef] [Green Version]
- Wuxi: Seventy Years of Trials and Hardships, Wuxi’s Old Appearance Has Changed. Available online: http://jszd.stats.gov.cn/ztzl/tjkfr_1/70zncj/201909/t20190919_3903.html (accessed on 19 September 2019).


| City Size | Classification Standard (10,000 People) | City (Number in the Research) | |
|---|---|---|---|
| Megacity Behemoth | >1000 | Shanghai (1) | |
| Megacity | 500–1000 | Nanjing (10) | |
| Large City | Ⅰ Large City | 300–500 | Hangzhou (2), Hefei (19), and Suzhou (14) |
| Ⅱ Large City | 100–300 | Wuxi (15), Ningbo (6), Nantong (16), Changzhou (13), Shaoxing (5), Wuhu (20), Yancheng (18), Yangzhou (12), Taizhou (in Jiangsu) (17), and Taizhou (in Zhejiang) (9) | |
| Medium City | 50–100 | Zhenjiang (11), Huzhou (4), Jiaxing (3), Ma’anshan (22), Anqing (25), Jinhua (8), and Zhoushan (7) | |
| Small City | Ⅰ Small City | 20–50 | Tongling (23), Chuzhou (21), Xuancheng (26), and Chizhou (24) |
| Ⅱ Small City | <20 | None | |
| Subgroup | Density Matrix | Image Matrix | ||||||
|---|---|---|---|---|---|---|---|---|
| 1 | 2 | 3 | 4 | 1 | 2 | 3 | 4 | |
| 1 | 1.000 | 0.278 | 0.361 | 0.000 | 1 | 0 | 1 | 0 |
| 2 | 0.972 | 0.500 | 0.139 | 0.021 | 1 | 1 | 0 | 0 |
| 3 | 0.694 | 0.000 | 0.900 | 0.104 | 1 | 0 | 1 | 0 |
| 4 | 0.292 | 0.000 | 0.396 | 0.518 | 0 | 0 | 1 | 1 |
Publisher’s Note: MDPI stays neutral with regard to jurisdictional claims in published maps and institutional affiliations. |
© 2022 by the authors. Licensee MDPI, Basel, Switzerland. This article is an open access article distributed under the terms and conditions of the Creative Commons Attribution (CC BY) license (https://creativecommons.org/licenses/by/4.0/).
Share and Cite
Liu, W.; Sun, Y.; Cai, W.; Ke, Y.; Ren, H. A Study on the Spatial Association Network of CO2 Emissions from the Perspective of City Size: Evidence from the Yangtze River Delta Urban Agglomeration. Buildings 2022, 12, 617. https://doi.org/10.3390/buildings12050617
Liu W, Sun Y, Cai W, Ke Y, Ren H. A Study on the Spatial Association Network of CO2 Emissions from the Perspective of City Size: Evidence from the Yangtze River Delta Urban Agglomeration. Buildings. 2022; 12(5):617. https://doi.org/10.3390/buildings12050617
Chicago/Turabian StyleLiu, Weidan, Yuanhe Sun, Weiguang Cai, Yanyan Ke, and Hong Ren. 2022. "A Study on the Spatial Association Network of CO2 Emissions from the Perspective of City Size: Evidence from the Yangtze River Delta Urban Agglomeration" Buildings 12, no. 5: 617. https://doi.org/10.3390/buildings12050617