
Research on the Spatio-Temporal Differentiation Characteristics and Factors of Typical Square Cities in China from the Perspective of Human Settlements


Abstract
:1. Introduction
2. Data and Methods
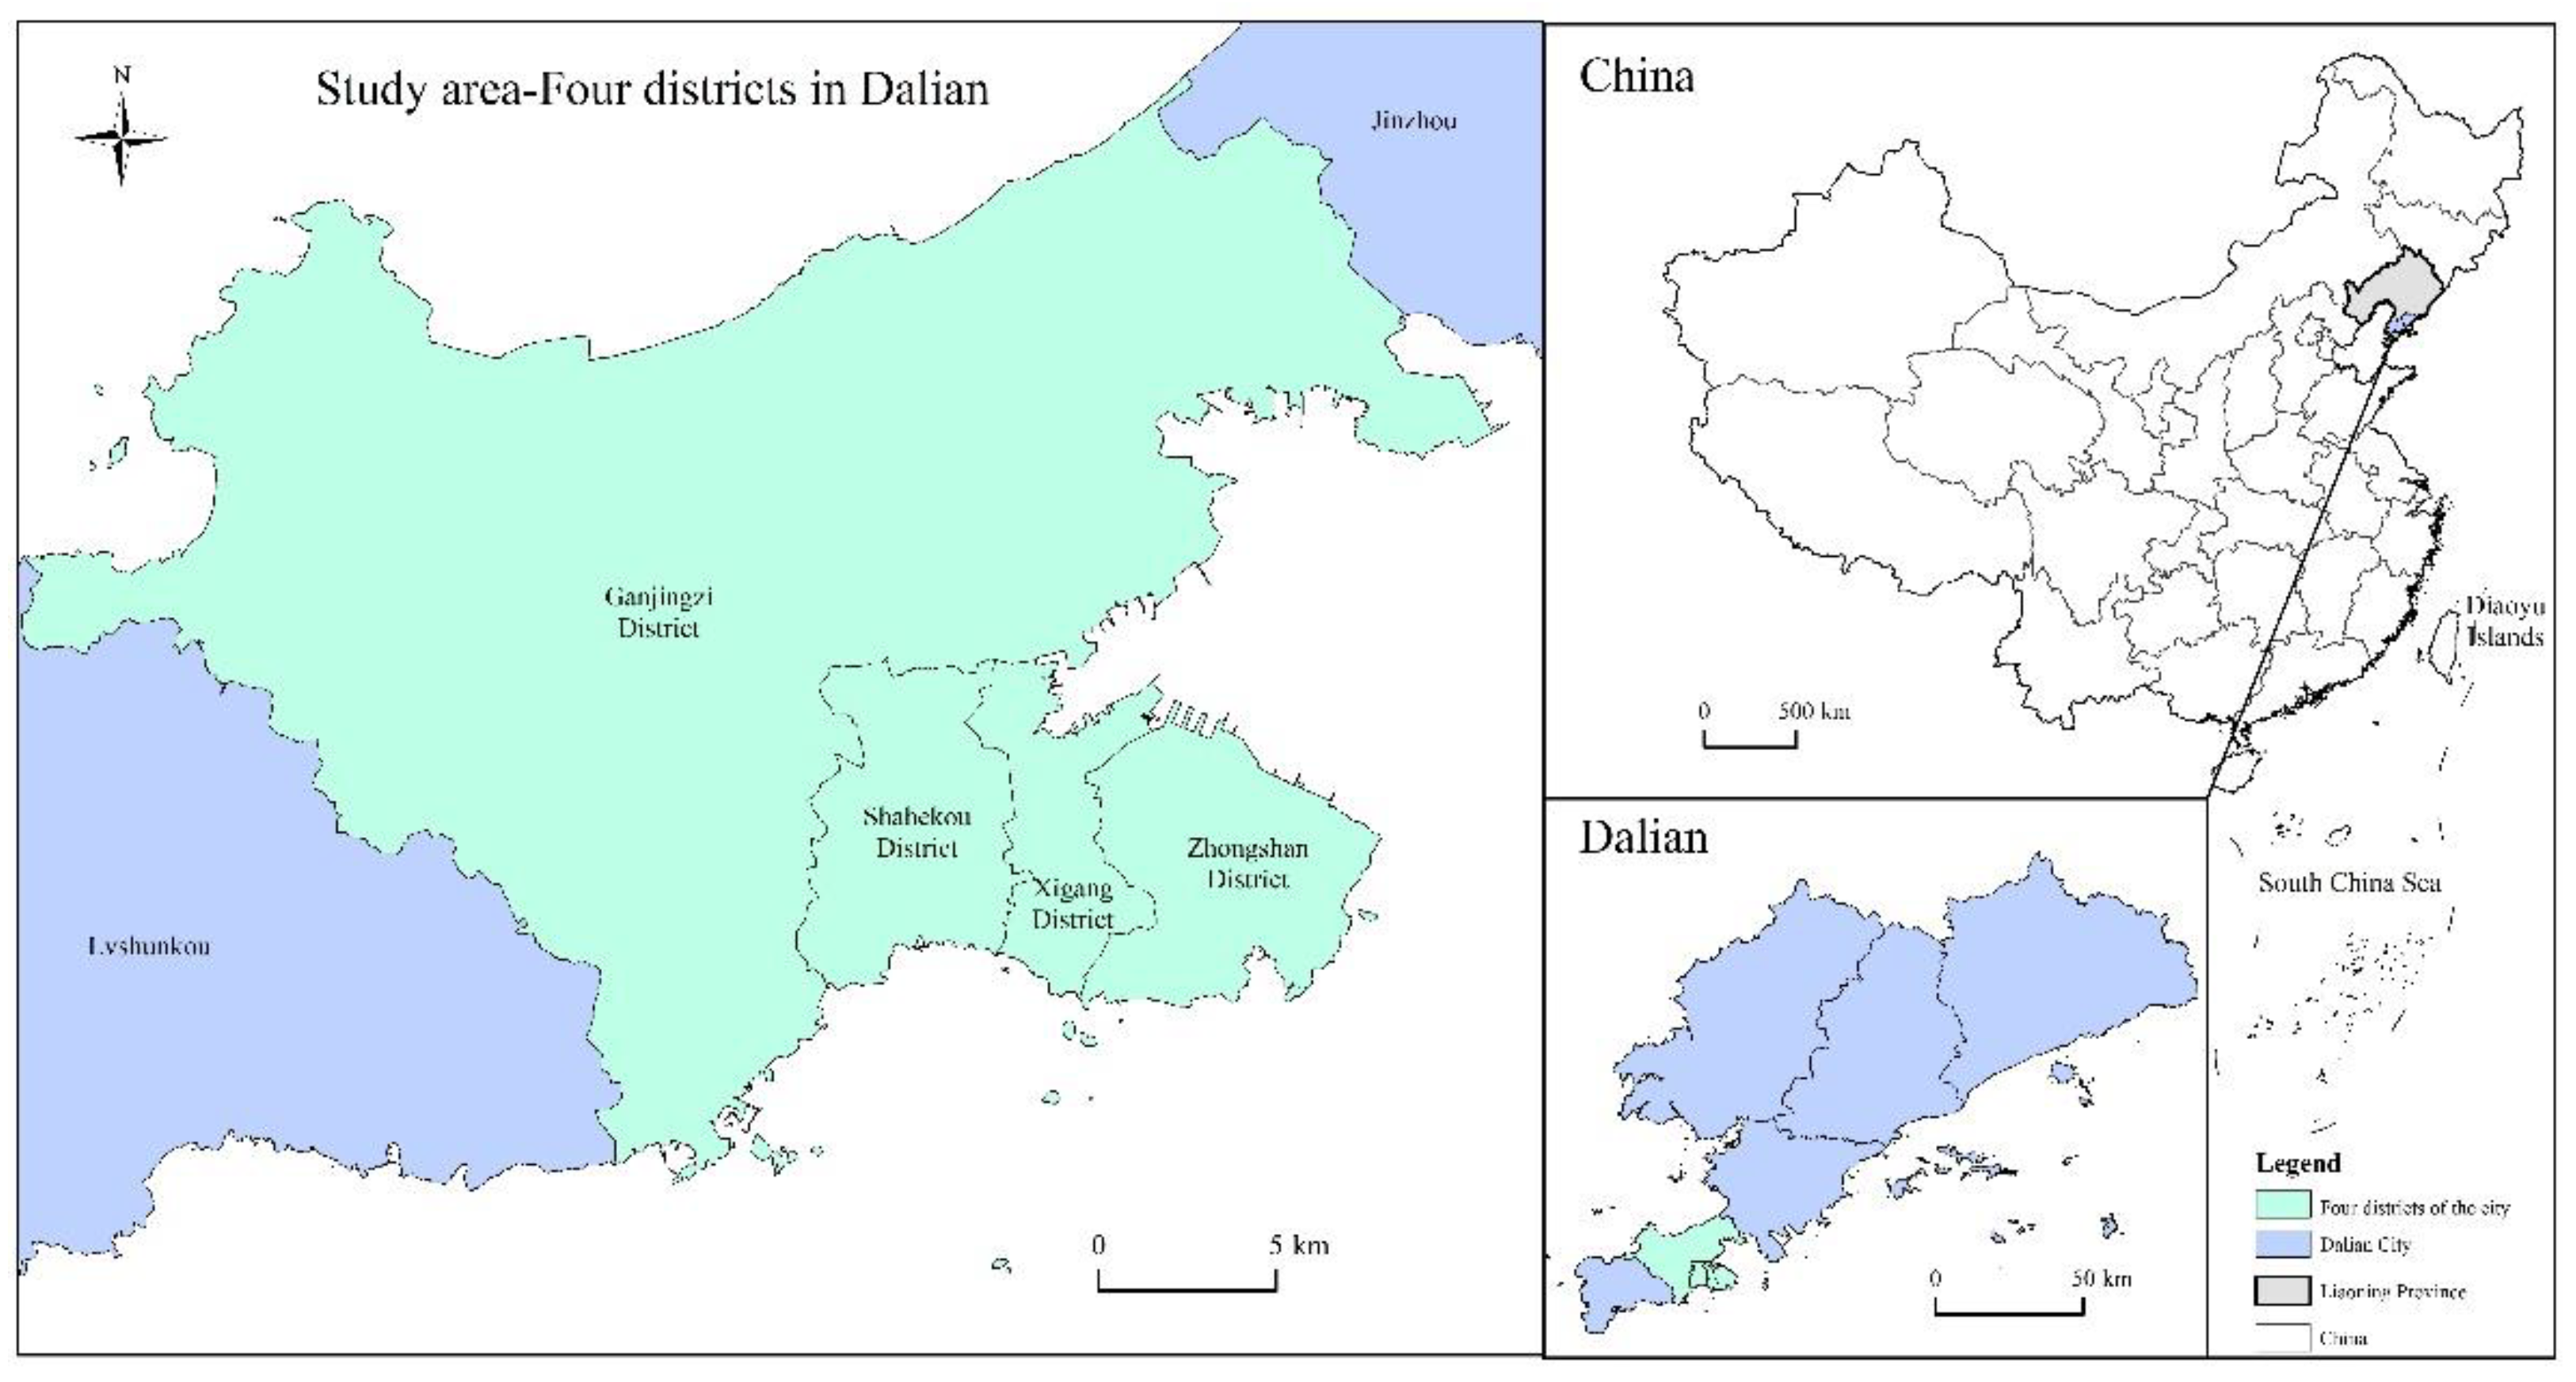
2.1. Research Area
2.2. Data Sources
2.3. Methods
3. Results and Analysis
3.1. Comprehensive Evaluation of City Squares
3.1.1. Principal Factor Analysis
3.1.2. Classification of City Squares
- The comprehensive square
- 2.
- The recreational square
- 3.
- The commercial service square
- 4.
- The traffic square
3.2. The Characteristics of Spatio-Temporal Patterns of City Squares
3.2.1. Analysis of Spatial Differences between City Squares
3.2.2. Service Scope of City Squares
3.3. Factors Influencing the Evolution of the Spatio-Temporal Pattern of City Squares
3.3.1. Natural Factors
3.3.2. Economic Factors
3.3.3. Social Factors
3.3.4. Political Factors
4. Discussion
4.1. Selection of Evaluation Indicators and Influencing Factors
4.2. Limitations
5. Conclusions
Author Contributions
Funding
Institutional Review Board Statement
Informed Consent Statement
Data Availability Statement
Conflicts of Interest
References
- Hwang, J. Representing Spatiotemporal Context of Public Space for Urban Design. In Proceedings of the 2013 Fourth International Conference on Computing for Geospatial Research and Application, San Jose, CA, USA, 22–24 July 2013; p. 153. [Google Scholar]
- Jin, Y.; Jin, H.; Kang, J. Combined effects of the thermal-acoustic environment on subjective evaluations in urban squares. Build. Environ. 2020, 168, 106517. [Google Scholar] [CrossRef]
- Wang, M.; Zhang, X.; Luan, W. Structure and Spatial Analysis of Evaluation of Residential Environment in Dalian City. Sci. Geogr. Sin. 2003, 23, 87–94. (In Chinese) [Google Scholar] [CrossRef]
- Cai, Y. Urban Square; Southeast University Press: Nanjing, China, 2006. (In Chinese) [Google Scholar]
- Li, X.; Zhang, J.; Yang, J.; Zhang, L. Analysis of the attraction field of urban human settlements: A case study of Dalian. Geogr. Res. 2012, 31, 1199–1208. (In Chinese) [Google Scholar] [CrossRef]
- Agryzkov, T.; Martí, P.; Nolasco-Cirugeda, A.; Serrano-Estrada, L.; Tortosa, L.; Vicent, J.F. Analysing successful public spaces in an urban street network using data from the social networks Foursquare and Twitter. Appl. Netw. Sci. 2016, 1, 1–15. [Google Scholar] [CrossRef] [Green Version]
- Wang, Y.; Chen, J. Does the rise of pseudo-public spaces lead to the ‘end of public space’ in large Chinese cities? Evidence from Shanghai and Chongqing. Urban Des. Int. 2018, 23, 215–235. [Google Scholar] [CrossRef]
- Wang, Y.; Yamaguchi, K.; Kawasaki, M. Urban revitalization in highly localized squares: A case study of the Historic Centre of Macao. Urban Des. Int. 2016, 23, 34–53. [Google Scholar] [CrossRef]
- Kassabaum, M.C. Early Platforms, Early Plazas: Exploring the Precursors to Mississippian Mound-and-Plaza Centers. J. Archaeol. Res. 2018, 27, 187–247. [Google Scholar] [CrossRef]
- Yang, J.; Yang, Y.; Sun, D.; Jin, C.; Xiao, X. Influence of urban morphological characteristics on thermal environment. Sustain. Cities Soc. 2021, 72, 103045. [Google Scholar] [CrossRef]
- Van Deusen Jr, R. Public space design as class warfare: Urban design, the ‘right to the city’ and the production of Clinton Square, Syracuse, NY. GeoJournal 2002, 58, 149–158. [Google Scholar] [CrossRef]
- Zalewski, A. Transportation Aspects of Shaping the Public Spaces of Urban Squares in Warsaw (Poland). IOP Conf. Ser. Mater. Sci. Eng. 2019, 603, 42092. [Google Scholar] [CrossRef]
- Xue, J. Open Space & Square Design; Phoenix Science Press: Nanjing, China, 2004. (In Chinese) [Google Scholar]
- You, W.; Ding, W. Effects of urban square entry layouts on spatial ventilation under different surrounding building conditions. Build. Simul.-China 2020, 14, 377–390. [Google Scholar] [CrossRef]
- Yang, J.; Wang, Y.; Xiu, C.; Xiao, X.; Xia, J.; Jin, C. Optimizing local climate zones to mitigate urban heat island effect in human settlements. J. Clean. Prod. 2020, 275, 123767. [Google Scholar] [CrossRef]
- Stocco, S.; Cantón, M.A.; Correa, E.N. Design of urban green square in dry areas: Thermal performance and comfort. Urban For. Urban Gree. 2015, 14, 323–335. [Google Scholar] [CrossRef]
- Kariminia, S.; Shamshirband, S.; Hashim, R.; Saberi, A.; Petković, D.; Roy, C.; Motamedi, S. A simulation model for visitors’ thermal comfort at urban public squares using non-probabilistic binary-linear classifier through soft-computing methodologies. Energy 2016, 101, 568–580. [Google Scholar] [CrossRef]
- Fayoumi, M.A.E. Street Vendors’ Roles in Main Squares Utilization as a Type of Tactical Urbanism Application in G.C.R. “A Criticism Review on Ramses Square”. Procedia Environ. Sci. 2017, 37, 153–163. [Google Scholar] [CrossRef]
- Pang, R.; Hou, C.; Man, W.; Song, Y.; Zhao, Z. Study on Spatial Structure and Accessibility of Urban Squares in Changchun. Econ. Geogr. 2015, 35, 88–93. (In Chinese) [Google Scholar] [CrossRef]
- Qixiang, H.; Hanchuan, P. Study on People Square’s Mass Passenger Flow Management System Launched in Shanghai Urban Rail Transit. Procedia Soc. Behav. Sci. 2013, 96, 751–765. [Google Scholar] [CrossRef] [Green Version]
- Spyrou, E.; Korakakis, M.; Charalampidis, V.; Psallas, A.; Mylonas, P. A Geo-Clustering Approach for the Detection of Areas-of-Interest and Their Underlying Semantics. Algorithms 2017, 10, 35. [Google Scholar] [CrossRef] [Green Version]
- Xiao, J.; Hilton, A. An Investigation of Soundscape Factors Influencing Perceptions of Square Dancing in Urban Streets: A Case Study in a County Level City in China. Int. J. Environ. Res. Public Health 2019, 16, 840. [Google Scholar] [CrossRef] [Green Version]
- Meng, Q.; Zhao, T.; Kang, J. Influence of Music on the Behaviors of Crowd in Urban Open Public Spaces. Front. Psychol. 2018, 9, 596. [Google Scholar] [CrossRef] [Green Version]
- Pugh, T.W. From the Streets: Public and Private Space in an Early Maya City. J. Archaeol. Method Theory 2018, 26, 967–997. [Google Scholar] [CrossRef]
- Hajmirsadeghi, R.S.; Shamsuddin, S.; Foroughi, A. The Relationship between Behavioral & Psychological Aspects of Design Factors and Social Interaction in Public Squares. Procedia Soc. Behav. Sci. 2014, 140, 98–102. [Google Scholar] [CrossRef] [Green Version]
- Zhang, L. People’s behavior psychology and the design of urban square. Urban Probl. 2008, 8, 65–67. (In Chinese) [Google Scholar]
- Lenzholzer, S. Engrained experience—A comparison of microclimate perception schemata and microclimate measurements in Dutch urban squares. Int. J. Biometeorol. 2010, 54, 141–150. [Google Scholar] [CrossRef] [PubMed] [Green Version]
- Ding, Y.; Li, S. Study on city square image based on public perception: A case of Guangzhou Huacheng Plaza. World Reg. Stud. 2018, 27, 65–76. (In Chinese) [Google Scholar] [CrossRef]
- Yang, B.; Volkman, N.J. From traditional to contemporary: Revelations in Chinese garden and public space design. Urban Des. Int. 2010, 15, 208–220. [Google Scholar] [CrossRef] [Green Version]
- Chen, C.; Zhou, B.; Yang, D.; Deng, W.; Yan, Z.; Qi, F. City square: An issue to be studied. City Plan. Rev. 2002, 26, 31–45. (In Chinese) [Google Scholar] [CrossRef]
- Li, Q.; Peng, K.; Cheng, P. Community-Level Urban Green Space Equity Evaluation Based on Spatial Design Network Analysis (sDNA): A Case Study of Central Wuhan, China. Int. J. Environ. Res. Public Health 2021, 18, 10174. [Google Scholar] [CrossRef]
- Yang, J.; Sun, J.; Ge, Q.; Li, X. Assessing the impacts of urbanization-associated green space on urban land surface temperature: A case study of Dalian, China. Urban For. Urban Gree. 2017, 22, 1–10. [Google Scholar] [CrossRef]
- Xu, Y. Discussion on Spiritual Dimension of Square Space: Read on Status Quo of City Plaza in Shanghai. Huazhong Archit. 2010, 28, 21–24. (In Chinese) [Google Scholar] [CrossRef]
- Li, C.; Li, Y. Analysis on the Spatial Form of City Square. Planners 2002, 18, 45–48. (In Chinese) [Google Scholar] [CrossRef]
- Wang, H.; Qiu, J.; Breuste, J.; Ross Friedman, C.; Zhou, W.; Wang, X. Variations of urban greenness across urban structural units in Beijing, China. Urban For. Urban Gree. 2013, 12, 554–561. [Google Scholar] [CrossRef]
- Massaro, A.; Birardi, G.; Manca, F.; Marin, C.; Birardi, V.; Giannone, D.; Galiano, A.M. Innovative DSS for intelligent monitoring and urban square design approaches: A case of study. Sustain. Cities Soc. 2021, 65, 102653. [Google Scholar] [CrossRef]
- Dalian City Construction Archives. The Squares of Dalian; Dalian Publishing House: Dalian, China, 2007. (In Chinese) [Google Scholar]
- Wu, L. Introduction to Science of Human Settlement; China Architecture & Building Press: Beijing, China, 2001. (In Chinese) [Google Scholar]
- Li, X.; Zhang, Y.; Gao, J. Spatial Pattern and Classification of Human Settlement:A Case Study of Shahekou in Dalian. Sci. Geogr. Sin. 2014, 34, 1033–1040. (In Chinese) [Google Scholar] [CrossRef]
- Xu, L.; Liu, D.; Liu, Y.; Zhang, N.; Yang, L. Analysis of Plant Composition and Diversity on Urban Square in Mudanjiang City, China. Bangl. J. Bot. 2021, 50, 277–287. [Google Scholar] [CrossRef]
- Guedoudj, W.; Ghenouchi, A.; Toussaint, J. Urban attractiveness in public squares: The mutual influence of the urban environment and the social activities in Batna. Urbe. Rev. Bras. De Gestão Urbana 2020, 12, e20190162. [Google Scholar] [CrossRef]
- Acar, H.; Yavuz, A.; Eroğlu, E.; Acar, C.; Sancar, C.; Değermenci, A.S. Analysis of activity, space and user relations in urban squares. Indoor Built Environ. 2021, 30, 1466–1485. [Google Scholar] [CrossRef]
- Shao, J.; Zhang, H.; Liu, J. Quality Evaluation of Square Space Based on the Aging-friendly City: Central city plaza in Harbin. Build. Energy Effic. 2018, 46, 78–83. (In Chinese) [Google Scholar] [CrossRef]
- Faye, B.; Le Fur, É. Square, Plaza, Piazza, Place: What Do We Know about these Targets of Urban Regeneration Programmes? Urban Stud. 2012, 49, 3081–3099. [Google Scholar] [CrossRef]
- Turgut, D. Case study on holistic assessment of the relationship between city and square. J. Archit. Urban. 2020, 44, 152–165. [Google Scholar] [CrossRef]
- Paiva, P.D.D.O.; Sousa, R.D.B.; Alves, S.F.N.D. Patchwork quilt: A methodology proposed for the study of historic gardens. Urban For. Urban Gree. 2021, 62, 127169. [Google Scholar] [CrossRef]
- Atik, D.; Keleş, E.; Bayrak, G. Unable to Inhale in an Historical Square. Eur. J. Sustain. Dev. 2018, 7, 274–286. [Google Scholar] [CrossRef]
- Li, C. Comprehensive Evaluation System of Square Based on the Analytic Hierarchy Process; Hefei University of Technology: Anhui, China, 2012. (In Chinese) [Google Scholar]
- Mehan, A. Investigating the Role of Historical Public Squares on Promotion of Citizens’ Quality of Life. Procedia Eng. 2016, 161, 1768–1773. [Google Scholar] [CrossRef] [Green Version]
- Jiang, M.; Nakajima, N. Chongqing People’s Square after 1997: Situated publicness of municipal squares in reform-era China. Urban Res. Pract. 2022, 1–29, ahead-of-print. [Google Scholar] [CrossRef]


| Types of Data | Data Characteristics | Data Sources |
|---|---|---|
| Remote sensing image | images of Landsat5 TM and DEM | Computer Network Information Center (http://www.gscloud.cn/, accessed on 30 April 2022) |
| Building data | plot ratio, site coverage | Dalian Land Natural Resources and Building Management Board |
| Status of land usage | green area, green coverage rate | Dalian Land Natural Resources and Building Management Board |
| Traffic network data | mainly include railways, subways, high-speed rails, urban roads of different levels, and urban transportation facilities (bus stations, subway stations) | Dalian Plan Bureau |
| Service Facilities | schools, medical facilities, catering facilities, entertainment facilities, etc. | Purchase of Google Earth images and research projects |
| Social statistics | population density, housing prices | Dalian Land Natural Resources and Building Management Board |
| Administrative division data | data from country, province, city, county and street | Dalian Land Natural Resources and Building Management Board |
| Target Layer | Criterion Layer | Index Layer | Target Layer | Criterion Layer | Index Layer |
|---|---|---|---|---|---|
| Natural system | Ecosystem (X1) | Per capita public green area (vector) | Live system | Education culture (X8) | Number of schools and training institutions within the scope (vector) |
| Green coverage (vector) | Residential system (X9) | Degree of Old and New Housing (questionnaire) | |||
| Natural landscape (X2) | Number of scenic spots (vector) | Land Price Network (Social Economic Data) | |||
| Distance to mountain and sea (vector) | Floor area ratio (vector) | ||||
| Humanity system | Resident composition (X3) | Education (questionnaire) | Exercise and Fitness (X10) | Number of sports facilities (vector data) | |
| Family composition (questionnaire) | Number of sports fields (vector) | ||||
| Age (questionnaire) | Support system | City Medical (X11) | Number of hospitals, community service centers, and pharmacies (vector) | ||
| Mental index (X4) | Sense of belonging (questionnaire) | Business service (X12) | Number of cinemas, restaurants, cafes, bars, KTV (vector) | ||
| Sense of happiness (questionnaire) | Basic cost of living (vegetables, fruits, grain, oil) (questionnaire) | ||||
| Sense of security (questionnaire) | City traffic (X13) | Residents’ public traffic attendance (questionnaire) | |||
| Society system | Security system (X5) | Public security management (questionnaire) | Number of bus and subway stations (vector) | ||
| Police Station (Vector) | Parking convenience (questionnaire survey) | ||||
| Education (X6) | Number of places for cultural activities | ||||
| Cultural living standard (questionnaire) | |||||
| Guarantee system (X7) | Employment status (questionnaire) | ||||
| Leisure and entertainment convenience (questionnaire) |
| Ingredient | Initial Eigenvalue | Extract the Sum of Squares and Load | Rotate the Sum of Squares and Load | ||||||
|---|---|---|---|---|---|---|---|---|---|
| Total | Variance% | Accumulation% | Total | Variance% | Accumulation% | Total | Variance% | Accumulation% | |
| 1 | 5.779 | 44.452 | 44.452 | 5.779 | 44.452 | 44.452 | 5.398 | 41.522 | 41.522 |
| 2 | 2.024 | 15.567 | 60.019 | 2.024 | 15.567 | 60.019 | 1.683 | 12.945 | 54.467 |
| 3 | 1.352 | 10.400 | 70.419 | 1.352 | 10.400 | 70.419 | 1.635 | 12.580 | 67.047 |
| 4 | 1.077 | 8.283 | 78.701 | 1.077 | 8.283 | 78.701 | 1.515 | 11.655 | 78.701 |
| 5 | 0.803 | 6.176 | 84.877 | ||||||
| 6 | 0.553 | 4.255 | 89.132 | ||||||
| 7 | 0.415 | 3.193 | 92.325 | ||||||
| 8 | 0.331 | 2.547 | 94.872 | ||||||
| 9 | 0.243 | 1.868 | 96.740 | ||||||
| 10 | 0.172 | 1.320 | 98.060 | ||||||
| 11 | 0.150 | 1.154 | 99.214 | ||||||
| 12 | 0.070 | 0.542 | 99.756 | ||||||
| 13 | 0.032 | 0.244 | 100.000 | ||||||
| Variable | 1 | 2 | 3 | 4 |
|---|---|---|---|---|
| (X1) | −0.345 | −0.234 | 0.318 | 0.652 |
| (X2) | 0.119 | 0.432 | 0.681 | −0.160 |
| (X3) | 0.342 | 0.538 | −0.437 | 0.465 |
| (X4) | −0.095 | −0.639 | 0.474 | 0.151 |
| (X5) | 0.825 | −0.107 | 0.286 | −0.125 |
| (X6) | 0.102 | 0.595 | 0.350 | 0.474 |
| (X7) | 0.594 | 0.604 | −0.058 | −0.171 |
| (X8) | 0.889 | −0.212 | −0.055 | 0.003 |
| (X9) | 0.887 | −0.212 | −0.114 | 0.221 |
| (X10) | 0.926 | −0.063 | 0.176 | −0.043 |
| (X11) | 0.865 | −0.264 | −0.003 | −0.067 |
| (X12) | 0.842 | 0.264 | 0.214 | −0.038 |
| (X13) | 0.764 | −0.349 | −0.268 | 0.245 |
| Squares | Total Scores | Squares | Total Scores | Squares | Total Scores | Squares | Total Scores |
|---|---|---|---|---|---|---|---|
| Youhao | 2.09 | Navy | 1.15 | Xinan | −0.46 | Ocean | −1.05 |
| Zhongshan | 1.98 | Garden | 1.12 | Wenyuan | −0.51 | Yingke Stone | −1.07 |
| Renmin | 1.91 | South of Railway Station | 1.08 | Huanan | −0.53 | Hudiao | −1.08 |
| Shengli | 1.78 | Kaixuan | 0.99 | Xueyuan | −0.54 | Xiangzhou Road | −1.12 |
| Shengliqiao | 1.75 | Wusi | 0.92 | Tianhe | −0.56 | Dalianmen | −1.15 |
| Sanba | 1.65 | Wuyi | 0.57 | Malan | −0.87 | Shanluan | −1.16 |
| Olympic | 1.58 | Gangwan | 0.47 | Bayi Road | −0.91 | Donggang Musical Fountain | −1.27 |
| Minzhu | 1.58 | Donghua | 0.44 | Xinghai | −0.91 | Airport | −1.34 |
| Xiwang | 1.51 | Qiuzhi | -0.11 | Digital | −0.99 | In front of Zhoushuizi Railway Station | −1.52 |
| Jiefang | 1.49 | Fumin | -0.16 | Huale | −1.03 | Jinwan | −1.52 |
| Erqi | 1.28 | Xianglujiao | -0.27 | Xuri | −1.03 | Shidao Street | −1.91 |
| Dongguan | 1.24 | Jinsanjiao | -0.33 | Qixing | −1.04 | Houyan | −2.13 |
| Classification | Squares | Number | Statistics | Main Factor 1 | Main Factor 2 | Main Factor 3 | Main Factor 4 |
|---|---|---|---|---|---|---|---|
| Comprehensive square | Olympic, Jiefang, Navy, Xiwang, Kaixuan, Shengliqiao, Renmin, Erqi, Garden Square, Minzhu, Gangwan, Wuyi, South of Railway Station, Dongguan, Sanba, Zhongshan, Youhao, Shengli, Wusi | 19 | Mean value | 2.42 | 0.33 | 0.27 | −0.09 |
| Standard deviation | 0.85 | 0.89 | 0.89 | 0.86 | |||
| Recreational square | Ocean, Hudiao, Xinghai, Huale, Xuri, Donggang Musical Fountain, Shanluan | 7 | Mean value | −2.40 | 2.02 | −0.81 | −0.68 |
| Standard deviation | 0.28 | 0.53 | 0.51 | 0.94 | |||
| Commercial service square | Malan, Huanan, Xiangzhou Road, Qiuzhi, Wenyuan | 5 | Mean value | 0.04 | −1.64 | −1.78 | −0.33 |
| Standard deviation | 0.42 | 0.80 | 0.63 | 0.85 | |||
| Traffic square | Jinwan, Houyan, South of Zhoushuizi Railway Station, Dalianmen, Shidao Street, Yingke Stone, Bayi Road, Xueyuan, Digital, Airport, Fumin, Tianhe, Donghua, Jinsanjiao, Xianglujiao, Qixing, Xinan | 17 | Mean value | −1.73 | −0.71 | 0.55 | 0.47 |
| Standard deviation | 1.05 | 0.96 | 1.24 | 1.08 |
Publisher’s Note: MDPI stays neutral with regard to jurisdictional claims in published maps and institutional affiliations. |
© 2022 by the authors. Licensee MDPI, Basel, Switzerland. This article is an open access article distributed under the terms and conditions of the Creative Commons Attribution (CC BY) license (https://creativecommons.org/licenses/by/4.0/).
Share and Cite
Gao, J.; Li, S.; Sun, D.; Zhang, Y.; Li, X. Research on the Spatio-Temporal Differentiation Characteristics and Factors of Typical Square Cities in China from the Perspective of Human Settlements. Buildings 2022, 12, 727. https://doi.org/10.3390/buildings12060727
Gao J, Li S, Sun D, Zhang Y, Li X. Research on the Spatio-Temporal Differentiation Characteristics and Factors of Typical Square Cities in China from the Perspective of Human Settlements. Buildings. 2022; 12(6):727. https://doi.org/10.3390/buildings12060727
Chicago/Turabian StyleGao, Jiaji, Songbo Li, Dongqi Sun, Yingjia Zhang, and Xueming Li. 2022. "Research on the Spatio-Temporal Differentiation Characteristics and Factors of Typical Square Cities in China from the Perspective of Human Settlements" Buildings 12, no. 6: 727. https://doi.org/10.3390/buildings12060727