Article

Influence of Different Ambient Temperatures on the Thermal Properties of Fiber-Reinforced Structural Lightweight Aggregate Concrete

1
Centre for Building Construction & Tropical Architecture (BuCTA), Faculty of Built Environment, University of Malaya, Kuala Lumpur 50603, Malaysia
2
Department of Civil Engineering, Faculty of Engineering and Quantity Surveying, INTI International University, Nilai 71800, Malaysia
3
Department of Civil Engineering, Faculty of Engineering, National Energy University, Kajang 43000, Malaysia
4
Institute of Energy Systems, School of Engineering, University of Edinburgh, Edinburgh EH9 3FB, UK
*
Authors to whom correspondence should be addressed.
Buildings 2022, 12(6), 771; https://doi.org/10.3390/buildings12060771
Submission received: 1 May 2022 / Revised: 27 May 2022 / Accepted: 3 June 2022 / Published: 6 June 2022
(This article belongs to the Section Building Materials, and Repair & Renovation)

Abstract

:
This study reports the influence of different climatic ambient temperatures on the thermal properties of fiber-reinforced lightweight aggregate concrete (LWAC). Lightweight expanded clay aggregates (LECA) with steel (ST) and polypropylene fibers were used in the mix proportions. The steady-state thermal test was performed on concrete samples at the oven-dry state with the measurement taken at six different climatic ambient temperatures of 0 °C, 10 °C, 20 °C, 30 °C, 40 °C, and 50 °C. The results show a linear dependence of thermal conductivity, specific heat, thermal diffusivity and thermal effusivity of fiber-reinforced LWACs against the different ambient temperatures. These ambient temperature variations are discussed as a function of the thermal properties of fiber-reinforced LWAC. The thermal conductivity and thermal diffusivity decrease linearly between 0 °C and 50 °C, whilst the specific heat and thermal effusivity increase linearly between 0 °C and 50 °C. Equations with strong correlations to predict thermal properties of fiber-reinforced LWAC were proposed based on the results of this study. The significance of this research is to propose the dynamic ambient temperature-dependent thermal properties equations that can be used in the energy analysis of the buildings.

1. Introduction

Highly thermal insulated buildings are the base of energy-efficient buildings, however normal concrete exhibits poor thermal properties. The thermophysical properties of a building envelope play a critical role in the thermal comfort and energy performance of the buildings [1]. Real et al. [2] found that structural lightweight aggregate concrete (LWAC) has a positive contribution to increasing energy efficiency by improving the thermal comfort in European countries regardless of the diverse outdoor conditions. Asadi et al. [3] concluded that using lightweight concrete in a building envelope is an important approach to reducing the amount of heat transfer and energy consumption due to the low thermal conductivity of lightweight concrete compared to normal weight concrete (NWC).
Currently, the energy simulation programs and published data on the insulation materials, and the thermal properties such as conductivity and specific heat, are considered to be constant and set at 24 °C regardless of the fluctuation of outdoor ambient temperatures. The thermal properties are temperature-dependent and dynamically respond to the fluctuations of outdoor ambient temperature. The proposed thermal properties temperature-dependent equations can be easily incorporated into the analysis to solve this problem.
The most common method to produce lightweight concrete commercially is to use the natural or manufactured lightweight aggregate (LWA). Natural lightweight aggregates like pumice, a froth-like volcanic rock, occur when lava expelled into the air from a volcanic source cools at a relatively fast rate [4]. The manufactured artificial LWA used in the structural lightweight concretes are typically expanded clay, expanded shale, or pumice and recycled glass. Lightweight expanded clay aggregate (LECA) is a manufactured lightweight aggregate widely used in the world. The abundant numbers of small, air-filled cavities with pore sizes ranging from 5 to 300 µm in LECA give its structural lightweight, thermal, and sound insulation characteristics.
The use of synthetic or metallic fibers such as steel, polymer, glass, carbon, and hybrid fibers has opened a new opportunity to compensate for the low mechanical properties and the brittleness of lightweight concrete [5]. Steel (ST) and polypropylene (PP) fibers are the most common fibers used in the concrete construction industry. Other types less commonly use are low modulus synthetic fibers—vinylon, nylon, polyethylene, polyester, polyvinyl alcohol, and acrylics—and high modulus synthetic fibers—aramid, glass, and carbon or natural organic cellulose—sisal, jute, coconut coil, and kenaf.
Real et al. [6] reported that plain LWAC has a thermal conductivity ranging from 0.94–1.21 W/m·K, a specific heat ranging from 932–1000 J/kg·K, and a thermal diffusivity ranging from 0.62–0.73 mm2/s set at a constant ambient temperature. Ma and Wang [7] reported that the specific heat capacity for NWC is 790–960 J/kg·K and the structural LWAC range is from 920–1000 J/kg·K. LWAC has a higher thermal mass capacity than NWC. Gül et al. [8] studied the thermo-mechanical properties of ST and PP fiber-reinforced LECA lightweight aggregate concrete. Their study showed that the addition of steel fiber will increase its mechanical strength and worsen the thermal conductivity, whilst the PP fiber has the opposite effects. However, Grabois et al. [9] mentioned the effect of steel fiber at a high dosage will decrease its mechanical strength and increase the thermal conductivity (k-value). Nagy et al. [10] concluded that increasing the ST fibers does not increase, necessarily, the thermal conductivity due to an increase in its porosity. However, there is a very limited study on both the thermal and mechanical properties of fiber-reinforced LWAC to come to conclusive results.
No study has been carried out on the thermal properties of fiber-reinforced LWAC at different ambient temperatures. Nguyen et al. [11] only study the plain LWAC and showed an increase of the conductivity with temperatures ranging from 5 °C to 35 °C and then stabilized at 35–50 °C. The Kim et al. [12] investigation of plain NWC showed a linear decrease of the conductivity with temperatures ranging from 20 °C to 60 °C. Other studies [8,9,13,14] on fiber-reinforced LWAC only gave the thermal properties of LWAC at a constant temperature. Most thermal studies focus on the high-temperature behavior of concretes [15,16,17,18,19,20,21]. The thermal conductivity generally decreases with temperature whilst its specific heat increases with temperature [22,23].
This paper aims to analyze the influence of the ambient temperature on the thermal properties of ST and PP fiber-reinforced LECA LWAC. In order to study the influence of different ambient temperatures on the thermal conductivity, specific heat, thermal diffusivity, and thermal effusivity, two sets of mix proportions are carried out with ST and PP fibers. The thermal properties of LWAC were analyzed in the ambient temperature of ranging from 0 °C to 50 °C in a step increment of 10 °C.
The first part of this paper contains the experimental details on the materials used. Secondly, fiber-reinforced LWAC mix proportions, testing procedures, and the steady-state heat flow meter (HFM) thermal test are explained. The thermal test was carried out using a Fox 50 HFM device. Thermal conductivity and specific heat were measured directly and their diffusivity and effusivity are deduced. In the last section, the main results on ambient temperature-dependent thermal properties of fiber-reinforced LWAC were analyzed and discussed together with the proposed equations to predict the different thermal properties.
The significance of this research is to propose the dynamic ambient temperature-dependent thermal properties equations that can be used for the library of the energy modelling software when conducting the energy analysis of the buildings using fiber-reinforced LECA LWAC material.

2. Materials and Methods
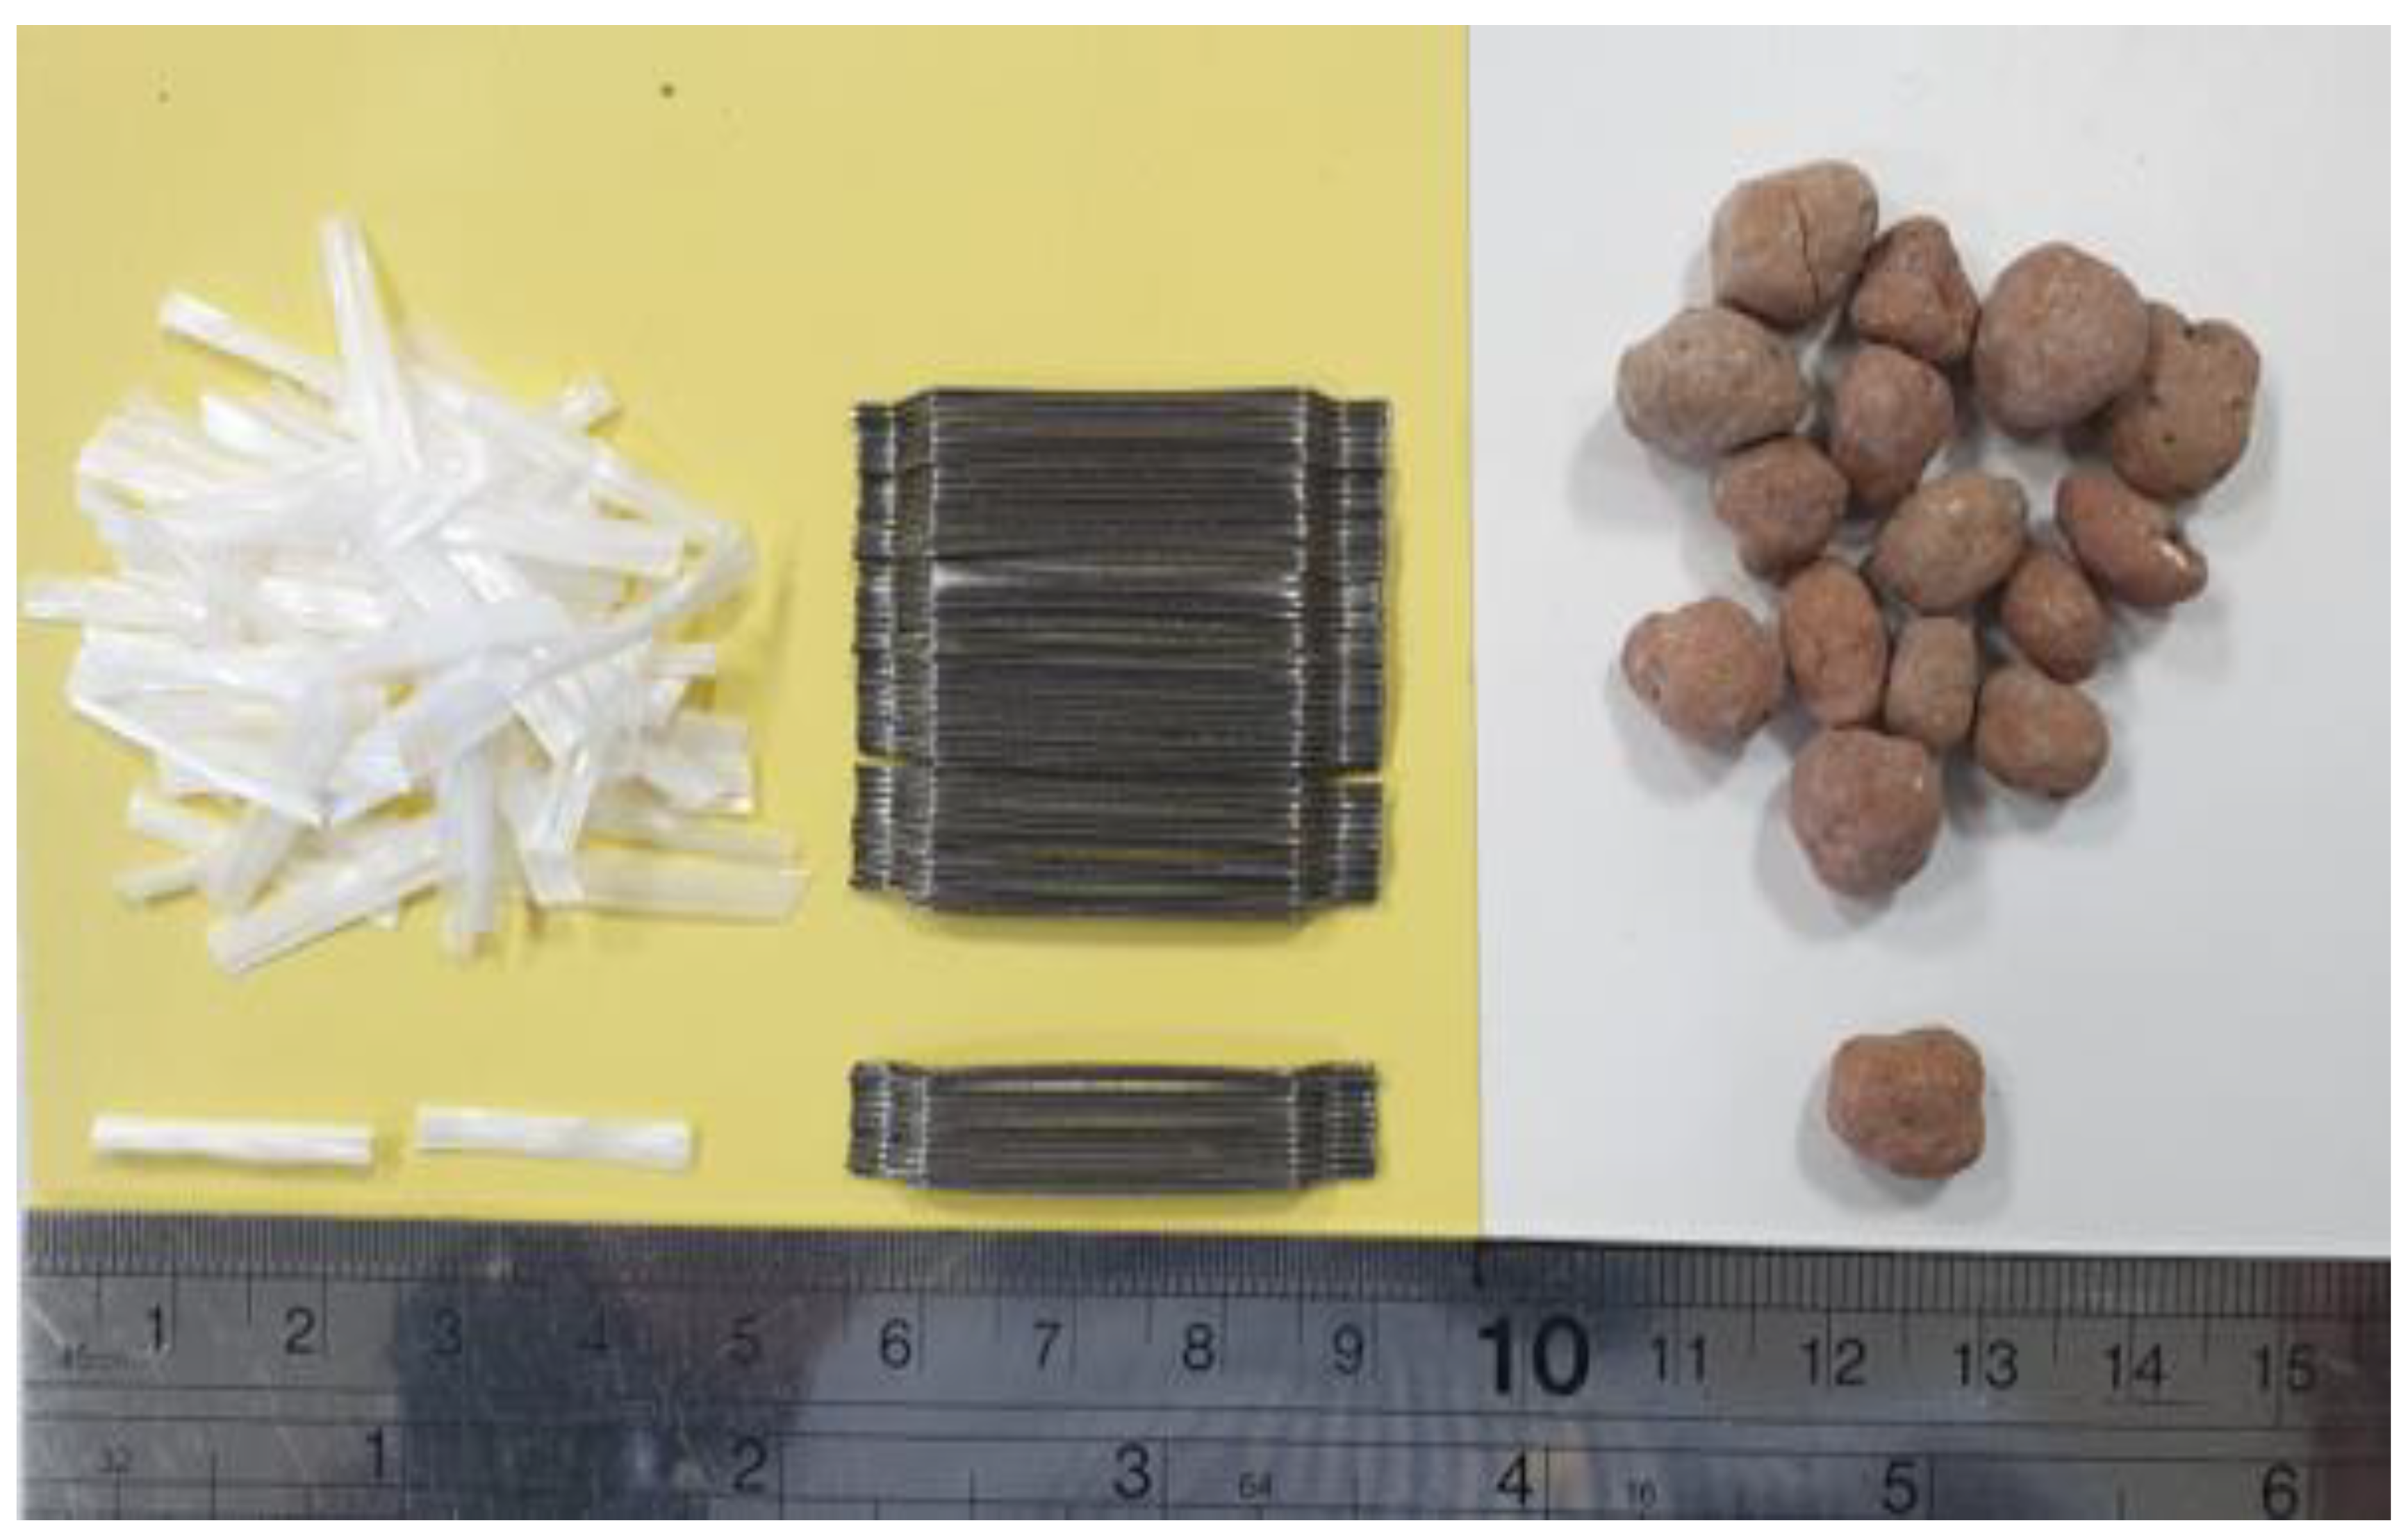
2.1. Materials

ASTM Type 1 cement with a specific gravity of 3.14 and a Blaine fineness of 3510 cm2/g was used. Ground granulated blast furnace slag (GGBFS) is a byproduct of the steel mill industry and is also used as a mineral admixture in concrete production. GGBFS has been used for better thermal conductivity and workability. The GGBFS has a specific gravity (S.G) of 2.9 or a density of 2900 kg/m3 and a Blaine fineness of 4050 cm2/g. The chemical compositions of the cement and GGBFS are shown in Table 1.
The fine aggregate was from a local mining site with a fineness modulus of 2.69, a saturated surface dry (SSD) specific gravity of 2.61, water absorption of 1.5%, and maximum particle size of 4.75 mm.
LECA was a manufactured lightweight aggregate with a specific gravity, bulk density, and 24 h of water absorption of 1.52, 780 kg/m3, and 17.68%, respectively. The maximum grain size of LECA was limited to 12.5 mm for lower thermal conductivity of the LWAC, whilst higher than that value will cause the floatation of the mix. The chemical compositions of LECA, obtained from the Energy Dispersive X-ray Fluorescence (EDXFR) analysis, is shown in Table 2. As can be seen in this table, LECA aggregate contains a high percentage of quartz (SiO2), hematite (Fe2O3), corundum (Al2O3), and calcium oxide (CaO). Both of these oxides constitute about 90.5% by mass of the aggregate.
The superplasticizer (SP) used is Sika Viscocrete-2192 modified polycarboxylate conforms to BS EN 934-2:2009. The recommended dosage for medium workability and high-strength concrete is 1.0% by weight of cement.
Two types of fiber configurations, namely ST and PP with different dosages, were used as fiber reinforcement. The physical and mechanical properties of these fibers are shown in Table 3.
Figure 1 shows PP fibers with a length of 19 mm, hooked-end ST fibers of 35 mm length, and LECA aggregates.

2.2. Mix Design and Mixing Procedure

The amount of lightweight aggregate, cement, ground granulated blast-furnace slag (GBBFS), sand, water–cement ratio, and superplasticizer were kept constant in all the mix proportions while fiber contents were different in nine mixtures.
LECA aggregates were pre-soaked in water for 30 min and then aggregates in saturated surface dry (SSD) condition were used. Aggregates and one-third of ST fiber, if any, were mixed for 2 min, and then cement and GBBFS were added and mixed for another 3 min. The remaining mixing water with the SP was then added and mixed for an additional 5 min. The remaining ST fibers or a specific amount of PP fibers, if any, were added and mixed for another 4 min. All the specimens are demolded after 24 h and submerged in water until the time of testing. The mechanical strength test is carried out at 28 days to BS EN 12390-4:2009 standard.
Table 4 shows the mix proportions and physical and compressive strength of plain LWAC, ST, and PP fiber-reinforced LWAC.

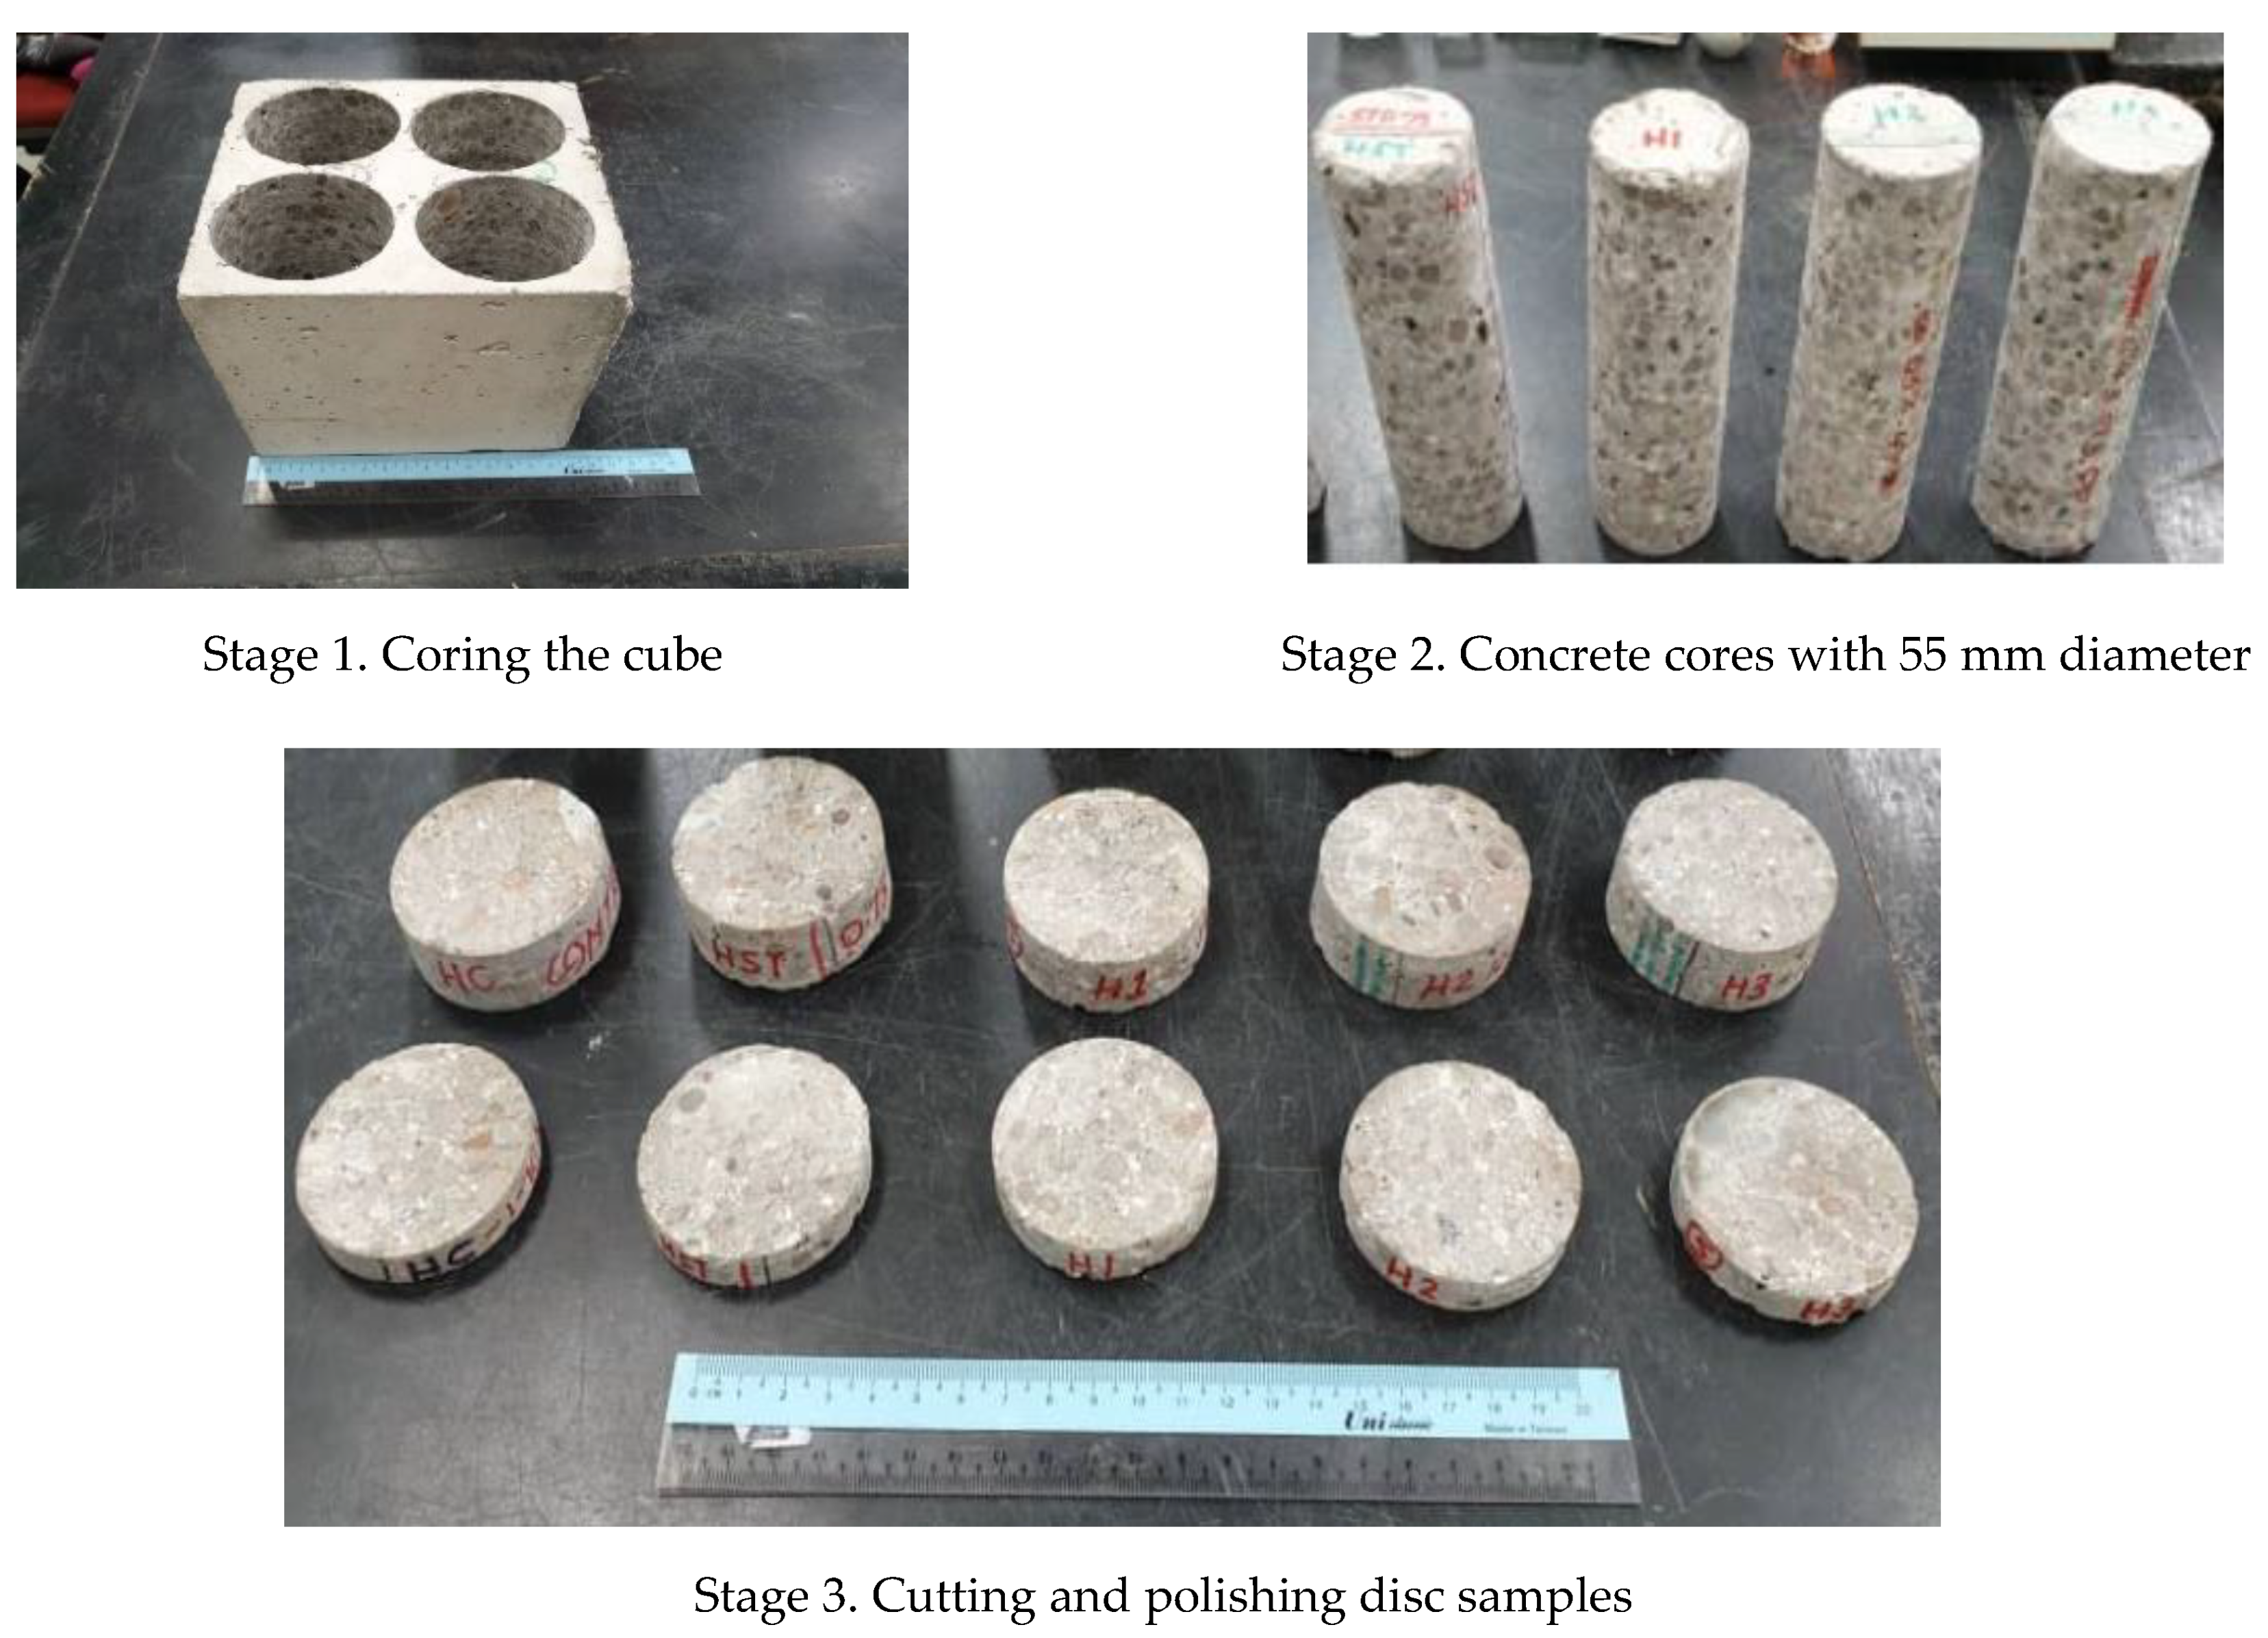
2.3. Experimental Procedure

Experimental procedures for density are based on ASTM C567/C567M-19 [24] and fresh properties [25,26], and mechanical properties are based on BS EN standard [27]. The stages of the sample preparation of the thermal test in the Fox 50 Heat Flow Meter instrument are shown in Figure 2.
Fox 50 Heat Flow Meter and its auxiliary unit arrangement, as shown in Figure 3, are used to measure the thermal conductivity and volumetric specific heat of the samples to ASTM C518 [28] and ASTM C1784 [29], respectively.
Thermal conductivity characterizes the ability of a material to conduct heat. It quantifies the quantity of heat transferred, under the steady-state, through a unit thickness in a direction normal to a surface of a unit area, and due to a unit temperature gradient. Specific heat capacity (Cp-value) and volumetric heat capacity characterize the ability of a material to store heat. The specific heat capacity is the amount of heat per unit mass required to raise the temperature by one degree Celsius, while the volumetric heat capacity is related to a unit of volume.
The general principle of the heat flow meter instruments is based on the one-dimensional equation for the Fourier law in the steady-state as indicated in Equation (1) below:
q =   Δ T ( x ) · k = S c a l   Q  
where q is the heat flux in W/m2 flowing through the sample, ΔT is the temperature change in °K, k is the thermal conductivity in W/mK of the sample, x is sample thickness in meter, Q is the electric output of the heat flow meter, and Scal is the calibration factor of the heat flow meter. Calibration factor, Scal, can be determined from Equation (3) as follows:
S c a l = k c a l · Δ T · ( Q 1 Q 2 )         ( Δ x 2 Δ x 1   ) · ( Q 1 · Q 2 )    
where Scal is the temperature-dependent calibration factor in W/(m2·μV), Q1 and Q2 are the signal values of two separate tests in μV, and Δx1 and Δx2 are the thicknesses of two separate specimens in meter. The Fox 50 apparatus transducer is calibrated using Pyrex 7740 as a reference standard material for the test. Two rubber sheets are used between the specimen surfaces and the apparatus plates to eliminate the air gap and poor contact for the thermal conductivity test.
The specific heat value is then calculated from Equation (3) as described below:
Cp ρ = (HTHHFMs)/x
where Cp is the specific heat of the specimen in J/(m3 K), ρ is the density in kg/m3), H is the amount of heat energy per square meter in J/m2, HHFMs is the correction factor to remove the effect of the plates in J/(m2 K, ΔT is the temperature change in °K, and x is the thickness of the specimen in meter.
The method follows the ASTM C1784-13 based on the amount of heat absorbed by the specimen, which can be calculated from the heat flow meter readings as shown in Equation (4):
H = i = 1 n τ · [ S U c a l   · (   Q U i   Q U e q u i l   ) +   S L c a l   · ( Q L i   Q U e q u i l   ) ]  
where H is the amount of heat energy given per square meter in J/m2, τ is the time interval in seconds, SUcal is the calibration factor of the upper plate in W/(m2·μV), SLcal is the calibration factor of a lower plate in W/(m2·μV), QUi is the Heat Flow Meter signal value of the upper plate in μV, QLi is the HFM signal value of the lower plate in μV, QUequil is the HFM signal at the final steady-state, the upper plate is μV, and QLequil is the HFM signal at the final steady-state, and the lower plate is μV.
The thermal conductivity and specific heat tests were conducted at different ambient temperatures of 0 °C, 10 °C, 20 °C, 30 °C, 40 °C, and 50 °C. Six samples for each set were used for the HFM Fox 50 thermal test, and the mean values and coefficient of variations (COVs) were tabulated. The samples are oven-dried at 100 °C for 24 h in the oven and later kept in the vacuum desiccator before the thermal test. The thermal test is carried out after 60 days.
The experimental procedures and analysis that are put in place to produce a reliable result and to minimize the errors in Fox 50 thermal conductivity and specific heat measurement are as below.
i.
Two thicknesses of 10 mm and 20 mm of the disc samples are run. The 10 mm thickness is to minimize lateral heat loss and the 20 mm thickness to allow the maximum 12 mm LECA aggregate size effect. The average value is taken from the two thicknesses.
ii.
The parallelism of the sample surfaces is of importance with less than a 1% gradient, which is less than the +0.55 mm thickness variation at the opposite ends.
iii.
Reject surfaces with macro-voids and repair any surfaces with micro-pores.
iv.
Surfaces are grinded and polished to P800 sanding to provide good surface contacts.
v.
Rubber sheets are used to minimize the air gap between the two isothermal plates and the surfaces of the sample.
vi.
An average of 6 running samples are run to get the mean values and their COVs.
Water absorption values are measured to ASTM C642-13. The ST fiber and PP fiber LWAC in this experiment have the final water absorption ranging from 3.44–4.64% and 4.19–4.88%, respectively. These values are still less than the criteria reported for quality concrete. Concrete with final water absorption of up to 5% is considered a good quality concrete for durability [30].
The porosity test method is based on evacuating air from the oven-dried samples and then allowing the water to fill the pores under a vacuum to reach full saturation. The ST fiber and PP fiber LWAC have a porosity between 4.90–5.94% and 5.25–6.14%, respectively. The porosity of high strength NWC with 0–2%VF of steel fiber varies between 7.3–7.6% [31]. The porosity values obtained for ST and PP fibers LECA LWAC are less than the ST fiber-reinforced high-strength NWC.

3. Results and Discussion

The mechanical and thermal performances of fiber-reinforced LWAC are strongly dependent on density, porosity, and different ambient temperatures. The dependence of the thermal properties on the different ambient temperatures was discussed in this section. Firstly, the physical and mechanical properties of the fiber-reinforced LWAC are briefly described. Secondly, the density, compressive strength, and porosity were investigated. Finally, the influence of the different ambient temperatures from 0 °C to 50 °C with 10 °C steps on the thermal properties was discussed with the proposed equations.

3.1. Physical and Mechanical Properties

The test results of the Vebe time, slump values, oven-dry density, and compressive strength are given in Table 2. Results show that the Vebe time increases and slump decreases as the fiber dosage increases. The ST fiber Vebe time ranges from 6–16 s and slump values range from 55–5 mm as the ST fiber dosage increases from 0.25% to 1.5% VF. The PP fiber Vebe time ranges from 4 to 8 sec and slump values range from 70 to 40 mm as the PP fiber dosage increases from 0.25% to 1.5% VF. The ST fiber has a more drastic effect than the PP fiber on the Vebe time and slump values. Lamond and Pielert [32] mentioned that a Vebe time range from 3 to 10 sec indicates adequate workability. Mehta and Monterio [33] reported that a 50–75 mm slump may be sufficient for the good workability of LWAC. ACI 213R-03 recommends a maximum limit of 125 mm slump to achieve a good floor finish [34].
The ST fibers have a density range from 1831 to 1951 kg/m3 as the fiber dosage increases from 0 to 1.5%. PP fiber density decreases from 1776 kg/m3 to 1688 kg/m3 as its fiber dosage increases from 0.1% to 0.3%. The ST fibers have a compressive strength increasing from 47.1 to 54.1 MPa as the fiber dosage increases from 0% to 1.0%VF. However, the compressive strength for ST fiber decreases from 1.5% VF to 47.4 MPa. The PP fiber increases from 46.3 to 48.9 MPa, and its fiber dosage increases from 0.1% to 0.2%VF. However, the compressive strength for PP fiber decreases from 0.3% VF to 44.9 MPa. This trend also has been observed by other researchers [5,35,36]. The fiber-reinforced LWACs fall into the structural LWC class 13-88 MPa with a density of less than 2000 kg/m3 in accordance with BS EN206-1. Other research [37,38,39] has produced similar compressive strength with almost the same cement content. The compressive strength of expanded shale (Asanolite) LWAC reinforced with ST and synthetic fibers vary between 29.0–46.1 MPa with a cement content of 422–490 kg/m3 [37]. Corinaldesi and Moriconi [38] investigated that the compressive strength of LECA LWAC reinforced with PP and macrofibres varies between 40.3–54.5 MPa with a cement/pulverized fuel ash content of 560/112 kg/m3. Zhao et al. [39] studied that the compressive strength of expanded shale LWAC reinforced with crimp ST fibers varies between 43.8–53.1 MPa with a cement/pulverized fuel ash content of 440/110 kg/m3.
In LWAC, the compressive load path travels to the cement matrix as it is stronger than the lightweight aggregate [40]. As such, the cement content plays a critical role in the compressive strength of the LWAC. In fiber-reinforced LWAC, the higher compressive strength is achieved usually by higher cement content, minimizing the size of the coarse aggregate and using fibers with a higher E-Modulus. The compressive strength increases with the addition of fibers due to the random fibers and mortar matrix around coarse aggregates forming a network space truss-like structural system where the fibers act as a tie and the concrete matrix acts as a strut when the internal forces are transferred in the concrete. The role of the fibers is to enhance the mechanical strength of the LWAC, however, it needs to be at an optimum VF to be effective. However, at a higher VF, the decrease in the compressive strength is the difficulty of dispersing the fibers in the mix—fibers form a close network structure that hindered the flow of the mix aggregates—which causes poor workability, air voids, and incomplete compaction [41].

3.2. Influence of the Ambient Temperature on the Thermal Properties of Fibre-Reinforced LWAC

The mean values with their COVs of the thermal properties are given in Table 5, Table 6, Table 7 and Table 8. The Fox-50 thermal measurements for thermal conductivity and specific heat are based on the steady-state heat-flow method and have higher accuracy than the transient method. Each measurement of data point would take about an hour, and each sample requires six data points of ambient temperatures that would take about 6 h of measurement to complete. The accuracy of each equation is ensured by the mean values of six samples with their COVs and the regression R2 value. Each sample needs a reading of a six-step of 0 °C, 10 °C, 20 °C, 30 °C, 40 °C, and 50 °C temperatures. The mean values of six samples are then used to plot each equation. Statistically, the coefficient of variation (COV) is evaluated to verify the accuracy of the mean values obtained in the experiment.

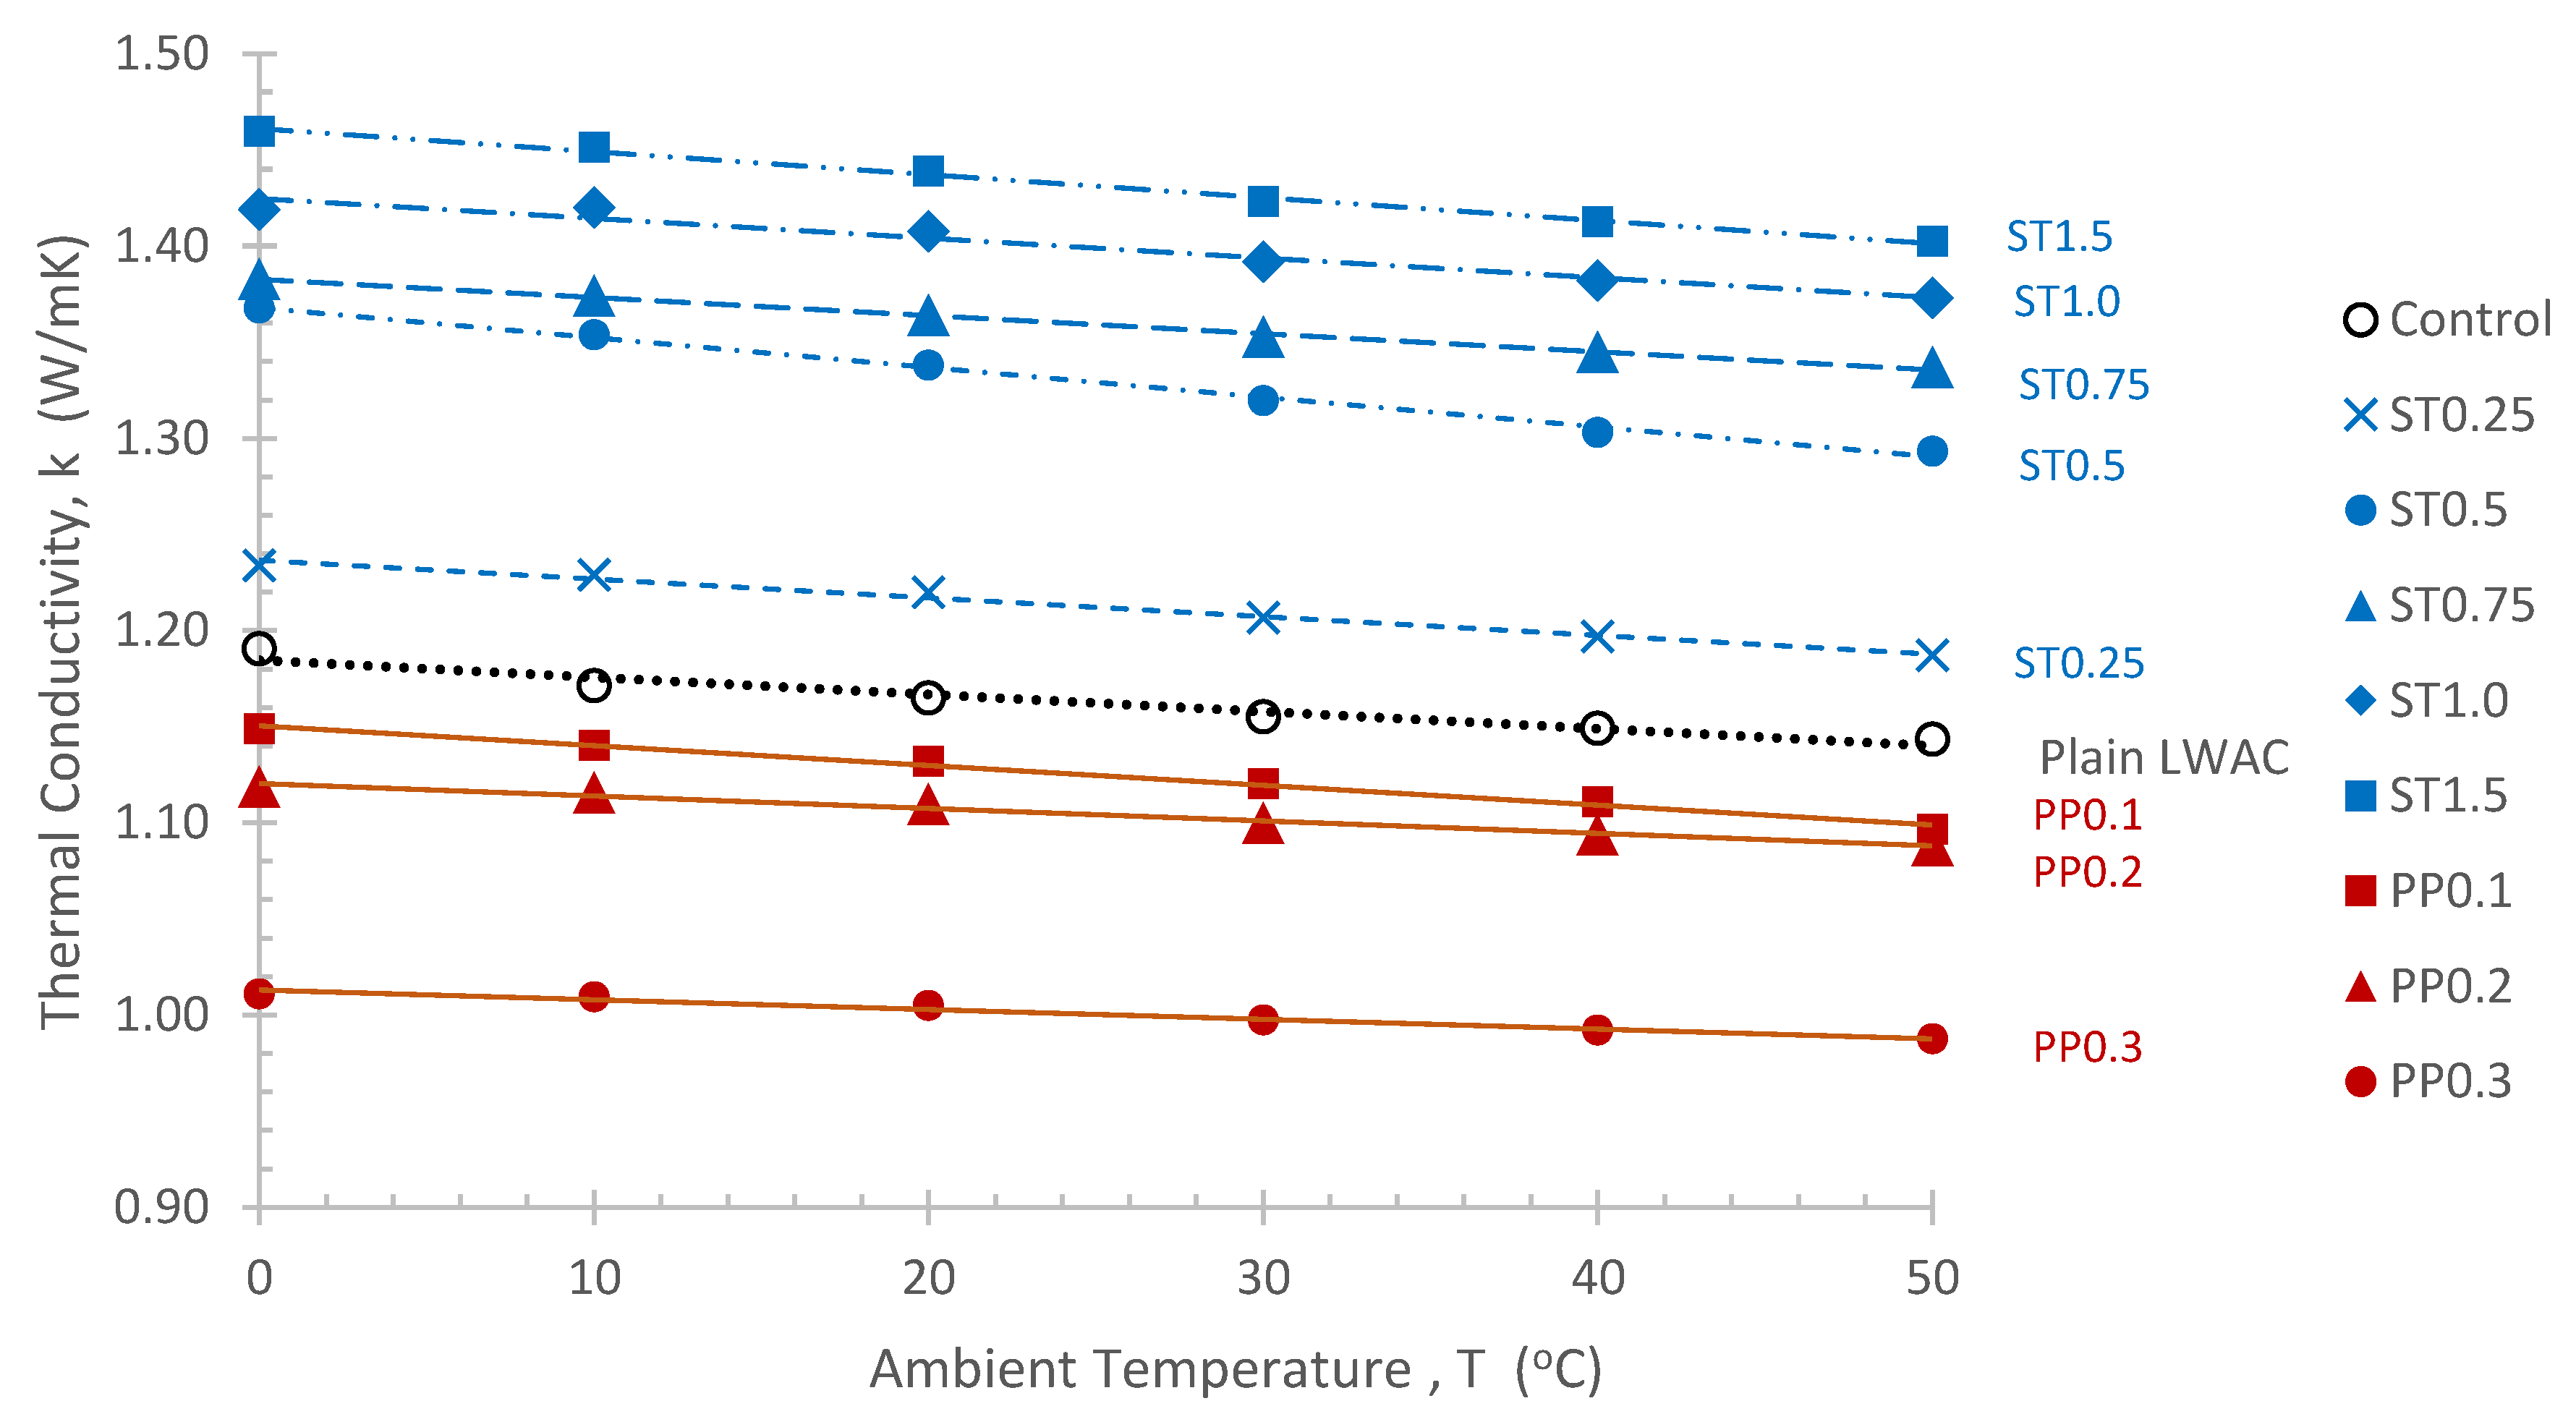
3.2.1. Thermal Conductivity

The mean values of thermal conductivity with their COVs against the ambient set temperatures are given in Table 5. The COV for thermal conductivity obtained from the experiment ranges from 2.88 to 12.28%, which is adequate for scientific use due to the non-homogeneity nature of fiber-reinforced LWAC.
Figure 4 illustrates the relationship between thermal conductivity and different ambient temperatures.
The relationship shows that thermal conductivities decrease as the specimen temperature increases while a similar trend exists for both ST and PP fiber. The rate of decrease of 0.001 W/mK per K is almost similar for all the fibers and the control, except for PP0.2 and PP0.3, where the rate of decrease is much lower. ST and PP fiber show a very strong linear correlation between thermal conductivity and temperature. The equations show that as the temperature increases, the thermal conductivity starts to decrease linearly for the ST and PP fibers. Since the PP fiber is less conductive than the ST fiber, its thermal conductivity is much lower than the ST. The PP fiber will decrease the thermal conductivity up to 15% below the plain LWAC (control). The ST fiber will increase the thermal conductivity up to 23% above the plain LWAC (control).
Table 6 shows the relevant equations for the thermal conductivity against the ambient temperatures for all concretes. These equations can be used to predict the dynamic response of the thermal conductivity of the ST and PP LECA fiber-reinforced LWAC at different ambient temperatures when conducting the energy analysis.
The measured thermal conductivity for ST and PP fiber concretes ranged from 1.185–1.4415 W/mK and 0.9762–1.1377 W/mK, respectively. Therefore, in terms of fiber category, PP fiber concrete has a much lower conductivity than ST fiber concrete. NWC concrete has a much higher thermal conductivity of 2.250 W/mK, as compared with the fiber-reinforced lightweight concrete [42].
Kim et al. [12], Morabito [22], Khaliq and Kodur [23], and Jansson [43] also reported that thermal conductivity decreases with an increase in temperature. Khaliq and Kodur [23] study the ST, PP, and ST–PP hybrid for self-compacting NWC, and that ST has the highest thermal conductivity, followed by the ST–PP hybrid, and the lowest is the PP. The thermal conductivity decreases almost linearly within the temperature range from 20–400 °C. This modification is due to the contribution of higher thermal conductivity of ST fiber as compared to PP fiber. Patti and Acierno [44] study that thermal conductivity of PP fiber material initially decreased from 0.25 to 0.15 W/mK as the temperature rose between 25 and 125 °C, then underwent a sudden peak of 0.47 W/mK during the melting process, and finally decreased.
In lightweight aggregate, Sajedi et al. [45] mentioned that the water-accessible porosity can reach up to 32%. There may be also closed pores that contain air and/or trapped water. The physically bound water is not all removed after drying in the oven at 100 °C. The thermal expansion may increase the air gap at the fiber–cement interfacial transition zone (ITZ) and contribute to the decrease in thermal conductivity. The fiber also provides the 3-D network of an interconnected pathway for the release of trapped water in the pores as the temperature increases. The physically bound water is not all removed after drying in the oven at 100 °C. The decrease in thermal conductivity could be further explained by the loss of conductive bonds in concrete due to the departure of physically and chemically bound water [46]. The occurrence of microcracks at the ITZ could also contribute to the decrease in conductivity. These microcracks could be generated by the differential thermal expansion and the occurrence of stresses at the paste–aggregate interface [11]. A percolation threshold is a point where the capillary pore space no longer percolates in the transport processes. This percolation threshold exists when pieces of the capillary pore space will be trapped and cut off from the main pore network with the hydration products, thus reducing the fraction of the pores that form a connected pathway for transport. The fast transport of water or ions through the relatively large capillary pore system would end, and slow transport would then be regulated by the smaller C-S-H gel pores (pore product) of roughly 10 nm size [47].
The trapped water in the cut-off capillary pore space, C-S-H gel pores, micro-cracks at ITZ, and micro-gaps at the fiber–cement interface undergo a solid–liquid–vapor phase as the temperature increases, causing a decrease in thermal conductivity as the temperature increases.
The proposed prediction equations between the thermodynamic parameter of thermal conductivity and other thermal properties at different ambient temperatures should be used against the real response of climatic temperatures in the energy building analysis rather than the static standard temperature of 24 °C due to its significance.

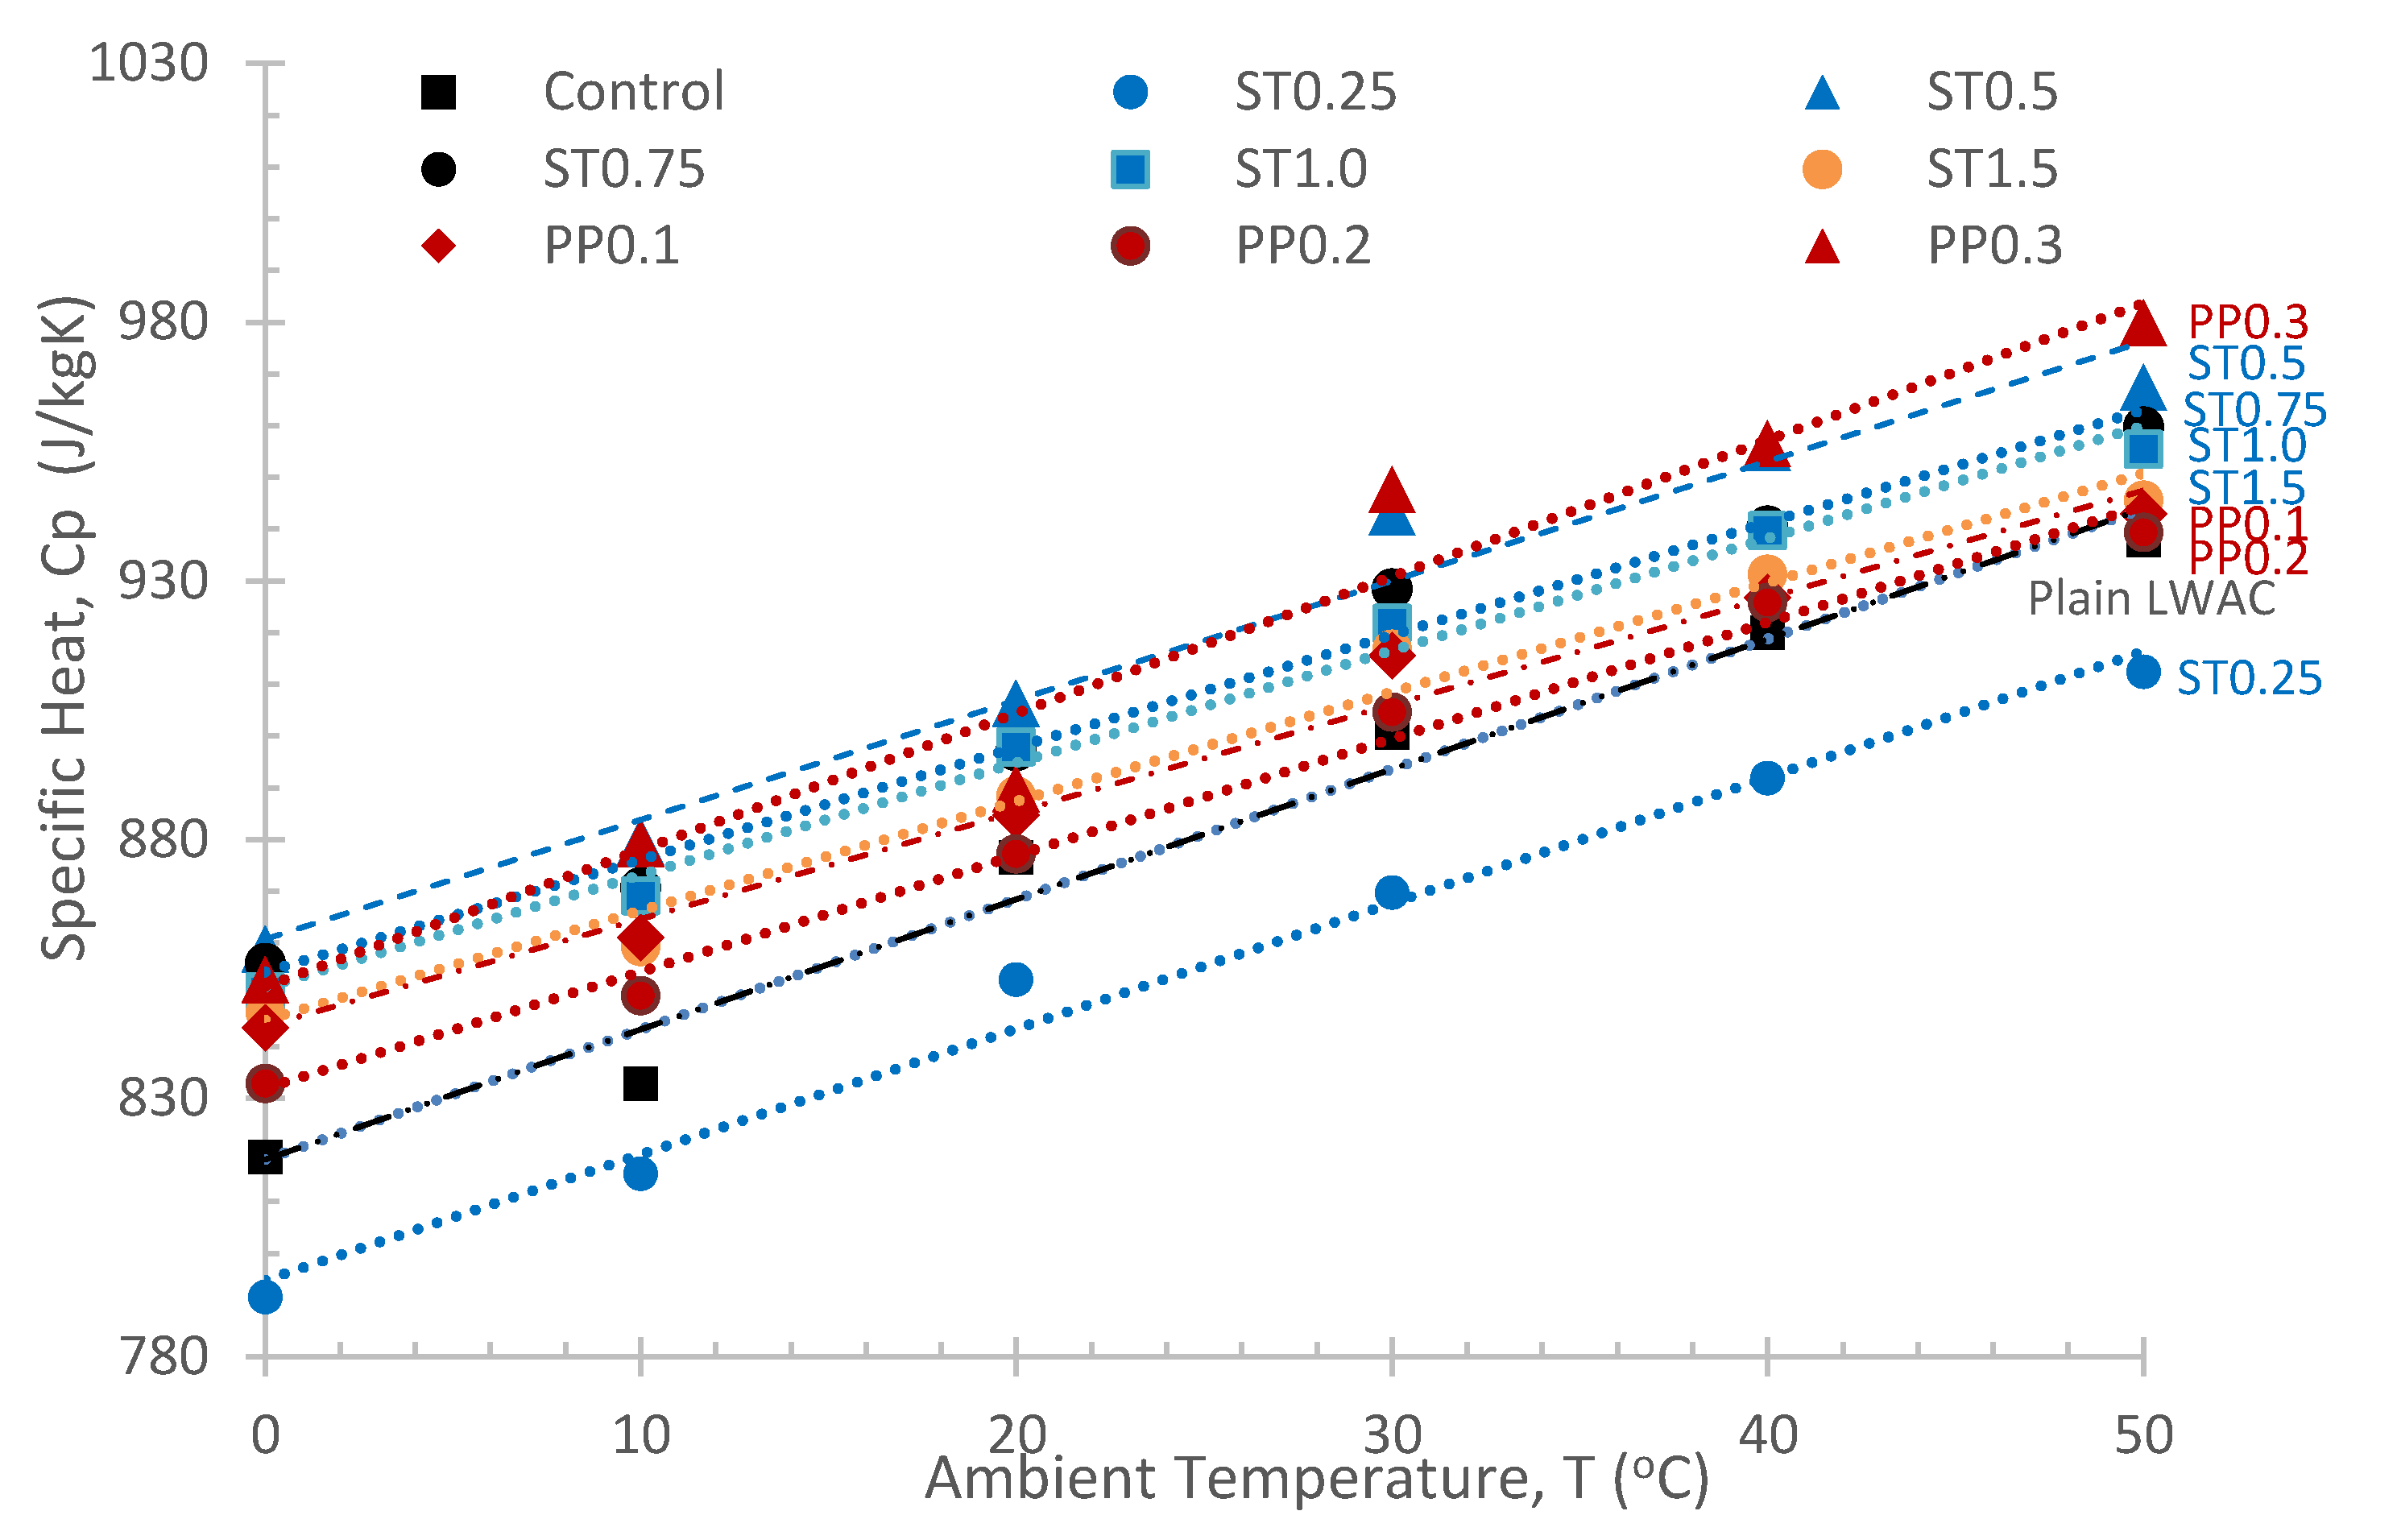
3.2.2. Specific Heat

Real et al. [2] studied LWAC with a specific heat range from 932–1000 J/kgK and an NWC with a specific heat of 741 J/kgK. Ma and Wang [7] reported that the specific heat capacity of structural LWC range from 920–1000 J/kgK and NWC is 790–960 J/kgK. In this study, the ST and PP fiber have a specific heat range from 791–967 J/kgK and 833–980 J/kgK respectively against the ambient temperature. In terms of fiber category, the PP fiber has the highest specific heat followed by ST. NWC concrete has a much higher thermal conductivity of 924 J/kgK, as compared with the fiber-reinforced lightweight concrete [42].
The mean values of specific heat with their COVs against the ambient set temperatures are given in Table 7. The COV for specific heat obtained from the experiment ranges from 0.94 to 8.70% is good for scientific use.
Figure 5 shows the relationship between the specific heat with different ambient temperatures from 0–50 °C. The ST and PP fiber concrete have a very strong linear correlation between specific heat and the temperature with a minimum R2 of 0.9597. The relationship shows that as the temperature increases, the specific heat increases linearly. The variation of the specific heat as a function of temperature is significant for LWAC. Neville [48] and Mindess [49] noticed the dependence of the specific heat on the temperature for the cement pastes and NWC. The rise of specific heat with the temperature increase is due to the specific heat evolutions of the mineral phases in concrete. EDXFR analysis of LECA expanded clay aggregate as in Table 2 contains a lot of mineral phases. The LECA aggregate has 53.5% of quartz, 24.5% of corundum, 8.98% hematite, and calcium oxide 3.57% in its composition.
According to several authors [50,51,52], the specific heat of minerals is a thermodynamic parameter varying as a function of temperature. Hemingway [53] proposed the specific heat capacity of quartz as Cp = 81.1447 + 0.0182834T + 5.4058 × 10⁻⁶T2 − 698.458T−0.5 − 180986T−2, with a valid range from 298.15 to 1000 °K, that showed an increase in specific heat with the temperature rise. Vua et al. [51] proposed the specific heat of hematite as Cp = −0.276 + 5.26 × 10⁻³T − 7.85 × 10⁻⁶T2 + 3.35 × 10⁻⁹T3 + 145T−2, with a valid range from 130 to 325 °K, that showed an increase in specific heat with the temperature rise. Gesellschaft [52] mentioned that the specific heat for quartz (SiO2), hematite (Fe2O3), corundum (Al2O3), and calcium oxide (CaO) between 100–1200 °C ranges from 746–980 J/kgK, 676–960 J/kgK, 866–1152 J/kgK, and 790–904 J/kgK, respectively.
Table 8 shows the equations of the specific heat against different ambient temperatures for the ST and PP fiber concretes.
These equations can be used to predict the dynamic response of the specific heat of the ST and PP LECA fiber-reinforced LWAC at different ambient temperatures when conducting the energy analysis.
The rate of specific heat increases per unit rise in temperature is different for each ST fiber with the highest being ST0.5 (2.3091 J/kgK) and the lowest ST1.5 (2.1121 J/kgK). The rate of specific heat increases, and the per unit rise in temperature is highest for PP0.3 (2.6403 J/kgK) and lowest for PP0.1 (2.0699 J/kgK). Thus, increasing the amount of PP fiber will provide a good thermal mass capacity for LWAC.
The presence of fiber also has a significant influence on the specific heat of fiber-reinforced LWAC as compared to plain LWAC (control). In terms of fiber category, PP0.3 has the highest specific heat followed by ST0.5. The evolution of high specific heat with temperature can be explained by the presence of the fiber, minerals composition of the aggregates and cement and trapped water in the close pores. The increase in higher specific heat can also be attributed to the heat of dehydration of cement with the chemically bound water.

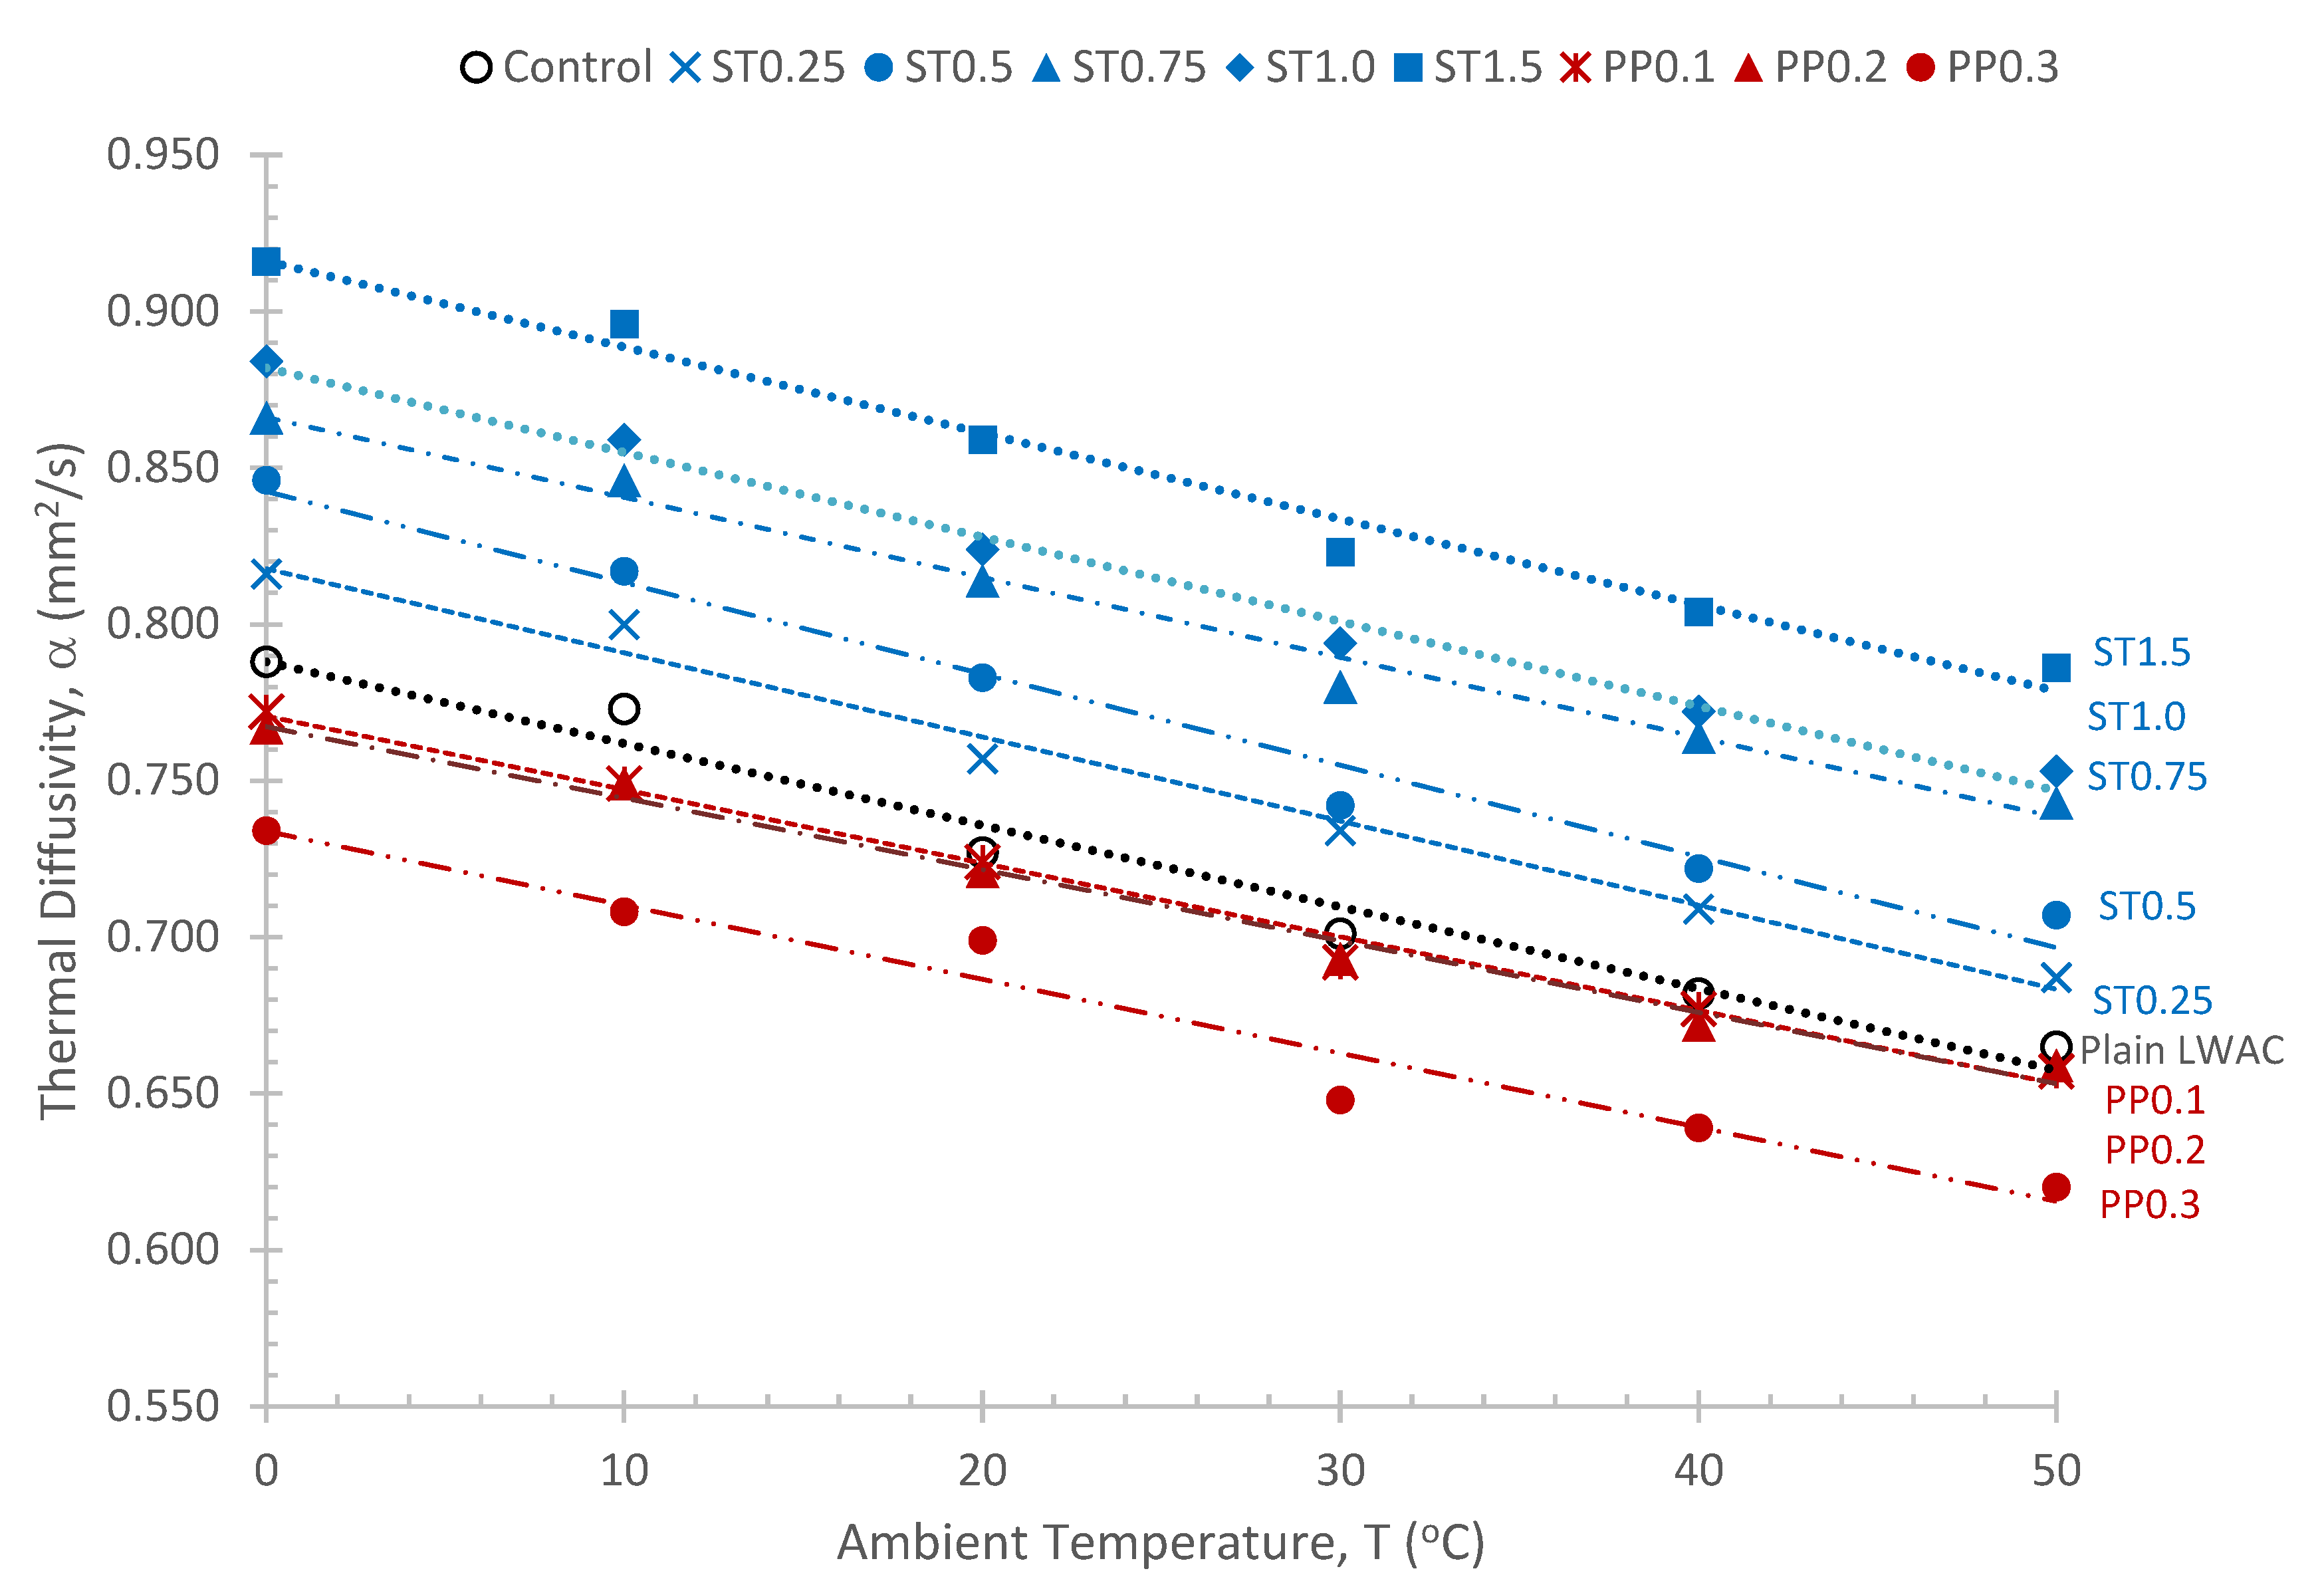
3.2.3. Thermal Diffusivity

Thermal diffusivity measures the ability of a material to conduct thermal energy relative to its ability to store it [2]. It describes the amount of time needed for a material to reach thermal equilibrium with its surroundings.
The thermal diffusivity equation is given in Equation (5) by Roberz et al. [53] as follows:
α = k ρ C p       ( m 2 / s   unit )
where k = thermal conductivity (W/mK), ρ = the density (kg/m3), and Cp is the specific heat capacity (J/kgK). In this study, the ST and PP fiber have a thermal diffusivity range from 0.687–0.916 mm2/s and 0.620–0.772 mm2/s, respectively, against ambient temperature. Overall, the ST has the highest diffusivity followed by PP.
The thermal diffusivity mean values with their COVs against the ambient set temperatures are given in Table 9. The COV obtained ranges from 3.04 to 10.78% is satisfactory for scientific use.
Figure 6 illustrates a very strong linear correlation between specific heat and different ambient temperature variations. The relationship shows that as the ambient temperature increases, the thermal diffusivity decreases linearly.
The thermal diffusivity evolution results are the derivative of the ratio of thermal conductivity and heat capacity. As the thermal conductivity decreases and specific heat increases with temperature, the thermal diffusivity will decrease with the rise of the ambient temperature.
Table 10 shows the equations for thermal diffusivity against different ambient temperatures for the ST and PP fiber concretes.
These equations can be used to predict the dynamic response of the thermal diffusivity of the ST and PP LECA fiber-reinforced LWAC at different ambient temperatures. The presence of fiber also has a significant influence on the thermal diffusivity of fiber-reinforced LWAC as compared to its plain LWAC (control). The ST fiber has a higher diffusivity than PP fiber. Real et al. [2] measured the thermal diffusivity of plain LECA LWAC with the value of 0.70 mm2/s at a constant temperature of 24 °C which is comparable with the value for the plain LWAC in this experiment. The ultra LWC has a much lower thermal diffusivity of 0.2 mm2/s, as compared with the NWC of 0.97 mm2/s [49].

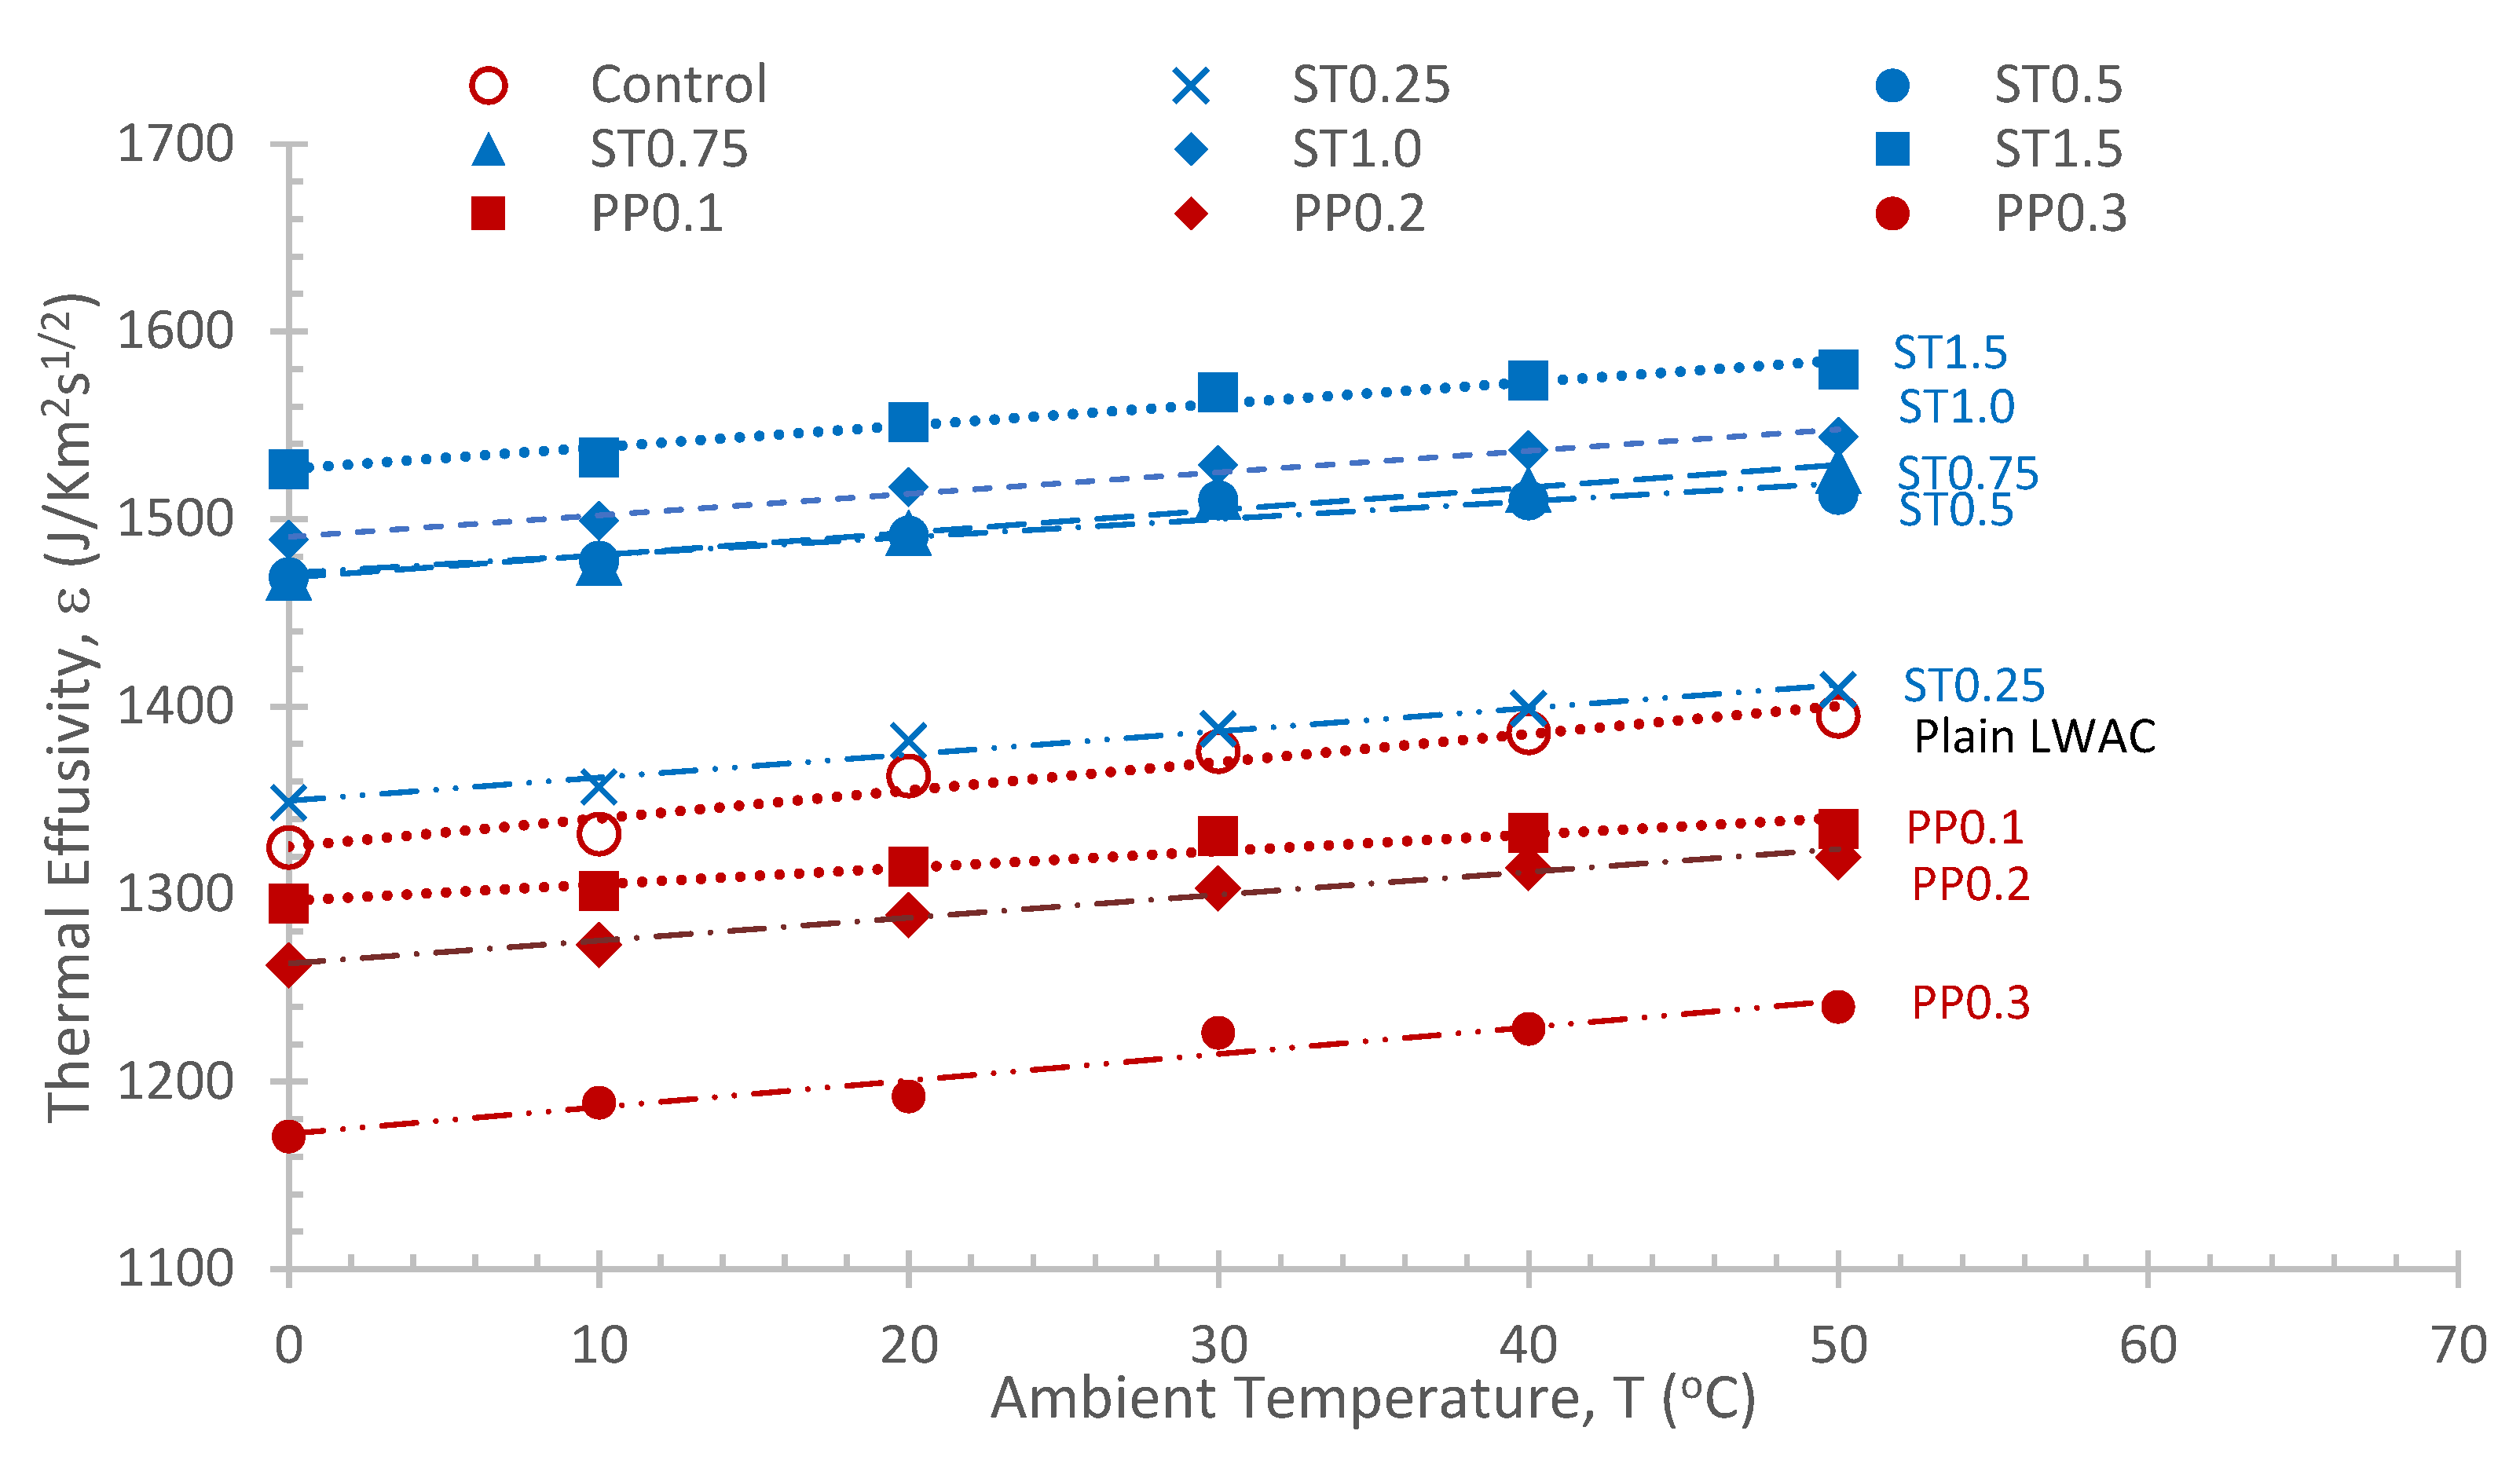
3.2.4. Thermal Effusivity

Thermal effusivity measures the material’s ability to exchange heat with the environment. It is sometimes referred to as the heat penetration coefficient is the rate at which a material can absorb heat. The thermal effusivity equation is given in Equation (6) by Roberz et al. [53] as follows:
ε = k ρ C p     ( J / Km 2 s 1 / 2   unit )
where k = thermal conductivity (W/mK), ρ = the density (kg/m3), and Cp is the specific heat capacity (J/kgK).
The thermal effusivity mean values with their COVs against the ambient set temperatures are given in Table 11. The COV obtained ranges from 1.85 to 8.95% which is good for scientific use.
Figure 7 shows the relationship between the thermal effusivity with the variation of ambient temperature from 0–50 °C. The thermal effusivity evolution results are the derivative of the product of thermal conductivity and heat capacity. As the thermal conductivity decreases and specific heat increases with temperature, the net product of thermal effusivity will increase with the rise of the ambient temperature.
The presence of fiber also has a significant influence on the thermal effusivity of fiber-reinforced LWAC as compared with plain LWAC. Based on the experimental results, the ST and PP fibers have a thermal effusivity range from 1349–1580 J/Km2s1/2 and 1171–1335 J/Km2s1/2, respectively, against different ambient temperature. The ST fiber has a higher effusivity than PP fiber.
Real et al. [2] measured the thermal effusivity of plain LECA LWAC equal to 1350 J/Km2s1/2 at a set temperature of 24 °C, which is comparable with the value of plain LWAC in this experiment. NWC concrete has a much higher thermal effusivity of 2019 J/Km2s1/2 as compared with the ultra-lightweight concrete of 312 J/Km2s1/2 [53]. Jin et al. [54] indicated the preference for the building material with low thermal diffusivity would lead to higher time lag and lower decrement factor in the tropical regions. As such, building envelope materials with low thermal diffusivity are of importance for the energy savings and thermal comfort of the building.
Table 12 shows the equations of the thermal effusivity against the ambient temperatures for the ST and PP fibers LECA LWAC. These equations can be used to predict the dynamic response of the thermal effusivity of the ST and PP LECA fiber-reinforced LWAC at different ambient temperatures.

4. Conclusions

In this study, the thermal properties of steel (ST) and polypropylene (PP) fiber-reinforced expanded clay LWAC at different climatic ambient temperatures from 0 to 50 °C were investigated. From the results and data analysis, the following conclusions could be drawn.
  • The ST and PP fiber LWAC have a thermal conductivity ranging from 1.185–1.4415 W/mK and 0.9762–1.1377 W/mK, respectively, when the ambient temperature is within 0 °C to 50 °C. In terms of fiber category, the ST fiber LWAC had a higher conductivity than PP fiber and plain LWAC.
  • The ST and PP fiber LWAC have a specific heat ranging 791–967 J/kgK and 833–980 J/kgK, respectively, when the ambient temperature is within 0 °C to 50 °C. In terms of fiber category, the ST fiber concrete had a higher specific heat than PP fiber LWAC.
  • The ST and PP fiber LWAC have a thermal diffusivity ranging from 0.687–0.916 mm2/s and 0.620–0.772 mm2/s, respectively, when the ambient temperature is within 0 °C to 50 °C. The ST fiber concrete had a higher diffusivity than PP fiber LWAC.
  • The ST and PP fibers LWAC have a thermal effusivity ranging from 1349–1580 J/Km2s1/2 and 1171–1335 J/Km2s1/2, respectively, when the ambient temperature is within 0 °C to 50 °C. The ST fiber concrete had a higher effusivity than PP fiber concrete.
  • The temperature-dependent thermal conductivity and thermal diffusivity decreased linearly between 0 °C and 50 °C with a very strong linear correlation.
  • The temperature-dependent specific heat and thermal effusivity increased linearly between 0 °C and 50 °C with a very strong linear correlation.
  • The equations to predict thermal conductivity, specific heat, thermal diffusivity, and thermal effusivity as a function of the ambient temperature, ranging from 0 °C to 50 °C, were proposed.

Author Contributions

Conceptualization, P.S. and Z.C.M.; methodology, Z.C.M.; formal analysis, Z.C.M. and P.S.; investigation, Z.C.M., Z.A. and A.Z.; resources, M.A.H.; data curation, S.B.; writing—original draft preparation, Z.C.M.; writing—review and editing, P.S.; visualization, A.Z.; supervision, P.S.; project administration, M.A.H.; funding acquisition, S.B. and M.A.H. All authors have read and agreed to the published version of the manuscript.

Funding

This work was supported by the Green Building Modelling by Utilizing Coal Combustion Product as Material Replacement in Concrete for TNB Substations (Grant numbers: U-TG-RD-20-21).

Institutional Review Board Statement

Not applicable.

Informed Consent Statement

Not applicable.

Data Availability Statement

Not applicable.

Acknowledgments

We greatly acknowledge the support of the University of Malaya and National Energy University in using the laboratory facilities for the experimental works.

Conflicts of Interest

The authors declare no conflict of interest. The funders had no role in the design of the study; in the collection, analyses, or interpretation of data; in the writing of the manuscript, or in the decision to publish the results.

References

  1. Manioğlu, C.; Yılmaz, Z. Energy efficient design strategies in the hot dry area of Turkey. Build. Environ. 2008, 43, 1301–1309. [Google Scholar] [CrossRef]
  2. Real, S.; Gomes, M.G.; Rodrigues, A.M.; Bogas, J.A. Contribution of structural lightweight aggregate concrete to the reduction of thermal bridging effect in buildings. Constr. Build. Mater. 2016, 121, 460–470. [Google Scholar] [CrossRef]
  3. Asadi, I.; Shafigh, P.; Abu Hassan, Z.F.B.; Mahyuddin, N.B. Thermal conductivity of concrete—A review. J. Build. Eng. 2018, 20, 81–93. [Google Scholar] [CrossRef]
  4. Campione, G.; Miraglia, N.; Papia, M. Mechanical properties of steel fibre reinforced lightweight concrete with pumice stone or expanded clay aggregates. Mater. Struct. Mater. Constr. 2001, 34, 201–210. [Google Scholar] [CrossRef]
  5. Hassanpour, M.; Shafigh, P.; Bin Mahmud, H. Lightweight aggregate concrete fibre reinforcement—A review. Constr. Build. Mater. 2012, 37, 452–461. [Google Scholar] [CrossRef]
  6. Real, S.; Bogas, J.A.; Glória, G.M.; Ferrer, B. Thermal conductivity of structural lightweight aggregate concrete. Mag. Concr. Res. 2016, 15, 798–808. [Google Scholar] [CrossRef]
  7. Ma, P.; Wang, L.S. Effective heat capacity of interior planar thermal mass (iPTM) subject to periodic heating and cooling. Energy Build. 2012, 27, 44–52. [Google Scholar] [CrossRef]
  8. Gül, R.; Okuyucu, E.; Türkmen, I.; Aydın, A.C. Thermo-mechanical properties of fibre reinforced raw perlıte concrete. Mater. Lett. 2007, 29, 5145–5149. [Google Scholar] [CrossRef]
  9. Grabois, T.M.; Cordeiro, G.C.; Filho, R.D.T. Fresh and hardened-state properties of self-compacting lightweight concrete reinforced with steel fibre. Constr. Build. Mater. 2016, 104, 284–292. [Google Scholar] [CrossRef]
  10. Nagy, B.; Nehme, S.G.; Szagri, D. Thermal properties and modeling of fibre-reinforced concretes. Energy Procedia 2015, 78, 2742–2747. [Google Scholar] [CrossRef] [Green Version]
  11. Nguyen, L.H.; Beaucour, A.L.; Ortola, S.; Noumowé, A. Experimental study on the thermal properties of lightweight aggregate concretes at different moisture contents and ambient temperatures. Constr. Build. Mater. 2017, 151, 720–731. [Google Scholar] [CrossRef]
  12. Kim, K.H.; Jeon, S.E.; Kim, J.K.; Yang, S. An experimental study on thermal conductivity of concrete. Cem. Concr. Res. 2003, 33, 363–371. [Google Scholar] [CrossRef]
  13. Nguyen, L.H.; Beaucour, A.L.; Ortola, S.; Noumowé, A. Influence of the volume fraction and the nature of fine lightweight aggregates on the thermal and mechanical properties of structural concrete. Constr. Build. Mater. 2014, 51, 121–132. [Google Scholar] [CrossRef]
  14. Tasdemir, C.; Sengul, O.; Tasdemir, M.A. A comparative study on the thermal conductivities and mechanical properties of lightweight concretes. Energy Build. 2017, 151, 469–475. [Google Scholar] [CrossRef]
  15. Wang, W.C.; Wang, H.Y.; Chang, K.H.; Wang, S.Y. Effect of high temperature on the strength and thermal conductivity of glass fibre concrete. Constr. Build. Mater. 2020, 245, 118–387. [Google Scholar] [CrossRef]
  16. Wang, W.; Lu, C.; Li, Y.; Li, Q. An investigation on thermal conductivity of fly ash concrete after elevated temperature exposure. Constr. Build. Mater. 2017, 148, 148–154. [Google Scholar] [CrossRef]
  17. Al-Sibahy, A.; Edwards, R. Thermal behaviour of novel lightweight concrete at ambient and elevated temperatures: Experimental, modelling and parametric studies. Constr. Build. Mater. 2012, 31, 174–187. [Google Scholar] [CrossRef]
  18. Kizilkanat, A.B.; Yuzer, N.; Kabay, N. Thermo-physical properties of concrete exposed to high temperature. Constr. Build. Mater. 2013, 45, 157–161. [Google Scholar] [CrossRef]
  19. Shin, K.Y.; Kim, S.B.; Kim, J.H.; Chung, M.; Jung, P.S. Thermo-physical properties and transient heat transfer of concrete at elevated temperatures. Nucl. Eng. Des. 2002, 22, 233–241. [Google Scholar] [CrossRef] [Green Version]
  20. Othman, M.A.; Wang, Y.C. Elevated-temperature thermal properties of lightweight foamed concrete. Constr. Build. Mater. 2011, 25, 705–716. [Google Scholar] [CrossRef]
  21. Pliya, P.; Beaucour, A.L.; Noumowé, A. Contribution of cocktail of polypropylene and steel fibre in improving the behaviour of high strength concrete subjected to high temperature. Constr. Build. Mater. 2011, 25, 1926–1934. [Google Scholar] [CrossRef]
  22. Morabito, P. Measurement of the thermal properties of different concretes. High Temp. High Press. 1989, 21, 51–59. [Google Scholar]
  23. Khaliq, W.; Kodur, V. Thermal and mechanical properties of fibre reinforced high performance self-consolidating concrete at elevated temperatures. Cem. Concr. Res. 2011, 41, 1112–1122. [Google Scholar] [CrossRef]
  24. ASTM C567/C567M-19; Standard Test Method for Determining Density of Structural Lightweight Concrete. ASTM International: West Conshohocken, PA, USA, 2019.
  25. BS EN 12350-2:2009; Testing Fresh Concrete. Slump-Test. BSI: London, UK, 2009.
  26. BS EN 12350-3:2009; Testing Fresh Concrete. Vebe Test. BSI: London, UK, 2009.
  27. BS EN 12390-4:2009; Compressive Strength of Test Specimens. BSI: London, UK, 2009.
  28. ASTM C518-98; Standard Test Method for Steady-State Thermal Transmission Properties by Means of Heat Flow Meter Apparatus. ASTM International: West Conshohocken, PA, USA, 1998.
  29. ASTM C1784-14; Standard Test Method for Using a Heat Flow Meter Apparatus for Measuring Thermal Storage Properties of Phase Change Materials and Products. ASTM International: West Conshohocken, PA, USA, 2014.
  30. Fraternali, F.; Ciancia, V.; Chechile, R.; Rizzano, G.; Feo, L.; Incarnato, L. Experimental study of the thermo-mechanical properties of recycled PET fibre-reinforced concrete. Compos. Struct. 2011, 93, 2368–2374. [Google Scholar] [CrossRef]
  31. Valcuende, M.; Lliso-Ferrando, J.R.; Roig-Flores, M.; Gandía-Romero, J.M. Porous Structure of Ultra-High-Performance Fibre-Reinforced Concretes. Materials 2021, 14, 1637. [Google Scholar] [CrossRef]
  32. Lamond, J.F.; Pielert, J.H. Significance of Tests and Properties of Concrete and Concrete-Making Materials; ASTM International Press: West Conshohocken, PA, USA, 2006. [Google Scholar]
  33. Mehta, P.K.; Monterio, P.J.M. Concrete: Microstructure, Properties and Materials; McGraw Hill Inc.: East Windsor, NJ, USA, 2006. [Google Scholar]
  34. ACI 213R-03; Guide for Structural Lightweight-Aggregate Concrete. American Concrete Institute: Farmington Hills, MI, USA, 2003.
  35. Yap, S.P.; Alengaram, U.J.; Jumaat, M.Z. Enhancement of mechanical properties in polypropylene- and nylon-fibre reinforced oil palm shell concrete. Mater. Des. 2013, 49, 1034–1041. [Google Scholar] [CrossRef]
  36. Li, J.; Niu, J.; Wan, C.; Liu, X.; Jin, Z. Comparison of flexural property between high performance polypropylene fibre reinforced lightweight aggregate concrete and steel fibre reinforced lightweight aggregate concrete. Constr. Build. Mater. 2017, 157, 729–736. [Google Scholar] [CrossRef]
  37. Choi, J.; Zi, G.; Hino, S.; Yamaguchi, K.; Kim, S. Influence of fibre reinforcement on strength and toughness of all-lightweight concrete. Constr. Build. Mater. 2014, 69, 381–389. [Google Scholar] [CrossRef]
  38. Corinaldesi, V.; Moriconi, G. Use of synthetic fibres in self-compacting lightweight aggregate concretes. J. Build. Eng. 2015, 4, 247–254. [Google Scholar] [CrossRef]
  39. Zhao, M.; Zhao, M.; Chen, M.; Li, J.; Law, D. An experimental study on strength and toughness of steel fibre re-inforced expanded-shale lightweight concrete. Constr. Build. Mater. 2018, 183, 493–501. [Google Scholar] [CrossRef]
  40. Wegian, F.M. Strength properties of lightweight concrete made with LECA grading. Aust. J. Civ. Eng. 2012, 10, 11–22. [Google Scholar] [CrossRef]
  41. Gao, J.; Sun, W.; Morino, K. Mechanical properties of steel fibre-reinforced, high-strength, lightweight concrete. Cem. Concr. Compos. 1997, 19, 307–313. [Google Scholar] [CrossRef]
  42. Che Muda, Z.; Shafigh, P.; Binti Mahyuddin, N.; Sepasgozar, S.M.E.; Beddu, S.; Zakaria, A. Energy Performance of a High-Rise Residential Building Using Fibre-Reinforced Structural Lightweight Aggregate Concrete. Appl. Sci. 2020, 10, 4489. [Google Scholar] [CrossRef]
  43. Jansson, R. Measurement of Thermal Properties at Elevated Temperatures—Brandforsk Project 328-031; SP Report 2004:46; SP Swedish National Testing and Research Institute: Borås, Sweden, 2004; ISBN 91-85-303-22-4. [Google Scholar]
  44. Patti, A.; Acierno, D. Thermal Conductivity of Polypropylene-Based Materials. In Polypropylene: Polymerization and Characterizationof Mechanical and Thermal Properties; IntechOpen: London, UK, 2019; Chapter 3. [Google Scholar] [CrossRef] [Green Version]
  45. Sajedi, F.; Razak, H.A.; Bin Mahmud, H.; Shafigh, P. Relationships between compressive strength of cement-slag mortars under air and water curing regimes. Constr. Build. Mater. 2012, 31, 188–196. [Google Scholar] [CrossRef] [Green Version]
  46. Marechal, J.C. Contribution à étude des propriétés thermiques et mécaniques du béton en fonction de la temperature. Ann. L’Inst. Tech. Bâtiment Trav. Publics 1970, 274, 122–146. [Google Scholar]
  47. Garboczi, E.J.; Bentz, D.P. Multi-Scale Picture of Concrete and Its Transport Properties: Introduction for Non-Cement Researchers; Internal Report 5900; National Institute of Standards and Technology: Gaithersburg, MD, USA, 1996. [Google Scholar]
  48. Neville, A.M. Properties of Concrete, 5th ed.; Prentice-Hall: Hoboken, NJ, USA, 2013; ISBN 0273786326. [Google Scholar]
  49. Mindess, S.; Young, J.F.; Darwin, D. Concrete, 2nd ed.; Pearson Education: London, UK, 2003. [Google Scholar]
  50. Hemingway, B.S. Quartz: Heat capacities from 340 to 1000 K and revised values for the thermodynamic properties. Am. Mineral. 1987, 72, 273–279. [Google Scholar]
  51. Vua, T.H.; Piqueux, S.; Choukrouna, M.; Edwards, C.S.; Christensen, P.R.; Glotch, T.D. Low-temperature specific heat capacity measurements and application to Mars thermal modelling. Icarus 2019, 321, 824–840. [Google Scholar] [CrossRef]
  52. VDI-Gesellschaft. VDI Heat Atlas, 2nd ed.; Springer: Berlin/Heidelberg, Germany, 2010; ISBN 978-3-540-77877-6. [Google Scholar] [CrossRef]
  53. Roberz, F.; Loonen, R.C.G.M.; Hoes, P.; Hensen, J.L.M. Ultra-lightweight concrete: Energy and comfort performance evaluation in relation to buildings with low and high thermal mass. Energy Build. 2017, 138, 432–442. [Google Scholar] [CrossRef]
  54. Jin, X.; Zhang, X.; Cao, Y.; Wang, G. Thermal performance evaluation of the wall using heat flux time lag and decrement factor. Energy Build. 2012, 47, 369–374. [Google Scholar] [CrossRef]
Figure 1. Fibrillated PP and hooked-end ST fibers and LECA aggregates.
Buildings 12 00771 g001
Figure 2. Sample preparation stages for Fox 50 HFM thermal test.
Buildings 12 00771 g002
Figure 3. Fox 50 HFM and its auxiliary unit arrangement.
Buildings 12 00771 g003
Figure 4. Relationship between thermal conductivity and ambient temperatures of all concretes.
Buildings 12 00771 g004
Figure 5. Relationship between specific heat and ambient temperatures for all concretes.
Buildings 12 00771 g005
Figure 6. Relationship between thermal diffusivity and ambient temperatures for all concretes.
Buildings 12 00771 g006
Figure 7. Relationship between thermal effusivity and ambient temperatures for all concretes.
Buildings 12 00771 g007
Table 1. Chemical composition of the binders by percentage of mass.
CaOSiO2Al2O3Fe2O3MgOSO3K2ONa2OLost on Ignition
Cement63.4019.805.103.102.502.401.000.191.80
GGBFS49.7629.3511.720.524.202.090.46--
Table 2. Chemical composition of LECA aggregates obtained by EDXFR analysis.
Chemical Composition of the LECA Aggregates (% by Mass)
CaOSiO2Al2O3Fe2O3MgOSO3K2ONa2OBaOTiO2P2O5
3.5753.5024.478.981.420.074.082.240.100.960.0064
Table 3. Physical and mechanical properties of the ST and PP fibers used.
Type of FibresLength,
l (mm)
Diameter,
d (mm)
Aspect Ratio
(l/d)
GeometrySolid Density
(kg/m3)
Modulus
GPa
Tensile Strength
(MPa)
Failure Strain
(%)
Steel (ST)350.5465Hooked-end784021012003.5
Polypropylene (PP)190.0161188Fibrillated9003.940015
Table 4. Mix proportions and physical and mechanical properties of ST and PP fiber-reinforced LWACs.
Mix CodeCement
(kg/m3)
GGBFS
(kg/m3)
LECA
(kg/m3)
Sand
(kg/m3)
Water
(kg/m3)
Water to Binder RatioVF 1
(%)
SP 2
(%)
Oven Dried Density (kg/m3)Vebe
(s)
Slump
(mm)
28-Day Compressive Strength (MPa)
Control
Plain LWAC400605068371610.3501183147047.1
ST Fibre
ST0.25400605068371610.350.251184765550.2
ST0.50400605068371610.350.501186565551.2
ST0.75400605068371610.350.751190974553.4
ST1.00400605068371610.351.0011934111554.1
ST1.50400605068371610.351.501195116547.4
PP Fibre
PP0.1400605068371610.350.11177647046.3
PP0.2400605068371610.350.21175956548.9
PP0.3400605068371610.350.31168884044.9
Notes: 1 VF % is fiber volume fraction (dosage) in percentage. 2 SP is a superplasticizer in % by cement weight for the workability requirement.
Table 5. The mean values of thermal conductivity with the COV against the ambient set temperatures.
Thermal Conductivity, kW/mK
Temperature0 °CCOV% 110 °CCOV%20 °CCOV%30 °CCOV%40 °CCOV%50 °CCOV%
Plain LWAC1.1906.691.1716.461.1656.291.1556.161.1496.081.1436.01
ST0.251.2336.631.2296.511.2206.401.2076.291.1976.121.1875.94
ST0.51.3673.451.3543.461.3383.431.3193.511.3033.361.2933.50
ST0.751.3833.061.3742.881.3642.901.3532.871.3452.921.3373.00
ST0.11.4198.331.4208.111.4078.011.3927.971.3827.931.3737.89
ST1.51.4595.331.4515.571.4395.591.4235.541.4125.541.4025.52
PP0.11.1496.581.1406.521.1326.511.1206.501.1116.941.0967.00
PP0.21.11812.221.11612.281.10912.151.10012.101.09411.941.08811.79
PP0.31.0116.141.0105.901.0055.740.9975.550.9925.360.9875.22
Note: 1 COV% is the coefficient of variation in percentage.
Table 6. Proposed equations to predict the thermal conductivity with temperature (ranging from 0 °C to 50 °C) for all concrete mixes.
Mix CodeEquationR2 Value
Control
Plain LWACkPLWAC= −0.0009T + 1.18450.9455
ST Fibre
ST0.25kST0.25 = −0.001T + 1.2360.9865
ST0.5kST0.5 = −0.0015T + 1.36780.9945
ST0.75kST0.75 = −0.0009T + 1.38260.9967
ST1.0kST1.0 = −0.001T + 1.42460.9573
ST1.5kST1.5 = −0.0012T + 1.4610.9935
PP Fibre
PP0.1kPP0.1 = −0.001T + 1.15040.9919
PP0.2kPP0.2 = −0.0006T + 1.12040.9825
PP0.3kPP0. = −0.0005T + 1.0130.9747
Table 7. The mean values of specific heat, Cp with the COV, and the ambient set temperatures.
Specific Heat, Cp (Joule/kgK)
Temperature0 °CCOV% 110 °CCOV%20 °CCOV%30 °CCOV%40 °CCOV%50 °CCOV%
Plain LWAC8196.568338.638775.309015.619205.059385.14
ST0.257914.898158.708536.368706.528926.219126.10
ST0.58591.938802.069062.239432.729562.099671.97
ST0.758563.688712.398972.589282.869412.729602.25
ST1.08513.858694.258984.389225.729404.319554.35
ST1.58471.298591.158881.199171.339311.389460.94
PP0.18435.758615.068854.069154.779274.349433.91
PP0.28334.488504.268776.499052.569263.279393.15
PP0.38536.148795.908905.749475.559565.369805.22
Note: 1 COV% is the coefficient of variation in percentage.
Table 8. Proposed equations to predict specific heat with temperature (ranging from 0 °C to 50 °C) for all concrete mixes.
Mix CodeEquationR2 Value
Control
Plain LWACCpControl= 2.5156T + 818.140.9765
ST Fibre
ST0.25CpST0.25 = 2.2499T + 794.810.9870
ST0.5CpST0.5 = 2.3091T + 860.740.9710
ST0.75CpST0.75 = 2.1719T + 854.390.9854
ST1.0CpST1.0 = 2.169T + 851.450.9908
ST1.5CpST1.5 = 2.1121T + 845.130.9813
PP Fibre
PP0.1CpPP0.1 = 2.0699T + 843.930.9837
PP0.2CpPP0.2 = 2.2517T + 831.910.9901
PP0.3CpPP0.3 = 2.6403T +851.580.9597
Table 9. The mean values of thermal diffusivity with the COV against the ambient set temperatures.
Thermal Diffusivity, a (mm2/s)
Temperature0 °CCOV% 110 °CCOV%20 °CCOV%30 °CCOV%40 °CCOV%50 °CCOV%
Plain LWAC0.7888.040.77310.780.7277.610.7017.920.6827.230.6657.11
ST0.250.8167.720.8009.880.7578.450.7348.340.7098.300.6877.83
ST0.50.8463.550.8173.370.7833.150.7424.970.7223.040.7073.09
ST0.750.8664.610.8464.350.8144.590.7804.730.7644.460.7434.70
ST0.10.8848.630.8598.750.8248.630.7948.990.7728.470.7538.34
ST1.50.9163.600.8963.700.8593.610.8233.660.8043.480.7863.71
PP0.10.7725.640.7495.620.7246.250.6926.060.6776.180.6576.23
PP0.20.7677.060.7497.740.7217.770.6937.540.6727.680.6598.20
PP0.30.7349.590.7085.680.6999.610.6485.600.6395.210.6205.33
Note: 1 COV% is the coefficient of variation in percentage.
Table 10. Proposed equations to predict thermal diffusivity with temperature (ranging from 0 °C to 50 °C) for all concrete mixes.
Mix CodeEquationR2 Value
Control
Plain LWACa Control = −0.0026T + 0.7880.9727
ST Fibre
ST0.25aST0.25 = −0.0027T + 0.81770.9875
ST0.5aST0.5 = −0.0029T + 0.84240.9791
ST0.75aST0.75 = −0.0026T + 0.86610.9878
ST1.0aST1.0 = −0.0027T + 0.88190.9903
ST1.5aST1.5 = −0.0027T + 0.9160.9828
PP Fibre
PP0.1aPP0.1 = −0.0024T + 0.77060.9911
PP0.2aPP0.2 = −0.0023T + 0.76720.9886
PP0.3aPP0.3 = −0.0024T + 0.73380.9606
Table 11. The mean values of thermal effusivity, e, with the COV against the ambient set temperatures.
Thermal Effusivity, e (J/Km2s1/2)
Temperature0 °CCOV% 110 °CCOV%20 °CCOV%30 °CCOV%40 °CCOV%50 °CCOV%
Plain LWAC13254.0513324.4913634.1313763.8313863.9113954.15
ST0.2513494.1713575.3013823.8013883.9913993.5214093.71
ST0.514692.2014782.2714912.3415101.7215102.2315132.32
ST0.7514693.0214772.1714931.9915122.2315162.2715261.85
ST0.114895.6314995.5915175.5815296.3315375.6115445.65
ST1.515273.3915333.3115523.3215683.3315743.3615803.20
PP0.112954.3513024.3013154.0013314.1613334.3213354.39
PP0.212628.9512738.6012898.2413038.4113148.1713207.78
PP0.311712.7411894.8611924.4212263.6212284.0812403.93
Note: 1 COV% is the coefficient of variation in percentage.
Table 12. Proposed equations of the thermal effusivity with temperature (ranging from 0 °C to 50 °C) for all concrete mixes.
Mix CodeEquationR2 Value
Control
Plain LWACPLWAC= 1.5000T + 1325.30.9541
ST Fibre
ST0.25ε ST0.25= 1.2343T + 1349.80.9669
ST0.5ε ST0.5= 0.9571T + 1471.20.9136
ST0.75ε ST0.75= 1.2029T + 1468.80.9713
ST1.0εST1.0= 1.1457T + 1490.50.9763
ST1.5ε ST1.5= 1.1543T + 1526.80.9598
PP Fibre
PP0.1ε PP0.1= 0.8829T + 1296.40.9244
PP0.2ε PP0.2= 1.22T + 12630.9846
PP0.3ε PP0.3= 1.417T + 1172.20.9846
Publisher’s Note: MDPI stays neutral with regard to jurisdictional claims in published maps and institutional affiliations.

