Abstract
Currently, numerous studies have focused on the differences in the properties of self-compacting concrete with recycled aggregate (RASCC) and normal concrete (NC), while less attention has been paid to the application of RASCC in reinforced concrete structures. In this paper, four-point bending loading tests were performed on seven RASCC beams and four NC beams, considering the parameter of reinforcement ratio, and the flexural properties were analyzed and compared. The results showed that the failure form, moment–deflection curves, and flexural capacity of the RASCC beams were similar to those of the NC beams. However, the cracking moment and the crack width of the RASCC beams were significantly smaller than that of the NC beams. With an increase in the longitudinal reinforcement ratio, the cracking resistance and flexural capacity of the RASCC beams increased significantly. The cracking moment and flexural capacity could be calculated using the method of the Chinese code GB50010-2010. However, compared with the test values, the predicted deflection was slightly less safe, while the maximum crack width calculation was slightly more conservative. Therefore, the current code formula was revised according to the test results.
1. Introduction
Self-compacting concrete (SCC) is a high-performance concrete with suitable filling ability, clearance passability, and resistance to segregation, which can improve the construction quality, accelerate the project speed, and address the casting problems of complex cross-sections [1]. However, the high preparation cost of SCC limits its application in engineering. With the advancement of urbanization in China, many old buildings have been demolished and rebuilt, leading to an increase in the use of recycled concrete as a raw material for the sustainable development of the construction industry [2]. Self-compacting concrete with recycled aggregate (RASCC) is formed by replacing all or part of the natural aggregates with recycled aggregate. The application of RASCC effectively reduces costs of construction and recycles waste concrete, and thus received considerable research attention at home and abroad in recent years [3,4,5,6,7,8].
However, the inherent properties of recycled aggregate, such as high water absorption, low modulus of elasticity, and high brittleness, negatively impact some basic mechanical properties of RASCC, such as compressive strength, tensile strength, and modulus of elasticity [9,10,11,12,13]. These material properties of recycled aggregate can also affect the performance of the components. So far, the flexural properties of recycled aggregate concrete (RAC) beams [14,15,16,17,18,19,20,21] and SCC beams [22,23,24,25,26] have been experimentally studied, and valuable results have been obtained. Ignjatovic et al. [14] found no significant difference between the load–deflection curves and ultimate bearing capacity of RAC beams and normal concrete (NC) beams. Knaack et al. [15], Seara et al. [16], and Zhang et al. [17] concluded that the deflection of RAC beams exceeds that of NC beams, and that the cracking loads of RAC beams with different replacement ratios are much similar, with ultimate loads and deflection increasing with the replacement ratio; moreover, increasing the reinforcement ratio increases the flexural capacity and cracking loads. Arezoumandi et al. [18] compared the flexural property of RAC beams with a 100% replacement rate of recycled coarse aggregate (RCA) with that of NC beams and found that both beams had comparable ultimate bearing capacity; however, the deflection of the RAC beams was approximately 13% higher than that of the NC beams. Sunayana et al. [19] suggested that the existing code provisions for NC beams can be applied to RAC beams. Yang et al. [20] revealed that it is conservative to predict the flexural strength of RCA using the code equations, which is inadequate to ensure construction safety. Deng et al. [21] proposed an equation for predicting the maximum crack width of RAC beams. Additionally, Luo et al. [22] and Huang et al. [23] suggested that the failure form of self-compacting concrete (SCC) beams is similar to that of NC beams, whereas the ultimate bending moment of SCC beams is slightly larger than that of NC beams; moreover, the cracking moment of SCC beams is slightly smaller. Petrovic et al. [24] found that SCC beams had satisfactory bearing capacity and stiffness, confirming the possibility of using SCC in continuous beams. Xue et al. [25] found that the ultimate bearing capacity of SCC beams can be calculated using the current code equations. Al-Ansari et al. [26] propose alternatives based on design code formulations to apply to SCC beams.
The above studies have shown some differences between the flexural properties of concrete beams using recycled aggregates and traditional concrete beams. Therefore, it is essential to study the flexural properties of RASCC beams which are different from that of either RAC beams or SCC beams. In this study, four-point bending loading tests were performed on the self-compacting concrete beams using 100% recycled aggregates by using reinforcement ratio as the test parameter. The flexural properties of RASCC beams, including failure form, moment–deflection curve, cracking moment and ultimate bearing capacity, deflection and crack width, and stress–strain curves of steel and concrete, were analyzed by using reinforcement ratio as the test parameter. Then, these properties of RASCC beams were compared with those of NC beams. Afterward, the cracking moment, flexural capacity, deflection, and maximum crack width of the RASCC beams were predicted by the current code and compared with the test values. Finally, the code calculation equations were modified to provide a reference for the design of RASCC beams.
2. Experimental Procedures
2.1. Material Properties and Design of Mix Proportion
Both RASCC and NC have a compressive strength of C40. The RCA was formed from laboratory waste concrete specimens with a compressive strength of C30 after crushing, cleaning, screening, and grading. Natural coarse aggregate was obtained from crushed natural limestone from Fushun City, Liaoning Province. The technical properties of the two aggregates were measured according to the Standard for Technical Requirements and Test Methods of Sand and Crushed Stone (or Gravel) for Ordinary Concrete (JGJ52-2006) (Table 1). The fine aggregate was washed in medium sand with a fineness modulus of 2.8. The cement was of P.O. 42.5 ordinary silicate type of Shanshui Gongyuan brand. The fly ash was of grade I, supplied by Shenxi Thermal Power. The water-reducing agent was type-LJ612 polycarboxylic acid supplied by Liaoning Academy of Construction Sciences. The mix proportion of the concrete is shown in Table 2.

Table 1.
Technical properties of coarse aggregates.
Table 2.
Mix proportion of concrete.
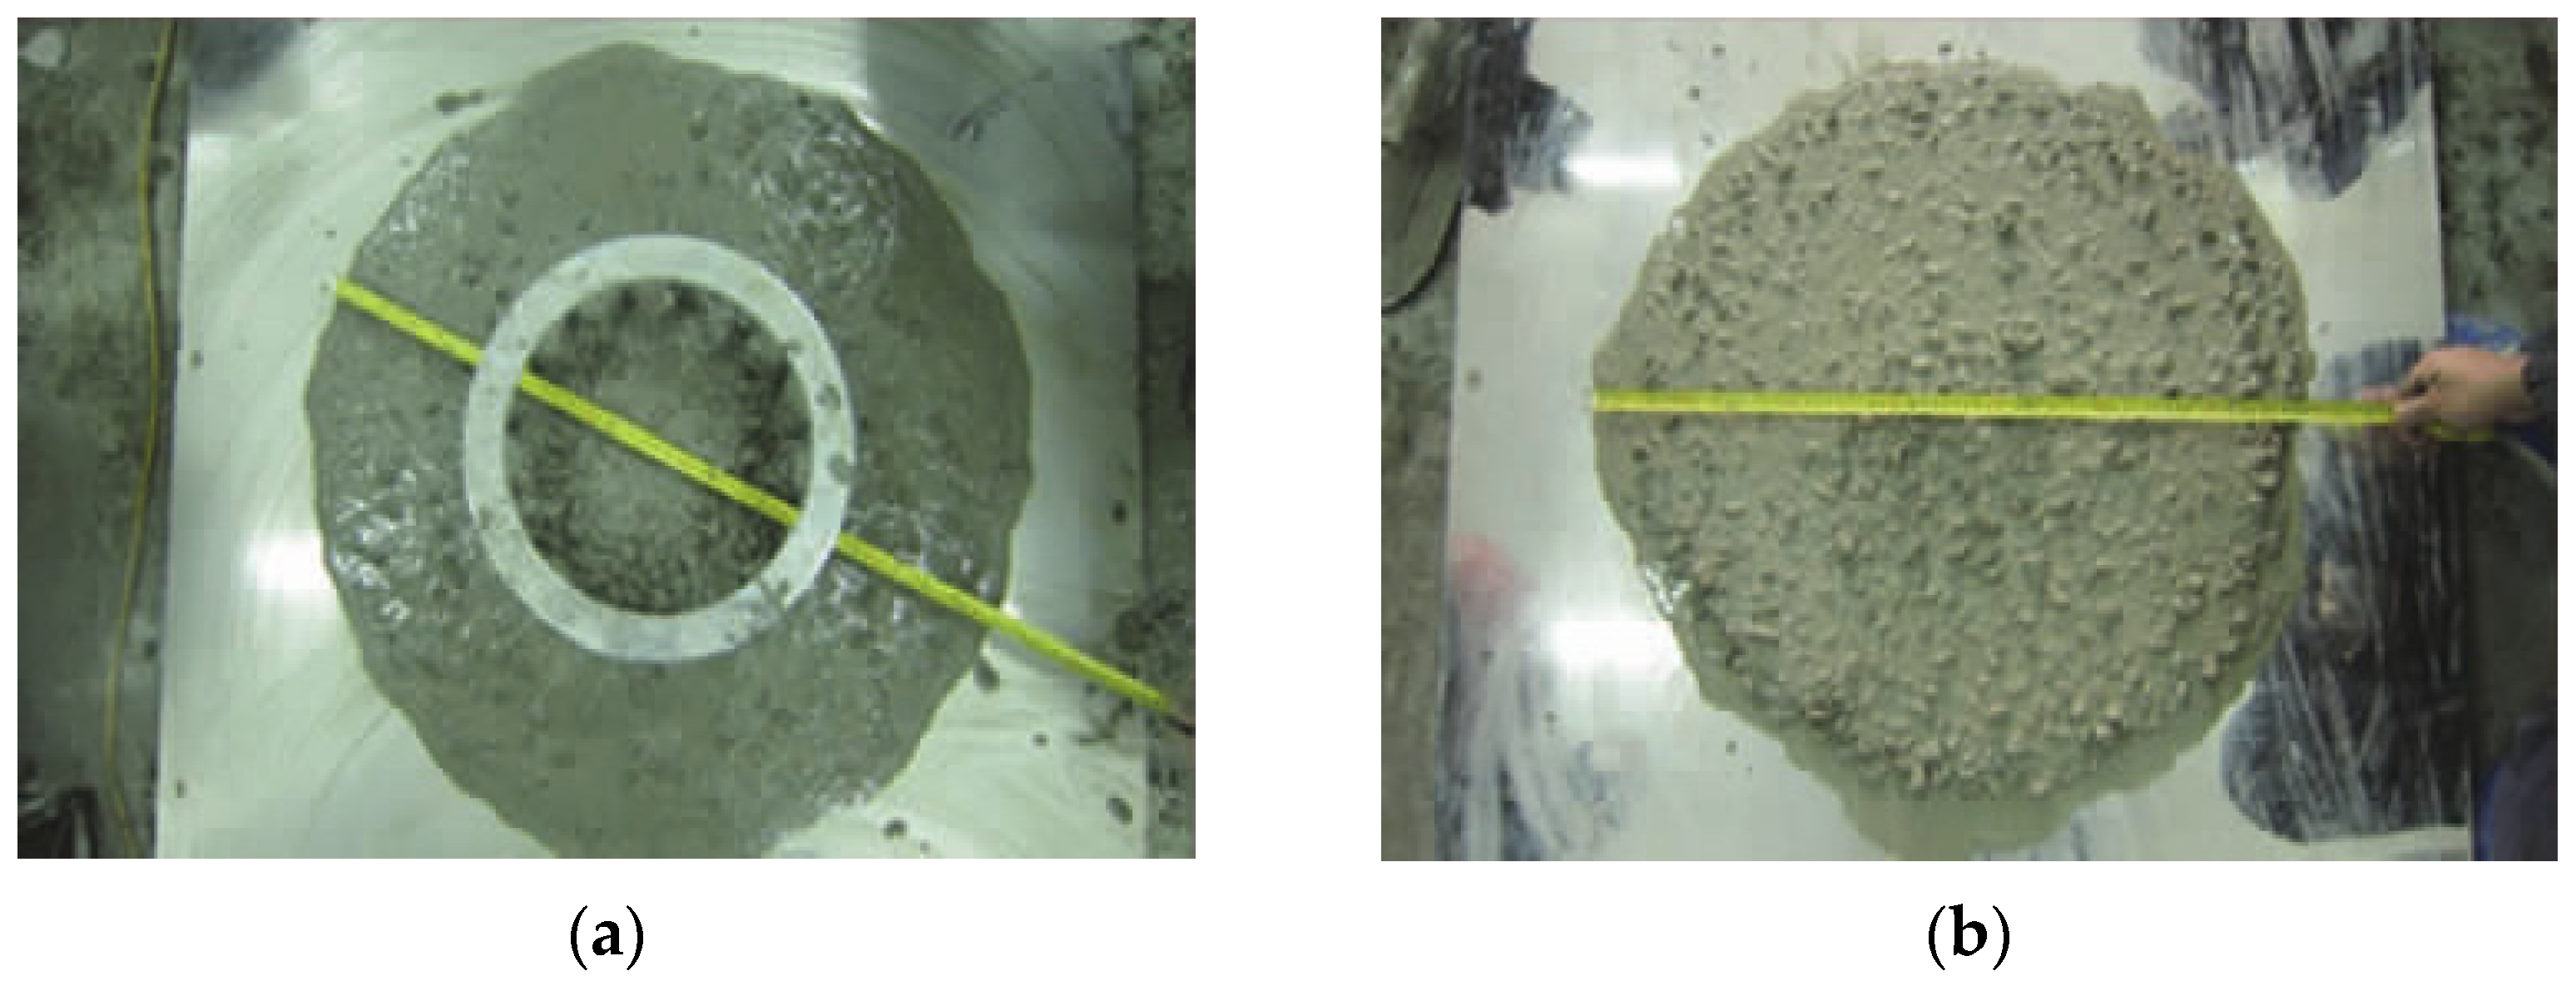
The freshly mixed RASCC was tested for workability according to the Technical Specification for Application of Self-Compacting Concrete (JGJ/T 283-2012) [27] (Figure 1 and Table 3). In addition, the mechanical properties of the hardened RASCC and NC were tested following the Standard for Test Methods of Concrete Physical and Mechanical Properties (GB/T 50081-2019) [28], and the detailed results are listed in Table 3.

Figure 1.
Workability test of RASCC. (a) Slump flow; (b) J-ring flow.
Table 3.
Workability and mechanical properties of concrete.
2.2. Specimen Design
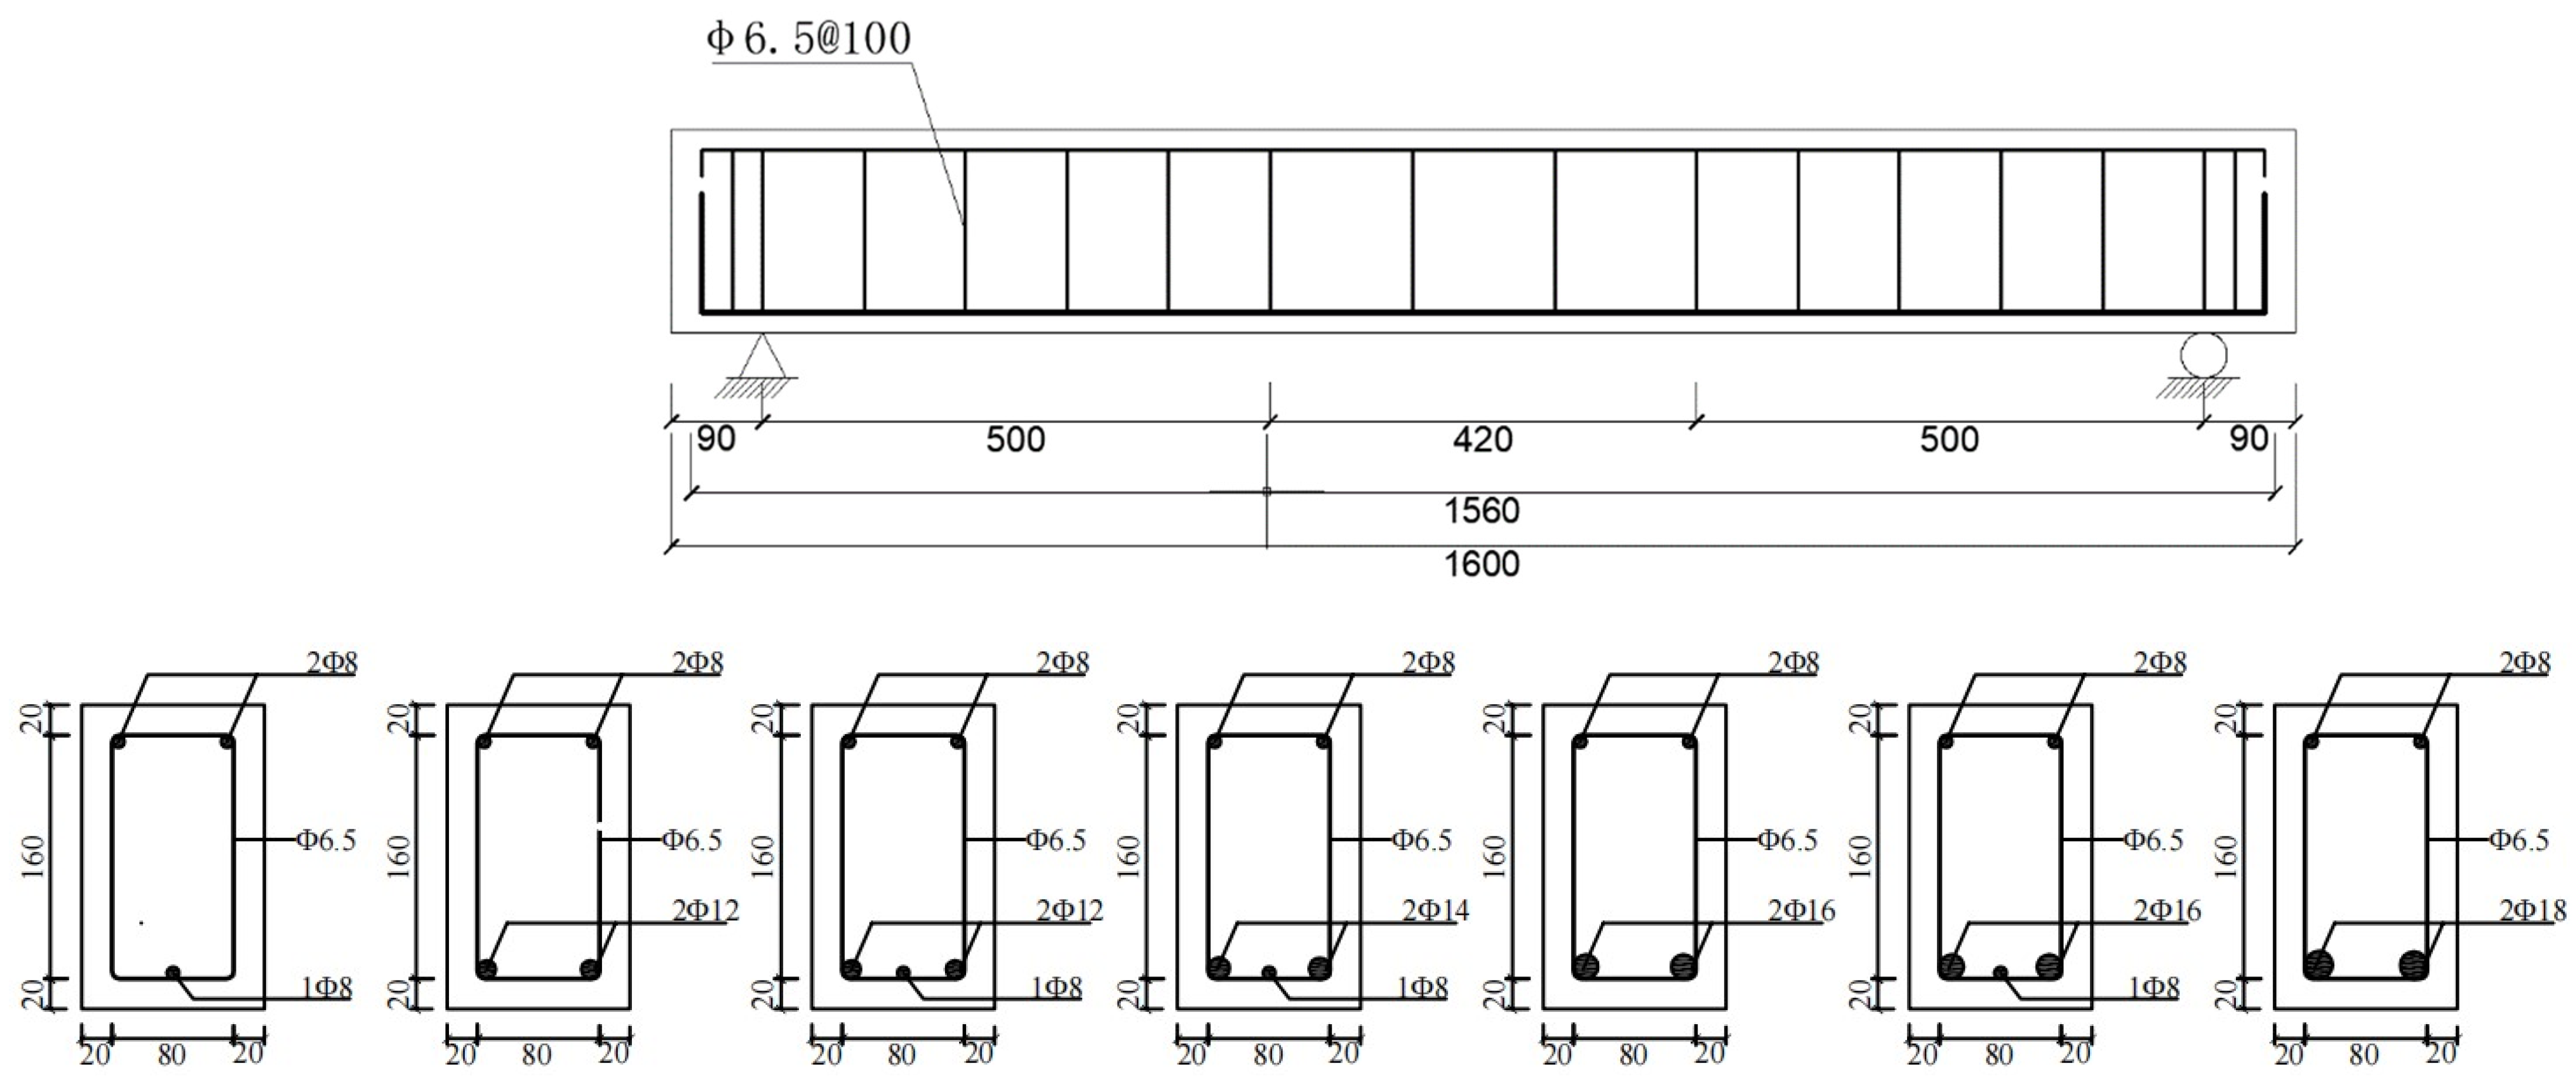
All test beams had the same dimensions (120 mm × 200 mm of cross-section and 1.6 m of length). The reinforcement ratios for the seven RASCC and four NC beams were 0.25%, 1.12%, 1.32%, 1.72%, 2.02%, 2.27%, and 2.82% and 0.25%, 1.32%, 1.72%, and 2.27%, respectively. Among them, 0.25% and 2.27%, respectively, were the minimum and maximum reinforcement ratios calculated following the code [29]. The beams’ longitudinal reinforcement was formed of HRB400-grade bars with diameters of 8 mm, 12 mm, 14 mm, 16mm, and 18 mm, respectively, depending on the reinforcement ratio. The yield strength (fy) of the longitudinal bar corresponded to 440, 492, 462, 434, and 420 Mpa, respectively. The ultimate strength (fu) corresponded to 620, 678, 594, 624, and 599 Mpa, respectively. The elastic modulus (Es) corresponded to 228, 202, 205, 208, and 198 Gpa, respectively. In addition, HPB300-grade reinforcement with a diameter of 6.5 mm was used to prepare stirrups. Additionally, the design parameters and reinforcement of the test beams are shown in Table 4 and Figure 2, respectively.
Table 4.
The design parameters and reinforcement of the test beams.
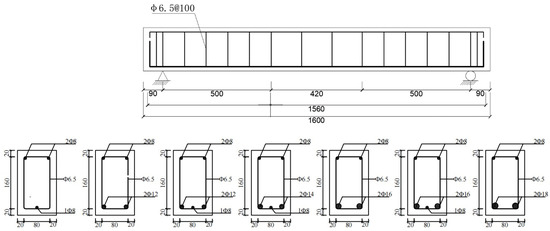
Figure 2.
Reinforcement details.
2.3. Test Apparatus and Loading Method
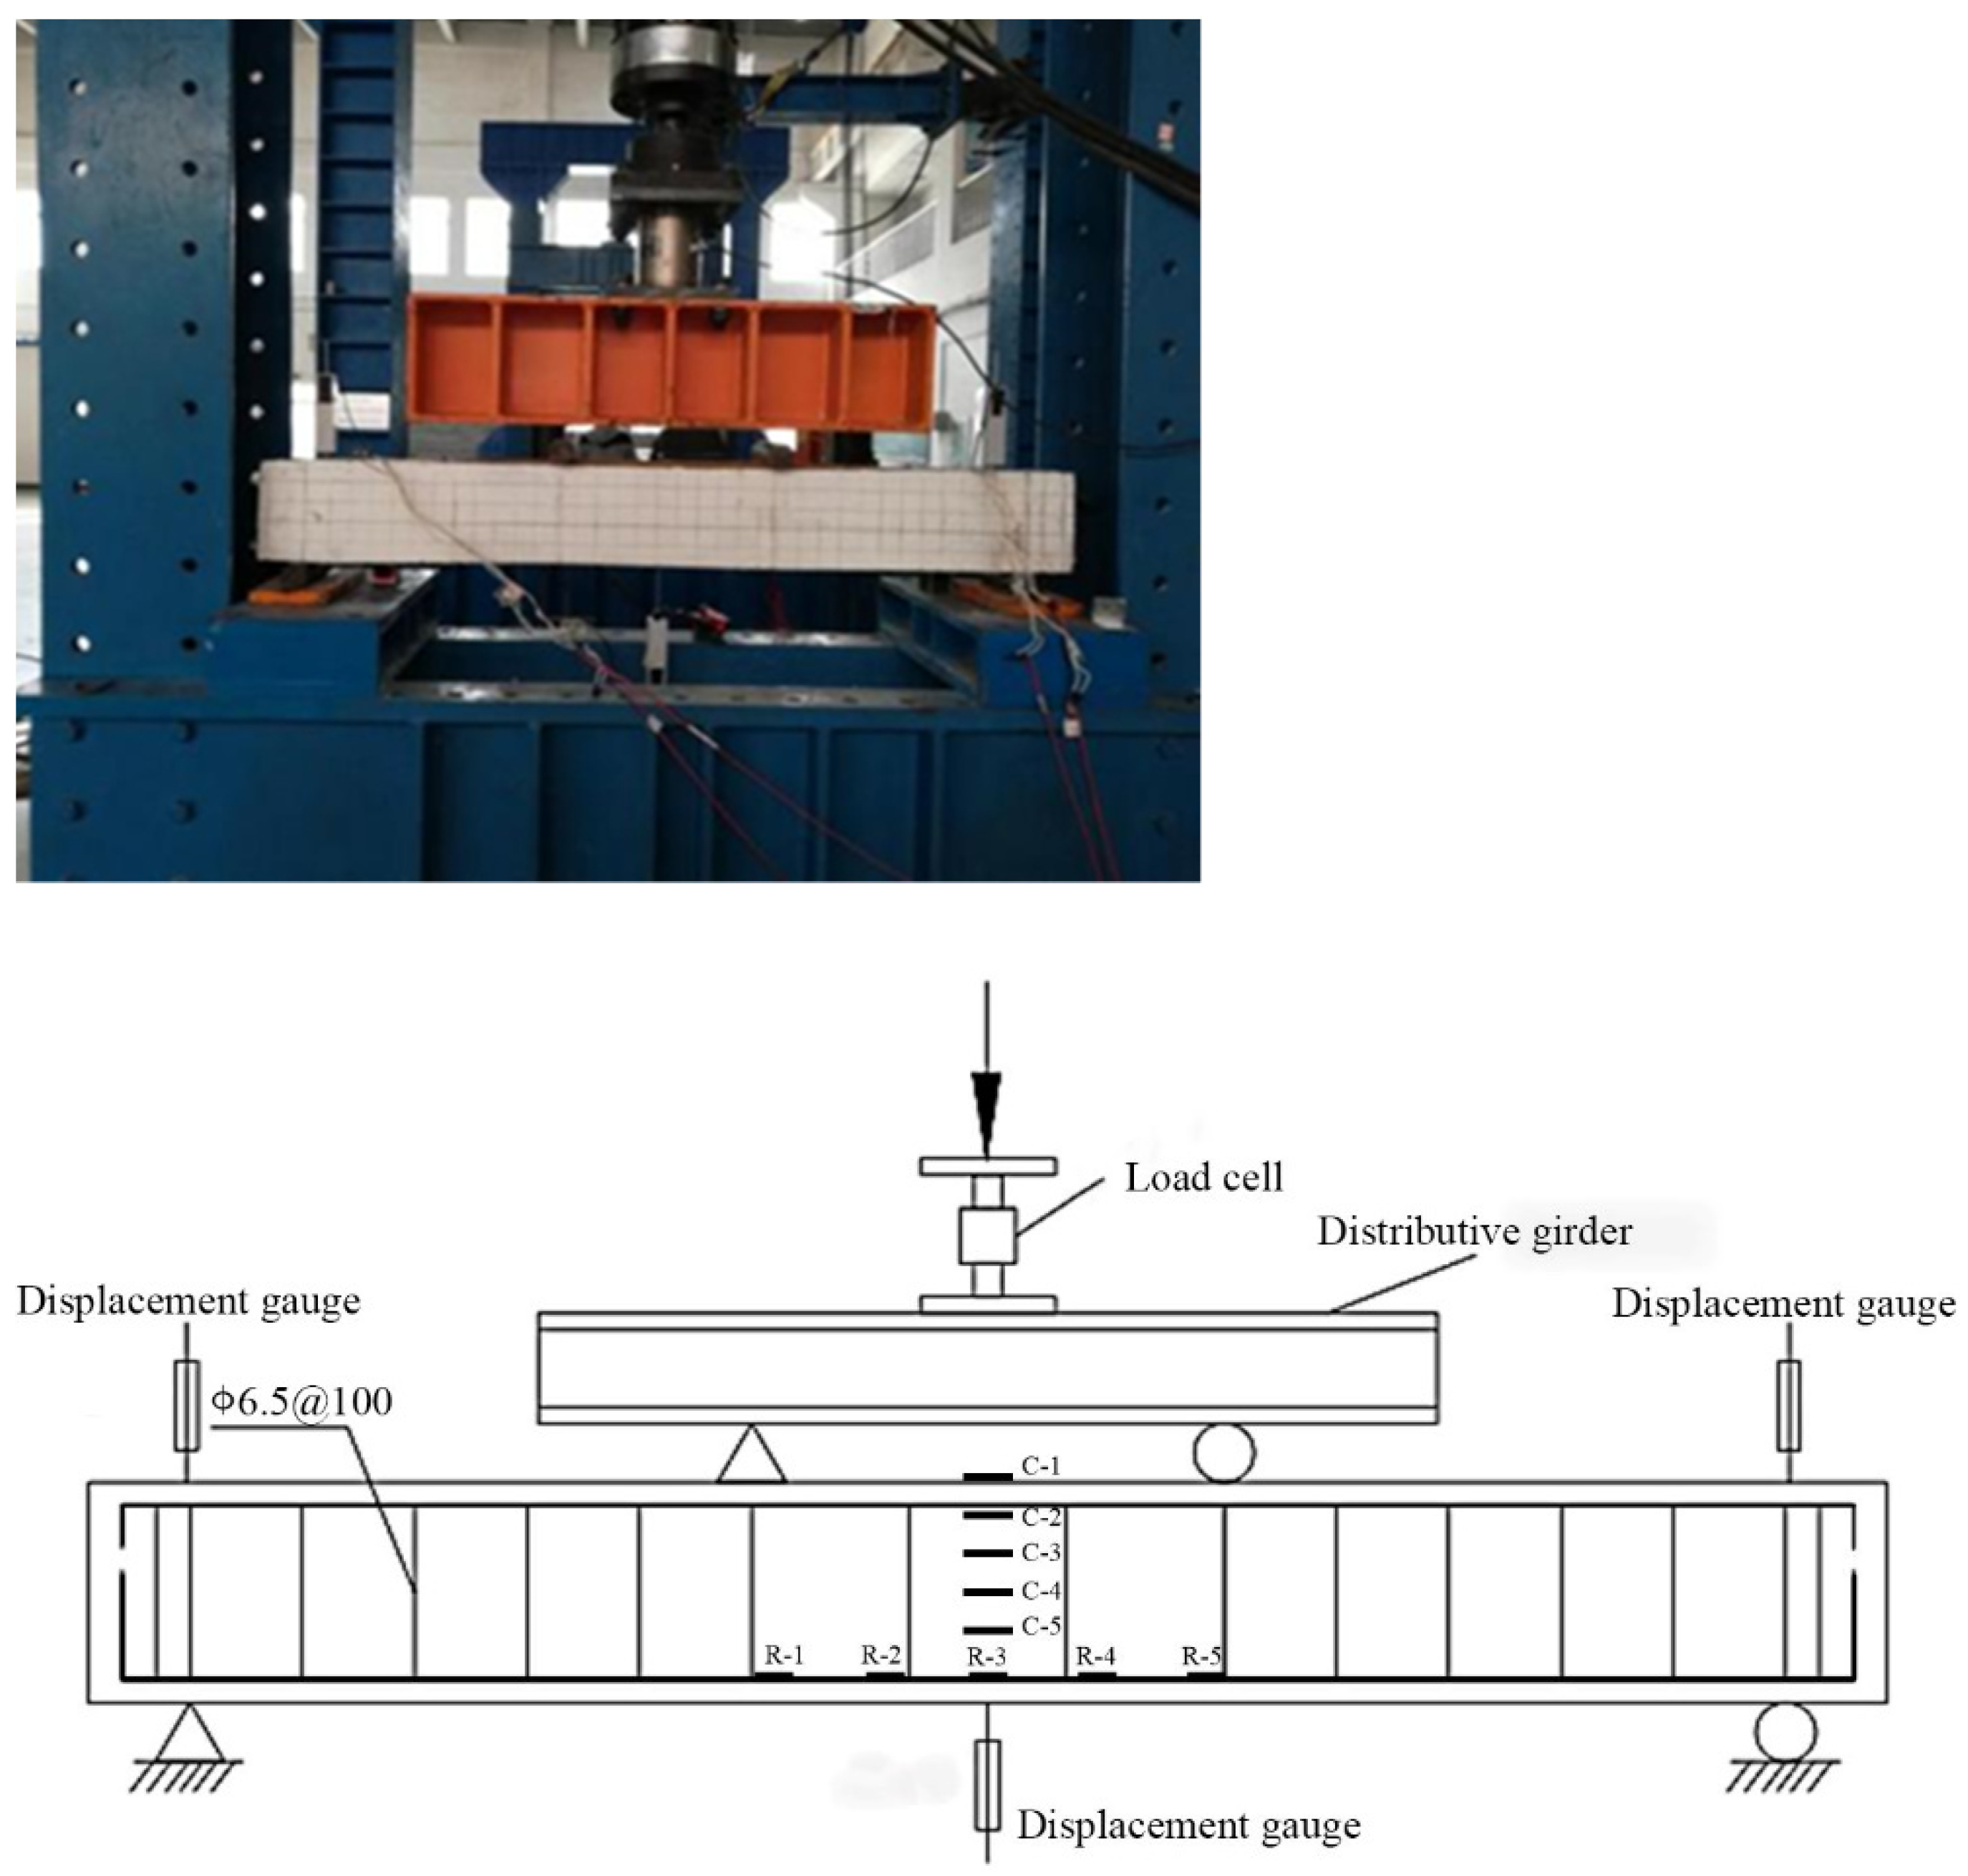
The test was carried out on a 500 kN hydraulic servo testing machine at the structural laboratory of the Shenyang University of Technology using a four-point bending loading method. A 500 kN compression load cell was fixed at the actuator to measure the load value; a YDH-100 displacement gauge was set at the girder span and at the two end supports to measure the span deflection of the test beam. Five strain gauges (R-1, R-2, R-3, R-4, and R-5) were attached at equal intervals within the purely bending section of a longitudinal bar in the test beam to measure the strain variation in the longitudinal bar. In addition, five strain gauges (C-1, C-2, C-3, C-4, and C-5) were attached to the span section of one side of the beam to measure the strain variation in the concrete along the height of the span section (Figure 3). Limewash was applied to the other side of the beam, and a grid was drawn with ink lines to observe the initiation and development of cracks. Subsequently, crack widths and heights were measured for all loading levels. In addition, loads, displacements, and strains were recorded by the imc CRONOScompact-400-RACK system.

Figure 3.
Schematic diagram of test device and loading.
According to the “Standard for Test Method of Concrete Structure” (GB/T 50152-2012), the mixed loading of load control and displacement control was adopted in this test. Pre-loading was required before the formal loading, and the loading value of pre-loading was 0.05 times the ultimate load. The pre-loading was to check whether the test beam contacted the loading device well and whether the data acquisition equipment and loading device were working normally. The initial load was applied at a 0.2 kN/min rate, with each step being loaded at 0.1 times the ultimate load. When the calculated value of the cracking load was approached, the loading value was considered 0.05 times the ultimate load for each step. After the first crack appeared, 0.1 times the ultimate load was applied at each step. Each stage of loading was maintained for 10 min to allow the deformation and cracks of the test beam to fully develop. When the load reached 85% of the ultimate load, the loading method was shifted to the displacement control method at a 0.2 mm/min rate until the component fractured. The test apparatus and loading method are shown in Figure 3.
3. Analysis of Test Results
3.1. Failure Form
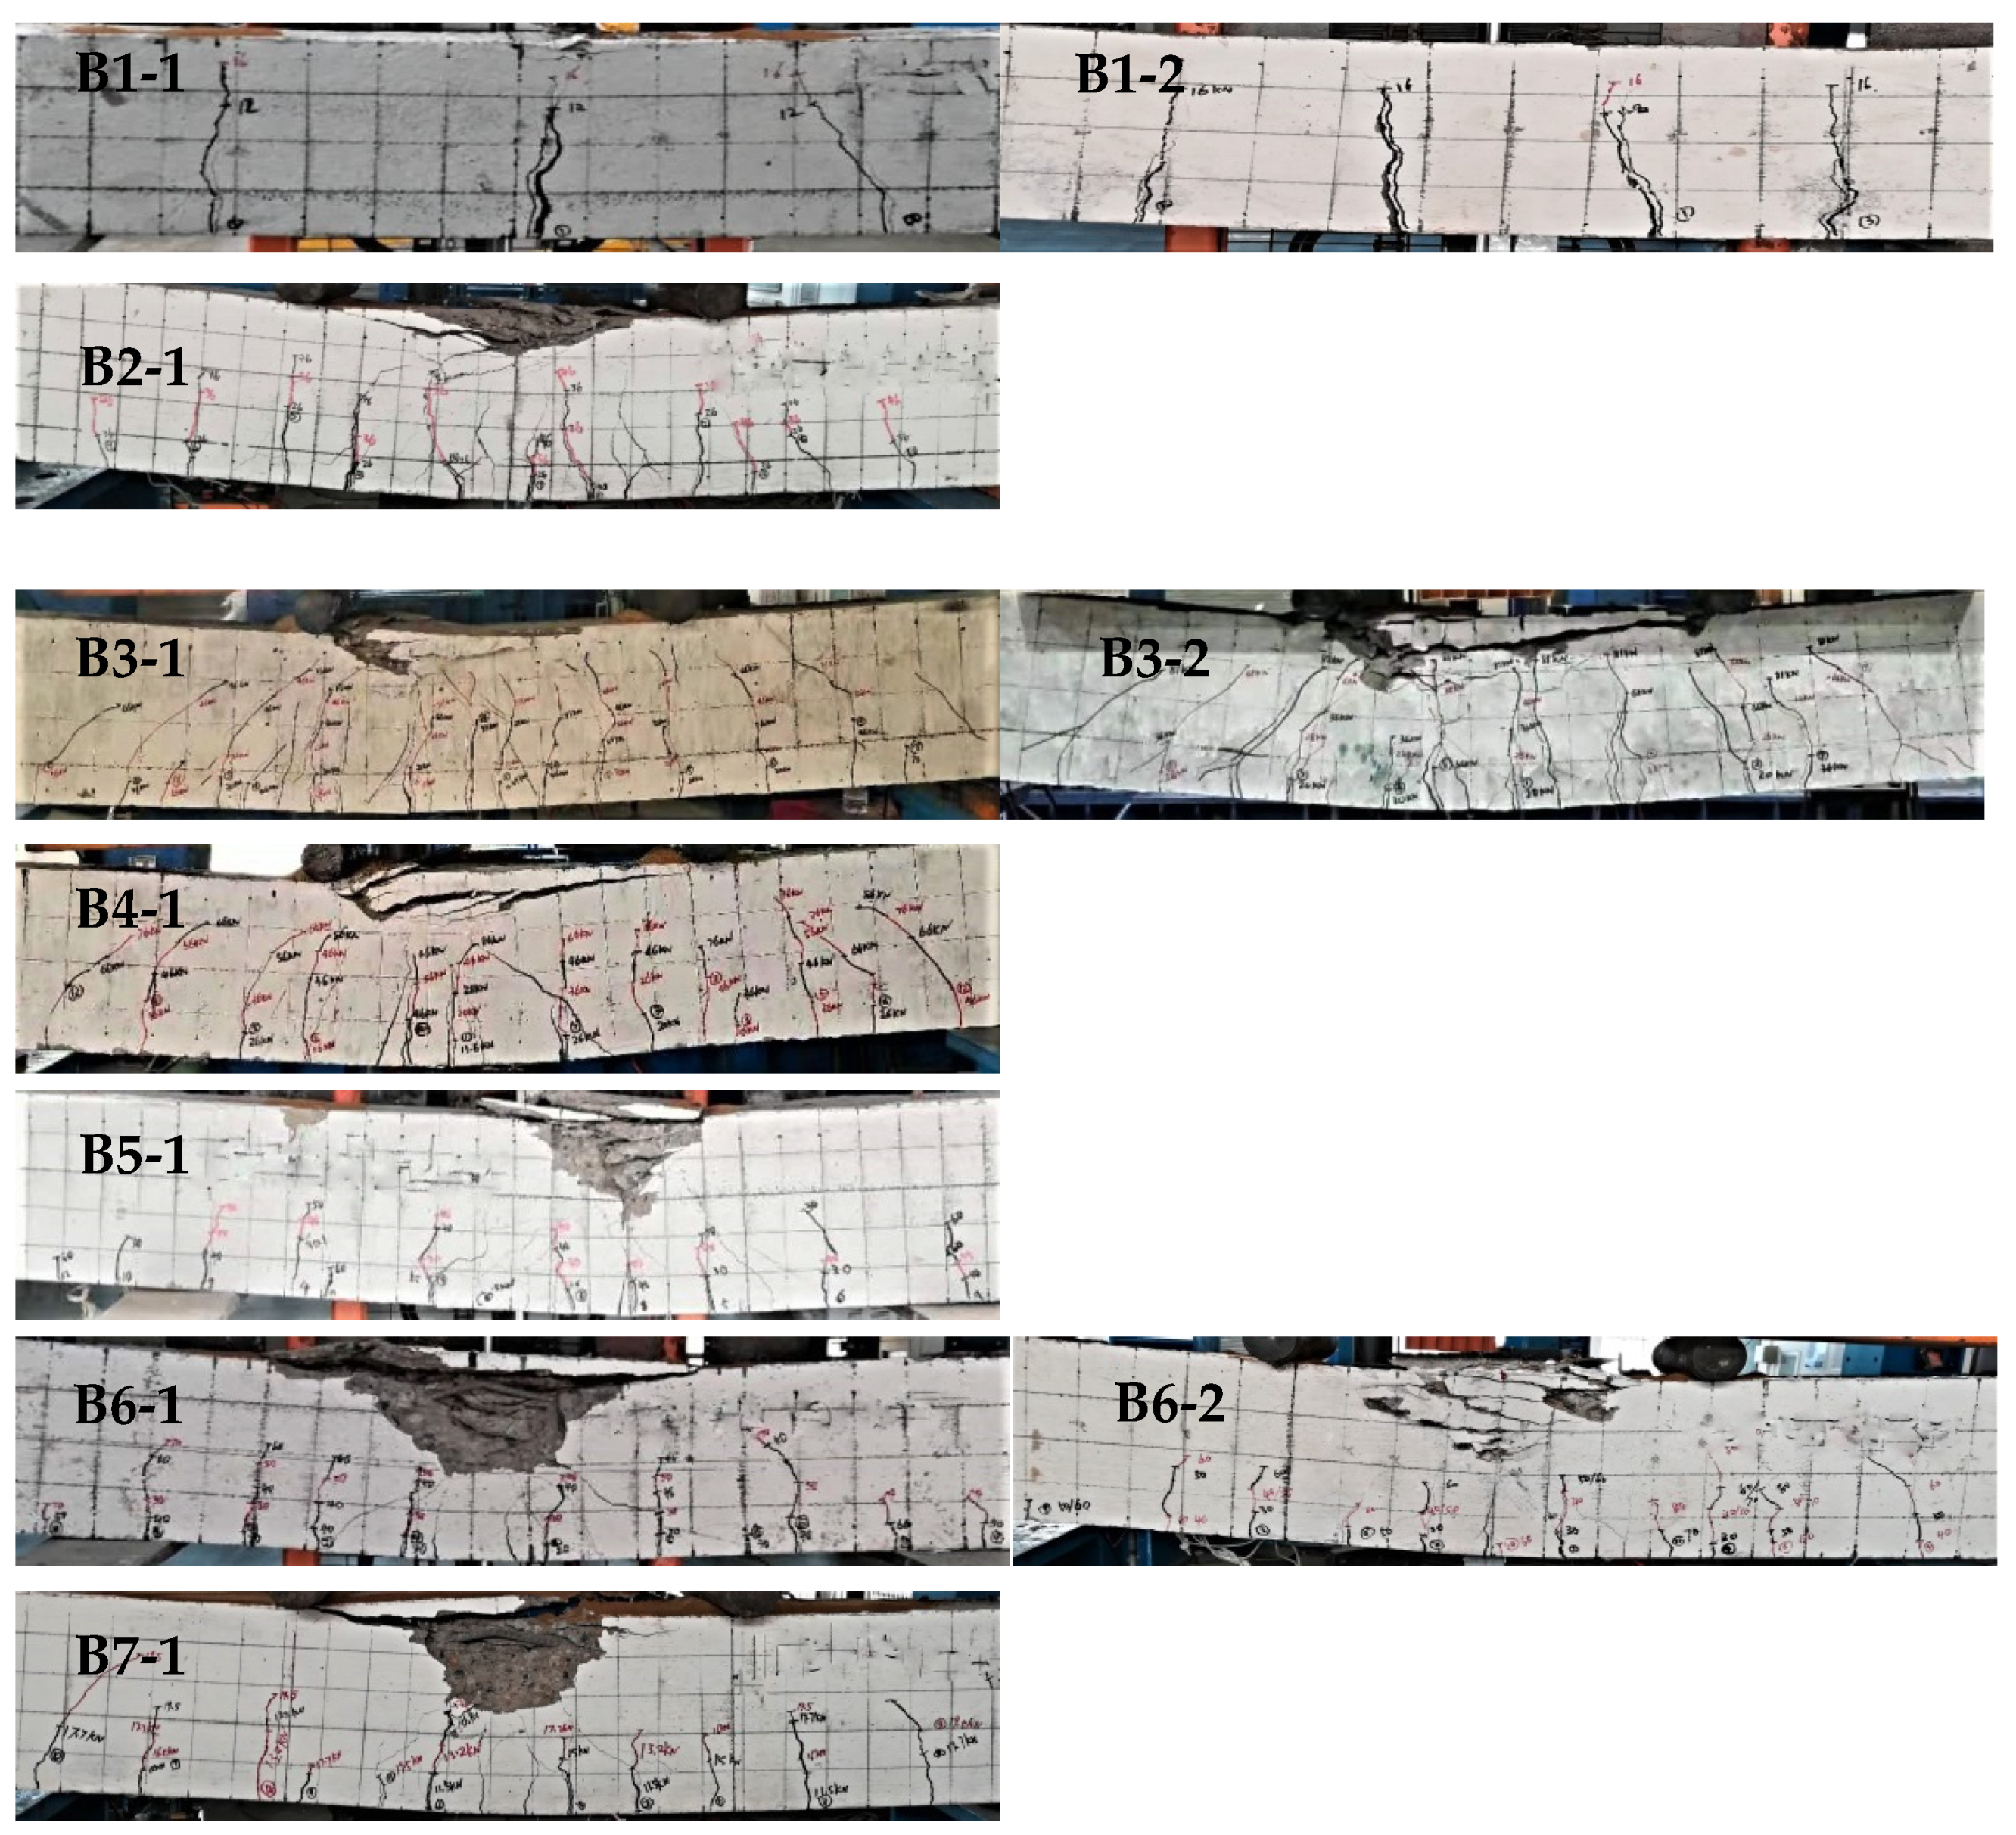
Figure 4 shows the failure form of RASCC beams under different reinforcement ratios. The failure form of these beams changed considerably with an increase in the reinforcement ratio. For example, once the concrete in the tensile zone of the RASCC beam B1-1 cracked at a reinforcement ratio of 0.25%, the tensile longitudinal bars yielded. At this point, the reinforcement strain reached 2680 με, while the concrete in the compressive zone remained uncrushed, resulting in typical under-reinforced beam failure. In this case, only a few cracks were observed within the purely bending section of the beam, and their lengths were similar to the beam length. Furthermore, the width of the main crack was significantly greater than those of the other cracks, which was consistent with the failure form of NC beam B1-2. However, the cracks in B1-1 were significantly wider and fewer, suggesting that the crack development in the RASCC under-reinforced beam was less adequate than that in the NC beam.
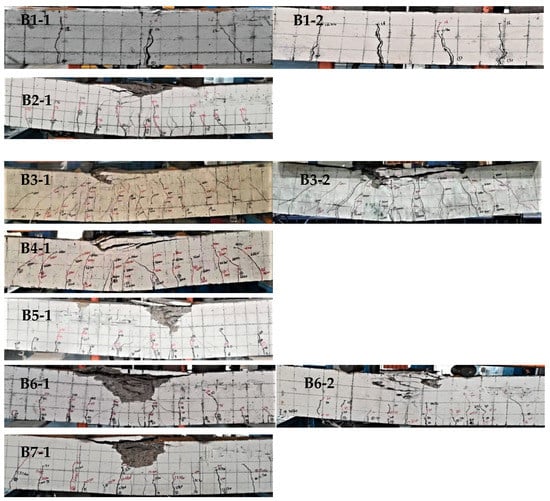
Figure 4.
Failure form of test beams.
At reinforcement ratios of 1.12–2.02%, the tensile longitudinal bars of the RASCC beams yielded first. Then, the strain in the compressive zone increased until the concrete was crushed, resulting in typical balanced-reinforced beam failure. At this point, with an increase in the reinforcement ratio, the average crack height of the RASCC beam gradually shortened, whereas the area of its compressive zone gradually increased. Moreover, both the crack height and the height of the compressive zone of the test beams gradually moved closer to the neutral axis. A comparison of the failure form between B3-1 and B3-2 beams suggested that the failure form of the RASCC beam was similar to that of the NC beam. However, the average crack interval and maximum crack width of B3-1 were smaller.
At the reinforcement ratio of 2.27%, the beam-bottom longitudinal reinforcement of RASCC beam B6-1 yielded. In addition, the concrete in the compressive zone bulged off, resulting in a balanced failure. However, the exposed longitudinal reinforcement of NC beam B6-2 had already buckled when the concrete in the compressive zone was crushed. At that point, the strain of the longitudinal reinforcement reached 1275 με. Therefore, the tensile longitudinal reinforcement did not yield, resulting in a typical over-reinforced failure. Additionally, B7-1, with a reinforcement ratio of 2.82%, experienced over-reinforced failure. The height and crushed area of the concrete in the compressive zone of the test beam far exceeded those of the balanced-reinforced beam, whereas the average crack interval of the former was sparser and the crack width was smaller than those of the latter. A comparison of the failure form between B6-1 and B6-2 beams suggested that the overall cracks were higher and wider in B6-1, indicating that the cracks in beam B6-1 were more fully developed than those in beam B6-2.
As the reinforcement ratio increased, the RASCC beams also underwent under-reinforced, balanced-reinforced, and over-reinforced failures similar to those in the NC beams. However, the average crack interval and crack width of the RASCC and NC beams varied with the reinforcement ratio.
3.2. Bending Moment–Deflection Curves
Figure 5 shows the bending moment–deflection curves of the RASCC beams under different reinforcement ratios. Before cracking, the RASCC beams were in the elastic phase and their bending moment–deflection curves varied linearly (i.e., the curves for all RASCC beams overlapped before cracking), indicating that the reinforcement ratio had no effect on the elastic stiffness of the curves. After cracking, the beam stiffness degraded. As cracking progressed, the concrete tensile zone gradually withdrew from work, resulting in a gradual increase in the bending moment carried by the tensile longitudinal reinforcements. However, the deflection of the test beam continued to increase linearly with the bending moment until the longitudinal reinforcement yielded. This stage was the elastic–plastic phase of the beam. The elastic–plastic stiffness of the RASCC beams under reinforcement ratios of 1.12–2.82% increased with the reinforcement ratio, while the under-reinforced beam B1-1 lacked the elastic–plastic phase. When the longitudinal bars yielded, the strain in the longitudinal bars increased rapidly. When the bending moment remained unchanged, the beam deflection increased dramatically, leading to a sharp increase in concrete strain in the compressive zone until the ultimate strain was reached. This stage was the plastic phase of the beam. The length of plastic deformation in the plastic phase of the RASCC beams under reinforcement ratios of 0.25–2.27% decreased with increasing reinforcement ratio. However, the plastic phase was missing in the over-reinforced beam B7-1.
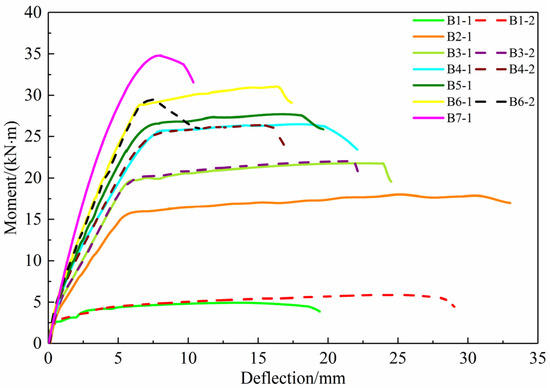
Figure 5.
Moment–deflection curves for different types of concretes and reinforcement ratios.
Figure 5 compares the moment–deflection curves of the RASCC and NC beams. The curves of the RASCC beams in the elastic and elastic–plastic phases agreed well with those of the NC beams. We conjectured that in the elastic phase, the beam stiffness was only related to the modulus of elasticity of the concrete, in addition to the moment of inertia of the transformed section. The modulus of elasticity of the RASCC beams did not differ much from that of the NC beams and, therefore, had little effect on elastic stiffness. In the elastic–plastic phase, the main factor affecting the beam stiffness was still the reinforcement ratio of the longitudinal bars. Therefore, the difference in stiffness between the RASCC and NC beams was also not significant under the same reinforcement ratio. This finding indicates that the mid-span deflections of the RASCC and NC beams in the elastic and elastic–plastic phases were equal, which is critical for the engineering application of RASCC beams. In the plastic phase, the yield moments of the RASCC beams were equal to those of the NC beams. Therefore, the plastic deformation section of the RASCC beams partially overlapped that of the NC beams. However, the plastic deformation section of the RASCC beams was 19–49% longer than that of the NC beams in the elastic–plastic phase, which was attributed to the difference in the modulus of elasticity and ultimate strain of the concrete in the compressive zone. In summary, the working deflection of the RASCC beams was almost equal to that of the NC beams, whereas the ductility of the former was better than that of the latter.
3.3. Reinforcement and Concrete Strain
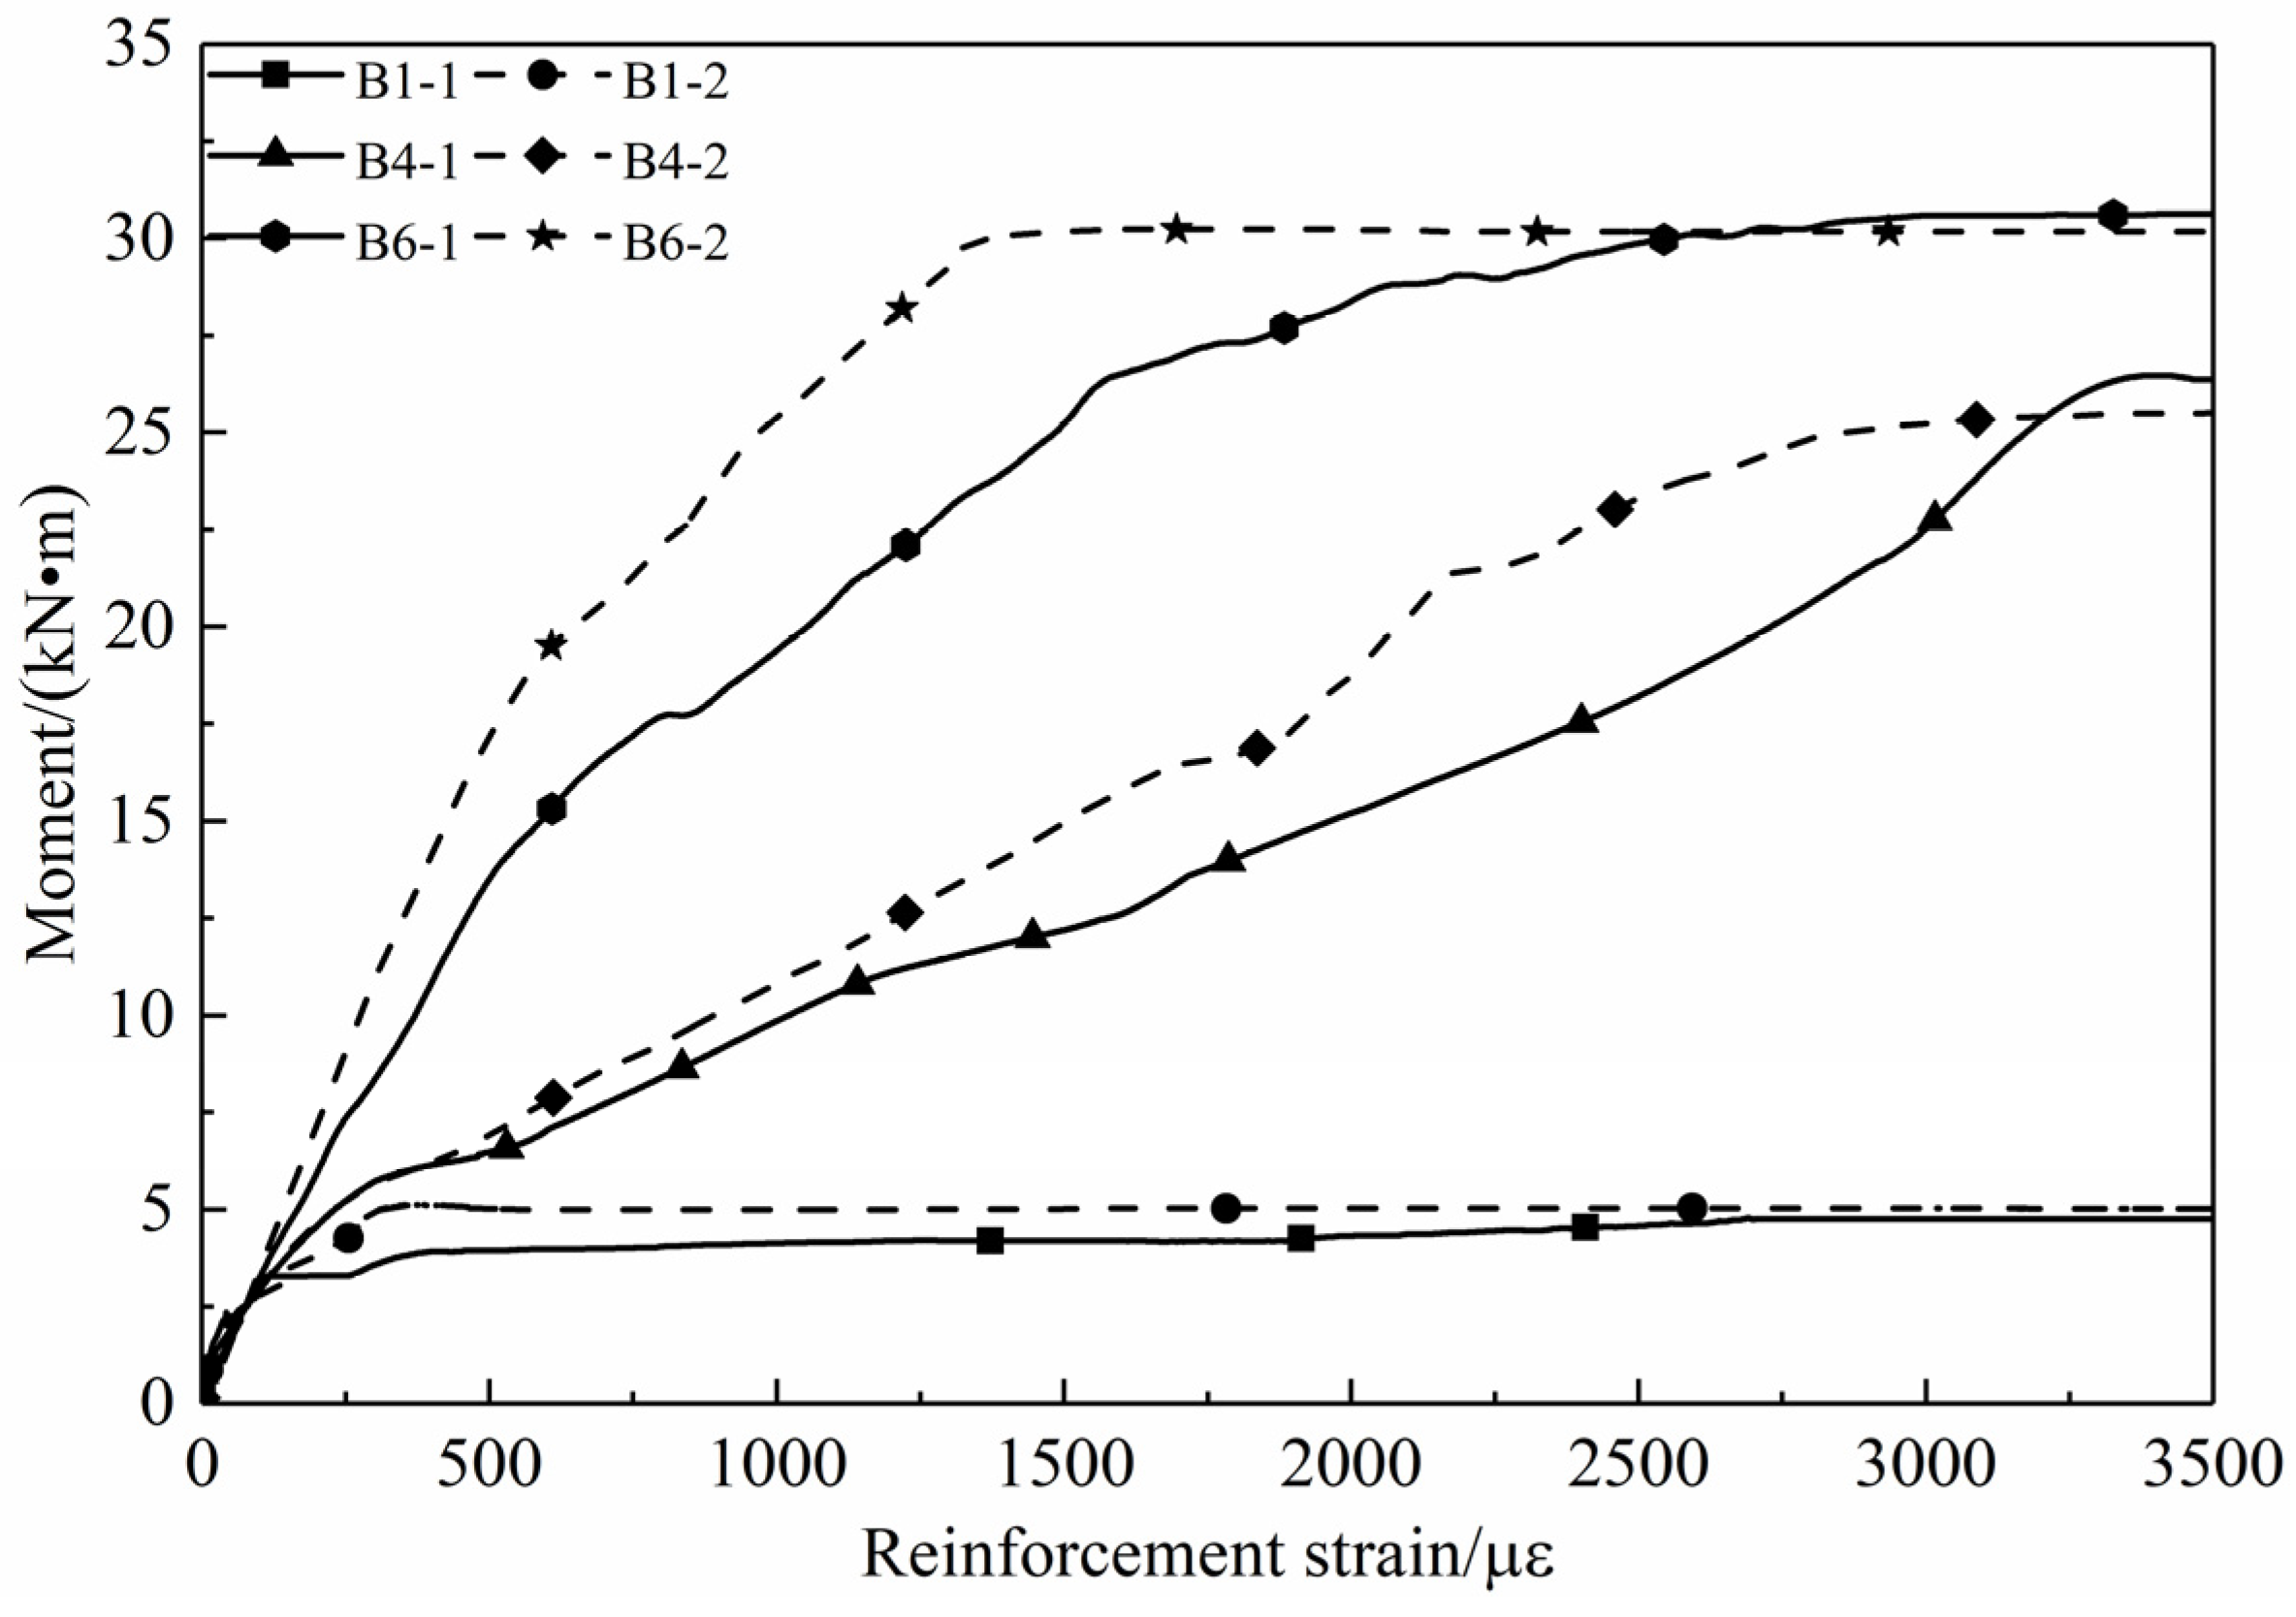
Figure 6 illustrates the moment–strain curves for part of the RASCC and NC beams. The reinforcement strain curves for the under-reinforced beams B1-1 and B1-2 overlapped. Only after cracking, the B1-1 curve was slightly lower than the B1-2 curve due to the slightly lower cracking load in B1-1 than that in B1-2. The strain development before cracking and after yielding of the longitudinal bar was similar for both balanced-reinforced beams B4-1 and B4-2. However, during the working phase between cracking and yielding, the strain increase of the tensile reinforcement accelerated, whereas the strain curve remained linear with the bending moment, resulting in a significant difference in the reinforcement strain between B4-1 and B4-2 beams at this stage. Under the same reinforcement conditions, the reinforcement strain in B4-1 was greater than that in B4-2. It is assumed that the earlier cracking of the B4-1 beam resulted in an earlier start of stressing of the longitudinal bar at the crack, resulting in a higher value of reinforcement strain for B4-1 under the same bending moment. Additionally, the reinforcement strains of test beams B6-1 and B6-2 significantly differed in the working phase between cracking and yielding (the strain curve of B6-1 was higher than that of B6-2). Furthermore, under ultimate load, the reinforcement yielded when the reinforcement strain increased to 2485 με. However, at a B6-2 reinforcement strain of 1275 με, the longitudinal bars had not yet yielded. Therefore, during the working phase between cracking and yielding of the longitudinal bars, the strain in the tensile reinforcement was greater in the RASCC beams than that in the NC beams.

Figure 6.
Moment–reinforcement strain curves for the RASCC and NC beams.
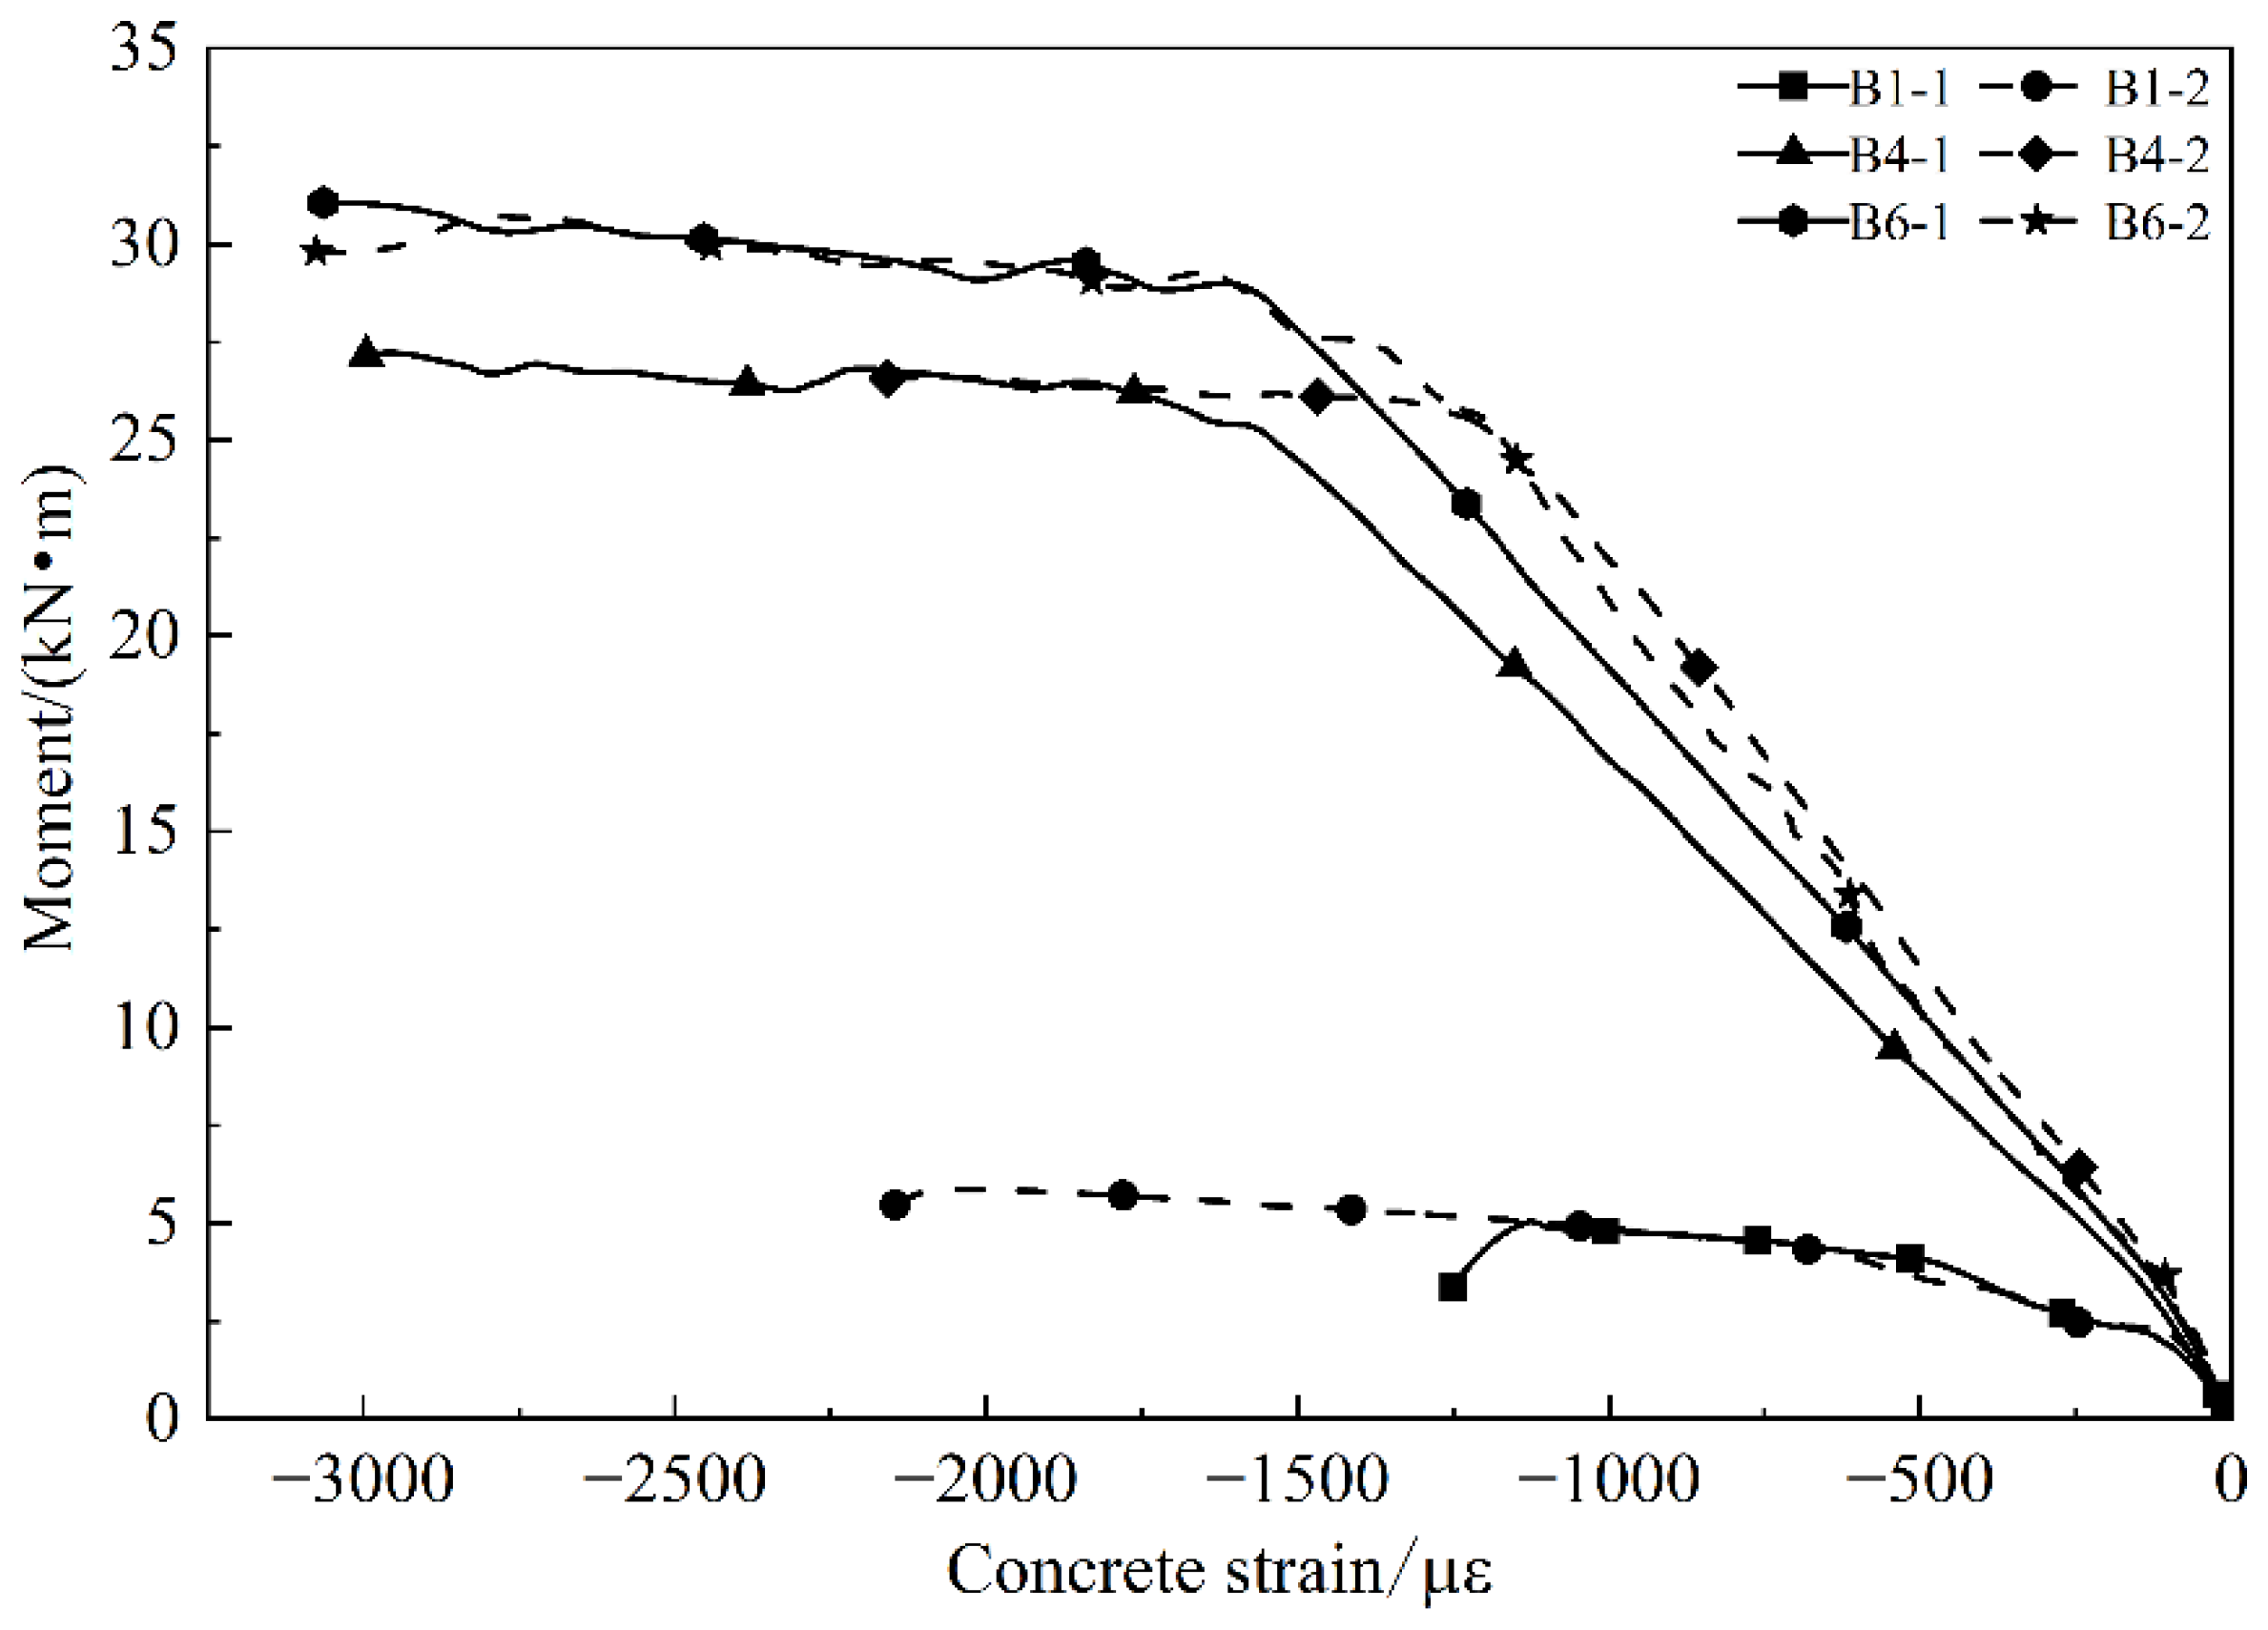
Figure 7 illustrates the variation in concrete strain and bending moment for parts of the RASCC and NC beams. The concrete strain curves for the under-reinforced beams B1-1 and B1-2 varied similarly. Moreover, when the specimens were damaged, none of the concrete deformations were sufficient. The strain curves for beams B4-1 and B4-2, as well as B6-1 and B6-2, were the same in the phase before concrete cracking and after yielding of the longitudinal bar. In the phase after cracking and before yielding the longitudinal bar, the concrete deformation accelerated and the strain curve continued to increase linearly with the bending moment. Furthermore, the concrete strains of B4-1 and B4-2, as well as B6-1 and B6-2, differed significantly, and those of B4-1 and B6-1 under the same bending moment were greater than those of B4-2 and B6-2. We hypothesized that this is attributable to the lower modulus of elasticity of RASCC compared to that of NC. Therefore, the higher deformation of B4-1 and B6-1 yielded higher strain values. Consequently, during the working phase between cracking and yielding of the longitudinal bar, the concrete strains induced on the RASCC beams were greater than those on the NC beams under the same reinforcement condition.
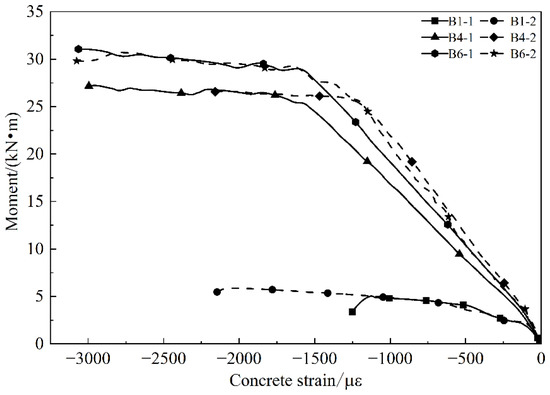
Figure 7.
Moment–concrete-strain curve for the RASCC and NC beams.
3.4. Crack Width and Average Crack Interval
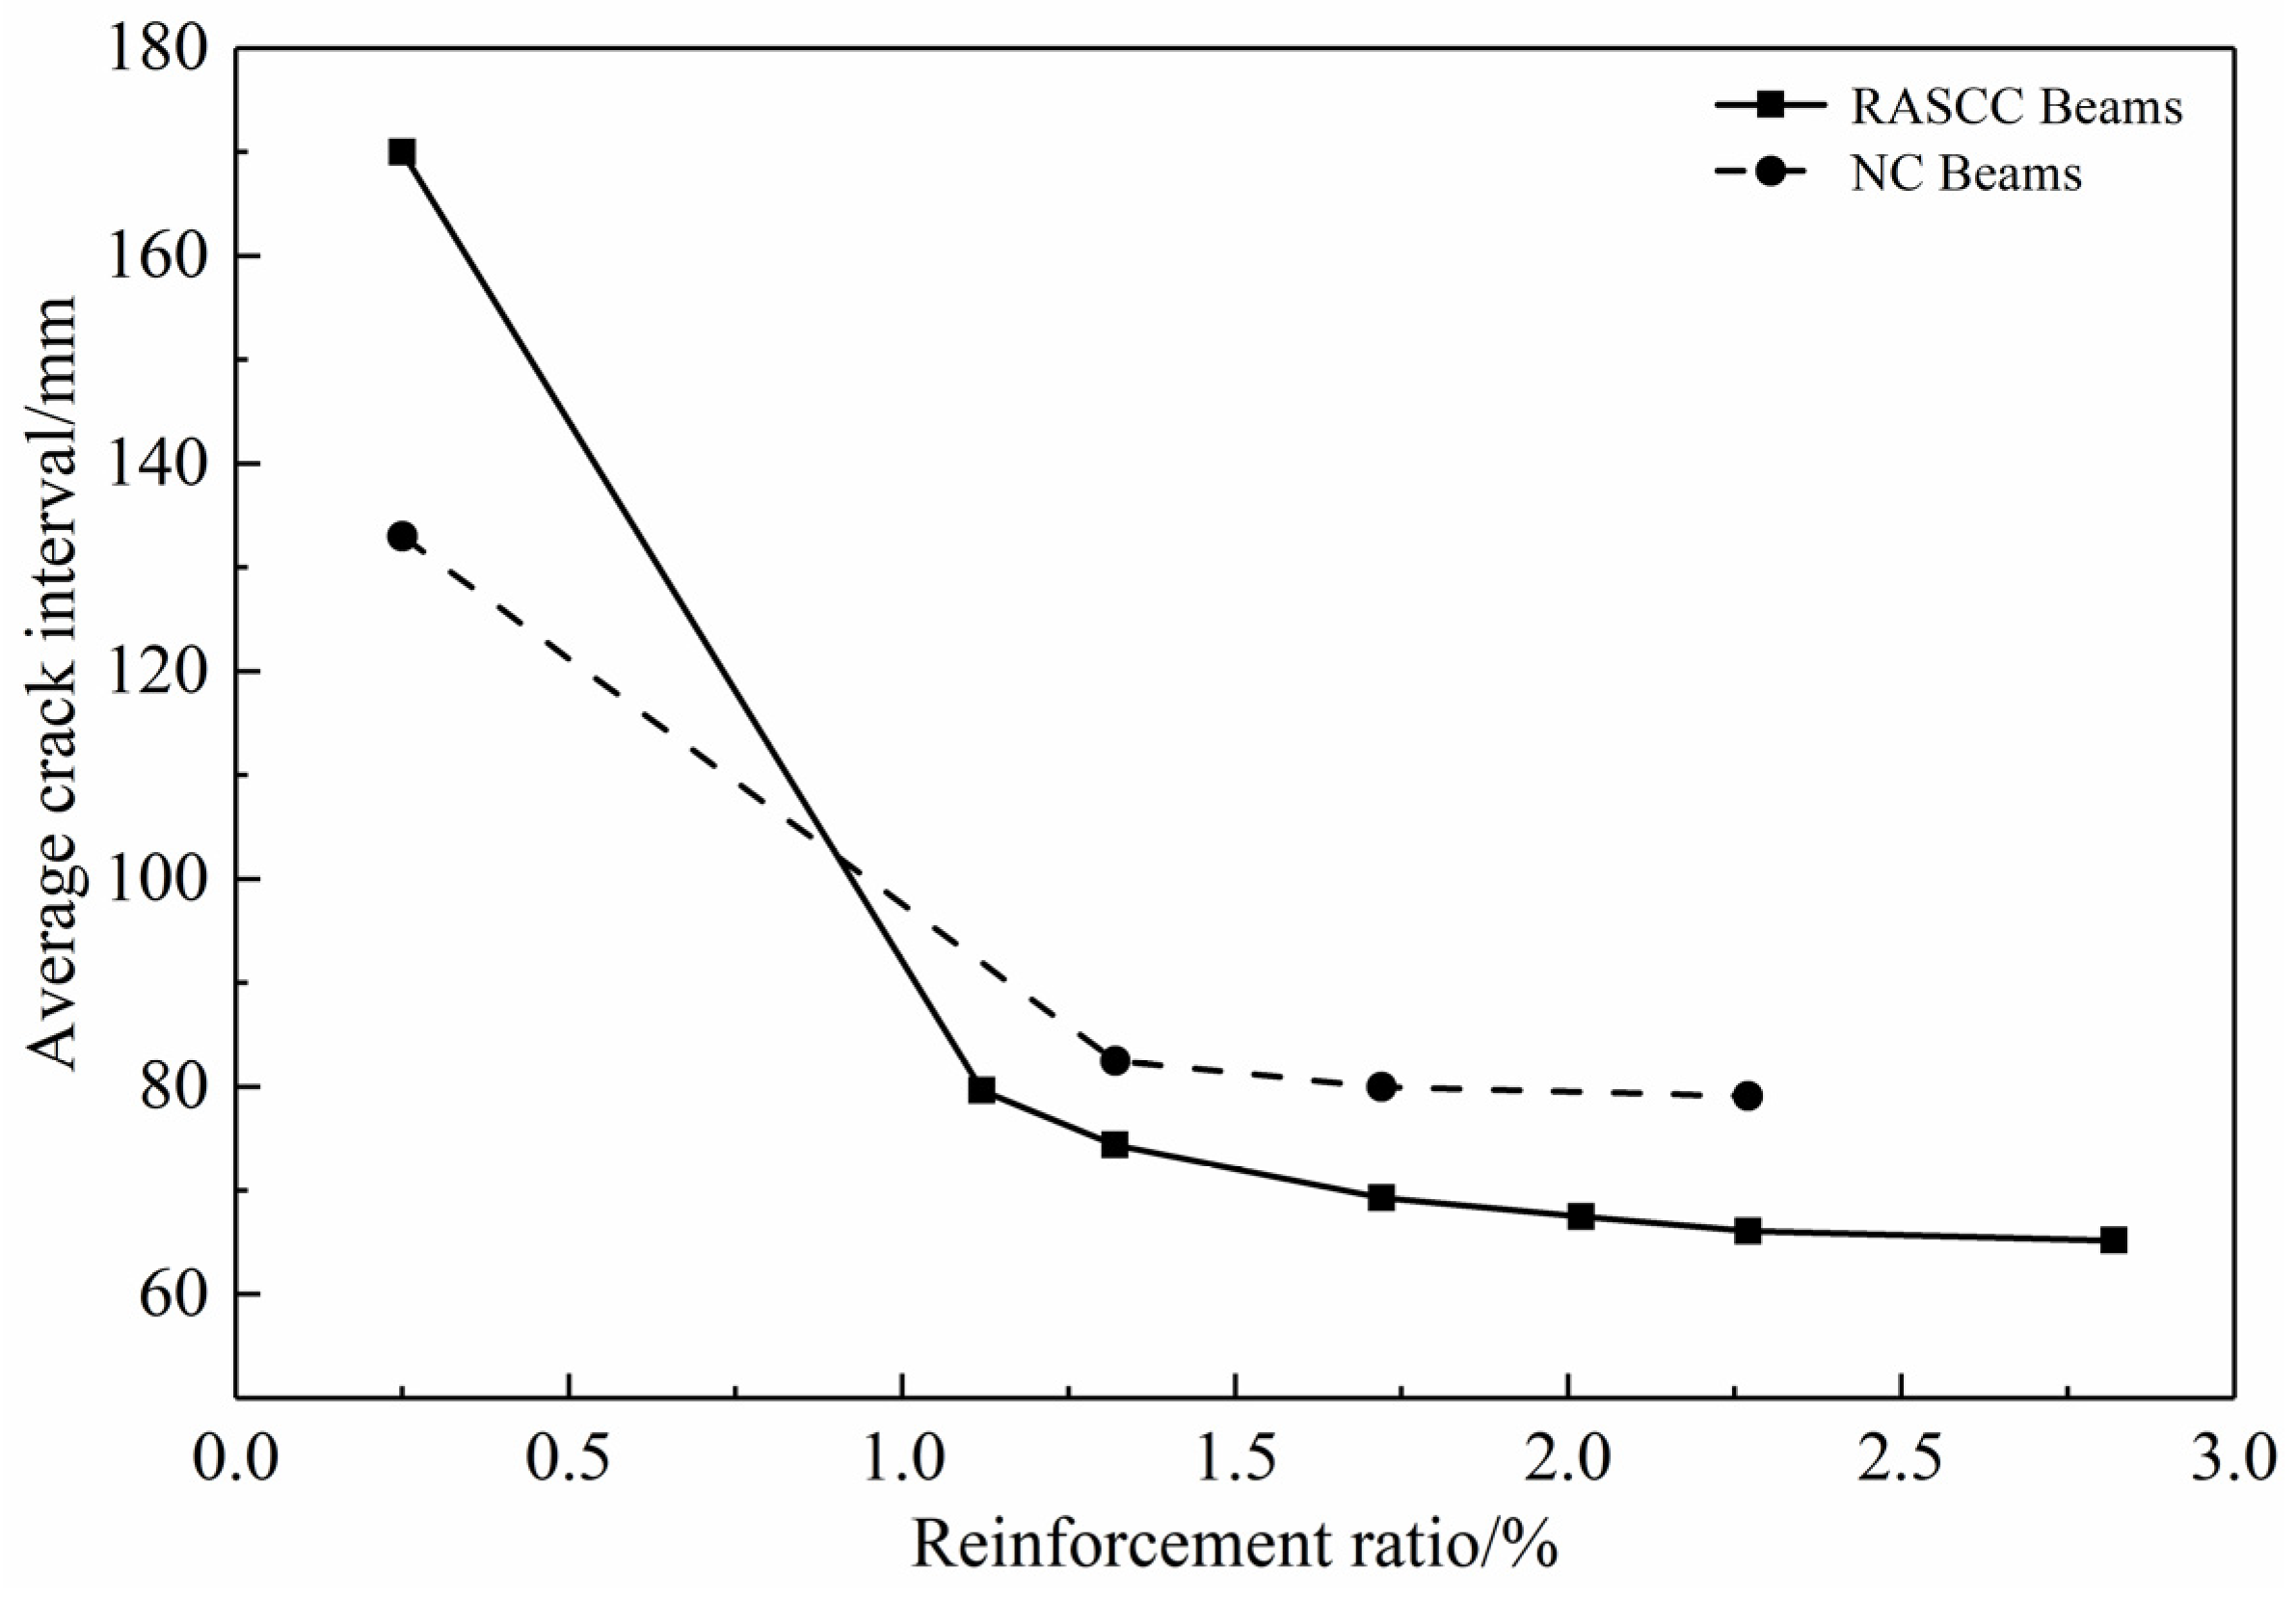
Figure 8 compares the average crack intervals for the different specimens. The average crack interval for both RASCC and NC beams gradually decreased with an increase in the reinforcement ratio of the longitudinal bars. As the reinforcement ratio was increased from 0.25% to 2.82%, the crack interval of the RASCC beams decreased by 62%. The increase in tensile longitudinal bar increased the ability of the reinforcement to restrain the concrete deformation, limiting the relative slip between the reinforcement and concrete, resulting in a reduction in the reinforcement stress transfer length and crack interval. Additionally, under the same reinforcement condition, the average crack interval of the RASCC beams was reduced by approximately 13% compared to the NC beams.

Figure 8.
Comparison of average crack interval between NC and RASCC beams.
Figure 9 shows the variation in crack widths in some of the test beams under each bending moment. The crack widths of the test beams increased with the bending moment. However, for the same bending moment, the crack widths of both beam types decreased with an increase in the reinforcement ratio of the longitudinal bars. Therefore, increasing the reinforcement ratio of the longitudinal bars can effectively inhibit crack development and limit crack width growth. Additionally, the crack width of the RASCC beams was smaller than that of the NC beams under the same reinforcement condition.
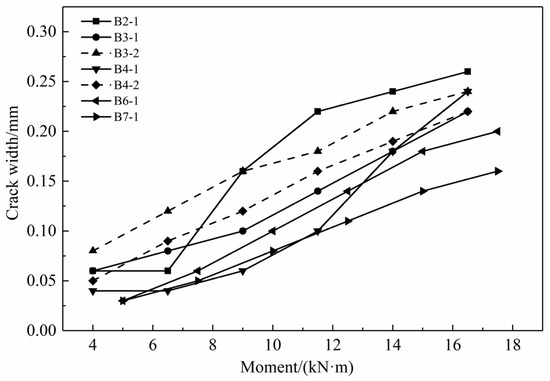
Figure 9.
Variation of crack width under bending moment.
4. Computational Models
The aforementioned test results showed that the ultimate bearing capacity of RASCC beams under the same reinforcement condition is approximately equal to that of NC beams. However, the cracking moment and crack width of RASCC beams are smaller than those of NC beams. Therefore, whether the cracking moment, flexural capacity, and maximum crack width of RASCC beams can be verified using the current code equations needs further discussion. Additionally, the above experimental results suggested that the working deflection of the RASCC beams was approximately equal to that of the NC beams. However, the strains in the reinforcement and concrete of the RASCC beams were significantly higher than those of the NC beams under the same load, which affected the short-term stiffness calculation of the RASCC beams. Therefore, adjusting the code stiffness equation in conjunction with the test results is necessary.
4.1. Cracking Moment
Due to the lack of relevant codes for designing RASCC structures at present, we conducted cracking moment calculations for seven RASCC beams and four NC beams, according to the Technical Standard for Recycled Concrete Structures (JGJ/T 443-2018) [30] with reference to the following equation in the code [29]:
where γm is the plastic influence coefficient of the sectional resistance moment (1.55 for rectangular sections); ft is the design value of the axial tensile strength of the concrete, which is obtained from the calculated compressive strength; I0 is the moment of inertia of the transformed section to its pivot axis; h is the section height; and y0 is the distance from the center of the transformed section to the edge of the compressive zone.
The cracking moments of both the RASCC and NC beams increased linearly with the reinforcement ratio of the longitudinal bars. As the reinforcement ratio was increased from 0.25% to 2.82%, the cracking moment of the RASCC beams increased by 43.2%. Under the same reinforcement condition, the cracking moment of the RASCC beams was approximately 15% lower than that of the NC beams.
Table 5a,b shows the calculation results of the cracking moments using the code equation. The four NC beams had a Mcr,t/Mcr,c mean and standard deviation of 1.110 and 0.105, respectively. The theoretical values for the NC beams were larger than the test values, which can ensure construction safety. The RASCC beams had a Mcr,t/Mcr,c mean and standard deviation of 1.030 and 0.116, respectively, which were smaller than the NC beam values. The test values agreed well with the calculated values, ensuring a certain safety reserve. Therefore, the current code equations can be used to calculate the cracking moment of RASCC beams.
Table 5.
(a). Comparison of experimental and code calculation results for RASCC beams. (b). Comparison of the experimental and code calculation results NC beams.
4.2. Flexural Capacity
We calculated the flexural capacity of the test beam under the basic assumptions for the flexural capacity calculation of normal sections in the current code [29] with the following equations:
where α1 is the simplified stress pattern coefficient for concrete in the compression zone (1.0), fc is the measured axial compressive strength of concrete, fy is the measured yield strength of the tensile reinforcement, x is the concrete’s height in the compressive zone, As is the cross-sectional area of tensile reinforcement, b is the cross-sectional width, and h0 is the effective height of the interface.
Table 5 shows that the flexural capacity of the under-reinforced beams increases significantly. For B1-1 and B2-1, the reinforcement ratio increased from 0.25% to 1.12%, and the flexural capacity increased by 265.3%. The flexural capacity of balanced-reinforced beams increased approximately linearly with the reinforcement ratio of the longitudinal bars. The reinforcement ratio of B2-1~B6-1 increased from 1.12% to 2.27%, and the flexural capacity increased by 72.4%. The growth rate of the flexural capacity of over-reinforced beams weakened significantly. For B6-1 and B7-1, when the reinforcement ratio increases from 2.27% to 2.82%, the flexural capacity increases by 13.1%. The ultimate bending moments of the RASCC and NC beams were approximately equal under the same reinforcement condition.
The specification equation for the flexural capacity of each specimen is shown in Table 5a,b. The bearing capacities of the NC and RASCC beams were relatively similar, with Mu,t/Mu,c mean values of 1.123 and 1.099, respectively. As the test values were greater than the theoretical values, construction safety can be ensured. Therefore, the current code equation can be used to calculate the flexural capacities of RASCC beams.
4.3. Deflection
The deflection values of the RASCC and NC beams were calculated according to the principle of minimum stiffness for deflection calculation of reinforced concrete flexural components and the calculation method in the code [29]. The calculation equation for short-term stiffness can be expressed as follows:
where Es is the modulus of elasticity of the reinforcement, ψ is the strain non-uniformity coefficient of the tensile longitudinal bar between cracks, η is the internal arm of the force coefficient, αE is the ratio of modulus of elasticity of the reinforcement to that of the concrete, ρ is the reinforcement ratio of the longitudinal tensile reinforcement, and ζ is the elastic–plastic resisting moment coefficient of the section.
We conducted deflection calculations for six RASCC beams and three NC beams according to the following equation in the code, expect the under-reinforced beams B1-1 and B1-2. Table 5b shows that the NC beam deflection calculated using the code [29] agreed well with the test values. However, the calculated deflection values for the RASCC beams derived from the code [29] were relatively small and failed to guarantee construction safety. As the reinforcement and concrete strains of the RASCC beams differed from those of the NC beams under service loads, appropriate corrections were made to the short-term stiffness equations based on the test results. The RASCC beams were reported to conform to the plane cross-section assumption [31]. Therefore, Equation (4) can be used to modify the short-term stiffness equation. In particular, we regressed the coefficients η, ζ, and ψ based on the measured data.
- (1)
- Internal arm of force coefficient η
Ignoring the effect of concrete tension on cracks, the internal arm of the force coefficient can be expressed as follows:
where M is the mid-span bending moment, εs is the strain on the longitudinal bar strain, and ES is the modulus of elasticity of the reinforcement.
The internal arm of force coefficient for the RASCC beams was calculated by substituting the test data into Equation (5) (Table 6). In this study, the mean value of the internal arm was 0.72, whereas the code took a value of 0.87. The internal arm of force coefficient for the RASCC beams was smaller than that for the NC beams. For both RASCC and NC beams with the same reinforcement ratio and concrete strength, the strain on the longitudinal bars of the RASCC beam was greater than that of the NC beam under the same load. Therefore, the internal arm of force coefficient was slightly smaller for the RASCC beams.
Table 6.
Regression calculation results of mid-span deflection.
- (2)
- Elastic–plastic resisting moment coefficient of the section ζ
Based on the relevant equations of material mechanics, the elastic–plastic resisting moment coefficient of the section can be expressed as follows:
where Ec is the modulus of elasticity of the concrete and εcm is the average strain on the concrete at the compressive zone edge.
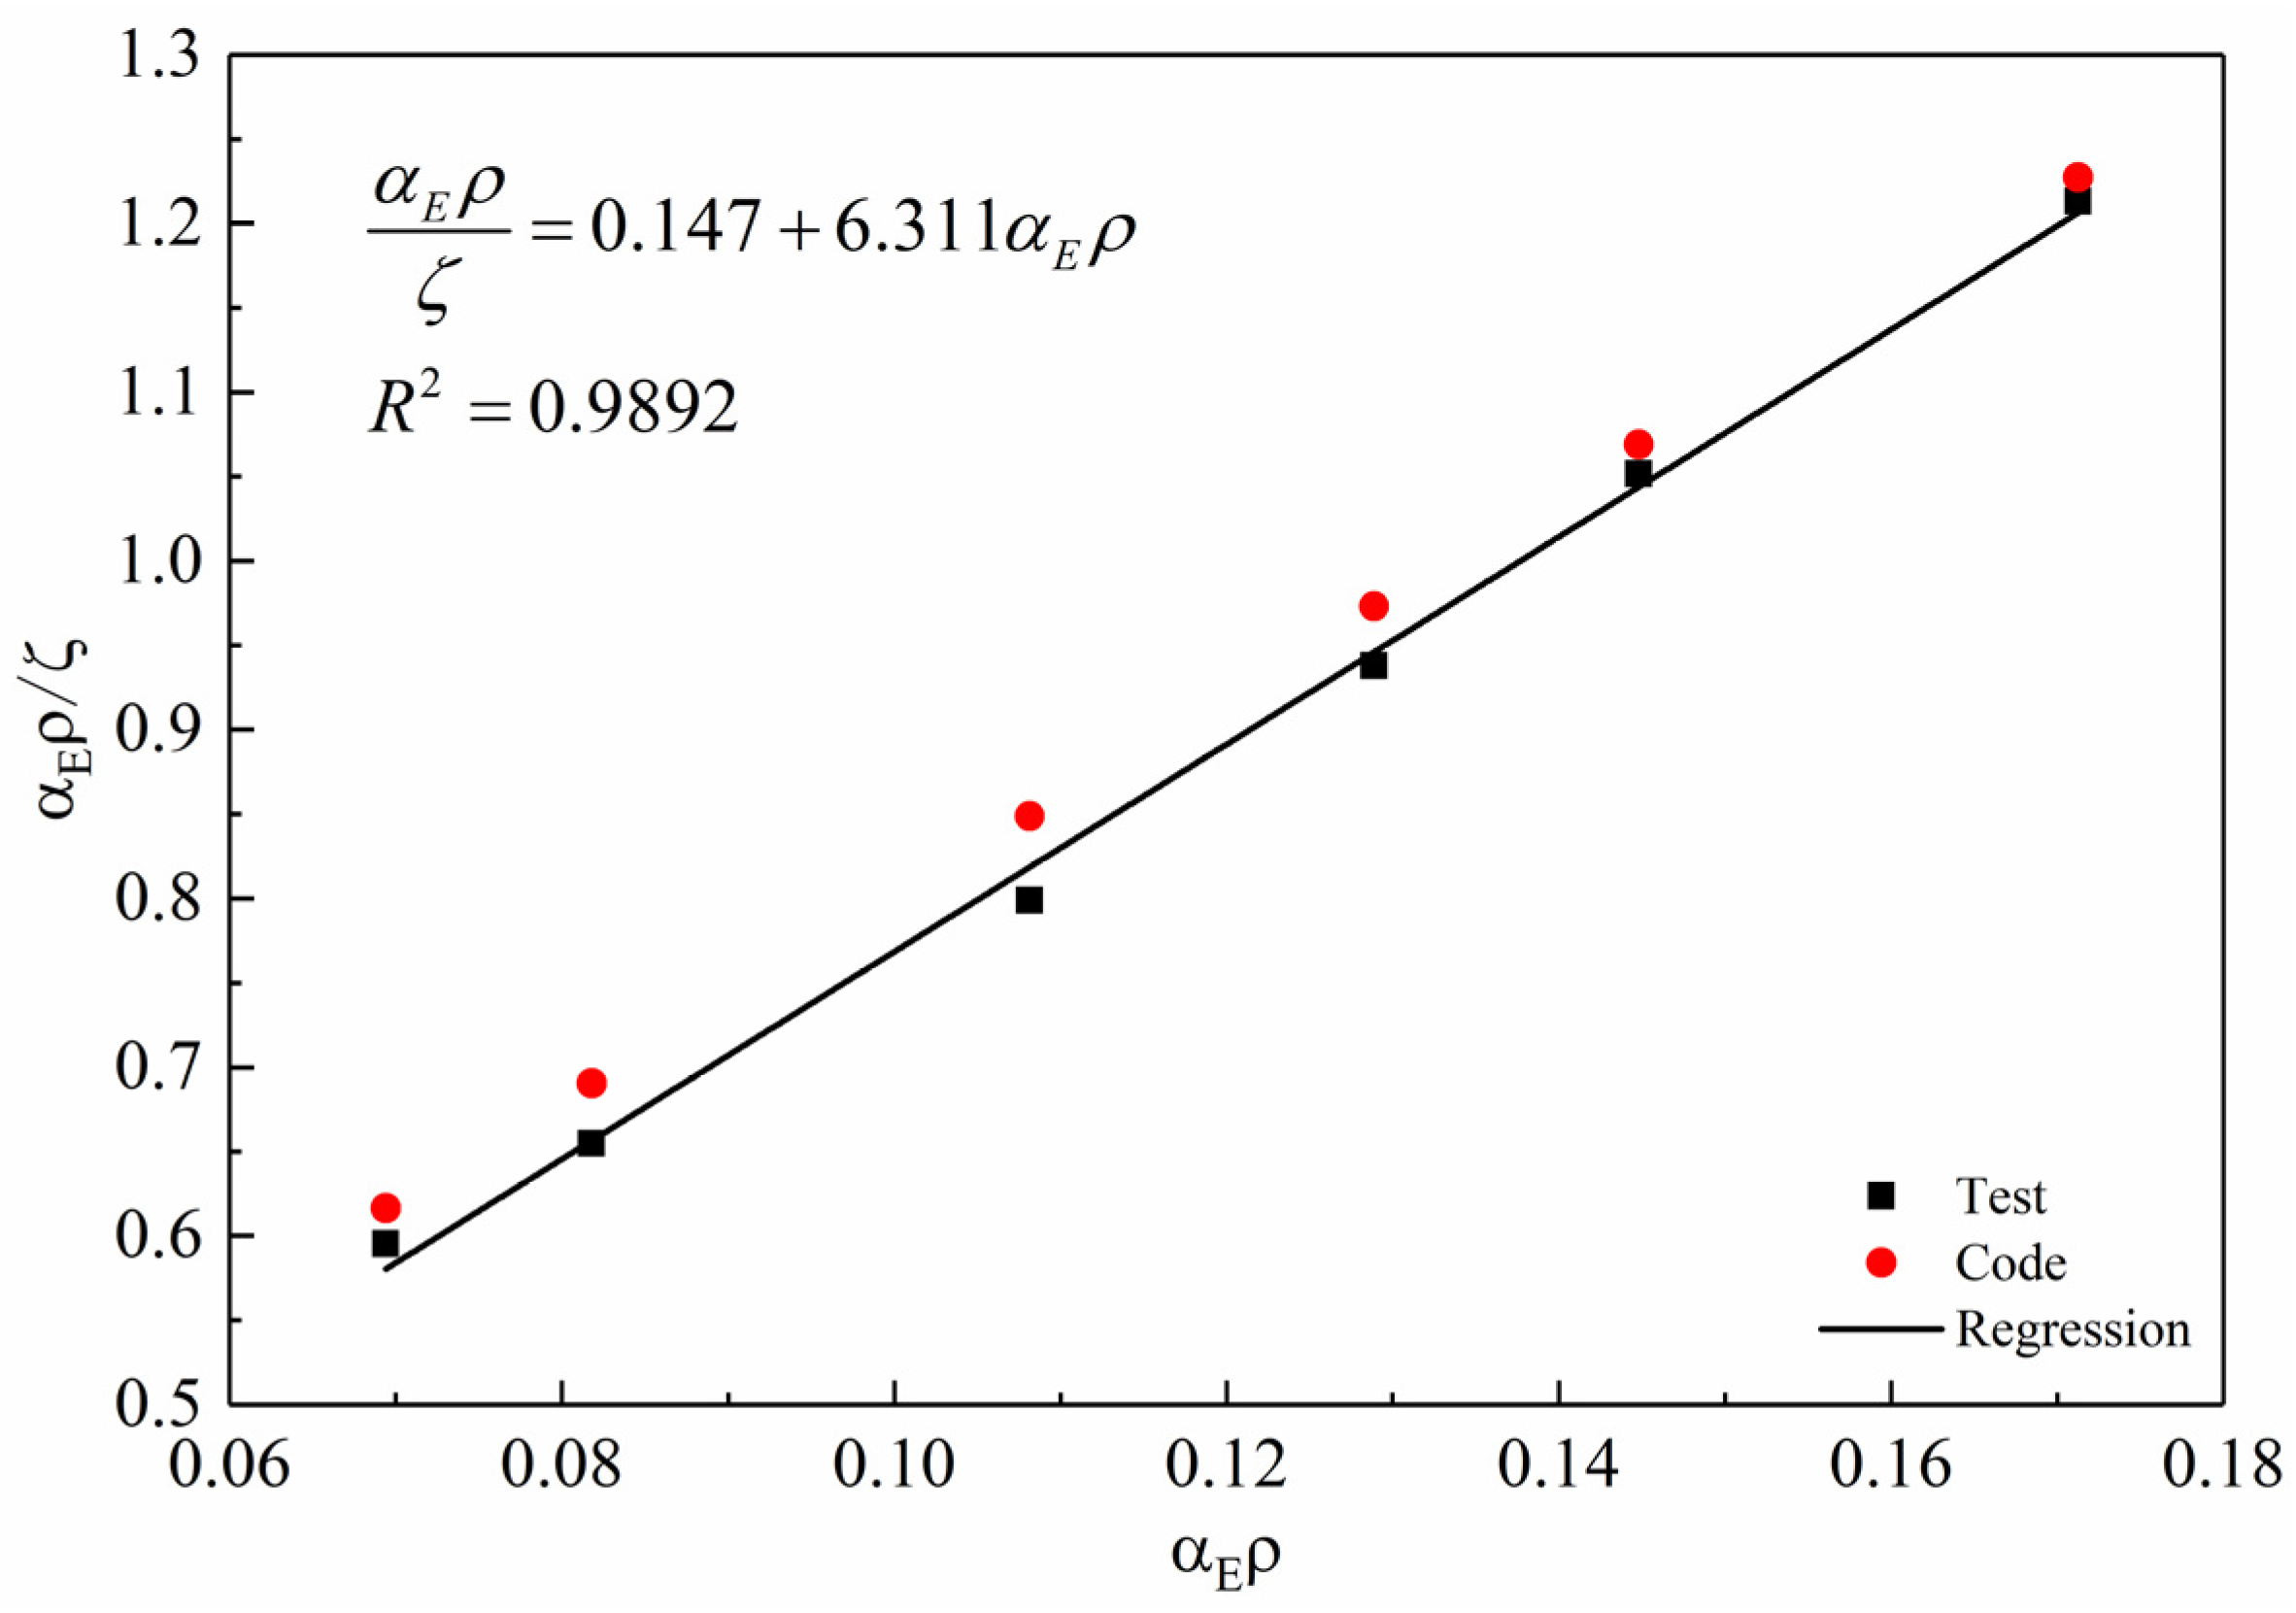
The test values of ζ of the RASCC beams were calculated from the measured data by Equation (6). With reference to the expression of ζ in the code regarding the transformed reinforcement ratio αEρ, the relational expression of ζ of the RASCC beams was obtained based on the test data (Figure 10).
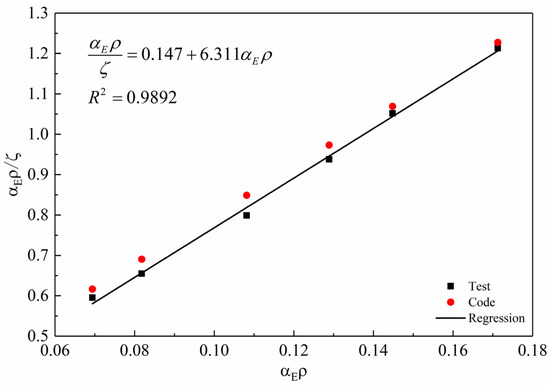
Figure 10.
Regression of the elastic–plastic resisting moment coefficient.
Figure 10 shows that the ζ value of the RASCC beams was greater than that in the code. As the compressive strength of the RASCC beams was relatively smaller than that of the NC beams under the same reinforcement condition, the height of the compressive zone of the RASCC beams under the same bending moment was slightly larger, resulting in a larger ζ value. Additionally, the ζ value obtained from the regression of the measured data in this study agreed well with the measured results.
- (3)
- Non-uniformity coefficient ψ
The non-uniformity coefficient ψ can be expressed as ψ = ε1/ε2, where ε1 is the reinforcement strain between the cracks and ε is the reinforcement strain at the crack. According to the code requirements [29], the relational expression between the non-uniformity coefficient of a concrete beam and the tensile strength of the concrete, reinforcement ratio, and reinforcement strain was obtained as follows:
where ft is the measured axial tensile strength of the concrete, ρte is the effective reinforcement ratio, and σs is the reinforcement stress at the section.
Using Equation (7) as a reference, we ran a regression based on the measured values of ψ and ρteσs for the RASCC beams and obtained the results shown in Figure 11.
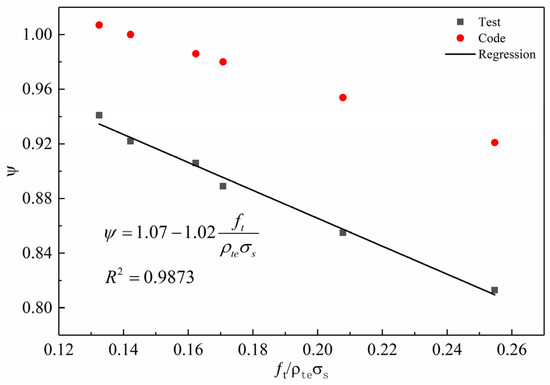
Figure 11.
Regression of non-uniformity coefficient.
The non-uniformity coefficient ψ reflects the degree to which the reinforcement works together with the concrete, with smaller values indicating a higher degree of concrete–reinforcement collaboration (i.e., a stronger bond between the reinforcement and concrete). Figure 11 shows that the ψ values of the RASCC beams were relatively smaller than the value specified in the code, indicating that the RASCC beams were more involved in the force bearing and had a better bond with the reinforcement. Due to the large difference between the code-based calculated values and the test results, the proposed ψ value based on the test data in this study agrees well with the actual situation.
- (4)
- Deflection calculation
Substituting the relational expressions of η, ζ, and ψ into Equation (4), the equations for the short-term stiffness and deflection of the RASCC beams can be derived as follows:
To validate the proposed stiffness equations, the short-term stiffness and deflection for the RASCC beams were calculated based on Equations (8) and (9), respectively (Table 6). The mean and standard deviation of δcl/δt calculated according to the proposed deflection equation were 1.003 and 0.017, respectively, indicating that the calculated value δcl agreed well with the measured value δt. Therefore, the proposed deflection equation has good applicability to RASCC beams.
4.4. Crack Width
We calculated the maximum crack width of the test beam according to the crack-control principle and calculation model in the code [29] with the following equation:
where αcr is the mechanics characteristic coefficient of the component, ψ is the non-uniformity coefficient, η is the internal arm of force coefficient, and lm is the average crack interval.
Table 7a,b lists the measured value wmax,t and code calculation value wmax,c of the maximum crack widths for the six RASCC beams and three NC beams at 0.5 and 0.6 Mu. The comparison test results showed that the crack widths of the RASCC beams were smaller than those of the NC beams under the same reinforcement condition. According to the bond-slip theory, when the bond between the reinforcement and concrete is larger, the crack interval is short and the crack width is small. Owing to the better bond between RASCC and reinforcement, the crack width of the RASCC beams was smaller than that of the NC beams. Furthermore, the mean and standard deviation of the ratio of calculated to measured values for the NC beams were 1.031 and 0.017, respectively, whereas those for the RASCC beams were 1.205 and 0.190. Consequently, using the code equation to calculate the crack widths for the RASCC beams yielded larger values and overly conservative results. Therefore, we made appropriate corrections to the code equation based on the measured data.
Table 7.
(a). Comparison of the experimental and calculation results for crack width of RASCC
beams. (b). Comparison of the experimental and calculation results for crack width of NC beams.
- (1)
- Average crack interval lm
In this test, the crack interval was measured. Based on the measured data and referring to the mean crack interval relationship model in the code [29], a relational expression for the mean crack intervals of the RASCC beams was derived (Figure 12). The measured lm values of the RASCC beams were smaller than the results of the code calculation, yielding a conservative value obtained using the code calculation. Therefore, the modified equation proposed in this paper agreed well with the test results.
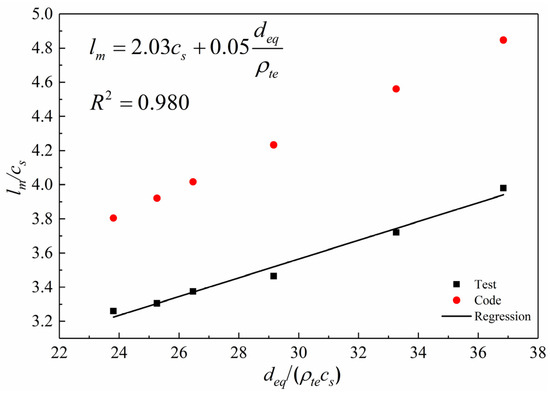
Figure 12.
Regression of average crack interval.
- (2)
- Crack width
The corrected relational expressions for ψ, η, and lm were substituted into Equation (10) to obtain the crack width for the RASCC beams:
To verify the applicability of the proposed equation, the crack widths of the RASCC beams at 0.5 and 0.6 Mu were calculated based on Equation (11) (Table 7a). The mean and standard deviation of wmax,cl/wmax,t were 1.048 and 0.152, respectively, indicating that the proposed equation agreed well with the test data and had less dispersion. Therefore, the equation for the maximum crack width proposed in this paper has good applicability to the flexural components of RASCC beams.
5. Conclusions
In this paper, the flexural properties of RASCC beams with different reinforcement ratios, as well as their comparison with those of NC beams were investigated by experiment and analysis. The following conclusions were drawn from the tests:
- (1)
- The bending failure form of RASCC beams is similar to that of NC beams. Under-reinforced, balanced-reinforced, and over-reinforced failures occur as the reinforcement ratio increases in RASCC beams.
- (2)
- Under the same reinforcement ratio, the flexural capacity of RASCC is almost equal to that of NC beams, while the cracking moment of beams is smaller. The cracking moment and flexural capacity of RASCC beams calculated using the code equation agree well with the test results.
- (3)
- The moment–deflection curve of RASCC beams almost coincides with that of NC beams in the elastic and elastic–plastic phases. However, the deflection of RASCC beams calculated using the code equation is smaller than the test values, while the revised formula in this paper is close to the test results.
- (4)
- RASCC beams exhibit smaller crack widths and shorter crack intervals than NC beams under the same reinforcement condition. Compared with the test results of the maximum crack width, the calculated value of the code equation is larger, and the method proposed in this paper agrees well with it.
Overall, this study achieves plausible results and does beneficially contribute to the research of self-compacting concrete beams with recycled aggregate. However, these results are related to the test conditions in this study, and the conclusions are neither general nor exhaustive. Therefore, further validation is required for more comprehensive studies. In addition, the tests were carried out on small-sized beams and aggregate up to 20 mm was used, in order to ensure accuracy of the test results but without the conclusion being distorted in the form of economies of scale affected.
Author Contributions
Conceptualization, F.Y. and D.Y.; Methodology, F.Y., D.Y. and W.Y.; Formal Analysis, M.W.; Investigation, F.Y. and D.Y.; Data Curation, W.Y.; Writing—Original Draft Preparation, M.W.; Writing—Review and Editing, F.Y. and D.Y.; Supervision, D.Y.; Funding Acquisition, F.Y. and D.Y. All authors have read and agreed to the published version of the manuscript.
Funding
This research was funded by [National Natural Science Foundation of China] grant number [51608331]. This research was funded by [Scientific Research Funding Project of the Educational Department of Liaoning Provincial] grant number [LJKZ0149 and LJKZ0151].
Institutional Review Board Statement
Not applicable.
Informed Consent Statement
Not applicable.
Data Availability Statement
Not applicable.
Conflicts of Interest
The authors declare no conflict of interest.
References
- Kefelegn, A.; Gebre, A. Performance of self-compacting concrete used in congested reinforcement structural element. Eng. Struct. 2020, 214, 110665. [Google Scholar] [CrossRef]
- Pacheco, J.; de Brito, J. Recycled aggregates produced from construction and demolition waste for structural concrete, constituents, properties and production. Materials 2021, 14, 5748. [Google Scholar] [CrossRef] [PubMed]
- Aslani, F.; Ma, G.; Wan, D.L.Y.; Muselin, G. Development of high-performance self-compacting concrete using waste recycled concrete aggregates and rubber granules. J. Clean. Prod. 2018, 182, 553–566. [Google Scholar] [CrossRef]
- Sun, C.; Chen, Q.; Xiao, J.; Liu, W. Utilization of waste concrete recycling materials in self-compacting concrete. Resour. Conserv. Recycl. 2020, 161, 104930. [Google Scholar] [CrossRef]
- Martínez-García, R.; Guerra-Romero, M.I.; Pozo, J.M.M.-D.; de Brito, J.; Juan-Valdés, A. Recycling Aggregates for Self-Compacting Concrete Production: A Feasible Option. Materials 2020, 13, 868. [Google Scholar] [CrossRef] [Green Version]
- Revilla-Cuesta, V.; Skaf, M.; Faleschini, F.; Manso, J.M.; Ortega-López, V. Self-compacting concrete manufactured with recycled concrete aggregate: An overview. J. Clean. Prod. 2020, 262, 121362. [Google Scholar] [CrossRef]
- Duan, Z.H.; Singh, A.; Xiao, J.Z.; Hou, S.D. Combined use of recycled powder and recycled coarse aggregate derived from construction and demolition waste in self-compacting concrete. Constr. Build. Mater. 2020, 254, 119323. [Google Scholar] [CrossRef]
- Hilal, N.; Hadzima-Nyarko, M. Improvement of eco-efficient self-compacting concrete manufacture by recycling high quantity of waste materials. Environ. Sci. Pollut. Res. 2021, 28, 53282–53297. [Google Scholar] [CrossRef]
- Nili, M.; Sasanipour, H.; Aslani, F. The Effect of Fine and Coarse Recycled Aggregates on Fresh and Mechanical Properties of Self-Compacting Concrete. Materials 2019, 12, 1120. [Google Scholar] [CrossRef] [Green Version]
- Nieto, D.; Dapena, E.; Alaejos, P.; Olmedo, J.; Pérez, D. Properties of Self-Compacting Concrete Prepared with Coarse Recycled Concrete Aggregates and Different Water:Cement Ratios. J. Mater. Civ. Eng. 2019, 31, 4018376. [Google Scholar] [CrossRef]
- Revilla-Cuesta, V.; Ortega-López, V.; Skaf, M.; Manso, J.M. Effect of fine recycled concrete aggregate on the mechanical behavior of self-compacting concrete. Constr. Build. Mater. 2020, 263, 120671. [Google Scholar] [CrossRef]
- Sasanipour, H.; Aslani, F. Durability properties evaluation of self-compacting concrete prepared with waste fine and coarse recycled concrete aggregates. Constr. Build. Mater. 2019, 236, 117540. [Google Scholar] [CrossRef]
- Mo, K.H.; Lingt, C.; Cheng, Q. Examining the Influence of Recycled Concrete Aggregate on the Hardened Properties of Self-Compacting Concrete. Waste Biomass Valorization 2021, 12, 1133–1141. [Google Scholar] [CrossRef]
- Ignjatović, I.S.; Marinković, S.B.; Mišković, Z.M.; Savić, A. Flexural behavior of reinforced recycled aggregate concrete beams under short-term loading. Mater. Struct. 2012, 46, 1045–1059. [Google Scholar] [CrossRef]
- Knaack, A.M.; Kurama, Y.C. Behavior of Reinforced Concrete Beams with Recycled Concrete Coarse Aggregates. J. Struct. Eng. 2015, 141, B4014009. [Google Scholar] [CrossRef]
- Paz, S.S.; González-Fonteboa, B.; Martínez-Abella, F.; Eiras-López, J. Flexural performance of reinforced concrete beams made with recycled concrete coarse aggregate. Eng. Struct. 2018, 156, 32–45. [Google Scholar] [CrossRef]
- Zhang, H.; Wan, K.; Wu, B.; Hu, Z. Flexural behavior of reinforced geopolymer concrete beams with recycled coarse aggregates. Adv. Struct. Eng. 2021, 24, 3281–3298. [Google Scholar] [CrossRef]
- Arezoumandi, M.; Smith, A.; Volz, J.S.; Khayat, K.H. An experimental study on flexural strength of reinforced concrete beams with 100% recycled concrete aggregate. Eng. Struct. 2015, 88, 154–162. [Google Scholar] [CrossRef]
- Sunayana, S.; Barai, S.V. Flexural performance and tension-stiffening evaluation of reinforced concrete beam incorporating recycled aggregate and fly ash. Constr. Build. Mater. 2018, 174, 210–223. [Google Scholar] [CrossRef]
- Yang, I.H.; Park, J.; Kim, K.C.; Lee, H. Structural behavior of concrete beams containing recycled coarse aggregates under flexure. Adv. Mater. Sci. Eng. 2020, 2020, 8037131. [Google Scholar] [CrossRef]
- Deng, Z.; Wang, Y.; Yang, H.; Qian, J. Research on Crack Behavior of Recycled Concrete Beams under Short-term Loading. KSCE J. Civ. Eng. 2017, 22, 1763–1770. [Google Scholar] [CrossRef]
- Luo, S.R.; Hu, X.L.; Huang, J.; Zheng, J.L. Experimental study on bearing properties of self-compacting high-performance concrete flexural members. J. Fuzhou Univ. (Nat. Sci. Ed.) 2004, 3, 339–343. [Google Scholar]
- Huang, H.; Ye, Y.H.; Han, J.; Qian, F.F. Flexure bearing property experiment of self-compacting concrete beams. J. Nanjing Univ. Technol. (Nat. Sci. Ed.) 2011, 33, 95–100. [Google Scholar]
- Petrović, Z.; Milošević, B.; Zorić, A.; Ranković, S.; MladenoviĆ, B.; Zlatkov, D. Flexural Behavior of Continuous Beams Made of Self-Compacting Concrete (SCC)—Experimental and Numerical Analysis. Appl. Sci. 2020, 10, 8654. [Google Scholar] [CrossRef]
- Xue, Z.H.; Ye, Y.H.; Sun, R.; Sun, H.X. Analysis of flexural behavior of reinforced self-compacting concrete beams. J. Nanjing Univ. Technol. (Nat. Sci. Ed.) 2013, 35, 65–68. [Google Scholar]
- Al-Ansari, M.S.; Abu Taqa, A.G.; Senouci, A.B.; Eldin, N.N.; Helal, M.; Asiado, C. Proposed Formulas for Estimating Splitting Tensile, Shear and Flexural Strengths, and Long Term Deflection Assessment of Self-Compacting Concrete Elements. Sci. Adv. Mater. 2017, 9, 1751–1761. [Google Scholar] [CrossRef]
- Ministry of Housing and Urban-Rural Construction of the People’s Republic of China. JGJ/T 283-2012; Technical Specification for Application of Self-Compacting Concrete. China Building Industry Press: Beijing, China, 2012.
- Ministry of Housing and Urban-Rural Construction of the People’s Republic of China. GB/T 50081-2019; Standard for Test Methods of Concrete Physical and Mechanical Properties. China Building Industry Press: Beijing, China, 2019.
- Ministry of Housing and Urban-Rural Construction of the People’s Republic of China. GB50010-2010; Code for Design of Concrete Structures. China Building Industry Press: Beijing, China, 2010.
- Ministry of Housing and Urban-Rural Construction of the People’s Republic of China. JGJ/T 443-2018; Technical Standard for Recycled Concrete Structures. China Building Industry Press: Beijing, China, 2018.
- Yang, W.C. Experimental Research on Stressing Performances of Self-Compacting Recycled Concrete Beams. Master’s Thesis, Shenyang University of Technology, Shenyang, China, 2018. [Google Scholar]


Publisher’s Note: MDPI stays neutral with regard to jurisdictional claims in published maps and institutional affiliations. |
© 2022 by the authors. Licensee MDPI, Basel, Switzerland. This article is an open access article distributed under the terms and conditions of the Creative Commons Attribution (CC BY) license (https://creativecommons.org/licenses/by/4.0/).