Article

An Experimental Study of the Hysteresis Model of the Kanchuang Frame Used in Chinese Traditional Timber Buildings of the Qing Dynasty

1
School of Civil Engineering, Shijiazhuang Tiedao University, Shijiazhuang 050043, China
2
Faculty of Architecture, Civil and Transportation Engineering, Beijing University of Technology, Beijing 100124, China
3
Key Scientific Research Base of Safety Assessment and Disaster Mitigation for Traditional Timber Structure (Beijing University of Technology), State Administration for Cultural Heritage, Beijing 100124, China
4
Beijing ZAJ Engineering Design Co., Ltd., No. 3 Chengxiangshiji Square, Beijing 100176, China
*
Author to whom correspondence should be addressed.
Buildings 2022, 12(7), 887; https://doi.org/10.3390/buildings12070887
Submission received: 19 April 2022 / Revised: 17 June 2022 / Accepted: 20 June 2022 / Published: 23 June 2022
(This article belongs to the Special Issue Advances in Building Conservation)

Abstract

:
Kanchuang frames are important parts of traditional timber architecture in China. This paper used experimental and numerical methods to study the restoring force model of Kanchuang frames, which were used frequently in Chinese ancient timber structures, particularly in North China. The prototyped test model is a type of Chinese traditional timber architecture named Qilinyingshan. It was widely used in ancient timber buildings preserved from the Ming and Qing dynasties. This study analyzed the loading process and failure modes of the test model, and the skeleton curve and hysteretic curve data were collected. Moreover, a dimensionless skeleton curve model was developed based upon the findings. The hysteresis loops of the test model were also analyzed, and it was found that each hysteresis loop can be divided into several feature segments according to their stiffness at different loading stages. Regression analysis was also used to obtain the stiffness degradation curvilinear equations of the feature segments. Finally, a hysteresis force model of a Kanchuang frame was established. This study also found that the loading process can be divided into three stages: the elastic stage, in which all of the components are in good condition; the elastic–plastic stage, in which cracks gradually develop on the wall; and the new elastic–plastic stage, after which the wall collapses. It was found there was consistency between the restoring force model and the test results, indicating that the model is valid and reliable. The skeleton curve model and hysteretic model provide reference for the nonlinear seismic response of ancient timber architecture.

1. Introduction

Ancient timber buildings are considered cultural treasures of China. They represent Chinese history and culture. However, during the previous years, earthquakes have damaged or even destroyed a large number of traditional timber buildings. For example, nearly 10,000 traditional timber buildings were damaged in the Wenchuan earthquake in Sichuan on 12 May 2008 [1]. The architecture of traditional Chinese timber buildings is different from the architecture of modern buildings. In detail, in the structure system of traditional Chinese timber buildings, columns are directly placed on plinths without any other fastening measures. Moreover, beams and columns are connected by mortise–tenon joints without any nails and bracings, and all of the mass from the roof is loaded onto the beams and columns. There are no weights on the infill walls [2,3]. Timber frames are usually the main-load bearing and force-resisting units of traditional Chinese timber structures, which is different from modern structures. It is thus of great importance to preserve these valuable cultural heritages by investigating the mechanical properties of the structure and components.

1.1. History and Research of Chinese Traditional Structures

The previous historical literature on the earliest works of Chinese timber architecture track its history to 5000 years ago. The most ancient known book about the construction method of Chinese traditional timber buildings was published in the Song Dynasty [4]. During recent modern times, many scholars have realized that this kind of cultural heritage is extremely valuable, and have begun to study and protect it. For example, in the 1930s, Liang [5] took the lead in the study of the ancient timber buildings, and his studies were focused on the architecture and anatomy of Chinese structures. Other scholars found that the mortise–tenon joints are the weak points of timber structures, and thus studied their mechanical properties. Eckelman et al. [6], Likos et al. [7], Huan et al. [8] and Chen et al. [9] studied the bending behaviour of different types of mortise–tenon joints in the timber structure. Other studies also focused on Dou-gong, a special part of traditional timber structures (see Figure 1 [10]). These are commonly used in the main buildings of traditional palaces. Experimental studies [11,12,13,14,15,16] were carried out to investigate their failure modes, stiffness, yield load and other mechanical properties. In detail, Yeo et al. [17] studied the seismic behaviour of Taiwanese timber brackets subjected to out-of-plane loading, and the effect of their mechanical behaviour—such as failure modes—on the strength of the mechanical model. Xie et al. [18] studied the static behaviour of a two-tiered Dou-Gong system reinforced with super-elastic alloy, and found that the pre-strain of the super-elastic alloy can significantly increase the damping ratio in the structure. Previous studies [19,20,21,22] tried to evaluate the mechanical properties and safety state of an entire timber structure through finite element modelling, mathematical methods, and a shaking-table test. However, all of these studies focused on the timer components and timber frames without considering the infill walls. Recently, scholars have considered that infill walls might have a significant effect on the seismic performance of timber structures. For example, Vieux-Champagne et al. [23,24] studied the seismic performance of timber-framed structures filled with natural stones and earth mortar by introducing three scales of experiments. Ali et al. [25] studied the in-plane behaviour of full-scale Dhajji walls, a wooden-braced frame with a stone infill system, and tested it under quasi-static loading. Poletti and Vasconcelos [26] studied the seismic behaviour of the walls with masonry infilllath and plaster, and a timber frame with no infill. Dutu et al. [27,28] studied the seismic behaviour of timber-framed masonry walls based on the static cyclic loading test, and proposed a simplified seismic evaluation method. All of these studies demonstrate that the infill walls can significantly increase the stiffness, the ductility and the load-bearing capacity of the timber frames, which consequently have a significant influence on the seismic behaviour of the entire building.

1.2. Research on Timber Frames with Infill Walls

Although the importance of infill walls has been studied in modern buildings, the infill walls of Chinese ancient timber architecture have not received attention in previous research, and they are considered to be nonstructural members. Moreover, limited research has studied the seismic performance of timber frames with infill walls. Emile et al. [29] studied the failure modes, stiffness, strength (including the rate of degradation), and energy dissipation capacity of Chinese traditional mortise–tenon jointed beam-column frames with wood panel infill. Xie et al. [30] also studied the influence of wood infill walls on the seismic performance of Chinese traditional timber structures through shaking table tests. It was found that the natural frequencies, damping ratio and acceleration responses of the model with wood infill walls were greater than those without. Chang et al. [31,32,33] studied the mechanical behaviours of traditional timber shear wall and reinforced planked timber shear walls using experiments and calculations. Their findings showed that the friction behaviour between board units and beams plays a major role in resisting the lateral force applied to the timber shear wall. The restoring force model is the foundation of the seismic evaluation of structures.

1.3. Research and Application of the Restoring Force Model

Many studies have investigated the restoring force model of connections and components of structures [34,35,36], and they found that steel structures are rich in the restoring force model of reinforced concrete structures. However, only limited research has studied the restoring force model of ancient timber structures. Moreover, the restoring force model of reinforced concrete structures and steel structures cannot be used in timber structures because of the huge difference in the machinal properties between timber and concrete. Therefore, it is essential to study the restoring force of Chinese timber frames with infill walls. In the present paper, a Chinese traditional timber frame with masonry and wood window infill—the Kanchuang frame (shown in Figure 2)—was tested under cyclic loading. Kanchuang is a kind of wood window used in ancient timber buildings named “Kan”. A Kanchuang frame is a timber frame with Kanchuang and a half masonry wall infilled. The loading process and failure modes of the test model were studied in order to collect test data such as skeleton curves and hysteretic curves. The restoring force model for the Kanchuang frame was developed to be used as the foundation for the seismic evaluation of the Kanchuang frame.
Finite element analysis has been frequently used to analyse the seismic performance of timber structures. However, a timber structure is quite different from the reinforced concrete structure. Moreover, most ancient timber buildings use various kinds of materials. Consequently, there are a lot of contact areas and small gaps between different components. This made them difficult to simulate using finite element analysis software, and the calculation results cannot be proven valid or reliable with the consideration of contacts, mechanical properties and material properties. Moreover, the calculation process is very complicated, and it takes a very long time to calculate the results. Nevertheless, it was found the building structures can be divided into sub-units. When the units’ hysteretic model, rigidity and strength are known, an analysis model can be used to calculate the sub-units. In this way, the contact analysis in the finite element calculation can be avoided, and we can improve the computational efficiency. Moreover, a correct hysteretic model is also crucial to nonlinear seismic analysis. Thus, there is a need to develop a simplified calculation model that can present the mechanical properties of the structure for nonlinear seismic analysis. The sub-units can be used to simplify the hysteretic model of the structure as mass elements or shell elements. Thus, the calculation model could be simpler than before, and the nonlinear seismic analysis methods—such as Newmark-β—can be applied to calculate the seismic responses of the structure.

2. Experimental Studies

2.1. Specimen Fabrication

In this study, a 1:2 scale Kanchuang frame model was used as the test specimen. This specimen of Chinese traditional timber architecture was collected from Qilinyingshan (see Reference [5]). The Kanchuang frame is widely used in ancient timber buildings of the Qing dynasty. Kanchuang frames consist of columns, fangs, wood windows, masonry walls, Shangkan, Fengkan and Baokuang. All of the wood specimens are connected with mortise–tenon joints. The structural properties of wood members can vary with the member size, or the size effect. According to the Buckingham theorem [37] and similitude theory, the structural properties of the prototype Kanchuang frame can be calculated by dividing the corresponding properties of the scaled specimens by the scale factors of the dimensions and mechanical properties of the materials [38]. The dimensional scale factor of the test model was 1/2. Table 1 shows the scale factor of the physical parameters.
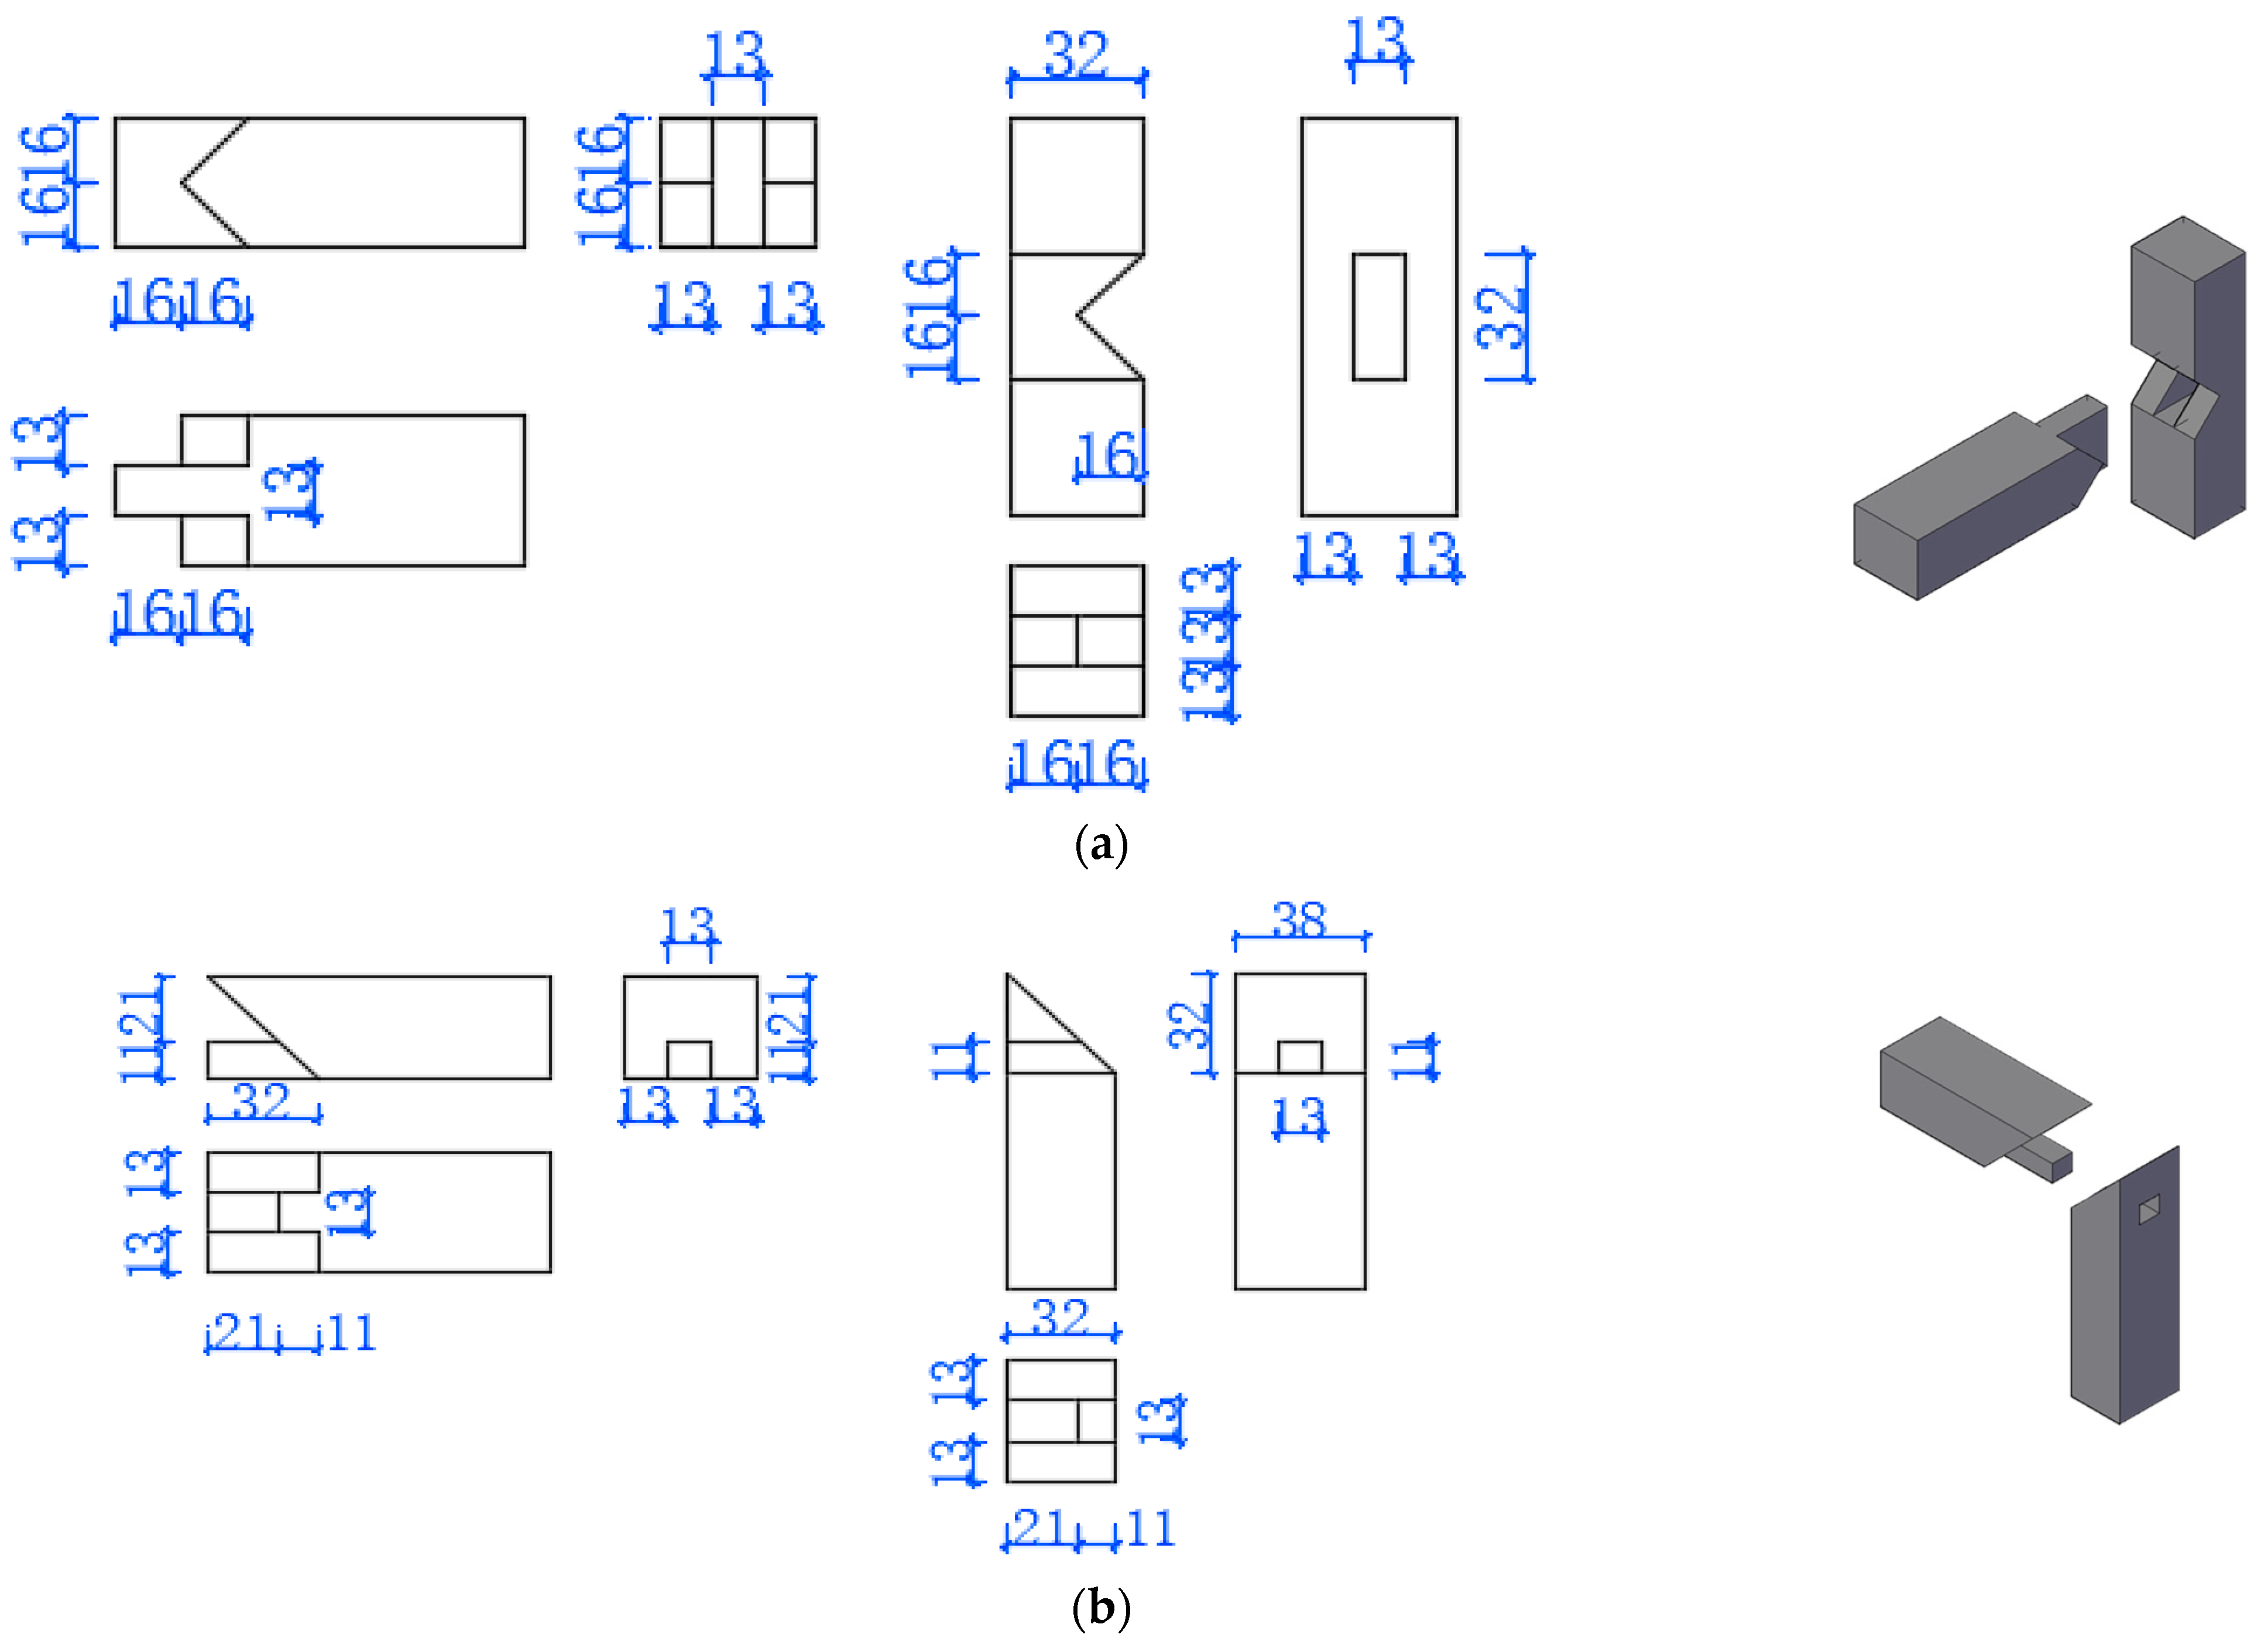
The span of the frame was 1600 mm and the total height was 1800 mm. The dimensions of the masonry wall were 1450 mm × 500 mm × 250 mm. Figure 2 shows the layout and main dimensions of the model. The dimensions of the components are shown in Figure 3 and Figure 4.

2.2. Material Properties

Ancient timber buildings are the cultural relics of a nation. It is prohibited for anyone to take materials from the standing ancient buildings. However, the material properties matter to the test results. In order to use materials similar to those from the ancient timber buildings, the researchers used Pinus sylvestris var. mongolica, lime and Xiaotingni brick to fabricate the specimen. Pinus sylvestris var. mongolica grows in Northeast China, and is a commonly used tree species in the repair and construction replacement of traditional timber structures. Lime was commonly used to make the mortar in ancient times. Xiaotingni brick is also widely used in the restoration of traditional buildings.
Compressive strength tests were performed on nine cubic samples of traditional mortar, according to the standard test method for the performance of building mortar (JGJ/T 70-2009 2009) [39]. The dimensions of the mortar sample were 70 mm × 70 mm × 70 mm (length × width × height). The mortar was made of lime and water. The mortar was poured into the molds and left to cure for 28 days at a temperature of 20 ± 2 °C and a relative air humidity of 95%. A universal testing machine was used to test the compressive strength of the mortar samples. The average compressive strength of the mortar was 2.0 Mpa.
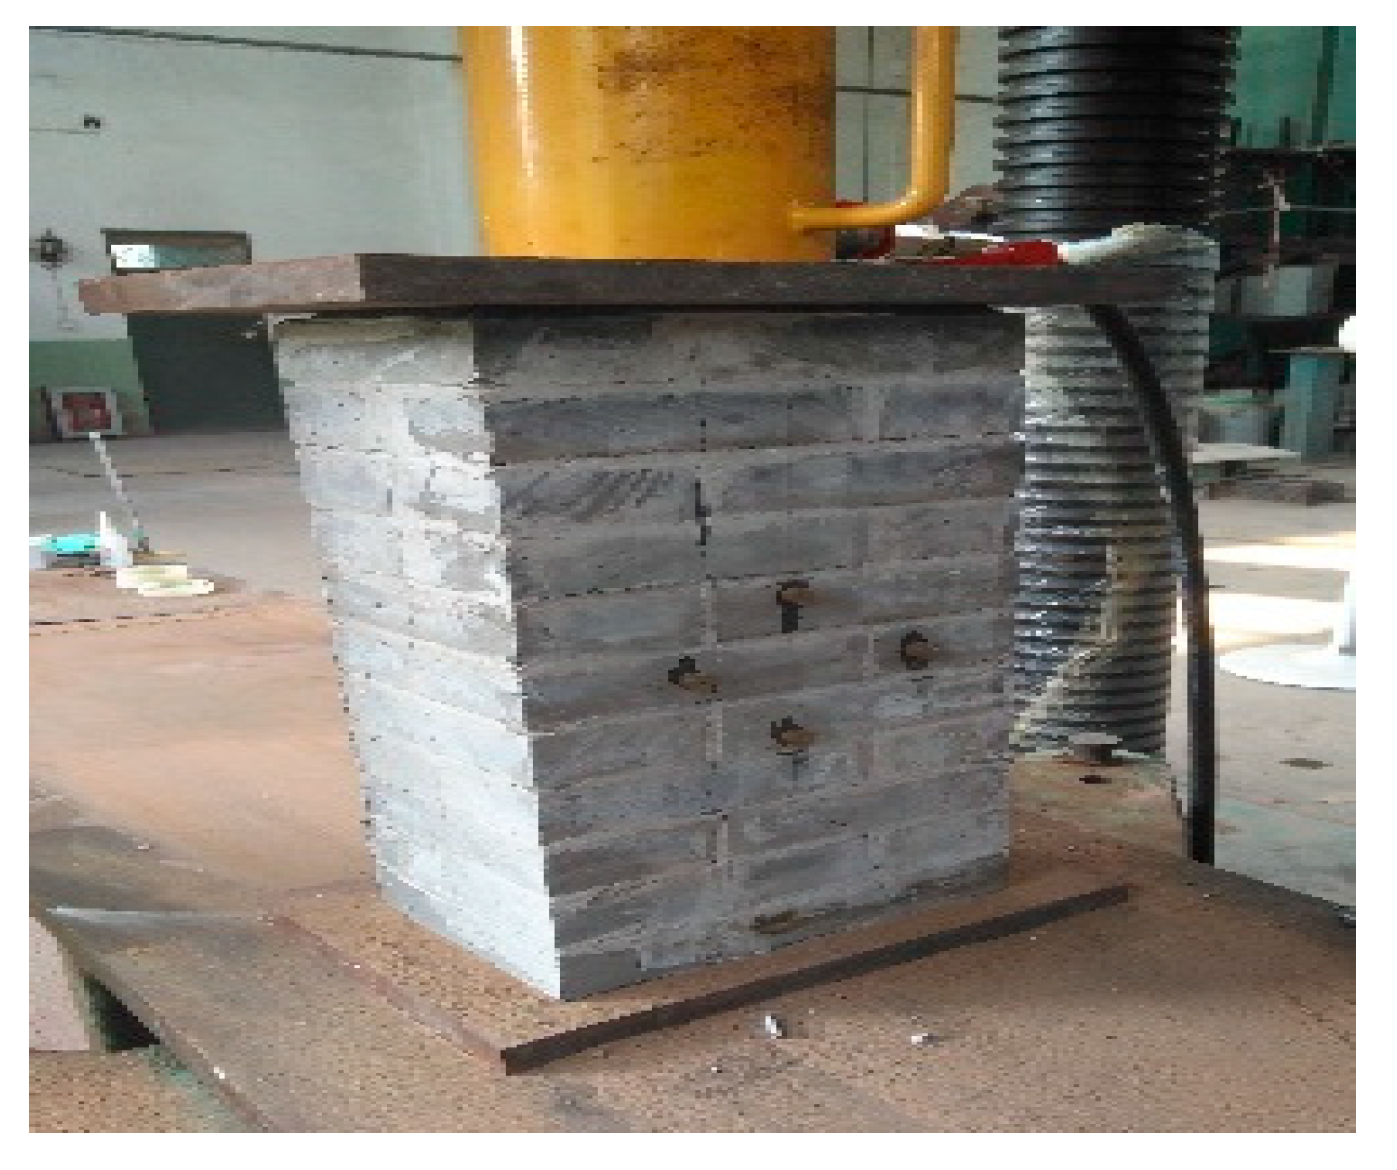
Compressive strength tests were also carried out on the brick and masonry samples according to the test method for wall bricks (GB/T 2542-2012) [40] and the standard test method for the basic mechanical properties of masonry (GB/T 50129-2011) [41]. Ten brick samples were made. The dimensions of the bricks were 75 mm × 75 mm × 60 mm (length × width × height). A universal testing machine was used to test the compressive strength of the bricks. The average compressive strength of the brick samples was 9.3 Mpa. The dimensions of the prism in the compression tests including 12 layers of brick and 11 layers of mortar were 130 mm × 200 mm × 415 mm (length × width × height) (see Figure 5). The average compressive strength of the masonry samples was 3.4 Mpa. The average Young’s modulus of the masonry samples was 1259 Mpa. Shear stress tests were performed on nine test samples. The test sample was composed of three layers of brick and two layers of mortar. The dimensions of the test sample were 130 mm × 200 mm × 230 mm. The whole operation process was strictly controlled according to the Chinese National Standard (GB/T 50129-2011) [41] (see Figure 6). All of the samples were cured indoors at a temperature of 15–20 °C for 28 days. The test samples were then positioned on the center of the test machine. Steel plates and sands were used to level up the bottom and top of the test sample. Vertical loads were applied by the testing machine, and the strength was calculated according to f = F/A (F is failure load and A is contact area). The average shear stress of nine test samples was 0.041 Mpa (see Table 2).
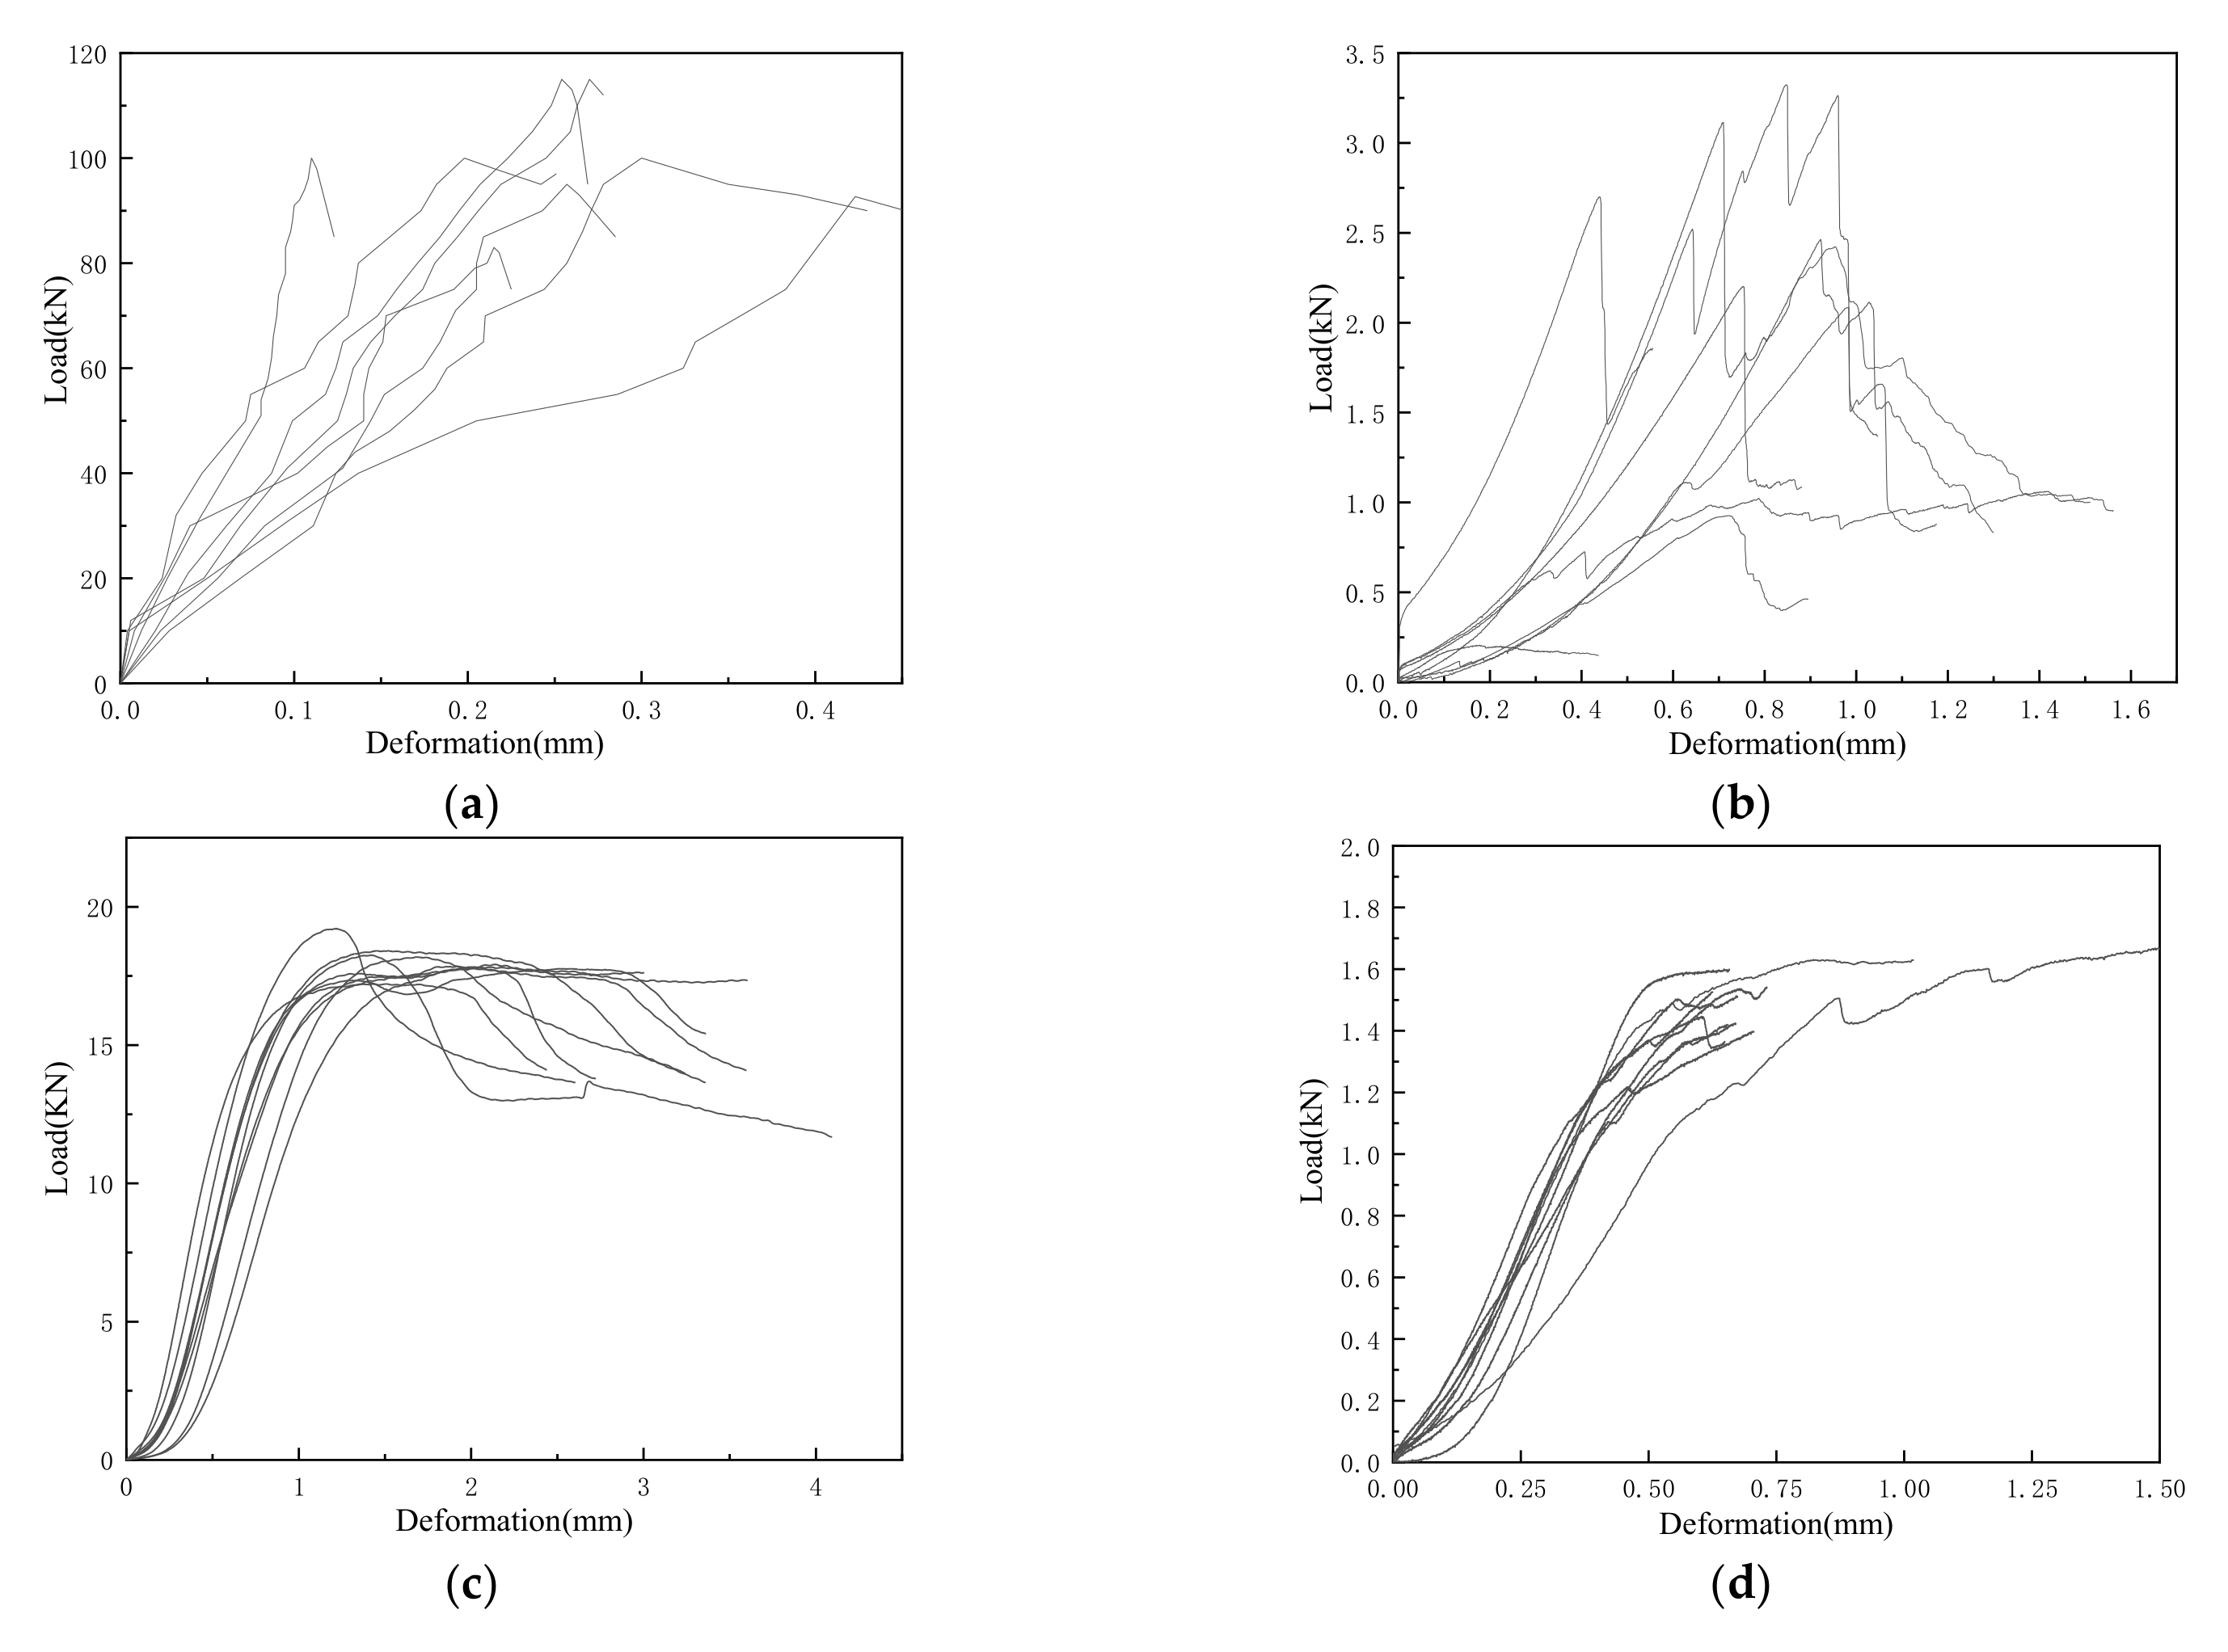
The material properties of the wood—including its modulus of elasticity, compression strength density and moisture content—were tested, using the physical and mechanical methods for wood (GB 1927-1943-91) [42]. The dimensions of the wood specimens for the compression test and elastic modulus test were 30 mm × 20 mm × 20 mm and 300 mm × 20 mm × 20 mm. The mechanical properties of the wood are shown in Table 3. The load–deformation curves of the test samples are shown in Figure 7.

2.3. Testing and Measuring Schemes

Steel caps were positioned on the top of the columns. A distribution beam was then positioned on the steel caps. Vertical loads of weight were hung at the two sides of the distribution beam, to simulate the dead-weight of the upper components and roof. The frame was installed in a vertical position with the bottom of the columns in hinge supports (see Figure 8). The vertical loads were calculated according to the relevant references [43,44,45]. Using the similarity theory [46,47], the vertical loads placed on the 1/2 scale model were 12 kN. The displacement data were recorded using Displacement meter 3 in Figure 8.
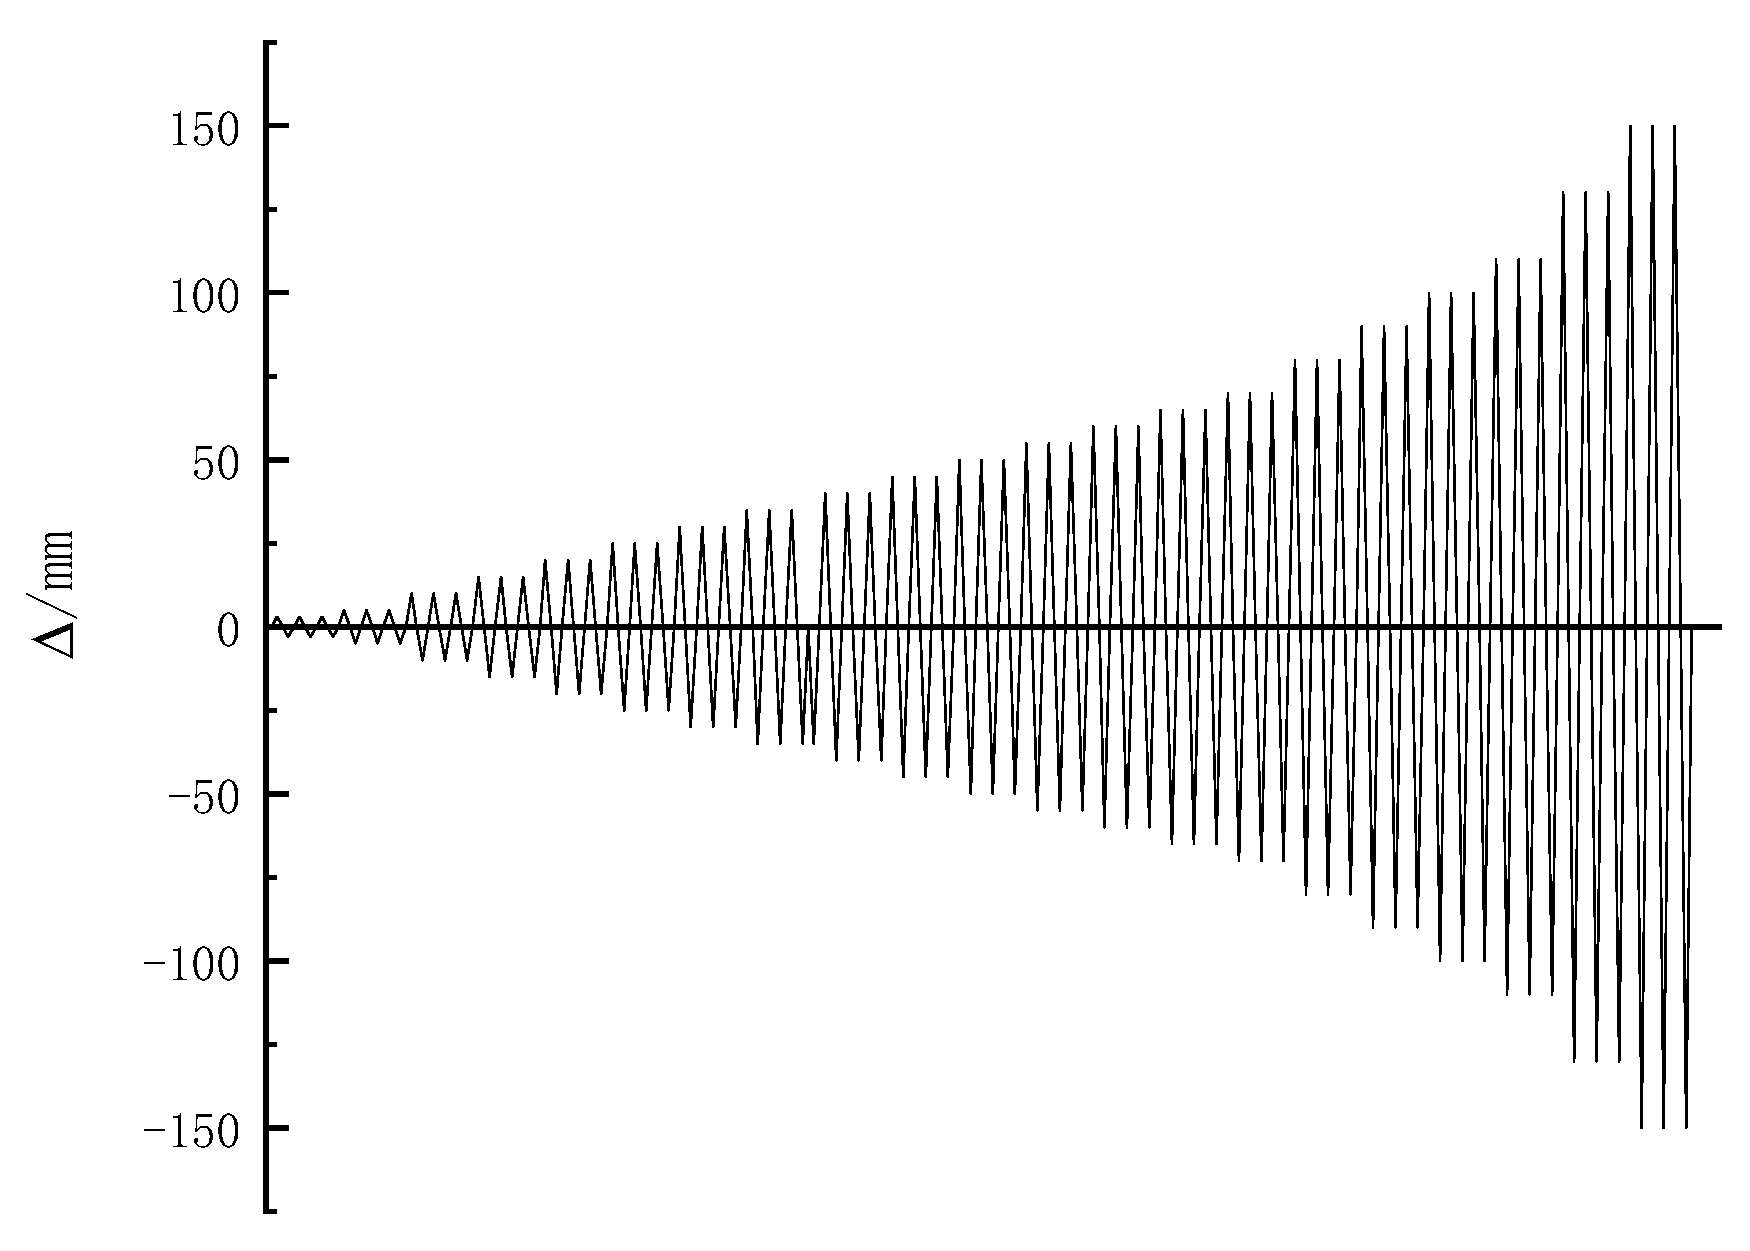
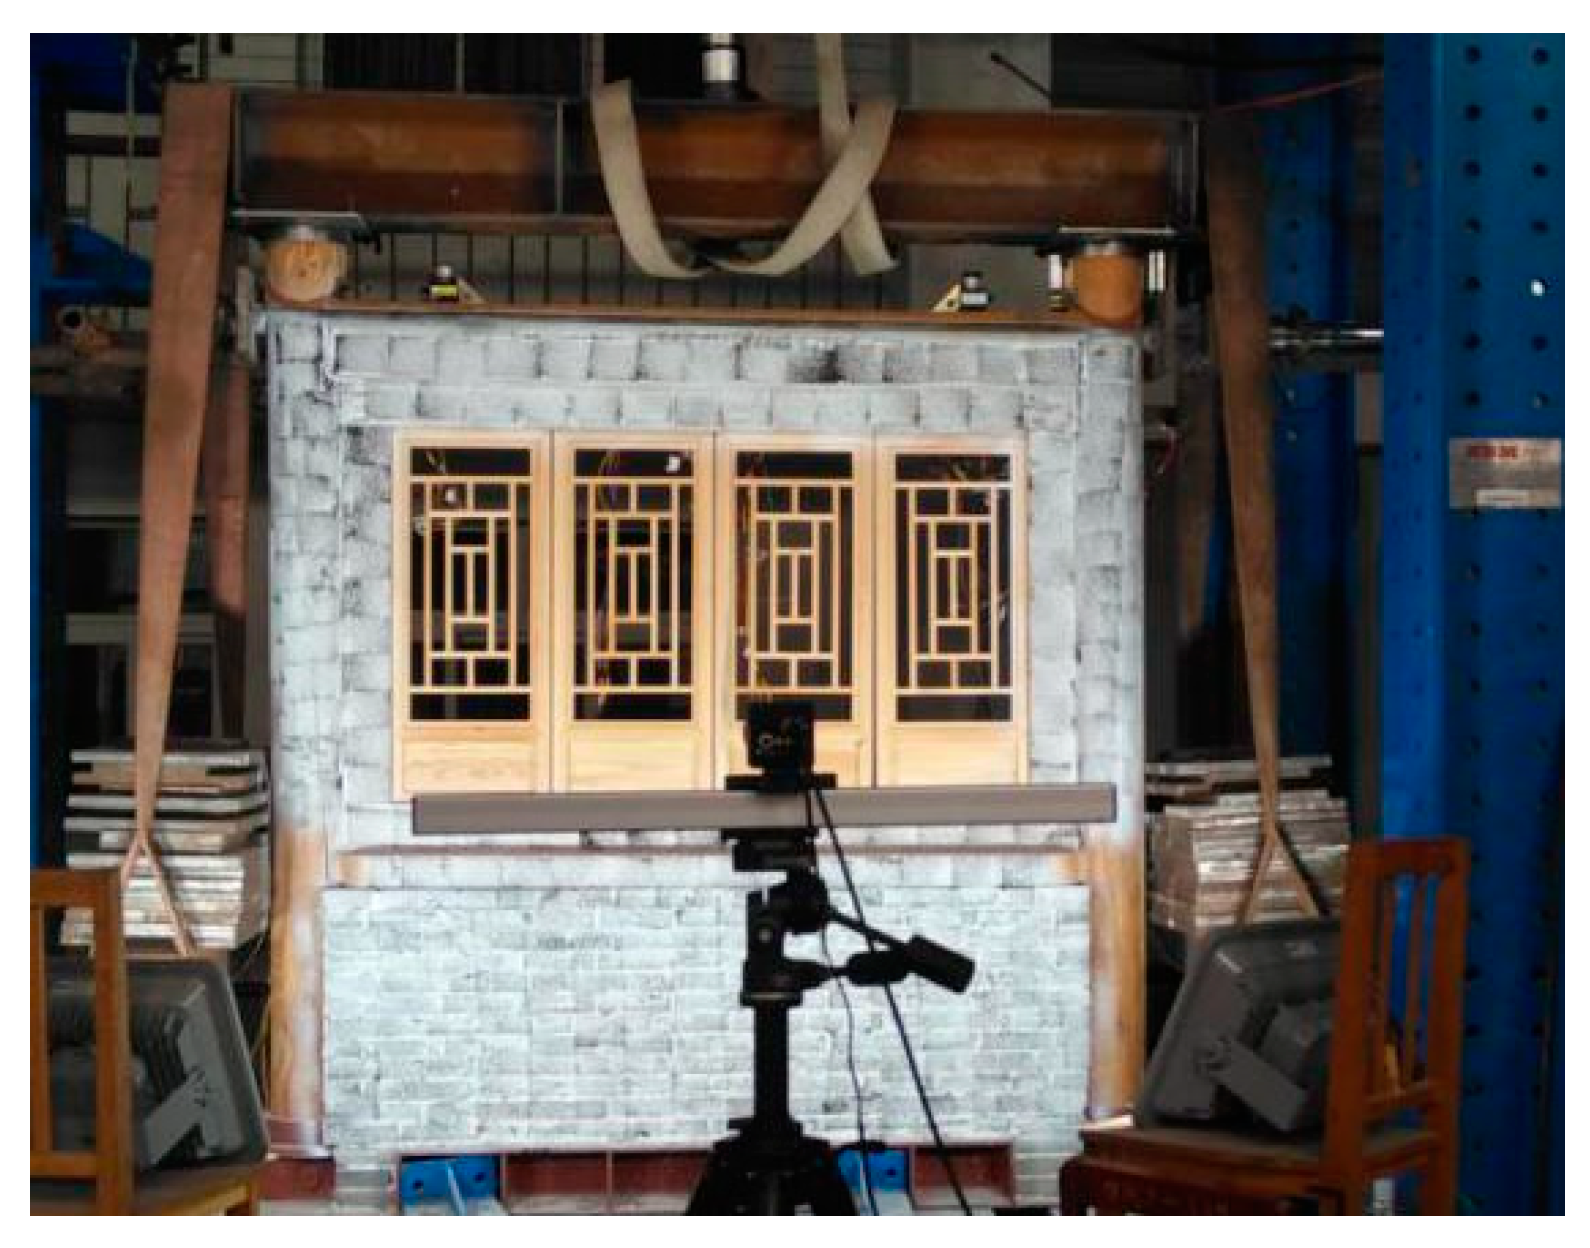
Cyclic loadings were applied using a hydraulic actuator with a displacement range of ±250 mm. The actuator was positioned at a height of 1.6 m, with a transverse cyclic load with a programmed load cycle. A displacement meter (Displacement meter 3) and a force sensor were used on the actuator. The force versus displacement curves were measured directly. The horizontal cyclic loads were applied under displacement control according to the ISO/FDIS 21581:2010(E) standards [48]. The frame was loaded with three initiation cycles with an amplitude of 3 mm. The amplitude of the second three cycles was 5 mm. The amplitude of the cycles gradually increased by a step of 5 mm until the amplitude was 70 mm. It then increased by a step of 10 mm until the amplitude reached 150 mm. Figure 9 presents the shape of the loading history. An overview of the test setup is shown in Figure 10.

2.4. General Observation

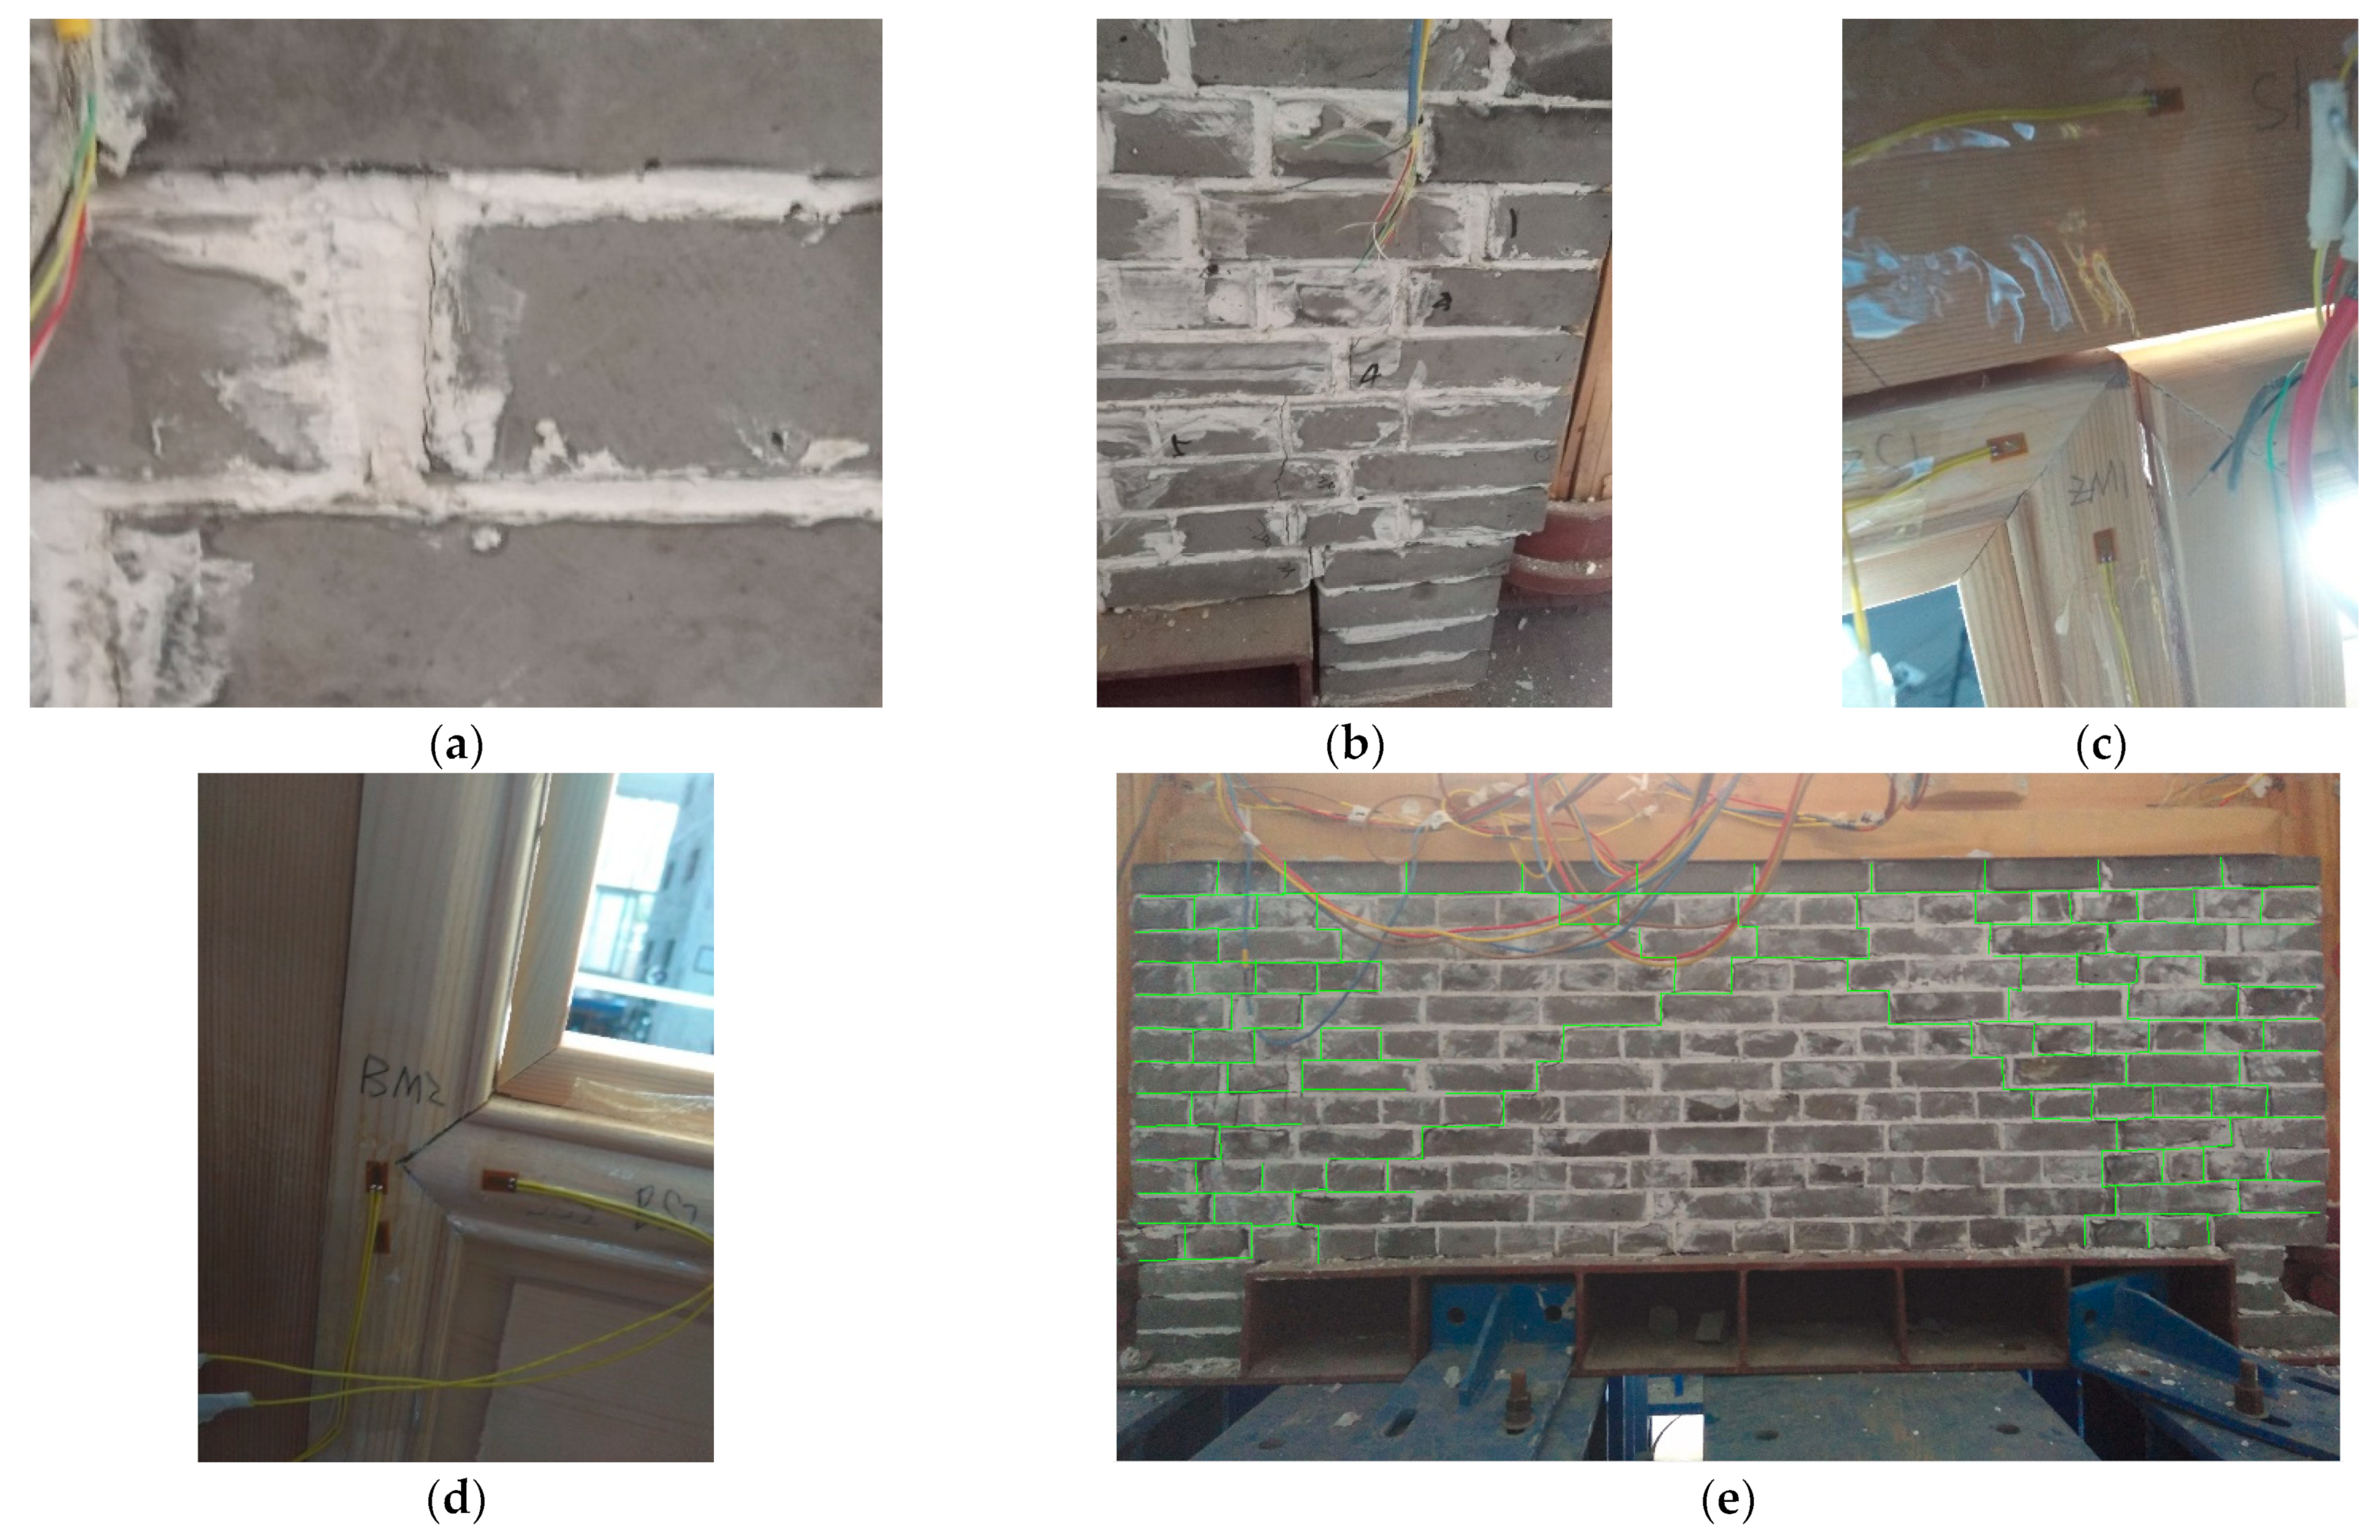
The Kanchuang frame was loaded until the displacement reached 150 mm (the drift angle was 3/32). Before the 10 mm (the drift angle was 1/160) cycles, no obvious damage was observed. Cracks primarily appeared in the side area of the masonry wall when the displacement reached 10 mm (see Figure 11). Then, the cracks developed further at an angle of 45° as the displacement increased. X-shaped cracks were formed when the displacement reached 50 mm (the drift angle was 1/32). Finally, cracks covered the whole wall and collapsed until the displacement reached 150 mm (the drift angle was 3/32). The tenons of the wood windows started to pull out of the mortise when the displacement reached 15 mm (drift angle is 3/320). Then, the gap gradually increased as the displacement increased. Finally, the gap reached 3 mm. Cracks appeared on the Lingtiao and Zaibian when the displacement reached 150 mm (the drift angle was 3/32). Figure 11 shows the final failure pattern.

3. Analysis of the Characteristic Curves

This study developed a hysteresis model of Kanchuang frames. Moreover, this paper mainly aimed to build the hysteretic model of the Kanchuang frame. The structural performance of the Kanchuang frame, such as its stiffness degradation and energy dissipation, were discussed in reference [49]. Figure 12 and Figure 13 show that the curves are slightly unsymmetrical, and the reasons include the following:
(1)
Although the frame is symmetrical theoretically, in practice, the frame is not exactly symmetrical. The timber frame of ancient timber buildings is not symmetrical, as the specimens were handmade by the timber building restoration people. There are different sizes of small gaps between the components, especially between the mortise and tenon.
(2)
The cracks and damage of the components did not appear in an exactly symmetrical way, and the curves are unsymmetrical in different loading directions.
(3)
The horizontal cyclic loads were applied using a hydraulic actuator. The actuator was positioned at one side of the frame. It wasn’t positioned in the middle of the frame, which also made the curves unsymmetrical.

3.1. Load–Displacement Hysteretic Curve

Figure 12 shows the load–displacement hysteretic curves of the Kanchuang frame. The curves were Z-shaped, particularly at the ultimate state. The pinch phenomenon was also shown in the curve. The pinch effect was clear as the displacement and loading cycle increased; it was caused by the plastic deformation of the wood, the pull-out of the mortise–tenon joints, and the crack development of the masonry wall. The peak values of the hysteretic loops increased as the loading displacements increased. The bending capacities of each loading displacement in the first cycle were higher than those in the second cycle. Moreover, the bending capacity of the second cycle was higher than that of the third cycle. This was caused by the accumulation of the damage and strength degradation of the mortise–tenon joints and the masonry wall.

3.2. Load–Displacement Envelope Curve

Figure 13 shows the load–displacement envelope curve of the Kanchuang frame:
(1)
In different displacement cycles, the strength of first cycle was found to be stronger than the second and third cycles. The strength degradation was caused by the crack development and the plastic cumulative deformation of the wood components.
(2)
Both the positive and negative curves followed the same trend up to 25 mm (the drift angle was 1/64) displacement. Before the 25 mm (the drift angle was 1/64) cycles, no obvious damage occurred in the timber components and no penetrating cracks formed on the masonry wall. The whole frame was still in the elastic stage.
(3)
During the 30–65 mm (drift angle during 3/160 and 13/320) cycles, strength degradation began in both the left (negative) and right (positive) loading directions while the load was increasing. This happened because of the failure of the masonry wall, and the tenons were pulled out of the mortises. The penetrating cracks began to appear in the masonry wall, and the crannies became larger as the loading displacement increased. The gaps between mortise and tenon joints of the frame and wood windows increased as loading displacement increased. In the 65 mm (the drift angle was 13/320) cycles, the left and right side of the masonry wall began to collapse. During the loading process, the cracks on the right side (the positive direction) of the masonry wall grew faster than those on the left side (the negative direction) (see Figure 11e). Therefore, the strength degradation of the frame in the positive loading was weaker than that in the negative direction. The whole frame entered the elastoplastic deformation stage.
(4)
After the 65 mm (the drift angle was 13/320) cycles, the stiffness increased in both the right (positive) and left (negative) directions. The stiffness was stronger than that of the 30–65 mm (the drift angle during 3/160 and 13/320) cycles but weaker than that before the 30 mm (the drift angle was 3/160) cycles. This is because the masonry wall failed after the 65 mm (the drift angle was 13/320) cycles, and the components of the timber frames were compressed with each other. The structure reached a new elastic–plastic stage characterized by the increase of the stiffness and the residual deformation of the timber components.
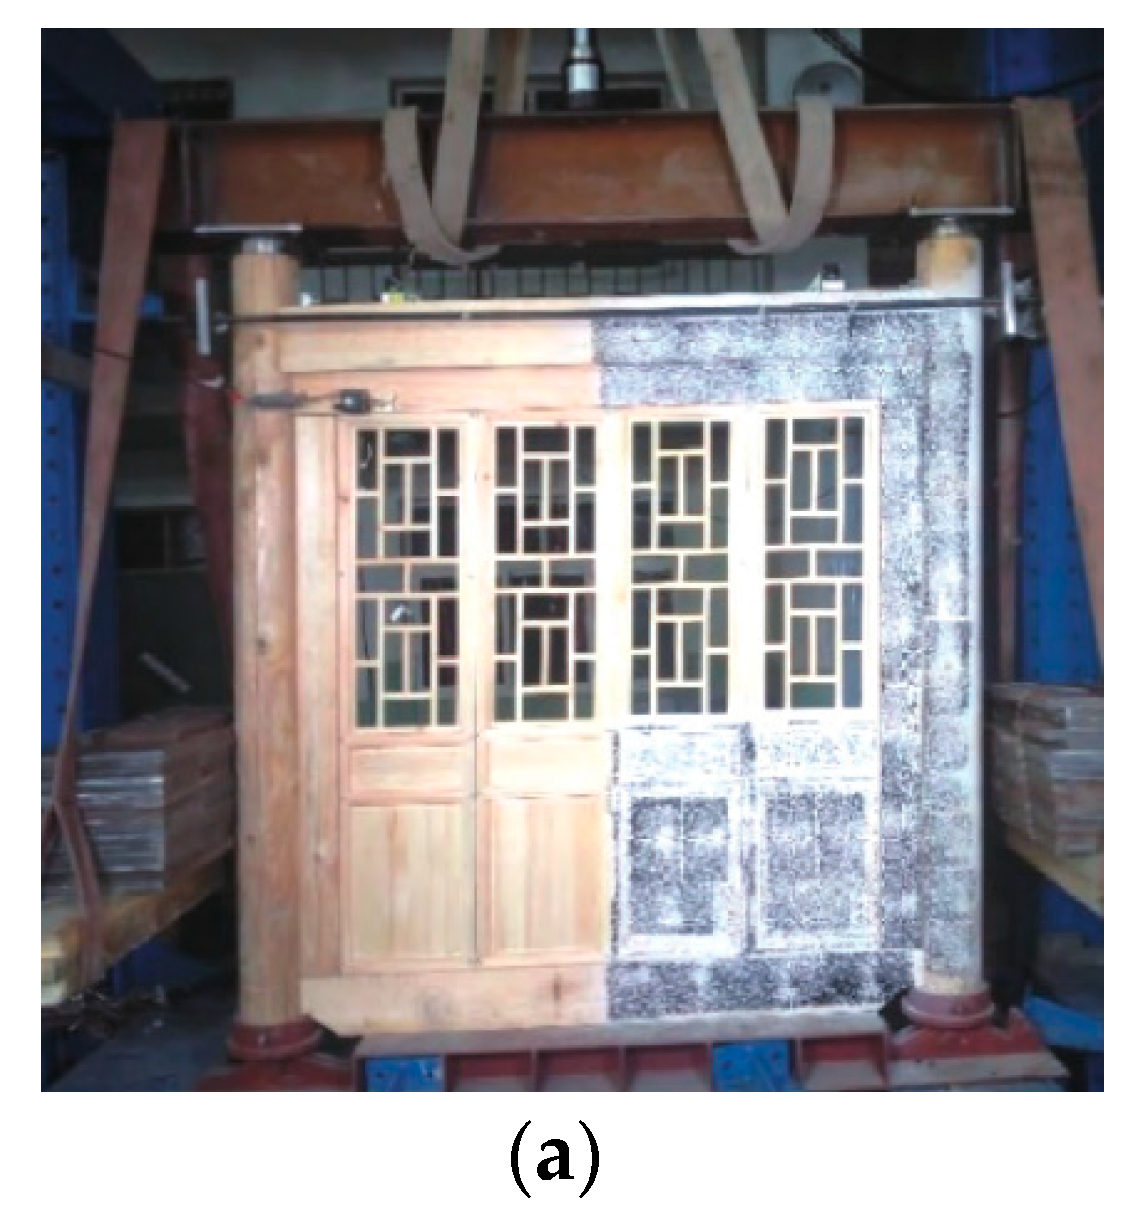
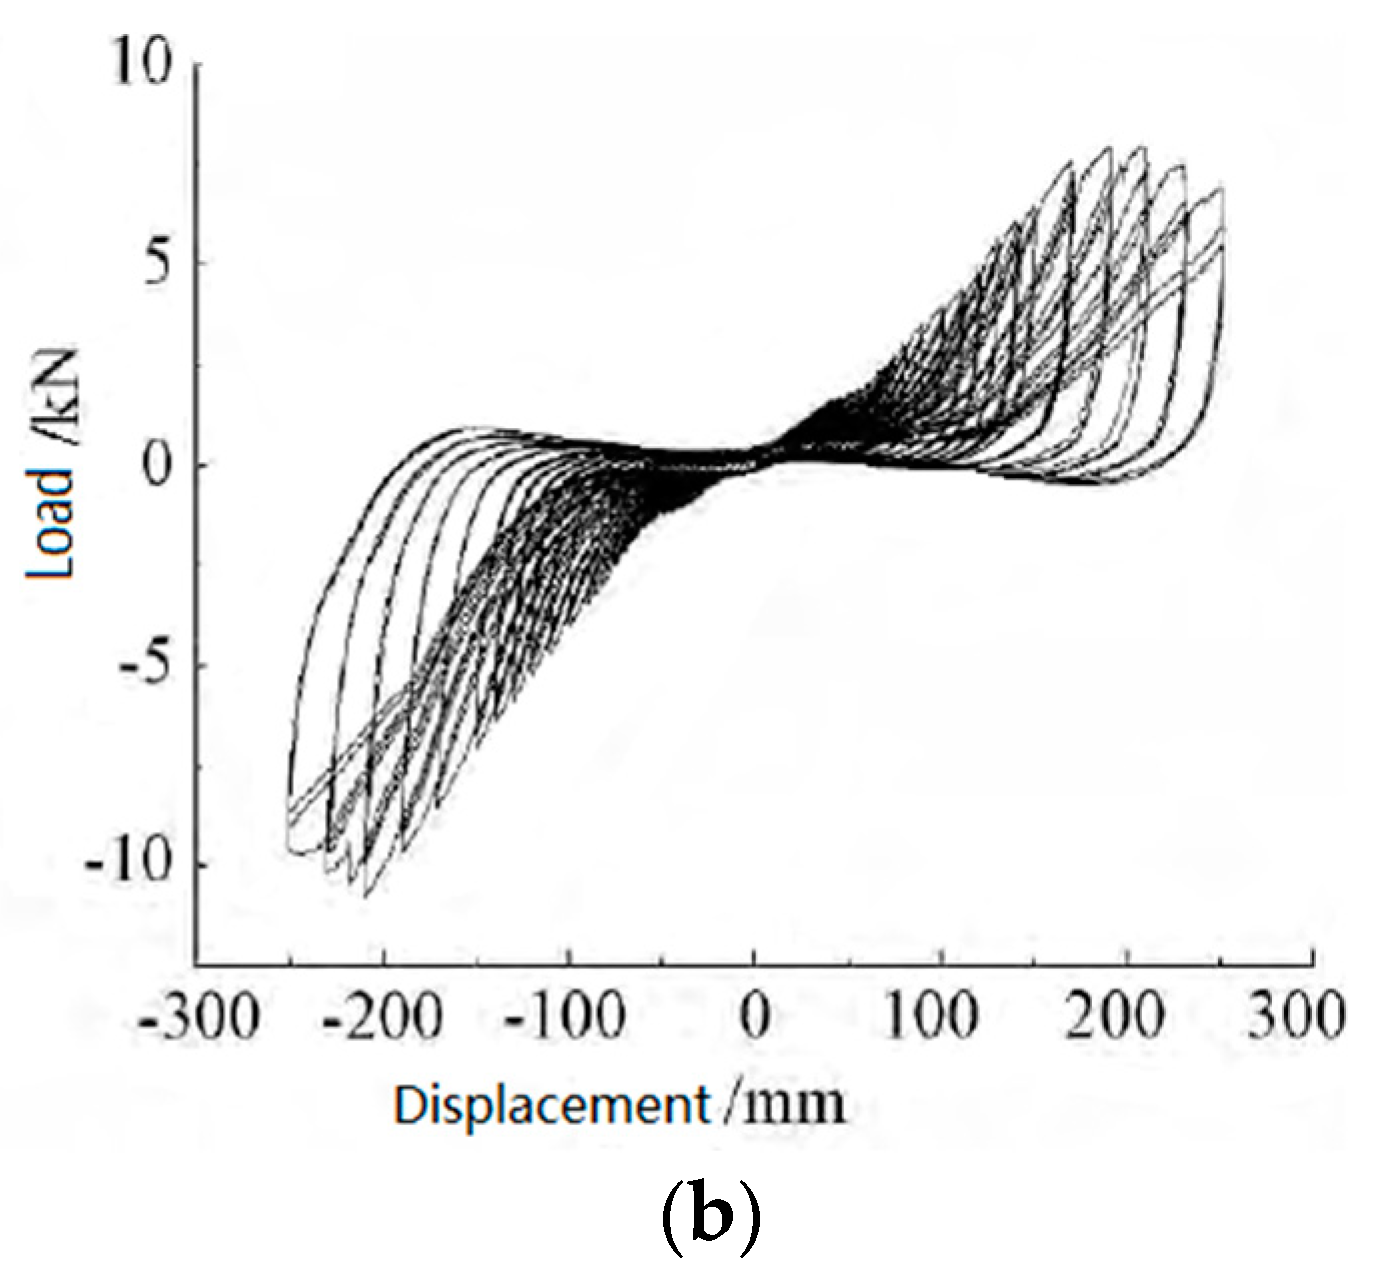
Research [29] has been conducted on traditional timber frames with wood plane infill. This frame has been used in ancient timber buildings. The test model was made of Pinus sylvestris var. mongolica. Figure 14 presents the test model and hysteretic curves of the test model. The peak values of two hysteretic curves at different displacement (drift angle) cycles are different between Figure 12 and Figure 14. This is because the dimensions, structures, wood spices and loading positions are different. The peak values (in Figure 14b) decreased while the loading displacement exceeded 200 mm (the drift angle was 1/8). However, the peak values of the Kanchuang frame’s hysteretic curves did not decrease. Both hysteretic curves turned into Z shapes a despite the different dimensions, structures, wood spices and loading processes. Both curves showed a degrading trend while the loading cycles increased.

4. Hysteresis Model

4.1. Envelope Curve

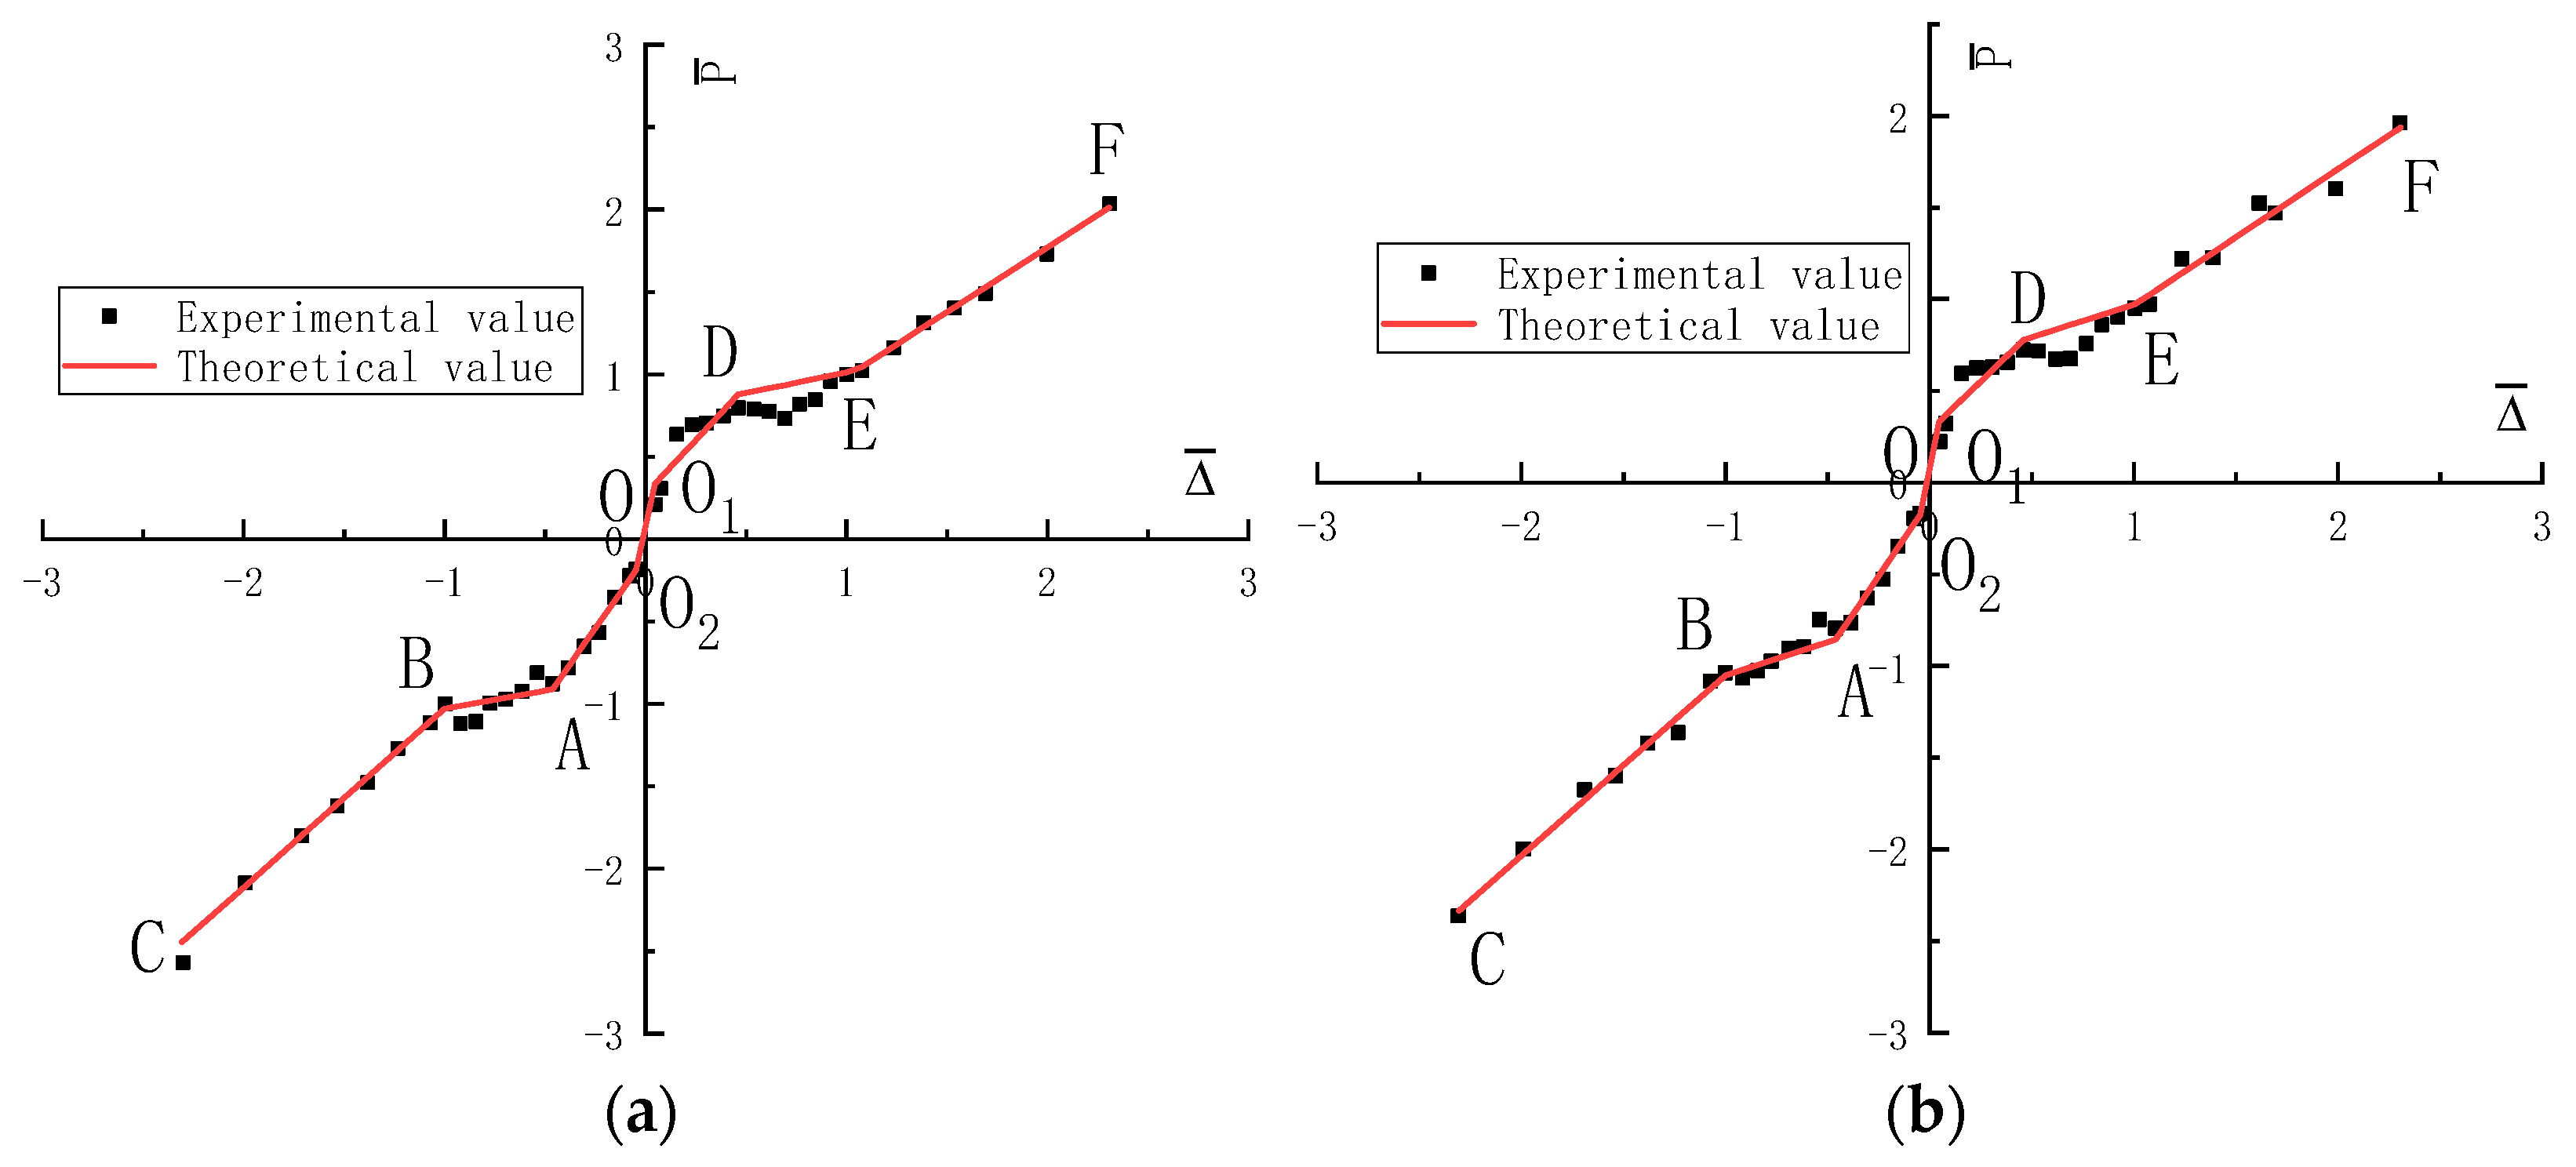
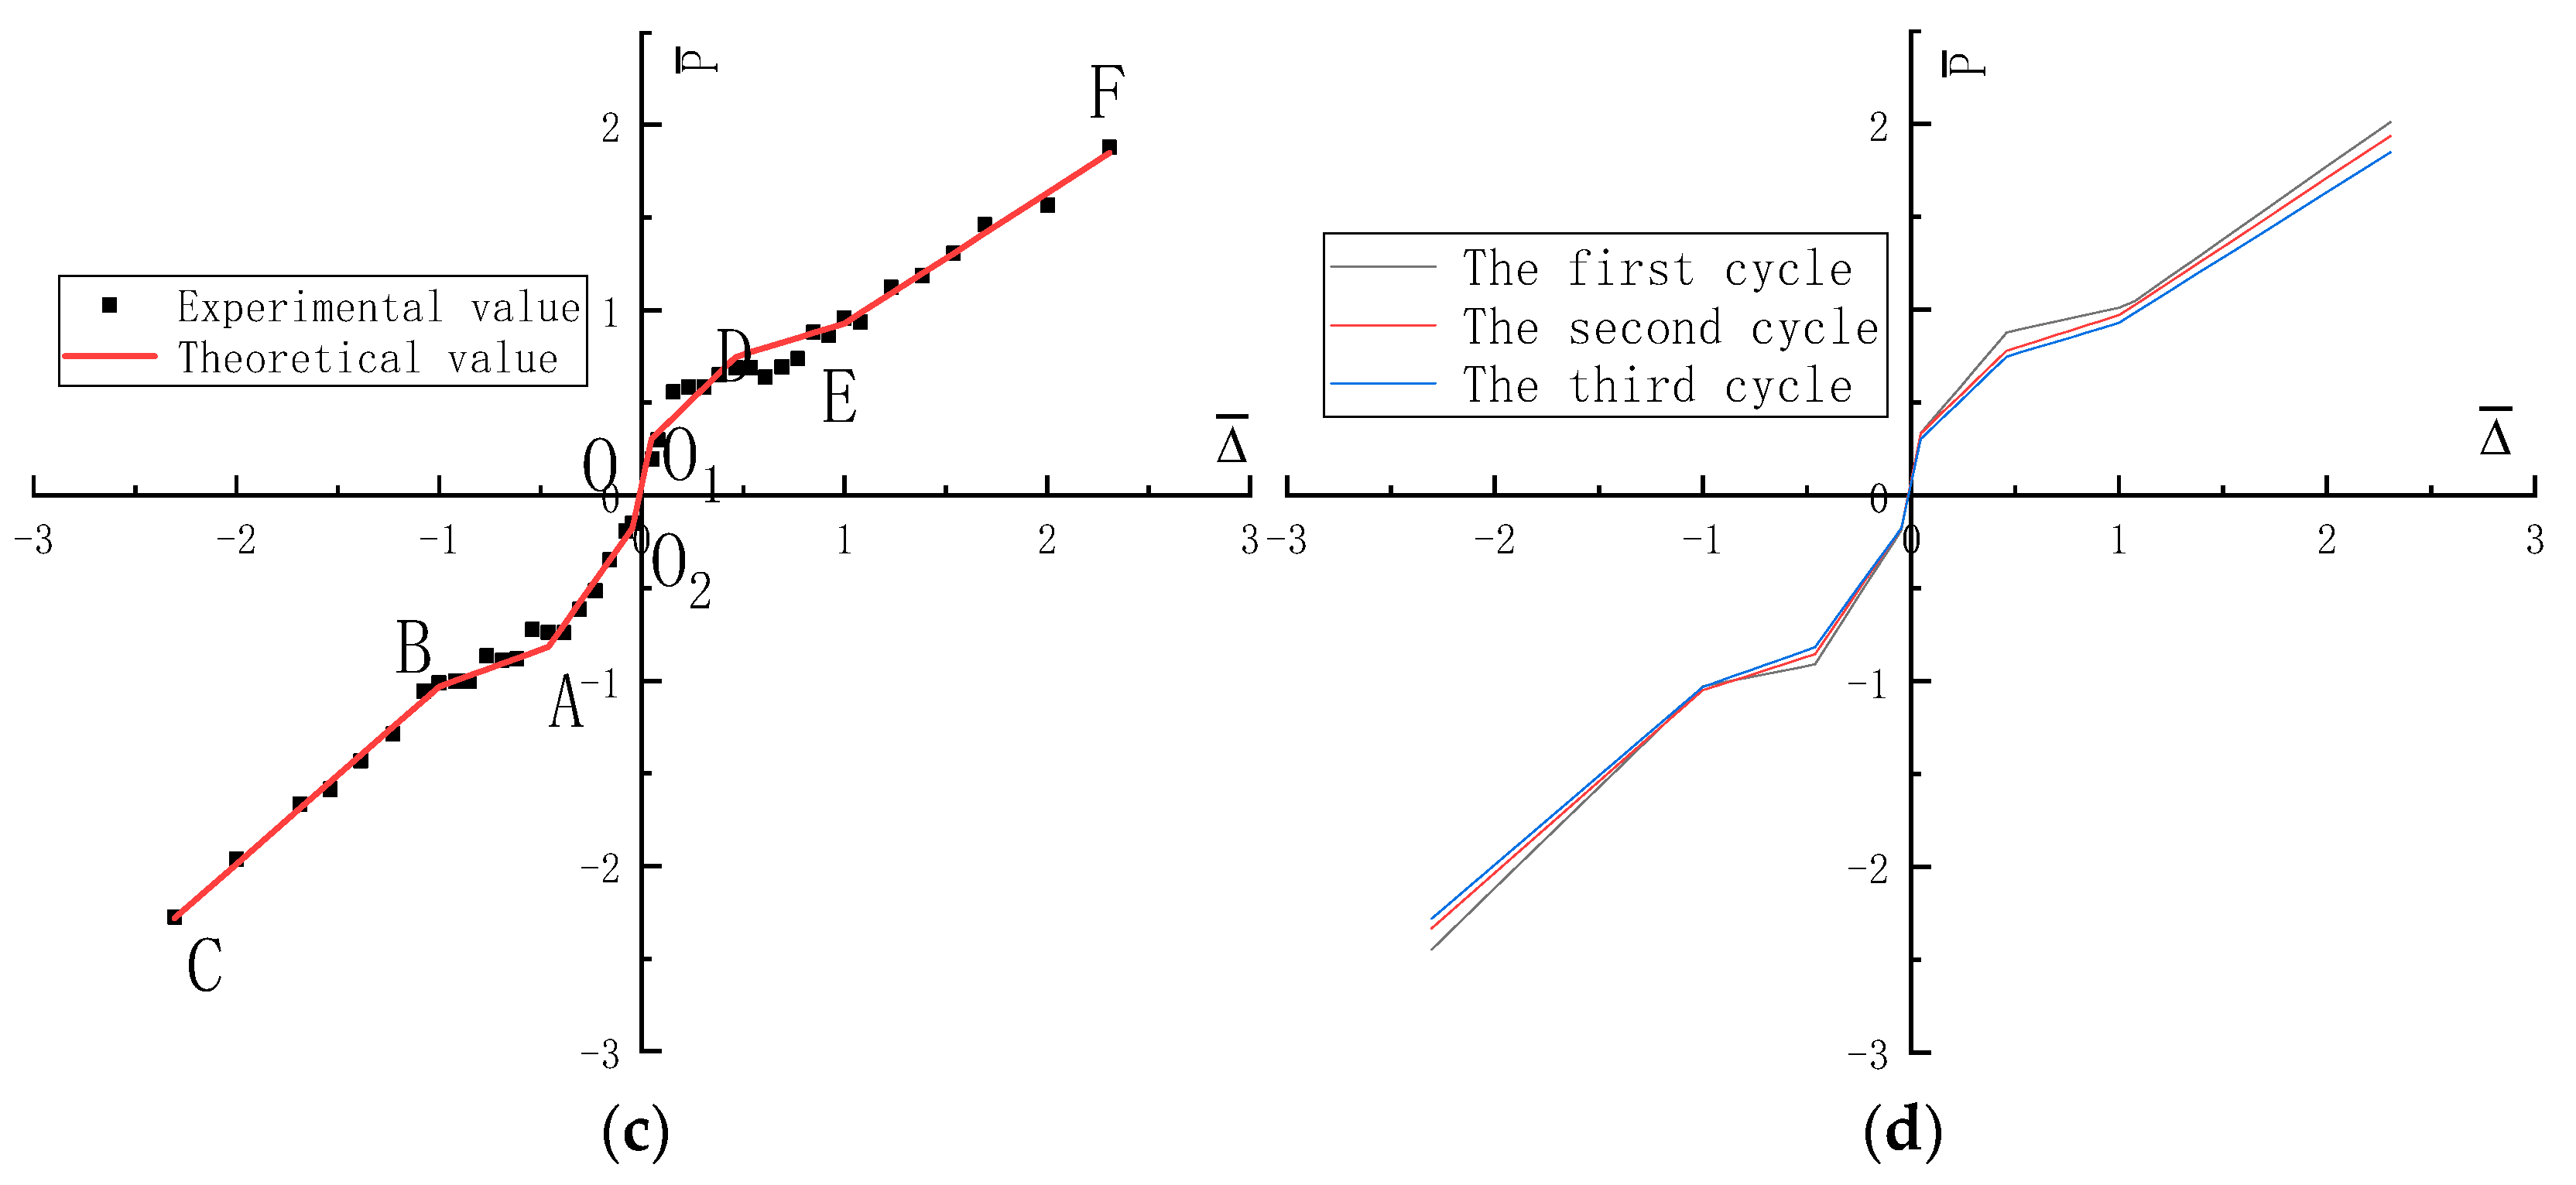
The envelope curve is an essential part of the hysteresis model. In order to build the hysteresis model, the data consisting of the envelope curves should be nondimensionalised. The Δ ¯ - P ¯ relationship curves were thus obtained through the dimensionless processing of the test data of the test specimen, as shown in Equations (1) and (2).
Δ ¯ = Δ / [ ( | Δ m + | + | Δ m | ) / 2 ]
P ¯ = P / [ ( | P m + | + | P m | ) / 2 ]
Δ and P are the loading displacement and the corresponding force. Δ m ± and P m ± are displacements in both the right (positive) direction and the left (negative) direction of the 65 mm cycles and the corresponding forces. Points O1, O2, A, B, D and E are vital points, and points C and F are ultimate loading points (see Figure 15). It was found that the shapes of the dimensionless envelope curves are close to the experimental data points. Table 4 presents the coordinates of the critical points and ultimate loading points; Table 5 shows the regression equations of the fitting envelope curves. The fitted envelope curves (see Figure 15d) indicated a strength degradation trend in the different cycle processes, as is consistent with the test results.

4.2. Stiffness of the Hysteretic Loops

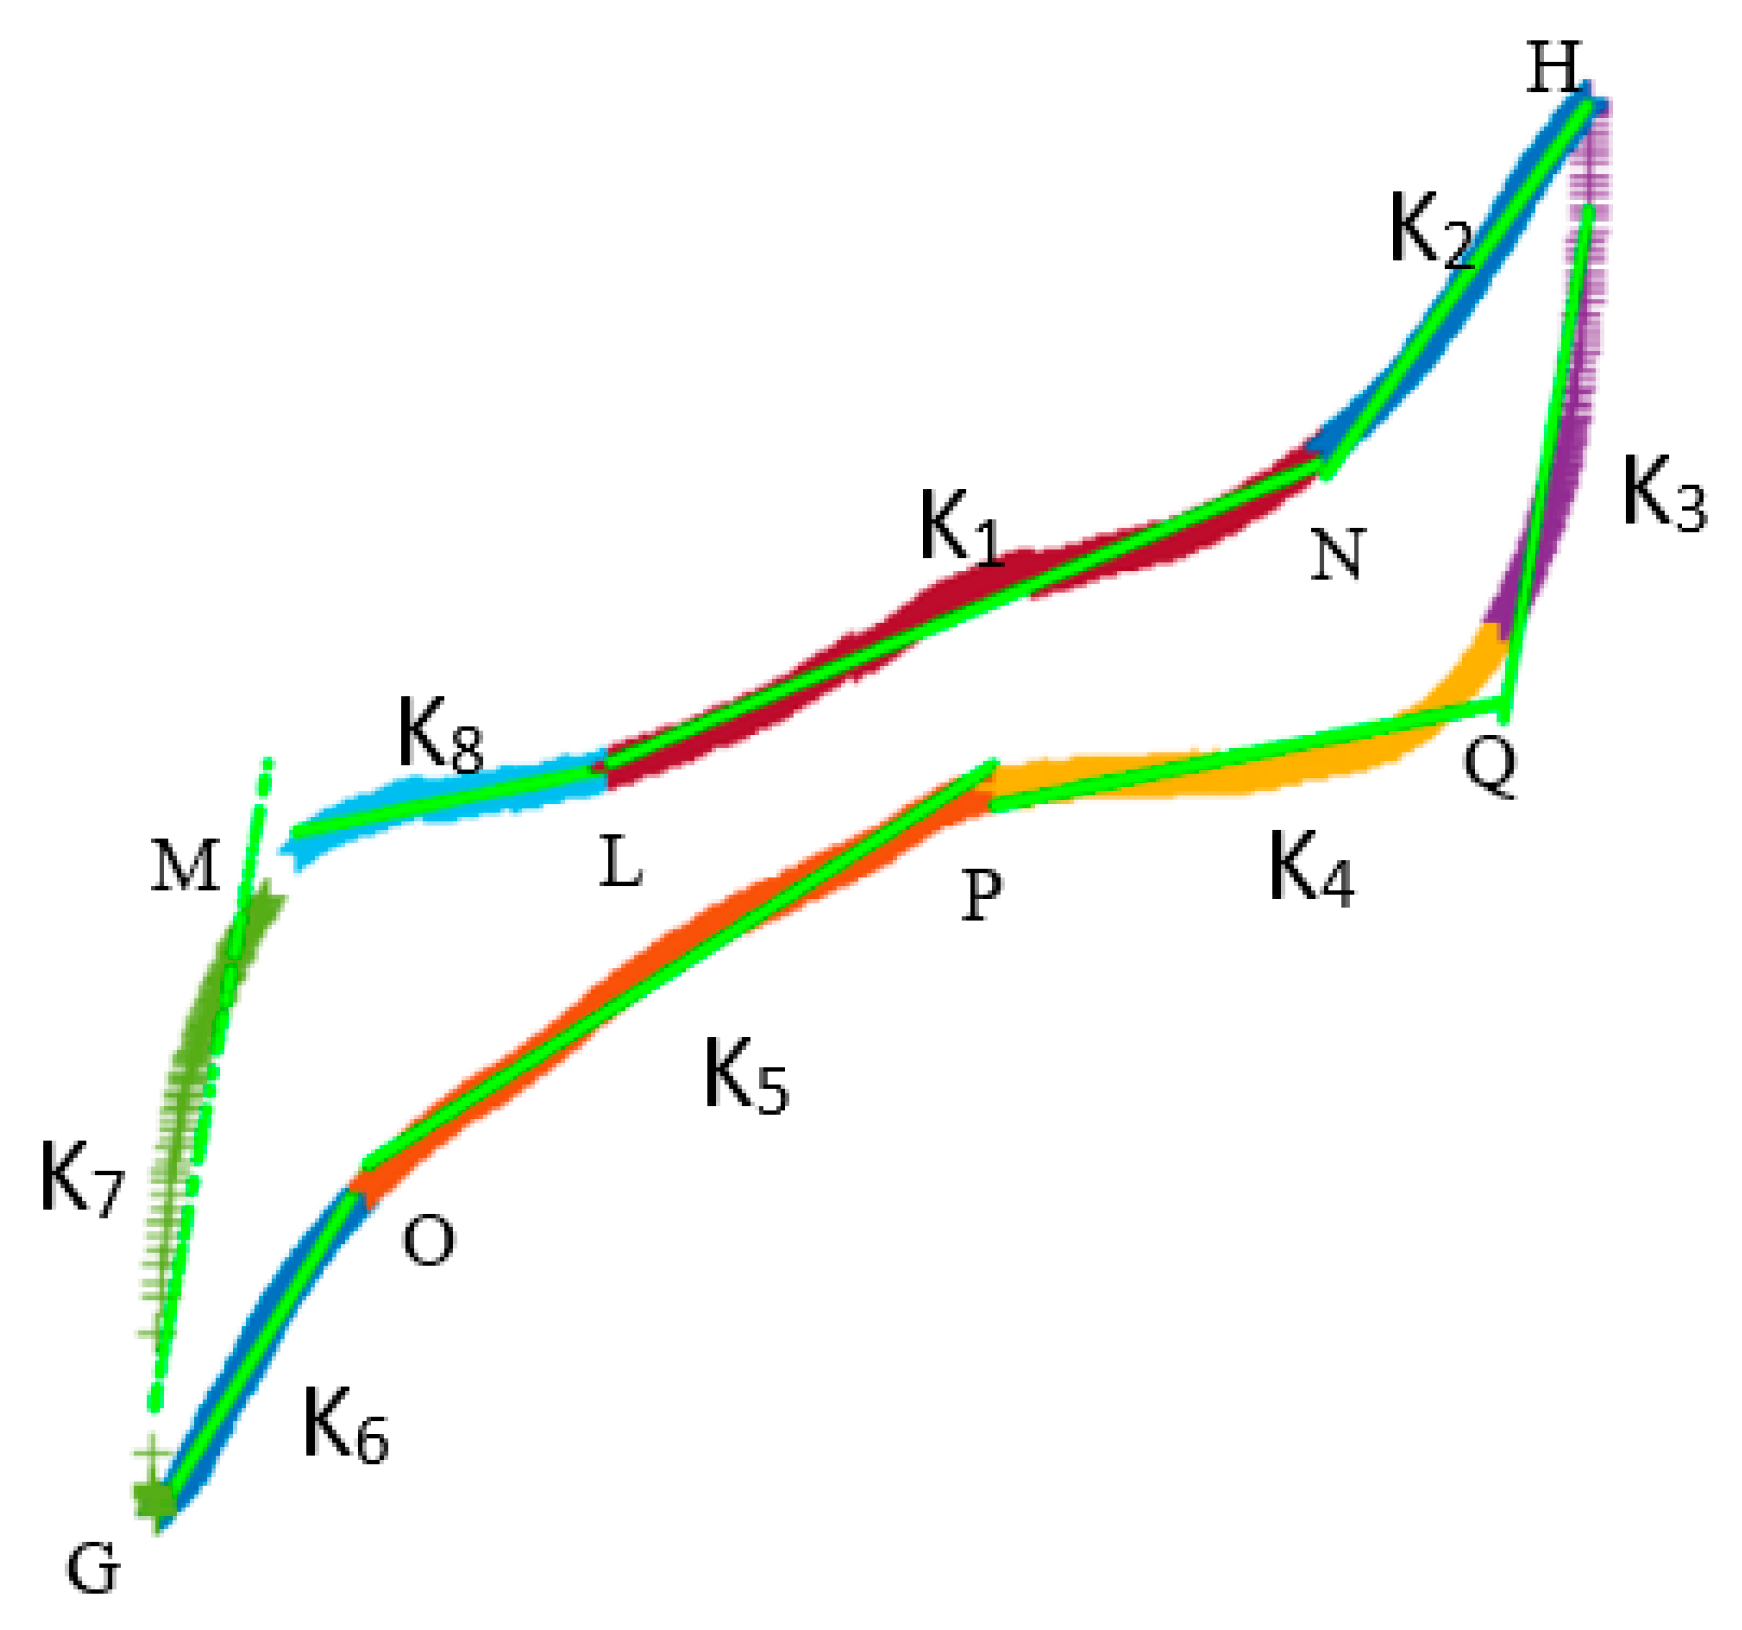
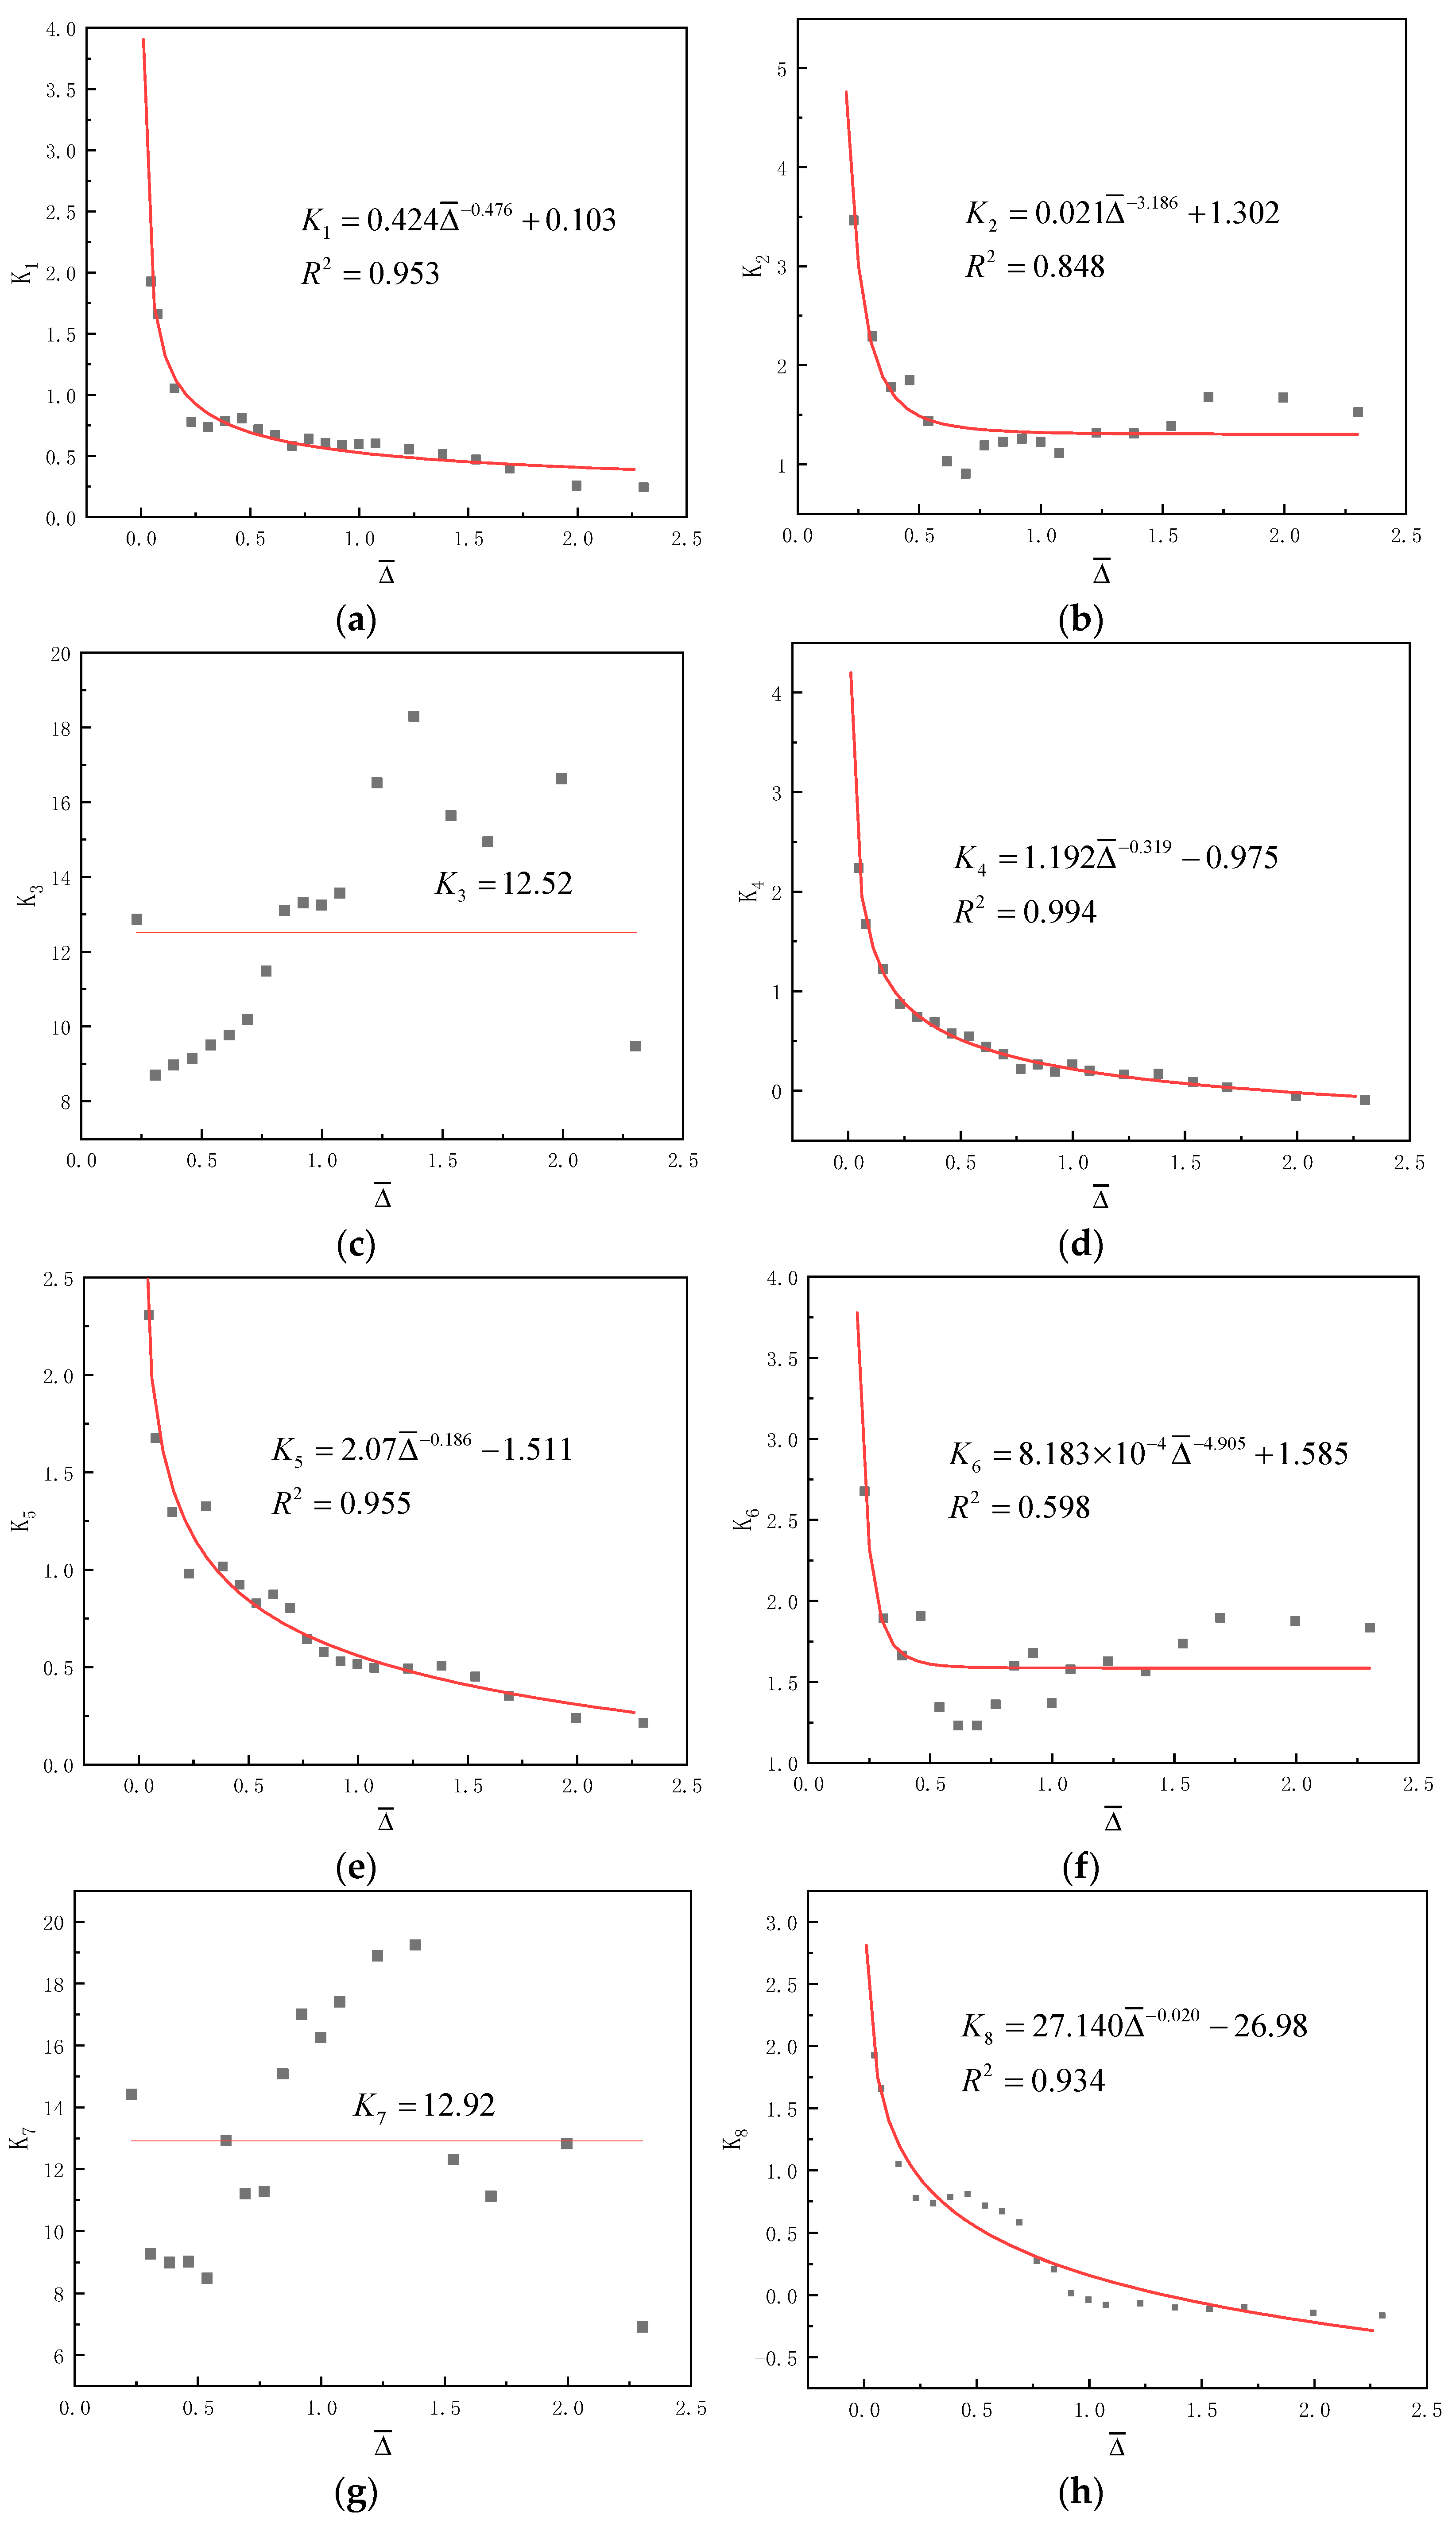
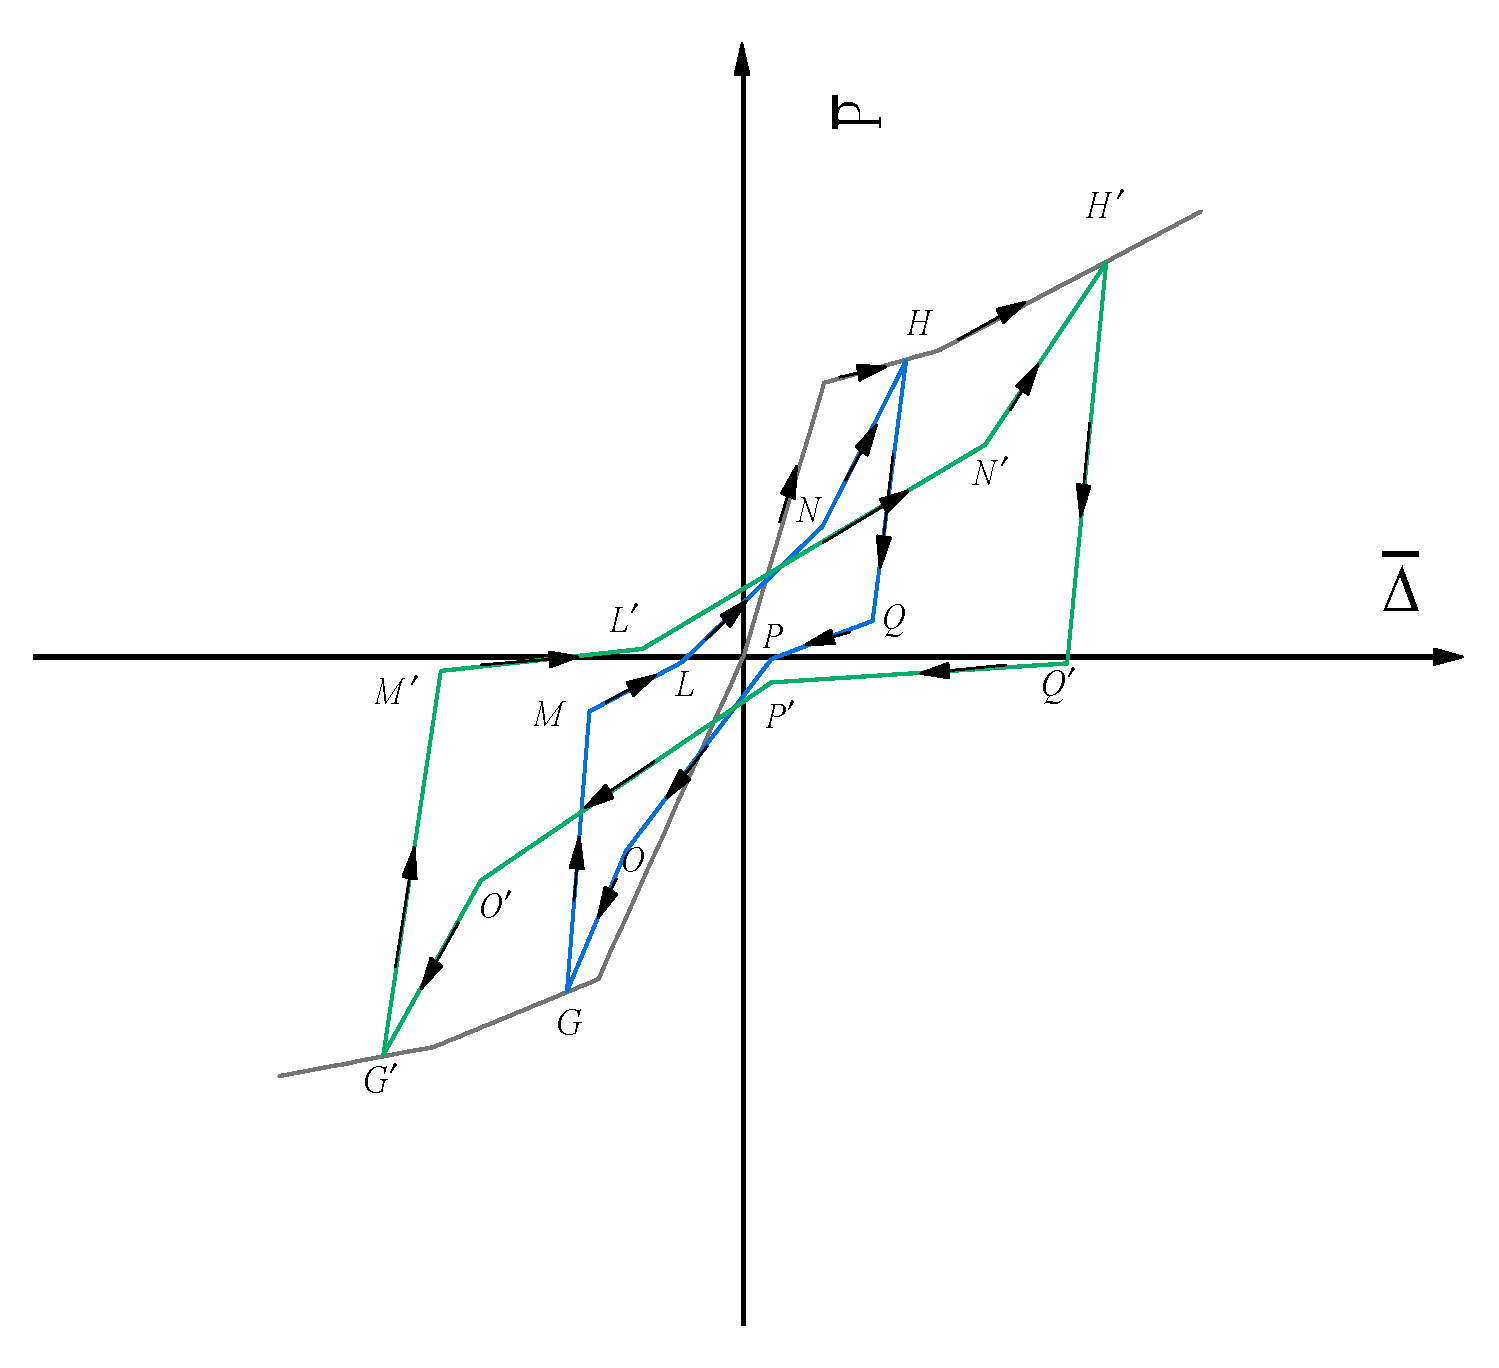
The steps of the investigation of the stiffness of the hysteretic loops were followed. First, the characters of the hysteretic loops were analyzed in order to investigate the changing rules of the stiffness. The findings show that the hysteretic loops of the Kanchuang frame were in the elastic stage when the loading displacements were under 10 mm cycles. If the loading displacements reached and exceeded 15 mm (the drift angle was 3/320), each hysteretic loop was divided into eight feature segments, and M, L, N, O, P and Q were the intersection points of each segment (see Figure 16). K i was used to represent the stiffness of each feature segment (see Table 6). Secondly, dimensionless processing was conducted on the experimental data of the hysteretic loops based on Equations (1) and (2). Third, the regression analysis of dimensionless data points was obtained from the fitting equations of K i (see Table 7). Because of the discreteness of the data of K 3 and K 7 , no appropriate fitting equations were found. Average values were used and adopted to build the hysteresis model. Figure 17 shows the fitted curves, and it was found that the fitting curves simulated the experimental data.
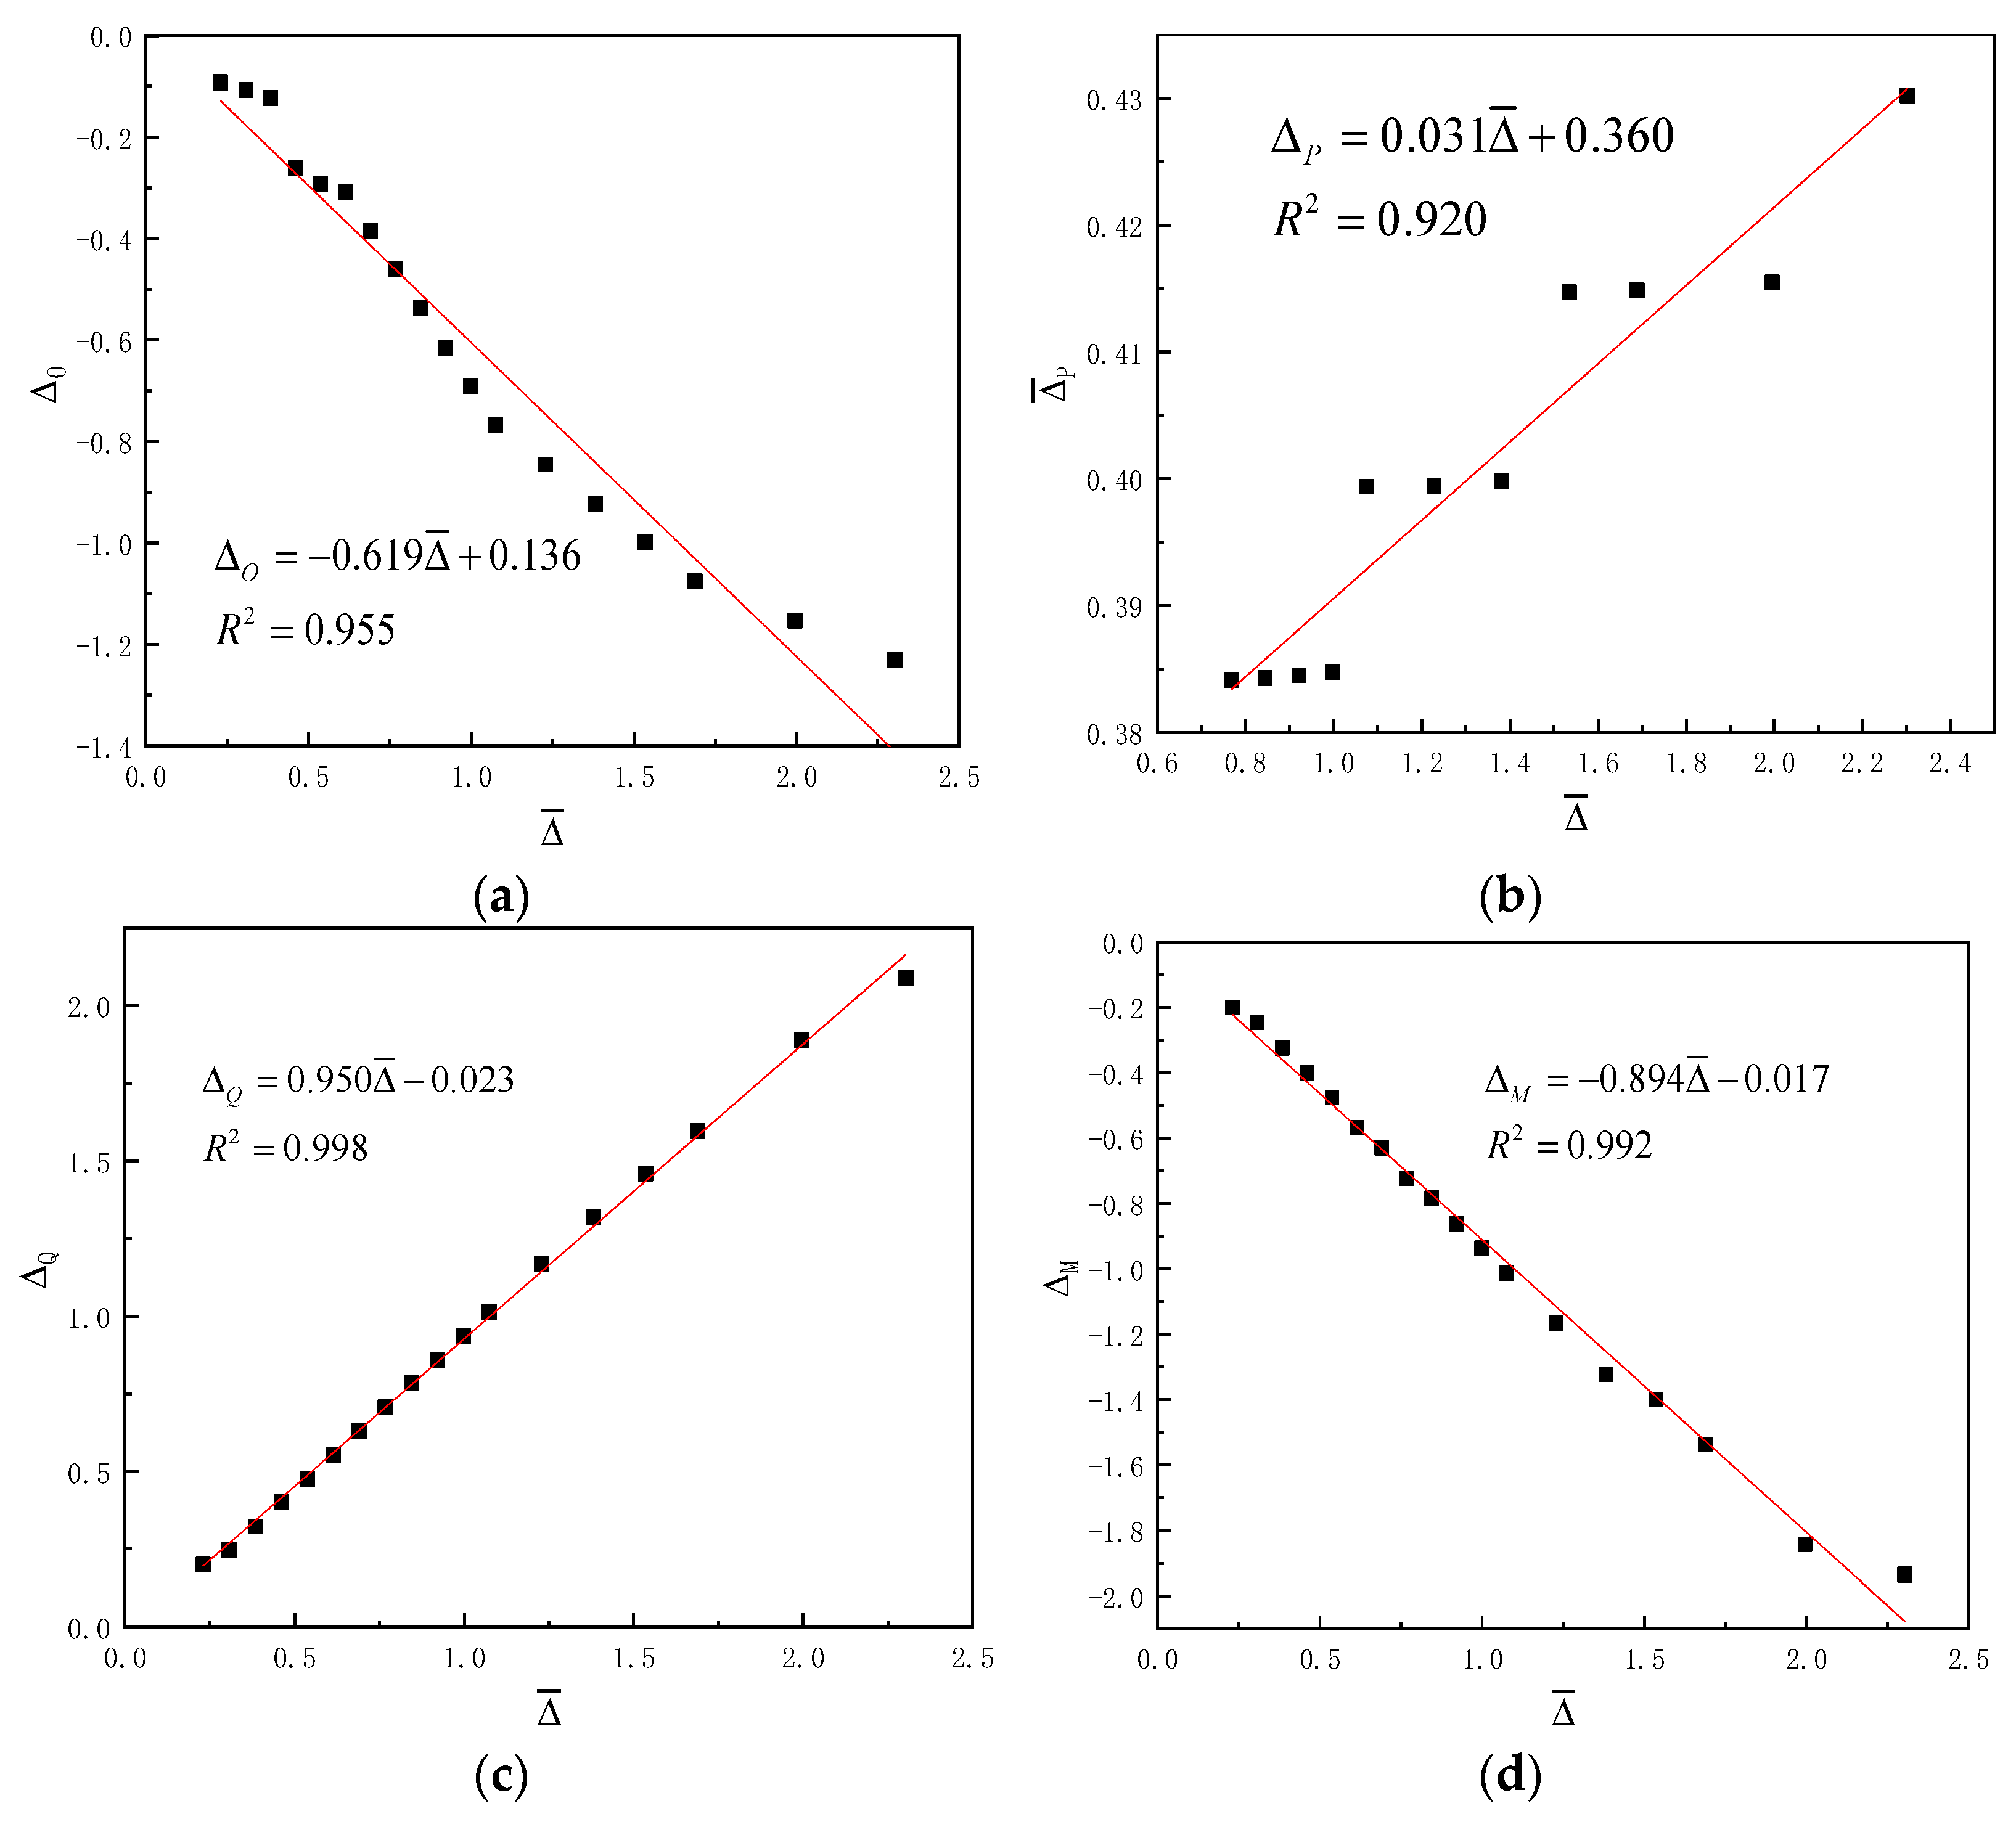
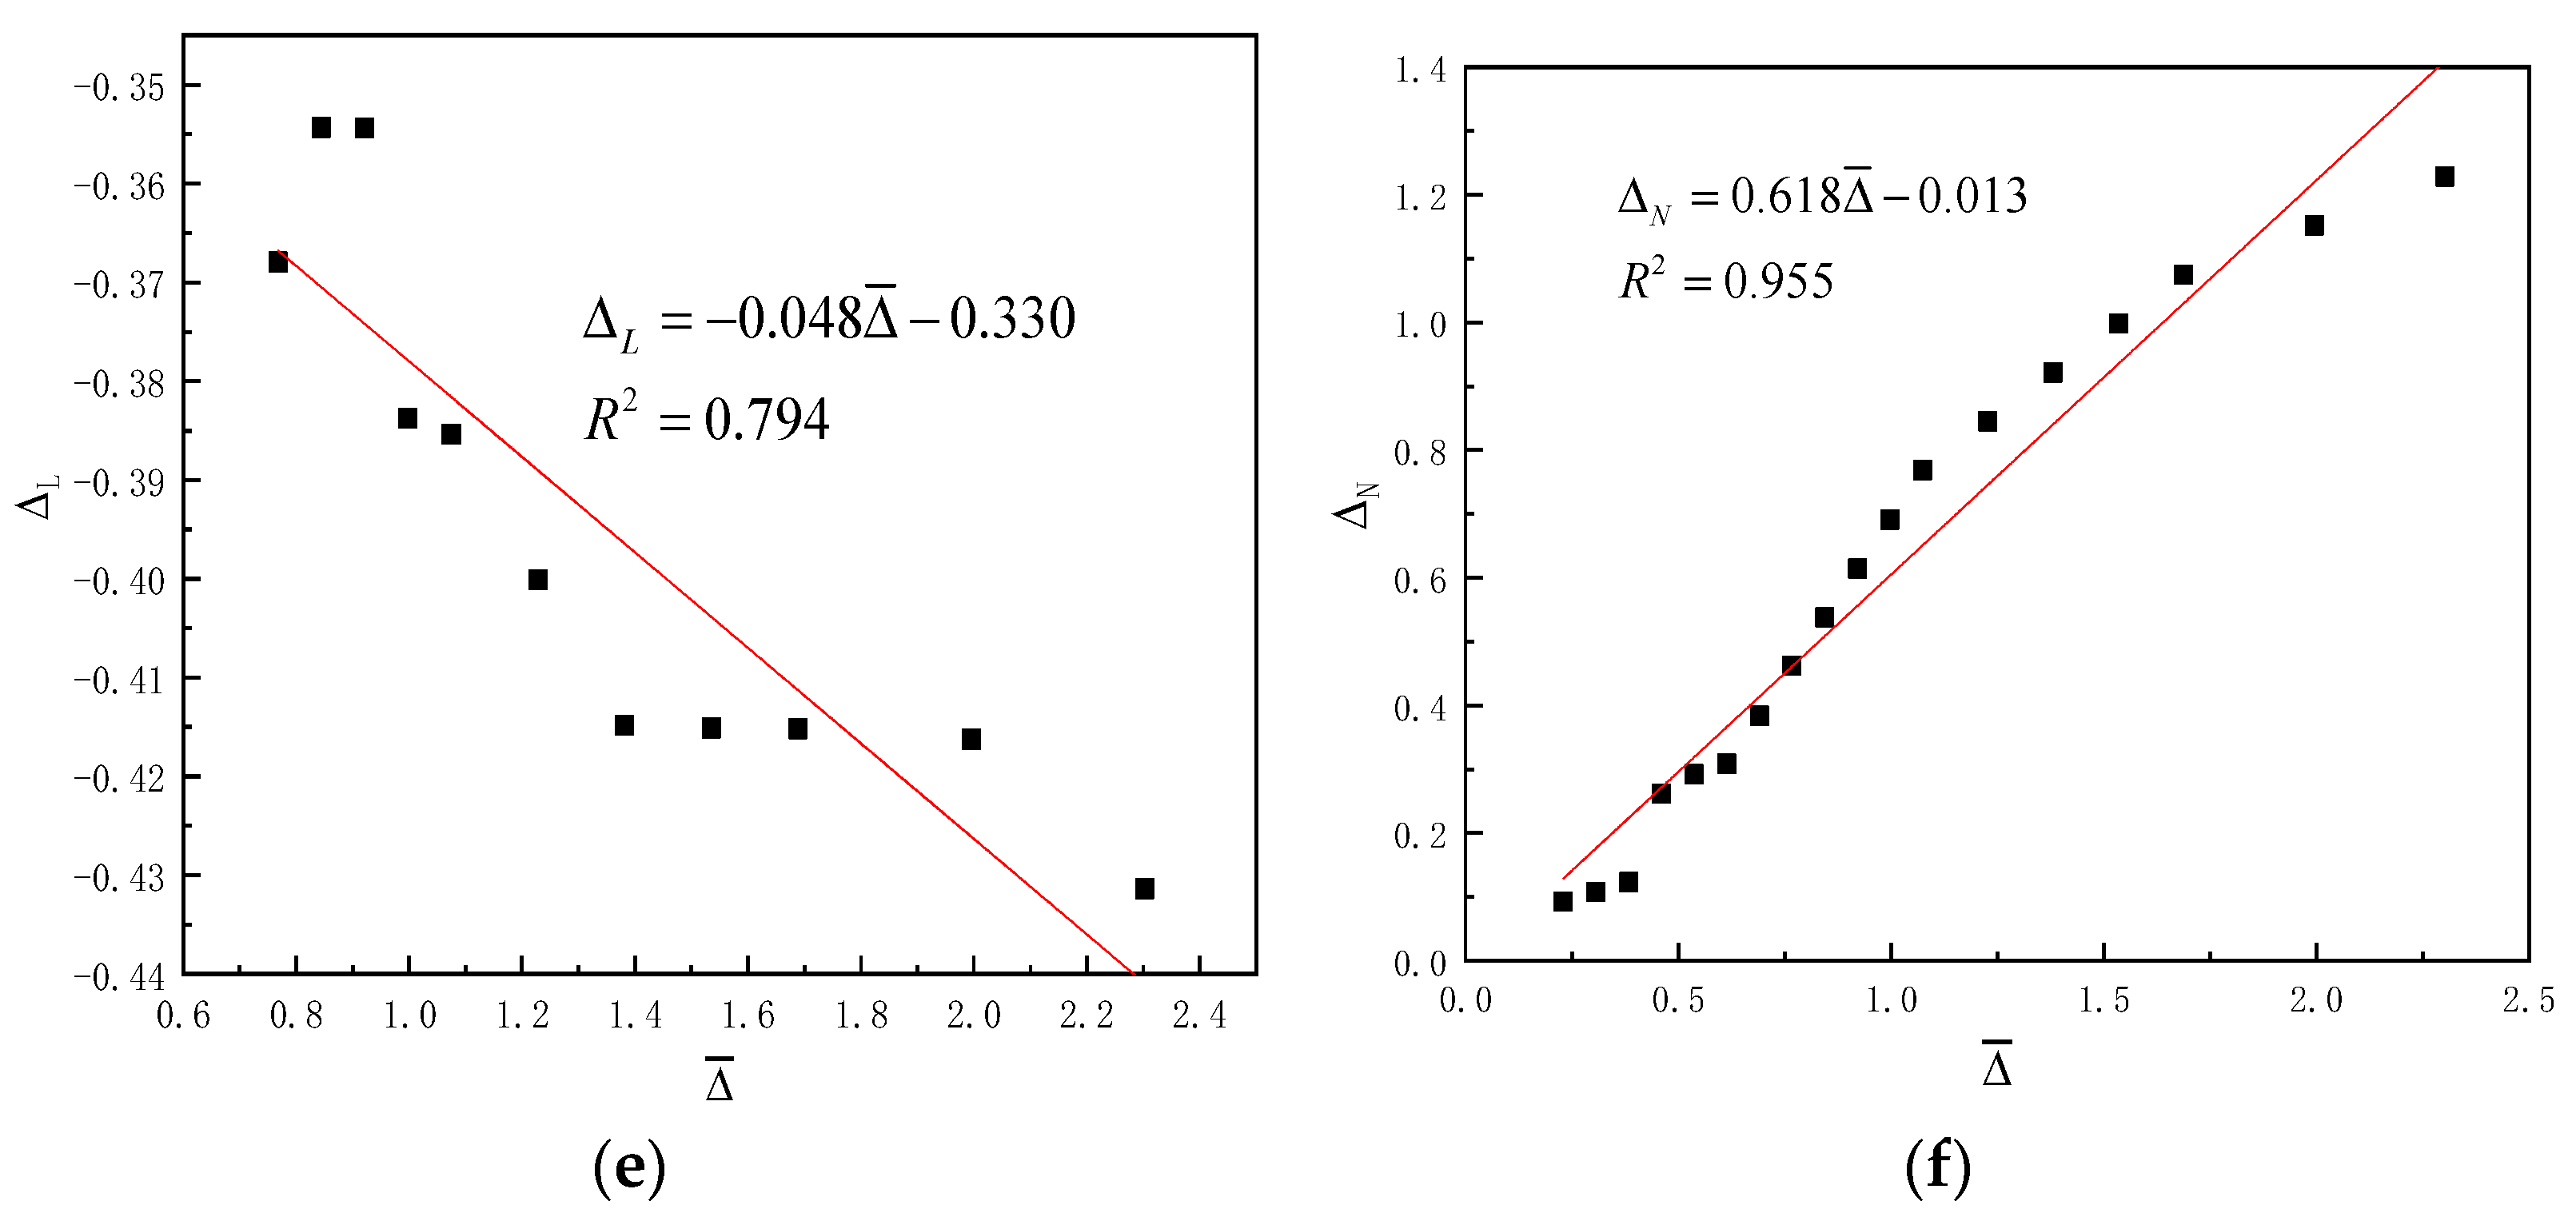
Based upon the analysis on the characteristics of the hysteretic loops, Equation (2) calculated the fitting curves between the displacement cycles and horizontal ordinates of the intersection points. △M, △L, △N, △O, △P and △Q are the dimensionless horizontal ordinates of the intersection points. Linear regression analysis was conducted on the points, and the fitting equations are shown in Table 8. The fitted curves are shown in Figure 18, and the data are close to the fitting line.

4.3. Hysteretic Rule

The hysteretic model plays a crucial role in the nonlinear seismic response analysis of structures. The seismic response analysis results may be diverse when different hysteretic models are adopted. Different kinds of hysteretic model have been widely used to simulate the hysteretic behaviours of different structures. However, it was found that these models cannot simulate the strength degradation and the pinch phenomenon of the hysteretic loops of the Kanchuang frame. A new hysteretic model was proposed to simulate the hysteretic loops of the Kanchuang frame (see Figure 19).
The hysteresis rule is as follows. The loading path follows the envelope curves to point H first. Then, unloading along the paths H–Q with stiffnesses of K 3 . And unloading along path Q–P K 4 . Following this, the curve enters a new stage, loading along paths P–O and O–G with stiffnesses of K 5 and K 6 . G is the peak point of the hysteretic loop. The negative unloading is then following along paths G–M and M–L with stiffnesses of K 7 and K 8 . It then loads along path L-N with the stiffness of K 1 . When the displacement load exceeds point N, the loading stiffness changes to K 2 , loads to the positive peak value H, and the first loading cycle finishes. After the loading displacement exceeds the initial loading displacement, its loading along the envelope curve is from point H to H’, and enters another loading cycle—H’-Q’-P’-O’-G’-M’-L’-N’ -H’—with stiffnesses of K 1 , K 2 , K 3 , K 4 , K 5 , K 6 , K 7 and K 8 . This is similar to the previous cycle.

5. Comparison of the Hysteretic Curves between the Analysis and Test

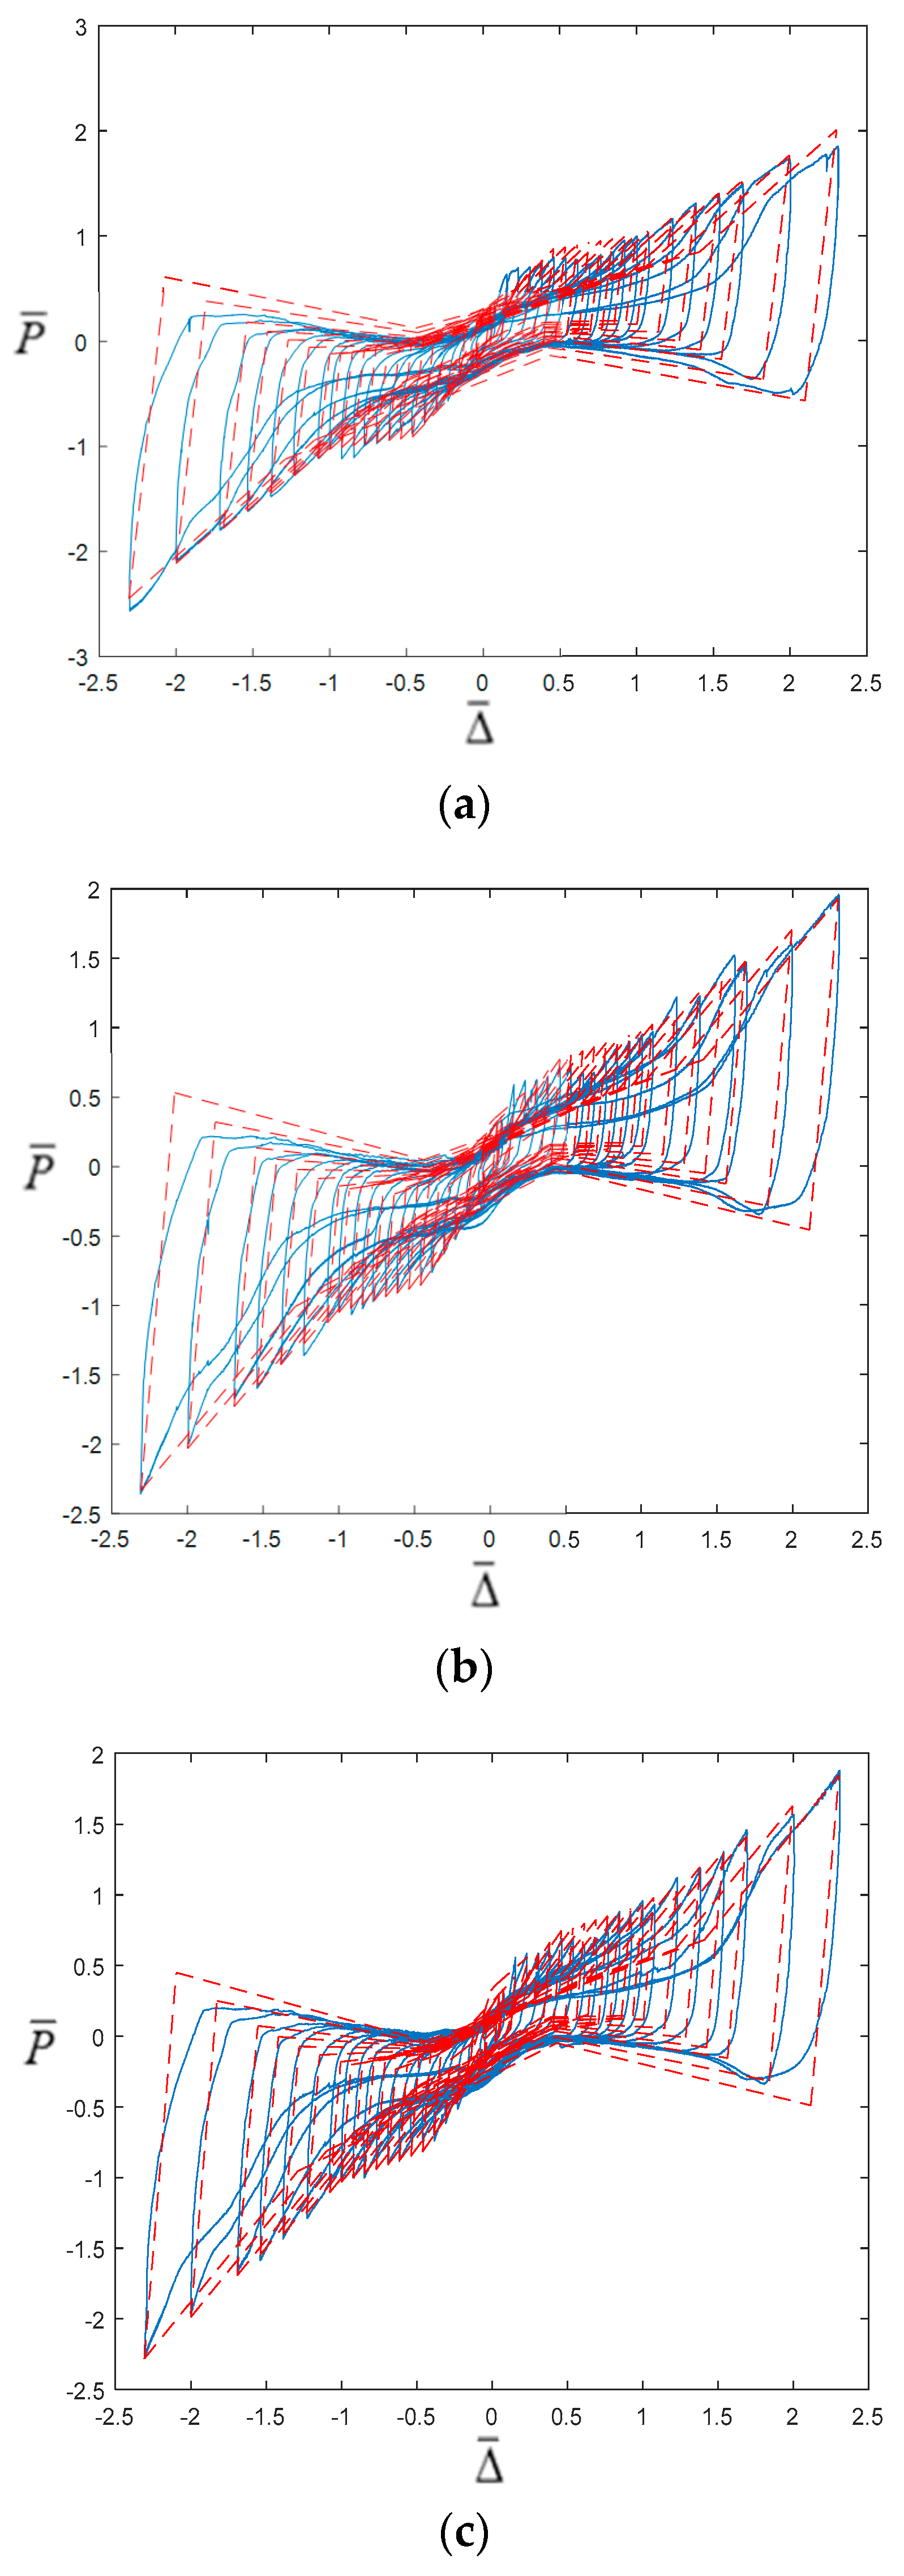
The restoring force model and the experimental loading process were used to obtain the calculated hysteresis curves. Figure 20 shows the comparations of the experimental results and the calculation results of the Kanchuang frame. The test curves are coloured in blue, and the calculation results are red. It was found that the calculation curves are similar to the experimental curves; thus, the hysteretic model simulates the strength degradation, stiffness degradation and pinching effect of the experimental curves. Based on the model, the nonlinear seismic analysis of the traditional timber structure can be used.

6. Conclusions

A 1/2-scale model of a timber frame with a timber window and infilled masonry wall was tested. The failure modes, stress and stiffness of the structure were investigated. Moreover, the characters of the envelope curves and hysteretic loops were studied. Based on the results of this research, the following conclusions can be drawn:
(1)
The test results show that the loading process can be divided into three stages. At the elastic stage, no apparent damage was found through observation except for slight cracks on the wall. During the elastoplastic stage, the cracks on the wall became longer, wider and deeper as the loading displacement increased, and the gaps between the mortises and tenons steadily increased as the loading displacement increased. During the final new elastoplastic stage, the stiffness of the whole structure increased after the masonry wall collapsed. Brittle shear failure was observed in the masonry infill wall. At the end of the test, the masonry wall collapsed, but the timber frames did not fall apart. Slight cracks also appeared on the surface of the Lingtiao.
(2)
The pinching effect was observed from the hysteretic loops of the Kanchuang frame, indicating an occurrence of a slip between the timber components. The bearing capacity and stiffness of the frame were decreased but not lost, showing that the timber frame has good bearing and deformation capacities.
(3)
A dimensionless hysteretic model for the Kanchuang frame was established based on test results and numerical analysis. This model simulates the experimental curves’ strength degradation, stiffness degradation and pinching effect. The calculation results were consistent with the experimental results. They provide references for dynamic analyses of the traditional timber structure under dynamic loads.
(4)
This study provided a useful reference for the seismic evaluation and preservation of cultural heritage. This study also conducted dynamic analyses of the traditional timber structure under dynamic loads. However, in this study, the experimental and analytical studies were carried out on a scaled specimen, not a full-scaled one. Thus, further studies will be conducted to investigate whether this hysteretic model could apply to other frames of different dimensions. Moreover, the seismic and hysteretic behaviours of more timber frames with different types of infilled walls from ancient timber buildings will be studied.

Author Contributions

Conceptualization, J.H. and X.G.; methodology, J.H. and X.G.; formal analysis, J.H., X.G. and Z.G.; investigation, J.H., X.G., Z.G., T.Y., T.C. and Z.S.; writing—original draft preparation, J.H.; writing—review and editing, X.G., Z.G., T.Y., T.C. and Z.S.; supervision, X.G.; project administration, X.G.; funding acquisition, X.G. All authors have read and agreed to the published version of the manuscript.

Funding

This study was financially supported by the National Key R&D Program of China (Grant Number 2019YFC1520803) and the Beijing Municipal Commission of Education–Municipal Natural Science Joint Foundation: “Research on Seismic Performance Evaluation of Beijing Ancient Timber Buildings Based on Value and damage Characteristics” (No. KZ202010005012).

Institutional Review Board Statement

Not applicable.

Informed Consent Statement

Not applicable.

Data Availability Statement

Not applicable.

Acknowledgments

The support of the National Key R&D Program of China (Grant Number 2019YFC1520803) and the Beijing Municipal Commission of Education–Municipal Natural Science Joint Foundation (Grant number KZ202010005012) is highly appreciated.

Conflicts of Interest

The authors declare no conflict of interest.

References

  1. Zhou, Q.; Yan, W.M.; Yang, X.S.; Bao, J.J. Damage of ancient Chinese architecture caused by the Wenchuan earthquake. Sci. Conserv. Archaeol. 2010, 22, 37–45. [Google Scholar]
  2. Fang, D.P.; Iwasaki, S.; Yu, M.H.; Shen, Q.P.; Miyamoto, Y.; Hikosaka, H. Ancient Chinese timber architecture I: An experimental study. J. Struct. Eng. 2001, 127, 1348–1357. [Google Scholar] [CrossRef]
  3. Xie, Q.; Zhang, L.; Wang, L.; Zhou, W.; Zhou, T. Lateral performance of traditional Chinese timber frames: Experiments and analytical model. Eng. Struct. 2019, 186, 446–455. [Google Scholar] [CrossRef]
  4. Li, J. Yingzao Fashi Construction Method; Royal Press: Kaifeng, China, 1103; (In Ancient Chinese). [Google Scholar]
  5. Liang, S.C. A Pictorial History of Chinese Architecture: A Study of the Development of Its Structural System and the Evolution of Its Types; MIT Press: Cambridge, MA, USA, 1984. [Google Scholar]
  6. Eckelman, C.A.; Uysal, M.; Haviarova, E. Statistical lower tolerance limits for rectangular mortise and tenon joints. BioResources 2016, 11, 7162–7171. [Google Scholar] [CrossRef] [Green Version]
  7. Likos, E.; Haviarova, E.; Eckelman, C.A.; Erdil, Y.Z.; Ozcifci, A. Effect of tenon geometry, grain orientation, and shoulder on bending moment capacity and moment rotation characteristics of mortise and tenon joints. Wood Fiber Sci. 2012, 44, 462–469. [Google Scholar]
  8. Huan, J.H.; Ma, D.H.; Guo, X.D.; Xu, S. Experimental study of aseismic behaviors of flexural tenon joint, through tenon joint and dovetail joint reinforced with flat steel devices. J. Beijing Univ. Technol. 2019, 45, 763–771. [Google Scholar]
  9. Chen, C.; Qiu, H.; Lu, Y. Flexural behaviour of timber dovetail mortise–tenon joints. Constr. Build. Mater. 2016, 112, 366–377. [Google Scholar] [CrossRef] [Green Version]
  10. Zhong, J.; Wang, L.; Li, Y.; Zhou, M. Solving the mystery of China’s thousand-year-old wooden pagoda. Civ. Eng. 2017, 170, 169–173. [Google Scholar] [CrossRef]
  11. Chen, Z.; Zhu, E.; Lam, F.; Pan, J. Structural performance of Dou-Gong brackets of Yingxian Wood Pagoda under vertical load—An experimental study. Eng. Struct. 2014, 80, 274–288. [Google Scholar] [CrossRef]
  12. Wu, Y.; Song, X.; Ventura, C.; Lam, F. Modeling hysteretic behavior of lateral load-resisting elements in traditional Chinese timber structures. J. Struct. Eng. 2020, 146, 04020062. [Google Scholar] [CrossRef]
  13. Meng, X.-J.; Li, T.-Y.; Yang, Q.-S. Lateral structural performance of column frame layer and dou-gong layer in a timber structure. KSCE J. Civ. Eng. 2018, 23, 666–677. [Google Scholar] [CrossRef]
  14. Kaori, F. Dynamic performance of bracket complexes used in traditional timber structures in Japan. Proc. Jpn. Acad. 2019, 95, 568–580. [Google Scholar]
  15. Tsuwa, I.; Koshihara, M.; Fujita, K.; Isao, K. A study on the size effect of bracket complexes used in traditional timber structures on the vibration characteristics. In Proceedings of the 10th World Conference on Timber Engineering, Miyazaki, Japan, 2–5 June 2008. [Google Scholar]
  16. Cui, Z.H.; Wang, J.; Yang, Q.S. Study on the structural performance of the hall-style wooden frame and bracket complexes in Tang Dynasty. In Proceedings of the 10th World Conference on Timber Engineering, Miyazaki, Japan, 2–5 June 2008. [Google Scholar]
  17. Yeo, S.Y.; Chung, Y.L.; Huang, Y.C.; Yeh, Y.H.; Hsu, M.F. Seismic behaviour of Taiwanese timber complex brackets subjected to out-of-plane loading. J. Proc. Inst. Civ. Eng.-Eng. Hist. Herit. 2020, 174, 15–31. [Google Scholar] [CrossRef]
  18. Xie, W.; Wang, T.H.; Chang, W.S. Static behaviour of a two-tiered Dou-Gong system reinforced by super-elastic alloy. J. Proc. Inst. Civ. Eng.-Eng. Hist. Herit. 2019, 172, 164–173. [Google Scholar] [CrossRef]
  19. Huan, J.H.; Ma, D.H.; Wang, W. Vulnerability analysis of ancient timber architecture by considering the correlation of different failure modes. Math. Probl. Eng. 2018, 2018, 5163472. [Google Scholar] [CrossRef]
  20. Huan, J.H.; Ma, D.H.; Wang, W.; Guo, X.D.; Wang, Z.Y.; Wu, L.C. Evaluation model of structural entropy weight-matter element extension for ancient timber architecture safety state. Adv. Struct. Eng. 2020, 23, 1087–1097. [Google Scholar] [CrossRef]
  21. Huan, J.H.; Ma, D.H.; Wang, W.; Wang, Z. Safety State evaluation method based on attribute recognition model for ancient timber buildings. Adv. Civ. Eng. 2019, 2019, 3612535. [Google Scholar] [CrossRef]
  22. Xie, Q.; Wang, L.; Zhang, L.; Hu, W.; Zhou, T. Seismic behaviour of a traditional timber structure: Shaking table tests, energy dissipation mechanism and damage assessment model. Bull. Earthq. Eng. 2019, 17, 1689–1714. [Google Scholar] [CrossRef]
  23. Vieux-Champagne, F.; Sieffert, Y.; Grange, S.; Polastri, A.; Ceccotti, A.; Daudeville, L. Experimental analysis of seismic resistance of timber-framed structures with stones and earth infill. Eng. Struct. 2014, 69, 102–165. [Google Scholar] [CrossRef]
  24. Vieux-Champagne, F.; Sieffert, Y.; Grange, S.; Nko’Ol, C.B.; Bertrand, E.; Duccini, J.C.; Faye, C.; Daudeville, L. Experimental analysis of a shake table test of timber-framed structures with stones and earth infill. Earthq. Spectra 2017, 33, 1075–1100. [Google Scholar] [CrossRef] [Green Version]
  25. Ali, Q.; Schacher, T.; Ashraf, M.; Naeem, A.; Ahmad, N.; Umar, M. In-Plane Behavior of the Dhajji Walls (Wooden Braced Frame with Stone Infill). Earthq. Spectra 2012, 28, 835–858. [Google Scholar] [CrossRef]
  26. Poletti, E.; Vasconcelos, G. Seismic behaviour of traditional timber frame walls: Experimental results on unreinforced walls. Bull. Earthq. Eng. 2015, 13, 885–916. [Google Scholar] [CrossRef]
  27. Dutu, A.; Yamazaki, Y.; Sakata, H. Shear spring model proposed for seismic evaluation of a timber framed masonry infilled wall. Eng. Struct. 2018, 167, 671–682. [Google Scholar] [CrossRef]
  28. Dutu, A.; Sakata, H.; Yamazaki, Y.; Shindo, T. In-plane behavior of timber frames with masonry infills under static cyclic loading. J. Struct. Eng. 2016, 142, 04015140. [Google Scholar] [CrossRef]
  29. Guo, X.D.; Wu, L.C.; Xu, Q.F.; Huan, J.H. Research on drift angle on wooden frame with partition board based on value recognition. Ind. Constr. 2021, 51, 113–120. [Google Scholar]
  30. Xie, Q.; Wang, L.; Li, S.; Zhang, L.; Hu, W. Influence of wood infill walls on the seismic performance of Chinese traditional timber structure by shaking table tests. Bull. Earthq. Eng. 2020, 18, 5009–5029. [Google Scholar] [CrossRef]
  31. Chang, W.S.; Komatsu, K.; Hsu, M.F.; Chen, W.J. On mechanical behavior of traditional timber shear wall in Taiwan I: Background and theory derivation. J. Wood Sci. 2007, 53, 17–23. [Google Scholar] [CrossRef]
  32. Chang, W.S.; Hsu, M.F.; Komatsu, K. A new proposal to reinforce planked timber shear walls. J. Wood Sci. 2011, 57, 493–500. [Google Scholar] [CrossRef]
  33. Chang, W.S.; Hsu, M.F.; Komatsu, K.; Chen, W.J. On mechanical behavior of traditional timber shear wall in Taiwan II: Simplified calculation and experimental verification. J. Wood Sci. 2007, 53, 24–30. [Google Scholar] [CrossRef]
  34. Zhang, D.; Tao, Z.; Zhang, G.G.; Li, J.C. Experimental study on restoring force model for outer shell beam-column joints of steel structure. J. Eng. Sci. Technol. Rev. 2017, 10, 203–212. [Google Scholar] [CrossRef]
  35. Zhang, P.; Sun, R.; Deng, Y.; Li, Z.Z. Resilience model of steel-reinforced concrete tension columns. J. Disaster Prev. Mitig. Eng. 2021, 41, 549–557. [Google Scholar]
  36. Wu, L.W.; Chen, H.B.; Guo, X.Y.; Guo, J.J.; Wang, S. Study on hysteretic and restoring force model of precast T-shaped joint with concrete-filled steel tubular column. J. Build. Struct. 2021, 42 (Suppl. S2), 117–124. [Google Scholar]
  37. Kline, S.J. Similitude and Approximation Theory; Mc Graw-Hill: New York, NY, USA, 1965. [Google Scholar]
  38. Chen, Z.Y.; Zhu, E.C.; Pan, J.L.; Wu, G.F. Energy dissipation performance of typical beam-column joints in Yingxian Wood Pagoda: Experimental study. J. Perform. Constr. Facil. 2015, 30, 04015028. [Google Scholar] [CrossRef]
  39. JGJ/T 70-200; Standard for Test Method of Performance on Building Mortar. China Architecture and Building Press: Beijing, China, 2009.
  40. GB/T 2542; Test Method of Wall Bricks. China Architecture and Building Press: Beijing, China, 2012.
  41. GB/T 50129-2011; Standard for Test Method of Basic Mechanics Properties of Masonry. China Architecture and Building Press: Beijing, China, 2011.
  42. GB 1927-1943; Physical and Mechanical Methods of Wood: –91. China Standards Press: Beijing, China, 1992.
  43. Liu, D.K. Roof loads of Chinese timber buildings (first volume). Tradit. Chin. Archit. Gard. 2001, 3, 58–64. [Google Scholar]
  44. Liu, D.K. Roof loads of Chinese timber buildings (second volume). Tradit. Chin. Archit. Gard. 2001, 4, 56–63. [Google Scholar]
  45. Chen, J.Y.; Shi, X.W.; Niu, Q.F.; Wei, J.W.; Li, T.Y.; Zhao, Y.X. Analysis of similar CaiFen modular system based on the weight of the roof of Song dynasty. J. Civ. Archit. Environ. Eng. 2016, 38, 27–33. [Google Scholar]
  46. Zhou, Y.; Lv, X.L. Method and Technology for Shaking Table Model Test of Building Structures; Science Press: Beijing, China, 2016. [Google Scholar]
  47. Sabnis, G.M.; Harris, H.G. Structural Modeling and Experimental Techniques; Prentice-Hall: Englewood Cliffs, NJ, USA, 1983. [Google Scholar]
  48. ISO/FDIS 21581; Timber Structures—Static and Cyclic Lateral Load Test Methods for Shear Walls. China Standards Press: Beijing, China, 2010.
  49. Huan, J.H.; Guo, X.D.; Ma, D.H.; Guan, Z.Z. Seismic performance and damage evaluation of Kanchuang frame of ancient architecture. J. Civ. Environ. Eng. 2022, 44, 129–137. [Google Scholar]
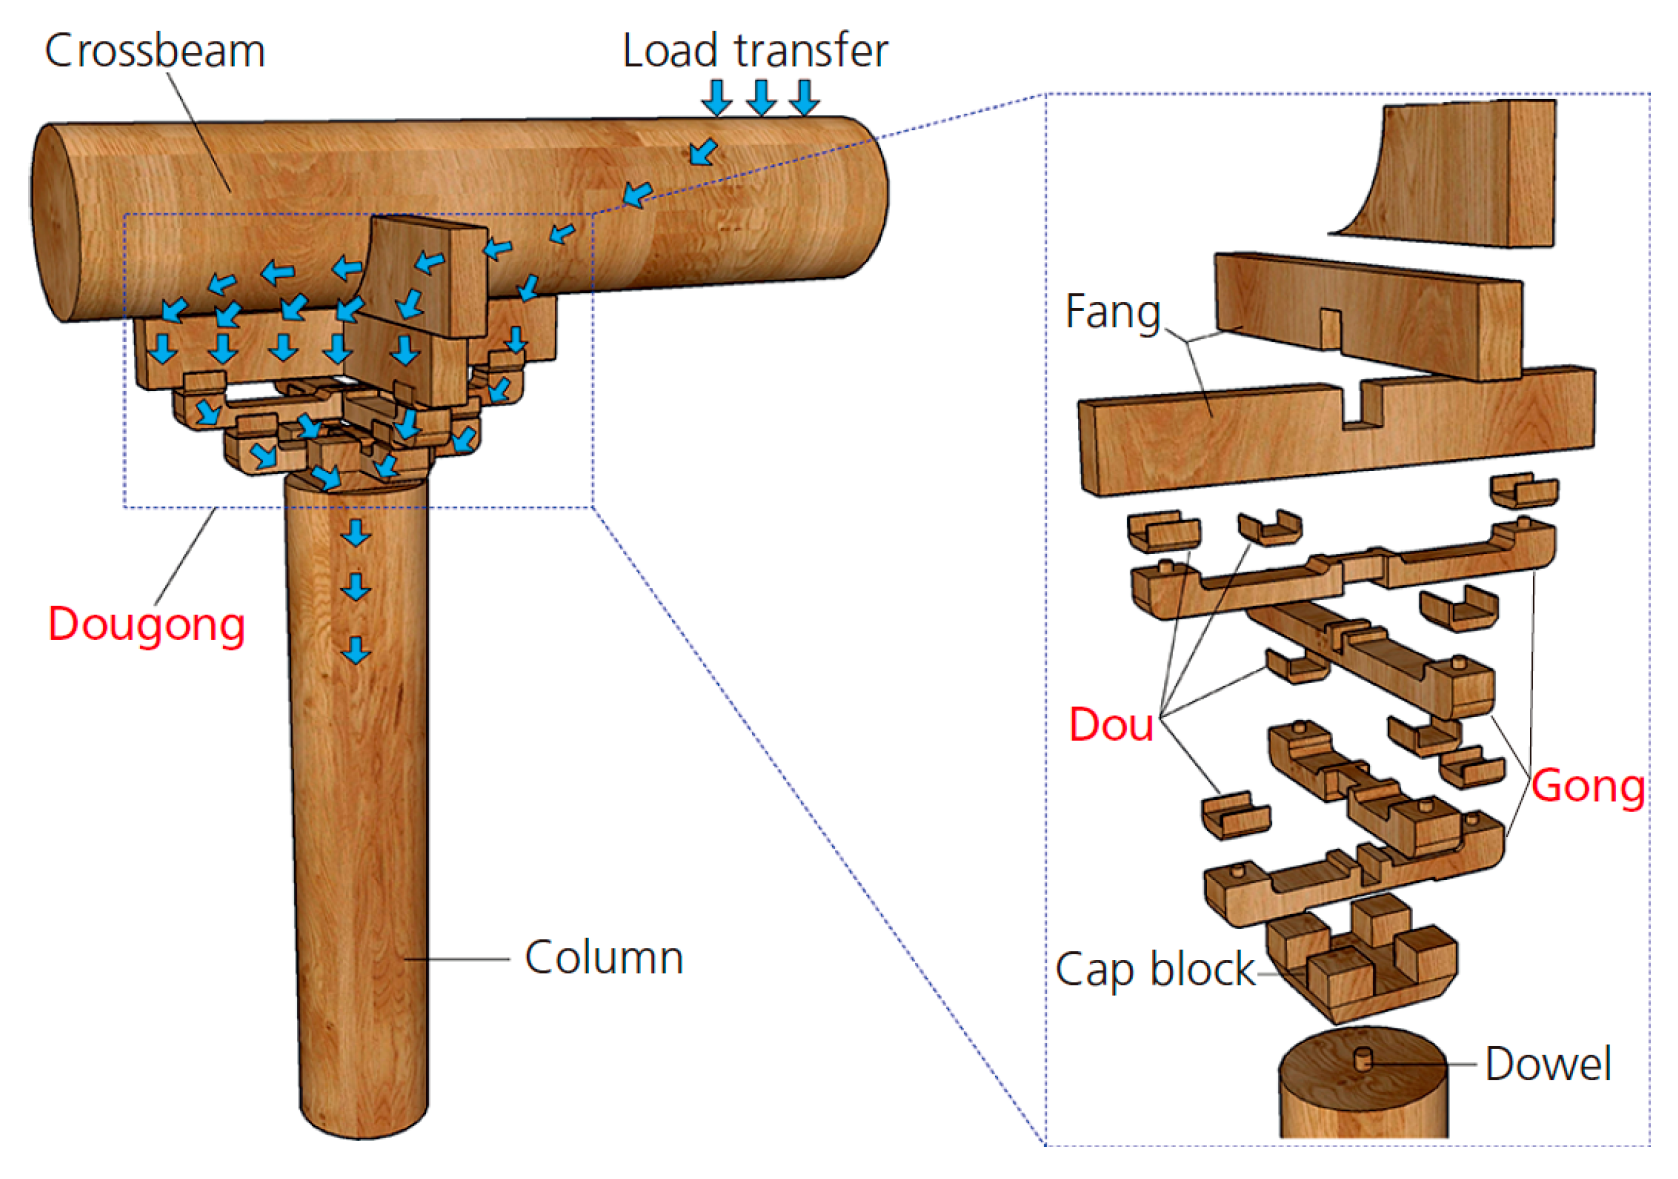
Figure 1. Structure of Dou-gong.
Buildings 12 00887 g001
Figure 2. Dimensions of the experimental model (mm).
Buildings 12 00887 g002
Figure 3. Dimensions of the specimen (mm).
Buildings 12 00887 g003
Figure 4. Dimensions of the mortise and tenon joints (unit: mm): (a) mortise of the Bianting and tenon of the Zhongmo; (b) mortise of the Bianting and tenon of the Shangmo/Xiamo.
Buildings 12 00887 g004
Figure 5. Compressive strength test of the masonry.
Buildings 12 00887 g005
Figure 6. Shear stress test of the masonry.
Buildings 12 00887 g006
Figure 7. Load–deformation curves of the test samples: (a) compressive strength test of the masonry samples; (b) shear stress test of the masonry samples; (c) compressive strength test of the wood samples (parallel to the grain); (d) compressive strength test of the wood samples (perpendicular to the grain, T); (e) compressive strength test of the wood samples (perpendicular to the grain, R).
Buildings 12 00887 g007aBuildings 12 00887 g007b
Figure 8. Schematic diagram of the loading equipment.
Buildings 12 00887 g008
Figure 9. Loading scheme.
Buildings 12 00887 g009
Figure 10. Test setup.
Buildings 12 00887 g010
Figure 11. Failure modes of the specimens: (a) crack on the left side of masonry wall at a displacement of 10 mm (the drift angle was 1/160); (b) penetrating cracks on the right side of the masonry wall at a displacement of 35 mm (the drift angle was 7/320); (c) the tenons pull out of mortise at a displacement of 15 mm (the drift angle was 3/320); (d) the tenons pull out of the mortise at a displacement of 30 mm (the drift angle was 7/320); (e) cracks on the masonry wall at a displacement of 50 mm (the drift angle was 1/32); (f) failure modes of the specimens at a displacement of 150 mm (the drift angle was 3/32).
Buildings 12 00887 g011aBuildings 12 00887 g011b
Figure 12. Load–displacement hysteresis curves.
Buildings 12 00887 g012
Figure 13. Load–displacement envelope curves.
Buildings 12 00887 g013
Figure 14. Figures from reference [29]: (a) Test model; (b) hysteretic curves.
Buildings 12 00887 g014aBuildings 12 00887 g014b
Figure 15. Fitting curves of the skeleton curves of the Kanchuang frame: (a) the first cycle; (b) the second cycle; (c) the third cycle; (d) fitting envelope curves of three cycles.
Buildings 12 00887 g015aBuildings 12 00887 g015b
Figure 16. Feature segments of hysteresis curves.
Buildings 12 00887 g016
Figure 17. Stiffness degradation curves and fitting equations of the Kanchuang frame at different loading states: (a) K 1 ; (b) K 2 ; (c) K 3 ; (d) K 4 ; (e) K 5 ; (f) K 6 ; (g) K 7 ; (h) K 8 .
Buildings 12 00887 g017
Figure 18. Fitting curves of the piecewise points: (a) Point O; (b) Point P; (c) Point Q; (d) Point M; (e) Point L; (f) Point N.
Buildings 12 00887 g018aBuildings 12 00887 g018b
Figure 19. Piecewise hysteresis curves.
Buildings 12 00887 g019
Figure 20. Comparison between the calculation results and the experimental results: (a) first displacement cycle; (b) second displacement cycle; (c) third displacement cycle.
Buildings 12 00887 g020
Table 1. Scale factors of the physical parameters.
LengthAreaDisplacementElastic ModulusForceDrift AngleMomentDensityMass
1/21/41/211/411/821/4
Table 2. Mechanical properties of the mortar, brick and masonry (unit: Mpa).
Compressive StrengthShear Strength of
Masonry
Young’s Modulus of
Masonry
MortarBrickMasonry
2.09.33.40.0411259
Table 3. Mechanical properties of the wood.
DensityMoisture ContentParallel to Grain (MPa)Perpendicular to Grain (MPa)
Compressive StrengthElastic ModulusCompressive Strength (T)Elastic
Modulus (T)
Compressive Strength (R)Elastic
Modulus (R)
0.369 g/m310.09%46.2189073.397715.491620
T is the tangential direction and R is the radial direction.
Table 4. Coordinate critical points and ultimate loading points of the Kanchuang frame.
PointsO2ABCO1DEF
The first cycle Δ ¯ −0.046−0.464−0.998−2.3010.0460.4621.0022.311
P ¯ −0.187−0.913−1.007−2.5110.3340.8781.0111.906
The second cycle Δ ¯ −0.046−0.461−1.001−2.3090.0460.4591.0052.304
P ¯ −0.173−0.856−1.051−2.3370.3320.7780.9721.933
The third cycle Δ ¯ −0.046−0.461−1.001−2.3090.0460.4591.0052.304
P ¯ −0.176−0.856−1.051−2.3370.3030.7780.9721.933
Table 5. Equations of the envelope curves of the Kanchuang frame.
LineRegression Equations
The First CycleThe Second CycleThe Third Cycle
OA P ¯ = 1 . 741 Δ ¯ 0 . 107 P ¯ = 1 . 642 Δ ¯ 0 . 099 P ¯ = 1 . 546 Δ ¯ 0 . 105
AB P ¯ = 0 . 214 Δ ¯ 0 . 814 P ¯ = 0 . 361 Δ ¯ 0 . 690 P ¯ = 0 . 397 Δ ¯ 0 . 636
BC P ¯ = 1 . 007 Δ ¯ 0 . 555 P ¯ = 0 . 983 Δ ¯ 0 . 066 P ¯ = 0 . 957 Δ ¯ 0 . 076
OD P ¯ = 1 . 309 Δ ¯ + 0 . 273 P ¯ = 1 . 080 Δ ¯ + 0 . 282 P ¯ = 1 . 069 Δ ¯ + 0 . 253
DE P ¯ = 0 . 246 Δ ¯ + 0 . 765 P ¯ = 0 . 354 Δ ¯ + 0 . 615 P ¯ = 0 . 333 Δ ¯ + 0 . 595
EF P ¯ = 0 . 786 Δ ¯ + 0 . 198 P ¯ = 0 . 740 Δ ¯ + 0 . 228 P ¯ = 0 . 704 Δ ¯ + 0 . 225
Table 6. Parameters of each feature segment.
Feature
Segment
Loading
Elastic Stage 1
Loading Strengthen Stage 1 Rapid
Unloading Stage 1
Unloading Elastic Stage 1Loading
Elastic Stage 2
Loading Strengthen Stage 2 Rapid
Unloading Stage 2
Unloading Elastic Stage 2
Represent parameter K 1 K 2 K 3 K 4 K 5 K 6 K 7 K 8
Table 7. Fitting equations of the stiffness.
Feature SegmentFitting Equations
Loading elastic stage 1 K 1 = 0.424 Δ ¯ 0.476 + 0.103
Loading strengthen stage 1 K 2 = 0.021 Δ ¯ 3.186 + 1.302
Rapid unloading stage 1 K 3 = 12.52
Unloading elastic stage 1 K 4 = 1.192 Δ ¯ 0.319 0.975
Loading elastic stage 2 K 5 = 2.07 Δ ¯ 0.186 1.511
Loading strengthen stage 2 K 6 = 8.183 × 10 4 Δ ¯ 4.905 + 1.585
Rapid unloading stage 2 K 7 = 12.92
Unloading elastic stage 2 K 8 = 27.140 Δ ¯ 0.020 26.98
Table 8. Fitting equations of points M, L, N, O, Pand Q.
PointsFitting Equations
O Δ o = 0.619 Δ ¯ + 0.136
P Δ P = 0.031 Δ ¯ + 0.360
Q Δ Q = 0.950 Δ ¯ 0.023
M Δ M = - 0.894 Δ ¯ 0.017
L Δ L = 0.048 Δ ¯ 0.330
N Δ N = 0.618 Δ ¯ 0.013
Publisher’s Note: MDPI stays neutral with regard to jurisdictional claims in published maps and institutional affiliations.