Article

Studying the Indoor Environment and Comfort of a University Laboratory: Air-Conditioning Operation and Natural Ventilation Used as a Countermeasure against COVID-19

Department of Architectural Design and Engineering, Yamaguchi University, 2-16-1 Tokiwa-dai, Ube 755-8611, Japan
*
Author to whom correspondence should be addressed.
Buildings 2022, 12(7), 953; https://doi.org/10.3390/buildings12070953
Submission received: 30 May 2022 / Revised: 23 June 2022 / Accepted: 1 July 2022 / Published: 4 July 2022
(This article belongs to the Section Building Energy, Physics, Environment, and Systems)

Abstract

:
In this study, the indoor air quality and thermal environment of a university facility were analyzed when an air conditioner was operated and natural ventilation was provided; the most effective natural ventilation method was also evaluated. The research conditions were established by adjusting the temperature of the air conditioner, and frequency of window openings every hour. The area around the windows that is open for natural ventilation was easily affected by outdoor air temperature and humidity. However, since the air conditioner was operating, there was only a brief period during which the environment was uncomfortable. Therefore, the participants in the questionnaire survey expressed neutrality or slight satisfaction for the thermal environment of the entire space. Setting the room temperature to 25 °C in summer was highly comfortable and generated a satisfactory indoor thermal environment. When the room temperature was set to 20 °C in winter, the thermal comfort level was higher than in the other conditions. Providing natural ventilation for 5 min every 30 min was determined to be effective in maintaining an indoor CO2 concentration of 1000 ppm or less. Facilitating natural ventilation for 10 min every 60 min allowed the entry of a large amount of fresh air; however, due to the extended period in which the windows and doors were closed, there were instances when the indoor CO2 concentration exceeded 1000 ppm. Therefore, providing frequent natural ventilation with short time intervals is effective for improving indoor air quality.

1. Introduction

Infectious diseases caused by viruses have been prevalent since the beginning of the 21st century. In 2003, a severe acute respiratory syndrome outbreak occurred [1], and an influenza pandemic was reported in 2009 [2]. The emergence of the Middle East respiratory syndrome [3] in 2012 raised concerns for a global public health crisis. The coronavirus disease 2019 (COVID-19) [4] has been prevalent worldwide since November 2019. It was declared as a public health emergency on 30 January 2020 and recognized as a pandemic on 11 March 2020, by the World Health Organization.
The Japanese government declared a state of emergency on 17 April 2020 [5], to prevent an increase in the number of people infected with COVID-19. To prevent infection, the government implemented the following guidelines: avoidance of dense, closed, and sealed crowds; observance of proper hand washing and cough etiquette; and adoption of new lifestyle changes [6]. The Ministry of Health, Labour, and Welfare (MHLW) in Japan established ventilation methods, such as opening windows and enhancing physical ventilation (air conditioning and mechanical ventilation equipment) [7] to improve “closed spaces with poor ventilation” during the winter. Moreover, as a countermeasure against COVID-19, the MHLW recommended that the carbon dioxide (CO2) concentration in a room should be maintained at ≤1000 ppm, and natural ventilation by opening the windows and doors should be provided. The COVID-19 pandemic has led to an increasing interest in indoor air quality management.
Various factors contribute to indoor air quality, including the concentration of harmful substances generated from finishing materials and air pollutants; among these factors, ventilation volume affects indoor air quality the most [8,9,10]. Several ventilation modes are used in buildings: natural, mechanical, or a combination of natural and mechanical ventilation [11,12]. Natural ventilation has been reported to have a significant impact on energy consumption [13,14,15] and the indoor environment of buildings [16,17]. Furthermore, the indoor environment significantly affects the productivity of the occupants of a building [14]; it has been observed that the occupants of hospitals and office buildings equipped with mechanical ventilation experience a high level of comfort in indoor environments [18]. The level of comfort that the thermal environment in a room generates is associated with various factors: temperature, humidity, wind speed, radiation temperature, and personal factors [18,19,20,21,22,23,24,25]. However, there are challenges in implementing natural ventilation, such as difficulty in adjusting the fresh air volume depending on the temperature difference between the indoor and outdoor air and the position and size of the window; such a limitation significantly affects the thermal environment in the room [26,27,28].
For the above reasons, natural ventilation is performed selectively according to the needs of the occupants and is usually not mandatory. However, due to the COVID-19 outbreak in November 2019, natural ventilation has become a necessity rather than an option. Buildings without ventilation facilities rely on natural ventilation. In general, natural ventilation is widely used in Japan when the outdoor temperature is 15–25 °C [29]. However, to reduce the infection rate of COVID-19 indoors, it is necessary to secure a large amount of ventilation regardless of the season or outdoor temperature. In particular, areas that are cold in the winter and hot and humid in the summer are vulnerable to the limitations of natural ventilation. Natural ventilation during winter and summer can have a significant effect on the indoor thermal environment. Therefore, natural ventilation in summer and winter needs to be properly adjusted according to the degree and frequency of opening and closing the windows and doors.
In this study, we analyzed the effect of natural ventilation on the indoor environment of university facilities and proposed the most effective natural ventilation method based on indoor air quality and the thermal environment.

2. Method

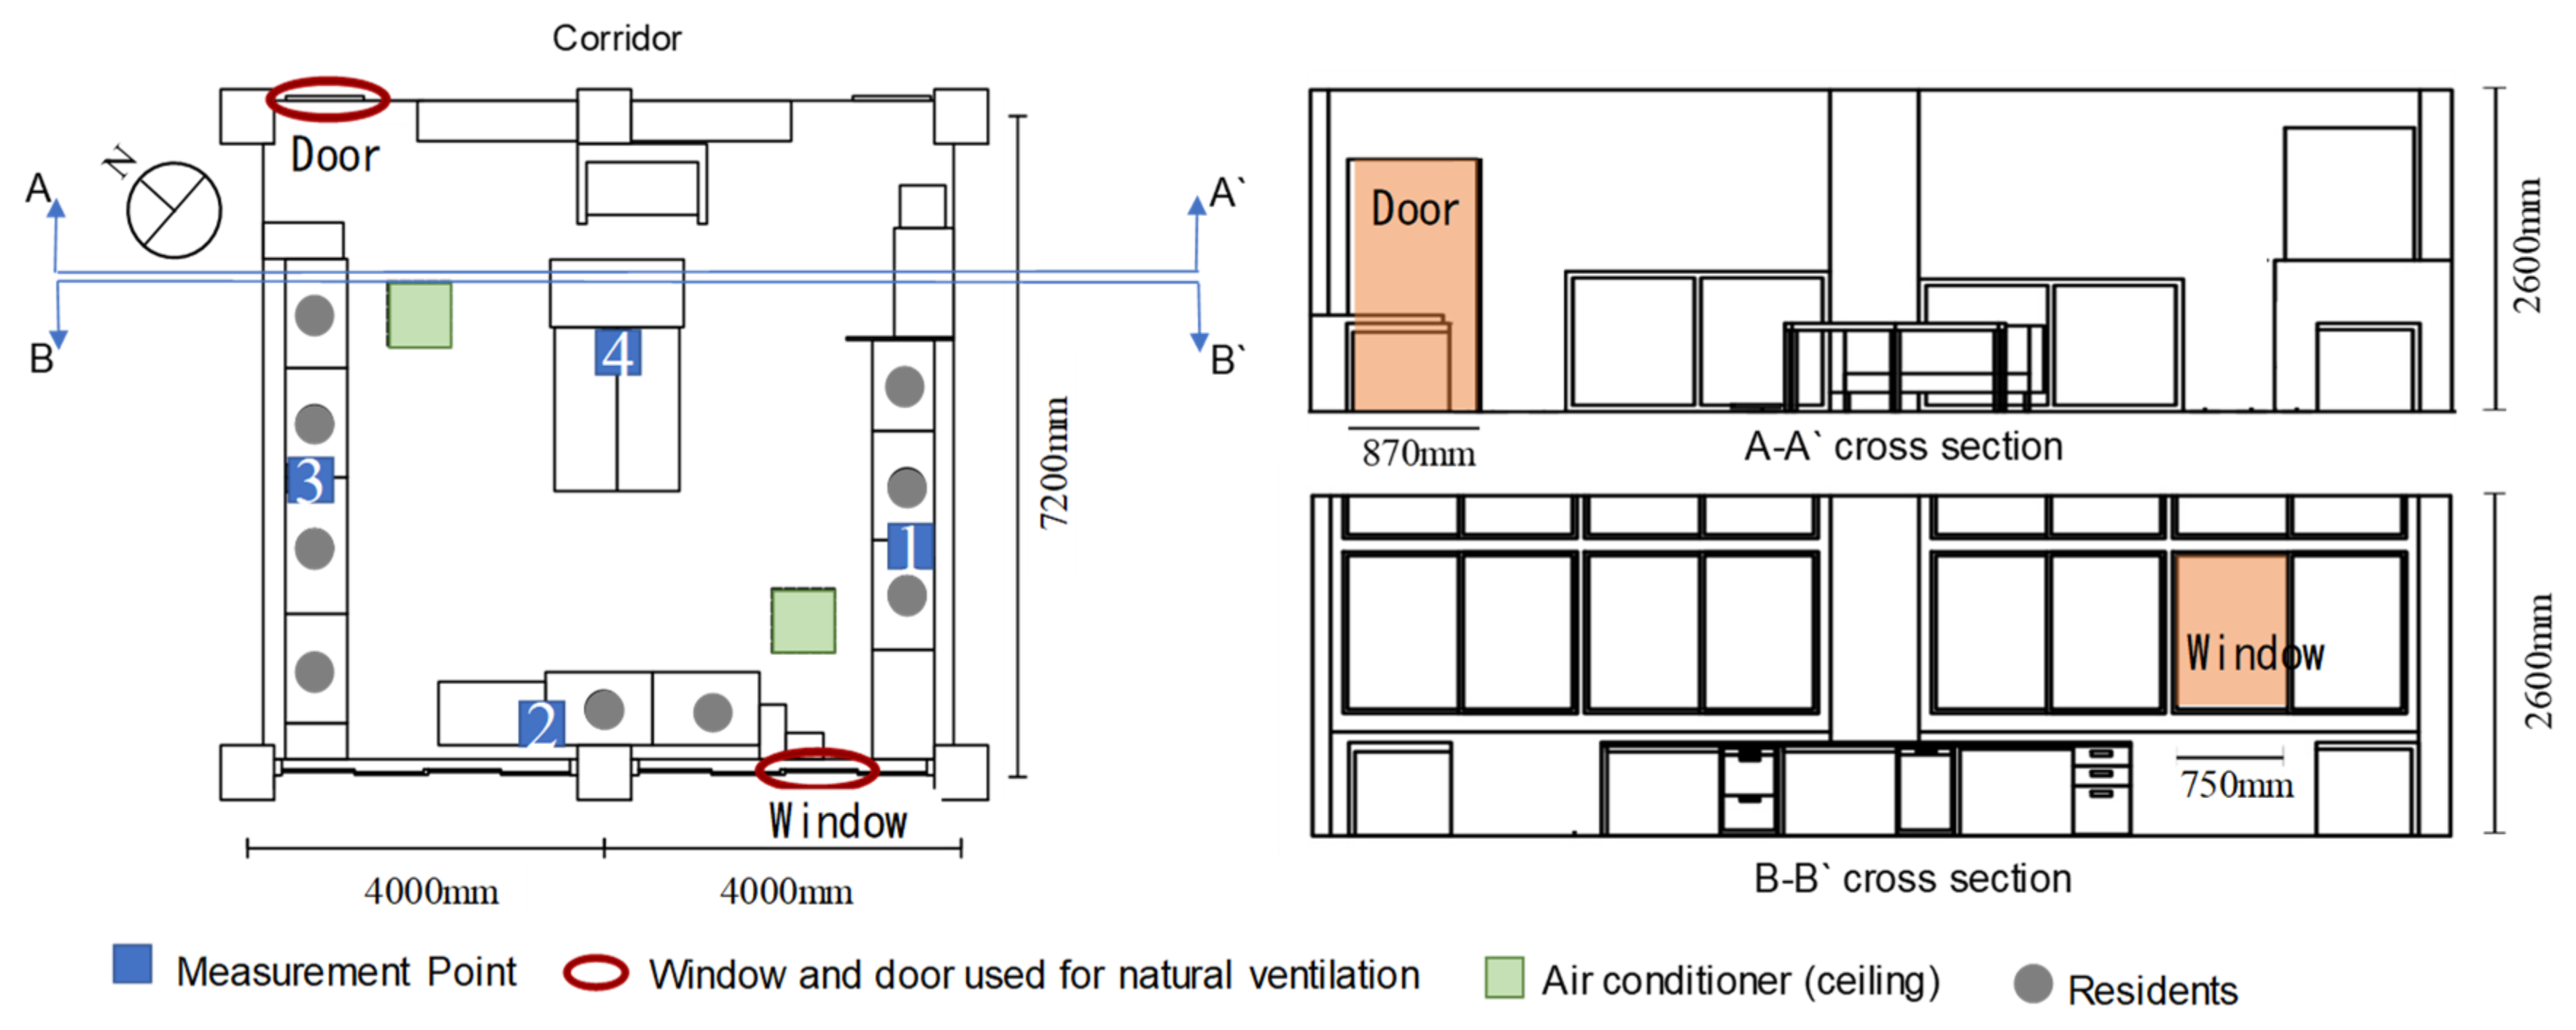
2.1. Overview of Measurement

The four-story building that was examined in this study serves as a faculty room and laboratory for the graduate students. It was made of reinforced concrete. Data collection was performed on the second floor of the building. The measured laboratory floor area was 57.6 m2 and the ceiling height was 2.6 m. The laboratory volume was approximately 149 m3. A ventilation fan was installed above the window on the southern part of the laboratory. The air volume of the ventilation fan was 350 m3/h; however, the actual ventilation volume was less than half due to the influence of outdoor wind and low air-tightness of the building. The air conditioning system was a ceiling-cassette type; two units were installed on the ceiling. The cooling and heating capacities of the air conditioning system were 7.1 and 8.0 kW, respectively. Figure 1 shows the measurement conditions, and Figure 2 shows the measurement position and cross section. The laboratory is typically occupied by 12 to 15 graduate students, but the number of individuals allowed in the laboratory has decreased because of COVID-19 preventive measures at the university. At the time of the survey, nine people were present in the room. In addition, as a measure against COVID-19 infection, lectures for the entire university were conducted online, which was difficult to measure in classrooms with occupants. Furthermore, due to restrictions such as university usage time, data collection was set to 1 day.
The following parameters were measured: temperature, relative humidity, CO2 concentration, wind speed, and radiation temperature. Additionally, a questionnaire survey about the level of satisfaction of the occupants with the thermal environment of the laboratory was conducted. Finally, the indoor predicted mean vote (PMV) was calculated using the measured data [30]. Table 1 lists the details of the measurement equipment used.

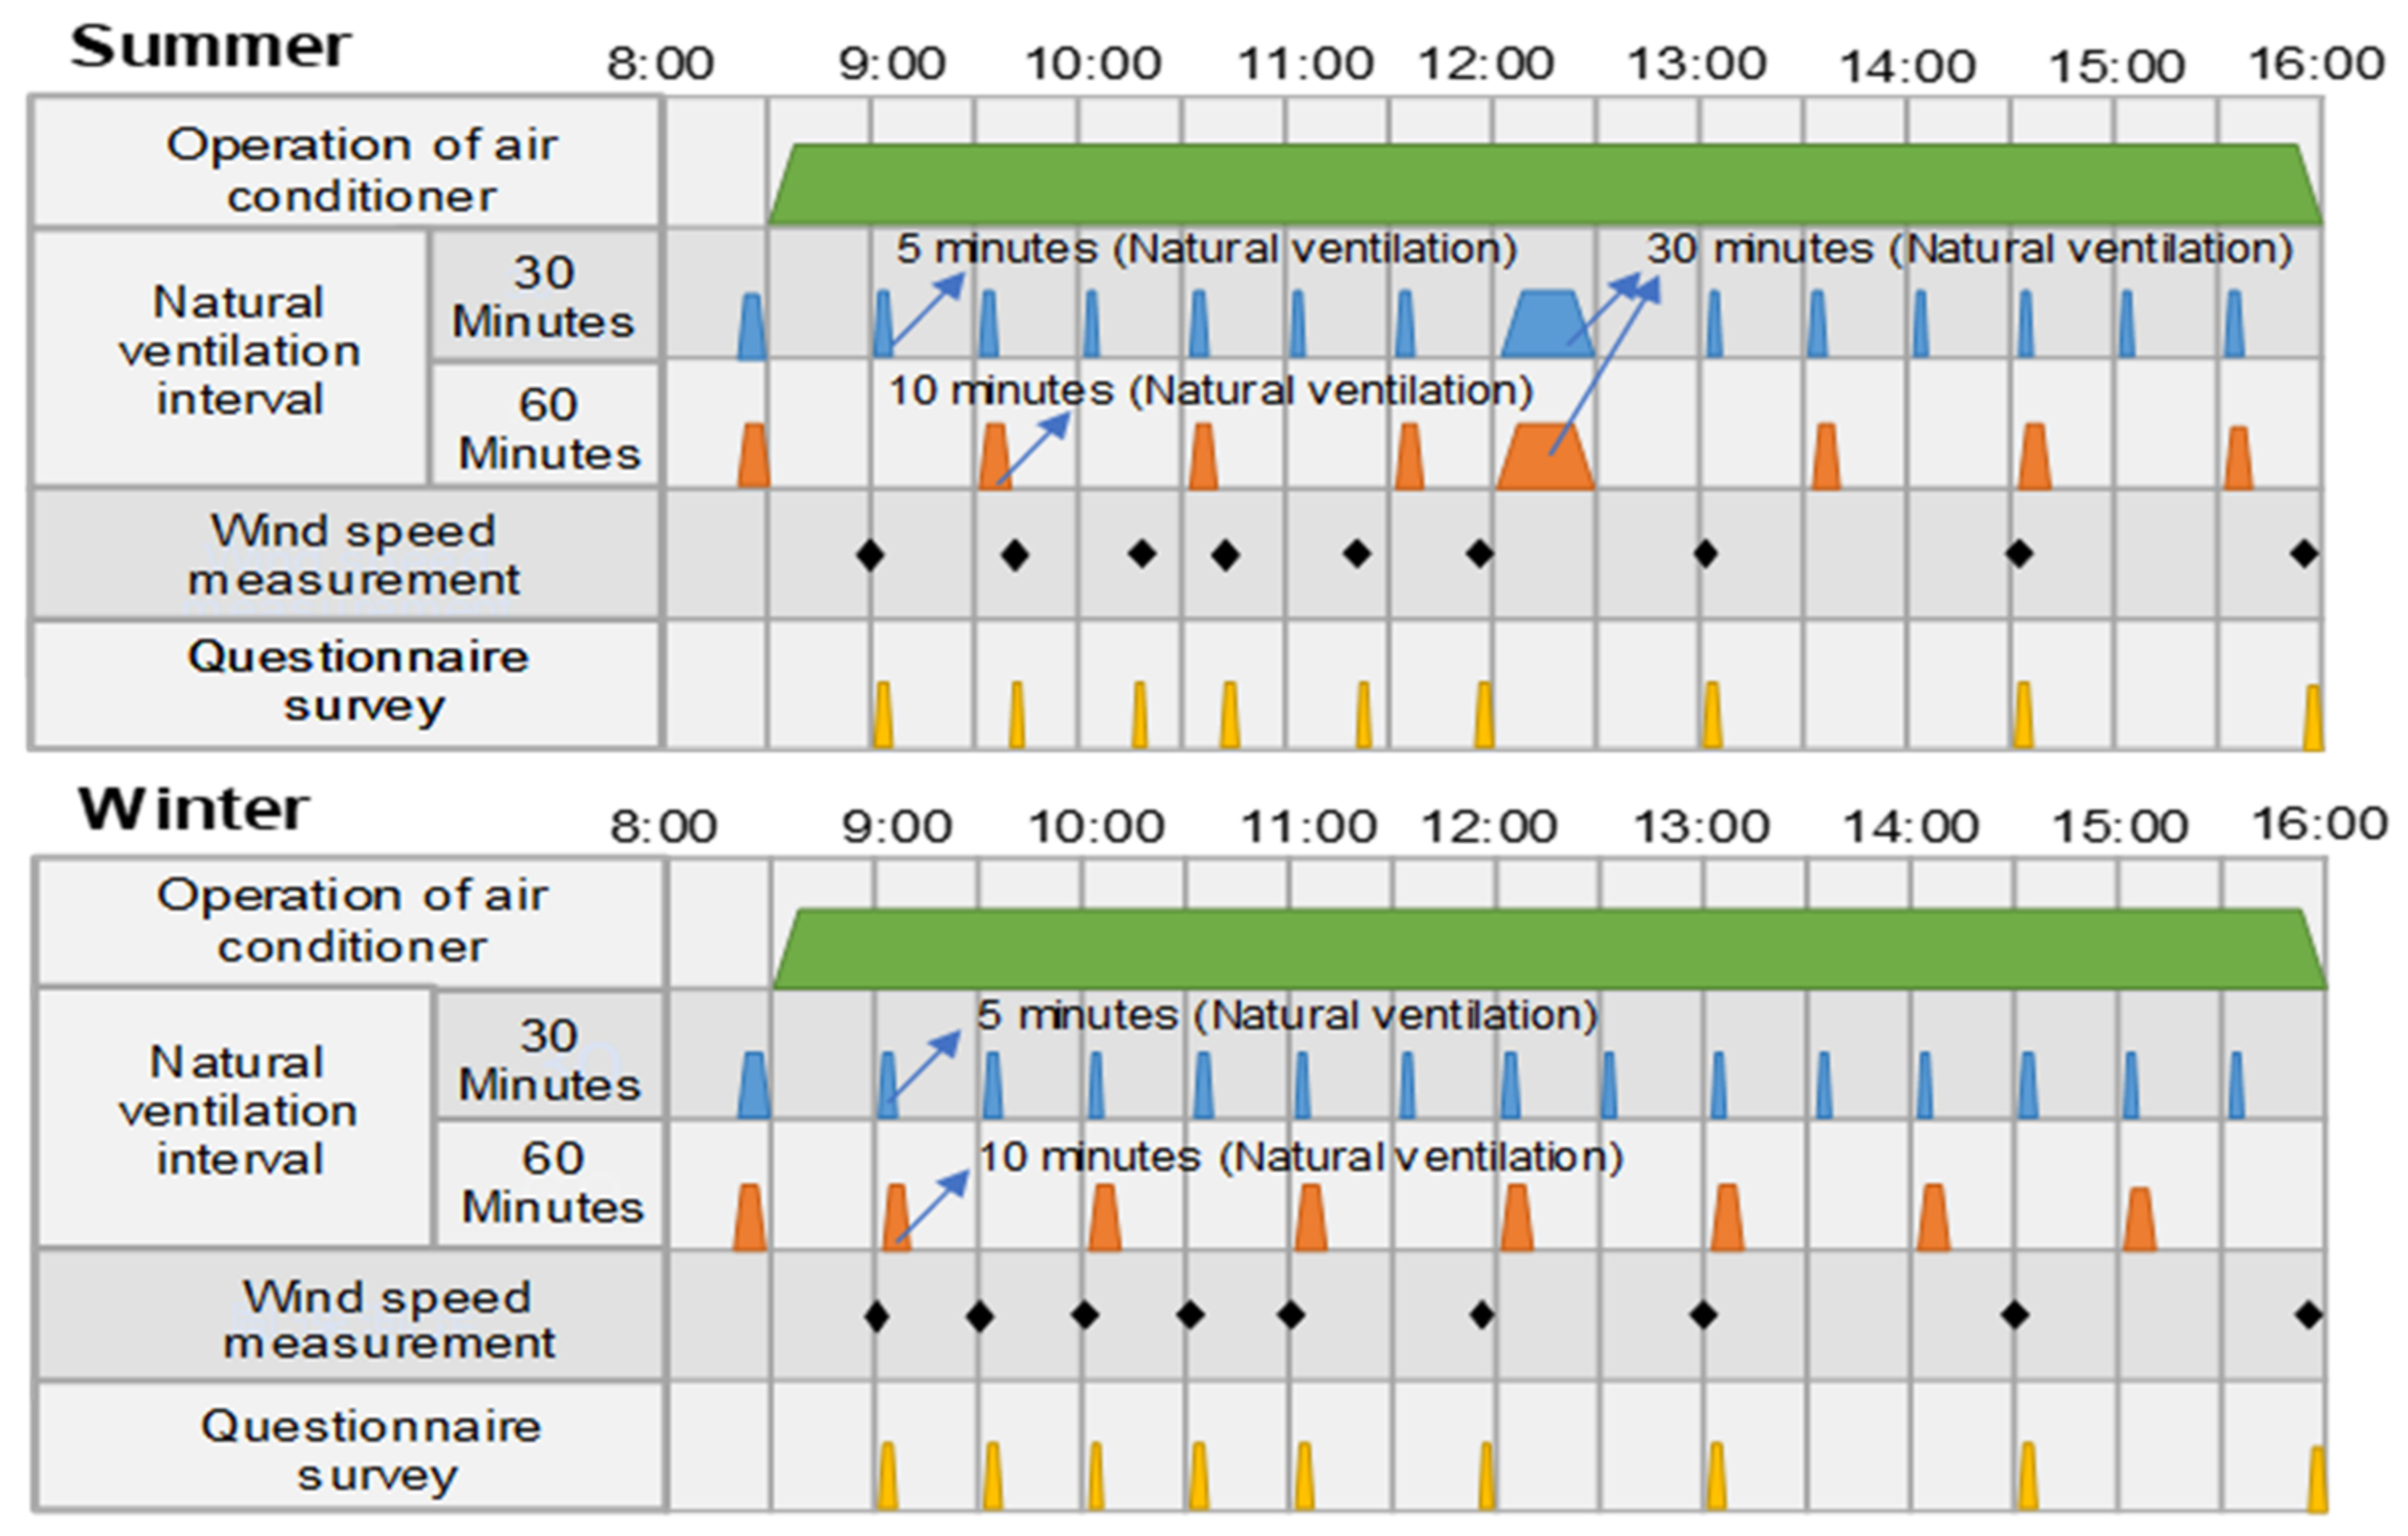
2.2. Conditions of Measurement

The laboratory environment was measured from 18 August to 28 August 2020 in the summer, and from 8 December to 17 December 2020 in the winter. The laboratory is equipped with an air conditioner in each private room but does not have a ventilation function. A ventilation fan installed in the upper part of the window provided ventilation for the room; the air conditioner was set to a weak operation, and the wind direction was set to swing during the target measurement time. The ventilation fan installed in the laboratory was operated for 24 h. Table 2 lists the conditions for summer and winter measurements and Figure 3 shows the measurement time schedule. Four conditions were used for summer and winter measurements. In summer, the following conditions were established: the temperature of the air conditioner was set to either 28 °C or 25 °C; natural ventilation was provided either for 5 min every 30 min or for 10 min every 60 min. In winter, the following conditions were established by adjusting the temperature of the air conditioner and duration of natural ventilation: at 18 °C and 22 °C, natural ventilation was provided for 10 min every 60 min; at 20 °C, natural ventilation was provided for either 5 min every 30 min or for 10 min every 60 min. To facilitate natural ventilation, the door (870 mm × 2000 mm) and window (750 mm × 1200 mm) were opened, as shown in Figure 2. In summer, natural ventilation was provided for 30 min during lunch break (12:00–12:30). The window blinds were always down, but when natural ventilation was facilitated, the ventilation blinds were raised to allow the entry of fresh air. Nine people were assessed in the room under all measurement conditions. Data collection under each condition was conducted from 9:00 to 16:00 even though the air conditioner was set to start its operation at 8:00 according to the measurement conditions, and natural ventilation was also provided intermittently. Wind speed measurements and questionnaire surveys were conducted six times from 9:00 to 13:00. We also conducted a questionnaire survey to analyze the facial expressions of the participants.
The graduate students served as the participants of the survey; they were asked to rate their satisfaction of the thermal, air, learning, and airflow environments. The Likert scale used in the questionnaire had seven options: “very satisfied–7, satisfied–6, slightly satisfied–5 neither–4, slightly dissatisfied–3, dissatisfied–2, and very dissatisfied–1” [31].

3. Result

3.1. Measurement Results of Summer

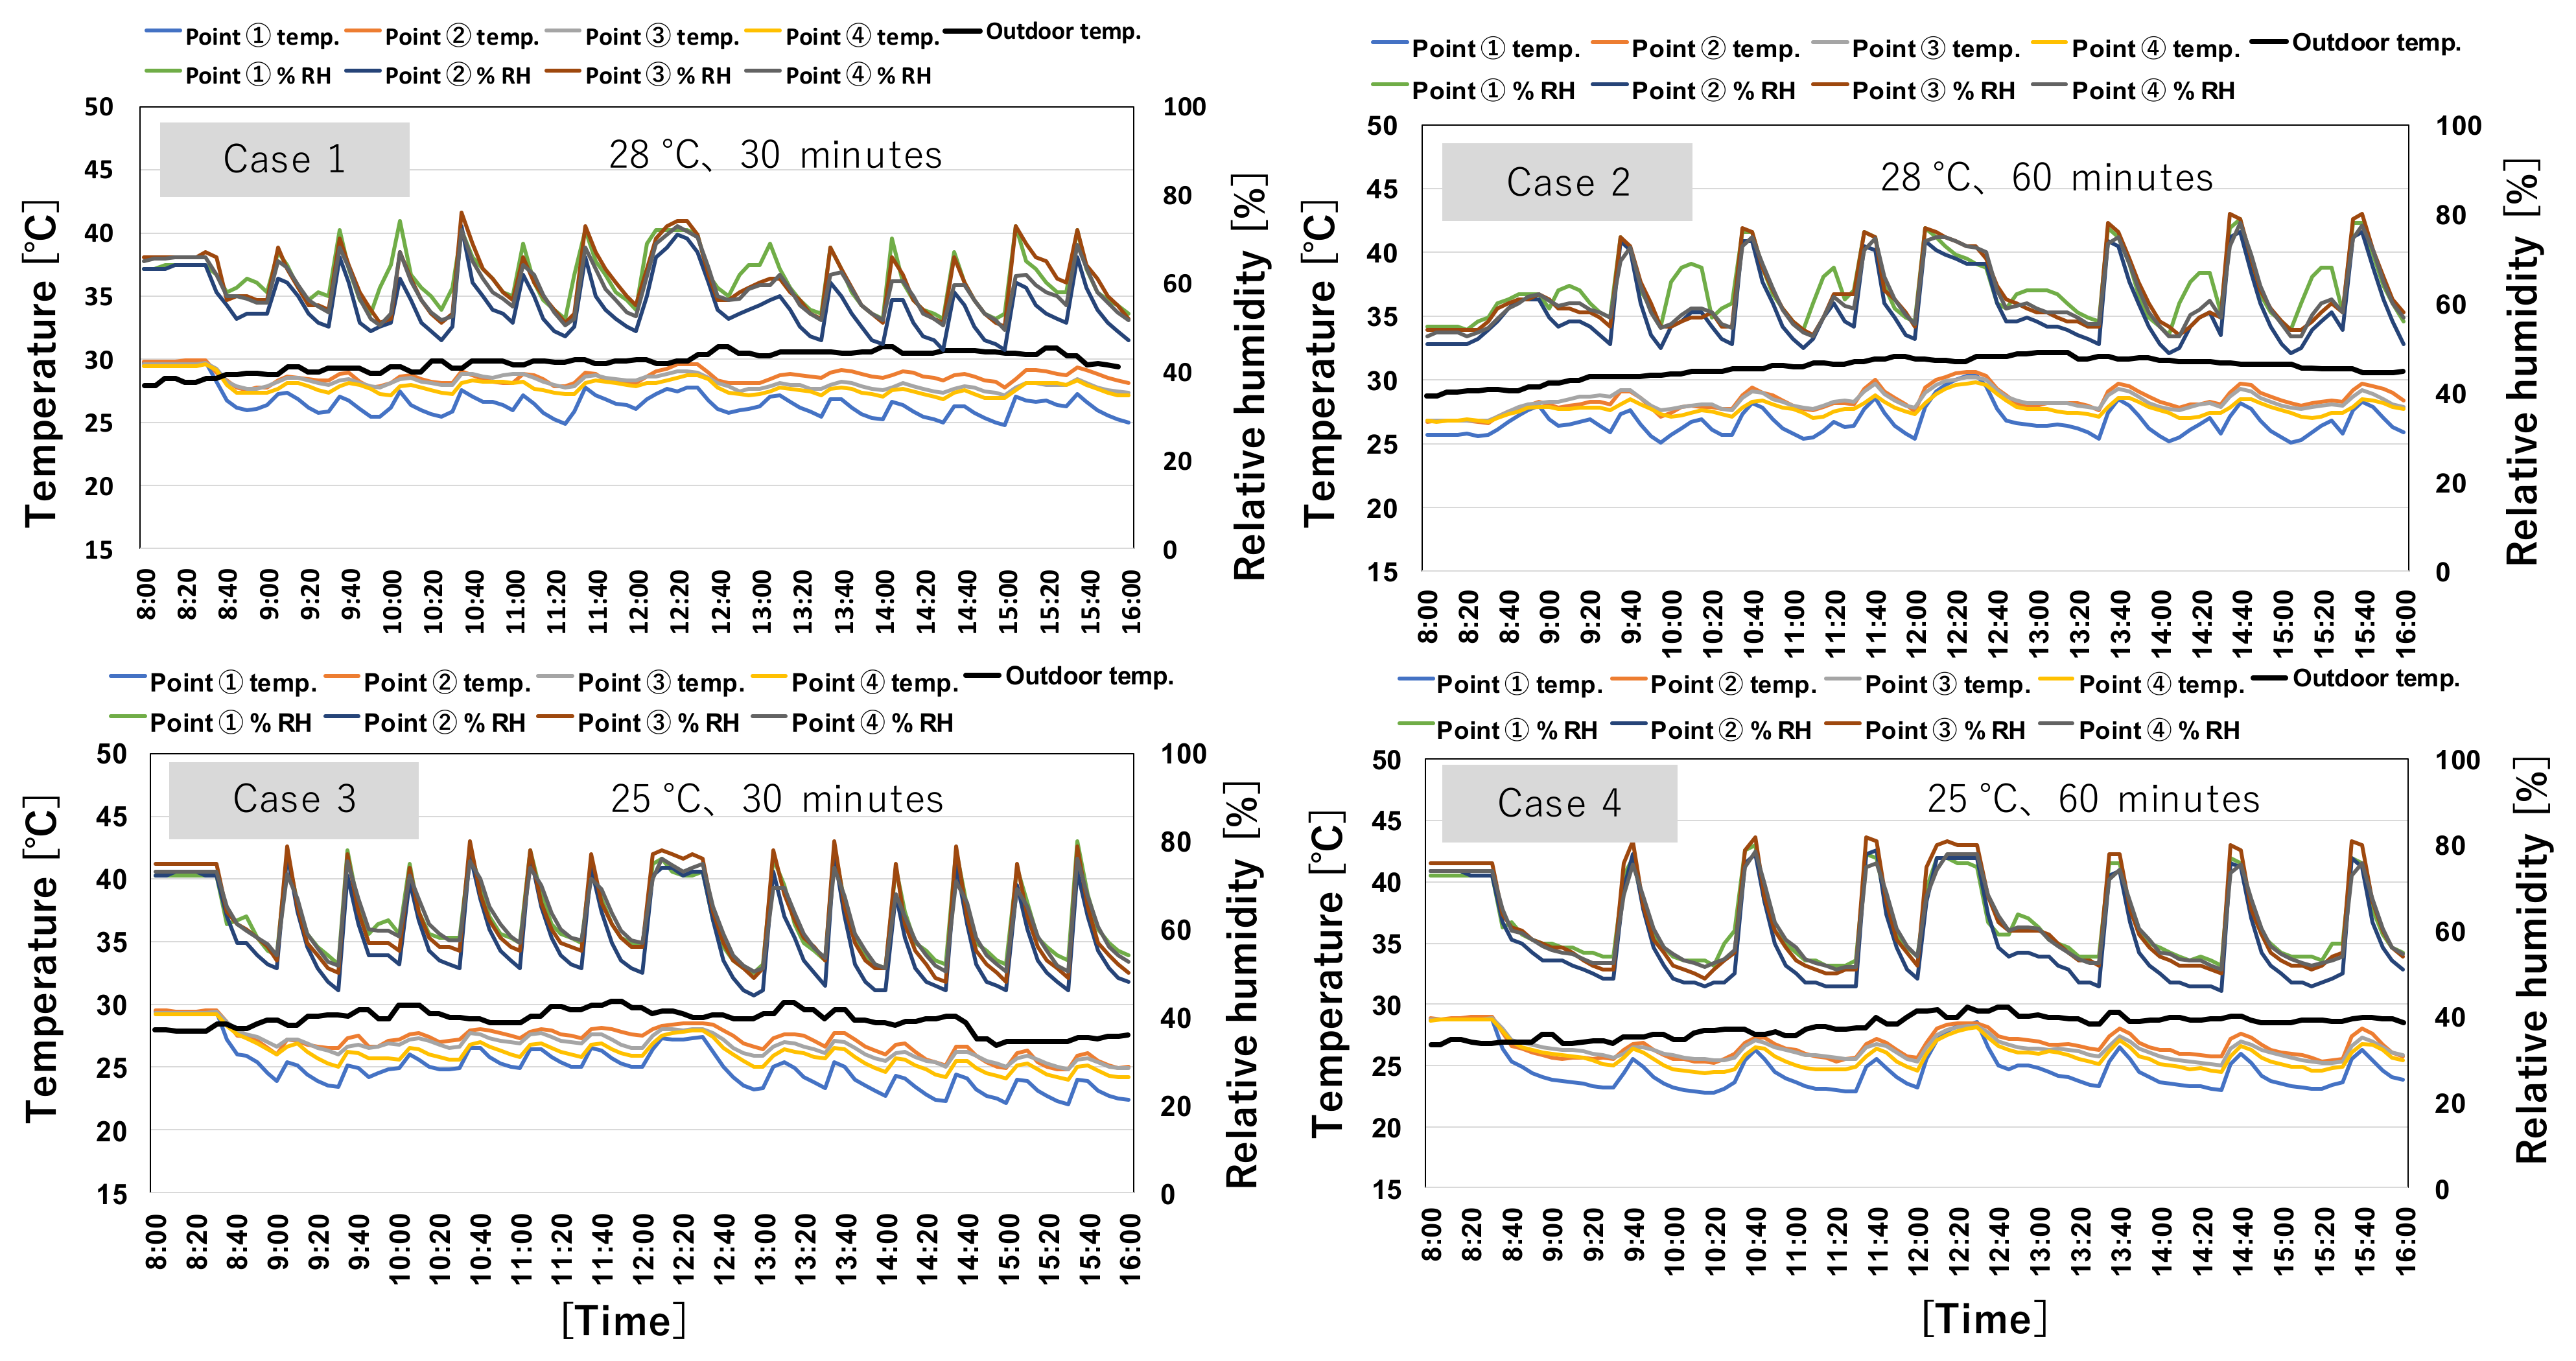
3.1.1. Changes in Temperature and Humidity

Figure 4 shows the changes in indoor temperature and relative humidity in summer. In Cases 1 and 3, the temperature of the air conditioner was set to 28 °C and 25 °C, respectively, and natural ventilation was facilitated for 5 min every 30 min. In Case 1, the following measurements were taken: the outdoor average temperature was 29.8 °C; the average temperature at each measurement point was 28.1 °C; the indoor relative humidity (RH) ranged from 45% to 76%; and the average RH at each measurement point was 59%.
In Case 3, the following measurements were taken: the outdoor temperature ranged from 26.7 °C to 30.2 °C; the average temperature was 28.7 °C; the indoor temperature ranged from 24.8 °C to 28.0 °C; and the indoor RH ranged from 45% to 80%. The average indoor temperatures in Cases 1 and 3 were 28.1 °C and 26.5 °C, respectively; the indoor temperature in Case 3 was 1.6 °C lower than that in Case 1.
In Cases 2 and 4, the temperature of the air conditioner was set to 28 °C and 25 °C, respectively, and natural ventilation was facilitated for 10 min every 60 min. The following measurements were taken in Case 2: the outdoor and indoor temperatures ranged from 28.8 °C to 32.2 °C and from 25.1 °C to 30.6 °C, respectively; the indoor RH ranged from 49% to 80%. The temperature and RH at measurement points 1 and 2 at the window side are high. This observation could be attributed to the influence of hot and humid outdoor air while natural ventilation was being provided. The following measurements were taken in Case 4: the outdoor and indoor temperatures ranged from 26.7 °C to 29.8 °C and from 22.8 °C to 29.0 °C, respectively; the indoor relative RH ranged from 41% to 80%. The average indoor temperatures in Cases 2 and 4 were 28.0 °C and 25.8 °C, respectively; the indoor temperature in Case 4 was 2.2 °C lower than that in Case 2. Although the temperature and humidity in the room increased due to natural ventilation, the indoor temperature was maintained due to the operation of the air conditioner; a dehumidifying effect was also observed. The results of this experiment revealed that although natural ventilation was provided once every 30 or 60 min, the temperature and humidity in the room was significantly unaffected. However, the temperature distribution in the room changed depending on the set temperature.

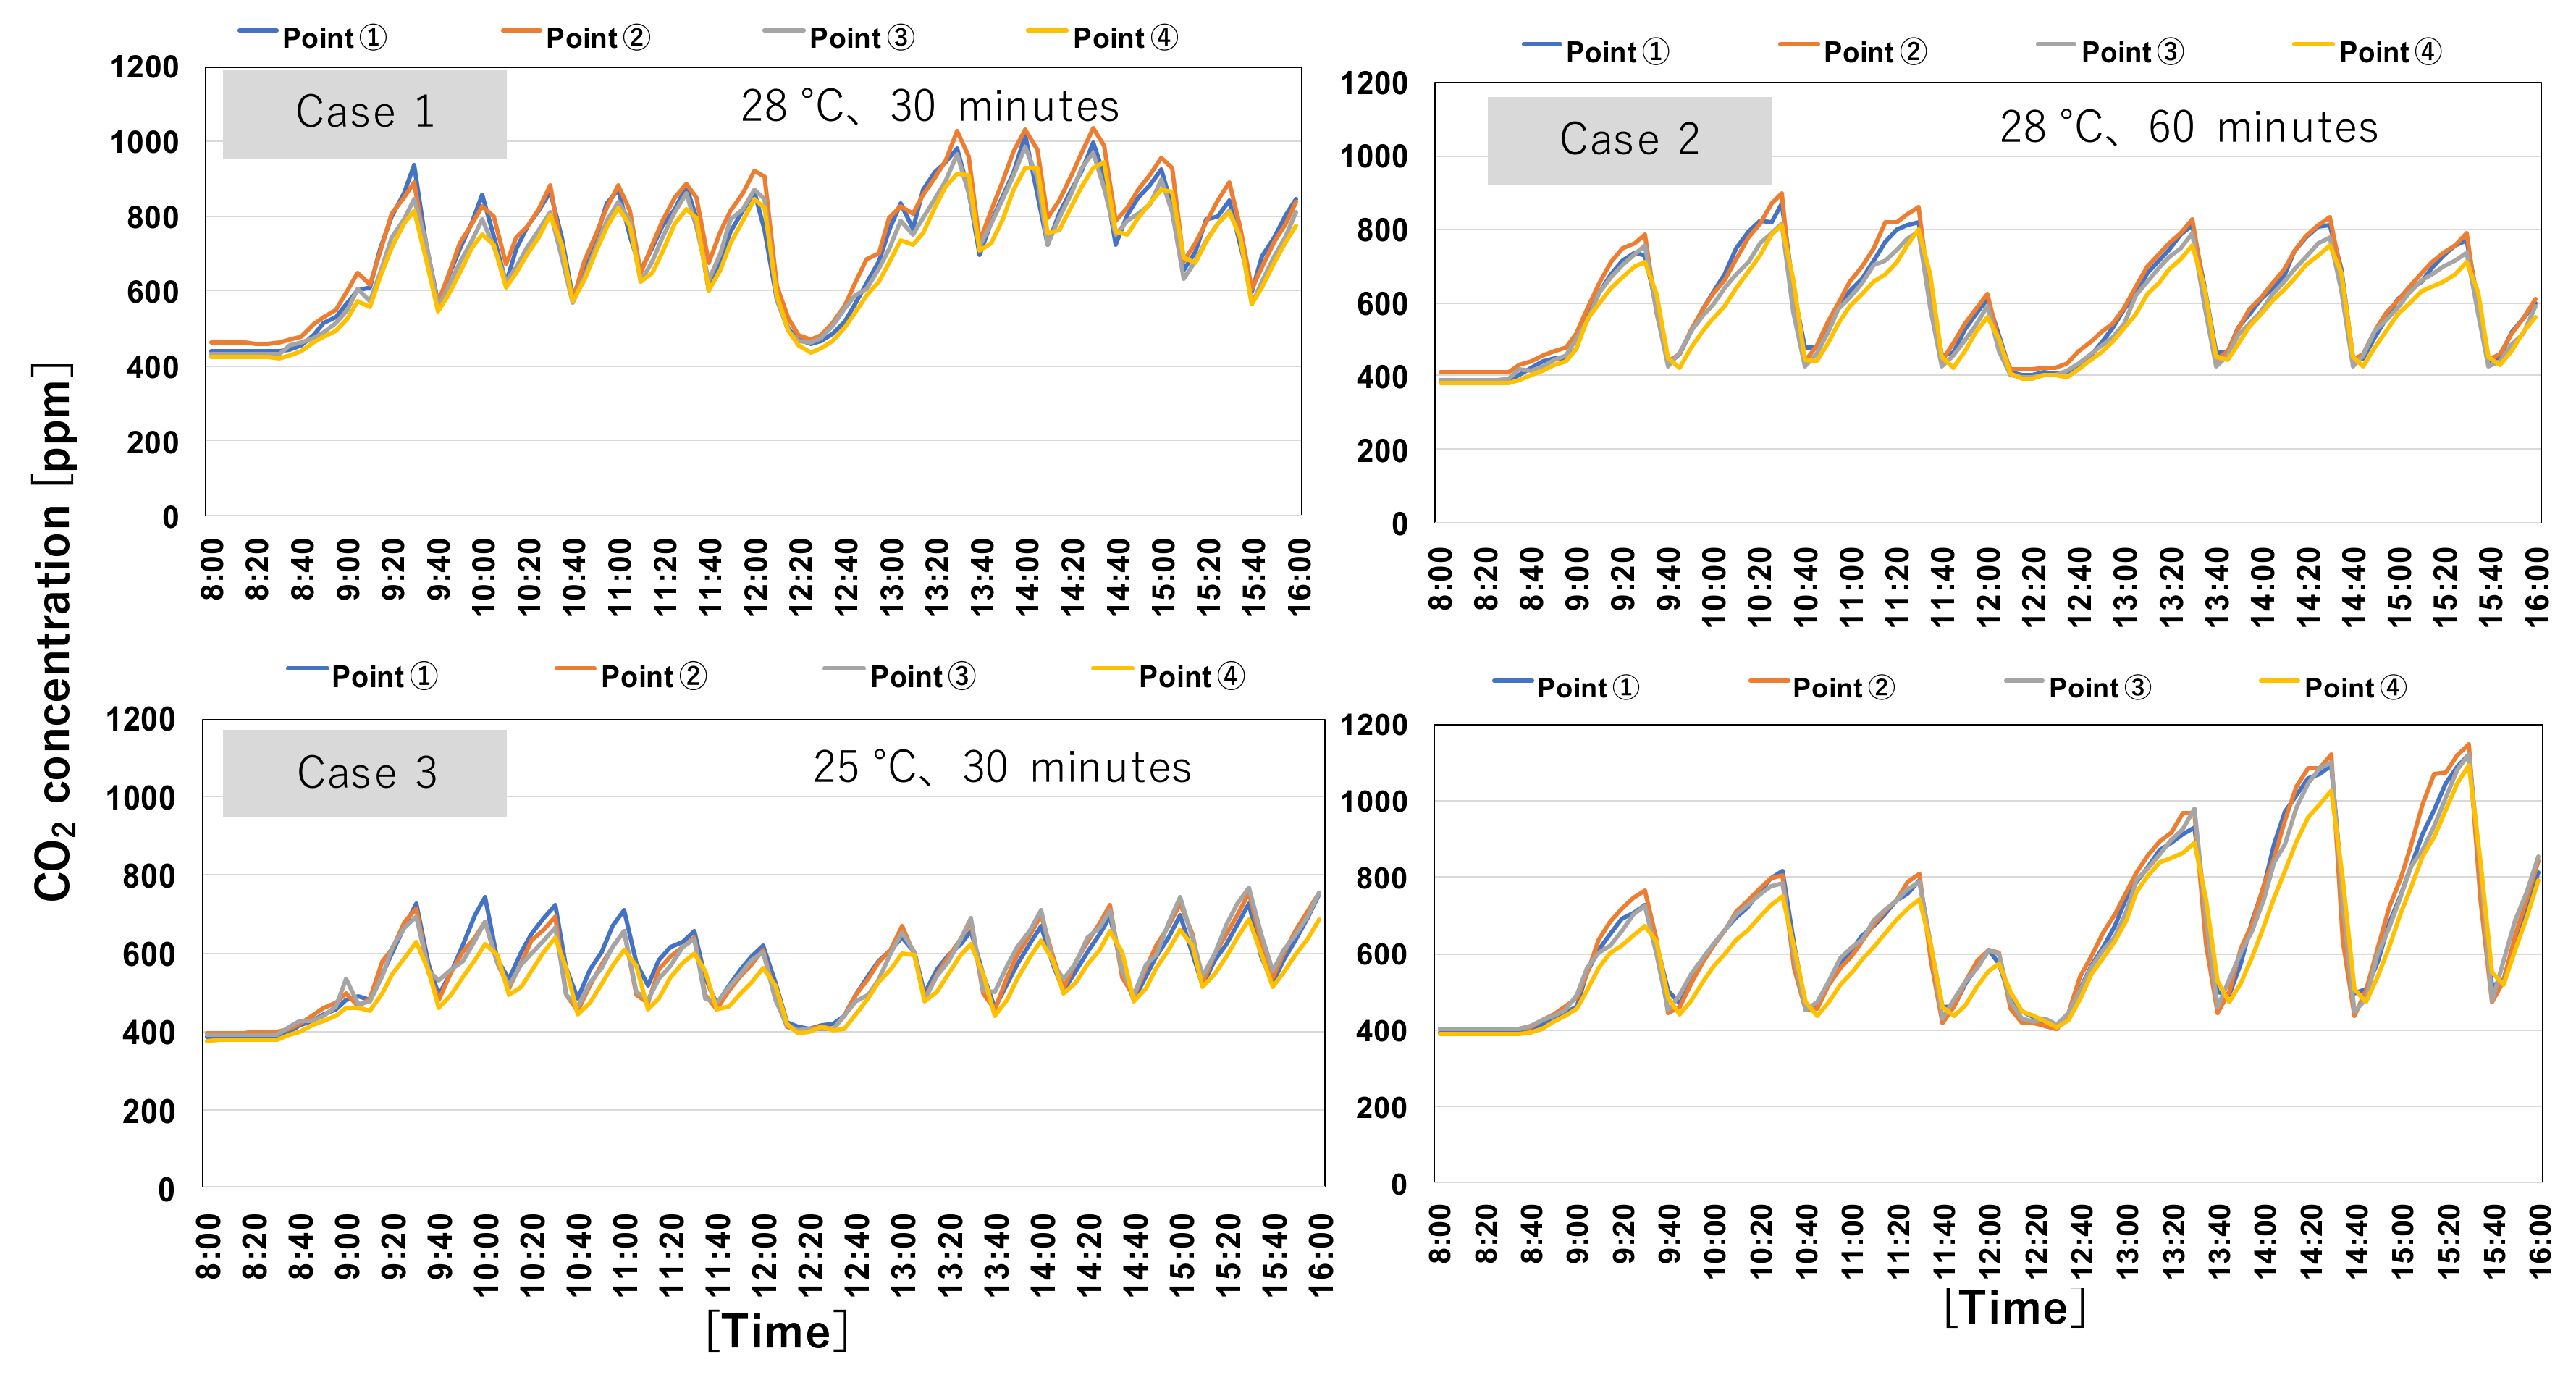
3.1.2. Change in CO2 Concentration

Figure 5 shows the changes in the CO2 concentration in summer. In Cases 1 and 3, ventilation was provided for 5 min every 30 min. In Case 1, the CO2 concentration ranged from 421 to 1037 ppm, and the average CO2 concentration was 710 ppm. The CO2 concentration immediately dropped to 547 ppm after 5 min of natural ventilation. Therefore, opening one window and door once every 30 min reduced the CO2 concentration in the room by approximately 278 ppm. In Case 3, the indoor CO2 concentration ranged from 376 to 770 ppm, and the average CO2 concentration was 548 ppm. The CO2 concentration immediately decreased to 445 ppm after 5 min of natural ventilation. The results of this study revealed that opening one window and door once every 30 min reduced the CO2 concentration in the room by approximately 325 ppm. It was found out that Case 3 better facilitated natural ventilation compared with Case 1. This observation could be attributed to the influence of outdoor wind speed and wind direction. In Case 1, the speed of the outdoor air ranged from 3.5 to 4.6 m/s, and the wind direction was southeast. In Case 3, the speed of the outdoor air was 6.1 to 8.7 m/s, and the wind direction was eastward. In Case 3, the outside wind speed was approximately twice as fast as that in Case 1, and the ventilation volume in the room was increased by natural ventilation.
In Cases 2 and 4, ventilation was provided for 5 min every 60 min. In Case 2, the CO2 concentration ranged from 379 to 900 ppm; the average CO2 concentration was 574 ppm. The CO2 concentration immediately decreased to 439 ppm after 10 min of natural ventilation. As a result, the CO2 concentration in the room was reduced by approximately 411 ppm by opening one window and door every 60 min. In Case 4, the indoor CO2 concentration ranged from 391 to 1124 ppm; the average CO2 concentration was 640 ppm. The CO2 concentration immediately dropped to 440 ppm after 10 min of natural ventilation. Consequently, opening a window and door once every 60 min reduced the CO2 concentration in the room by approximately 310 ppm. It was also found out that Case 2 facilitates natural ventilation better compared with Case 4. In Case 2, the speed of the outdoor air ranged from 8.7 to 10.9 m/s, and the wind direction was eastward; while in Case 4, the speed of the outdoor air was 4.9 to 8.6 m/s, and the wind direction was northeast. However, in Cases 2 and 4, the indoor CO2 concentration might exceed 1000 ppm; shortening the time interval of natural ventilation every hour is considered effective in improving indoor air quality.

3.1.3. Questionnaire Survey Results

Questionnaires about the indoor environment were distributed to nine people present in the room. The items included in the questionnaire were indoor air quality, thermal, airflow, and learning environments. The satisfaction scale had seven levels. The results show the average values of the data at each measurement point. Figure 6 shows the degree of satisfaction of the participants with the indoor environment during summer. The participants were neither or slightly satisfied about the indoor air quality, airflow, and learning environments. However, the participants in Cases 3 and 4 were slightly dissatisfied about the thermal environment.

3.2. Measurement Results during the Winter

3.2.1. Changes in Temperature and Humidity

Figure 7 shows the changes in the indoor temperature and RH in winter. In Case 5, the temperature of the air conditioner temperature was set to 20 °C, and natural ventilation was provided for 5 min every 30 min. In Cases 6, 7, and 8, the temperature of the air conditioner was set to 20 °C, 18° C, and 22 °C, respectively, and natural ventilation was provided for 10 min every 60 min.
The following measurements were taken in Case 5: the outdoor and indoor temperatures ranged from 3 °C to 4.6 °C and from 16.4 °C to 24.9 °C, respectively; the average indoor temperature was 0.8 °C lower than the set temperature. When natural ventilation was facilitated, the temperature measured at points 1 and 2, which were close to the ventilation window, decreased to 16.4 °C. Natural ventilation caused a decrease of 3.8 °C to 7.1 °C in indoor temperature. RH ranged from 14% to 22%. The following measurements were taken in Case 6: the outdoor and indoor temperatures ranged from 3.8 °C to 4.6 °C and from 11.2 °C to 25.9 °C, respectively; the outdoor temperature in Case 6 was almost the same as that in Case 5. The temperature decreased by 8.3 °C to 14.3 °C due to natural ventilation. RH ranged from 15% to 35%. As there was a large difference in temperature between the indoor and outdoor environments with natural ventilation during winter, the indoor temperature changes were considerable.
The average indoor temperatures in Cases 5 and 6 were almost the same, but the difference in temperature decrease was significant in Case 6. In Case 7, the temperature was at 18 °C and natural ventilation was facilitated for 10 min every 60 min. The outdoor temperature ranged from 1.1 °C to 5.6 °C in Case 7. The temperature distribution ranged from 15.7 °C to 26.6 °C. The indoor temperature decreased by 7.4 °C to 10.5 °C due to natural ventilation. In Case 7, there was a difference in indoor temperature between morning and afternoon. This could due to the slow increase in indoor temperature because the set air conditioner temperature was low. In Case 8, the temperature was set to 22 °C, and natural ventilation was facilitated for 10 min every 60 min. In Case 8, the outdoor temperature ranged from 5.6 °C to 12.3 °C. The outdoor temperature in Case 8 was higher than that of the other conditions. The temperature distribution ranged from 20.8 °C to 31.4 °C. The indoor temperature decreased by 6.1 °C to 10.4 °C when natural ventilation was provided. However, the minimum temperature during ventilation was 20.8 °C. When natural ventilation was facilitated, the outdoor temperature affects the indoor temperature.

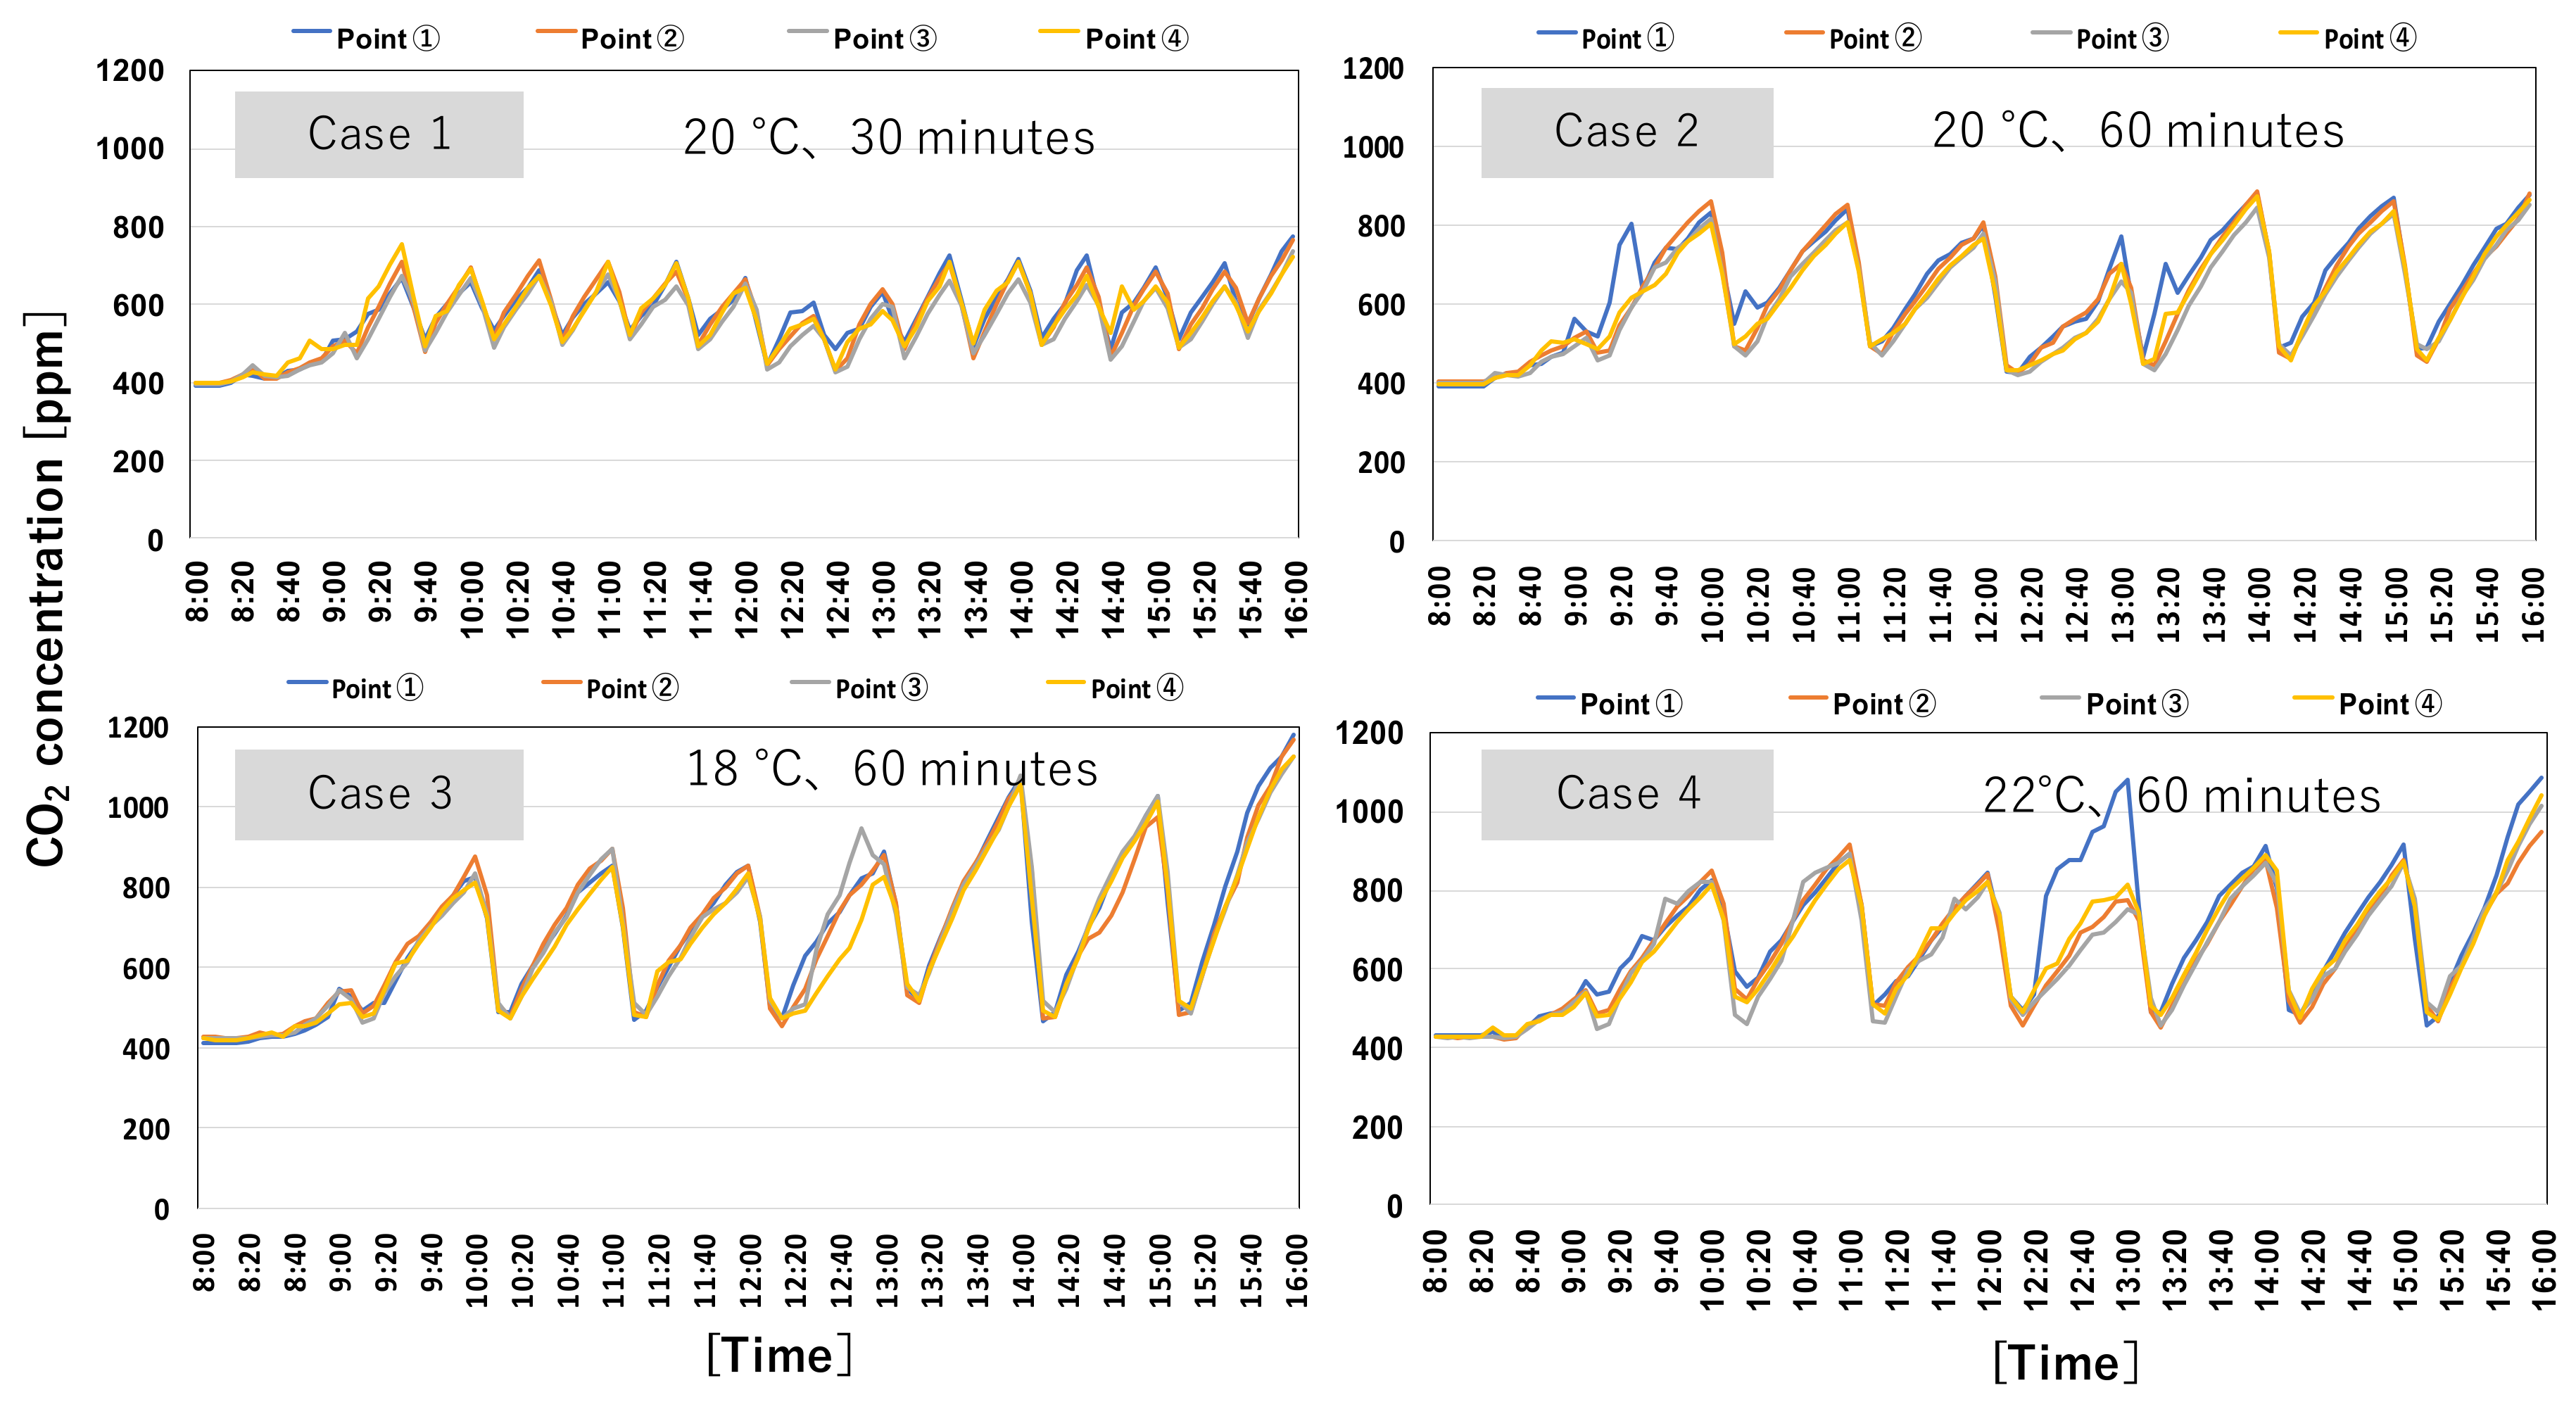
3.2.2. Change in CO2 Concentration

Figure 8 shows the changes in indoor CO2 concentration during winter. In Case 5, natural ventilation was provided for 5 min every 30 min. In Cases 6, 7, and 8, natural ventilation was provided for 10 min every 60 min. In Case 5, the speed of the outdoor air ranged from 3.2 to 4.6 m/s, and the wind direction was northwest. The indoor CO2 concentration in Case 5 ranged from 424 to 772 ppm; the average CO2 concentration was 587 ppm. The CO2 concentration in the room was reduced by approximately 325 ppm by opening one window and door every 30 min.
In Case 6, the speed of the outdoor air ranged from 1.3 to 5.6 m/s, and the wind direction was northwest. The indoor CO2 concentration in Case 6 ranged from 419 to 885 ppm; the average CO2 concentration was 645 ppm. With natural ventilation provided for 10 min at every hour, the indoor CO2 concentration was reduced to approximately 449 ppm.
In Case 7, the speed of the outside air ranged from 4.2 to 6.5 m/s, and the wind direction was northwest. The indoor CO2 concentration in Case 7 ranged from 455 to 1178 ppm; the average CO2 concentration was 717 ppm. Natural ventilation provided for 10 min every 60 min reduced the indoor CO2 concentration by approximately 685 ppm.
In Case 8, the speed of the outdoor air ranged from 5.6 to 12.1 m/s, and the wind direction was northwest. The indoor CO2 concentration in Case 8 ranged from 446 to 1087 ppm; the average CO2 concentration was 688 ppm. The CO2 concentration in the room was substantially reduced by facilitating natural ventilation for 10 min every hour. However, when the ventilation time interval was increased, the CO2 concentration immediately exceeded 1000 ppm. Decreasing the natural ventilation time interval would be effective in reducing indoor CO2 concentration. During the Case 8 measurement, the outside air wind speed ranged from 5.6 to 12.1 m/s, and the wind direction was northwest. The indoor CO2 concentration during Case 8 ranged from 446 to 1087 ppm and the average CO2 concentration was 688 ppm. The CO2 concentration in the room was significantly reduced by performing natural ventilation once an h for 10 min. However, when the ventilation time interval was increased, the CO2 concentration immediately before natural ventilation occasionally exceeded 1000 ppm. It is effective to decrease the interval of the natural ventilation time and the time to open the door and window.

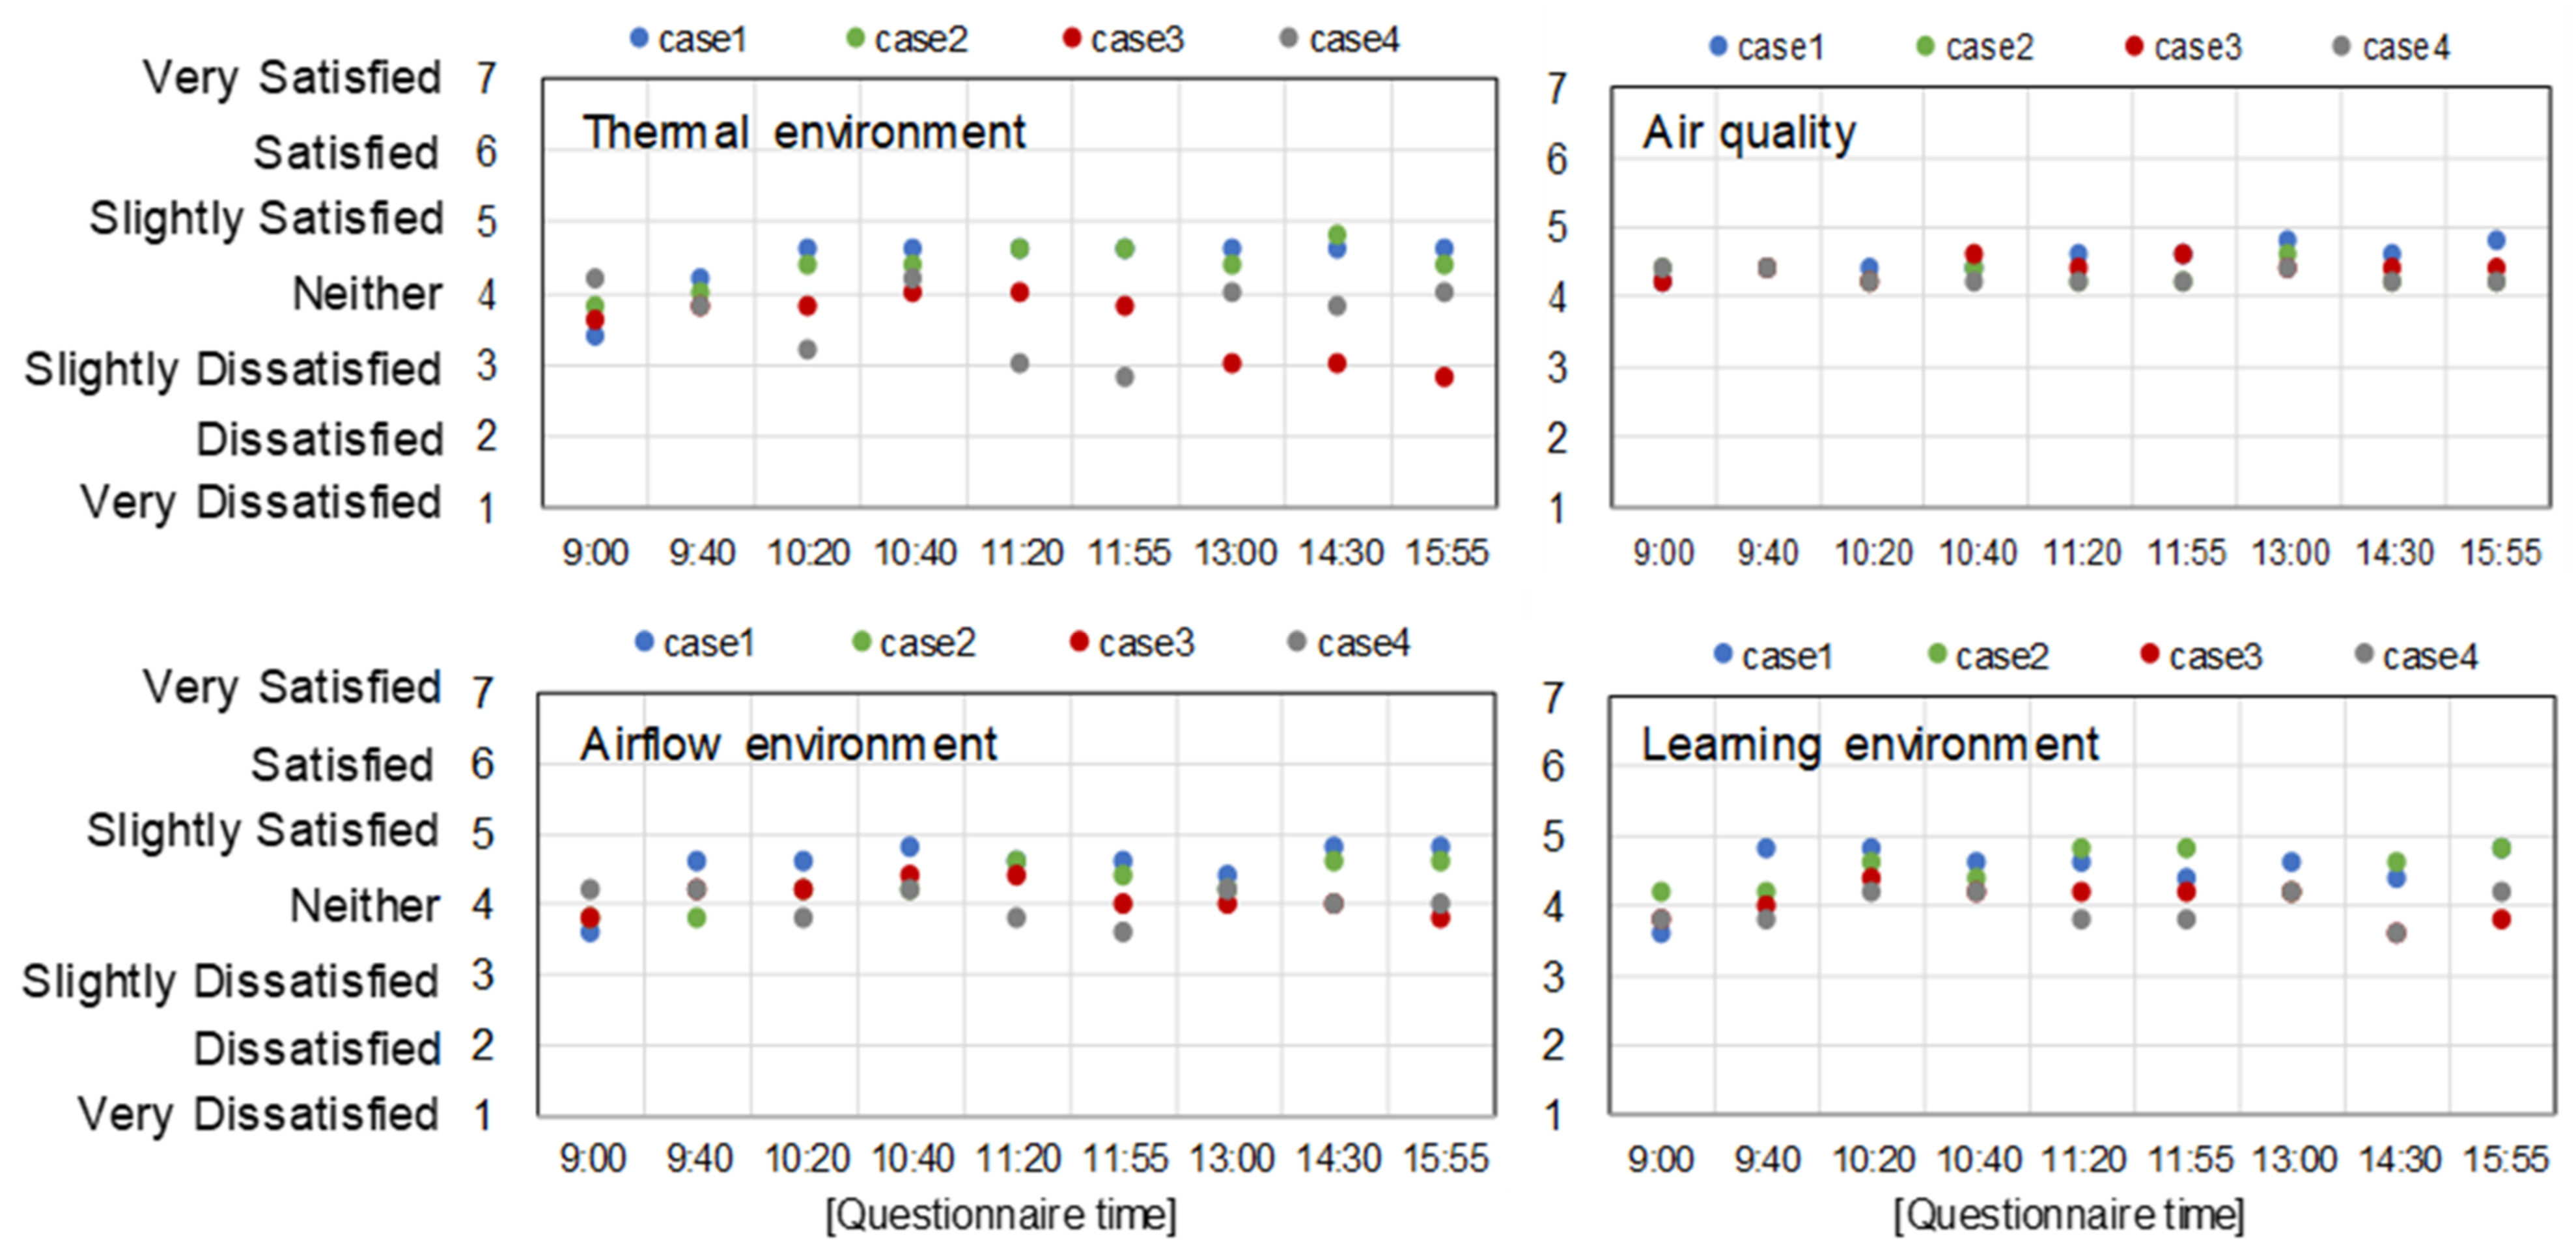
3.2.3. Questionnaire Survey Results

The number of participants who participated in the indoor environment questionnaire survey was the same as those during summer. Figure 9 shows the degree of satisfaction of the participants with the indoor environment during winter. The participants responded that they were slightly satisfied or dissatisfied with indoor air quality under all conditions. They expressed dissatisfaction with the indoor thermal environment in Case 7 in which the temperature was set to 18 °C. They felt more than slightly satisfied with Case 8, which had a temperature setting of 22 °C, and considered it as the most comfortable among the four conditions. In the case of airflow and learning environments, they were most dissatisfied with Case 7. Natural ventilation during winter influences the thermal and airflow environments because cold air enters the room as it is. Such a phenomenon also affects the learning environment.

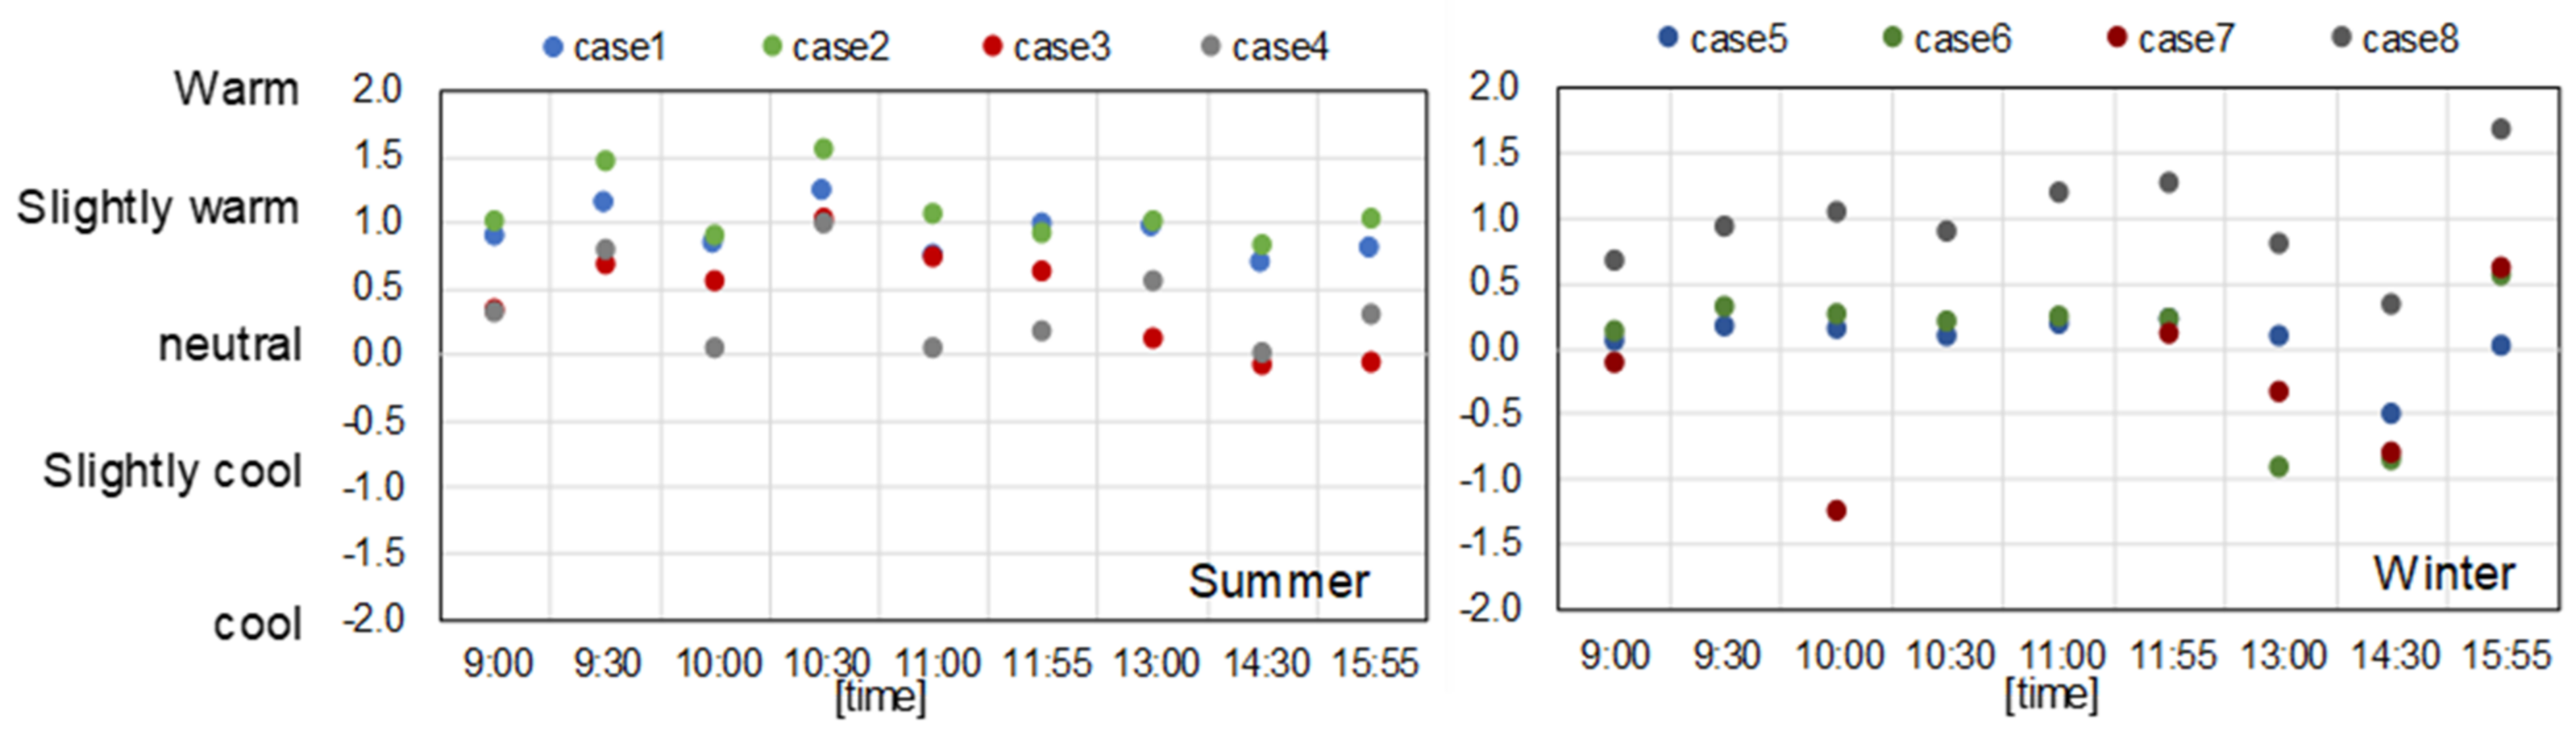
3.3. Predicted Mean Vote (PMV)

Figure 10 shows the PMV values of the summer and winter measurements. The PMV value was calculated using the temperature, relative humidity, radiation temperature, and wind speed measured indoors. The values used were the average values for the entire laboratory. The amount of clothing (clo) worn by the occupants was 0.6 clo (short sleeves, long trousers, socks, shoes) in summer. In winter, 1.1 clo (long sleeves, layered clothes, outerwear, winter trousers, socks, shoes) was used. The amount of metabolism (met) was set to 1.2 met, assuming that office work was performed on one’s own seat. In Cases 1 and 2, wherein the room temperature was set to 28 °C, the PMV ranged from 0.69 to 1.24 and from 0.84 to 1.55, respectively; such values were predicted to exceed the comfort range of 0.5. In Cases 3 and 4, wherein the room temperature was set to 25 °C, the PMV ranged from −0.08 to 1.04 and from 0.01 to 0.98, respectively; the thermal environment in the room ranged from neutral to slightly warm. The occupants of the building set the room temperature to 28 °C to save energy, but frequent natural ventilation during summer affected the thermal environment of the room.
In Cases 5 and 6, wherein the room temperature was set to 20 °C, the PMV ranged from −0.49 to 0.23 and from −0.91 to 0.56, respectively. The PMV range was wider in Case 6 than in Case 5; the former had natural ventilation once every 60 min, while the latter had natural ventilation once every 30 min. This observation could be attributed to the extension of time interval for natural ventilation, and the temperature decrease in the room was considerable. The PMV was predicted to range from −1.26 to 0.62 and from 0.34 to 1.69 in Cases 7 (set temperature: 18 °C) and 8 (set temperature: 22 °C), respectively. When the indoor temperature was set to 18 °C to save energy, the indoor thermal environment was predicted to be slightly cool. However, the thermal environment in Case 8 was predicted to be slightly warm since the indoor temperature was set to 22 °C. Setting the room temperature to 20 °C in winter and facilitating natural ventilation frequently over a short period of time are effective in improving the indoor thermal environments.

4. Discussion

COVID-19 transmission routes are classified as contact, droplet, and airborne infections [32]. For airborne infection, ventilation that dilutes the droplet nuclei floating in a room with clean air, such as outdoor air, is effective; however, it is necessary to operate a custom-mechanical system. For disease transmission to be controlled, contact and droplet infections require personal hygiene, whereas airborne infections require mechanical systems installed in buildings.
Droplets generally refer to mists with a particle size ≥ 5 µm generated when an infected person coughs or sneezes; the droplet nuclei have a particle size < 5 µm [33]. The severe acute respiratory syndrome coronavirus 2 (SARS-CoV-2) particle size is approximately 60–120 nm and has a distinct spike of 9–12 nm [32]. However, when this virus is present in the air, it does not float as a single virus but is present in the mist that is splashed when an infected individual coughs or sneezes. It has been experimentally found that when a person coughs, the particle size of the mist that splashes from his or her mouth ranges from 1.6 to 123 µm [34]. To prevent airborne infection in a room, it is necessary to clean the circulating air using ventilation or a filter.
Indoor air purification can remove pollutants from the air using ventilation and filter filters. Large-scale buildings and hospitals are equipped with centralized air conditioners, making it possible to manage the indoor air quality suitable for hygiene. In particular, the high efficiency particulate air filter used in air conditioners can remove ≥99.97% of 0.3 µm–sized particles [35]. Therefore, it was possible to filter SARS-CoV-2 with a droplet size of 1.6–123 µm. In addition, a building where a centralized air conditioner is installed improves air quality by controlling the indoor CO2 concentration. In Japan, the standard indoor CO2 concentration should be maintained at 1000 ppm or less [36]. Indoor CO2 concentrations provide valuable information for assessing the levels of human-generated and other pollutants and for determining the ventilation volume of mechanical systems [36,37,38,39].
However, for a building without a mechanical ventilation system, using a ventilation fan and opening the windows and doors for natural ventilation are commonly practiced. Natural ventilation has advantages and disadvantages [40]. As an advantage, it can be effectively used to manage the indoor thermal environment in warm climate areas. Moreover, significant air volumes can be easily obtained, and simple natural ventilation is inexpensive to operate and maintain. The disadvantages include the following: the climatic conditions of the outdoor air are diverse, it is difficult to predict the ventilation volume, and external noise may enter. Furthermore, when the outdoor air is hot, humid, or cold, the thermal comfort level of the room decreases.
In this study, we analyzed the effect of natural ventilation on the indoor environment of university facilities and evaluated the most effective natural ventilation method based on indoor air quality and the thermal environment. It is hot and humid during summer in Japan, and natural ventilation affects the indoor thermal environment. When the temperature of the air conditioner was set to 25 °C and 28 °C, and natural ventilation was facilitated once every 30 min, the average indoor temperatures were 26.5 °C and 28.1 °C, respectively. The temperature setting of 25 °C was more comfortable than that of 28 °C. In addition, the participants of the questionnaire survey expressed that the temperature setting of 25 °C was slightly comfortable in terms of the thermal and learning environments. When the indoor temperature was set to 25 °C and 28 °C, and natural ventilation was provided once every 60 min, the indoor thermal environment was more comfortable at 25 °C than at 28 °C. However, providing natural ventilation once every 30 min had a smaller difference in indoor temperature and humidity and less effect on the indoor thermal environment than providing natural ventilation once every 60 min.
The measurements taken during winter showed that the indoor thermal environment was affected by the set indoor temperature. The thermal environment was the highest when the indoor temperature setting was at 22 °C. Moreover, when the indoor temperature was set to 18 °C, the level of satisfaction with the indoor environment was low. In winter, as in summer, the thermal environment differs depending on the duration and time interval of natural ventilation. When natural ventilation was performed once every 60 min, a large amount of cold outdoor air was introduced, and the temperature inside the room changed significantly. The PMV was calculated using the measured values of all conditions. Setting the indoor temperature to 25 °C in summer generated a thermal comfort level that was closer to the comfortable range than the other conditions. Meanwhile, setting the temperature to 20 °C in winter produced a thermal comfort level that was closer to the comfort range than the other conditions. Such results were congruent with the results of the thermal environment questionnaire.
The Japanese government recommends maintaining an indoor CO2 concentration below 1000 ppm to prevent COVID-19 infection. In this study, the indoor air environment was evaluated using the measured values of changes in indoor CO2 concentration. It has been reported that natural ventilation is significantly influenced by indoor and outdoor temperatures and outdoor wind speed [41]. The range of reduction in the indoor CO2 concentration was larger when natural ventilation was provided once every 60 min than when it was provided once every 30 min. However, because the windows and doors were closed for a long time, there were instances when the indoor CO2 concentration exceeded 1000 ppm. During winter, the indoor CO2 concentration often exceeded 1000 ppm. From the above results, it was found that frequently facilitating natural ventilation in short time intervals is effective in maintaining the indoor CO2 concentration at 1000 ppm or less.
The limitations of this study include the following: data collection was conducted in a limited time, and spaces of various sizes could have also been measured. In addition, the Japanese government recommends keeping the indoor CO2 concentration below 1000 ppm to prevent COVID-19 infection, but the relationship between indoor CO2 concentration and infection rate is not clear. Although ventilation is known to be an effective countermeasure against airborne infection, the behavioral characteristics of the virus generated from an infected person have not been clarified. Therefore, if the CO2 concentration in the room is 1000 ppm or less, it remains unclear whether such concentration would lead to infection control. For future research, it will be necessary to collect data from long-term measurements in various spaces, clarify the behavioral characteristics of the new coronavirus using computational fluid dynamics (CFD), and take further measures against infection indoors.

5. Conclusions

In this study, the indoor air quality and thermal environment of a university facility were analyzed when an air conditioner was operated and natural ventilation was provided; the most effective natural ventilation method was also evaluated.
In general, natural ventilation in Japan is related to the energy saving, and the outdoor temperature is an important condition of natural ventilation. The range of outdoor air temperature for natural ventilation in Japan is often at 15–25 °C. To prevent the spread of COVID-19 infection, natural ventilation has been recently provided in buildings without ventilation equipment regardless of the season or outdoor temperature.
Therefore, due to the COVID-19 pandemic, the purpose of natural ventilation has shifted from energy conservation to infection control. If the outdoor temperature is within the range of 15 °C to 25 °C, it will not have a significant effect on the indoor thermal environment and will lead to energy savings. Contrarily, even in summer when the indoor and outdoor temperatures are 30 °C or higher, and in winter when the temperature is 5 °C or lower, natural ventilation is being provided and the air conditioner is operating.
From the results of this study, it was found that natural ventilation in winter has a great influence on the indoor thermal environment. In particular, providing natural ventilation once every 60 min, rather than once every 30 min, adversely affects the thermal environment in the room. This was because the temperature difference between the outdoor and indoor temperatures was large, and the ventilation volume for 10 min was large. In addition, when natural ventilation was facilitated for 10 min every 60 min, the thermal and learning environments of the occupants near the window were not satisfactory. However, since the air conditioner was in operation, the uncomfortable experience was brief. In this study, setting the room temperature to 25 °C in summer and 20 °C in winter generated a thermal comfort level that was closer to the comfortable range.
For the indoor air environment, it was effective to provide natural ventilation once every 30 min for 5 min to maintain the indoor CO2 concentration at ≤1000 ppm. Providing natural ventilation for 10 min every 60 min can secure a large amount of ventilation at one time; however, the CO2 concentration might exceed 1000 ppm because of the extended period of time that the windows and doors are closed. Therefore, providing frequent natural ventilation in short time intervals is more effective in improving indoor air quality. However, natural ventilation makes it difficult to predict the ventilation volume and is significantly affected by the region’s climate; hence, a strategy for natural ventilation in each region is necessary.
Although the Japanese government recommends that the indoor CO2 concentration should be maintained at <1000 ppm to prevent COVID-19 infection, the relationship between the indoor CO2 concentration and infection rate is unknown. The behavioral characteristics of the virus generated by an infected person have not yet been clarified. In the future, it will be necessary to clarify the behavioral characteristics of the novel coronavirus using CFD, and to take further measures against indoor infection.

Author Contributions

Conceptualization, R.K. and H.K.; methodology, R.K. and H.K.; software, R.K. and H.K.; validation, R.K. and H.K.; formal analysis, R.K. and H.K.; investigation, R.K. and H.K.; resources, R.K. and H.K.; data curation, R.K. and H.K.; writing—original draft preparation, H.K.; writing—review and editing, R.K. and H.K.; visualization, R.K. and H.K.; supervision, R.K. and H.K.; project administration, R.K. and H.K.; funding acquisition, R.K. All authors have read and agreed to the published version of the manuscript.

Funding

This research received no external funding.

Institutional Review Board Statement

Not applicable.

Informed Consent Statement

Not applicable.

Data Availability Statement

Not applicable.

Acknowledgments

Thanks to the people who participated in the measurement.

Conflicts of Interest

The authors declare no conflict of interest.

References

  1. SARS. Available online: https://www.who.int/health-topics/severe-acute-respiratory-syndrome#tab=tab_1 (accessed on 20 July 2020).
  2. Influenza A (H1N1). Available online: https://www.who.int/emergencies/situations/influenza-a-(h1n1)-outbreak (accessed on 22 July 2020).
  3. MERS. Available online: http://www.emro.who.int/health-topics/mers-cov/mers-outbreaks.html (accessed on 22 July 2020).
  4. COVID-19, WHO. Available online: https://covid19.who.int/ (accessed on 14 May 2022).
  5. Cabinet Secretariat, Japan. Countermeasures for COVID-19 Infection. Available online: https://corona.go.jp/emergency/ (accessed on 9 March 2021).
  6. Ministry of Health, Labour and Welfare. Countermeasures for COVID-19 Infection. Available online: https://www.mhlw.go.jp/stf/covid-19/kenkou-iryousoudan.html (accessed on 9 March 2021).
  7. Ministry of Health, Labour and Welfare. Ventilation Method for Improving Closed Space with Poor Ventilation. Available online: https://www.mhlw.go.jp/stf/newpage_15102.html (accessed on 9 March 2021).
  8. WHO. Coronavirus Disease (COVID-19): How Is It Transmitted? Available online: www.who.int/news-room/questions-andanswers/item/coronavirus-disease-covid-19-how-is-it-transmitted (accessed on 24 February 2022).
  9. ASHRAE. ASHRAE Position Document on Infectious Aerosols. Available online: http://www.ashrae.org/file%20library/about/position%20documents/pd_infectiousaerosols_2020.pdf (accessed on 24 February 2022).
  10. REHVA. REHVA COVID-19 Guidance. Available online: http://www.rehva.eu/fileadmin/user_upload/REHVA_COVID-19_guidance_document_ver2_20200403_1.pdf (accessed on 24 February 2022).
  11. Luo, M.; Cao, B.; Damiens, J.; Lin, B.; Zhu, Y. Evaluating thermal comfort in mixed-mode buildings: A field study in a subtropical climate. Build. Environ. 2015, 88, 46–54. [Google Scholar] [CrossRef]
  12. Hummelgaard, J.; Juhl, P.; Sæbjörnsson, K.; Clausen, G.; Toftum, J.; Langkilde, G. Indoor air quality and occupant satisfaction in five mechanically and four naturally ventilated open-plan office buildings. Build. Environ. 2007, 42, 4051–4058. [Google Scholar] [CrossRef]
  13. Cao, S.-J.; Ren, C. Ventilation control strategy using low-dimensional linear ventilation models and artificial neural network. Build. Environ. 2018, 144, 316–333. [Google Scholar] [CrossRef]
  14. Tanabe, S.-I.; Haneda, M.; Nishihara, N. Workplace productivity and individual thermal satisfaction. Build. Environ. 2015, 91, 42–50. [Google Scholar] [CrossRef]
  15. Yu, Z.; Fung, B.C.M.; Haghighat, F.; Yoshino, H.; Morofsky, E. A systematic procedure to study the influence of occupant behavior on building energy consumption. Energy Build. 2011, 43, 1409–1417. [Google Scholar] [CrossRef] [Green Version]
  16. Zhao, Q.; Lian, Z.; Lai, D. Thermal comfort models and their developments: A review. Energy Built Environ. 2021, 2, 21–33. [Google Scholar] [CrossRef]
  17. Indraganti, M.; Rao, K.D. Effect of age, gender, economic group and tenure on thermal comfort: A field study in residential buildings in hot and dry climate with seasonal variations. Energy Build. 2010, 42, 273–281. [Google Scholar] [CrossRef]
  18. Szekeres, S.; Kostyák, A.; Szodrai, F.; Csáky, I. Investigation of Ventilation Systems to Improve Air Quality in the Occupied Zone in Office Buildings. Buildings 2022, 12, 493. [Google Scholar] [CrossRef]
  19. Ortiz, M.A.; Kurvers, S.R.; Bluyssen, P.M. A review of comfort, health, and energy use: Understanding daily energy use and wellbeing for the development of a new approach to study comfort. Energy Build. 2017, 152, 323–335. [Google Scholar] [CrossRef]
  20. Rupp, R.F.; Vasquez, N.G.; Lamberts, R. A review of human thermal comfort in the built environment. Energy Build. 2015, 105, 178–205. [Google Scholar] [CrossRef]
  21. Schweiker, M.; Huebner, G.M.; Kingma, B.R.M.; Kramer, R.; Pallubinsky, H. Drivers of diversity in human thermal perception—A review for holistic comfort models. Temperature 2018, 5, 308–342. [Google Scholar] [CrossRef]
  22. Daisey, J.M.; Angell, W.J.; Apte, M.G. Indoor air quality, ventilation and health symptoms in schools: An analysis of existing information. Indoor Air 2003, 13, 53–64. [Google Scholar] [CrossRef] [PubMed]
  23. Hong, T.; Taylor-Lange, S.C.; D’Oca, S.; Yan, D.; Corgnati, S.P. Advances in research and applications of energy-related occupant behavior in buildings. Energy Build. 2016, 116, 694–702. [Google Scholar] [CrossRef] [Green Version]
  24. Stazi, F.; Naspi, F.; D’Orazio, M. A literature review on driving factors and contextual events influencing occupants’ behaviours in buildings. Build. Environ. 2017, 118, 40–66. [Google Scholar] [CrossRef]
  25. Van Den Wymelenberg, K. Patterns of occupant interaction with window blinds: A literature review. Energy Build. 2012, 51, 165–176. [Google Scholar] [CrossRef]
  26. Emmerich, S.J.; Dols, W.S.; Axley, J.W. Natural Ventilation Review and Plan for Design and Analysis Tools. National Institute of Standards and Technology: Gaithersburg, MD, USA, 2001. [Google Scholar]
  27. Yamanaka, T.; Kotani, H.; Iwamoto, K.; Kato, M. Natural, wind-forced ventilation caused by turbulence in a room with a single opening. Int. J. Vent. 2006, 5, 179–187. [Google Scholar] [CrossRef]
  28. Eftekhari, M.M.; Marjanovic, L.D.; Pinnock, D.J. Air flow distribution in and around a single-sided naturally ventilated room. Build. Environ. 2003, 38, 389–397. Available online: https://azure.microsoft.com/ja-jp/services/cognitive-services/face/#overview (accessed on 24 May 2020). [CrossRef]
  29. Yamamoto, Y.; Tanabe, S.-I. The criteria of outdoor conditions for operating natural ventilation openings. J. Environ. Eng. Transact. AIJ 2016, 81, 375–384. [Google Scholar]
  30. ISO 7730:2005; Ergonomics of the Thermal Environment—Analytical Determination and Interpretation of Thermal Comfort Using Calculation of the PMV and PPD Indices and Local Thermal Comfort Criteria. ASTM: West Conshohocken, PA, USA, 2005.
  31. ISO 10551:2019; Ergonomics of the Physical Environment—Subjective Judgement Scales for Assessing Physical Environments. ASTM: West Conshohocken, PA, USA, 2019.
  32. WHO. Modes of Transmission of Virus Causing COVID-19: Implications for IPC Precaution Recommendations, Scientific Brief. 29 March 2020. Available online: https://apps.who.int/iris/bitstream/handle/10665/331616/WHO-2019-nCoV-Sci_Brief-Transmission_modes-2020.2-eng.pdf?sequence=1&isAllowed=y (accessed on 24 February 2021).
  33. Wiersinga, W.J.; Rhodes, A.; Cheng, A.C.; Peacock, S.J.; Prescott, H.C. Pathophysiology, Transmission, Diagnosis, and Treatment of Coronavirus Disease 2019 (COVID-19), A review. JAMA 2020, 324, 782–793. [Google Scholar] [CrossRef]
  34. Johnson, G.R.; Morawska, L.; Ristovski, Z.D.; Hargreaves, M.; Mengersen, K.; Chao, C.Y.H.; Wan, M.P.; Li, Y.; Xie, X.; Katoshevski, D.; et al. Modality of human expired aerosol size distributions. J. Aerosol Sci. 2011, 42, 839–851. [Google Scholar] [CrossRef]
  35. Riederer, A.M.; Krenz, J.E.; Tchong-French, M.I.; Torres, E.; Perez, A.; Younglove, L.R.; Jansen, K.L.; Hardie, D.C.; Farquhar, S.A.; Sampson, P.D.; et al. Effectiveness of portable HEPA air cleaners on reducing indoor PM2.5 and NH3 in an agricultural cohort of children with asthma: A randomized intervention trial. Indoor Air. 2021, 31, 454–466. [Google Scholar] [CrossRef] [PubMed]
  36. Building Environmental Hygiene Management Standards, Japan, Tokyo. Available online: https://www.mhlw.go.jp/bunya/kenkou/seikatsu-eisei10/ (accessed on 10 May 2021).
  37. Persily, A.K. The relationship between indoor air quality and carbon dioxide. In Proceedings of the 7th Indoor Air Quality and Climate, Nagoya, Japan, 21–26 July 1996; pp. 961–966. [Google Scholar]
  38. Kalmár, T.; Kalmár, F. Investigation of natural aeration in home offices during the heating season—Case study. J. Build. Eng. 2020, 35, 102052. [Google Scholar] [CrossRef]
  39. Pereira, P.F.; Ramos, N.M.M. The impact of mechanical ventilation operation strategies on indoor CO2 concentration and air exchange rates in residential buildings. Indoor Built Environ. 2021, 30, 1516–1530. [Google Scholar] [CrossRef]
  40. WHO. WHO Publication/Guidelines. In Natural Ventilation for Infection Control in Health-Care Settings; World Health Orgnaization: Geneva, Switzerland, 2009. [Google Scholar]
  41. Zhong, H.-Y.; Sun, Y.; Shang, J.; Qian, F.-P.; Zhao, F.-Y.; Kikumoto, H.; Jimenez-Bescos, C.; Liu, X. Single-sided natural ventilation in buildings: A critical literature review. Build. Environ. 2022, 212, 108797. [Google Scholar] [CrossRef]
Figure 1. Photograph of measurement scenery.
Buildings 12 00953 g001
Figure 2. Measurement position and cross section.
Buildings 12 00953 g002
Figure 3. Measurement time schedule.
Buildings 12 00953 g003
Figure 4. Changes of indoor temperature and relative humidity in summer.
Buildings 12 00953 g004
Figure 5. Changes of indoor CO2 concentration in summer.
Buildings 12 00953 g005
Figure 6. Satisfaction with the indoor environment in summer.
Buildings 12 00953 g006
Figure 7. Changes of indoor temperature and relative humidity in winter.
Buildings 12 00953 g007
Figure 8. Changes of indoor CO2 concentration in winter.
Buildings 12 00953 g008
Figure 9. Satisfaction with the indoor environment in winter.
Buildings 12 00953 g009
Figure 10. Prediction of PMV in summer and winter.
Buildings 12 00953 g010
Table 1. The details of the measuring equipment.
Measured DataMeasuring Equipment
Temperature
Relative humidity
Radiation temperature
T&D, Wireless Thermo Recorder RTR-322
ESPEC MIC Corp. RTW-30S + Black bulb ϕ40 mm
CO2T&D, CO2 Recorder TR-76Ui
Wind speedKANOMAX, Anemomaster Model 6035
Table 2. Measurement conditions in summer and winter.
Measurement SeasonSummerWinter
ItemCase 1Case 2Case 3Case 4Case 5Case 6Case 7Case 8
Nautral Ventilation interval [min.]3060306030606060
Air conditioner set temperature [°C]2828252520201822
Number of people in the room9
Publisher’s Note: MDPI stays neutral with regard to jurisdictional claims in published maps and institutional affiliations.

