Article

Plastic Deformation Analysis of a New Mega-Subcontrolled Structural System (MSCSS) Subjected to Seismic Excitation

1
School of Mechanics, Civil Engineering and Architecture, Northwestern Polytechnical University, Xi’an 710129, China
2
Department of Civil Engineering, University of Management and Technology, Lahore 54000, Pakistan
*
Author to whom correspondence should be addressed.
Buildings 2022, 12(7), 987; https://doi.org/10.3390/buildings12070987
Submission received: 10 June 2022 / Revised: 4 July 2022 / Accepted: 5 July 2022 / Published: 11 July 2022

Abstract

:
This paper seeks to examine the plastic deformation and seismic structural response of a mega-subcontrolled structural system (MSCSS) subjected to strong seismic excitations. Different MSCSS configurations were modeled with nonlinear finite elements, and nonlinear dynamic analyses were performed to examine their behaviors. This paper introduces a novel and optimized MSCSS configuration, configuration 30, which demonstrates remarkable results for the reduction of plastic strain. Utilizing a steel plate shear wall enhances the seismic structural integrity of this system (SPSW). This configuration improved the mean equivalent plastic strain of columns and beams by 51% and 80%, respectively. In addition, a comparison between unstiffened and ring-shaped infill panels of SPSWs demonstrates that ring-shaped infill panels offer greater lateral stiffness and energy dissipation with a 44% reduction in maximum equivalent plastic strain. Compared to configuration 1, configuration 30 exhibited the most controlled structural response, as the minimum residual story drift improvement was 70% in the first, second, and third substructures, respectively, and the maximum coefficient of variation (COV) was 16% and 32% in the acceleration and displacement responses, respectively.

1. Introduction

Due to urbanization and limited land availability in metropolises, there has been an escalation in the demand for high-rise buildings. According to the Council on Tall Buildings and Urban Habitat (CTBUH) in 2019, 368 high-rise buildings have been constructed that are more than 100 m tall and, up to now, 5129 high-rise buildings have been constructed that are more than 150 m tall [1]. In recent years, buildings have become slender and taller, which is only possible due to advancements in construction techniques and ultra-strength materials [2]. Due to their slenderness and light weight, these tall, slender buildings are prone to random vibrations and excitations. As high-rise buildings are more prone to lateral loads, structures can be safe by enhancing energy dissipation and lateral stiffness while optimizing weight. Wind loads depend on structural height, while seismic loads depend on structural weight, soil-structure interaction, earthquake duration, magnitude, and distance to epicenter. Random excitations from lateral loads reduce the load-bearing capacity of structural foundations, shortening their lifespan. The structural fundamental period depends on soil-structure interactions and soil properties. Under prolonged dynamic loading, the fundamental period may change [3,4,5].
To control the high-rise building structural response against severe seismic and wind loading, mega-substructures (MSSs) has been used worldwide as the typical structural design. Mega-structural frame and multistory substructures are key components of MSSs. In the MSS configuration, the mega-structural frame has a rigid connection with multistory substructures. The main structural strength component in MSSs is the mega-structural frame, and multistory substructures serve as the occupants’ residency. Feng and Mita introduced a passive mega-subcontrolled structure (PMSCS) [6]. In their design, fixed-end conditions are used between the megastructure and substructure. In the PMSCS, the substructures act as a tuned mass damper (TMD). Furthermore, there is no need to add an additional 1% mass over the structure, as the mass ratio between the megastructure and substructure is 100% compared to the 1% of a traditional TMD. Chai and Feng improved Feng and Mita’s work on dynamic structural response to wind. In their model, a cantilever beam represented the megastructure and a concentrated mass represented the substructure [7]. Later, Lan proposed a multidegree freedom system for his analytical model by replacing each substructure with a concentrated mass [8].
In the past decade, Zhang established a new configuration for PMSCSs, named the mega-subcontrolled structure system (MSCSS), which showed dominant shearing and bending in their substructures and mega-frames, respectively. The relative stiffness ratio (RD) between the substructure’s shear stiffness and the mega-bending frame’s stiffness affects structural vibration control. Vibration control is effective if RD is less than 0.477, but if it increases, first modal vibrations will not be damped effectively. This newly proposed PMSCS performs better in terms of energy dissipation and self-control in structural vibrations caused by seismic excitations. Later, the effects of friction and magnetorheological dampers used in MSCSS substructures were studied [9,10,11]. Recent studies [12,13] have examined a variety of controlling techniques and contrasted them with the use of an MSS to reach their conclusions. The results showed that the MSCSS has a better structurally controlled response under seismic activity; i.e., it experiences less structural accelerations and displacements than previous models. A further application of friction dampers was made in an MSCSS substructure to improve the substructure’s responses to wind and seismic excitations [14,15]. Recent research on an MSCSS viscous damper control mechanism involved optimizing damper locations and parameters. Rubber bearings were installed at the tops of additional columns between floor mega-beams and substructural components to reduce earthquake response. In a high-intensity earthquake, the MSCSS sustains moderate damage while the MSS collapses [16,17]. The MSCSS has a 30% lower failure probability than the MSS, and the megastructure has a 50% lower failure probability than its substructure. MSCSS showed a response control rate of over 10% and a base shear control rate of 20% during long-period ground motions [18,19]. According to the MSCSS, the controlling effectiveness of structural acceleration and displacement at the top of a mega-frame with various arrangements and numbers of substructures ranged from 42% to 70% [20], whereas the controlling effectiveness of substructural acceleration and displacement ranged from 20% to 65%. Using mid-story isolation and inverted V-bracing (chevron), the MSCSS has demonstrated remarkable stabilizing effects against earthquake-induced structural vibration and shows significant improvements, particularly under a service load, with an average structural acceleration response of 49.7% under the El Centro earthquake. The presence of chevron bracing increases the structural stiffness of the structure, which reduces the excessive structural displacement caused by a shift in the period of time [21].
Despite recent developments in structural response control of MSCSS that show significantly improved results, the investigation of plastic deformation in a structure under intense seismic excitations still has not been fully explored and therefore requires further attention.
In this paper, the performance of different configurations of MSCSS under intense seismic excitations is investigated. An improved and new configuration of MSCSS is suggested that has a steel plate shear wall (SPSW) as a resisting structural system for lateral loads. The new proposed configuration of the MSCSS shows a remarkable improvement in the structural response under seismic excitations. The results of drift and plastic dissipation are presented in the first half of this study to comparatively calculate and compare the seismic response. In the second half, the results of the time histories for the new and proposed configuration of MSCSS are presented to quantify the effect of an SPSW in the MSCSS.

2. Scope

Utilizing the performance of various MSCSS configurations under intense seismic excitations, a new and improved configuration is proposed. The structural response is studied in relation to various types and configurations of SPSW infills in MSCSS. Due to the high dissipation of hysteretic energy, infill panels exhibit significant post-buckling strength and ductility under tension, according to previous research. Consequently, tension-only yielding behavior is observed in the infill panels and plastic hinges formed at the ends of horizontal boundary elements (HBEs), resulting in adequate seismic performance of SPSW systems [22,23]. HBEs reduce tension fields in unstiffened infill panels by increasing structural stiffness and stability. Vertical boundary elements (VBEs) prevent plastic hinges and yielding in the infill panel. High-rise buildings need more brittle infill panels. Infill panels connected only with HBEs dissipate less energy and carry less load than fully connected infill panels but demonstrate the same lateral deformation resistance [24,25,26]. SPSW infill’s ductility and post-buckling strength provide seismic stability. SPSWs are commonly used as multi-stories, making them a cost-effective way to resist lateral loads in high-rise buildings. As infills are relatively thin compared to conventional concrete shear walls, they decrease the wall’s dead load and increase the occupant floor space. SPSWs are easy to install; they are appropriate for new structures and also for retrofitting existing structures. Additionally, under earthquake loads, they buckle during compression because of their slenderness [27,28,29].
A new SPSW system was developed during the last decade, which exhibits a unique pattern of rings connected by diagonal links, with circular cut-outs. This ring-shaped steel plate shear wall (RS-SPSW) resists out-of-plane buckling by deforming the rings into an ellipse. Elongation of the ring shrinks the diagonal links during tension, preventing the web from sagging perpendicular to the tension field [30,31]. Low-rise buildings subjected to near-field ground motions showed the best performance from unstiffened SPSW systems, whereas RS-SPSW and honeycomb-SPSW systems demonstrated good resistance to induced structural acceleration and dampening effects [26]. Prior to suggesting a new and improved configuration of MSCSS that addresses common problems faced by structural engineers in high-rise building design, in this research, plastic deformation and plastic and viscous dissipation in various MSCSS configurations under seismic loads are studied.
This work was conducted using MSCSSs with various configurations. The MSCSS seismic response was studied using nonlinear time-history analysis (NTHA) to improve structural strength and stiffness while reducing structural weight, resulting in a more cost-effective solution. Different durations of seismic waves were used to investigate the seismic performance of the suggested MSCSS to draw a comprehensive conclusion.

3. Generation of Ground Motion

To examine the seismic response and performance of different MSCSS configurations, nonlinear dynamic analysis is conducted. For this purpose, 11 renowned seismic time histories are used. Five of the 11 ground motions are near-fault time histories with a distance to the rupture surface (Rrup) of less than 15 km, while the others are far-fault. According to ASCE 7–16, the ground motion number is chosen for nonlinear dynamic analysis (NDP). To balance more accurate estimates of the mean structural responses, this number of motions were chosen. The use of this greater number of motions has the benefit of indicating a significant likelihood that the structure will not achieve the 10% target collapse reliability for Risk Category I and II structures, if unacceptable responses are found for more than one of the 11 motions [32]. The total duration of these ground motions varies between 20 s and 56 s, and the interval is defined according to Kawashima and Aizawa, which is the exceedance of the first and last ground accelerations and is more than ±0.1 g [33]. Time histories are scaled to a design spectrum with a peak ground acceleration (PGA) of 1 g. The design spectrum is conceived under the guidelines of ASCE/SEI 41-17 [34], with SXS and SX1 being 2.50 and 1, respectively. A long-period transition of 8 s along with 5% damping for soil type D is utilized. The spectral matching method is used for scaling the time histories, which was primarily recommended in 1987–1988. For the purpose of spectral matching, SesimoMatch is used, which is based on RSPMatch (wavelets algorithm) in 1992 and later improved in 2006 [35,36,37,38,39]. Table 1 contains details on selected ground motions, and Figure 1 depicts the design spectrum, as well as spectral matching. Figure 1d illustrates a comparison between the time history of the original Nahanni and after conversion. In addition, also evident from Figure 1d is that after spectral matching, the characteristics of ground motions are preserved.

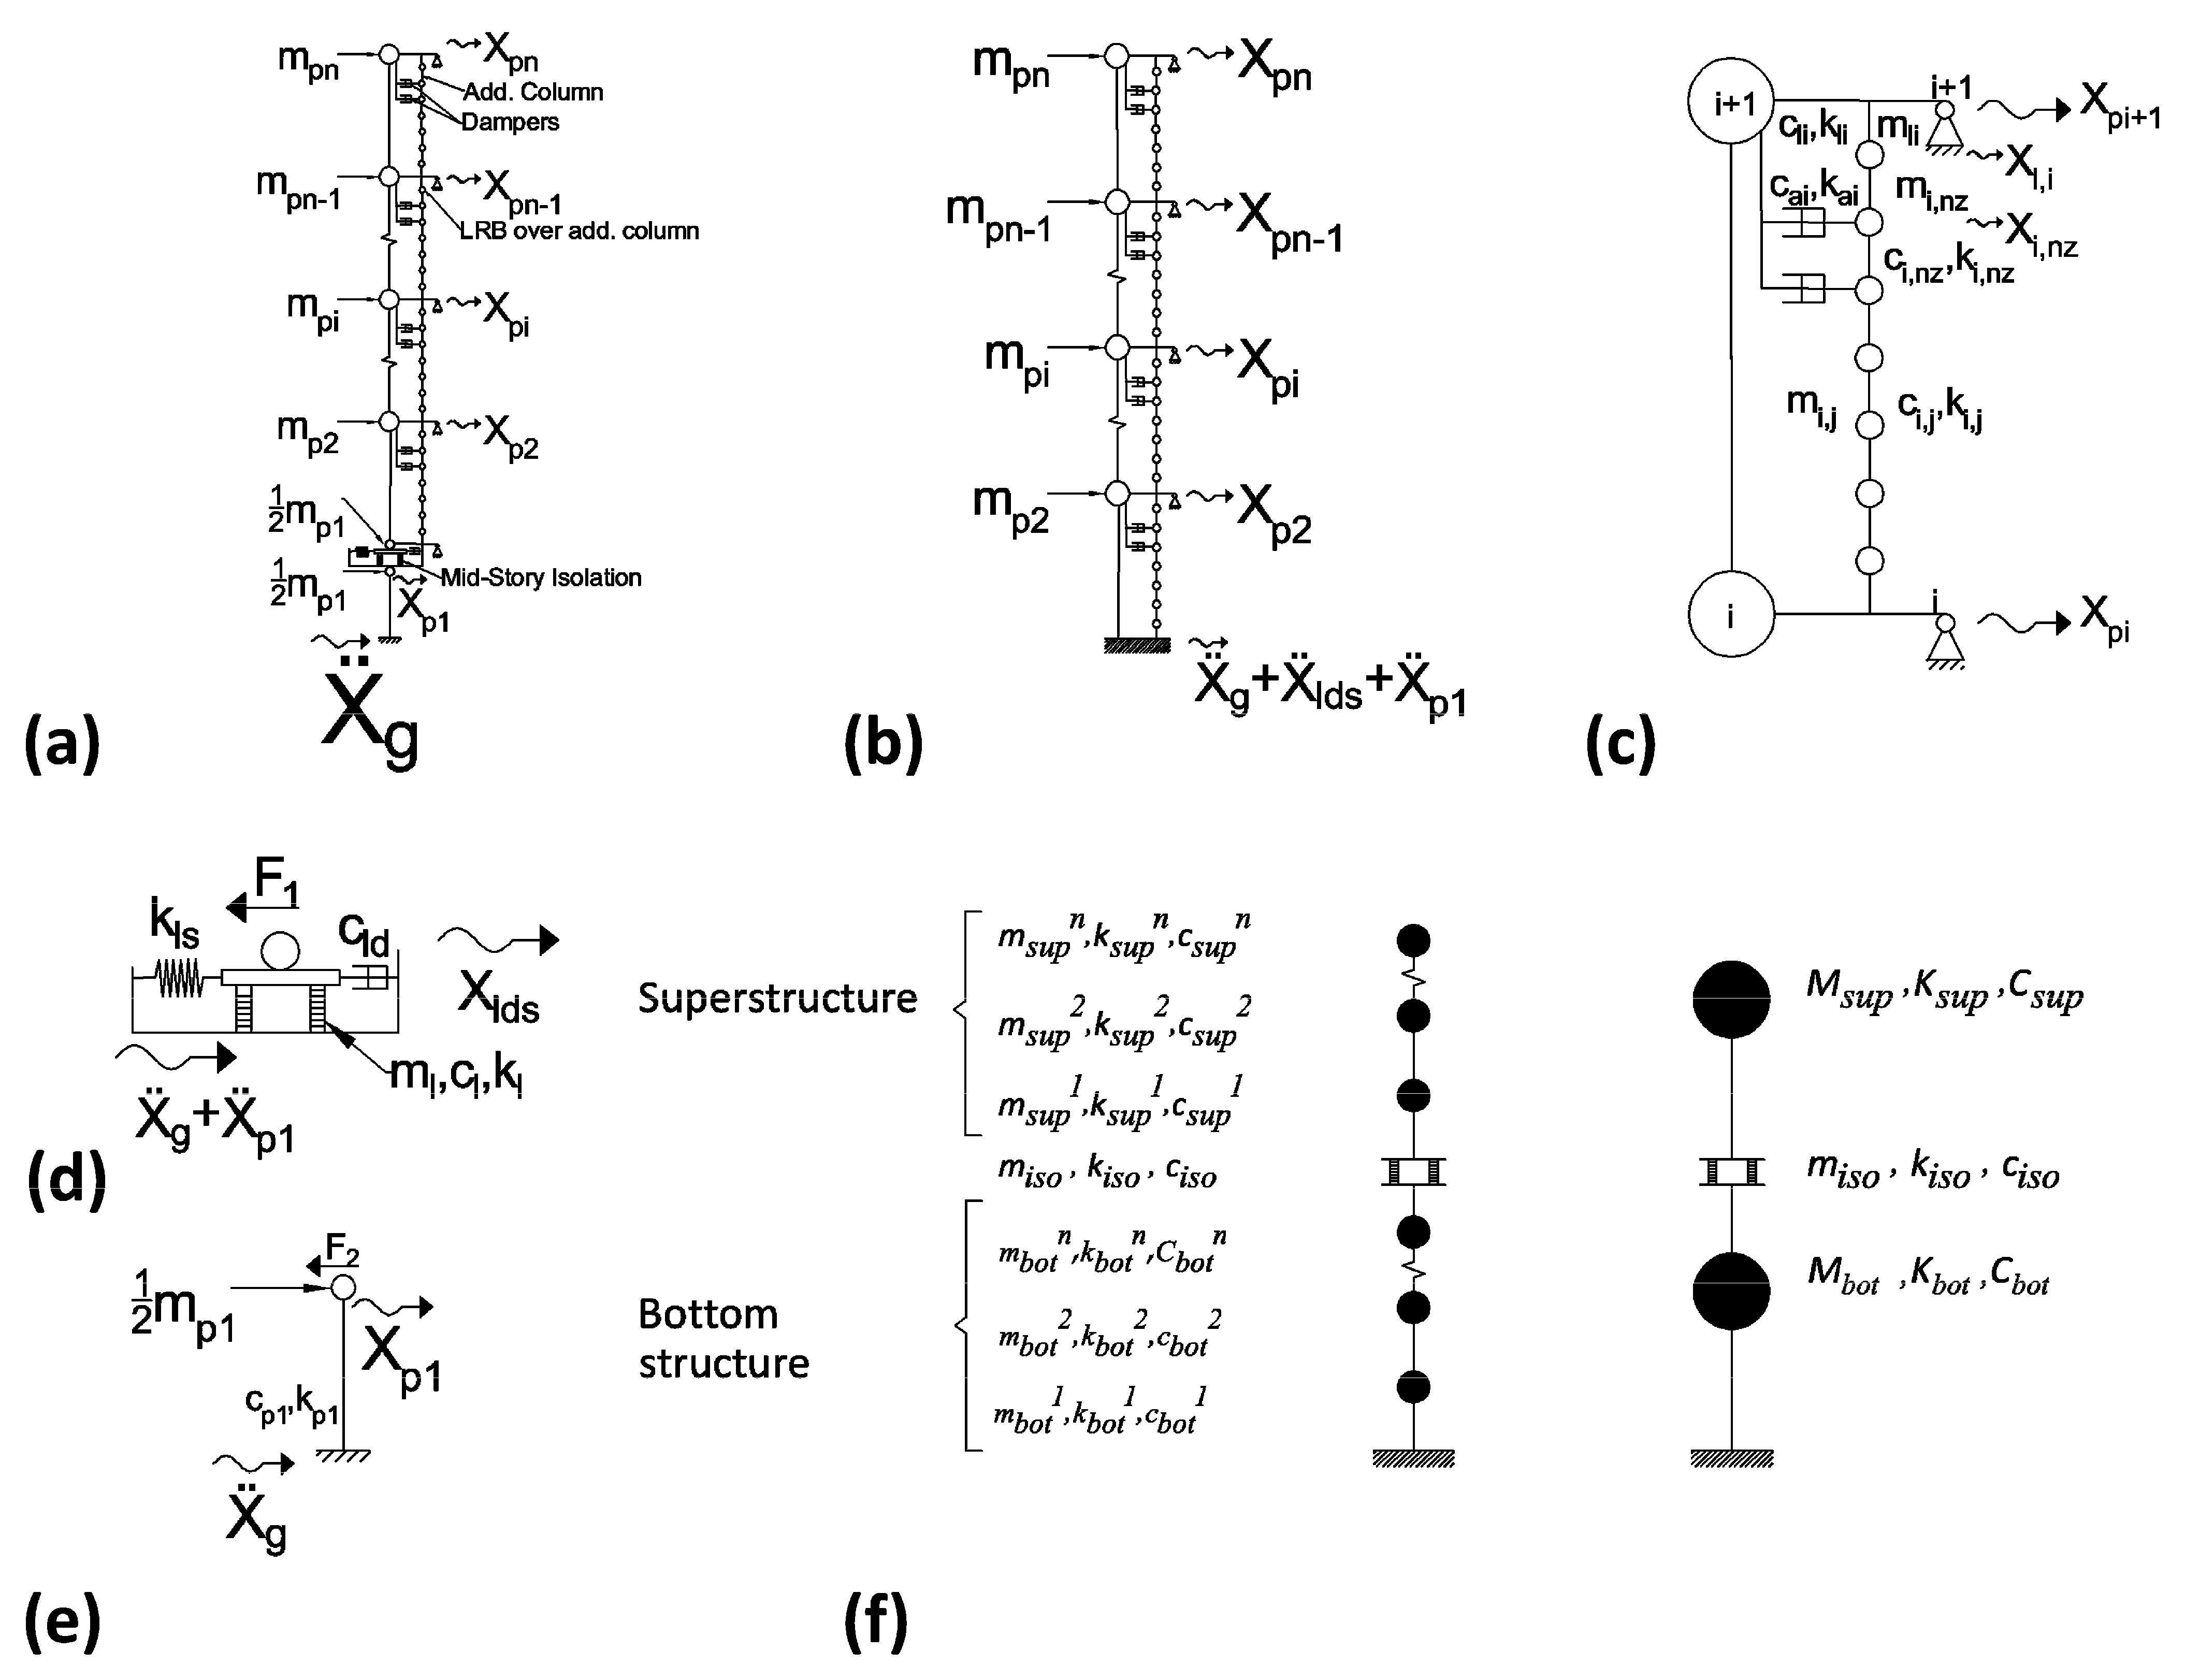
4. Computation Model

The analytical models of the MSCSS with mid-story isolation [21] and the newly proposed MSCSS with steel plate shear wall are represented as a simplified three-lumped-mass model based on Kelly’s two-lumped-mass model for base isolation structures, which used an equivalent linear model to represent the isolation system’s hysteretic behavior [40,41]. Figure 2 depicts an elevation view, as well as plans for various sections in MSCSS with mid-story isolation and a newly proposed MSCSS.
Figure 3 depict the computing model of the newly proposed MSCSS, which includes a bottom structure, an isolation system, and a superstructure. Except for the isolation system, all structural elements are assumed to be elastic during seismic excitation.
The dynamic equation of motion for the superstructure (i.e., above the mid-story isolator) for proposed MSCSS under seismic excitation can be expressed as:
M T P S X ¨ T + C T P S X ˙ T + K T P S X T = Γ T P S X ¨ g
where Γ T P S = d i a g   [ M T P S ] is the mass vector of the superstructure and X T = [   [ X p ] , [ X s ] ] T with (n − 1) +(n − 1) (nz + 1) variables is the lateral deformation vector of the superstructure relative to mid-story isolator, and X p = [ X p 2 , X p 3 , ,   X p n ] T with (n − 1) variables, X s = [   [ X s 1 ] ,     [ X s 2 ] , ,     [ X s ( n 1 ) ] ] T with (n − 1) (nz + 1) variables, X s i = [ ( X i , 1 + X S W i , 1 ) ,   ( X i , 2 + X S W i , 2 ) , , ( X i , j + X S W i , j ) , ,   ( X i , n z + X S W i , n z ) , X l i ] T with (nz + 1) variables are lateral deformation vectors of mega-structure, substructure, and ith substructure, respectively. Xli is the relative lateral deformation of LRB, which is placed over additional column, and X S W i , j is the relative lateral deformation of infill panels of shear wall presents at jth floor of ith substructure, n is total number of mega-structure stories, and nz is total number of stories in each substructure.
  • The mass matrix MTPS in Equation (1) can be expressed as:
    M T P S = [ M P 0 0 M s ] ,   M p = d i a g     [ m p 2 , m p 3 , . . , m p n ] M s = d i a g     [ m s 1 , m s 2 , . , m i ( n 1 ) ] M s i = d i a g     [ ( m i 1 + m S W i 1 ) , ( m i 2 + m S W i 2 ) , . , ( m i n z + m S W i n z ) , m l i ]
    where MP, Ms, and Msi are diagonal mass matrices of super mega-structure, substructures, and ith substructure, respectively. Mass of shear wall infill panels at the at jth floor of ith substructure is represented by m S W i , j .
  • The damping matrix CTPS of the superstructure in Equation (1) can be expressed as:
    C T P S = [ C P A C c C c T C s ] ,   C s = d i a g     [ C s , 1 ,   C s , 2 , . . , C s ( n 1 ) ] C P A = C P + d i a g     [ C i + 1 , 1 + C l i + a d C i , 1 + a d C i , 2 ] f o r   C p A ,   i = 1 , 2 , 3 . , ( n 1 )   a n d   C n , 1 = 0
    where Cp and Cs are damping matrices of the super mega-structure and substructures. The [(n − 1)] × [(n − 1) (nz + 1)] matrix Cc in Equation (3) is the coupling damping matrix between the super mega-structure and substructures. Cli is damping coefficient of LRB placed over additional column of ith substructure and adCi is damping coefficient of additional column of ith substructure. It can be expressed as:
    C c i , ( i 1 ) n z + 1 + n z + 1 = C l i C c i , ( i 1 ) n z + 1 + n z = a d C i , 1 C c i , ( i 1 ) n z + 1 + n z 1 = a d C i , 2   i = 1 , 2 , 3 , , ( n 1 ) C c i , i n z + 1 + 1 = C i + 1 , 1   i = 1 , 2 , 3 , ( n 2 ) C c ( r e s t ) = 0
  • The stiffness matrix KTPS of the superstructure in Equation (1) can be expressed as:
    K T P S = [ K P A K c K c T K s ] ,   K s = d i a g     [ K s , 1 ,   K s , 2 , . . , K s ( n 1 ) ] K P A = K P + d i a g     [ K i , 1 + K l , i 1 ] f o r   K p A ,   i = 2 , 3 , . , n   a n d   K n , 1 = 0
    where Kp and Ks are stiffness matrices of the super mega-structure and substructures. The [(n − 1)] × [(n − 1) (nz + 1)] matrix Kc in Equation (5) is the coupling damping matrix between the super mega-structure and substructures. It can be expressed as:
    K c [ i , ( i 1 ) ( n z + 1 ) + ( n z + 1 ) ] = K l i }   i = 1 , 2 , . , ( n 1 ) K c [ i , i ( n z + 1 ) + 1 ] = K i + 1 , 1 }   i = 1 , 2 , 3 . . , ( n 2 ) K c ( r e s t ) = 0
Appendix A contains details on the assemblies for matrices CTPS and KTPS.
The dynamic equation of motion for the mid story isolator for proposed MSCSS under seismic excitation can be expressed as:
m l d s X ¨ lds + C l d s X ˙ lds + K l d s X l d s = Γ m X ¨ g { B } { X ¨ P 1 X ¨ lds X ¨ TPS }
where Xlds is the lateral displacement of mid-story isolator relative to the bottom face of the mid-story isolator and Γ m = I e M T P S I e T + m l d s .
{ B } = I e e [ I e M T P S I e T + m l d s 0 0 0 I e M T P S I e T 0 0 0 M T P S ] ,   C l d s = C l + C l d K l d s = K l + K l d m l d s = 1 2 m p 1 + m l
where Kls and Cld are the limit spring and limit damper for the top structural displacement, respectively. Ie is unit line vector and Iee from Equation (8) can be expressed as:
I e = [ 1 , 1 , . . , 1 ] ( n 1 ) + ( n 1 ) ( n z + 1 ) I e e = [ 1 , 1 , . . , 1 ] ( n + 1 ) + ( n 1 ) ( n z + 1 ) I e e = [ 1 , 1 , I e ]
The dynamic equation of motion for the substructure for proposed MSCSS under seismic excitation can be expressed as:
M s u b X ¨ p 1 + C p 1 X ˙ p 1 + K p 1 X p 1 = Γ b X ¨ g { A } { X ¨ P 1 X ¨ lds X ¨ TPS }
where X p 1 is the lateral displacement relative to the ground, K p 1 is bending stiffness, M s u b = 1 2 m p 1 , Γ b = I e M T P S I e T + m l d s + M s u b and {A} from the equation can be expressed as:
{ A } = I e e [ I e M T P S I e T + m l d s 0 0 0 I e M T P S I e T + m l d s 0 0 0 M T P S ]
The overall dynamic equation of motion for proposed MSCSS under seismic excitation can be expressed as:
M s u b 0 0 0 m l d s 0 0 0 M T P S X ¨ P 1 X ¨ lds X ¨ TPS + { A } { B } { 0 } X ¨ P 1 X ¨ lds X ¨ TPS + C p 1 0 0 0 C l d s 0 0 0 C T P S X ˙ P 1 X ˙ l d s X ˙ T P S + K p 1 0 0 0 K l d s 0 0 0 K T P S X P 1 X l d s X T P S = Γ b Γ m Γ T P S X ¨ g
As the co-ordinates X p 1 , X l d s ,   and   X T P S in above Equation (12) are respectively relative to different co-ordinate positions; therefore, a dynamic equation cannot resolve it. Hence, the transformed co-ordinates of each mass point relative to the base ground and can be expressed as:
Y l i = X l i + X l d s + X p 1 Y i , j = X i , j + X l d s + X p 1 For   Substructure i = 1 , 2 , , ( n 1 ) j = 1 , 2 , , n z Y P i = X P i + X l d s + X p 1 Y l d s = X l d s + X p 1 Y D 1 = X D 1 For   Mega   Structure
Hence, Equation (12) can be written as:
M sub 0 0 0 m l d s 0 0 0 M T P S + { A } { B } { 0 } R 1 Y ¨ P 1 Y ¨ lds Y ¨ TPS + C p 1 0 0 0 C l d s 0 0 0 C T P S R 1 Y ˙ P 1 Y ˙ l d s Y T P S + K p 1 0 0 0 K l d s 0 0 0 K T P S R 1 Y P 1 Y l d s Y T P S = Γ b Γ m Γ T P S X ¨ g
Appendix A contains details on matrix R.
The mass ratios and nominal frequencies [41] of the three-lumped-mass model are as follows:
r TPS = M TPS m lds ;   r bot = M bot m lds
ω TPS = K TPS M TPS ; ω bot = K P 1 M bot ; ω sub * = K P 1 M bot + M TPS + m lds ; ω lds = k lds m lds
After applying the classic damping assumption, the damping ratios of the superstructure, bottom structure, and isolation system, the first modal damping ratio, and the first modal participation mass ratio can be written as follows:
ζ TPS = C TPS 2 M TPS ω TPS ; ζ bot = C P 1 2 ω bot * ( M bot + M TPS + m lds ) ; ζ lds = C lds 2 ω lds ( M TPS + m lds )
ζ 1 = ζ lds ( 1 + 2 ( 1 + r TPS ) r bot ( ω lds ω bot ) 2 + 2 r TPS 1 + r TPS ( ω lds ω TPS ) 2 )
L 1 = r bot + 2 r bot + r TPS + 1 ω lds ω bot 2 + 2 r TPS r bot 1 + r TPS ω lds ω TPS 2 1 + r bot + r TPS r bot 1 + r TPS + 2 ω lds ω bot 2 + 2 r TPS r bot 1 + r TPS 2 ω lds ω TPS 2 α
From Equation (18), if the effective lateral stiffness is much smaller than the elastic lateral stiffnesses of the superstructure and bottom structure, then the first modal damping ratio will approach the first modal damping ratio of the isolation system. The relationship between the superstructure and bottom structure frequency is as follows [42,43]:
ω bot = ω TPS 1 + r TPS
From Equation (20), the higher-order modal coupling is independent of the isolation frequency, which means that higher-order modal coupling will be prevented in the mid-story isolation system.

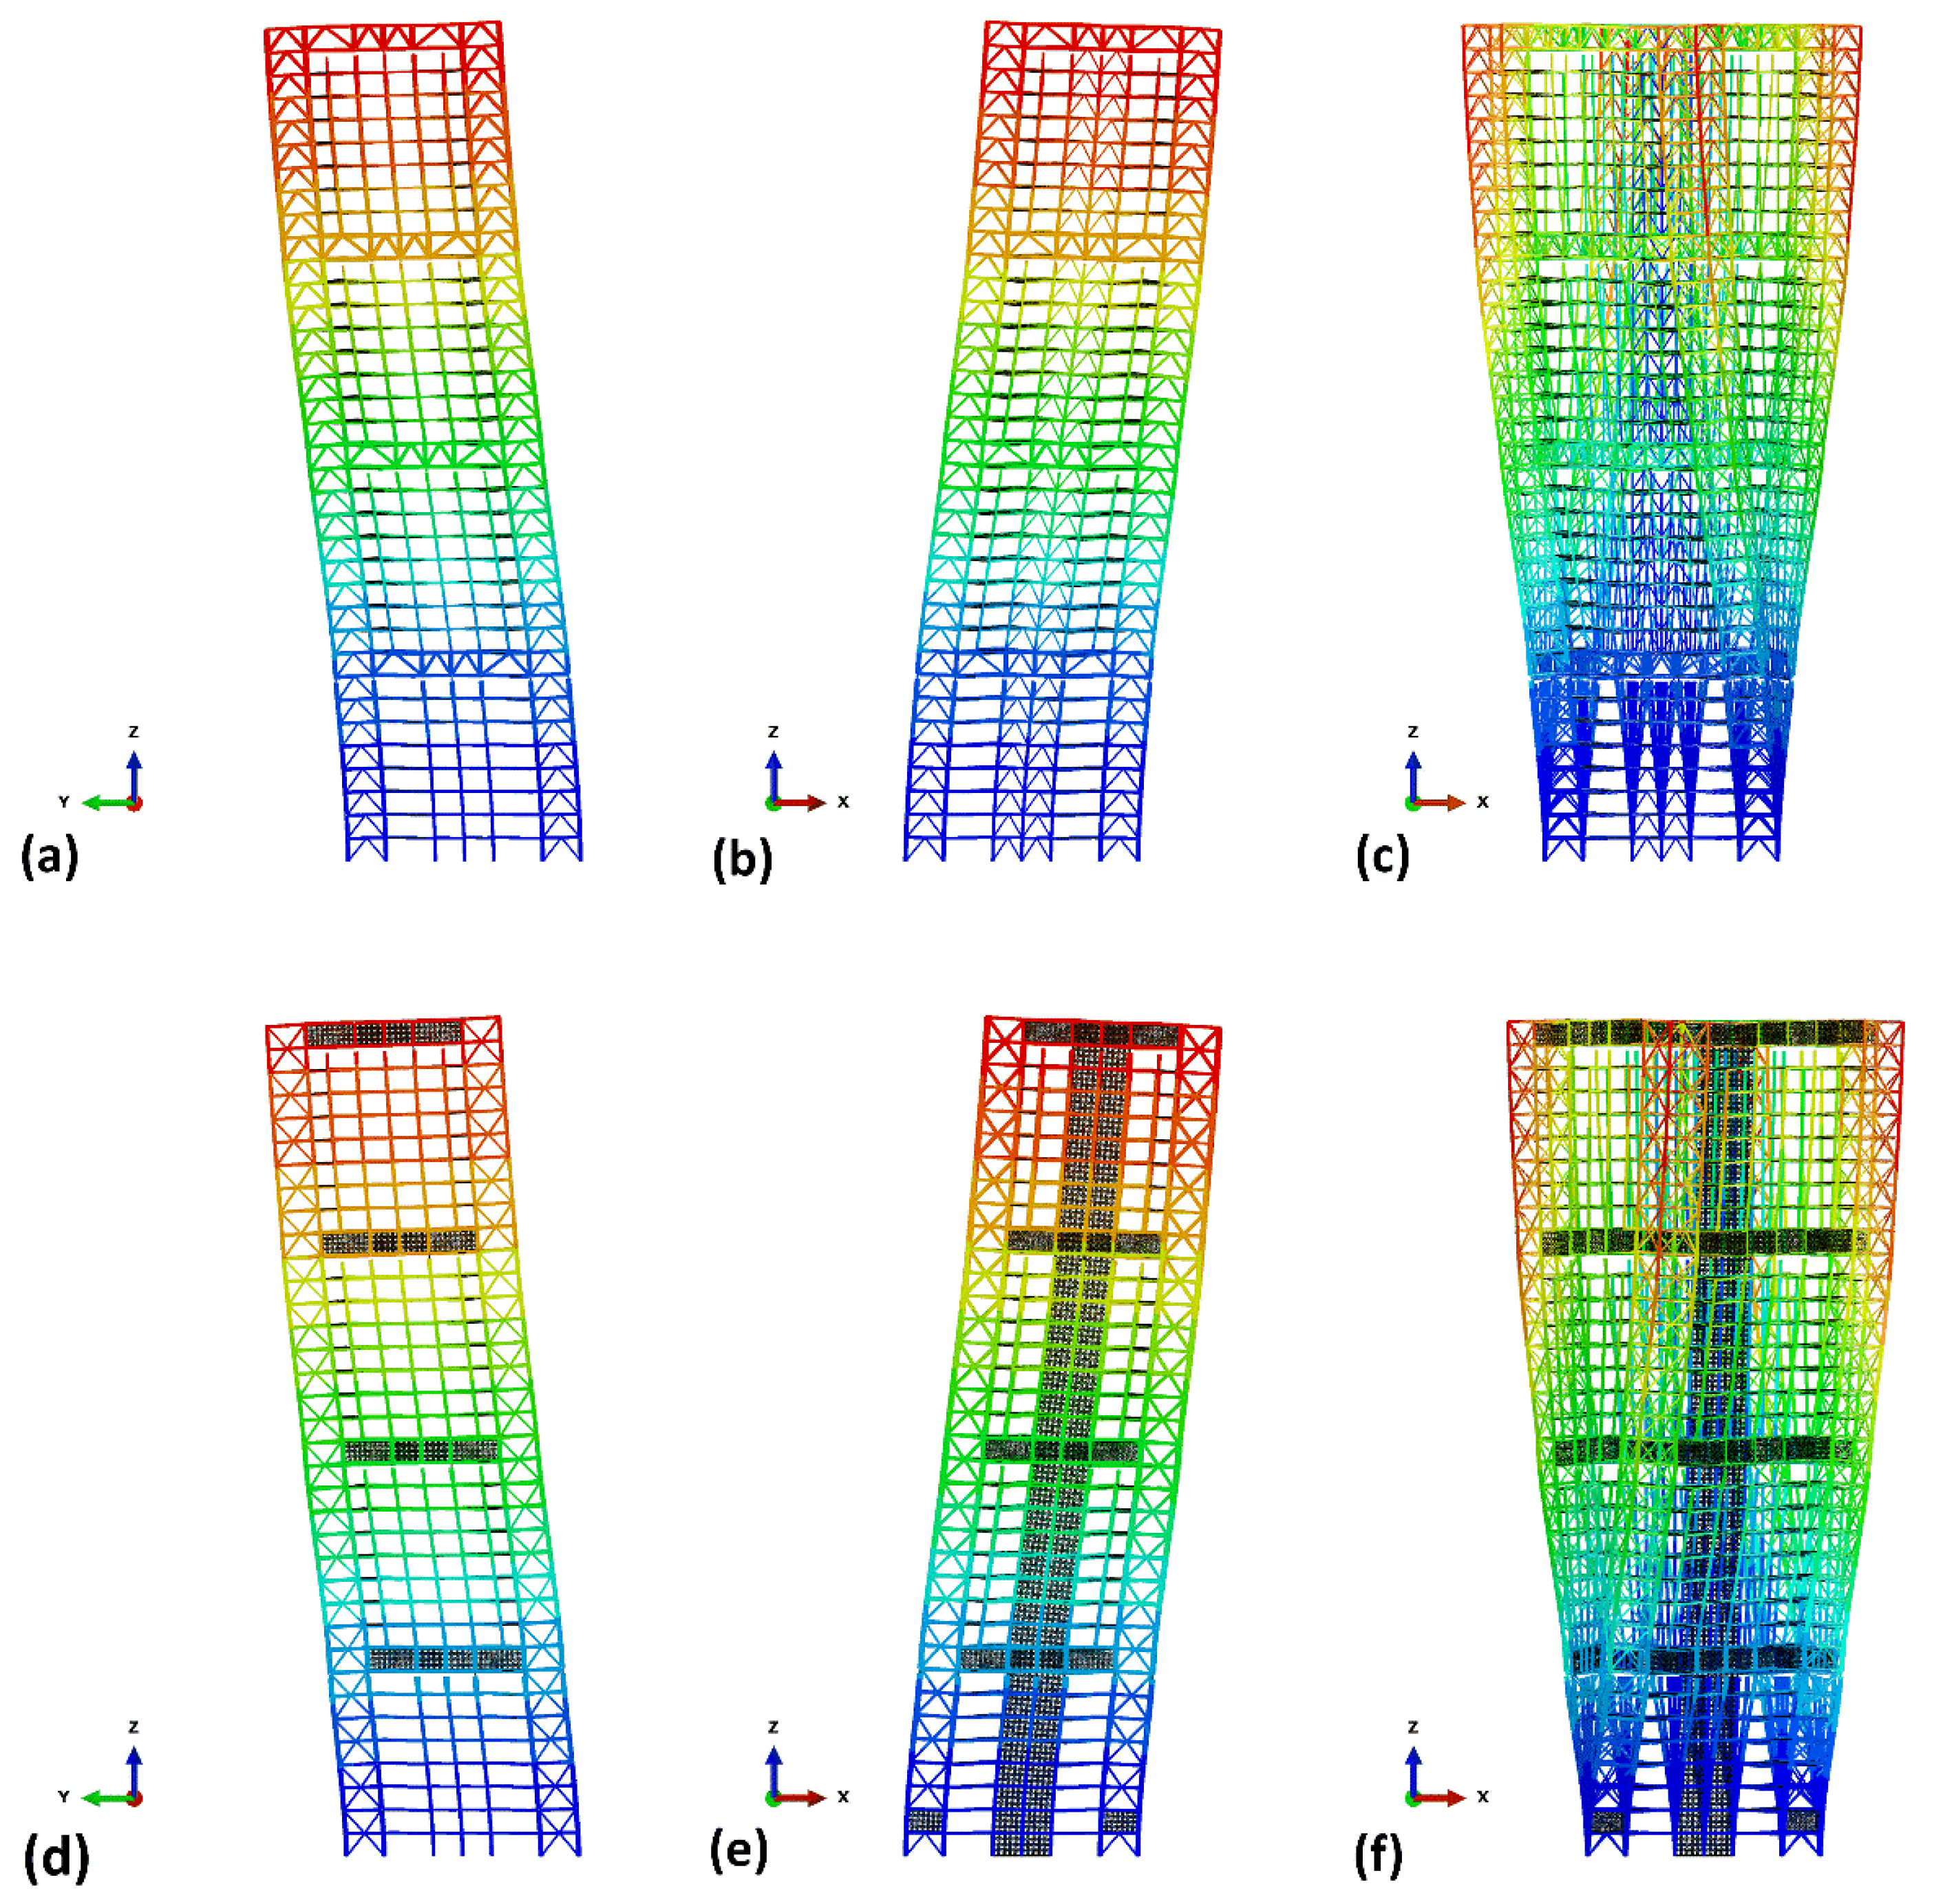
4.1. Development of the Finite Element Model

To investigate the structural control response for different configurations of the MSCSS under robust seismic excitations, finite element models are used. The traditional MSS, used in the Bank of China in Hong Kong and the Tokyo Metropolitan Government Building, is selected as the base design for different configurations of the MSCSS. The structural height of the MSCSS configuration is 144 m with a width of 40 m. A total of four mega-frames are present in the structure, and each mega-frame has its own eight-story substructure with a 4 m story height.
ABAQUS is used for preparing and analyzing the finite element models. The whole structure is created with deformable wire, except for floors, and SPSW infill panels in a 3D modeling space. Deformable shells are used to construct the floors and infill panels. It is possible to stretch and bend axially and biaxially on a three-node quadratic beam in space (B32). The finite element models used in this study do not use a fish plate for connecting infill panels with boundary members because this approximation had a negligible effect [44] on the results. The eight nodes in shell element S8R5 are used to model the infill panels and floors, with five degrees of freedom (DoFs) per node, and hourglass control has greatly increased convergence. Because of the independence between rotational and translational DoFs, the model includes rotation about the out-of-plane axis. As a result, transverse shear deformation is considered along the cross-section.
Infill panels are assigned to the material properties of ASTM A36 steel, section members are ASTM A992 grade 50 steel, and floor slabs are assigned to the material properties of concrete class C30. These materials are modeled to exhibit isotropic elastoplastic behavior with high-level strain reversal because of the Bauschinger effect of kinematic hardening during cyclic loading. In the analysis, the dynamic explicit solver based on central differences over the dynamic implicit solution is preferred and utilized.

4.2. Reasons for the Preference of the Dynamic Explicit Solver

For the following reasons, the dynamic explicit solver is preferred over the dynamic implicit solver.
(a)
Calculations for stress wave propagation are more accurate when using the dynamic explicit solver.
(b)
In the dynamic implicit, the time and computational costs exponentially increase with the number of DOFs.
(c)
Although the central difference method becomes unstable if Δ t   T n π , it is preferable to take Δ t   T n 10 . For this reason, very small time increments are taken to attain the desired precision.
With small time increments in the dynamic explicit solver, seismic loads are modeled more precisely, and convergence is easier.

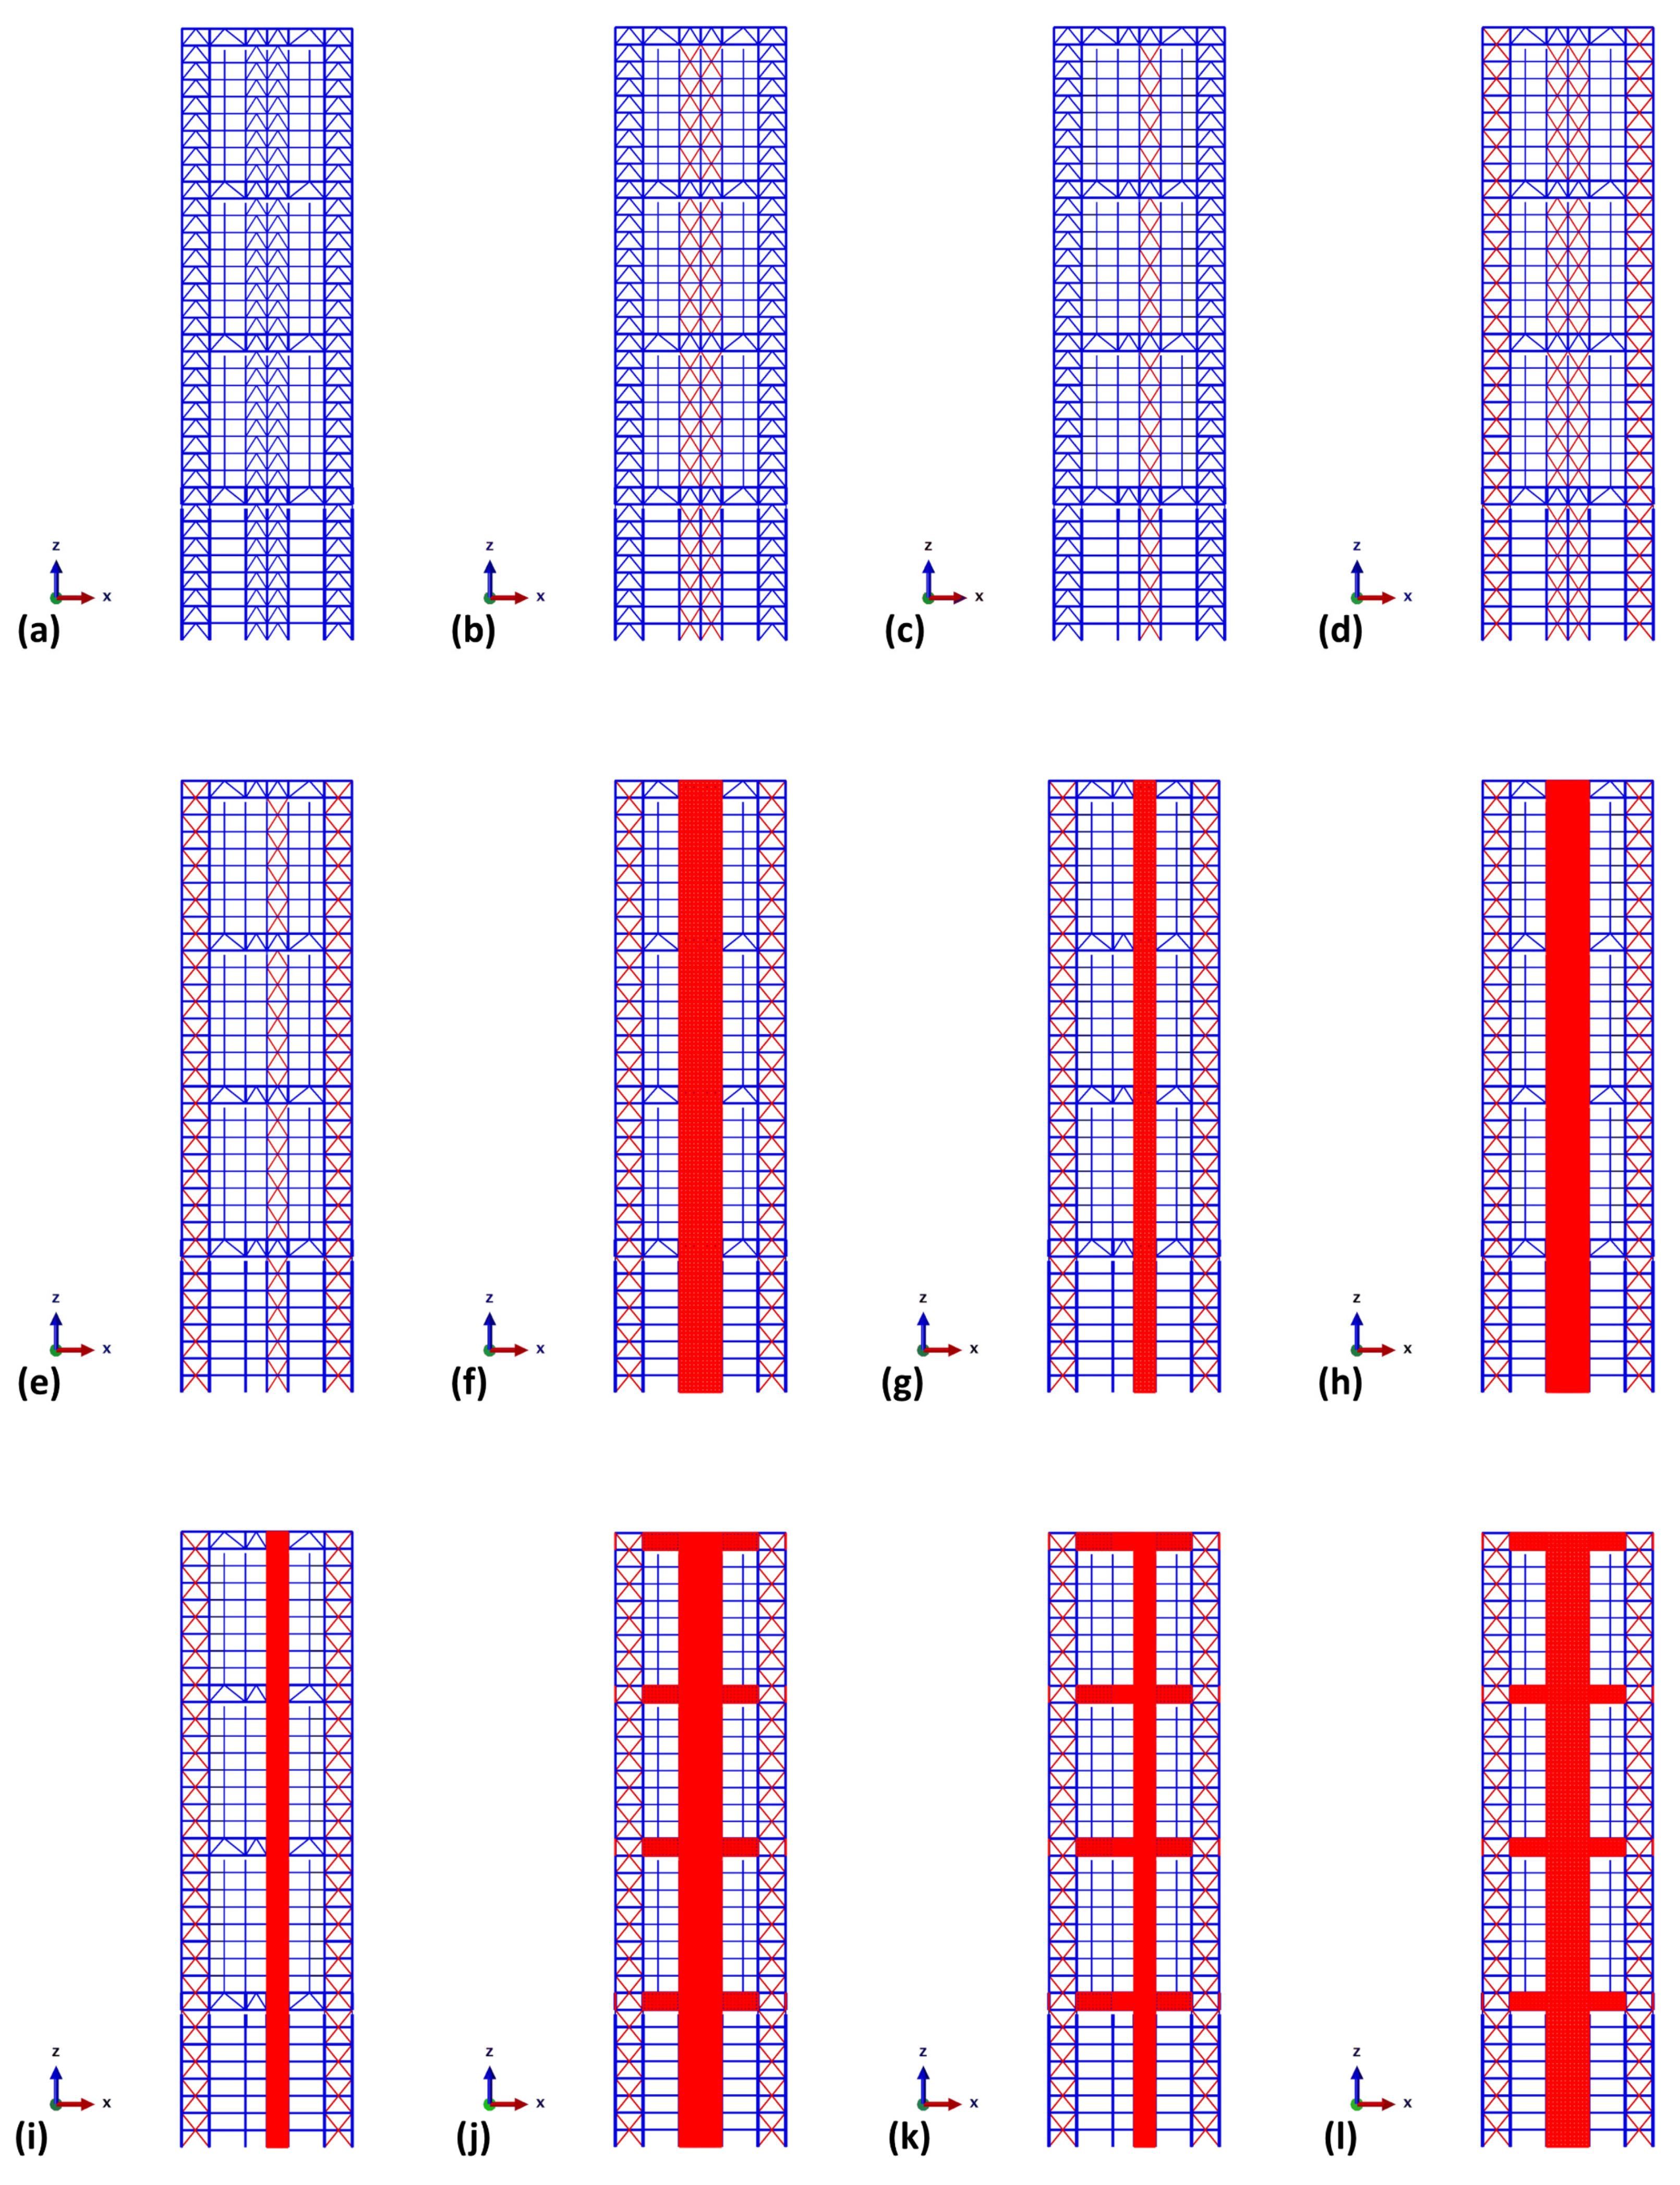
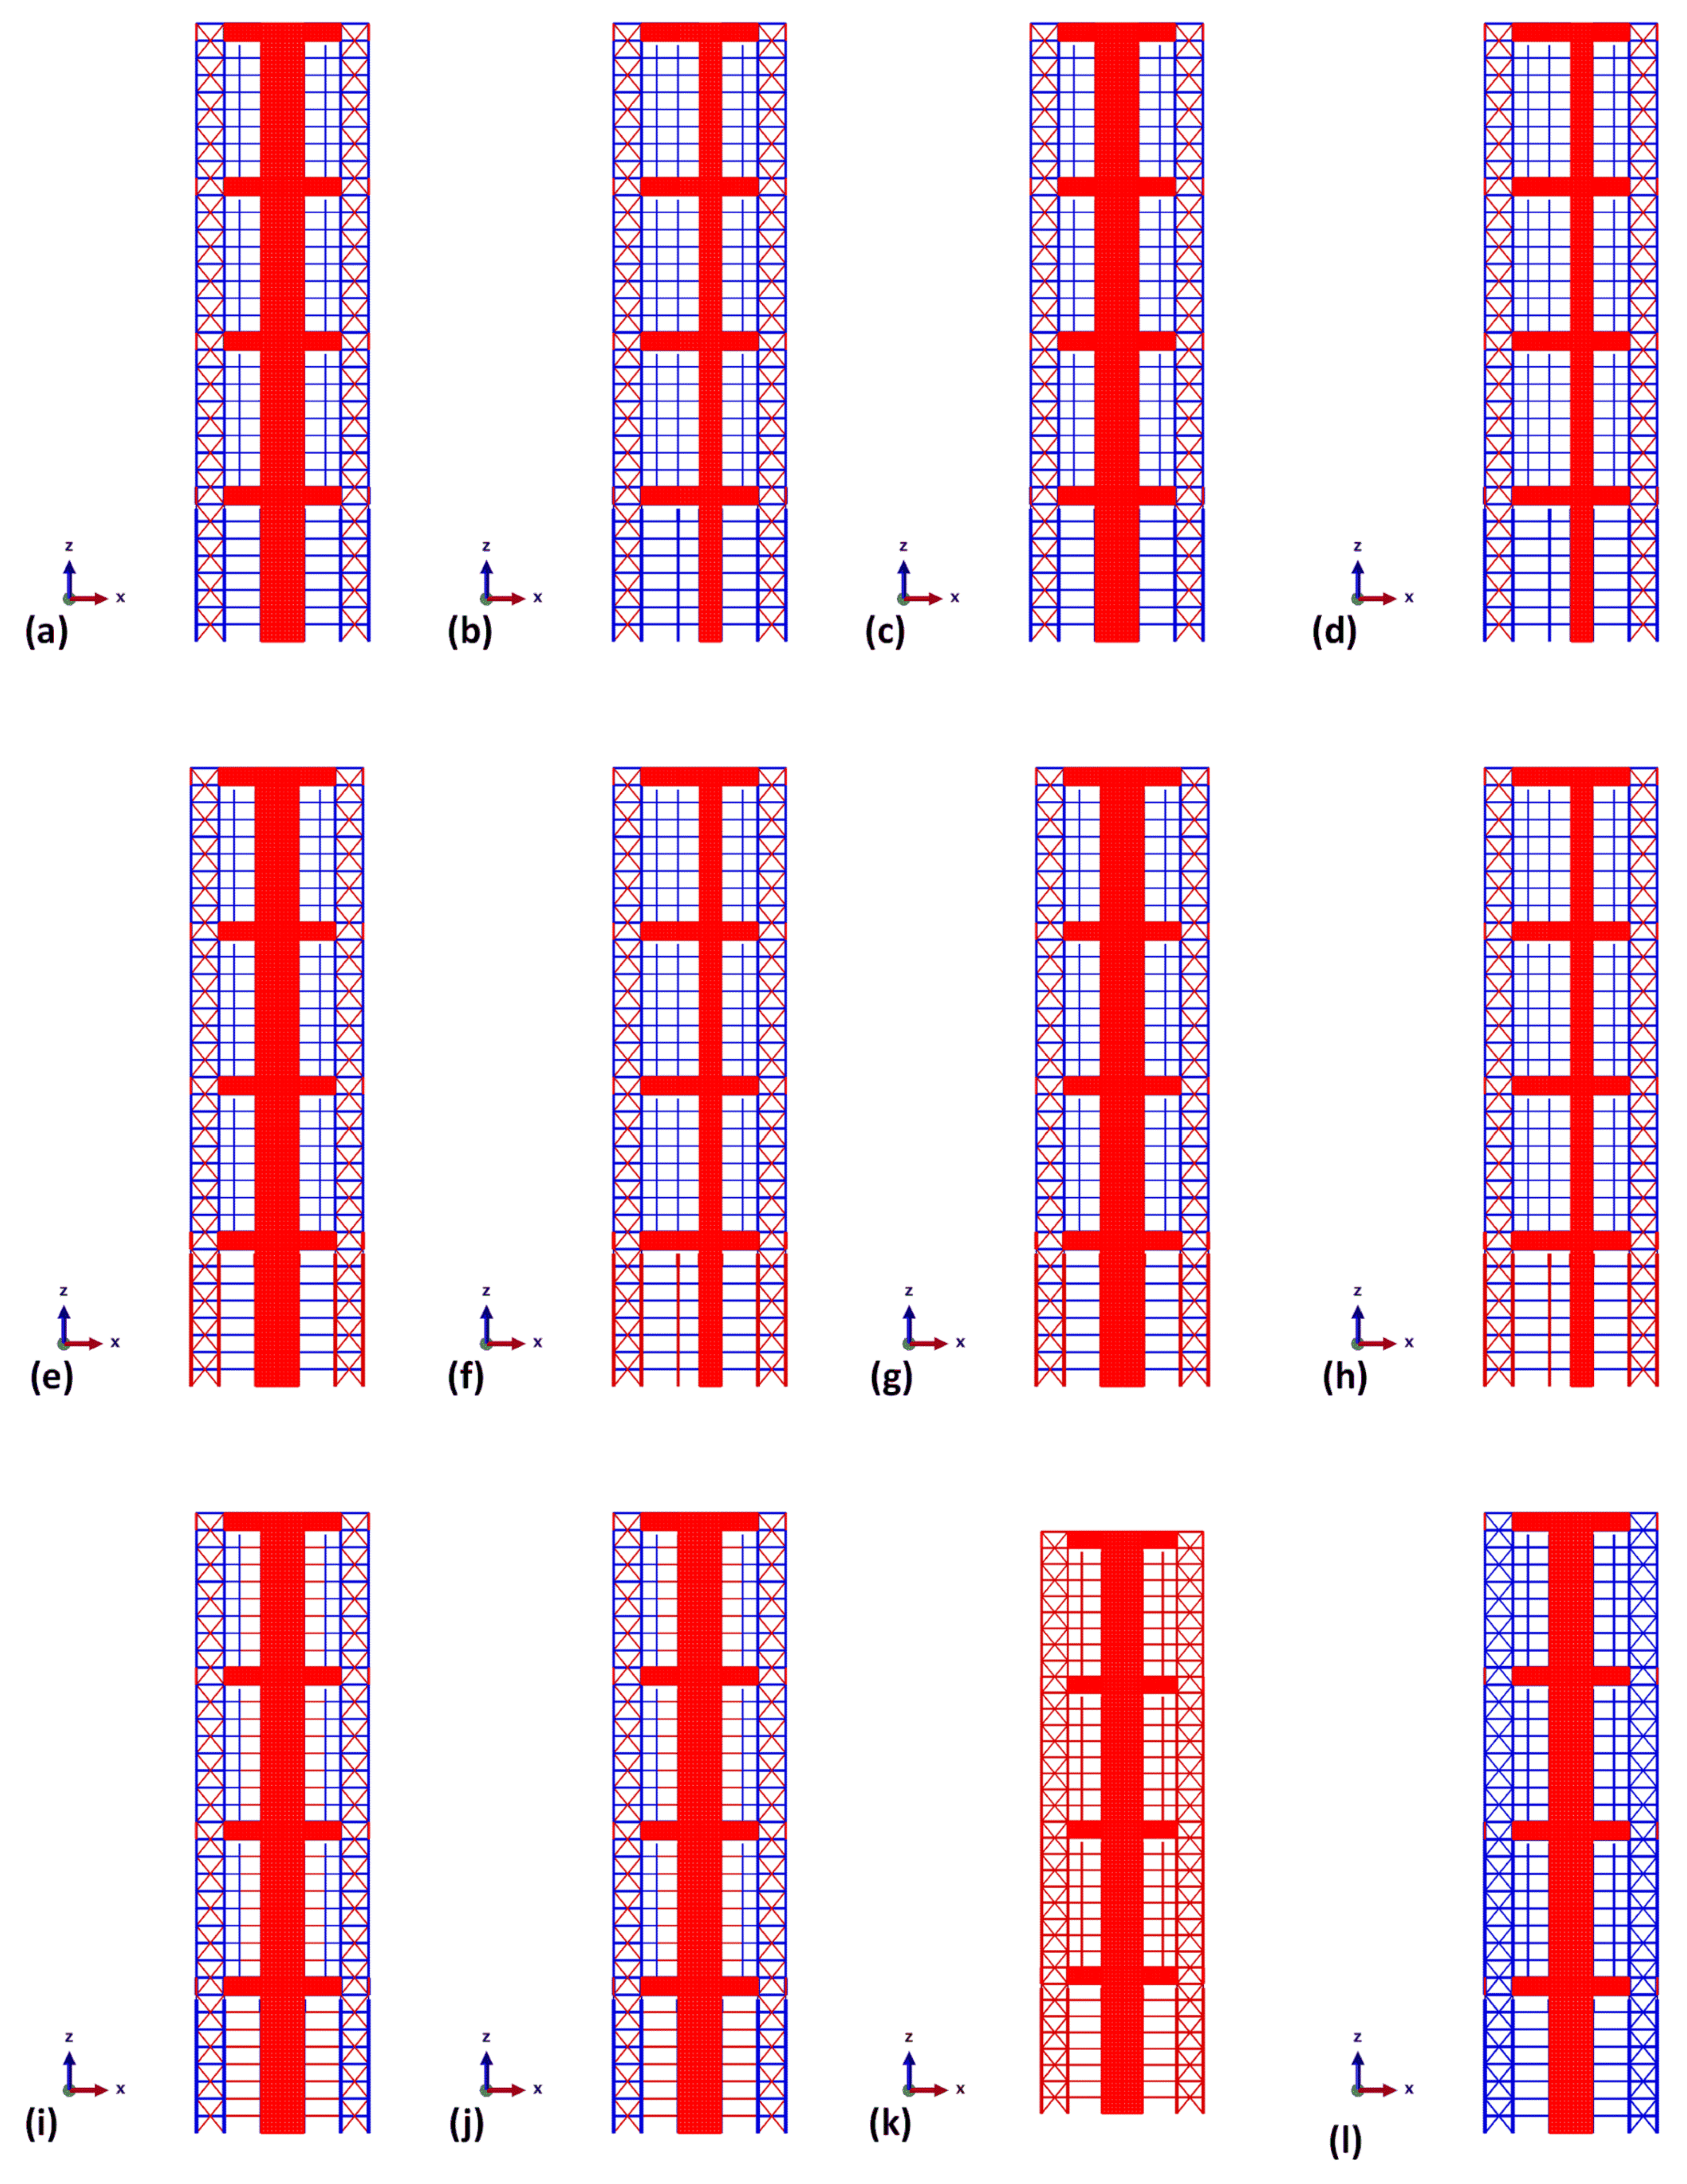
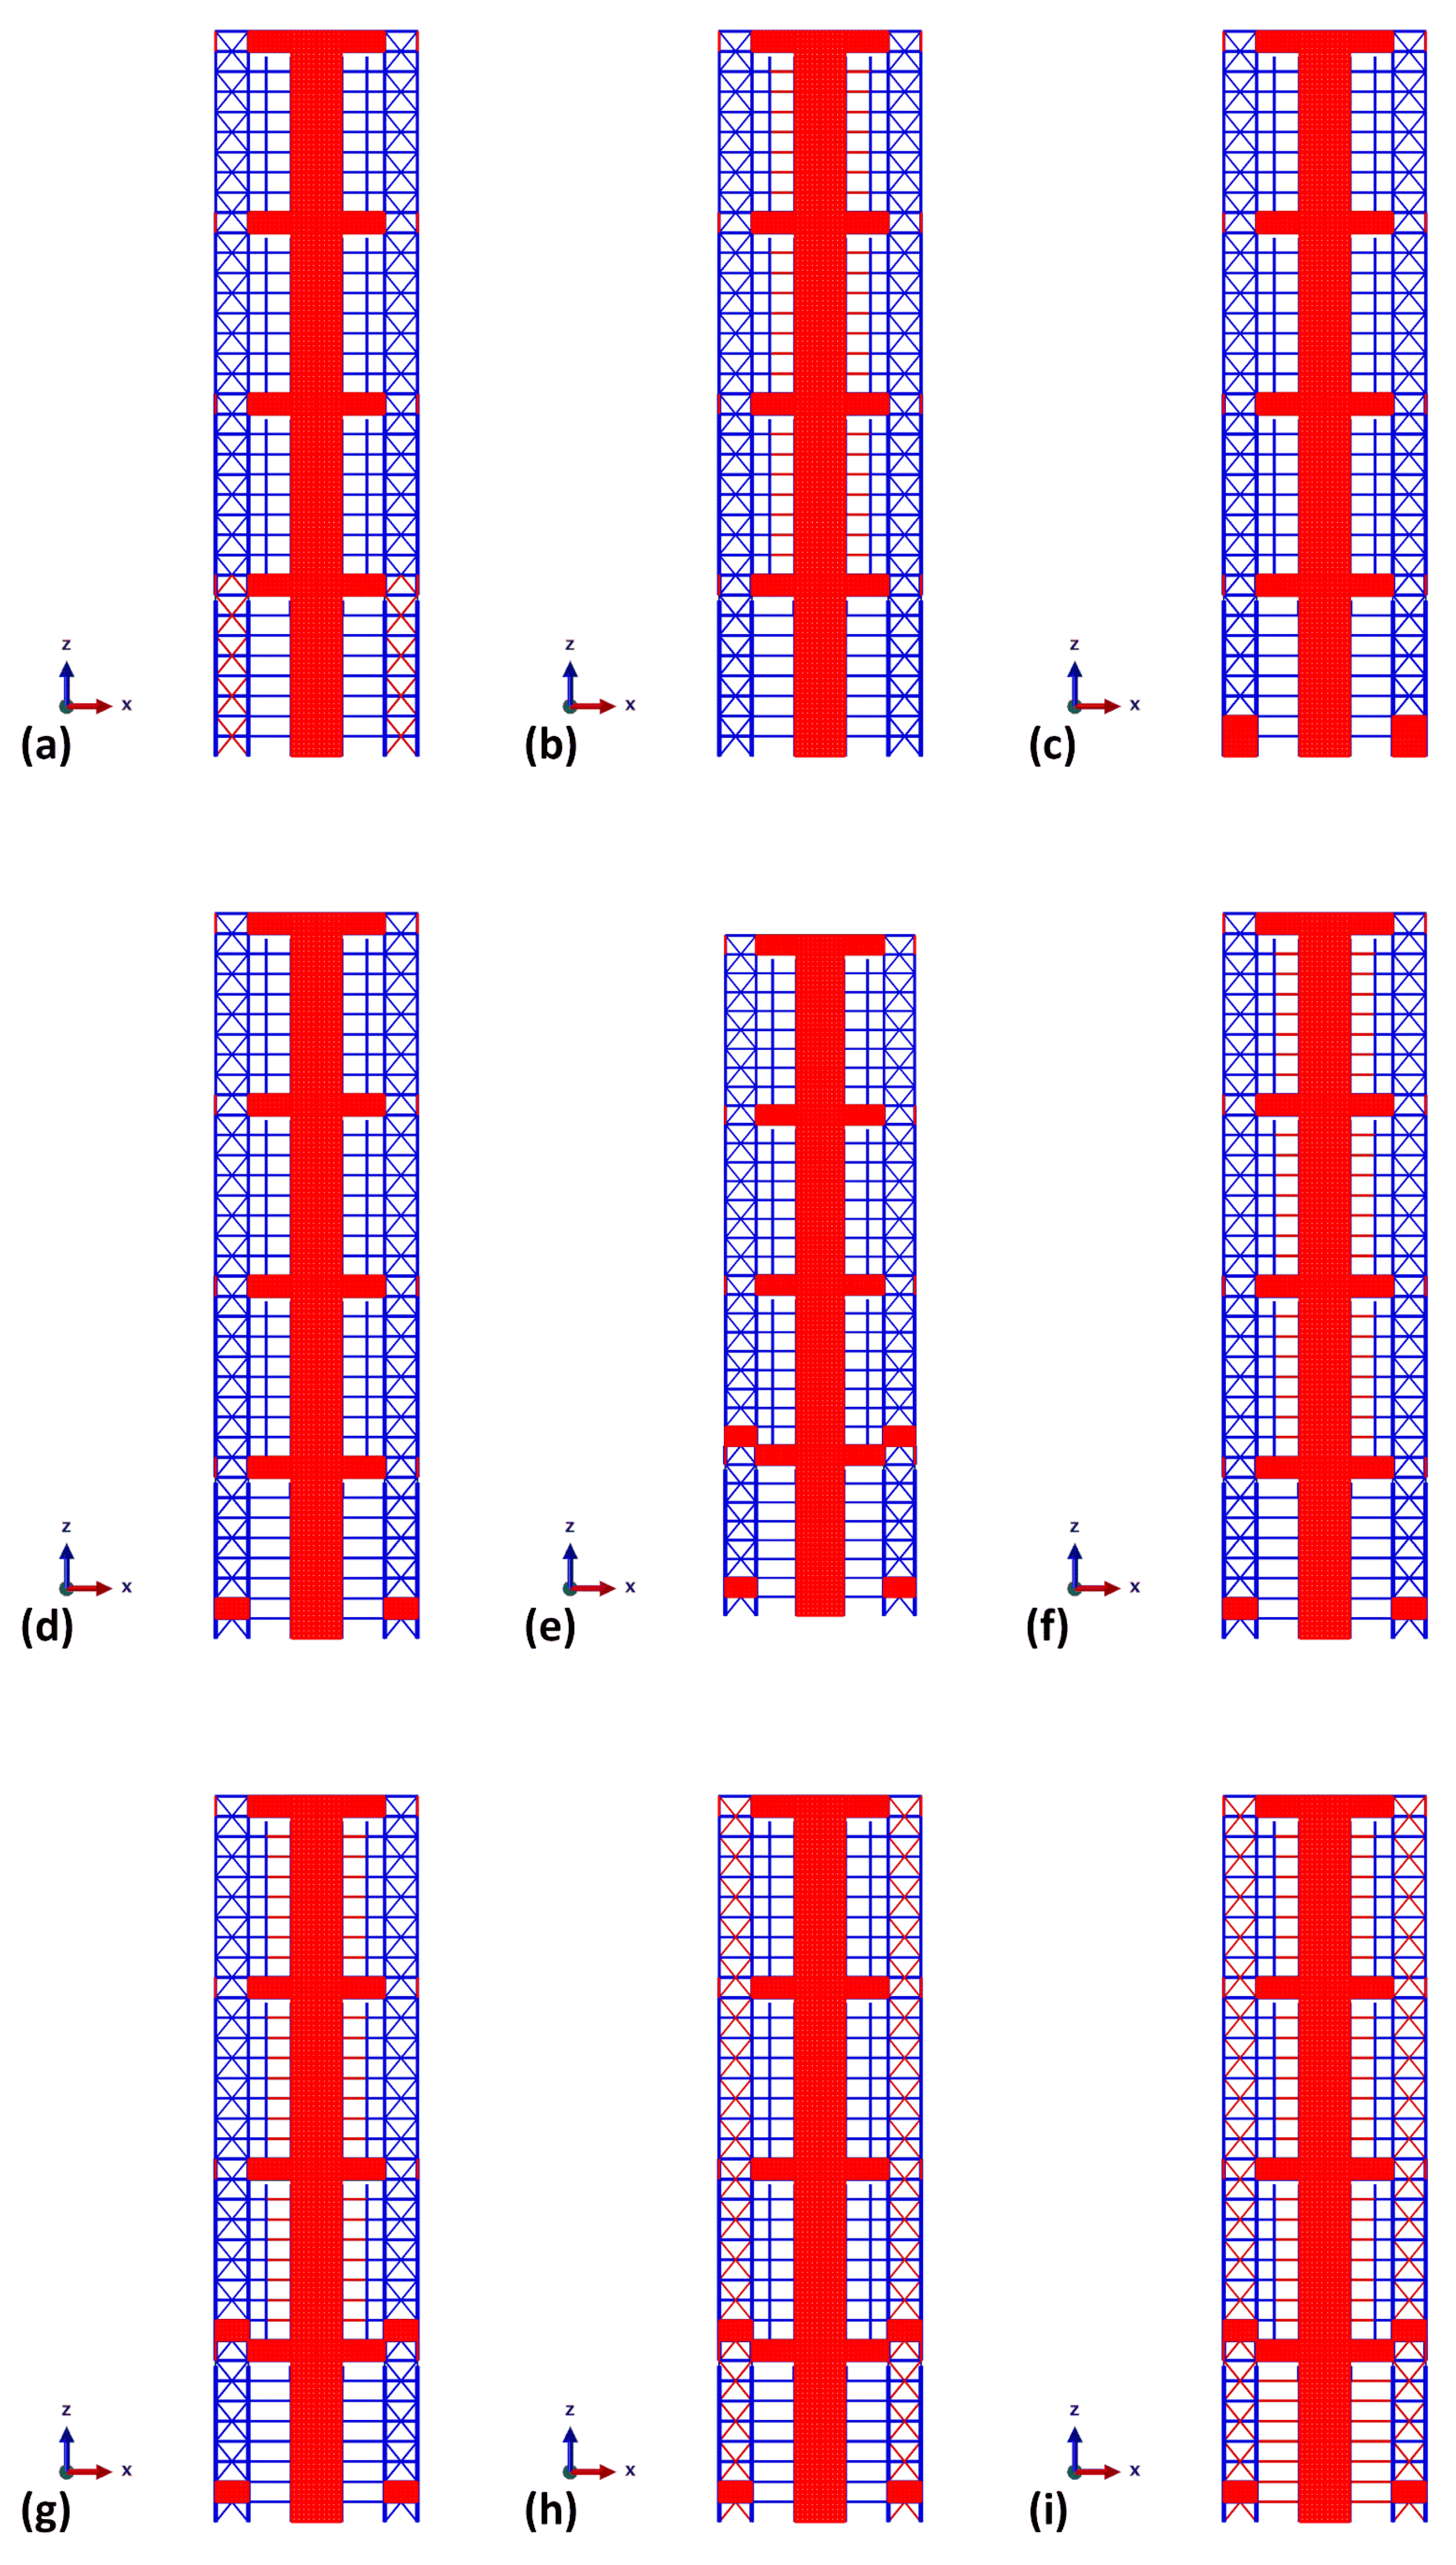
4.3. MSCSS Configurations

In this paper, 33 different MSCSS configurations are used to investigate the structural response under seismic vibrations to propose the optimal design for an improved MSCSS. An improved optimal design will enhance structural stability, especially under plastic deformation, and reduce the seismic structural response. The summarized details of these configurations are as follows.
i. 
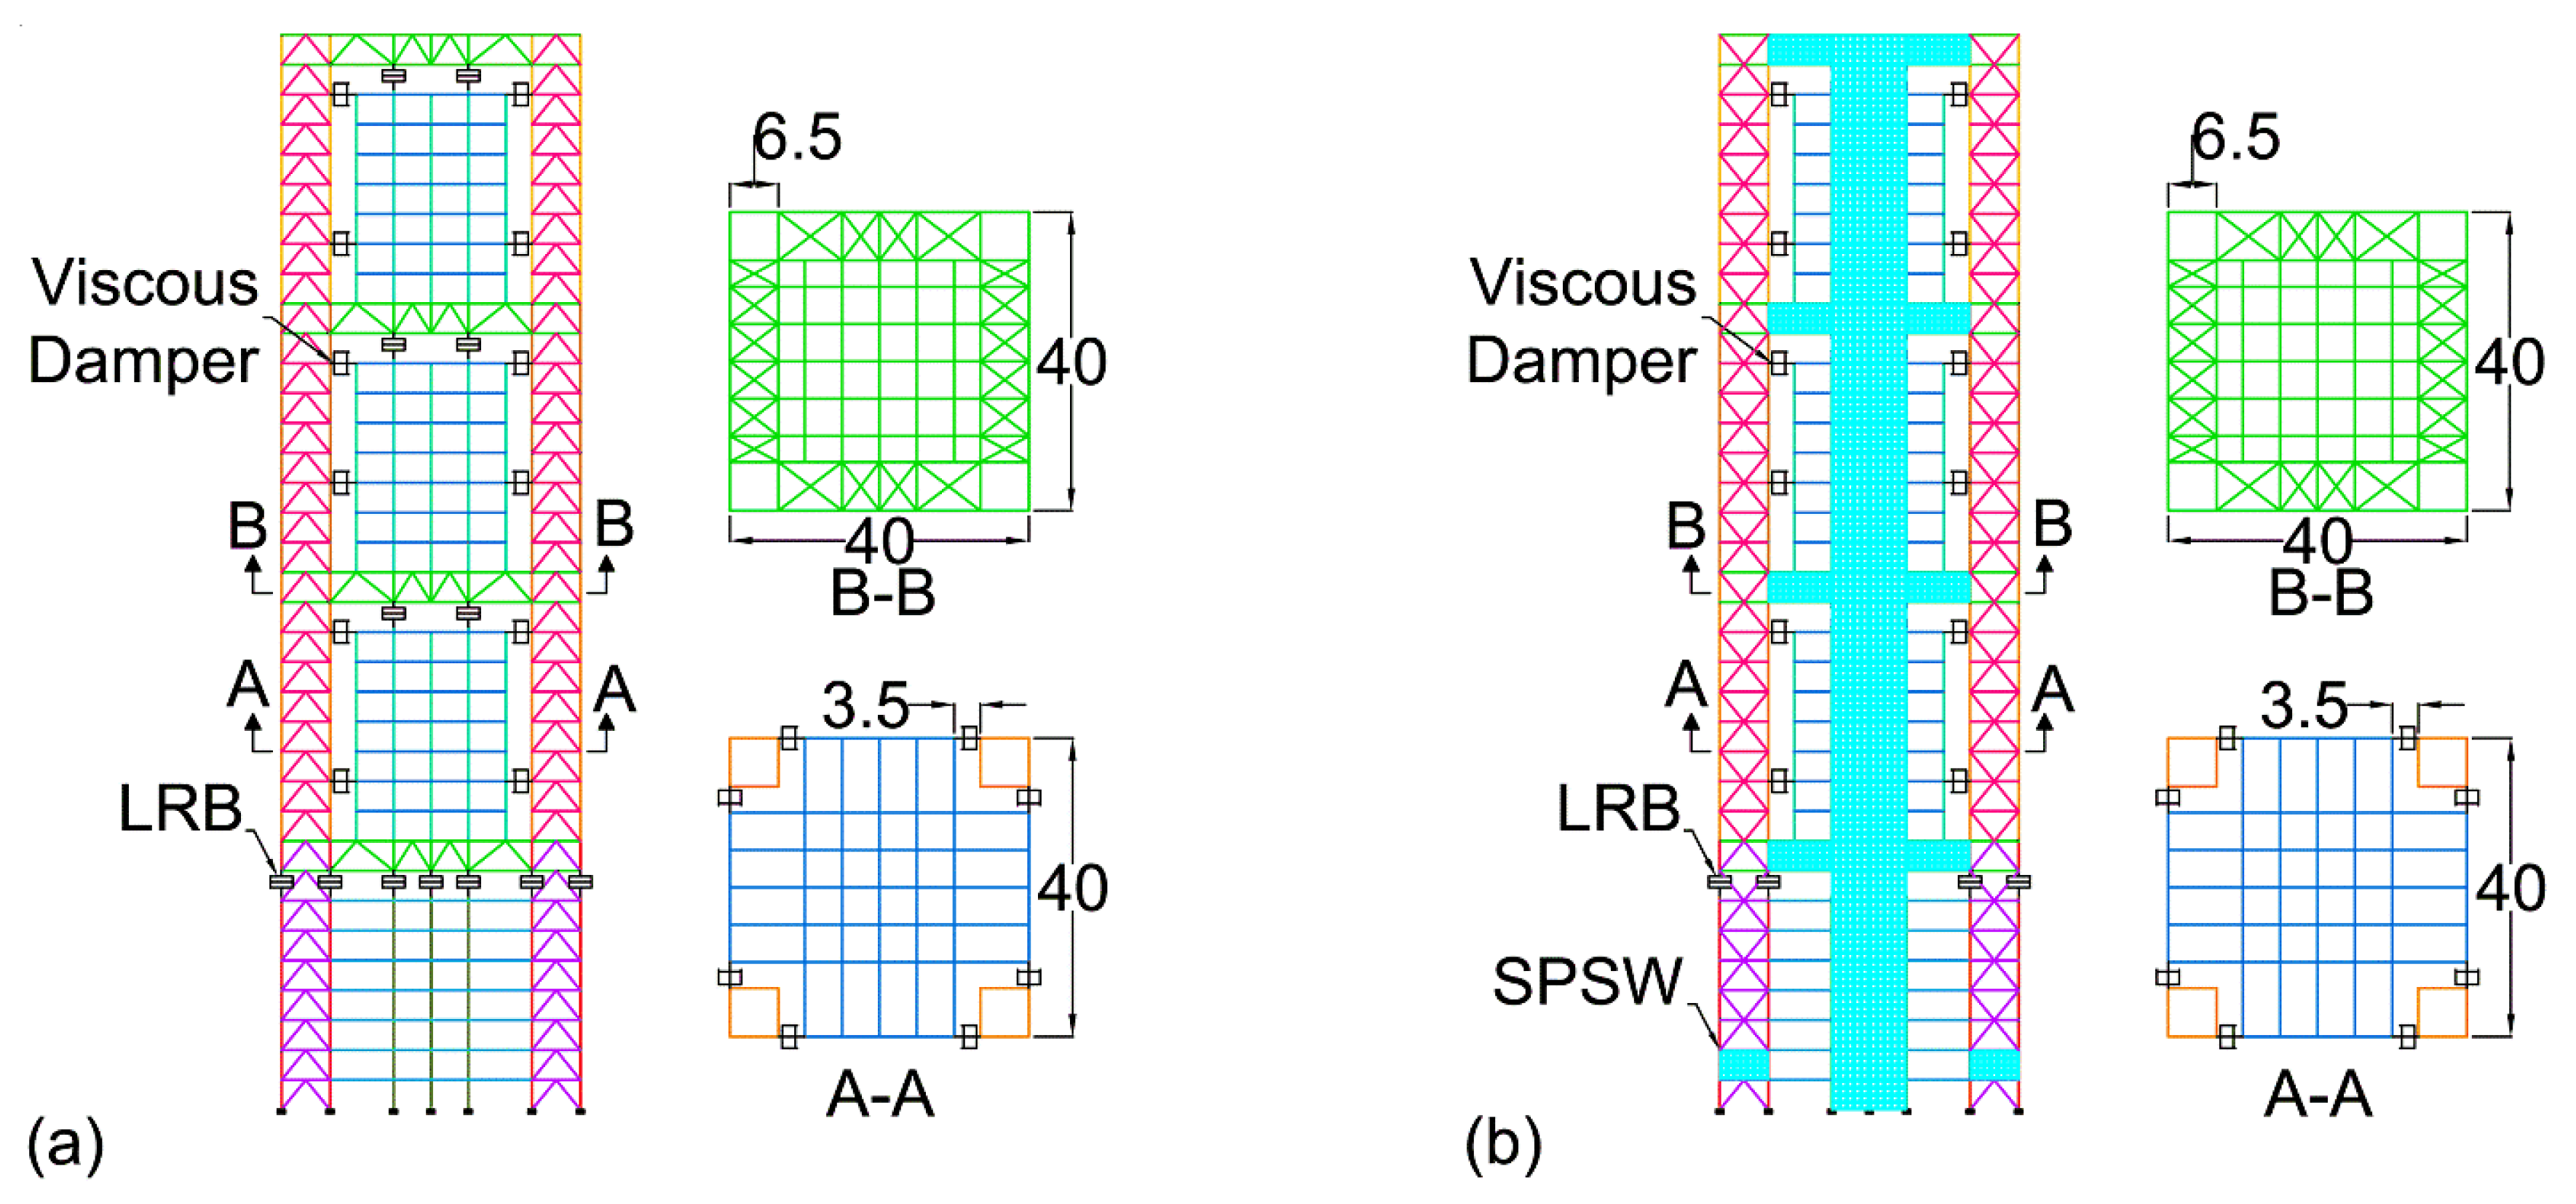
Configuration 1 which was proposed by Muhammad et al. [21], is an improved configuration initially proposed by Abdulhadi et al. [16]. This configuration has 49 lead rubber bearings beneath the first mega-beam and inverted V-bracing (Chevron) in the middle of the structure across its whole height. This Chevron bracing is present at 15 m to 25 m in the X-axis and 20 m in the Y-axis.
ii. 
Configuration 2 is the same as configuration 1, but Chevron bracing is replaced by X-bracing.
iii. 
Configuration 3 is the same as configuration 2, but the X-bracing location is changed from configuration 2; that is, X-bracing is present at 20 m to 25 m in both the X and Y axes.
iv. 
Configuration 4 is the same as configuration 2, but X-bracing is also used between the mega-columns, which have also been previously used for Chevron bracing.
v. 
Configuration 5 is the same as configuration 3, but X-bracing is also used between mega-columns, which were before also Chevron bracing.
vi. 
Configuration 6 is the same as configuration 4, but the X-bracing, which is used in the center of the structure, is replaced by ring-shaped infill panels of the SPSW. Table 2 shows the dimensions of the ring-shaped infill panels, and Figure 4 shows the layout of the ring-shaped infill panel.
vii. 
Configuration 7 is the same as configuration 5, but the X-bracing, which is used in the center of the structure, is replaced by ring-shaped infill panels of the SPSW. The dimensions of the ring-shaped infill panels are the same as those in configuration 6.
viii. 
Configuration 8 is the same as configuration 4, but the X-bracing, which is used in the center of the structure, is replaced by unstiffened infill panels of the SPSW with a thickness of 6 mm.
ix. 
Configuration 9 is the same as configuration 5, but the X-bracing, which is used in the center of the structure, is replaced by unstiffened infill panels of the SPSW with a thickness of 6 mm.
x. 
Configuration 10 is the same as configuration 8 along with steel infill panels. This configuration replaces mega-beam bracings.
xi. 
Configuration 11 is the same as configuration 9 along with steel infill panels. This configuration replaces mega-beam bracings.
xii. 
Configuration 12 is the same as configuration 6 except for the addition of steel infill panels. Mega-beam bracings are replaced by infill panels in this configuration. Appendix B Table A1 shows the dimensions of the ring-shaped infill panels.
xiii. 
Configuration 13 is the same as configuration 12, but the infill panel’s thickness is revised to 5 mm.
xiv. 
Configuration 14 is the same as configuration 7 along with steel infill panels. This configuration replaces mega-beam bracings. The dimensions of the ring-shaped infill panels are the same as those in configuration 12.
xv. 
Configurations 15 and 16 are identical to configurations 12 and 14, respectively, but the steel infill panel properties have changed, as shown in Table A2 of Appendix B.
xvi. 
Configurations 17 and 18 are identical to configurations 15 and 16, respectively, but the dimensions of ring-shaped infill panels are shown in Table A1 of Appendix B, and mega-column 1 (MC1) and substructure column 1 (SSC1) are revised, with details shown in Table A3 of Appendix B.
xvii. 
Configurations 19 and 20 are the same as configurations 17 and 18, respectively, but the thickness of the infill panels of the SPSW is increased from 6 mm to 8 mm.
xvii. 
Configuration 21 is identical to configuration 12, but the thickness of the SPSW infill panels has been increased from 6 mm to 10 mm. In addition, section members’ profiles have been updated, and Appendix B Table A4 illustrates the changes.
xix. 
Configuration 22 is the same as configuration 21, but the infill panel’s thickness is revised to 5 mm.
xx. 
Configuration 23 is the same as configuration 12, but the infill panel’s thickness is revised to 10 mm, and the section members are also modified, and Table A5 of Appendix B illustrates its details.
xxi. 
Configuration 24 is the same as configuration 12, but the infill panel’s thickness is revised to 8 mm, and the section members are also modified in configuration 23.
xxii. 
Configuration 25 is the same as configuration 24, but the bracing between the first substructure mega-columns (MC Bracing 1) and the first three mega-beams (MB 1~3) is revised, as illustrated in Table A6 of Appendix B.
xxiii. 
Configuration 26 is identical to configuration 24, but the lead rubber bearing (LRB) parameters and substructure beams (SB) of substructures 2 to 4 are revised, as shown in Appendix B Table A7 and Table A8.
xxiv. 
Configuration 27 is identical to configuration 24, except that the first three mega-beams (MB 1~3) are revised, and infill panels are added in the mega-column of the first substructures on floors 1 and 2. Appendix B Table A9 and Table A10 contain information on revised section members and infill panels.
xxv. 
Configuration 28 is the same as configuration 27, but the infill panels are only added in the mega-column of the first substructures on the second floor.
xxvi. 
Configuration 29 is identical to configuration 28, but infill panels are also added on the first floor of the second substructure at the mega-column (MC 2) above the first mega-beam (MB 1).
xxvii. 
Configuration 30 is the same as configuration 28, but the lead rubber bearing (LRB) parameters and substructure beams (SB) of substructures 2–4 have been revised, as shown in Appendix B Table A7 and Table A8. Table 3 lists the section members in detail.
xxviii. 
Configuration 31 is the same as configuration 29, but substructure beams (SB) of substructures 2–4 and LRB parameters are revised as shown in Appendix B Table A7 and Table A8.
xxix. 
Configuration 32 is the same as configuration 29, but the LRB parameters have been revised as shown in Appendix B Table A7. Furthermore, the bracing in mega-columns for the entire structure (MC Bracing 1 and 2~4) has been revised, as shown in Appendix B Table A11.
xxx. 
Configuration 33 is the same as configuration 32, but substructural beams (SB 1 and SB 2~4) of the entire structure are revised, and Appendix B Table A12 illustrates its details.
Figure A1, Figure A2 and Figure A3 in Appendix C show details about the configurations.
According to the modal analysis results, the maximum fundamental natural period for configurations 13 and 22 is 5.529 s. Both of these configurations have 5 mm thick infill panels, but configuration 30 is the most rigid and has the most structural stiffness because its natural period is 3.704 s, which is the minimum among the others. The natural vibration period of configuration 1 is 4.32 s, and Figure 5 depicts the first three modal shapes of configurations 1 and 30. Table 4 illustrates the fundamental natural period of all configurations in detail.

5. Comparative Analyses

For the parametric study, 32 different MSCSS configurations are used to evaluate the optimal configuration. The Nahanni time history is used in this section, as it is near-fault ground motion with high arias intensity; i.e., 3.9 ms−1 and configuration 1 are used as the base case. The following observations are made after nonlinear dynamic analyses.

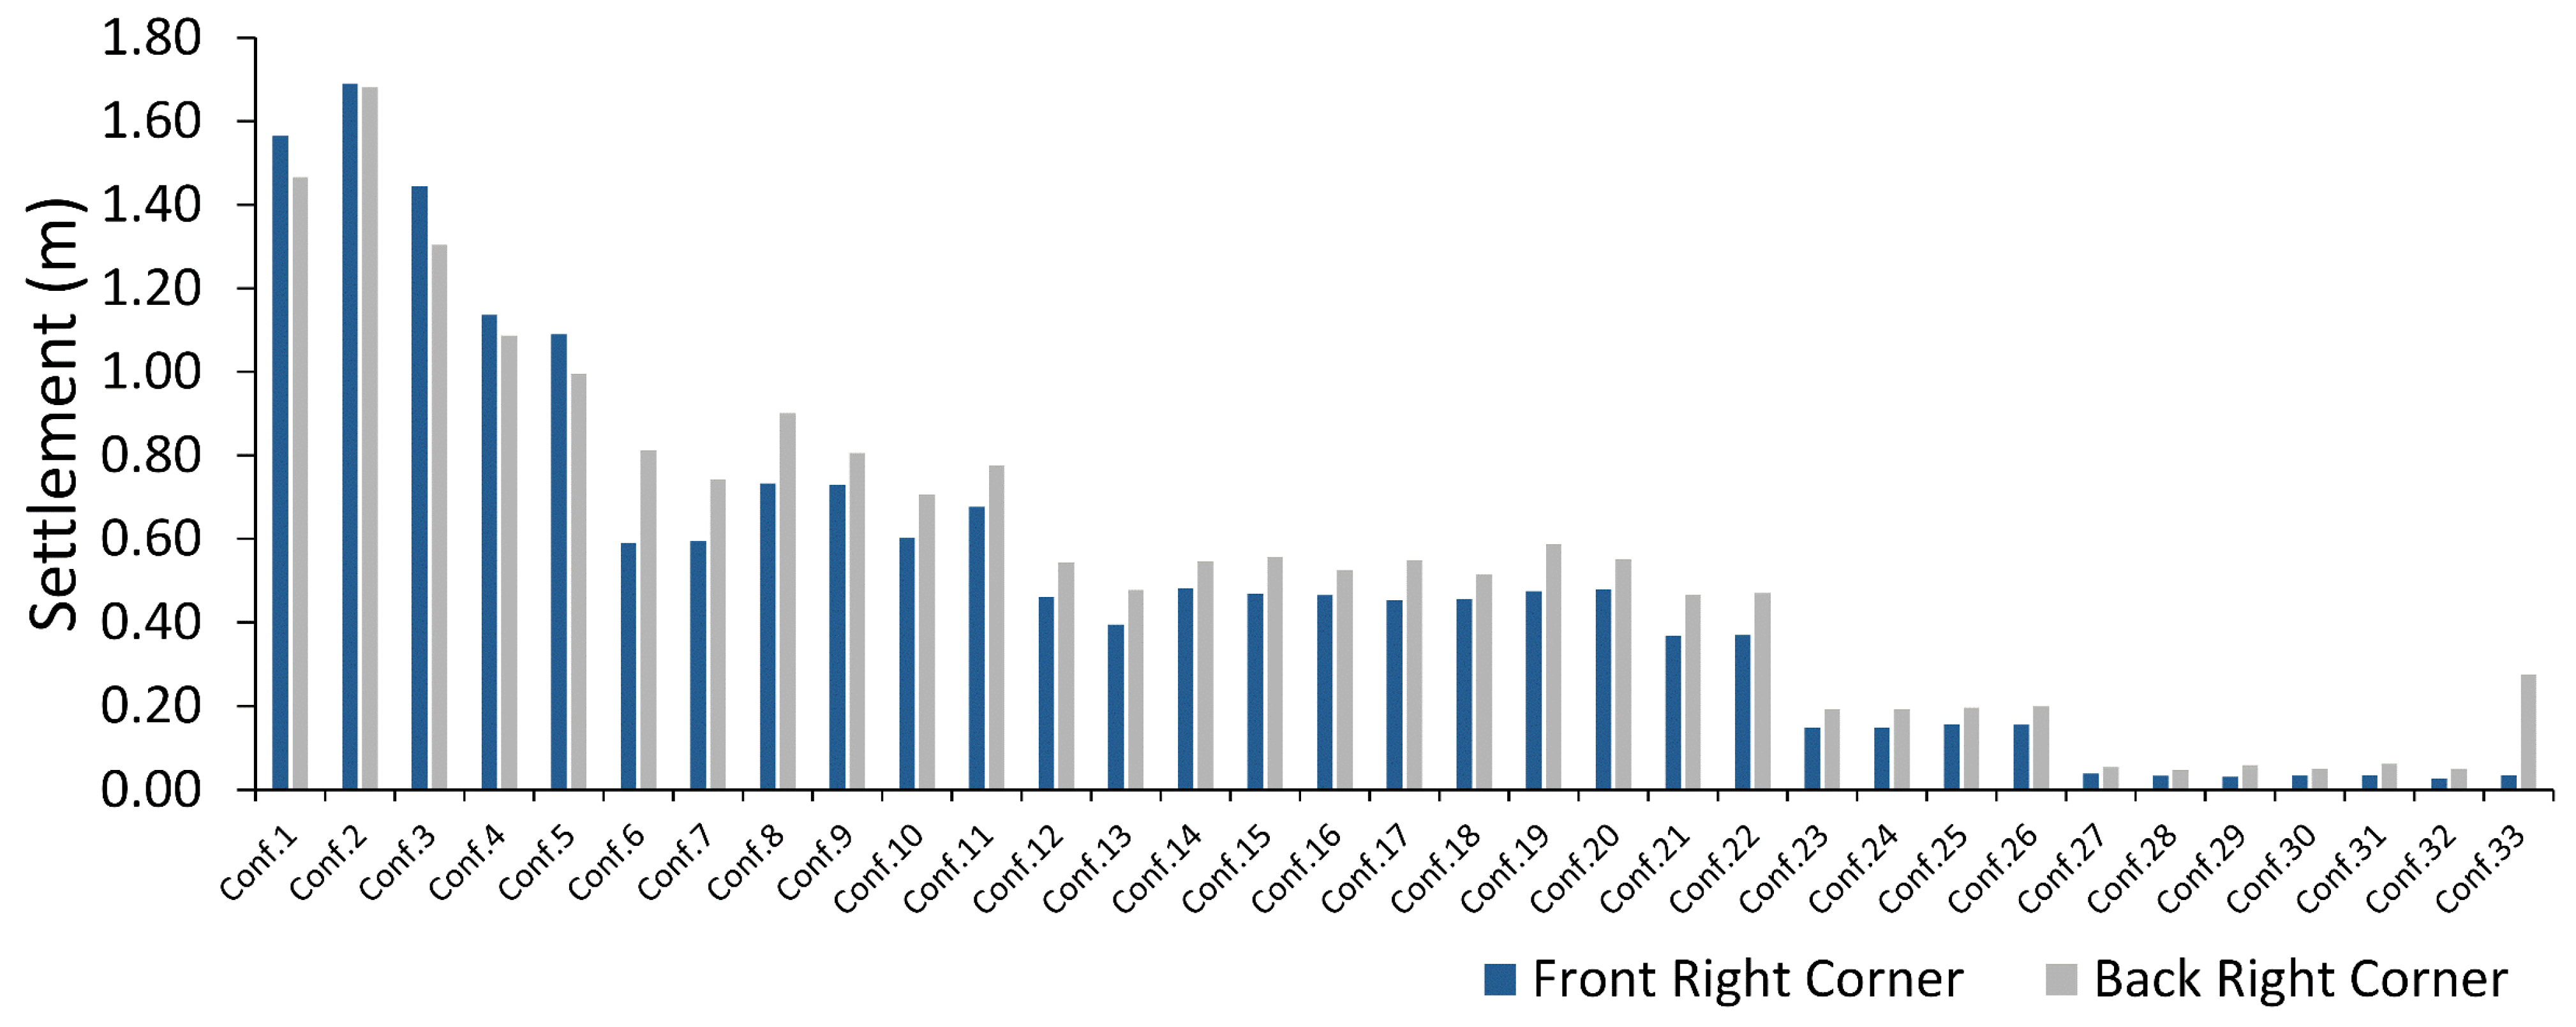
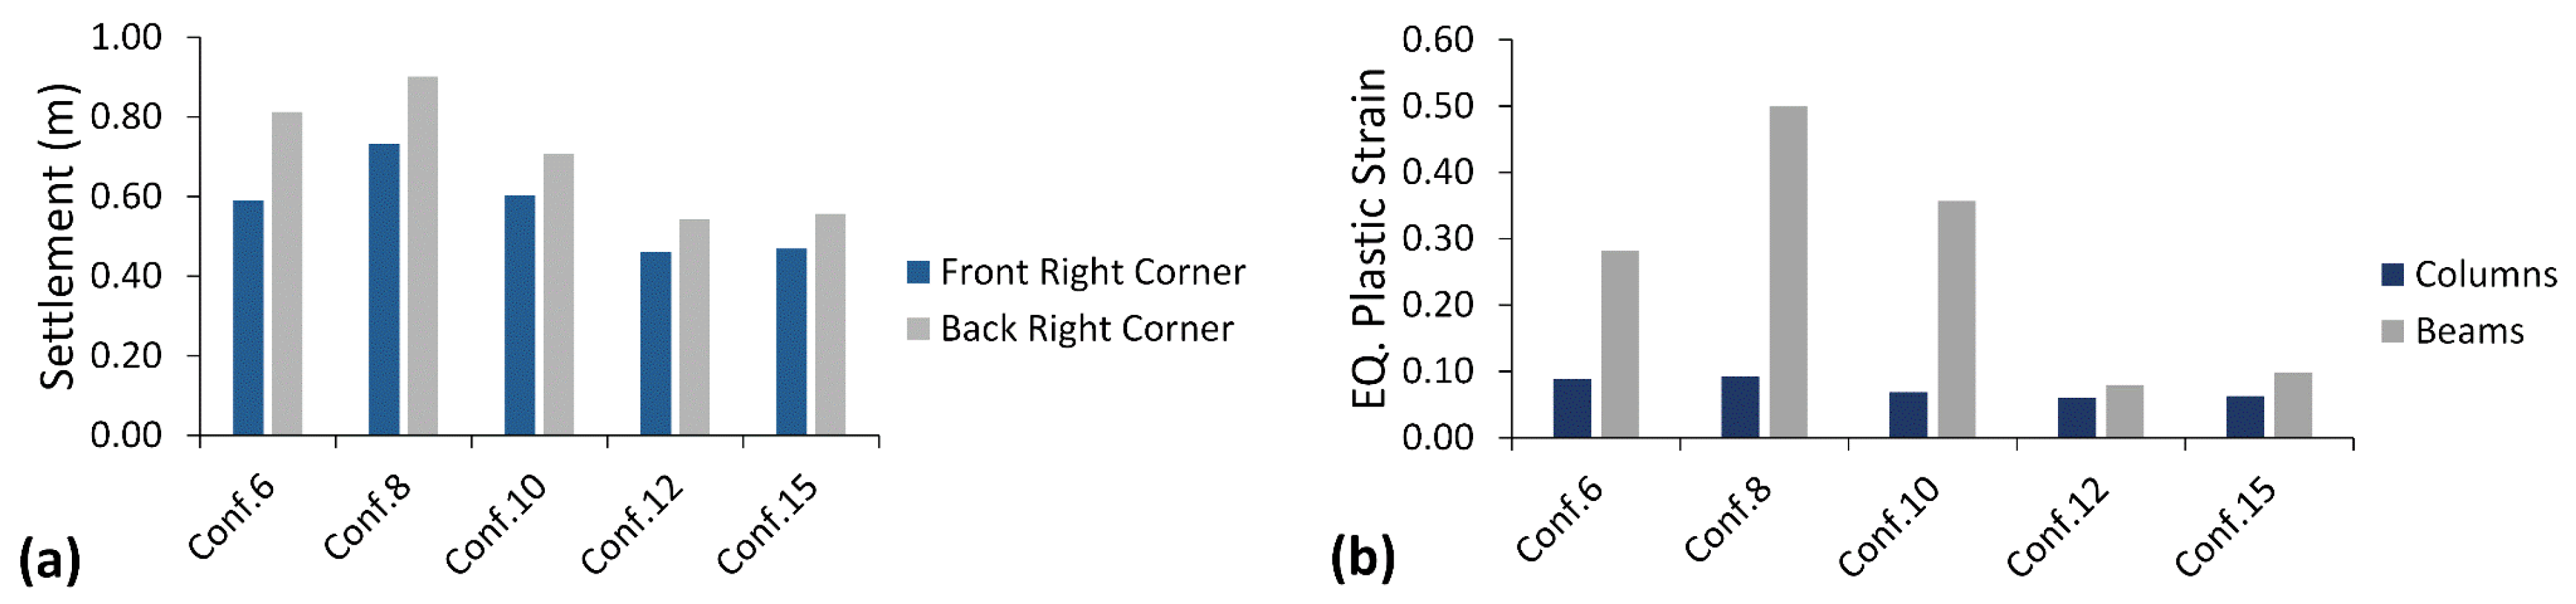
5.1. Settlement at the Top of the Structure

Structural settlement is observed at the top of the structure in all MSCSS configurations. This settlement occurred during the structural response under nonlinear dynamic analyses and illustrated in Figure 6. Configuration 1 showed a 1.56 m settlement, which means that 39% of the story height is settled. The configurations with SPSW showed much improvement, and a maximum settlement of 0.9 m is observed in configuration 8. The major cause of this settlement is the plastic deformation of the mega-beam bracings. When the bracings between mega-beams are replaced by infill panels of SPSW, the structural response with respect to settlement is further improved with an average settlement of 0.36 m, which is an approximately 77% improvement compared with configuration 1, between different configurations with a maximum of 0.78 m in configuration 11. Compared with configuration 1, configuration 2 showed 8.33% more settlement, as more plastic deformation occurred in the X-bracing between the center of the structure along with deformation in the mega-columns. While comparing the settlement at the top of the structure, some trends are reflected in the behavior of different configurations. Configurations that do not have an SPSW showed that the back right corner has less settlement compared to the front right corner, but this trend is reversed with the use of an SPSW in place of chevron and X-bracings in the center of the structure. Configurations that have ring-shaped infill panels in their SPSW also exhibited a 12% improvement in results compared to regular infill panels without circular cut-outs. The plastic deformation in the mega-column bracing at the first floor also causes settlement at the top of the structure. Therefore, when ring-shaped infill panels of SPSW are used only at the first floor in mega-columns, this settlement is reduced by 97% for configuration 1, and a maximum reduction occurs in configuration 32, which is 98.25% when the settlement is 2.7 cm.

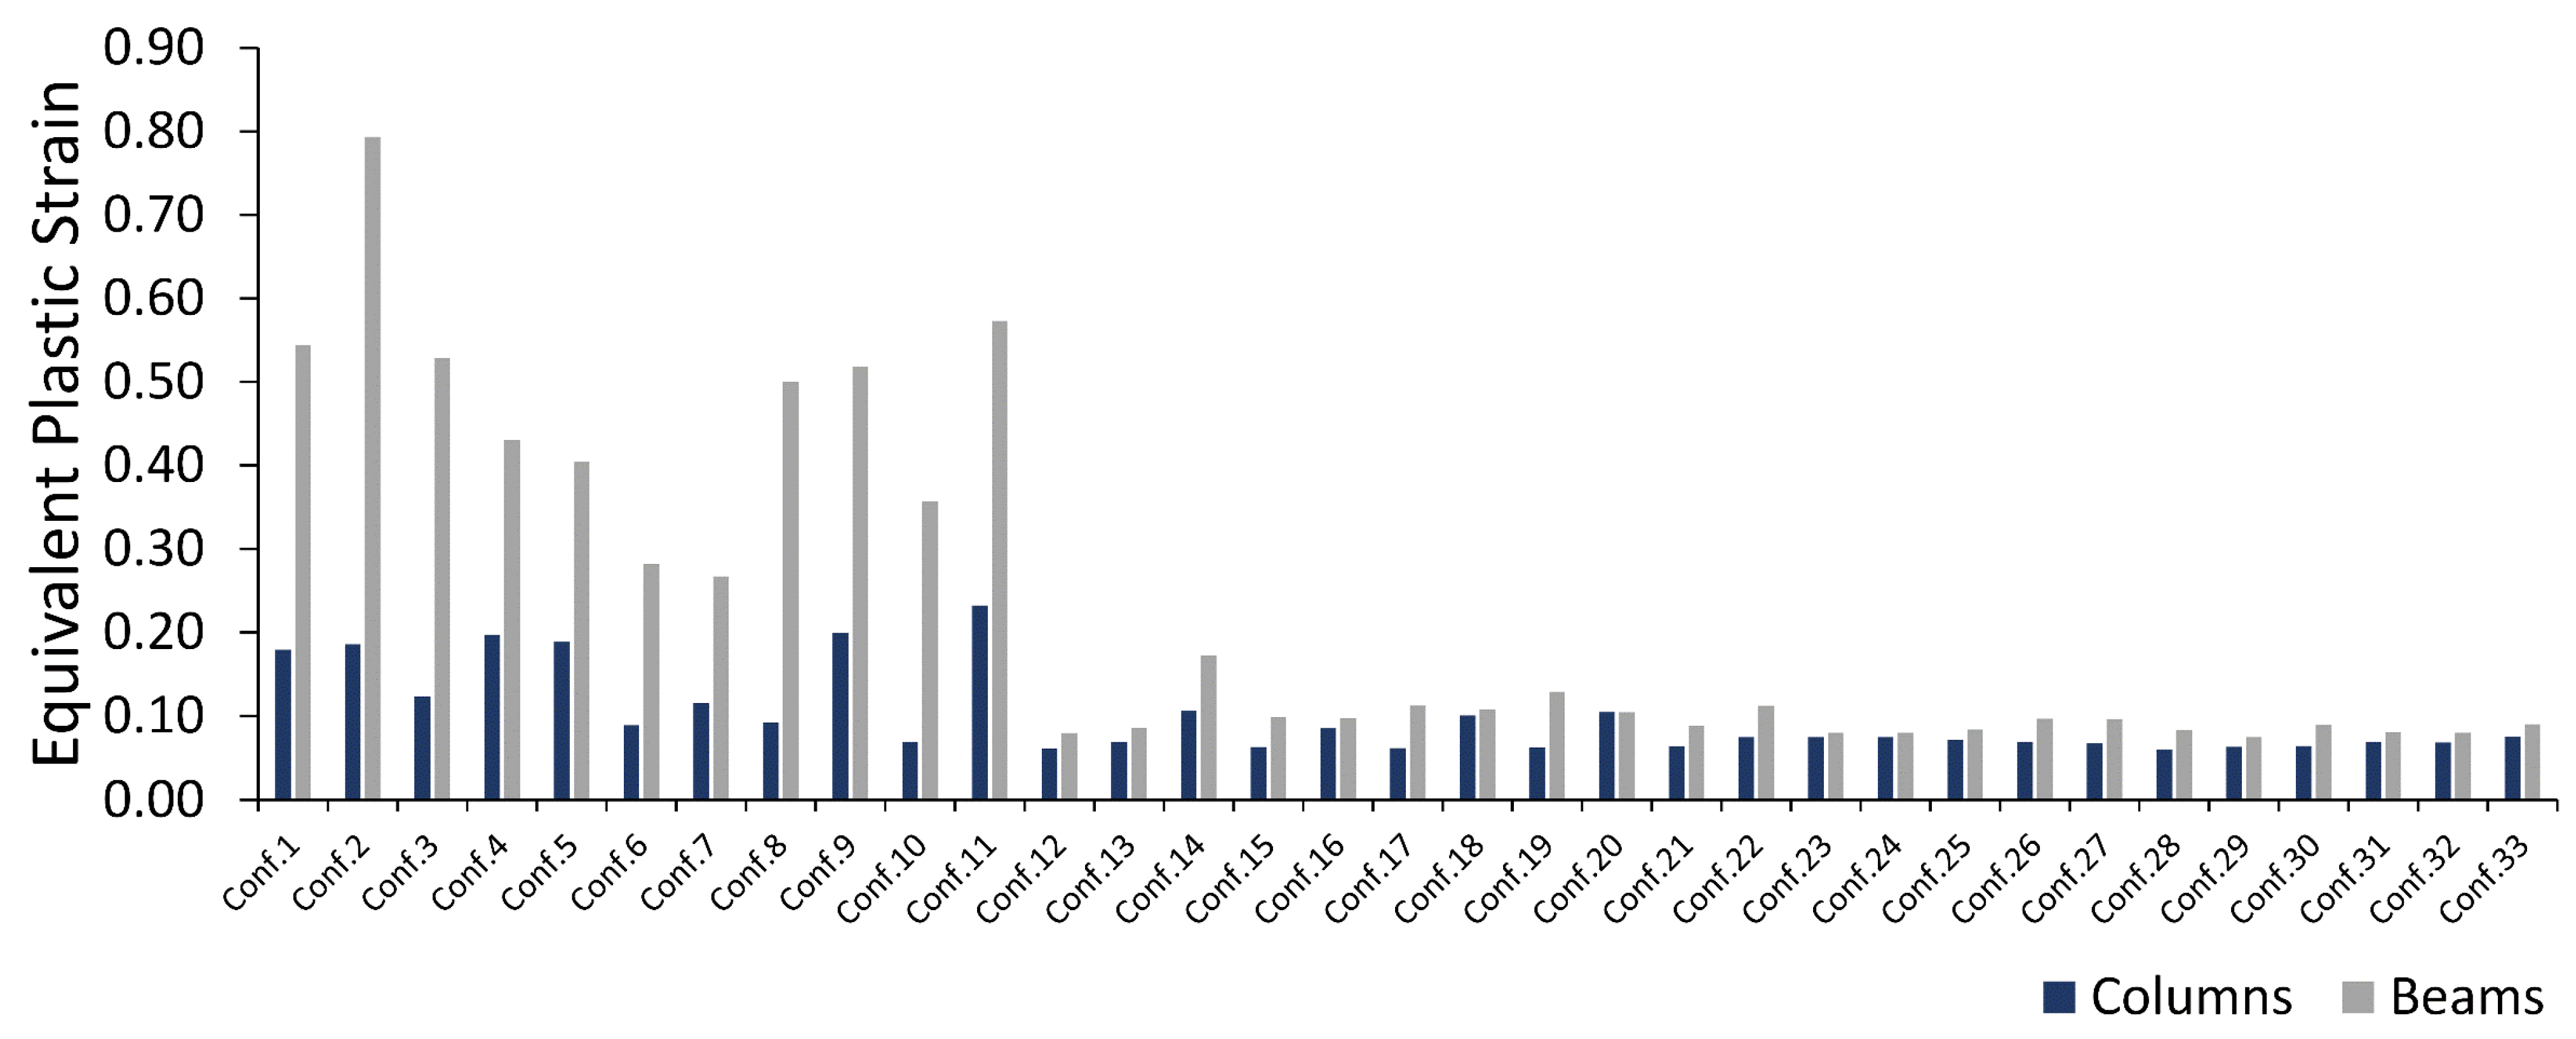
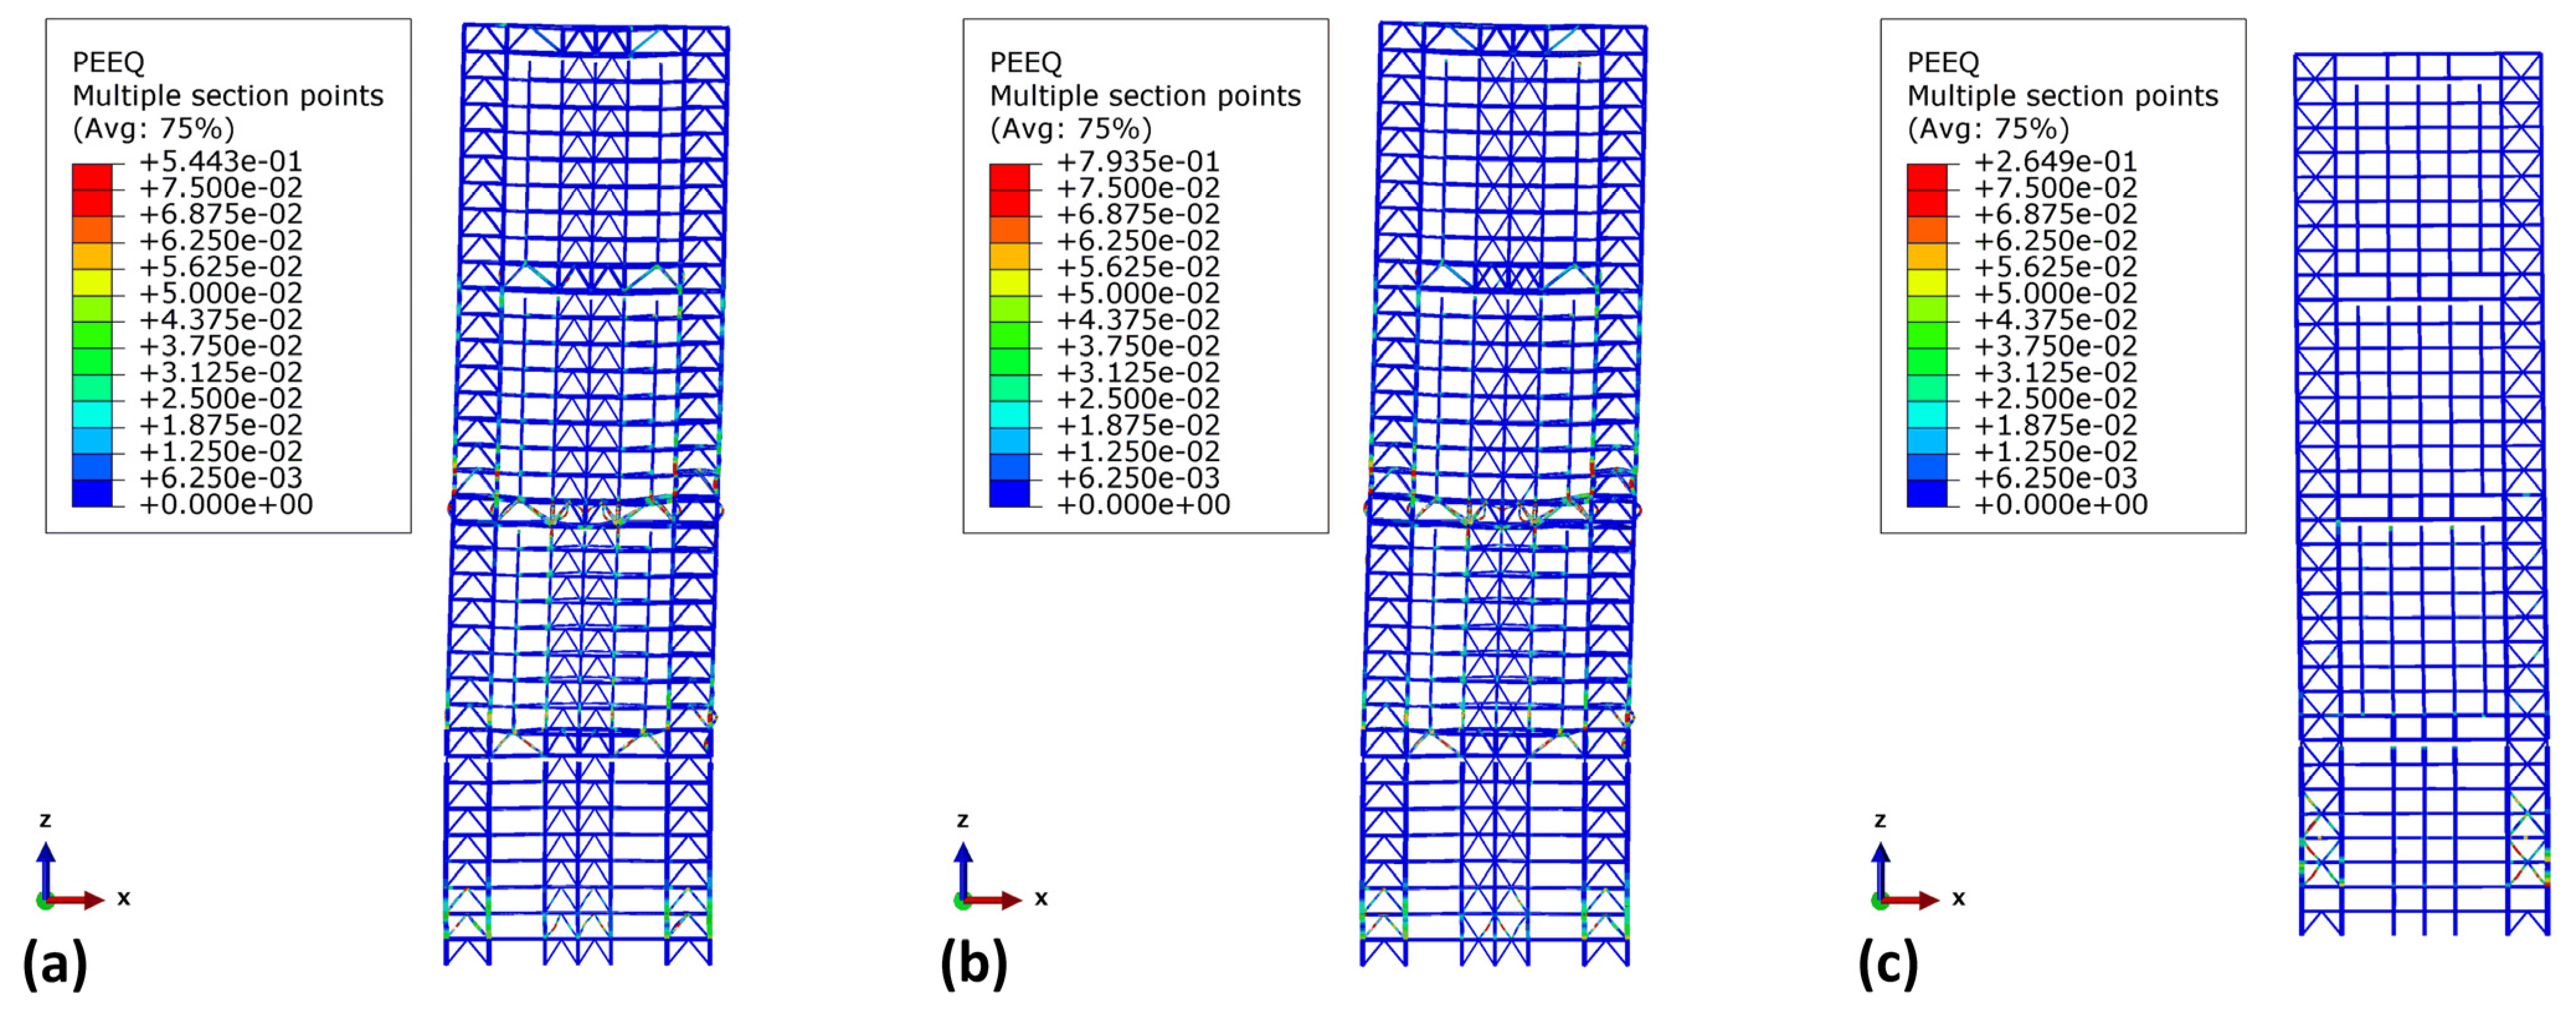
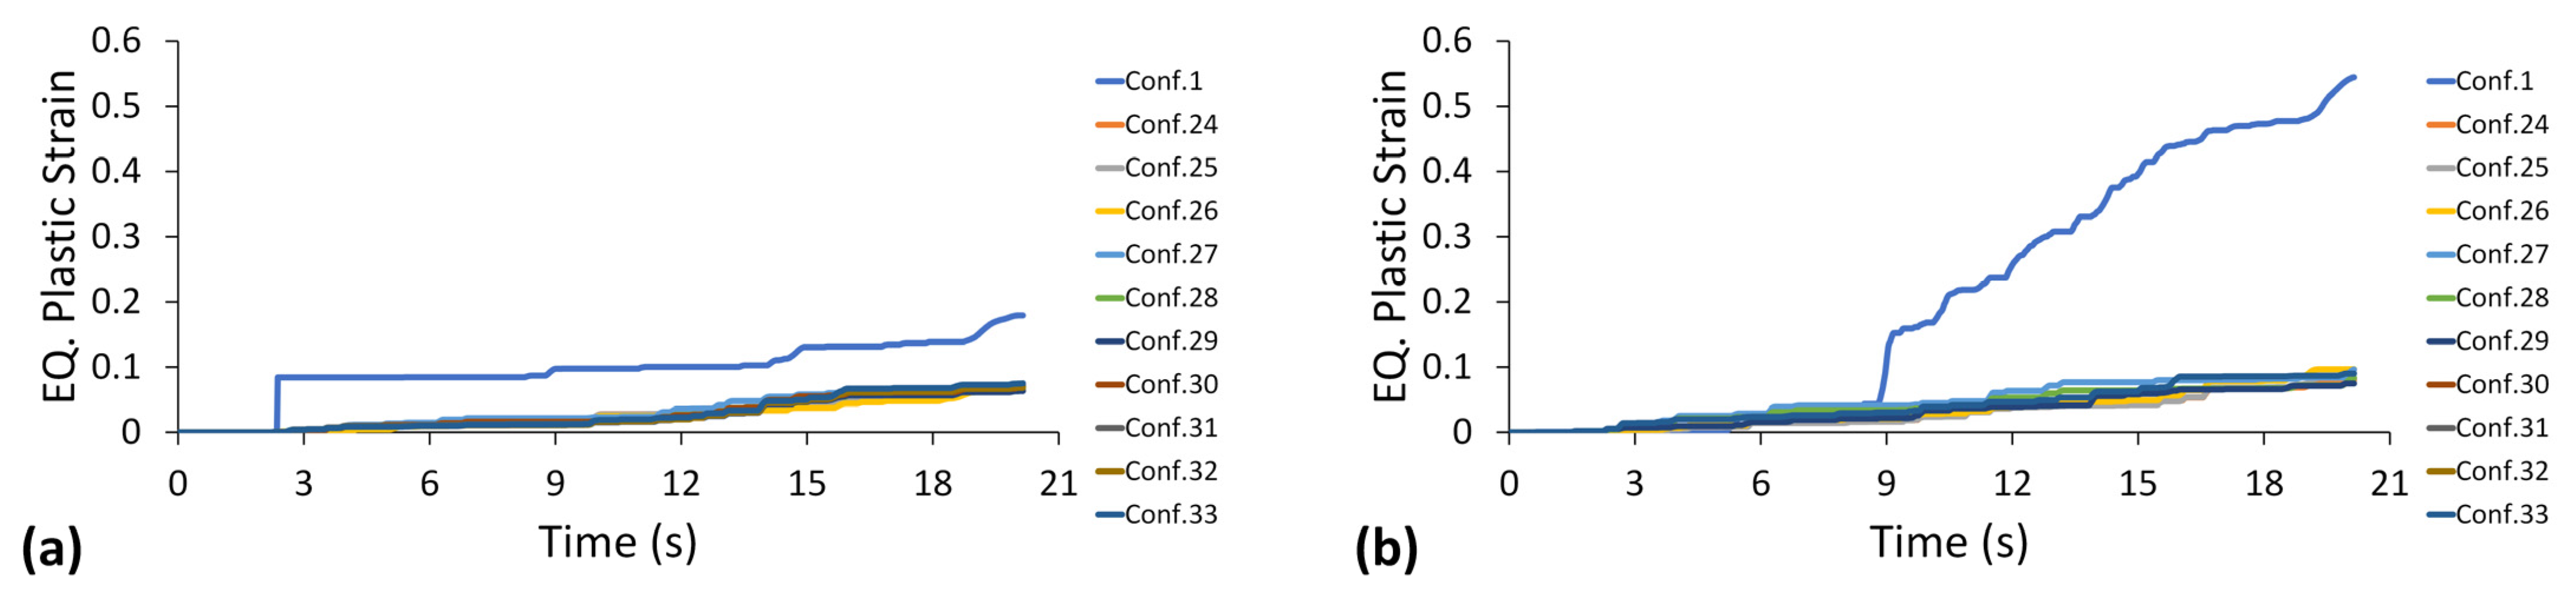
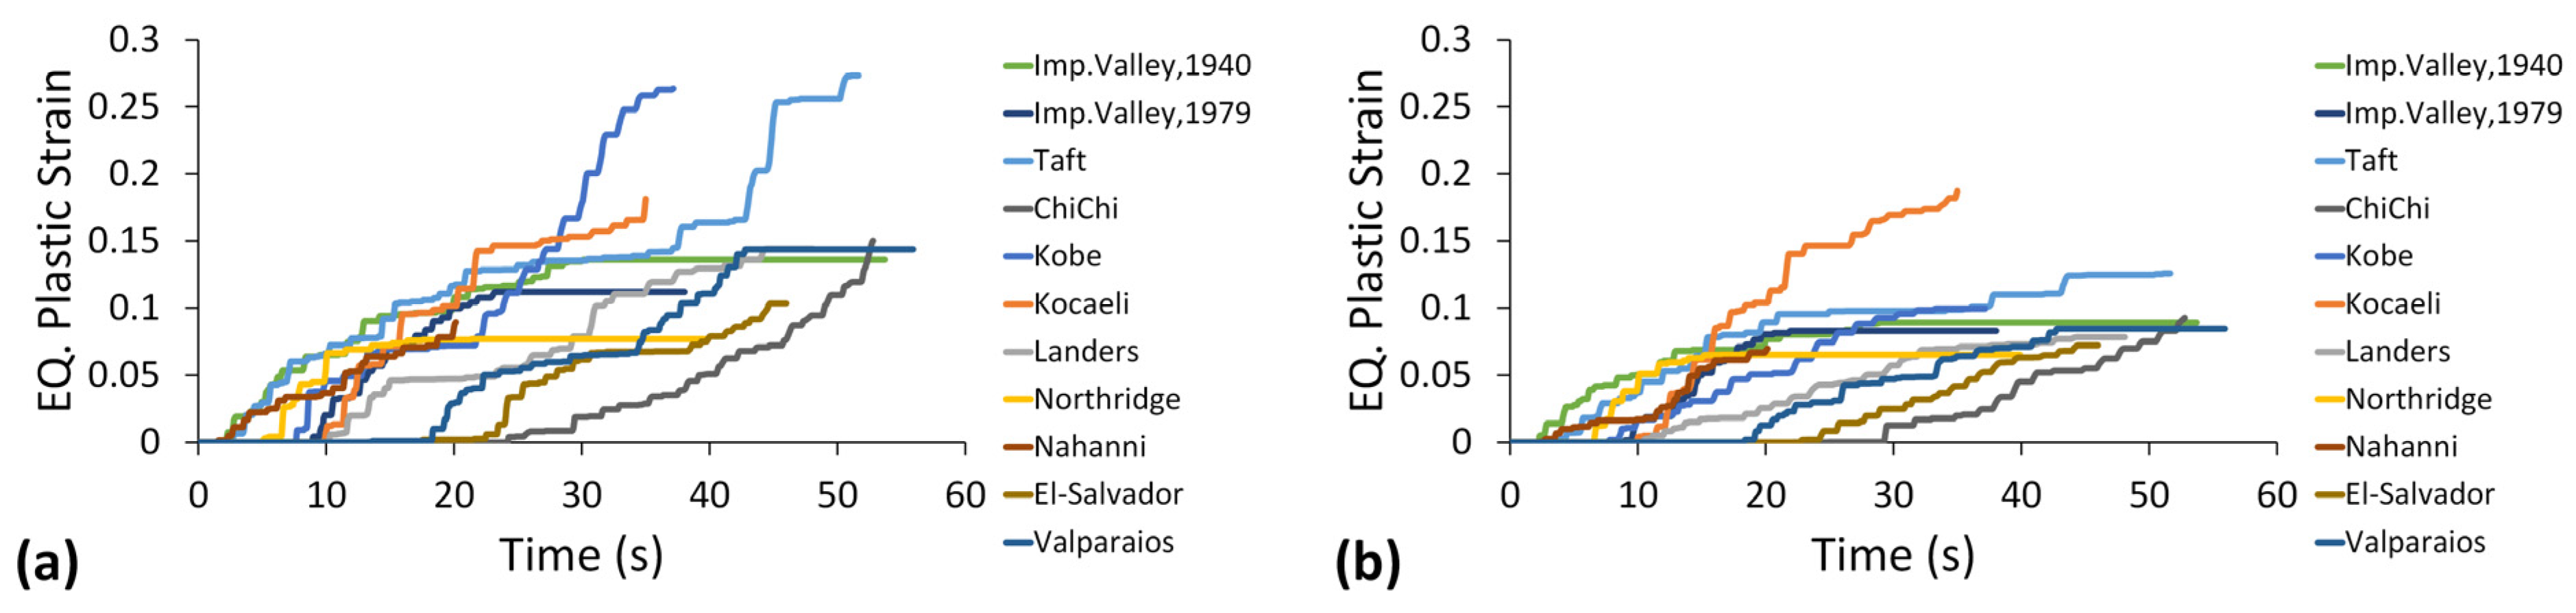
5.2. Equivalent Plastic Strain

To investigate the plastic deformation in the MSCSS configurations, equivalent plastic strain is evaluated in beams and columns, as these are major load bearing components. From the results, as a general trend, the equivalent plastic strain in beams is higher than that in columns, as illustrated in Figure 7. A maximum equivalent plastic strain of 0.794 is observed in configuration 2 in the beam, while a maximum equivalent plastic strain of 0.232 is observed in configuration 11 in the column. This means that the column and beam fail completely. Configurations that have infill panels between mega-beams showed improved structural stability compared to the other configurations, as their equivalent plastic strain in beams and columns is less than 0.18. Configuration 14 showed a maximum equivalent plastic strain of 0.173 in its beam. When infill panels are used between mega-columns, equivalent plastic strain is further reduced, and its maximum remains under 0.09, except in configurations 26 and 27, as their maximum equivalent plastic strains are 0.0968 and 0.0963, respectively, in the beam. Equivalent plastic strain in configurations that have ring-shaped infill panels in their SPSW showed improved results compared to traditional infill panels, especially plastic strains in beams.
Plastic deformation occurs in all configurations at the mega-frame on the second and third stories. Major plastic deformation occurs in bracing and mega-columns at this location. Bracing between mega-beams 1 and 2 showed plastic deformation up to the ninth configuration, triggering catastrophic structural deformation, particularly in the third substructure above the second mega-beam. Because of this deformation, the entire structure above the second mega-beam tilted to the right, as shown in Figure 8. Figure 8 illustrates where the plastic deformation occurs in configurations 1, 2, and 30. The configuration with the maximum plastic deformation was configuration 2. Severe buckling of beams and columns has also been observed in the second and third substructures. After substituting infill panels between mega-beams from configuration 10, the mega-beams show no signs of plastic deformation, preventing the structure from sustaining catastrophic damage. Bracing between mega-frames in configuration 30 showed signs of plastic strain, as shown in Figure 8c.
The structure underwent plastic deformation at 2.3 s when the ground acceleration was 0.31 g. The maximum plastic deformation occurs in columns at location (32.8,20,36~33.5,20,36) in configuration 1. Due to failure occurring at the beam-column joint, the plastic strain reached 0.0842, and the strain remained constant for 8.74 s but jumped to 0.097 after 9.2 s, when the ground acceleration reached 1.14 g. The trend is similar in other configurations; the maximum equivalent plastic strain in configuration 29 is 0.063, which is the minimum among all other configurations. The plastic deformation trend in beams is similar to that in columns, and the maximum equivalent plastic strain in configuration 29 is 0.0748, which is the minimum among the others, as illustrated in Figure 9a,b. Additional to this, the beam of configuration 1 has a maximum equivalent plastic strain of 0.5444.

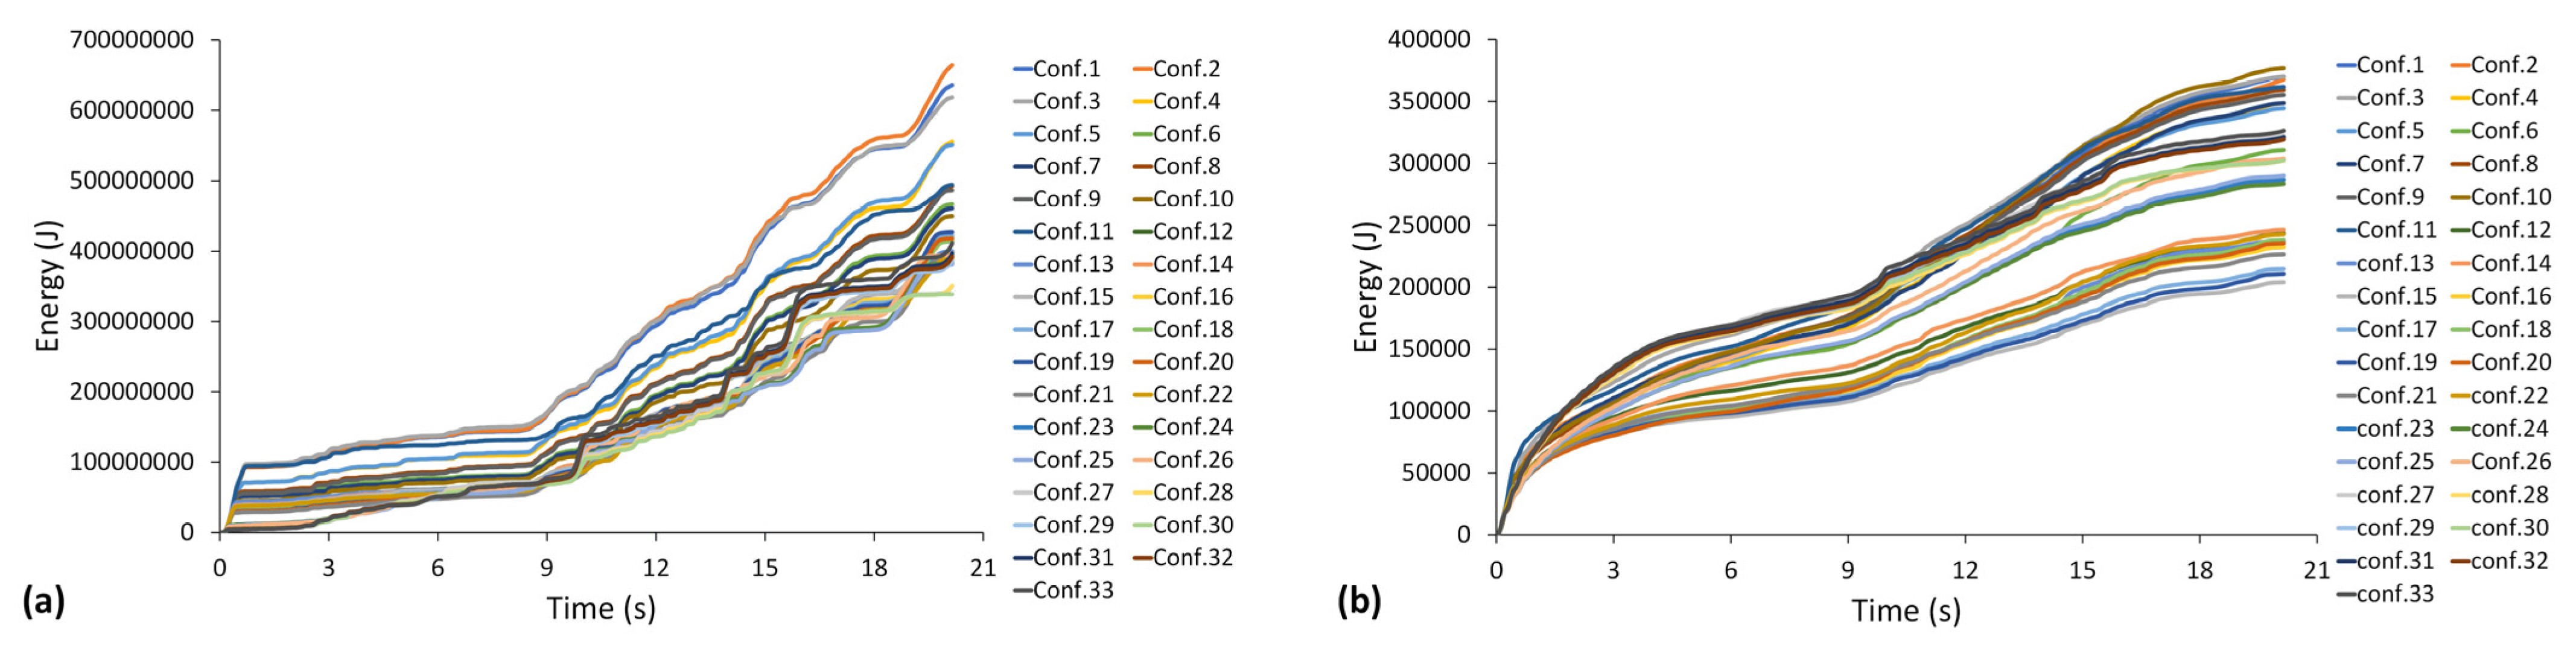
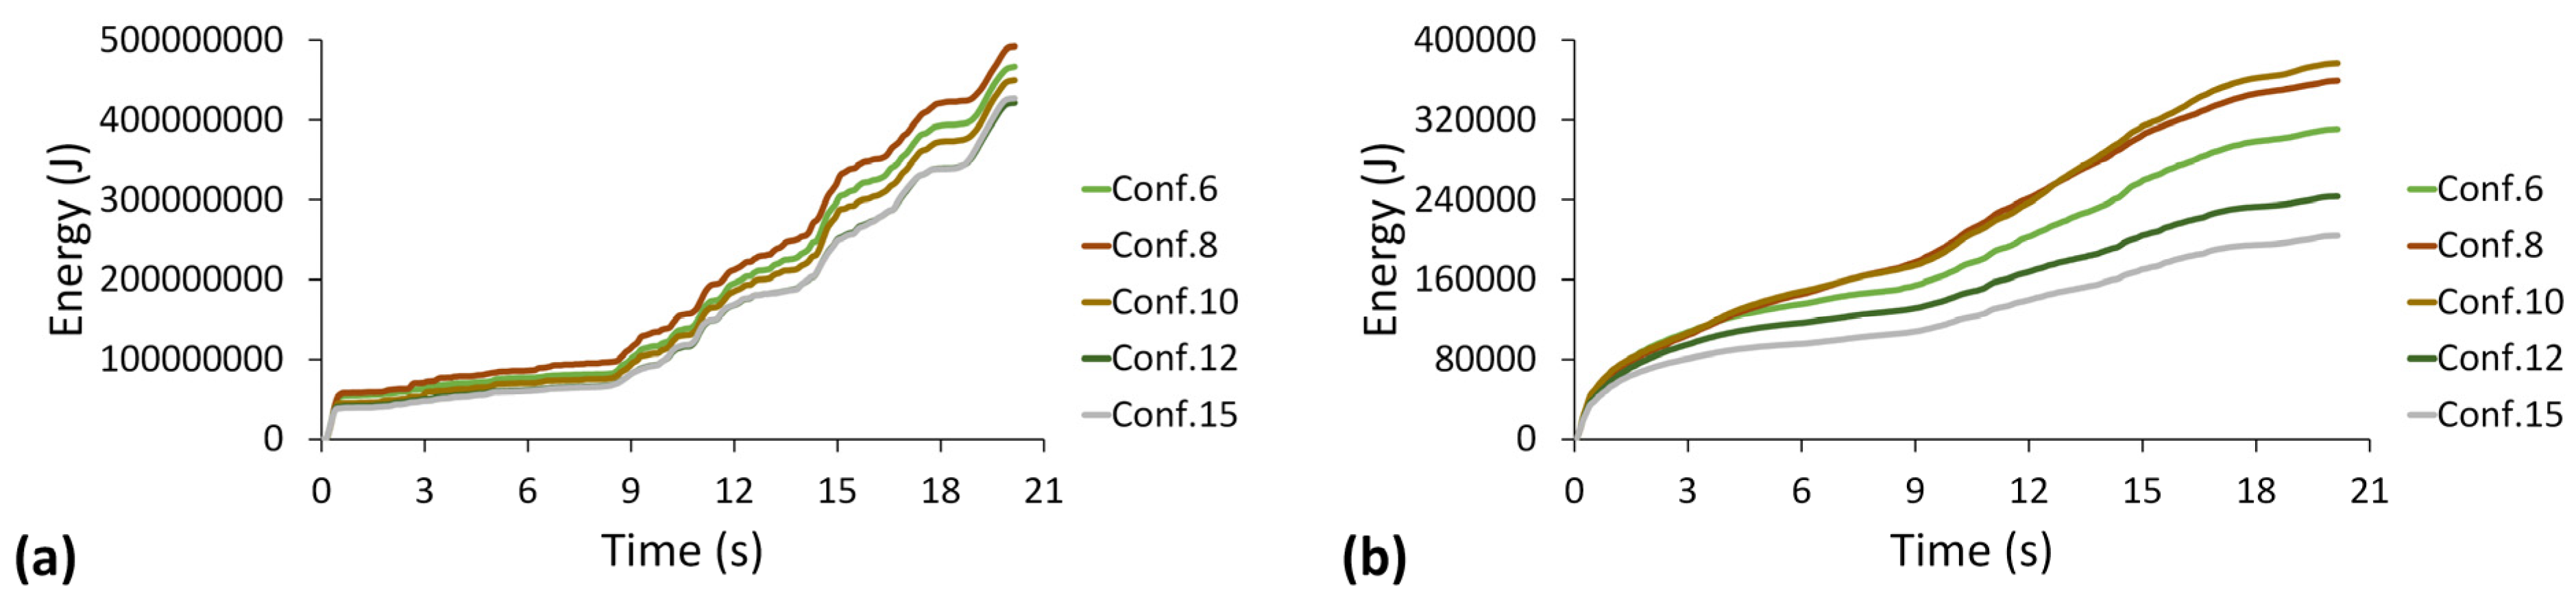
5.3. Energy Dissipation

Seismic energy will be dissipated from the structure because of the viscous effect of a structure, as well as the energy dissipation caused by plastic deformation occurring in the structural members. All the configurations are evaluated as a function of the viscous and plastic dissipation. A maximum viscous dissipation of 377 kJ of energy occurs in configuration 10, as depicted in Figure 10b, while configuration 29 dissipates 320.8 kJ. Configuration 30 dissipates 338 MJ of energy because of plastic deformation, as shown in Figure 10a, which is the minimum among all other configurations. Additionally, configuration 30 has 302.kJ viscous dissipation, which is better than half of the other configurations. The trend of plastic dissipation in configuration 30 is that it becomes constant at the end of ground motion, while the others are still reaching their peaks. Both plastic and viscous dissipation reach their peaks after 9.2 s. Overall, configurations with infill panels between mega-beams showed an improved control response under seismic excitations.

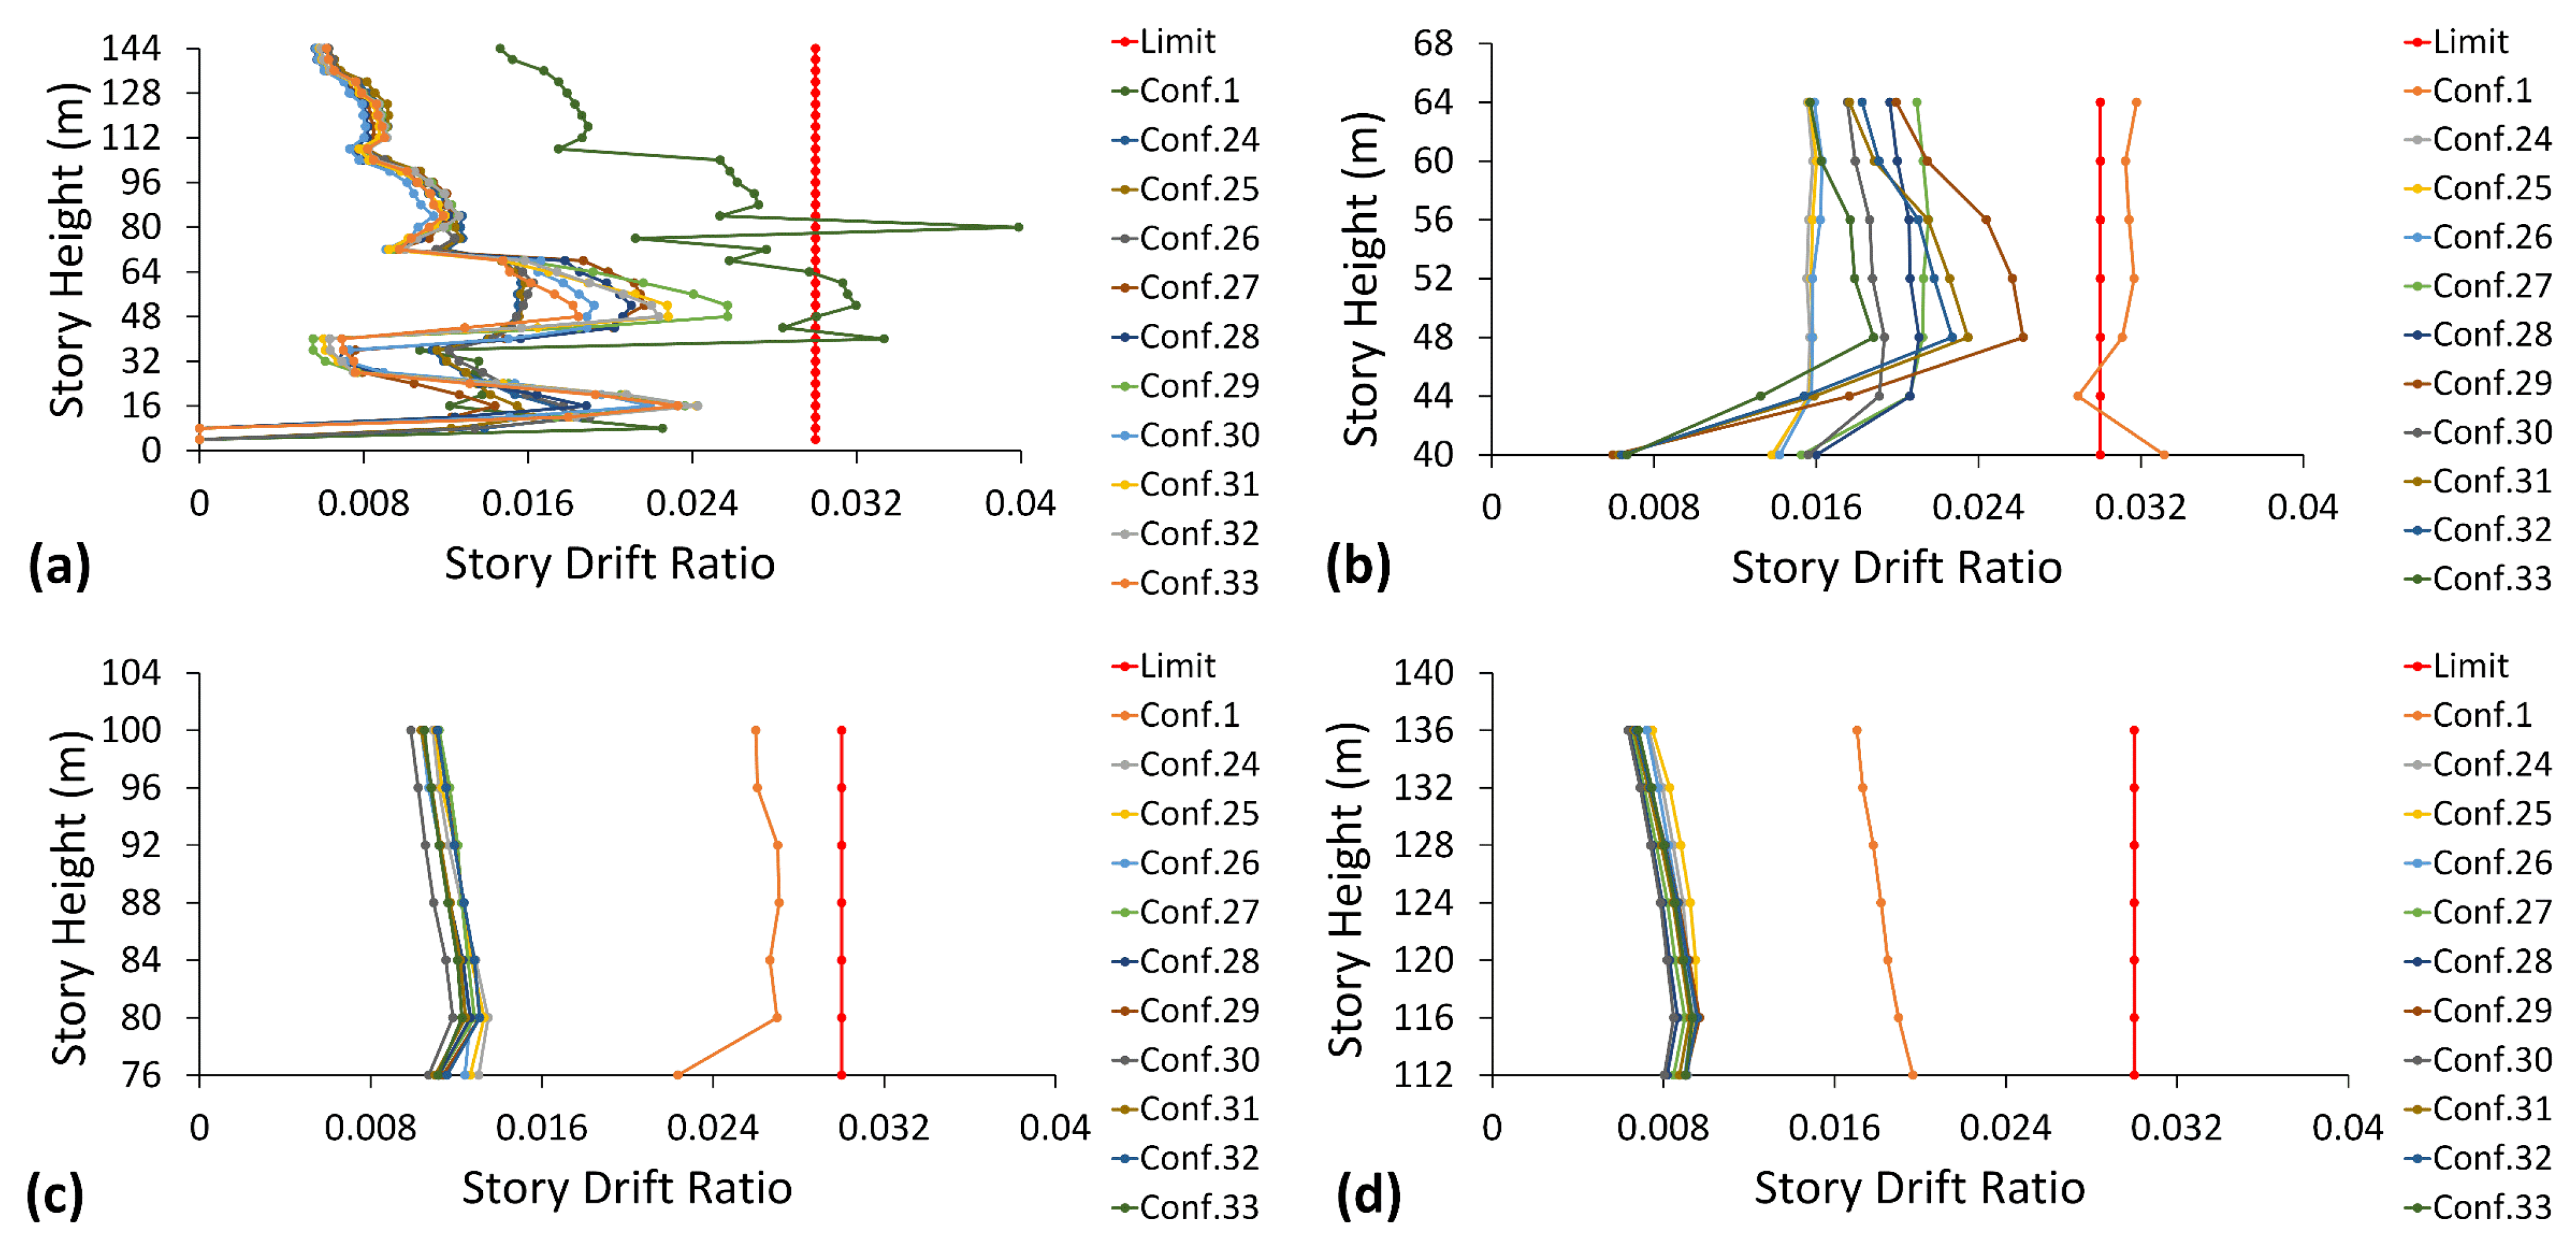
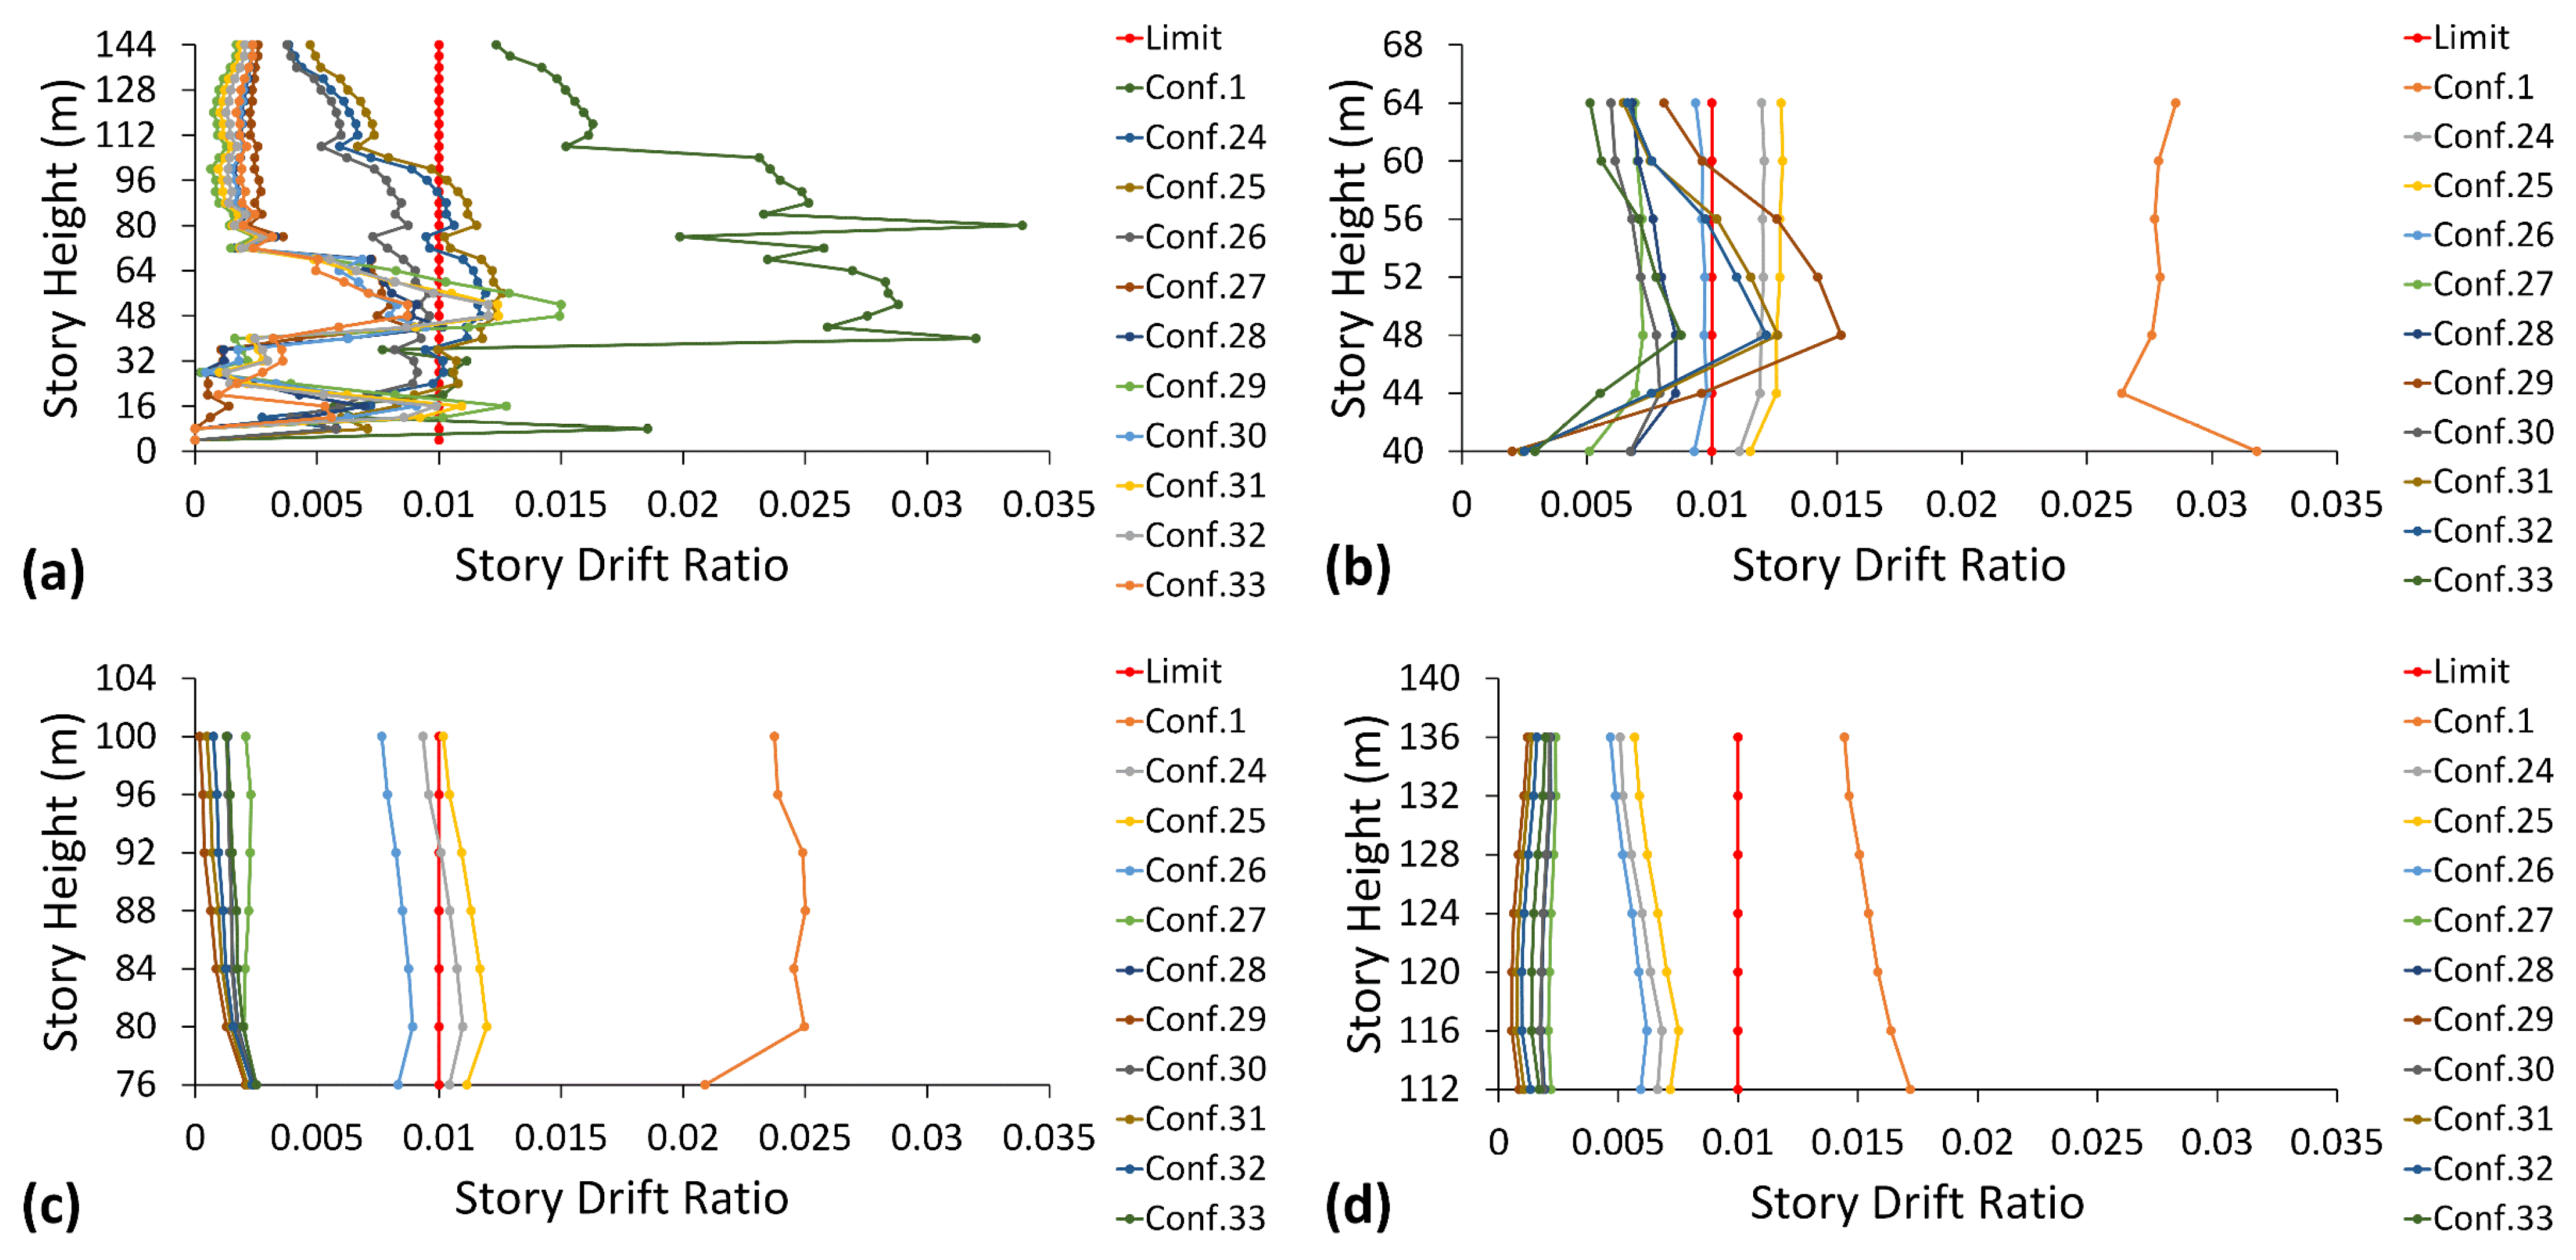
5.4. Peak Transient Story Drift

Peak transient story drift is one of the most important indicators of structural response. Different configurations, which have less than 0.2 m settlement at the top of the structure along with an equivalent plastic strain less than 0.1 in beams and columns, are selected in this section for a comparative study. The mega-frame of configuration 1, which is the base case, passed the limits of its structural response at a 40 m height, until 60 m, and showed the maximum drift at 80 m, which is 0.0399. The entire structure above the second mega-beam tilted to the right because of catastrophic plastic deformation at mega-beams 1 and 2 of configuration 1, causing peak transient story drift to exceed the safety limits. The equivalent plastic strain nephogram for configuration 1, Figure 8a, confirms the reason for exceeding limits. Other configurations did not go beyond the structural limits, as shown in Figure 11. In the peak transient story drift in the mega-frame, zero drift is observed from 4 m to 8 m on the infill panels, after which the drift increases and then decreases from 32 m to 40 m. From 40 m to 72 m, the first substructure is present and shows maximum transient drift in the whole structure. The drift in the mega-frame at the second and third substructures is smooth and does not attain any sudden peak. From the trend in transient story drift, most plastic deformation occurring in the mega-frame is at 72 m. There is little dip at 72 m, where the second substructure starts, while the initial gain in drift at 36 m is due to the presence of LRBs.
In all three substructures, the first substructure of configuration 1 went beyond its performance limits, while in all other selected configurations and other substructures, the limits were not passed. The drift in the selected configurations is approximately 40% of the drift in configuration 1, which means an approximately 60% improvement in the structural performance. Configurations 24, 25, and 26 showed a smooth gain in drift from 44 m to 52 m; the drift became almost constant, and the drifts of each of these configurations were close to each other. The other selected configurations showed a sudden peak at 48 m and then decreased gradually. In the second and third substructures, the peak transient story drift does not change much and shows smooth and steady changes. In the second substructure, the story drift changes within 10%, whereas in the third substructure, this change is within 25%. In the second and third substructures, all the selected configurations also showed approximately 60% less peak transient story drift compared to the base case.

5.5. Residual Story Drift

The same configurations with peak transient story drift are studied; residual story drift is also investigated. The trends are similar to the peak transient story drift. In the mega-frame, zero drift is observed from 4 m to 8 m, after which the drift increases and then decreases from 32 m to 40 m. From 40 m to 72 m, the first substructure is present and shows the maximum residual drift in the whole structure. Configurations 26, 27, 30, and 33 do not pass the limits, as shown in Figure 12a while the other configurations go beyond the residual story drift limits, which is a post-earthquake concern. Most configurations go beyond limits at 44 m to 60 m in the mega-frame. Configurations 24 and 25 pass the limits from 24 m to 96 m. At the top of the structure, configuration 30 showed the greatest improvement in structural performance, as its residual story drift was 81.15% less than that of configuration 1.
In the first and second substructures, configurations 1, 24, and 25 of the whole substructure go beyond the limits, while in the first substructure, configurations 29, 31, and 32 pass from 48 m to 56 m. When mega-beams 1 and 2 of configuration 1 experienced catastrophic plastic deformation, the entire structure above the second mega-beam tilted to the right, exceeding the allowable limits for residual story drift. Figure 8a is an equivalence plastic strain nephogram for configuration 1, further validating the aforementioned explanation for exceeding constraints. In the second and third substructures, configurations other than 1, 24, 25, and 26 do not show any sudden change. In all substructures and mega-frames, configuration 30 showed the most structural response control and does not cross its performance limits in terms of the substructures and mega-frame, as depicts in Figure 12. Minimum improvements of 70%, 88.73%, and 85.25% were observed in the first, second, and third substructures, respectively, compared to the base case.

6. Selection of the Optimized Design

After a parametric study of 33 different MSCSS configurations under Nahanni ground motion, configuration 30 exhibits the optimized design, among others. Configuration 30 demonstrates minimum plastic dissipation with medium-to-high viscous dissipation. The maximum equivalent plastic strains in the beam and column are 0.0643 and 0.0893, respectively. These maximum equivalent plastic strains are 64% and 83.6% less in the beam and column, respectively, than in the base case. Configuration 30 also demonstrates minimum settlement at the top of the structure, i.e., 3.4 cm, which is 97.82% less than that for configuration 1. Residual story drift also remains under its limits, with an average improvement of 85% and a minimum of 70% in substructures compared to the base case. Moreover, the minimum is 21% and the average is 65%, which is less than the residual story drift limit (0.01), in the substructures of configuration 30.

Selection of Optimized Infill Panels

In this paper, three different infill panels are used, of which one is a conventional unstiffened infill panel and the others are ring-shaped infill panels with different dimensions. Ring-shaped infill panels showed improved seismic performance compared to conventional infill panels. In configuration 6, ring-shaped infill panels are used and show a 19.18% improvement in settlement at the front right corner, whereas at the right back corner, this improvement is 10% compared with configuration 8 with conventional unstiffened infill panels, as shown in Figure 13. Similarly, the maximum equivalent plastic strain in the column of configuration 6 is 4% less than that in configuration 8. Additionally, the maximum equivalent plastic strain in the beam is 44% less than when the ring-shaped infill is used. The ring-shaped infill panels used in configuration 6 have a mass of 448.17 kg per panel of 5 m × 4 m; however, this mass increases by 2.14 times in the conventional unstiffened infill panel of the same dimensions.
Conventional unstiffened infill panels have buckling issues because of their low lateral stiffness and energy dissipation. Ring-shaped infill panels have circular cut-outs and diagonal links, which lessen the buckling effect caused by the deformation ring properties.
Large radius ring-shaped infill panels cut-outs showed slightly better performance, as configuration 12 has Ro = 0.44 m and configuration 15 has Ro = 0.42 m. The settlement at the front right corner on top of the structure is 0.46 m in configuration 12 and 0.47 m in configuration 15. Similarly, at the back right corner on top of the structure, this settlement is 0.54 m in configuration 12 and 0.56 m in configuration 15. The trend is the same with respect to the maximum equivalent plastic strain in the beams and columns between large and small cut-outs. Configuration 12 showed slightly improved performance in plastic deformation under seismic excitation, as shown in Figure 14. Additionally, the mass of infill panels in configuration 12 is approximately 6% lighter than in infill panels of configuration 15. Both configurations 12 and 15 showed the same plastic dissipation, but the viscous dissipation in configuration 12 was 16% more than that in configuration 15. Therefore, ring-shaped infill panels using configuration 12 are selected as optimized infill panels.

7. Nonlinear Dynamic Analysis

For further investigation, a nonlinear dynamic procedure (NDP) is carried out on the new optimized MSCSS, which is configuration 30, and compared with the base case. The nonlinear dynamic procedure, which is also known as nonlinear time-history analysis [34], provides the most realistic structural inelastic response, as it includes elasto-plastic behavior.
Configuration 30 showed more consistent maximum floor acceleration and displacement responses after nonlinear dynamic analysis under selected ground motions. The maximum coefficient of variation (COV) in configuration 30 is 16% and 32% in acceleration and displacement responses, respectively. The COV in configuration 1 is 15% and 134% in the acceleration and displacement responses, respectively. The maximum floor acceleration at the top of the structure in configuration 30 is 19.65 ms−2 under Imperial Valley 1979 ground motion with a mean of 17.32 ms−2 under selected ground motions, while configuration 1 has a mean of 28.06 ms−2 and a maximum under Landers ground motion. 36.13 ms−2, as illustrated in Table 5. Configuration 1 showed catastrophic results in the maximum floor displacement at the top of the structure under Landers ground motion because of the formation of soft stories at the second mega-beam location and story. This is because buckling failure occurs in columns at the right half of structures at heights from 68 m to 76 m. Due to failure in the columns, a major collapse occurs in the structure, and the maximum floor displacements are 18.26 m, 16.46 m, and 7.83 m at the top of the structure (i.e., 144 m height), the top of the fourth substructure (i.e., 136 m height) and the top of the third substructure (i.e., 100 m height), respectively. The mean maximum floor displacement at the top of the structure in configuration 1 is 3.55 m, while configuration 30 has a mean of 1.53 m with a maximum of 2.46 m under Taft ground motion, as illustrated in Table 6.
The time histories of the acceleration response of both configurations under the Landers earthquake showed that the structure experienced maximum acceleration between 10 and 20 s as the ground motion reached its peak, i.e., 11.28 ms−2 at 10.2 s, as shown in Figure 15. Additionally, during this period, the structure experienced maximum fluctuations. After 20 s, the structural acceleration of configuration 30 showed more smoothness than the other configuration. However, the displacement response of configuration 1 showed that after 18.3 s, the structure tilted toward the right side and did not return to its central axis. The cause of this leaning toward one side is due to the plastic deformation in columns, particularly in mega-columns on the right side of the structure between 68 m and 76 m in height. After 20 s, complete failure is triggered in the columns and the structure completely collapses after 40 s. The maximum equivalent plastic strain in the column element occurs at (40, 0, 74~40, 0, 74.4), which is 0.583, while in the beam element, it occurs at (40, 3.25, 76~40, 3.9, 76), which is 4.7. Configuration 30 showed a controlled displacement response, and the displacement showed damping after 37.5 s. The structure did not show any structural failure. The maximum equivalent plastic strain in the column element occurs at (40, 6.5, 8), which is 0.076, and in the beam element occurs at (36.75, 6.5, 72~37.4, 6.5, 72), which is 0.144.
From the time history of the equivalent plastic strain, plastic deformation starts in the column element at (40, 0, 74~40, 0, 74.4) after 1.2 s and in the beam element at (40, 3.25, 76~40, 3.9, 76) after 0.9 s in configuration 1. In the column after 34.6 s, the equivalent plastic strain reaches to 0.2, while in the beam after 18.3 s, when the ground displacement is maximum. In configuration 30, plastic deformation starts after 12 s in the column, reaches 0.02 at 19.3 s and in the beam after 10 s and reaches 0.02 at 13 s, but the equivalent plastic strain does not reach to 0.2, as illustrated in Figure 16.
The equivalent plastic strain in column of configuration 30 never crosses 0.2 under selected ground motion, but equivalent plastic strain in beams only crosses 0.2 under Taft and Kobe ground motions, as shown in Figure 17a. Maximum equivalent plastic strain the beam element under both ground motions occurs at (36.1, 0, 16~36.75, 0, 16). Equivalent plastic strain crosses 0.2 at 43.4 s in Taft, after maximum ground displacement reaches 43.016 s, i.e., −0.5664 m. Under Kobe, crosses at 30.4 s, although the maximum ground displacement reaches 21.96 s, i.e., −0.76422 m. Among all selected ground motions, the maximum equivalent plastic strain in the columns is 0.187 at (0, 40, 8~0, 40, 8.4) under Kocaeli.
Under Taft, configuration 30 leans toward the left side because of plastic deformation in mega-columns, which causes severe damage to the mega-frame of a structure. In configuration 1, the structure leans toward the right side, and this leaning causes more severe damage than in configuration 30. The structural acceleration response showed the same trend as that under the Landers earthquake. Tilting of the structure in configuration 30 started after 20 s when the structure already experienced a maximum ground acceleration of −9.12 ms−2 at 6.45 s, as shown in Figure 18. Due to the leaning of the structure, the structure also showed a reduction in height. The front right and left corners on top of the structure exhibit downward displacements of 10.5 cm and 36 cm, respectively. In configuration 1, these values are 3.48 m and 1.58 m. Configuration 30 showed improved results in downward displacement at the top of the structure under Kobe, with 10.9 cm at the right front corner and 12 cm at the left front corner. Under Taft, configuration 30 dissipated 770 MJ of energy in the form of plastic deformation and 600 MJ under the Kobe earthquake, which is approximately 21.9% less than that under Taft. Plastic dissipation under Taft in configuration 30 is approximately 30% less than that in configuration 1.
Plastic dissipation mostly occurs because of plastic deformation of the SPSW in configuration 30, the core structural elements remain intact, and the structure does not collapse or face severe damage. However, in configuration 1, plastic dissipation occurred because of plastic deformation of the beams and columns, which triggered severe damage or collapse of the structure. Configuration 30 showed a minimum of 13% improvement in equivalent plastic strain compared to configuration 1 in beams with a mean of 51% under selected ground motions, whereas in columns, this minimum improvement was 75% with a mean of 80%, as shown in Figure 19c.

8. Conclusions

In this paper, nonlinear dynamic analysis was conducted on different configurations of a mega-subcontrolled structural system (MSCSS) to investigate seismic structural response and plastic deformation. The following conclusions are drawn on the basis of results from finite element and parametric studies:
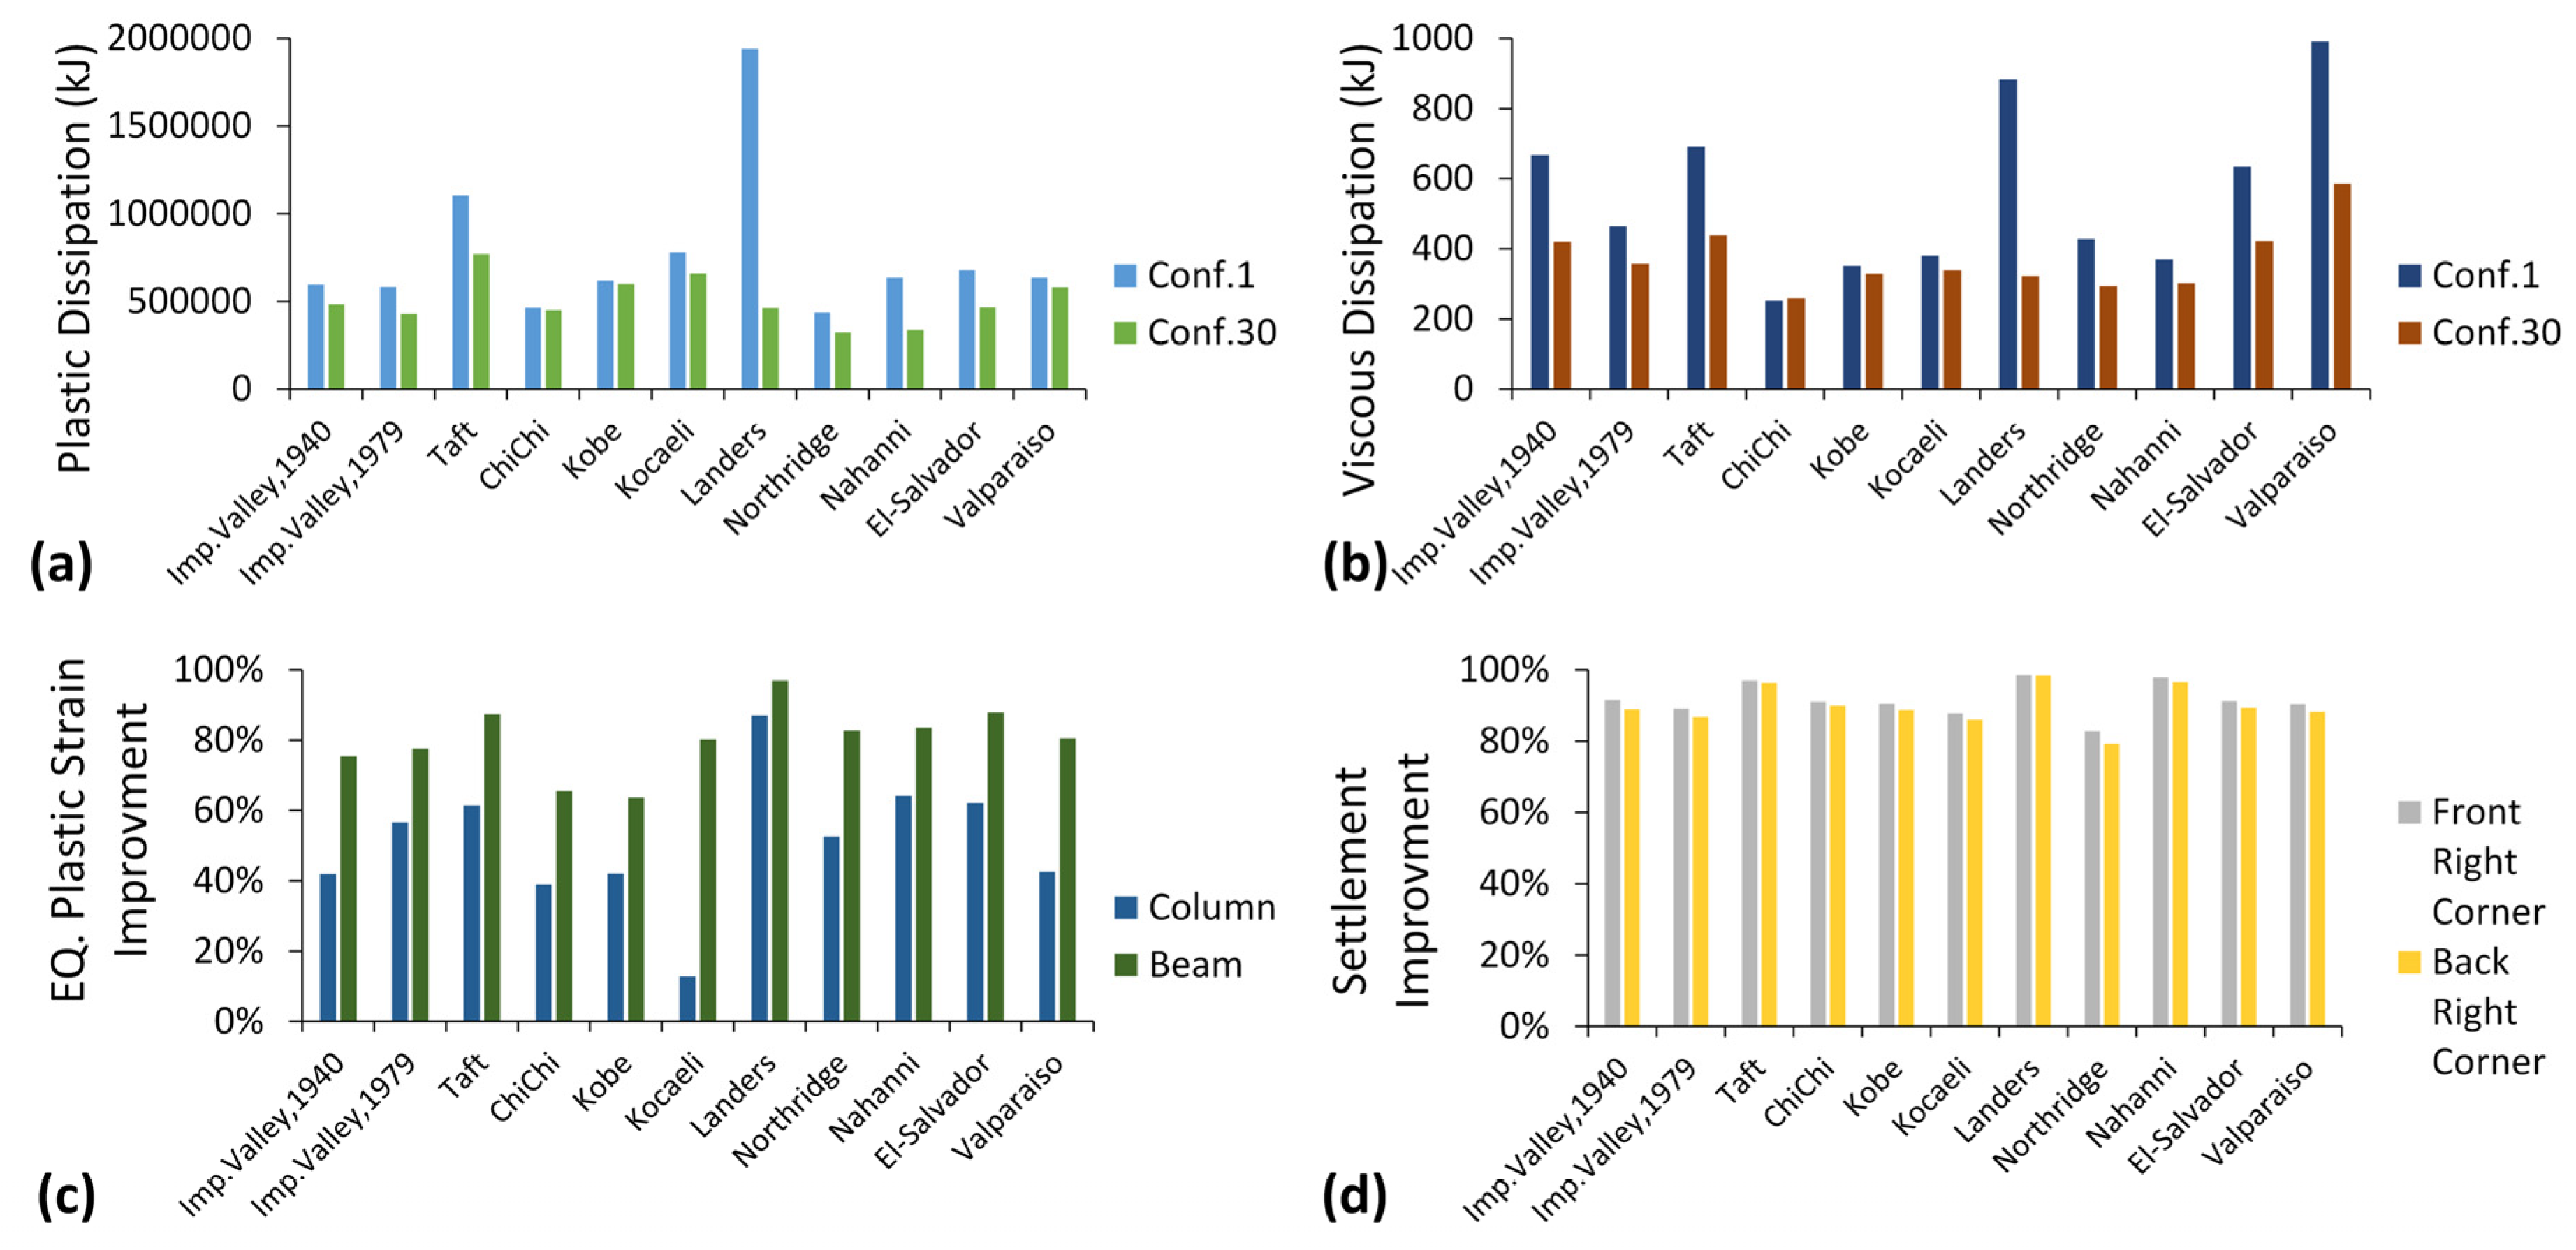
  • Configuration 30 is proposed as a novel configuration for the MSCSS, as it has minimum plastic dissipation with medium-to-high viscous dissipation among all other tentative configurations. The maximum equivalent plastic strains are 64% and 83.6% less in the column and beam, respectively, in configuration 30 than in configuration 1.
  • Compared to configuration 1, configuration 30 showed the most control structural response, as the minimum residual story drift improvement was 70%, 88.73%, and 85.25% in the first, second, and third substructures, respectively.
  • Compared to conventional infill panels, ring-shaped infill panels showed improved seismic performance and a 44% decrease in maximum equivalent plastic strain in beam where ring-shaped infills were used. Large radius ring-shaped infill panels cut-outs showed slightly better performance. The SPSW provides strength and stability to the whole structure even under extensive exposure to strong earthquakes.
  • Ring-shaped infill panels exhibit improved stiffness, as they have less buckling effect because of deformation ring properties, which increase energy dissipation.
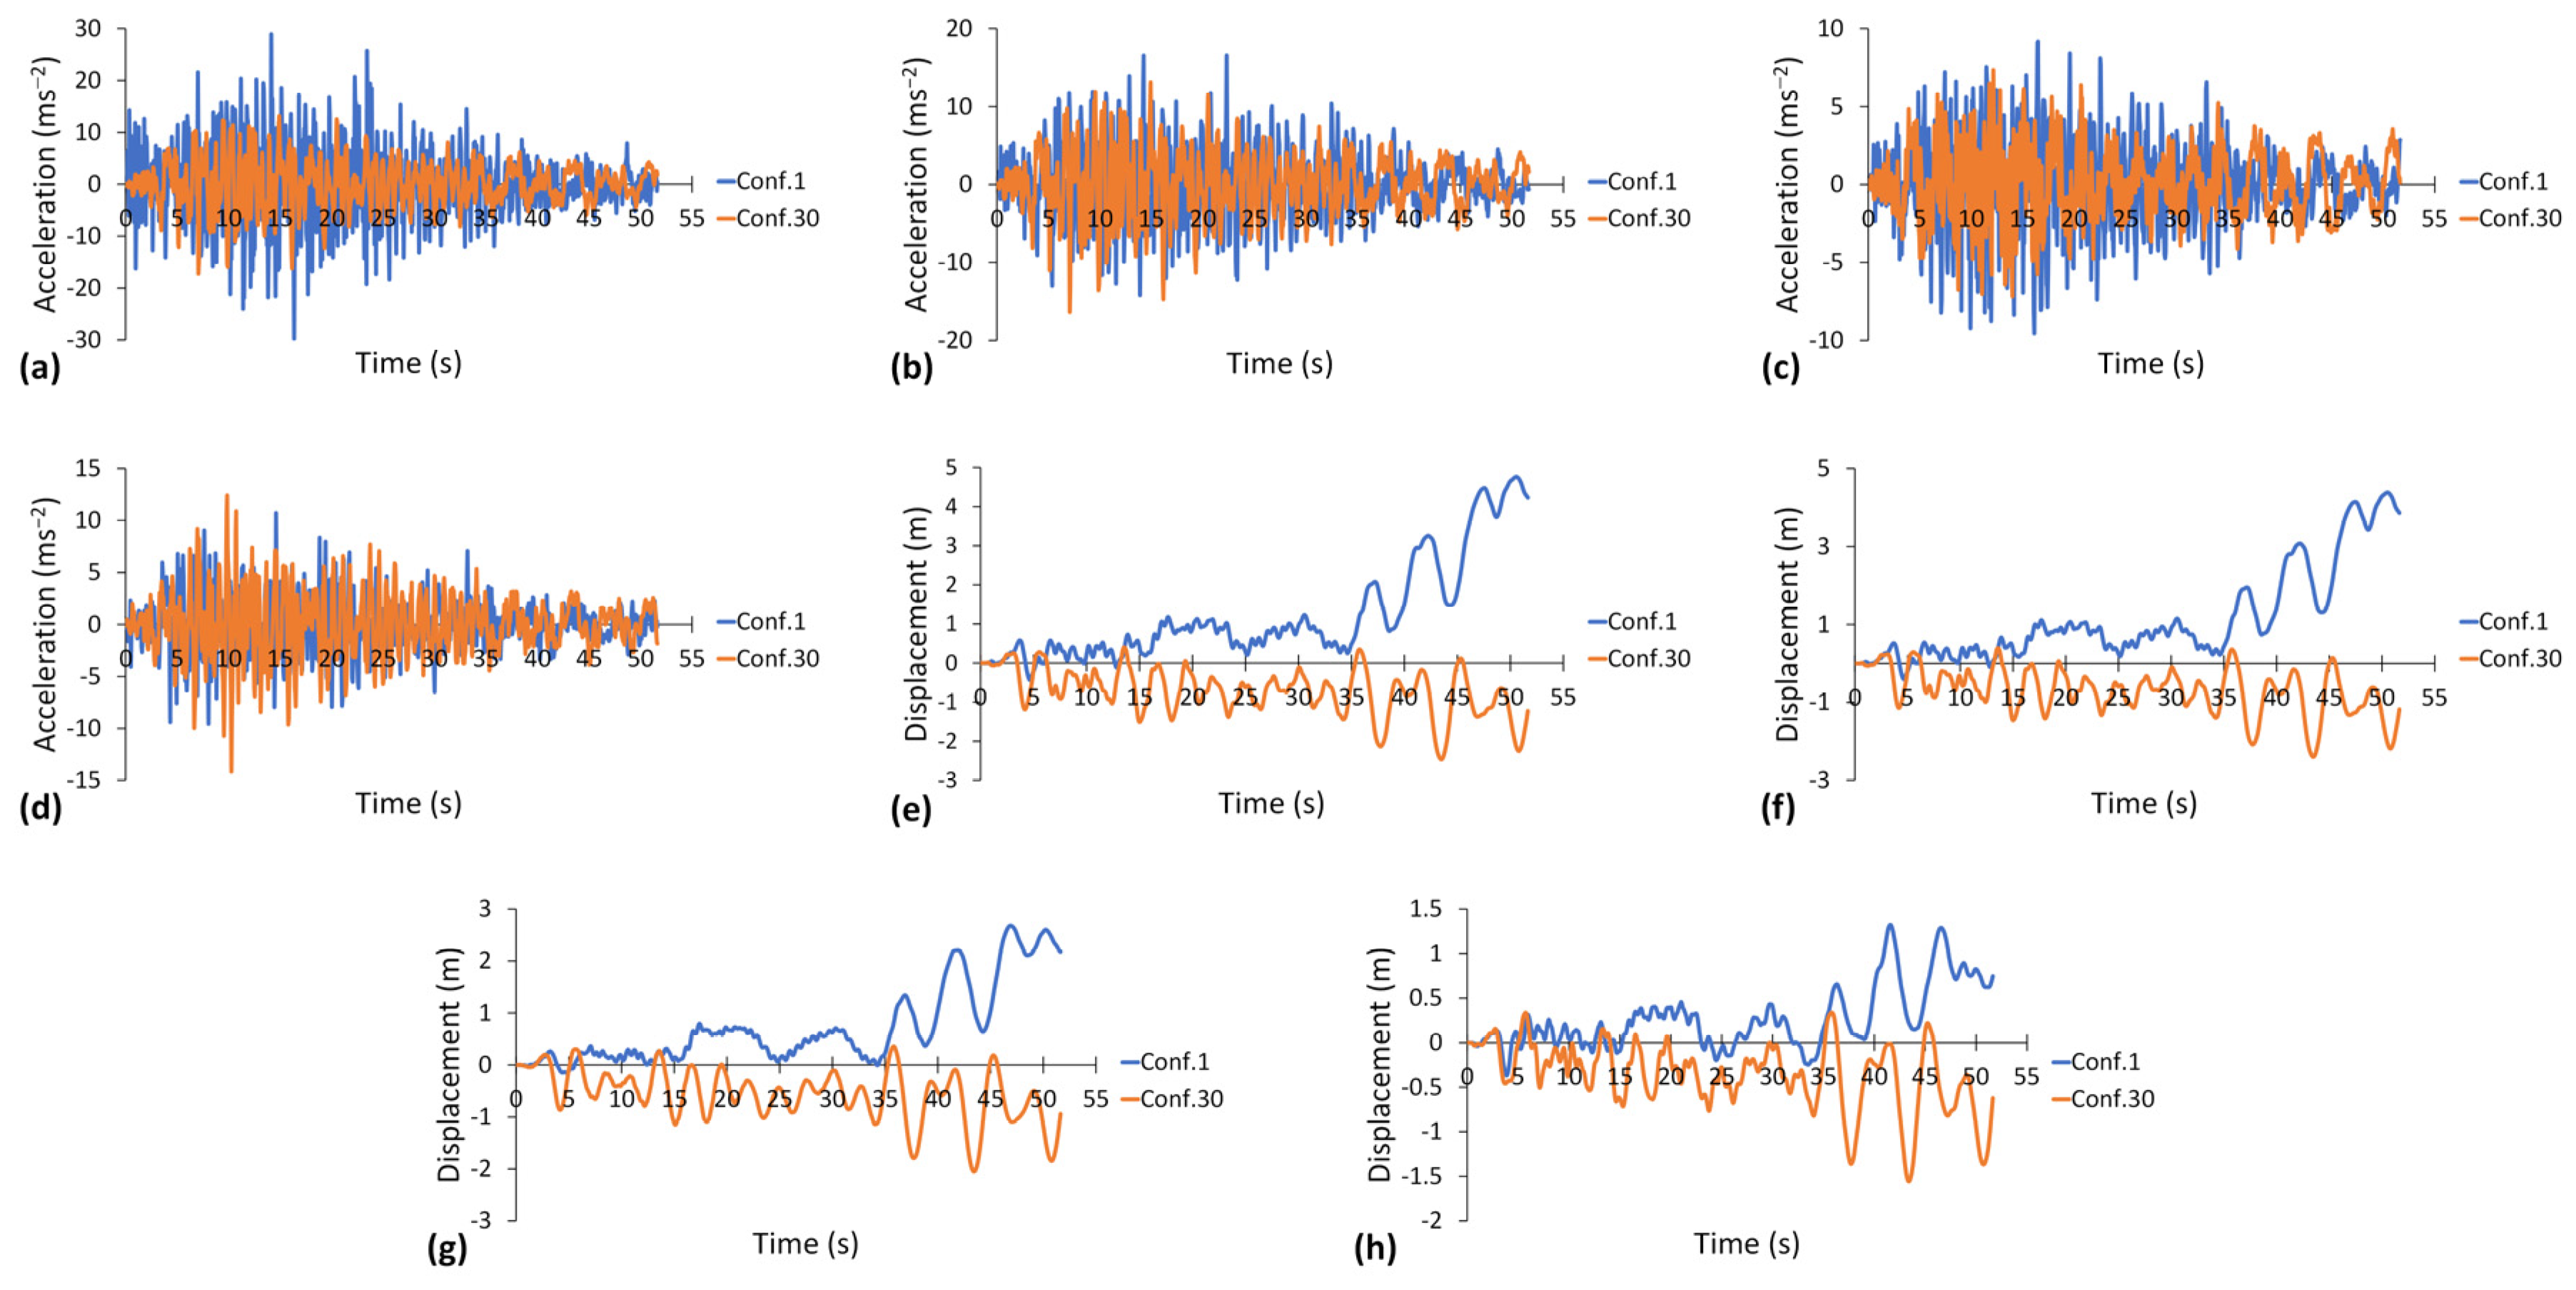
  • Configuration 30 showed a more consistent seismic structural response, as the maximum COV was 16% and 32% in the acceleration and displacement responses, respectively.
  • Compared to configuration 1, configuration 30 showed a mean improvement of 51% in plastic strain in columns, while in beams, it was 80%. The equivalent plastic strain in columns of configuration 30 never crossed the failure limits, but in beams, section failure occurred only under Taft and Kobe ground motions. Under Taft, the structure leans toward the left side because of plastic deformation in the mega-columns, which causes severe damage to the mega-frame of a structure.
  • Under Taft, configuration 30 dissipated 770 MJ of energy in the form of plastic deformation, which is approximately 30% less than that under configuration 1, and under the Kobe earthquake, plastic dissipation is 21.9% less than that under Taft. Configuration 1 shows catastrophic damage under the Landers and Taft earthquakes.
Overall, nonlinear dynamic analysis shows that the proposed configuration improves seismic performance through increased energy dissipation and lateral stiffness. The results of this study pave the way for future investigations into the seismic performance of MSCSS featuring steel plate shear walls. Stochastic optimal design control will be used in the future to investigate the uncertainty related to seismic excitation in an effort to enhance the controllability index

Author Contributions

M.M.S.: Conceptualization (lead); methodology (lead); software (lead); writing—original draft (lead); formal analysis (lead); writing—review and editing (equal); X.Z.: funding; review and editing (equal); conceptualization (supporting); writing—original draft (supporting); writing—review and editing (equal); X.W., M.A., Y.X. and B.F.: writing—review and editing (supporting); methodology (supporting); software (supporting). All authors have read and agreed to the published version of the manuscript.

Funding

This work is financially supported by the National Natural Science Foundation of China under grant no. 51878274.

Institutional Review Board Statement

Not applicable.

Informed Consent Statement

Not applicable.

Conflicts of Interest

The authors declare no conflict of interest.

Appendix A

In Equation (3), the submatrix CPA can be built as follows:
C P A = C p 1 , 1 + C 2 , 1 + C l , 1 + a d C 1 , 1 + a d C 1 , 2 C p 1 , 2 C p 1 , ( n 1 ) C p 2 , 1 C p 2 , 2 + C 3 , 1 + C l , 2 + a d C 2 , 1 + a d C 2 , 2 C p 2 , ( n 1 ) C p ( n 1 ) , 1 C p ( n 1 ) , 2 C p ( n 1 ) , ( n 1 ) + C l , ( n 1 ) + a d C ( n 1 ) , 1 + a d C ( n 1 ) , 2 ( n 1 ) x ( n 1 )
where CPi,j (i,j = 1,2,3,……,(n − 1)) is the element of damping matrix Cp of the mega-structure, Ci,1 (i = 2,3,4,……,n) is the shear stiffness value of the ith substructure, and Kli−1 (i = 2,3,4,……,n) is the damping of the ith−1 substructure’s lead rubber bearing over the addition column.
In Equation (3), the submatrix CS is composed of diagonal matrix CSi, and CSi-1 can be built as follows:
C s i 1 = C i 1 , 1 + C i 1 , 2 C i 1 , 2 0 0 0 C i 1 , 2 C i 1 , 2 + C i 1 , 3 C i 1 , 3 0 0 0 0 C i 1 , j C i 1 , j + C i 1 , j + 1 C i 1 , j + 1 0 0 C i 1 , n z 1 C i 1 , n z 1 + C i 1 , n z C i 1 , n z 0 0 0 C i 1 , n z C i 1 , n z + C a i 1 C a i 1 0 0 C a i 1 C l i 1 + C a i 1 n z + 1 x n z + 1              C i 1 , j = C s u b i 1 , j + C S W i 1 , j
where C s u b i 1 , j (i − 1 = 1,2, 3,……,(n − 1)), (j = 1,2,3,……,(nz + 1)), and C S W i 1 , j are the floor and shear wall damping values for jth floor of the ith-1 substructure, respectively, while C a i 1 and C l i 1 are the damping of the ith-1 substructure’s addition column and lead rubber bearing, respectively.
In Equation (5), the submatrix KPA can be built as follows:
K P A = [ K p 1 , 1 + K 2 , 1 + K l , 1 K p 1 , 2 K p 1 , ( n 1 ) K p 2 , 1 K p 2 , 2 + K 3 , 1 + K l , 2 K p 2 , ( n 1 ) K p ( n 1 ) , 1 K p ( n 1 ) , 2 K p ( n 1 ) , ( n 1 ) + K l ( n 1 ) ] ( n 1 ) x ( n 1 )
where KPi,j (i,j = 1,2,3,……,(n − 1)) is the element of stiffness matrix Kp of the mega-structure, Ki,1 (i = 2,3,4,……,n) is the shear stiffness value of the ith substructure, and Kli−1 (i = 2,3,4,……,n) is the shear stiffness of the ith-1 substructure’s lead rubber bearing over the addition column.
In Equation (5), the submatrix KC can be built as follows:
K C = [ ( K l 1 ) ( K 2 , 1 ) 0 0 0 0 ( K l 2 ) ( K 3 , 1 ) 0 0 0 ( K l ( n 2 ) ) ( K ( n 1 ) , 1 ) 0 0 0 0 ( K l ( n 1 ) ) ] ( n 1 ) x   [ ( n 1 ) ( n z + 1 ) ]
In Equation (5), the submatrix KS is composed of diagonal matrix KSi, and KSi−1 can be built as follows:
K s i 1 = K i 1 , 1 + K i 1 , 2 K i 1 , 2 0 0 0 K i 1 , 2 K i 1 , 2 + K i 1 , 3 K i 1 , 3 0 0 0 0 K i 1 , j K i 1 , j + K i 1 , j + 1 K i 1 , j + 1 0 0 K i 1 , n z 1 K i 1 , n z 1 + K i 1 , n z K i 1 , n z 0 0 0 K i 1 , n z K i 1 , n z + K a i 1 K a i 1 0 0 K a i 1 K l i 1 + K a i 1 n z + 1 x n z + 1                K i 1 , j = K s u b i 1 , j + K S W i 1 , j
where K s u b i 1 , j (i − 1 = 1,2, 3,……,(n − 1)), (j = 1,2,3,……,(nz + 1)), and K S W i 1 , j are the floor and shear wall stiffness values for jth floor of the ith-1 substructure, respectively, while K a i 1 and K l i 1 are the shear stiffness of the ith-1 substructure’s addition column and lead rubber bearing, respectively.
In Equation (14), the submatrix R can be built as follows:
R = [ 1 0 0 0 0 1 1 0 1 0 0 0 0 0 1 1 0 0 1 ] [ ( n + 1 ) + ( n 1 ) ( n z + 1 ) ] x [ ( n + 1 ) + ( n 1 ) ( n z + 1 ) ]

Appendix B

The dimensions of the ring-shaped infill panels used in configuration 12 are as follows:
Table A1. Ring-Shaped Infill Panel Dimensions.
Steel Infill Panel Properties (5 m × 4 m)Steel Infill Panel Properties (8.5 m × 4 m)
ParametersDimensionsParametersDimensions
Thickness6 mmThickness6 mm
Ro0.44 mRo0.4 m
wc0.11 mwc0.1 m
Wi0.15 mWi0.14 m
Broader at the top and bottom0.08 mBroader at the top and bottom0.2 m
Broader at the right and left sides0.1 mBroader at the right and left sides0.2 m
The dimensions of steel infill panels used in configurations 15 and 16 have changed as follows:
Table A2. Ring-Shaped Infill Panel Dimensions.
Steel Infill Panel Properties (5 m × 4 m)Steel Infill Panel Properties (8.5 m × 4 m)
ParametersDimensionsParametersDimensions
Thickness6 mmThickness6 mm
Ro0.42 mRo0.42 m
wc0.11 mwc0.11 m
Wi0.15 mWi0.15 m
Broader at the top and bottom0.12 mBroader at the top and bottom0.2 m
Broader at the right and left sides0.15 mBroader at the right and left sides0.2 m
The following are the details of the revised mega-column 1 (MC1) and substructure column 1 (SSC1) in configurations 17 and 18:
Table A3. Revised Section of MC1 and SSC1.
SectionsOldRevised
MC1800 × 800 × 34 × 34 mm900 × 900 × 34 × 34 mm
SSC1600 × 600 × 20 × 20 mm600 × 600 × 34 × 34 mm
The following section members’ profiles have been updated in configuration 21:
Table A4. Revised Section Members.
SectionsOld (mm)Revised (mm)
Substructural beams up to the 1st mega-beam500 × 250 × 18 × 10500 × 250 × 18 × 12
Substructural beams between the 1st and 4th mega-beam350 × 250 × 10 × 10350 × 250 × 12 × 12
The following are the revised section members in configuration 23:
Table A5. Revised Section Members.
SectionsOld (mm)Revised (mm)
MC 1800 × 800 × 34 × 34900 × 900 × 34 × 34
MC 2600 × 600 × 34 × 34800 × 800 × 34 × 34
MC 3600 × 600 × 20 × 20700 × 700 × 34 × 34
MC 4600 × 600 × 20 × 20600 × 600 × 34 × 34
MB 1~3600 × 350 × 25 × 16650 × 450 × 25 × 25
MB 4582 × 300 × 17 × 12600 × 300 × 18 × 18
MC Beam 1~2582 × 300 × 17 × 12582 × 350 × 20 × 20
MC Beam 3~4500 × 250 × 18 × 10500 × 300 × 18 × 18
SC 1600 × 600 × 20 × 20700 × 700 × 34 × 34
SC 2~4400 × 400 × 20 × 20600 × 600 × 34 × 34
SB 1500 × 250 × 18 × 12500 × 350 × 25 × 25
SB 2~4350 × 250 × 12 × 12500 × 300 × 18 ×18
MC Bracing 1350 × 300 × 25 × 25400 × 350 × 25 × 25
MC Bracing 2~4350 × 300 × 19 × 12350 × 350 × 25 × 25
Add Column400 × 400 × 20 × 20600 × 600 × 34 × 34
In configuration 25, MC Bracing 1 and MB 1~3 are revised, and their details are as follows:
Table A6. Revised Sections of MC Bracing1 & MB 1-3.
SectionsOld (mm)Revised (mm)
MC Bracing 1400 × 350 × 25 × 25450 × 350 × 30 × 30
MB 1~3650 × 450 × 25 × 25650 × 550 × 30 × 30
The following are the revised lead rubber bearing (LRB) parameters and substructure beams (SB) of substructures 2 to 4 in configuration 26:
Table A7. Revised Section of SB2~4.
SectionsOld (mm)Revised (mm)
SB 2~4500 × 300 × 18 ×18500 × 350 × 25 × 25
Table A8. Revised LRB Parameters.
Main LRB Small LRB
OldRevisedOldRevised
Bearing horizontal stiffness, Kh9.26 × 103 kNm−12.32 × 10³
kNm−1
Bearing horizontal stiffness, Kh4.17 × 103
kNm−1
1.27 × 10³
kNm−1
Bearing vertical stiffness, Kv3.59 × 107 kNm−14.10 × 10⁷
kNm−1
Bearing vertical stiffness, Kv2.59 × 107
kNm−1
3.16 × 10⁷
kNm−1
Rotation Linear Elastic, stiffness1.63 × 1010 kNm.rad1.75 × 1010
kNm.rad
Rotation Linear Elastic, stiffness4.84 × 109
kNm.rad
7.74 × 10⁹
kNm.rad
Torsion Linear Elastic, stiffness1.32 × 106 kPa6.83 × 105
kPa
Torsion Linear Elastic, stiffness1.07 × 106
kPa
6.12 × 10⁵
kPa
The first three mega-beams (MB 1~3) have been revised, as have the infill panel details added in the mega-column of the first substructures on floors 1 and 2.
Table A9. Revised Section MB1~3.
SectionsOld (mm)Revised (mm)
MB 1~3650 × 450 × 25 × 25650 × 550 × 30 × 30
Table A10. Ring-Shaped Infill Panel Dimensions (6.5 m × 4 m).
ParametersDimensions
Thickness8 mm
Ro0.4 m
wc0.1 m
Wi0.15 m
Broader at the top and bottom0.2 m
Broader at the right and left sides0.1 m
For configuration 32, the revised bracing in mega-columns for the entire structure (MC Bracing 1 and 2~4) is as follows:
Table A11. Revised Section of MC Bracing 1 and MC Bracing 2~4.
SectionsOld (mm)Revised (mm)
MC Bracing 1400 × 350 × 25 × 25450 × 350 × 30 × 30
MC Bracing 2~4350 × 350 × 25 × 25350 × 350 × 30 × 30
For configuration 33, the revised substructural beams for the entire structure (SB 1 and SB 2~4) are as follows:
Table A12. Revised Section Members of SB 1 & SB 2~4.
SectionsOld (mm)Revised (mm)
SB 1500 × 350 × 25 × 25500 × 350 × 30 × 30
SB 2~4500 × 300 × 18 ×18500 × 350 × 30 × 30

Appendix C

Configuration 1 serves as the base structure for configurations 2 to 22, while Configuration 23 serves as the base for configurations 24 to 33. The red structural members indicated the modification from the base structure.
Figure A1. Structural configuration: (a) Conf. 1, (b) Conf. 2, (c) Conf. 3, (d) Conf. 4, (e) Conf. 5, (f) Conf. 6, (g) Conf. 7, (h) Conf. 8, (i) Conf. 9, (j) Conf. 10, (k) Conf. 11, and (l) Conf. 12.
Buildings 12 00987 g0a1
Figure A2. Structural configuration: (a) Conf. 13, (b) Conf. 14, (c) Conf. 15, (d) Conf. 16, (e) Conf. 17, (f) Conf. 18, (g) Conf. 19, (h) Conf. 20, (i) Conf. 21, (j) Conf. 22, (k) Conf. 23, and (l) Conf. 24.
Buildings 12 00987 g0a2
Figure A3. Structural configuration: (a) Conf. 25, (b) Conf. 26, (c) Conf. 27, (d) Conf. 28, (e) Conf. 29, (f) Conf. 30, (g) Conf. 31, (h) Conf. 32, and (i) Conf. 33.
Buildings 12 00987 g0a3

References

  1. CTBUH. The Global Tall Buildings Database of the CTBUH. Available online: http://www.skyscrapercenter.com/ (accessed on 23 March 2020).
  2. Ali, M.M.; Moon, K.S. Structural Developments in Tall Buildings: Current Trends and Future Prospects. Arch. Sci. Rev. 2007, 50, 205–223. [Google Scholar] [CrossRef]
  3. Gunel, M.H.; Ilgin, H.E. Tall Buildings—Structural Systems and Aerodynamic Form; Routledge: Oxfordshire, UK, 2014. [Google Scholar] [CrossRef]
  4. Zhang, Z.; Nielsen, S.R.K.; Blaabjerg, F.; Zhou, D. Dynamics and Control of Lateral Tower Vibrations in Offshore Wind Turbines by Means of Active Generator Torque. Energies 2014, 7, 7746–7772. [Google Scholar] [CrossRef]
  5. Bhattacharya, S.; Adhikari, S. Experimental validation of soil–structure interaction of offshore wind turbines. Soil Dyn. Earthq. Eng. 2011, 31, 805–816. [Google Scholar] [CrossRef]
  6. Feng, M.Q.; Mita, A. Vibration Control of Tall Buildings Using Mega SubConfiguration. J. Eng. Mech. 1995, 121, 1082–1088. [Google Scholar] [CrossRef] [Green Version]
  7. Chai, W.; Feng, M.Q. Vibration control of super tall buildings subjected to wind loads. Int. J. Non-Linear Mech. 1997, 32, 657–668. [Google Scholar] [CrossRef] [Green Version]
  8. Lan, Z.; Fang, L.; Wang, X. Multifunctional shock-absorption system of RC megaframe structures. Ind. Constr. 2002, 32, 1–4. [Google Scholar]
  9. Xun’An, Z.; Dong, W.; Jiesheng, J. The controlling mechanism and the controlling effectiveness of passive mega-sub-controlled frame subjected to random wind loads. J. Sound Vib. 2005, 283, 543–560. [Google Scholar] [CrossRef]
  10. Zhang, X.; Zhang, J.; Wang, D.; Jiang, J. Controlling Characteristics of Passive Mega-Subcontrolled Frame Subjected to Random Wind Loads. J. Eng. Mech. 2005, 131, 1046–1055. [Google Scholar] [CrossRef]
  11. Lian, Y.; Zhang, X.; Sheldon, C. Damping characteristics of friction damped braced frame and its effectiveness in the mega-sub controlled structure system. Earthq. Eng. Eng. Vib. 2007, 6, 171–181. [Google Scholar] [CrossRef]
  12. Qin, X.; Zhang, X.; Sheldon, C. Study on semi-active control of mega-sub controlled structure by MR damper subject to random wind loads. Earthq. Eng. Eng. Vib. 2008, 7, 285–294. [Google Scholar] [CrossRef]
  13. Zhang, X.; Qin, X.; Cherry, S.; Lian, Y.; Zhang, J.; Jiang, J. A New Proposed Passive Mega-Sub Controlled Structure and Response Control. J. Earthq. Eng. 2009, 13, 252–274. [Google Scholar] [CrossRef]
  14. Li, T.; Zhang, X.A.; Wang, Q. Control characteristics of mega-sub controlled structure system with friction damper under rare earthquake. In Proceedings of the World Congress on Engineering 2012, London, UK, 4–6 July 2012; International Association of Engineers: Hong Kong, China, 2010; Volume 2189, pp. 791–796. [Google Scholar]
  15. Li, T.; Zhang, X.A.; Limazie, T. Viscous Dampers Installation Arrangement and Hysteresis Curve Characteristics Research on the Mega-Sub Controlled Structure System. Appl. Mech. Mater. 2011, 71–78, 1687–1690. [Google Scholar] [CrossRef]
  16. Abdulhadi, M.; Xun’an, Z.; Fan, B.; Moman, M. Design, Optimization and Nonlinear Response Control Analysis of the Mega Sub-Controlled Structural System (MSCSS) Under Earthquake Action. J. Earthq. Tsunami 2020, 14, 2050013. [Google Scholar] [CrossRef]
  17. Abdulhadi, M.; Xun’An, Z.; Fan, B.; Moman, M. Evaluation of Seismic Fragility Analysis of the Mega Sub-Controlled Structural System (MSCSS). J. Earthq. Tsunami 2020, 14, 2050025. [Google Scholar] [CrossRef]
  18. Wang, X.; Zhang, X.; Shahzad, M.M.; Shi, X. Research on the disaster prevention mechanism of mega-sub controlled structural system by vulnerability analysis. Structures 2021, 33, 4481–4491. [Google Scholar] [CrossRef]
  19. Wang, X.; Zhang, X.; Shahzad, M.M.; Wang, T. Research on dynamic response characteristics and control effect of mega-sub controlled structural system under long-period ground motions. Structures 2020, 29, 225–234. [Google Scholar] [CrossRef]
  20. Abdulhadi, M.; Xun’an, Z.; Fan, B.; Moman, M. Substructure design optimization and nonlinear responses control analysis of the mega-sub controlled structural system (MSCSS) under earthquake action. Earthq. Eng. Eng. Vib. 2021, 20, 687–704. [Google Scholar] [CrossRef]
  21. Shahzad, M.M.; Zhang, X.; Wang, X.; Abdulhadi, M.; Wang, T.; Xiao, Y. Response control analysis of a new mega-subcontrolled structural system (MSCSS) under seismic excitation. Struct. Des. Tall Spéc. Build. 2022, 31, e1935. [Google Scholar] [CrossRef]
  22. Bruneau, M.; Bhagwagar, T. Seismic retrofit of flexible steel frames using thin infill panels. Eng. Struct. 2002, 24, 443–453. [Google Scholar] [CrossRef]
  23. Berman, J.; Bruneau, M. Plastic Analysis and Design of Steel Plate Shear Walls. J. Struct. Eng. 2003, 129, 1448–1456. [Google Scholar] [CrossRef] [Green Version]
  24. Berman, J.W. Seismic behavior of code designed steel plate shear walls. Eng. Struct. 2010, 33, 230–244. [Google Scholar] [CrossRef]
  25. Daniel, J.B.; Larry, A.F. Seismic Design and Analysis of Steel Plate Shear Walls with Coupling. J. Struct. Eng. 2013, 139, 1263–1273. [Google Scholar] [CrossRef]
  26. Shahzad, M.M.; Zhang, X.; Wang, X.; Abdulhadi, M. Comparative response assessment of different steel plate shear walls (SPSWs) under near-field ground motion. J. Constr. Steel Res. 2022, 190, 107147. [Google Scholar] [CrossRef]
  27. Sabelli, R.; Bruneau, M. Design Guide 20: Steel Plate Shear Walls; American Institute of Steel Construction: Chicago, IL, USA, 2007. [Google Scholar]
  28. Qureshi, R.; Bruneau, M. Behavior of Steel Plate Shear Walls Subjected to Long Duration Earthquakes; State University of New York: Buffalo, NY, USA, 2016. [Google Scholar]
  29. Lv, Y.; Li, Z.-X. Influences of the gravity loads on the cyclic performance of unstiffened steel plate shear wall. Struct. Des. Tall Spéc. Build. 2016, 25, 988–1008. [Google Scholar] [CrossRef]
  30. Maurya, A. Computational Simulation and Analytical Development of Buckling Resistant Steel Plate Shear Wall (BR-SPSW). Master’s Thesis, Department of Civil and Environmental Engineering, Virginia Polytechnic Institute and State University, Blacksburg, VA, USA, 2012. [Google Scholar]
  31. Egorova, N.; Eatherton, M.R.; Maurya, A. Experimental study of ring-shaped steel plate shear walls. J. Constr. Steel Res. 2014, 103, 179–189. [Google Scholar] [CrossRef] [Green Version]
  32. ASCE/SEI 7–16; Minimum Design Loads and Associated Criteria for Buildings and Other Structures. American Society of Civil Engineers: Reston, VA, USA, 2016.
  33. Kawashima, K.; Aizawa, K. Bracketed and normalized durations of earthquake ground acceleration. Earthq. Eng. Struct. Dyn. 1989, 18, 1041–1051. [Google Scholar] [CrossRef]
  34. ASCE/SEI 41-17; Seismic Evaluation and Retrofit of Existing Buildings. American Society of Civil Engineers: Reston, VA, USA, 2017.
  35. Lilhanand, K.; Tseng, W. Generation of synthetic time histories compatible with multiple-damping design response spectra. In Proceedings of the 9th International Conference on Structural Mechanics in Reactor Technology, Lausanne, Switzerland, 17–21 August 1987; Volume K1. [Google Scholar]
  36. Lilhanand, K.; Tseng, W.S. Development and application of realistic earthquake time histories compatible with multiple-damping design spectra. In Proceedings of the 9th World Conference on Earthquake Engineering, Tokyo-Kyoto, Japan, 2–9 August 1988; Japan Association for Earthquake Disaster Prevention: Tokyo, Japan, 1989; Volume 2, pp. 819–824. [Google Scholar]
  37. Abrahamson, N. Non-stationary spectral matching. Seismol. Res. Lett. 1992, 63, 30. [Google Scholar]
  38. Hancock, J.; Watson-Lamprey, J.; Abrahamson, N.A.; Bommer, J.J.; Markatis, A.; McCOYH, E.; Mendis, R. An improved method of matching response spectra of recorded earthquake ground motion using wavelets. J. Earthq. Eng. 2006, 10, 67–89. [Google Scholar] [CrossRef]
  39. Al Atik, L.; Abrahamson, N. An Improved Method for Nonstationary Spectral Matching. Earthq. Spectra 2010, 26, 601–617. [Google Scholar] [CrossRef] [Green Version]
  40. Kelly, J.M. Base Isolation: Linear Theory and Design. Earthq. Spectra 1990, 6, 223–244. [Google Scholar] [CrossRef]
  41. Kelly, J.M. Earthquake-Resistant Design with Rubber; Springer: London, UK, 1993. [Google Scholar]
  42. Wang, S.-J.; Chang, K.-C.; Hwang, J.-S.; Lee, B.-H. Simplified analysis of mid-story seismically isolated buildings. Earthq. Eng. Struct. Dyn. 2011, 40, 119–133. [Google Scholar] [CrossRef]
  43. Wang, S.-J.; Chang, K.-C.; Hwang, J.-S.; Hsiao, J.-Y.; Lee, B.-H.; Hung, Y.-C. Dynamic behavior of a building structure tested with base and mid-story isolation systems. Eng. Struct. 2012, 42, 420–433. [Google Scholar] [CrossRef]
  44. Driver, R.G. Seismic Behaviour of Steel Plate Shear Walls. Ph.D. Thesis, Department of Civil and Environmental Engineering, University of Alberta Edmonton, Edmonton, AB, Canada, 1997. [Google Scholar]
Figure 1. Spectral acceleration: (a) spectra before matching, (b) mean spectral matching, (c) spectra after matching, and (d) time history of Nahanni.
Buildings 12 00987 g001
Figure 2. Configurations: (a) MSCSS with mid-story isolation [21] and (b) newly proposed MSCSS. Dimensions are in meters. (Adapted with permission from [21]).
Buildings 12 00987 g002
Figure 3. Computing model of newly proposed MSCSS [21]: (a) whole system, (b) superstructure, (c) ith Substructure, (d) mid-story isolator, (e) bottom structure, and (f) three-lumped-mass structural model. (Adapted with permission from [21]).
Buildings 12 00987 g003
Figure 4. Ring-shaped infill panel.
Buildings 12 00987 g004
Figure 5. Modal Analysis Results: (a) Conf.1 mode 1, (b) Conf.1 mode 2, (c) Conf.1 mode 3, (d) Conf.30 mode 1, (e) Conf.30 mode 2, and (f) Conf.30 mode 3.
Buildings 12 00987 g005
Figure 6. Settlement at the top of the structure.
Buildings 12 00987 g006
Figure 7. Maximum Equivalent Plastic Strain.
Buildings 12 00987 g007
Figure 8. Equivalent plastic strain nephogram: (a) configuration 1, (b) configuration 2, and (c) configuration 30.
Buildings 12 00987 g008
Figure 9. Equivalent plastic strain in different configurations under the Nahanni earthquake: in the (a) column and (b) beam.
Buildings 12 00987 g009
Figure 10. Energy dissipation in different configurations under the Nahanni earthquake: (a) plastic dissipation and (b) viscous dissipation.
Buildings 12 00987 g010
Figure 11. Peak transient story drift of different configurations under the Nahanni earthquake: (a) mega-frame, (b) first substructure, (c) second substructure, and (d) third substructure.
Buildings 12 00987 g011
Figure 12. Residual story drift of different configurations under the Nahanni earthquake: (a) mega-frame, (b) first substructure, (c) second substructure, and (d) third substructure.
Buildings 12 00987 g012
Figure 13. Seismic performance of different infill panels in configurations under the Nahanni earthquake: (a) settlement at the top of the structure and (b) maximum equivalent plastic strain.
Buildings 12 00987 g013
Figure 14. Seismic performance of different infill panels in the configurations under the Nahanni earthquake: (a) plastic dissipation and (b) viscous dissipation.
Buildings 12 00987 g014
Figure 15. Structural response time histories under Landers earthquake: (a) acceleration at the top of the structure, (b) acceleration at the top of the fourth substructure, (c) acceleration at the top of the third substructure, (d) acceleration at the top of the second substructure, (e) displacement at the top of the structure, (f) displacement at the top of the fourth substructure, and (g) displacement at the top of the third substructure and (h) displacement at the top of the second substructure.
Buildings 12 00987 g015
Figure 16. Max. equivalent plastic strain under Landers earthquake: (a) in beam and (b) in column.
Buildings 12 00987 g016
Figure 17. Max. equivalent plastic strain in configuration 30 under selected earthquake: (a) in beam and (b) in column.
Buildings 12 00987 g017
Figure 18. Structural response time histories under Taft earthquake: (a) acceleration at the top of the structure, (b) acceleration at the top of the fourth substructure, (c) acceleration at the top of the third substructure, (d) acceleration at the top of the second substructure, (e) displacement at the top of the structure, (f) displacement at the top of the fourth substructure, (g) displacement at the top of the third substructure, and (h) displacement at the top of the second substructure.
Buildings 12 00987 g018
Figure 19. Parametric comparison: (a) plastic dissipation, (b) viscous dissipation, (c) equivalent plastic strain improvement, and (d) settlement at the top of the structure.
Buildings 12 00987 g019
Table 1. Selected Ground Motions.
EventYearStationMwMechanismRjb (km)Rrup (km)Arias Intensity (m/s)
Imperial Valley1940El Centro Array # 96.95Strike Slip6.096.091.6
Imperial Valley1979El Centro Array # 136.53Strike Slip21.9821.980.3
Chi-Chi1999TCU0457.62Reverse Oblique26261.4
Kobe1995Kakogawa6.9Strike Slip22.522.51.7
Kocaeli1999Yarimca7.51Strike Slip1.384.831.3
Kern County1952Taft Lincoln School7.36Reverse38.4238.890.6
Landers1992Lucerne7.28Strike Slip2.192.197
Northridge1994Canoga Park6.69Reverse014.72.8
Nahanni1985Site 16.76Reverse2.489.63.9
El Salvador2001Santiago de Maria7.6Strike SlipEpicenter 52.2 km11.7
Valparaiso1985San Isidro8Reverse ObliqueEpicenter 33 km16
Table 2. Ring-Shaped Infill Panel Dimensions (5 m × 4 m).
ParametersDimensions
Thickness6 mm
Ro0.44 m
wc0.11 m
Wi0.15 m
Broader at the top and bottom0.08 m
Broader at the right and left sides0.1 m
Table 3. Section Member Properties of Configuration 30.
MemberSection ShapeSection Size (mm)Area (m2)Moment of InertiaSection ModulusRadius of Gyration
Ix (m4)Iy (m4)Wx (m3)Wy (m3)Rgx (m)Rgy (m)
Mega-columns up to the 1st mega-beam Buildings 12 00987 i001900 × 900 × 34 × 340.11780.01470.01470.03280.03280.35380.3538
Mega-columns between the 1st and 2nd mega-beams Buildings 12 00987 i001800 × 800 × 34 × 340.10420.01020.01020.02550.02550.3130.313
Mega-columns between the 2nd and 3rd mega-beams Buildings 12 00987 i001700 × 700 × 34 × 340.09066.713 × 10−36.713 × 10−30.01920.01920.27220.2722
Mega-columns between the 3rd and 4th mega-beams Buildings 12 00987 i001600 × 600 × 34 × 340.0776.165 × 10−36.165 × 10−30.01370.01370.23150.2315
Substructural columns up to the 1st mega-beam Buildings 12 00987 i001700 × 700 × 34 × 340.09066.713 × 10−36.713 × 10−30.01920.01920.27220.2722
Substructural columns between the 1st and 4th mega-beams Buildings 12 00987 i001600 × 600 × 34 × 340.0776.165 × 10−36.165 × 10−30.01370.01370.23150.2315
Additional columns Buildings 12 00987 i001600 × 600 × 34 × 340.0776.165 × 10−36.165 × 10−30.01370.01370.23150.2315
Mega-beams 1, 2 and 3H650 × 550 × 30 × 300.05073.687 × 10−38.332 × 10−30.01133.030 × 10−30.26970.1282
Mega-beam 4H600 × 300 × 18 × 180.02191.426 × 10−38.13 × 10−54.388 × 10−35.42 × 10−40.25550.061
Beams between the mega-columns up to the 2nd mega-beamH582 × 350 × 20 × 200.02481.371 × 10−31.433 × 10−44.712 × 10−38.187 × 10−40.2350.0759
Beams between the mega-columns from the 2nd to 4th mega-beamH500 × 300 × 18 × 180.01927.774 × 10−48.123 × 10−53.11 × 10−35.415 × 10−40.20150.0651
Bracing in the mega-columns up to mega-beam 1H450 × 350 × 30 × 300.03271.076 × 10−32.153 × 10−44.782 × 10−31.23 × 10−30.18140.0811
Bracing in the mega-columns above mega-beam 1H350 × 350 × 25 × 250.0255.193 × 10−41.79 × 10−42.967 × 10−31.023 × 10−30.14410.0846
Substructural beamsH500 × 350 × 25 × 250.02881.178 × 10−31.792 × 10−44.711 × 10−31.024 × 10−30.20240.079
Table 4. Fundamental Natural Period.
Configuration NameModal Time Period (s)Modal Frequency (Hz)
Mode 1Mode 2Mode 3Mode 1Mode 2Mode 3
Conf.14.3204.1712.6500.2310.2400.377
Conf.24.3344.1972.6510.2310.2380.377
Conf.34.2814.2662.6220.2340.2340.381
Conf.44.3774.2352.6860.2280.2360.372
Conf.54.3394.2872.6860.2300.2330.372
Conf.64.6064.6064.4020.2170.2170.227
Conf.74.6064.6064.4000.2170.2170.227
Conf.84.5154.5154.3160.2210.2210.232
Conf.94.5154.5154.3140.2210.2210.232
Conf.104.4274.4274.2310.2260.2260.236
Conf.114.4274.4274.2290.2260.2260.236
Conf.125.1355.1354.5190.1950.1950.221
Conf.135.5295.5294.9680.1810.1810.201
Conf.145.2355.1524.6000.1910.1940.217
Conf.155.0835.0144.3650.1970.1990.229
Conf.165.0785.0174.3640.1970.1990.229
Conf.174.9844.9134.3650.2010.2040.229
Conf.184.9784.9194.3640.2010.2030.229
Conf.194.9614.8883.2750.2020.2050.305
Conf.204.9534.8963.2750.2020.2040.305
Conf.214.8094.7302.9770.2080.2110.336
Conf.225.5295.5294.8550.1810.1810.206
Conf.233.9163.8652.7690.2550.2590.361
Conf.243.9233.8743.4590.2550.2580.289
Conf.253.8423.7943.4590.2600.2640.289
Conf.263.7413.6993.4590.2670.2700.289
Conf.273.8773.8272.7420.2580.2610.365
Conf.283.8843.8353.4240.2570.2610.292
Conf.293.8043.7563.4240.2630.2660.292
Conf.303.7043.6633.4240.2700.2730.292
Conf.313.8393.7892.7150.2600.2640.368
Conf.323.8463.7973.3910.2600.2630.295
Conf.333.7663.7193.3910.2660.2690.295
Table 5. Max. Floor Acceleration at the Main Points of Structure.
Top of the StructureTop of the 4th
Substructure
Top of the 3rd
Substructure
Top of the 2nd
Substructure
Max. Acc. (ms−2)Acc. RMS. (ms−2)Max. Acc. (ms−2)Acc. RMS. (ms−2)Max. Acc. (ms−2)Acc. RMS. (ms−2)Max. Acc. (ms−2)Acc. RMS. (ms−2)
Configuration 1Imperial Valley, 194026.806.9213.694.439.612.799.582.70
Imperial Valley, 197927.515.8915.233.6010.102.3910.902.39
Taft29.786.8716.564.259.542.7510.722.51
Chi-Chi22.233.4013.792.037.661.127.901.33
Kobe25.495.0415.303.0512.451.917.801.88
Kocaeli23.305.6815.003.589.742.128.612.15
Landers36.135.0714.063.028.791.868.641.90
Northridge31.645.8514.743.519.642.278.722.08
Nahanni25.567.0114.084.409.312.7611.402.68
El Salvador34.936.3716.024.1911.332.7712.232.65
Valparaiso25.257.6219.354.8810.062.7210.523.01
Mean (µ)28.065.9715.263.729.842.319.732.30
Variance, σ218.861.282.430.611.410.262.050.21
SD, σ4.341.131.560.781.190.511.430.46
CoV, %15%19%10%21%12%22%15%20%
Configuration 30Imperial Valley, 194018.594.1617.643.798.412.1110.512.70
Imperial Valley, 197919.653.8017.613.488.621.8811.172.53
Taft17.234.2516.353.927.342.2114.152.93
Chi-Chi13.922.4812.452.345.751.5310.041.48
Kobe19.263.9917.953.697.802.2213.972.61
Kocaeli15.394.1613.633.836.331.9411.782.87
Landers17.683.1615.632.946.641.7812.022.09
Northridge16.183.3514.873.057.631.7911.922.22
Nahanni17.805.0416.654.609.902.3811.983.53
El Salvador16.984.1116.273.7310.052.1712.802.74
Valparaiso17.864.6216.164.168.232.7512.322.95
Mean (µ)17.323.9215.933.597.882.0712.062.61
Variance, σ22.560.452.660.351.690.101.450.26
SD, σ1.600.671.630.591.300.321.210.51
CoV, %9%17%10%17%16%15%10%20%
Table 6. Max. Floor Displacement at the Main Points of Structure.
Top of the StructureTop of the 4th
Substructure
Top of the 3rd
Substructure
Top of the 2nd
Substructure
Max. Disp. (m)Disp. RMS. (m)Max. Disp. (m)Disp. RMS. (m)Max. Disp. (m)Disp. RMS. (m)Max. Disp. (m)Disp. RMS. (m)
Configuration 1Imperial Valley, 19401.090.621.030.580.770.390.500.25
Imperial Valley, 19792.020.841.970.821.680.691.220.49
Taft4.761.794.391.662.681.051.320.44
Chi-Chi1.630.561.560.541.190.461.040.36
Kobe1.410.581.320.540.930.370.790.27
Kocaeli2.621.252.441.171.560.791.200.43
Landers18.264.0116.463.627.831.871.300.48
Northridge1.030.600.980.570.680.420.490.30
Nahanni2.660.772.540.731.890.541.000.34
El Salvador1.940.611.820.581.110.380.760.21
Valparaiso1.670.731.590.701.100.500.630.24
Mean (µ)3.551.123.281.051.950.680.930.35
Variance, σ222.610.9618.170.773.760.180.090.01
SD, σ4.760.984.260.881.940.430.300.10
CoV, %134%87%130%84%100%63%32%28%
Configuration 30Imperial Valley, 19400.780.320.750.310.610.240.430.16
Imperial Valley, 19791.230.461.200.450.960.410.880.37
Taft2.460.932.390.902.050.741.560.52
Chi-Chi1.630.491.590.481.350.421.020.33
Kobe1.730.551.690.531.450.441.130.32
Kocaeli1.700.591.690.581.630.521.520.44
Landers1.460.531.430.531.260.461.000.37
Northridge1.380.521.340.501.080.420.730.27
Nahanni1.930.611.880.601.630.531.250.44
El Salvador1.320.391.290.381.120.320.860.25
Valparaiso1.180.331.150.320.980.260.740.19
Mean (µ)1.530.521.490.511.280.431.010.33
Variance, σ20.180.030.170.020.140.020.110.01
SD, σ0.420.160.410.150.380.130.320.11
CoV, %28%31%28%30%30%30%32%32%
Publisher’s Note: MDPI stays neutral with regard to jurisdictional claims in published maps and institutional affiliations.

