
Nonlinear Seismic Assessment of a Historic Rubble Masonry Building via Simplified and Advanced Computational Approaches

Abstract
:1. Introduction
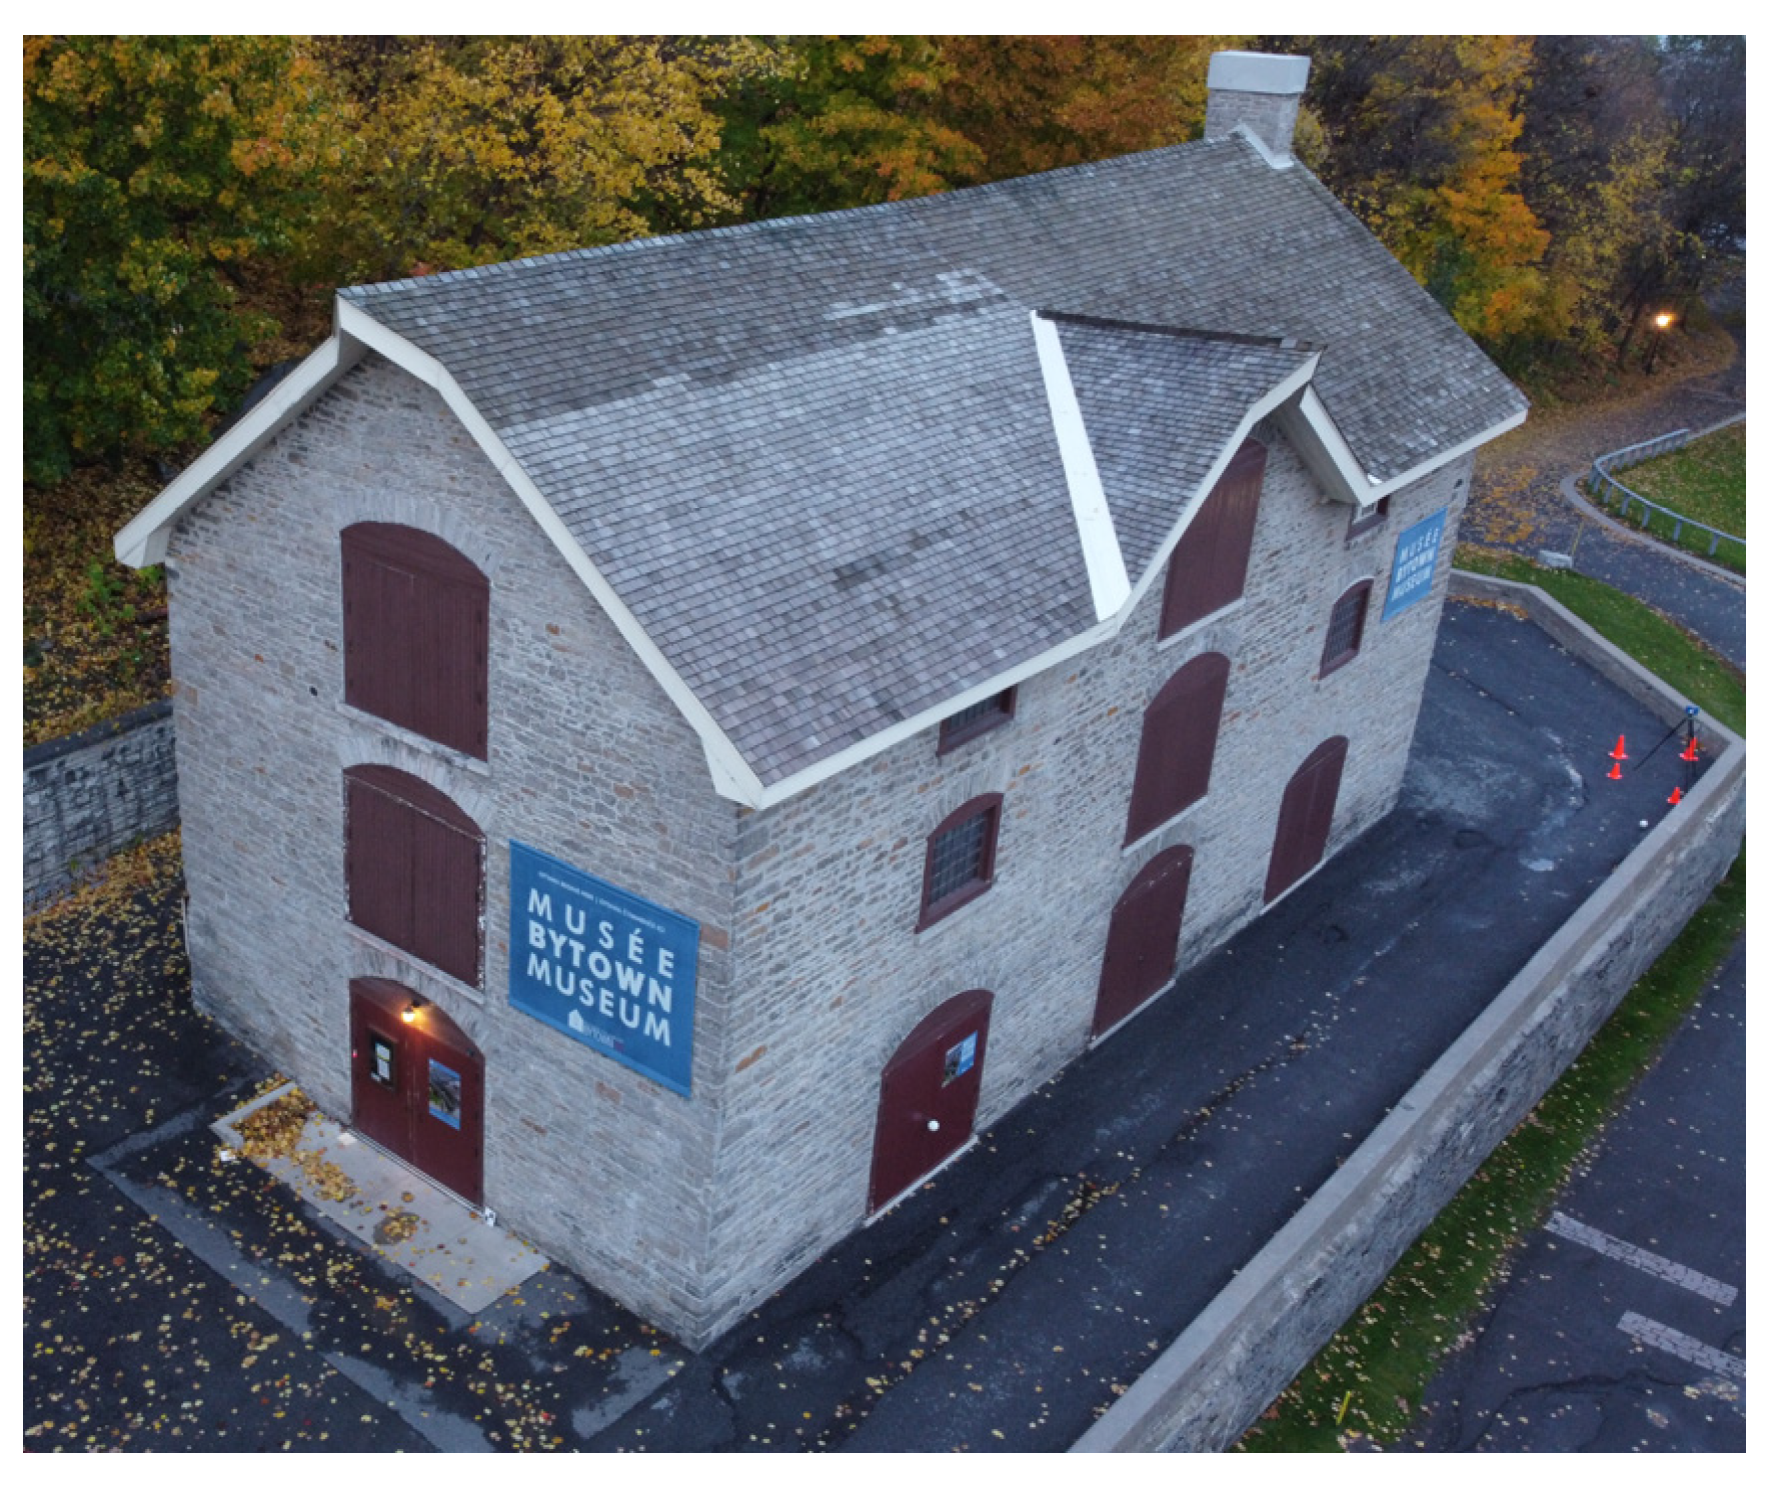
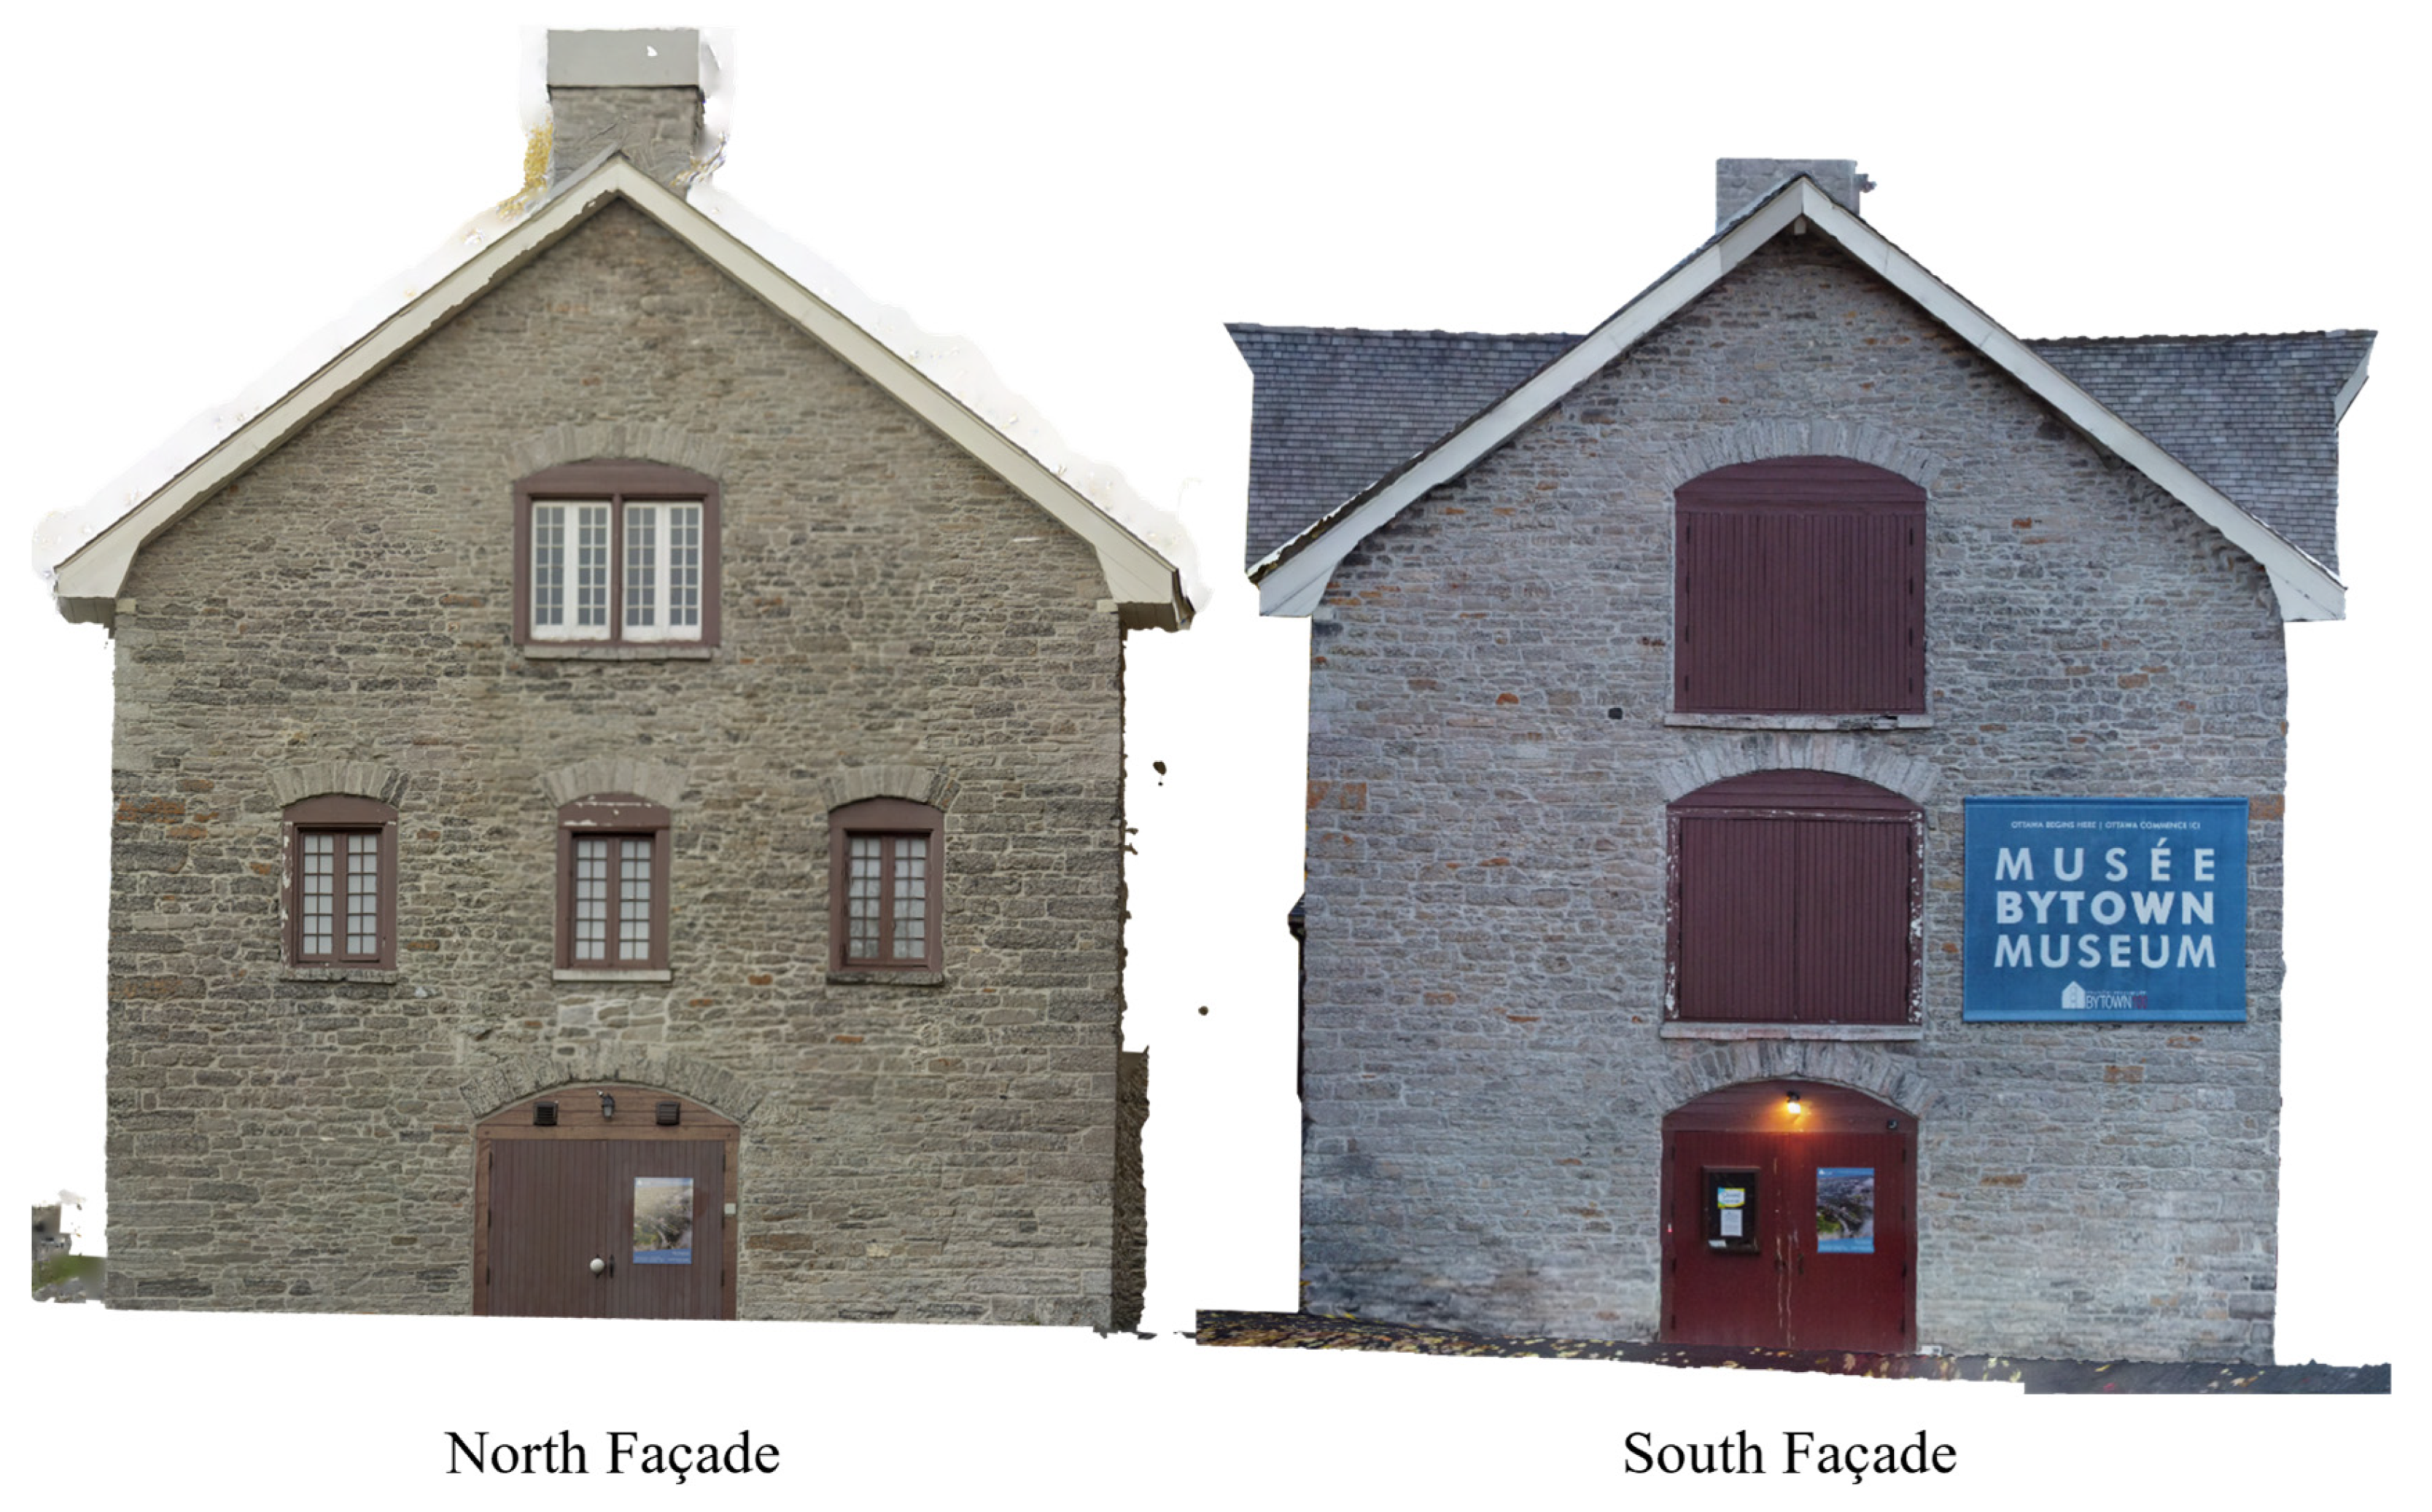
2. Bytown Museum
3. Brief Overview of Discrete Rigid Block Analysis (D-RBA)
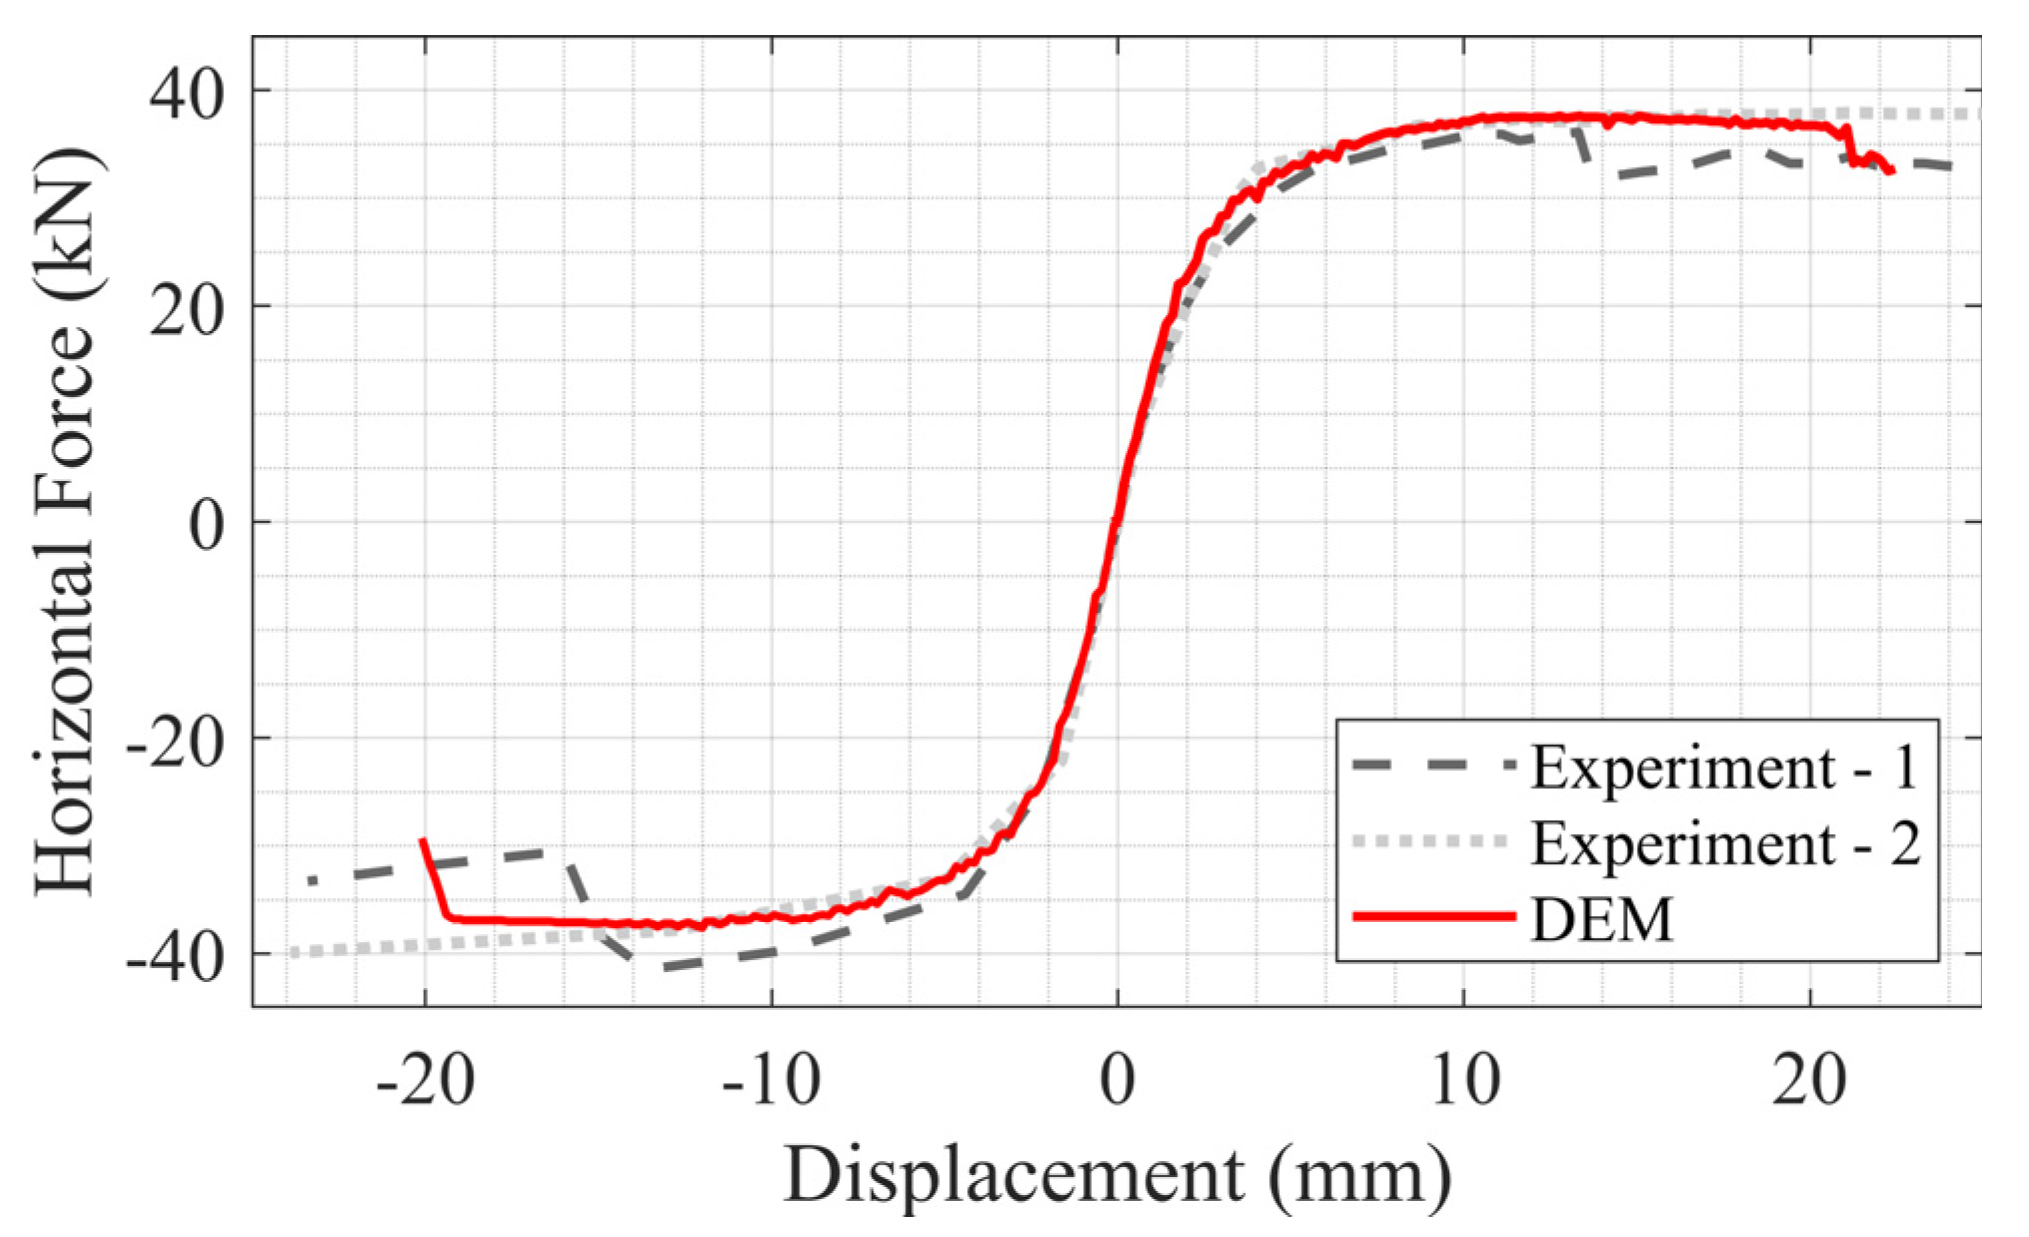
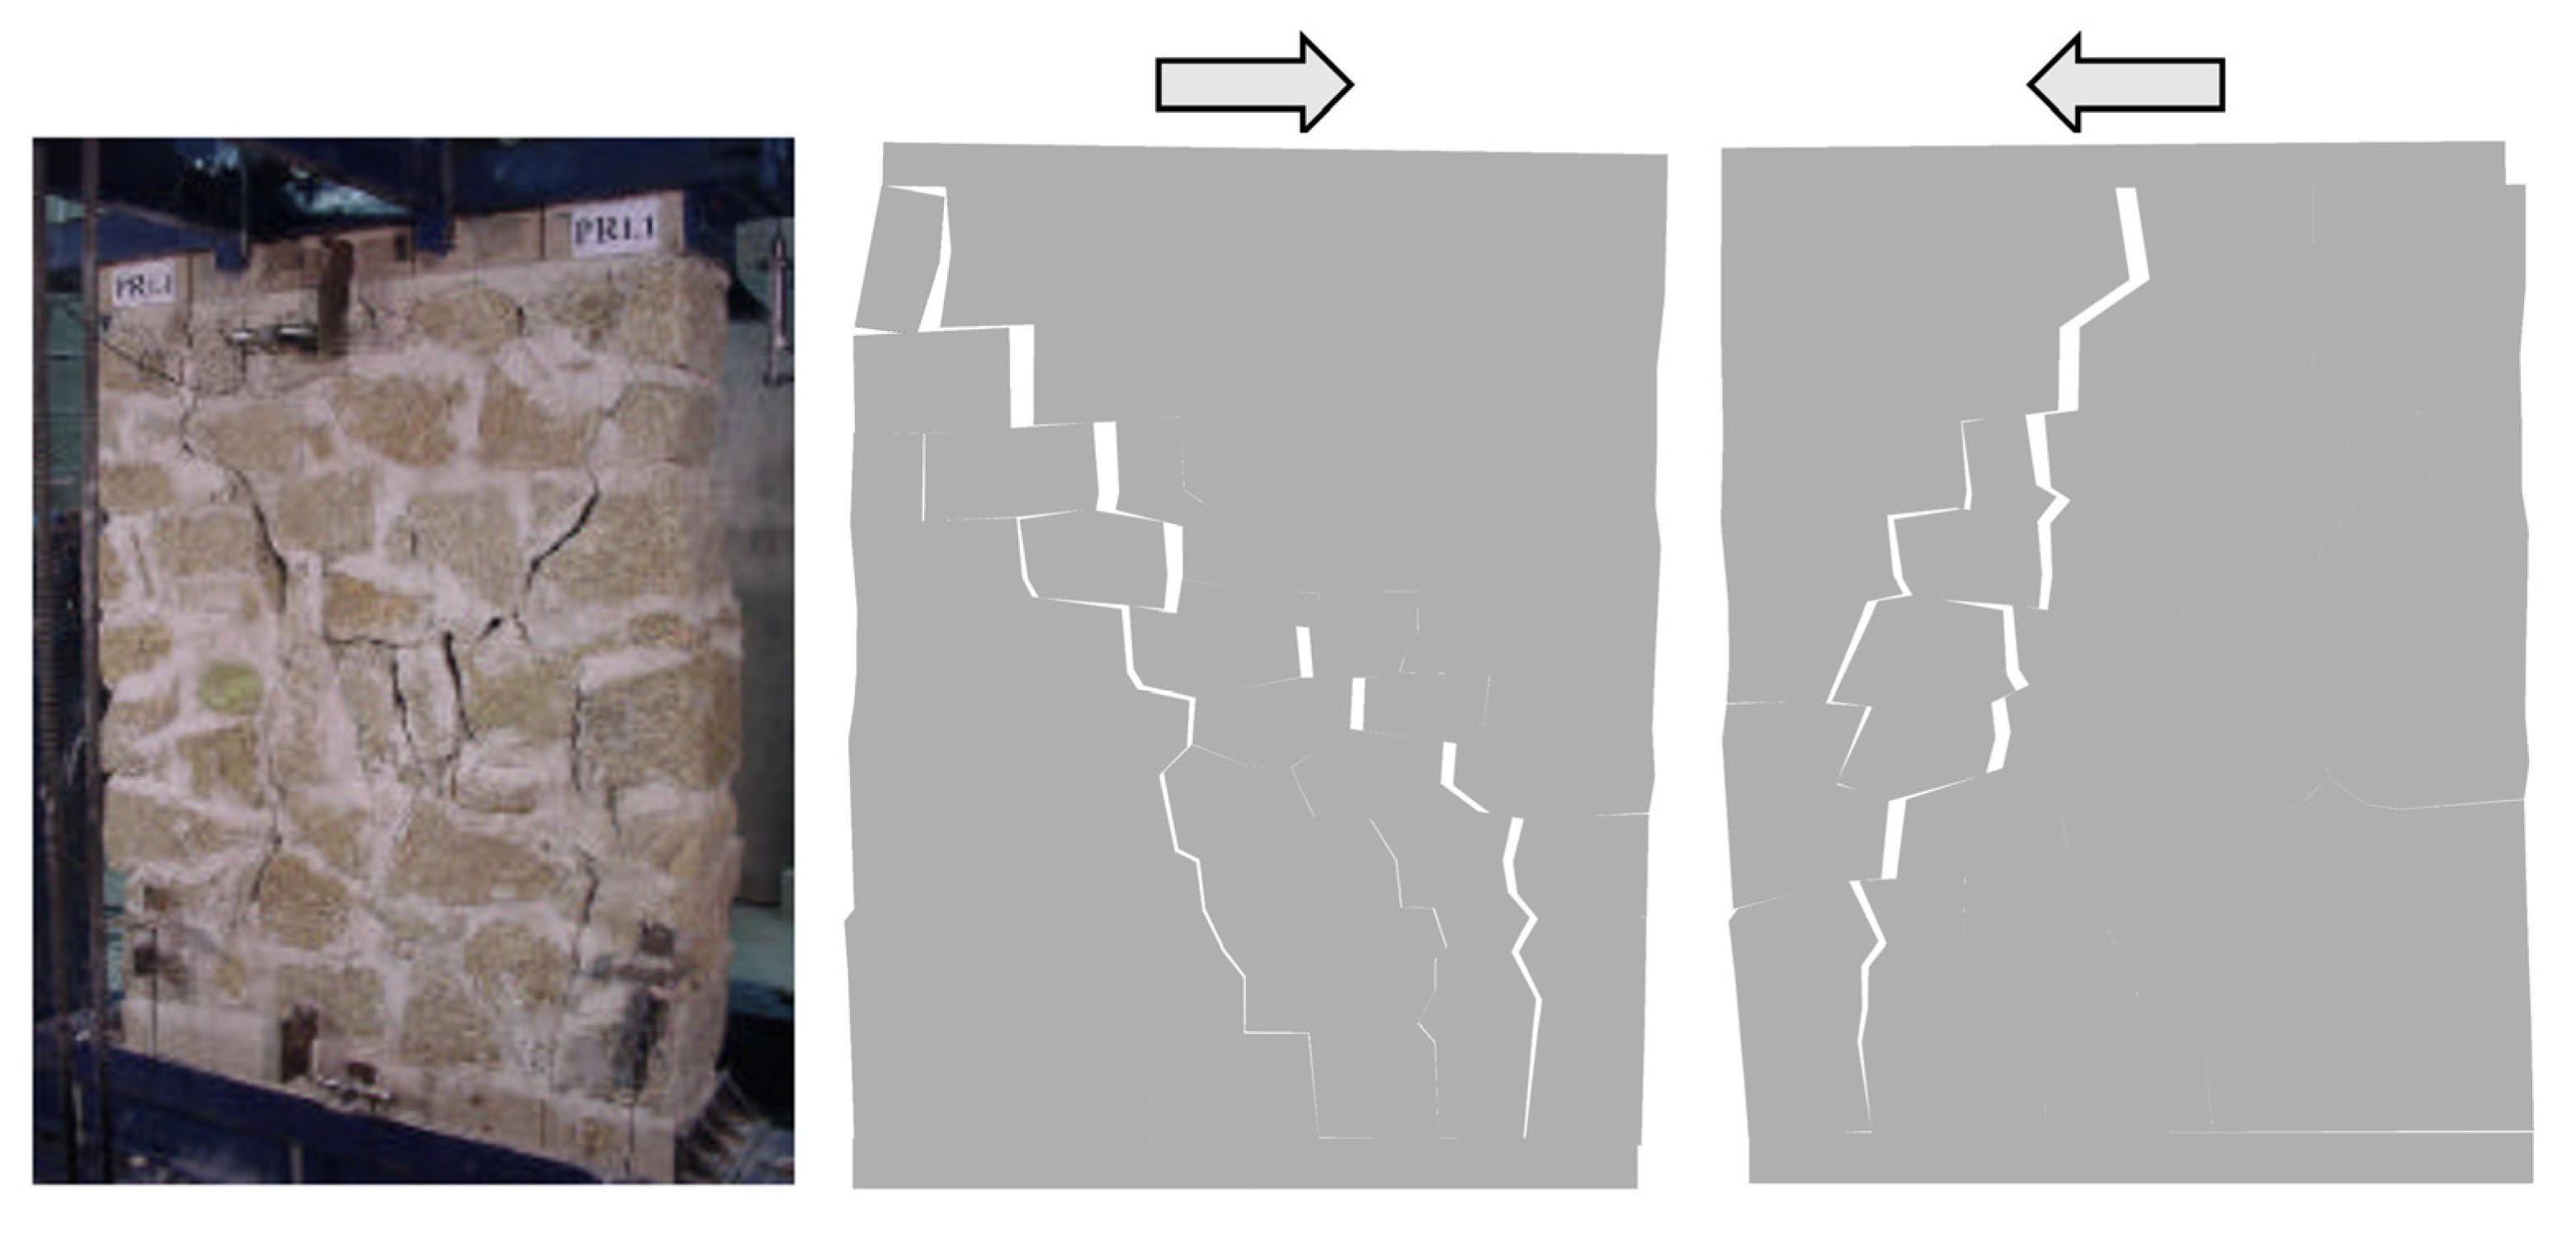
4. Validation Study
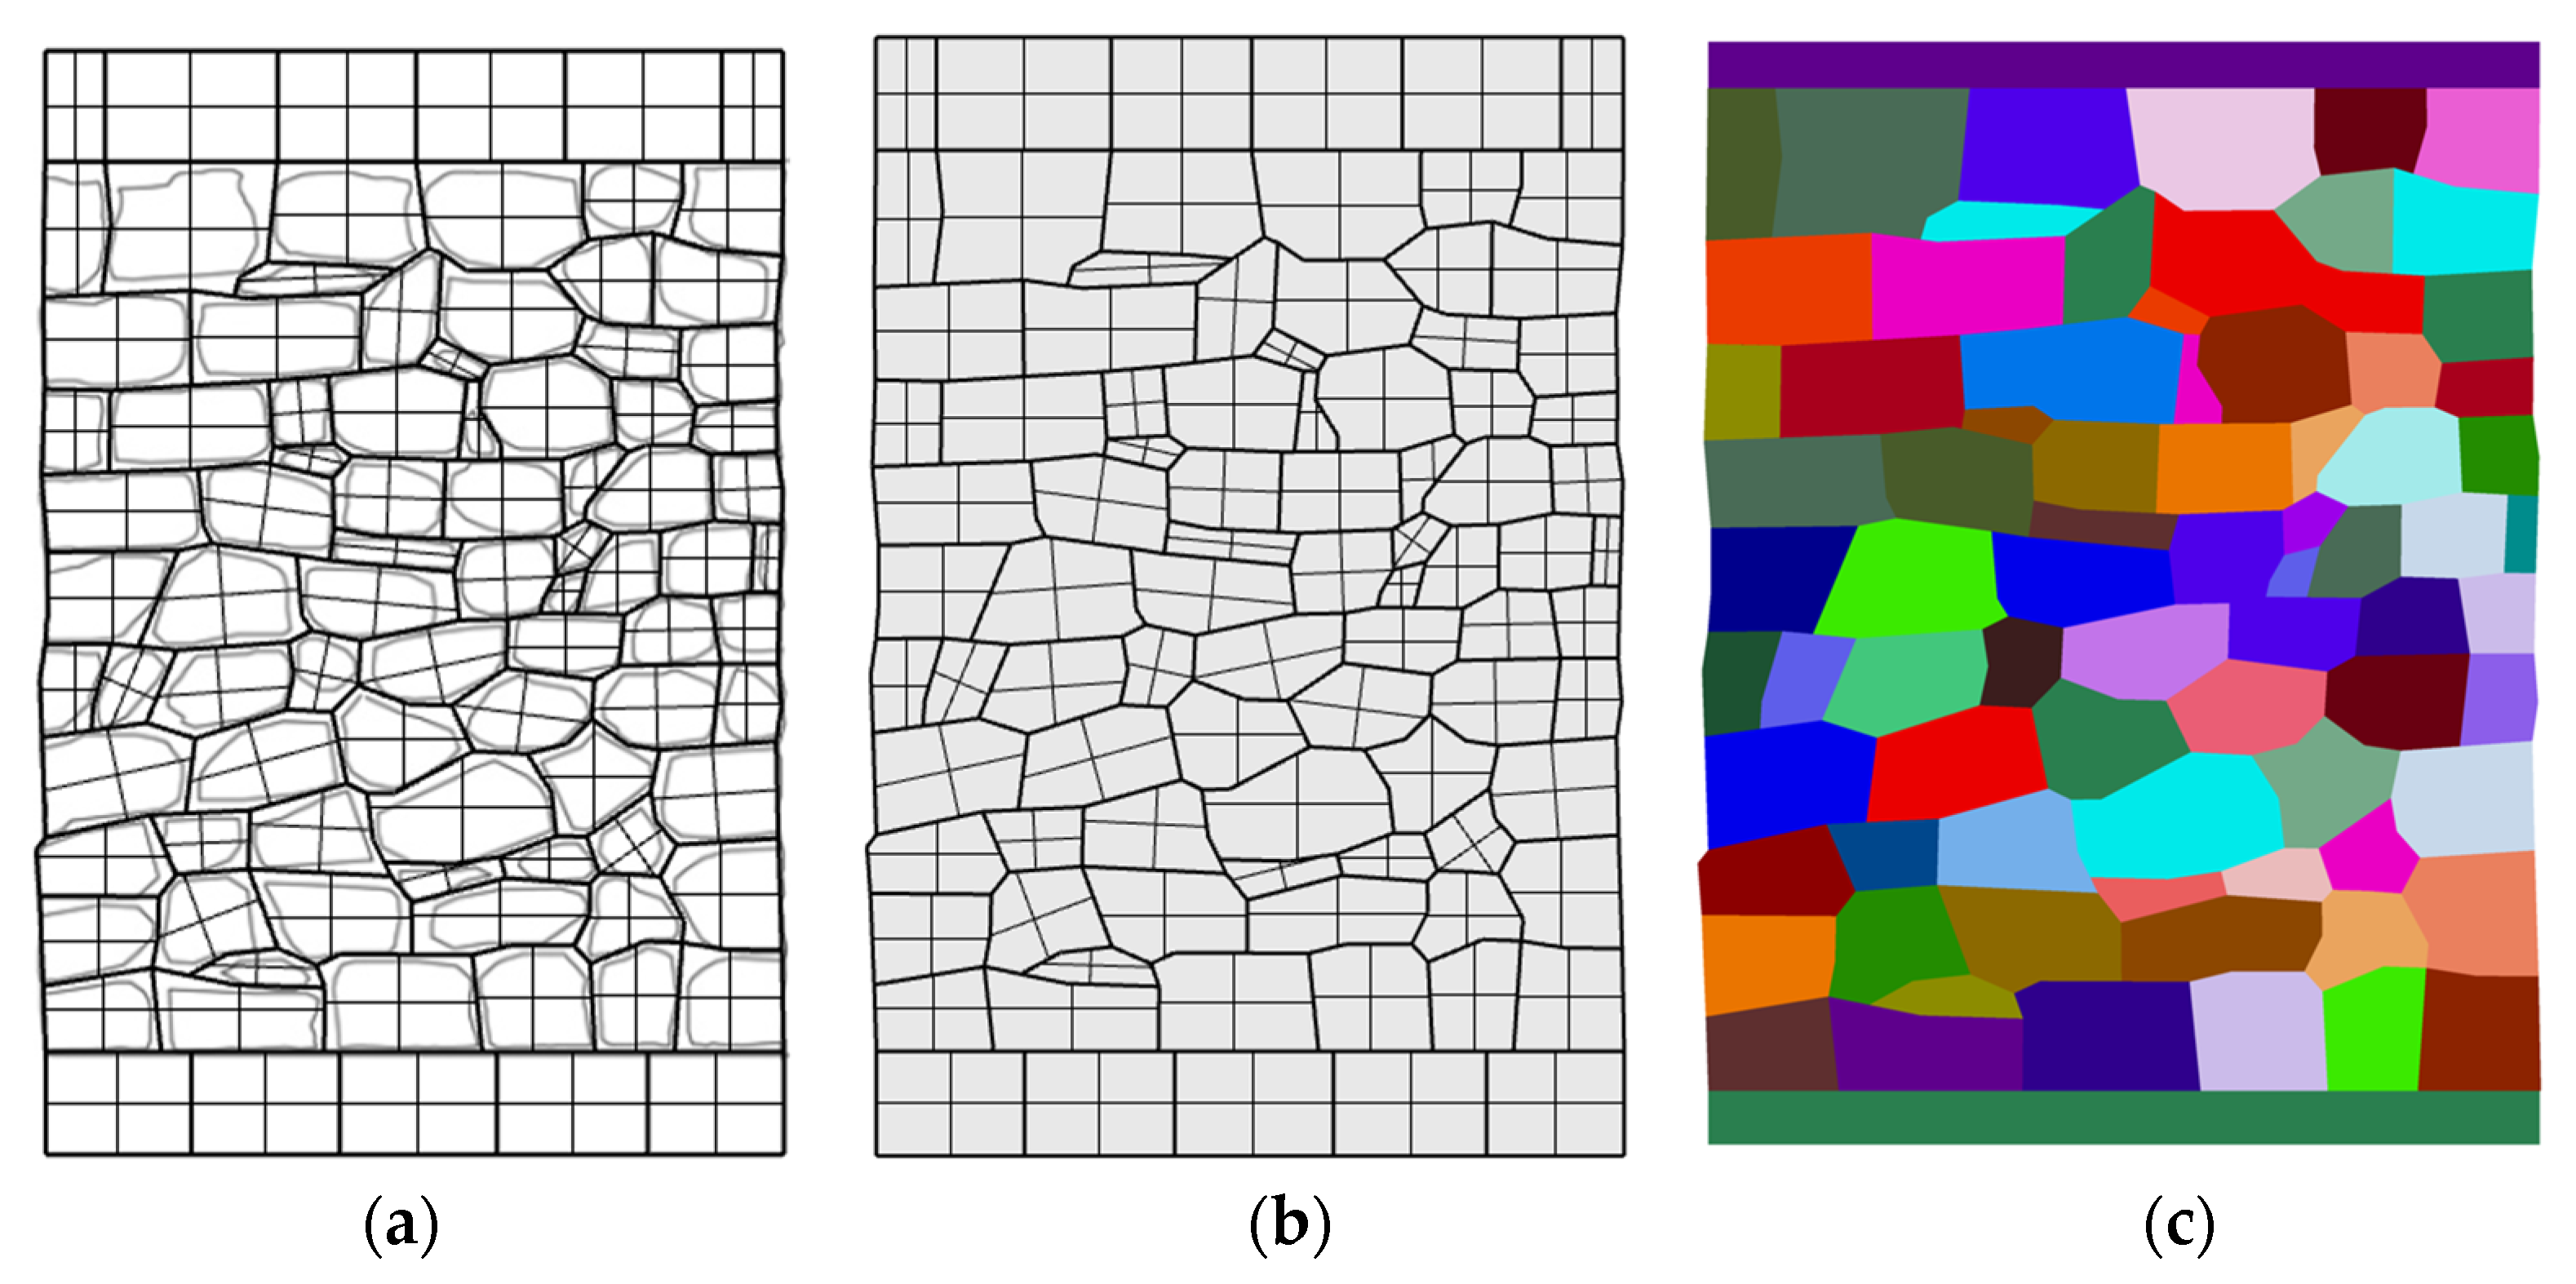
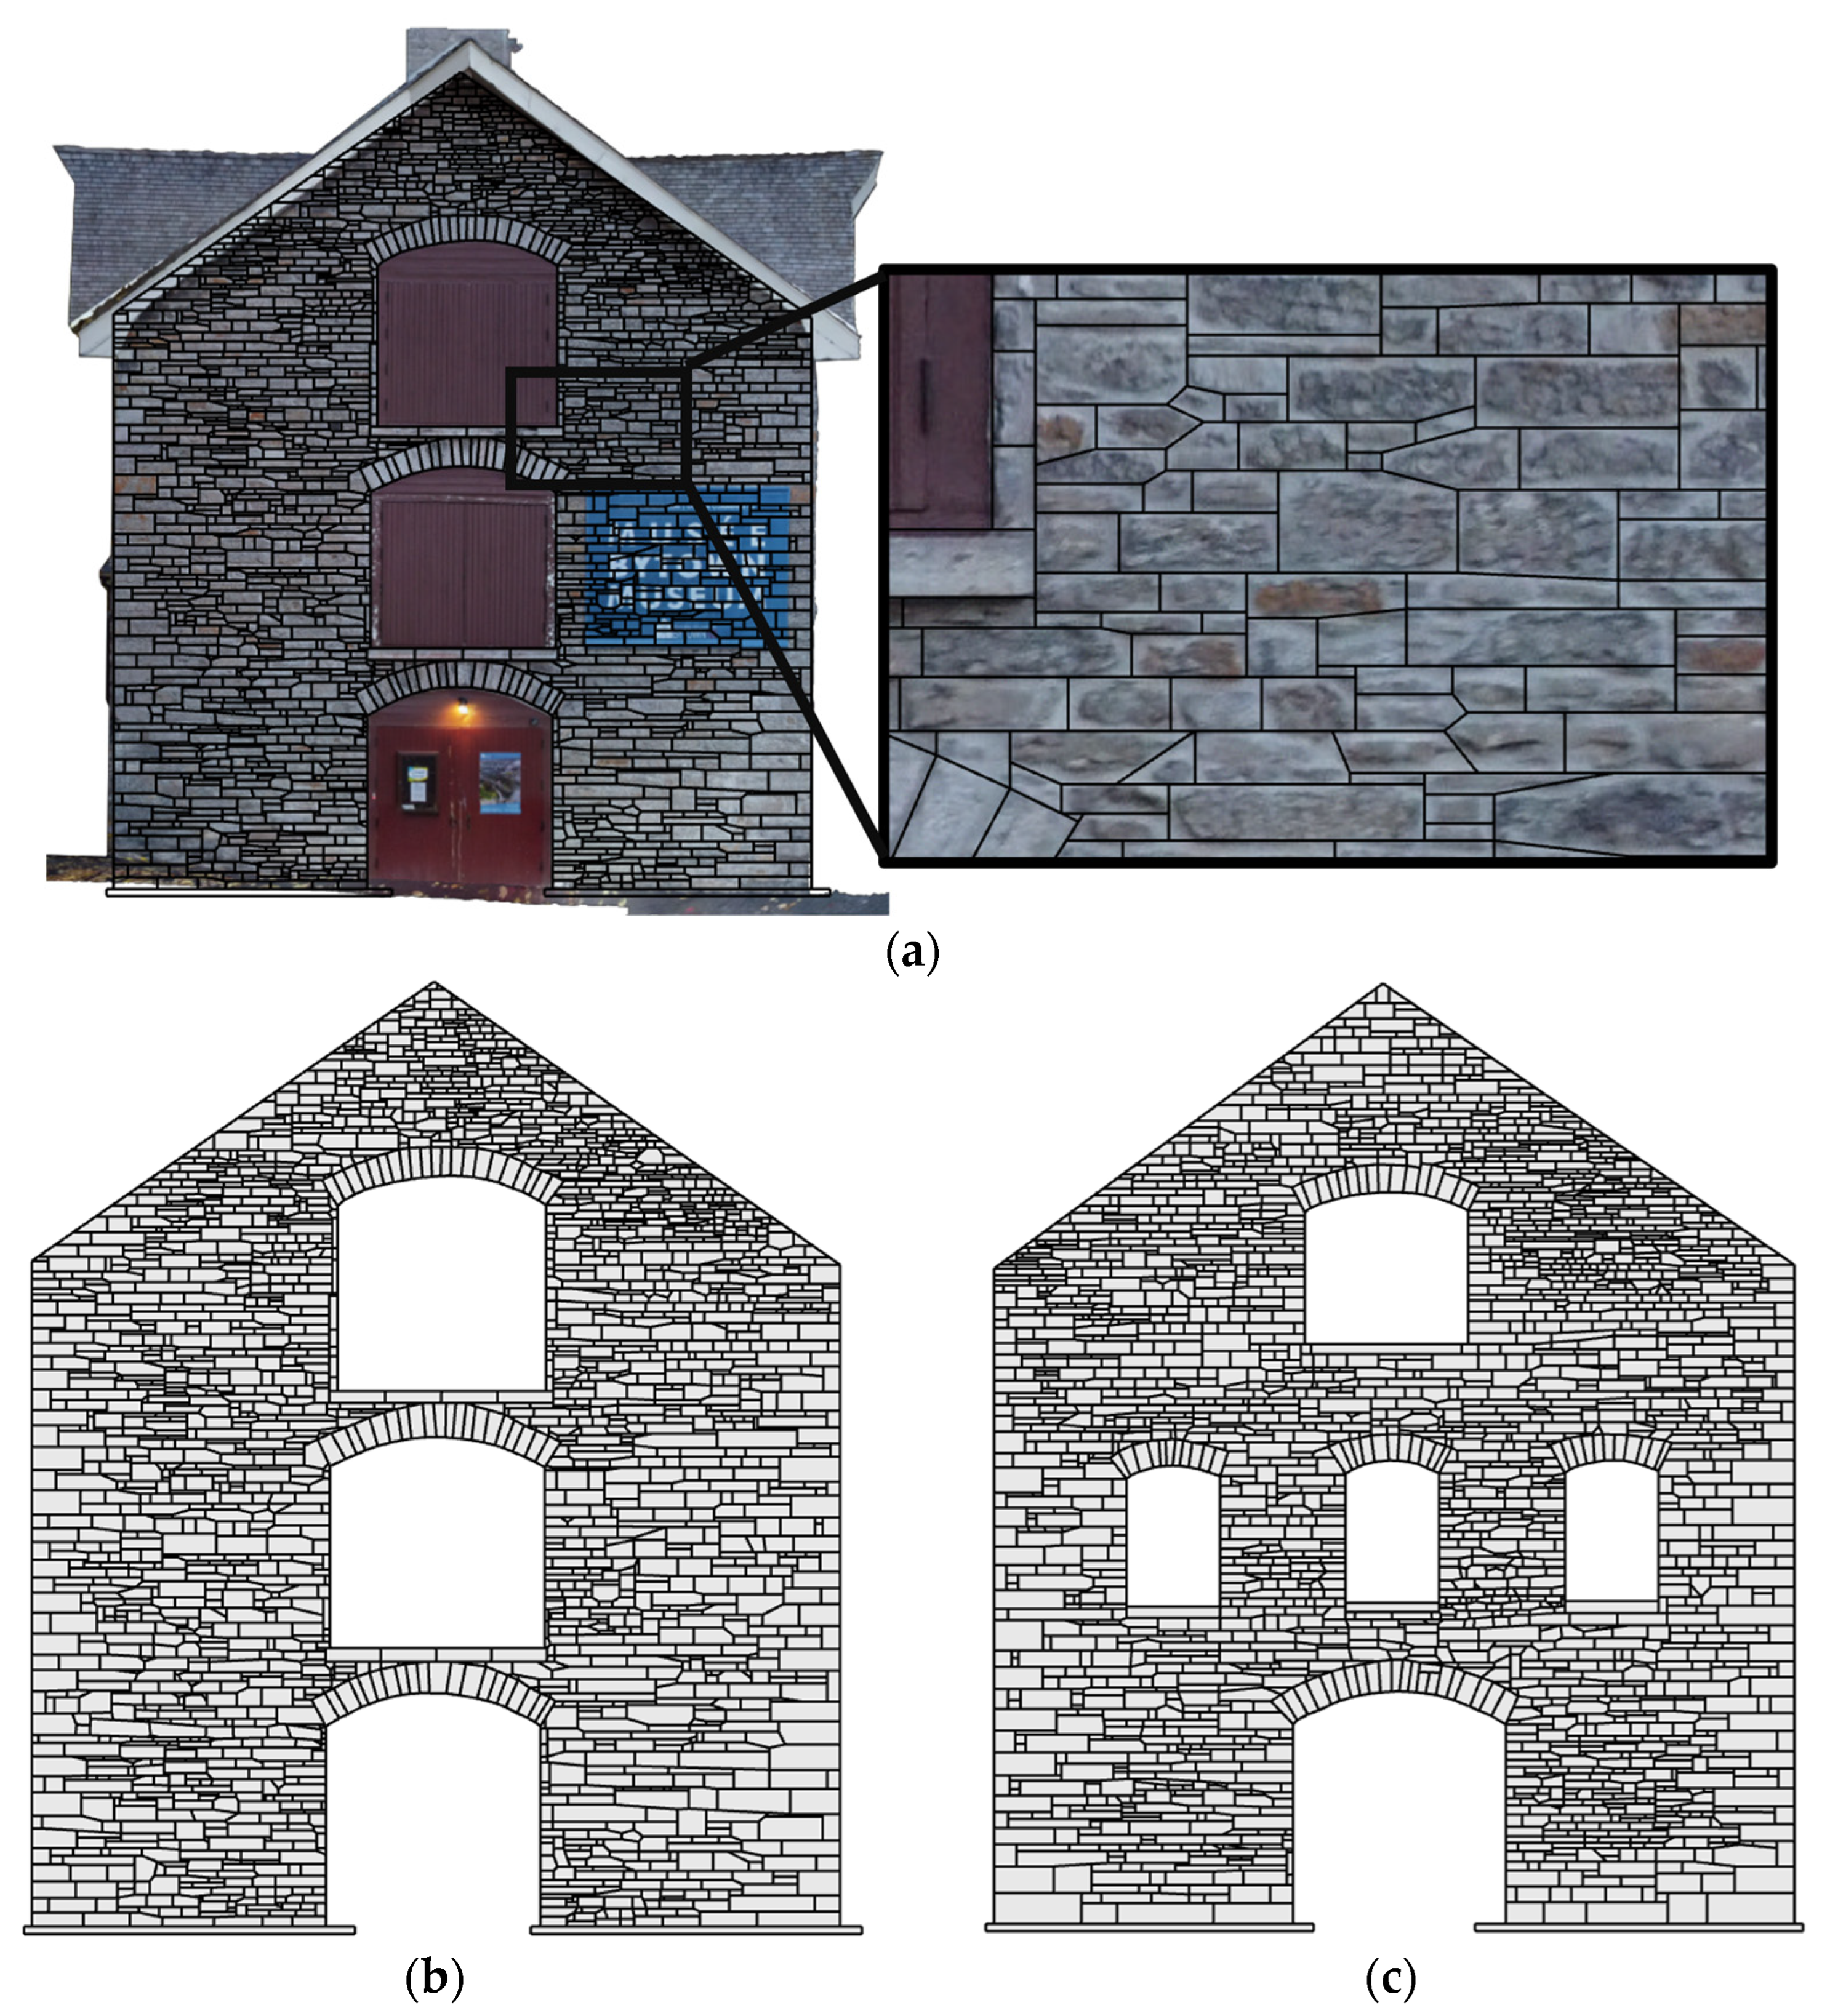
5. From Vision-Based Data to D-RBA
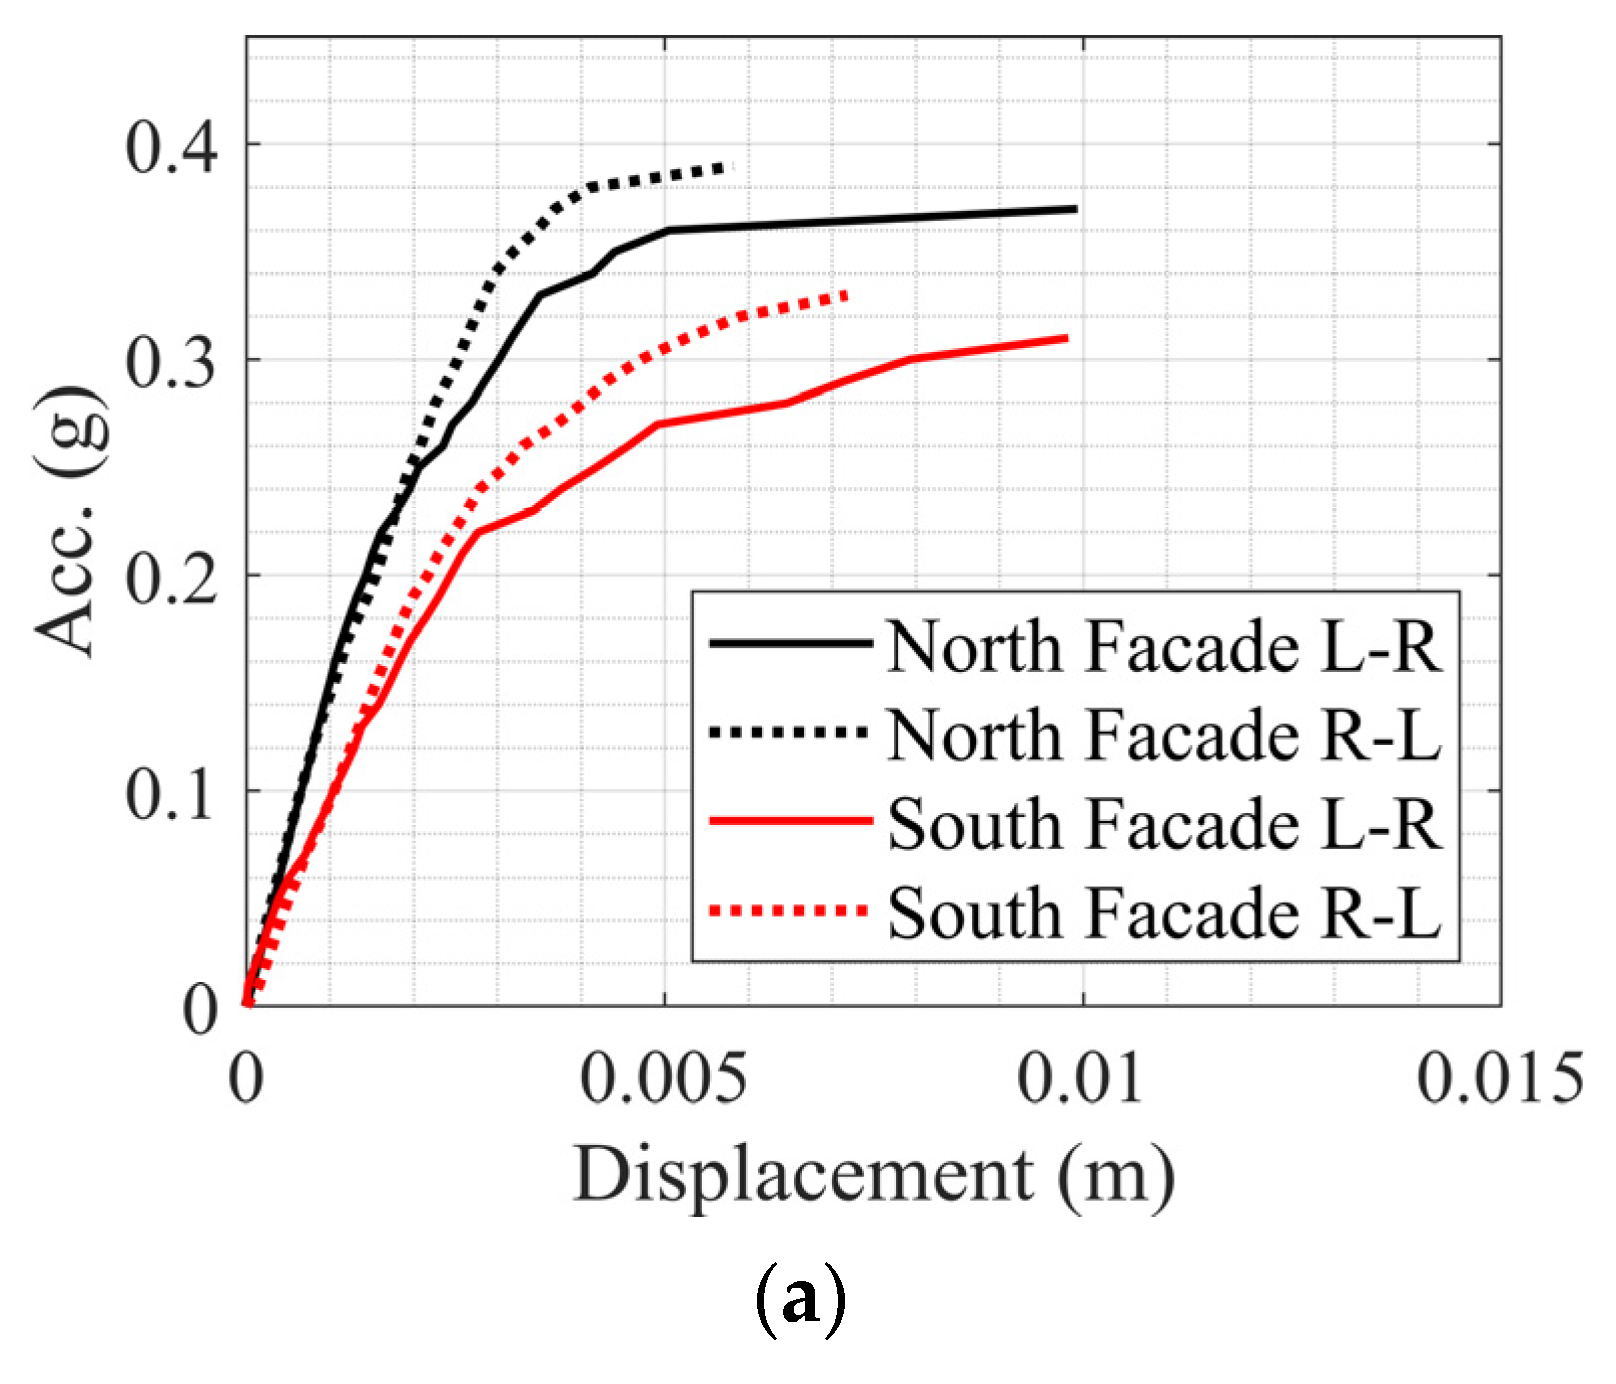
6. In-Plane Pushover Analysis of Bytown Museum
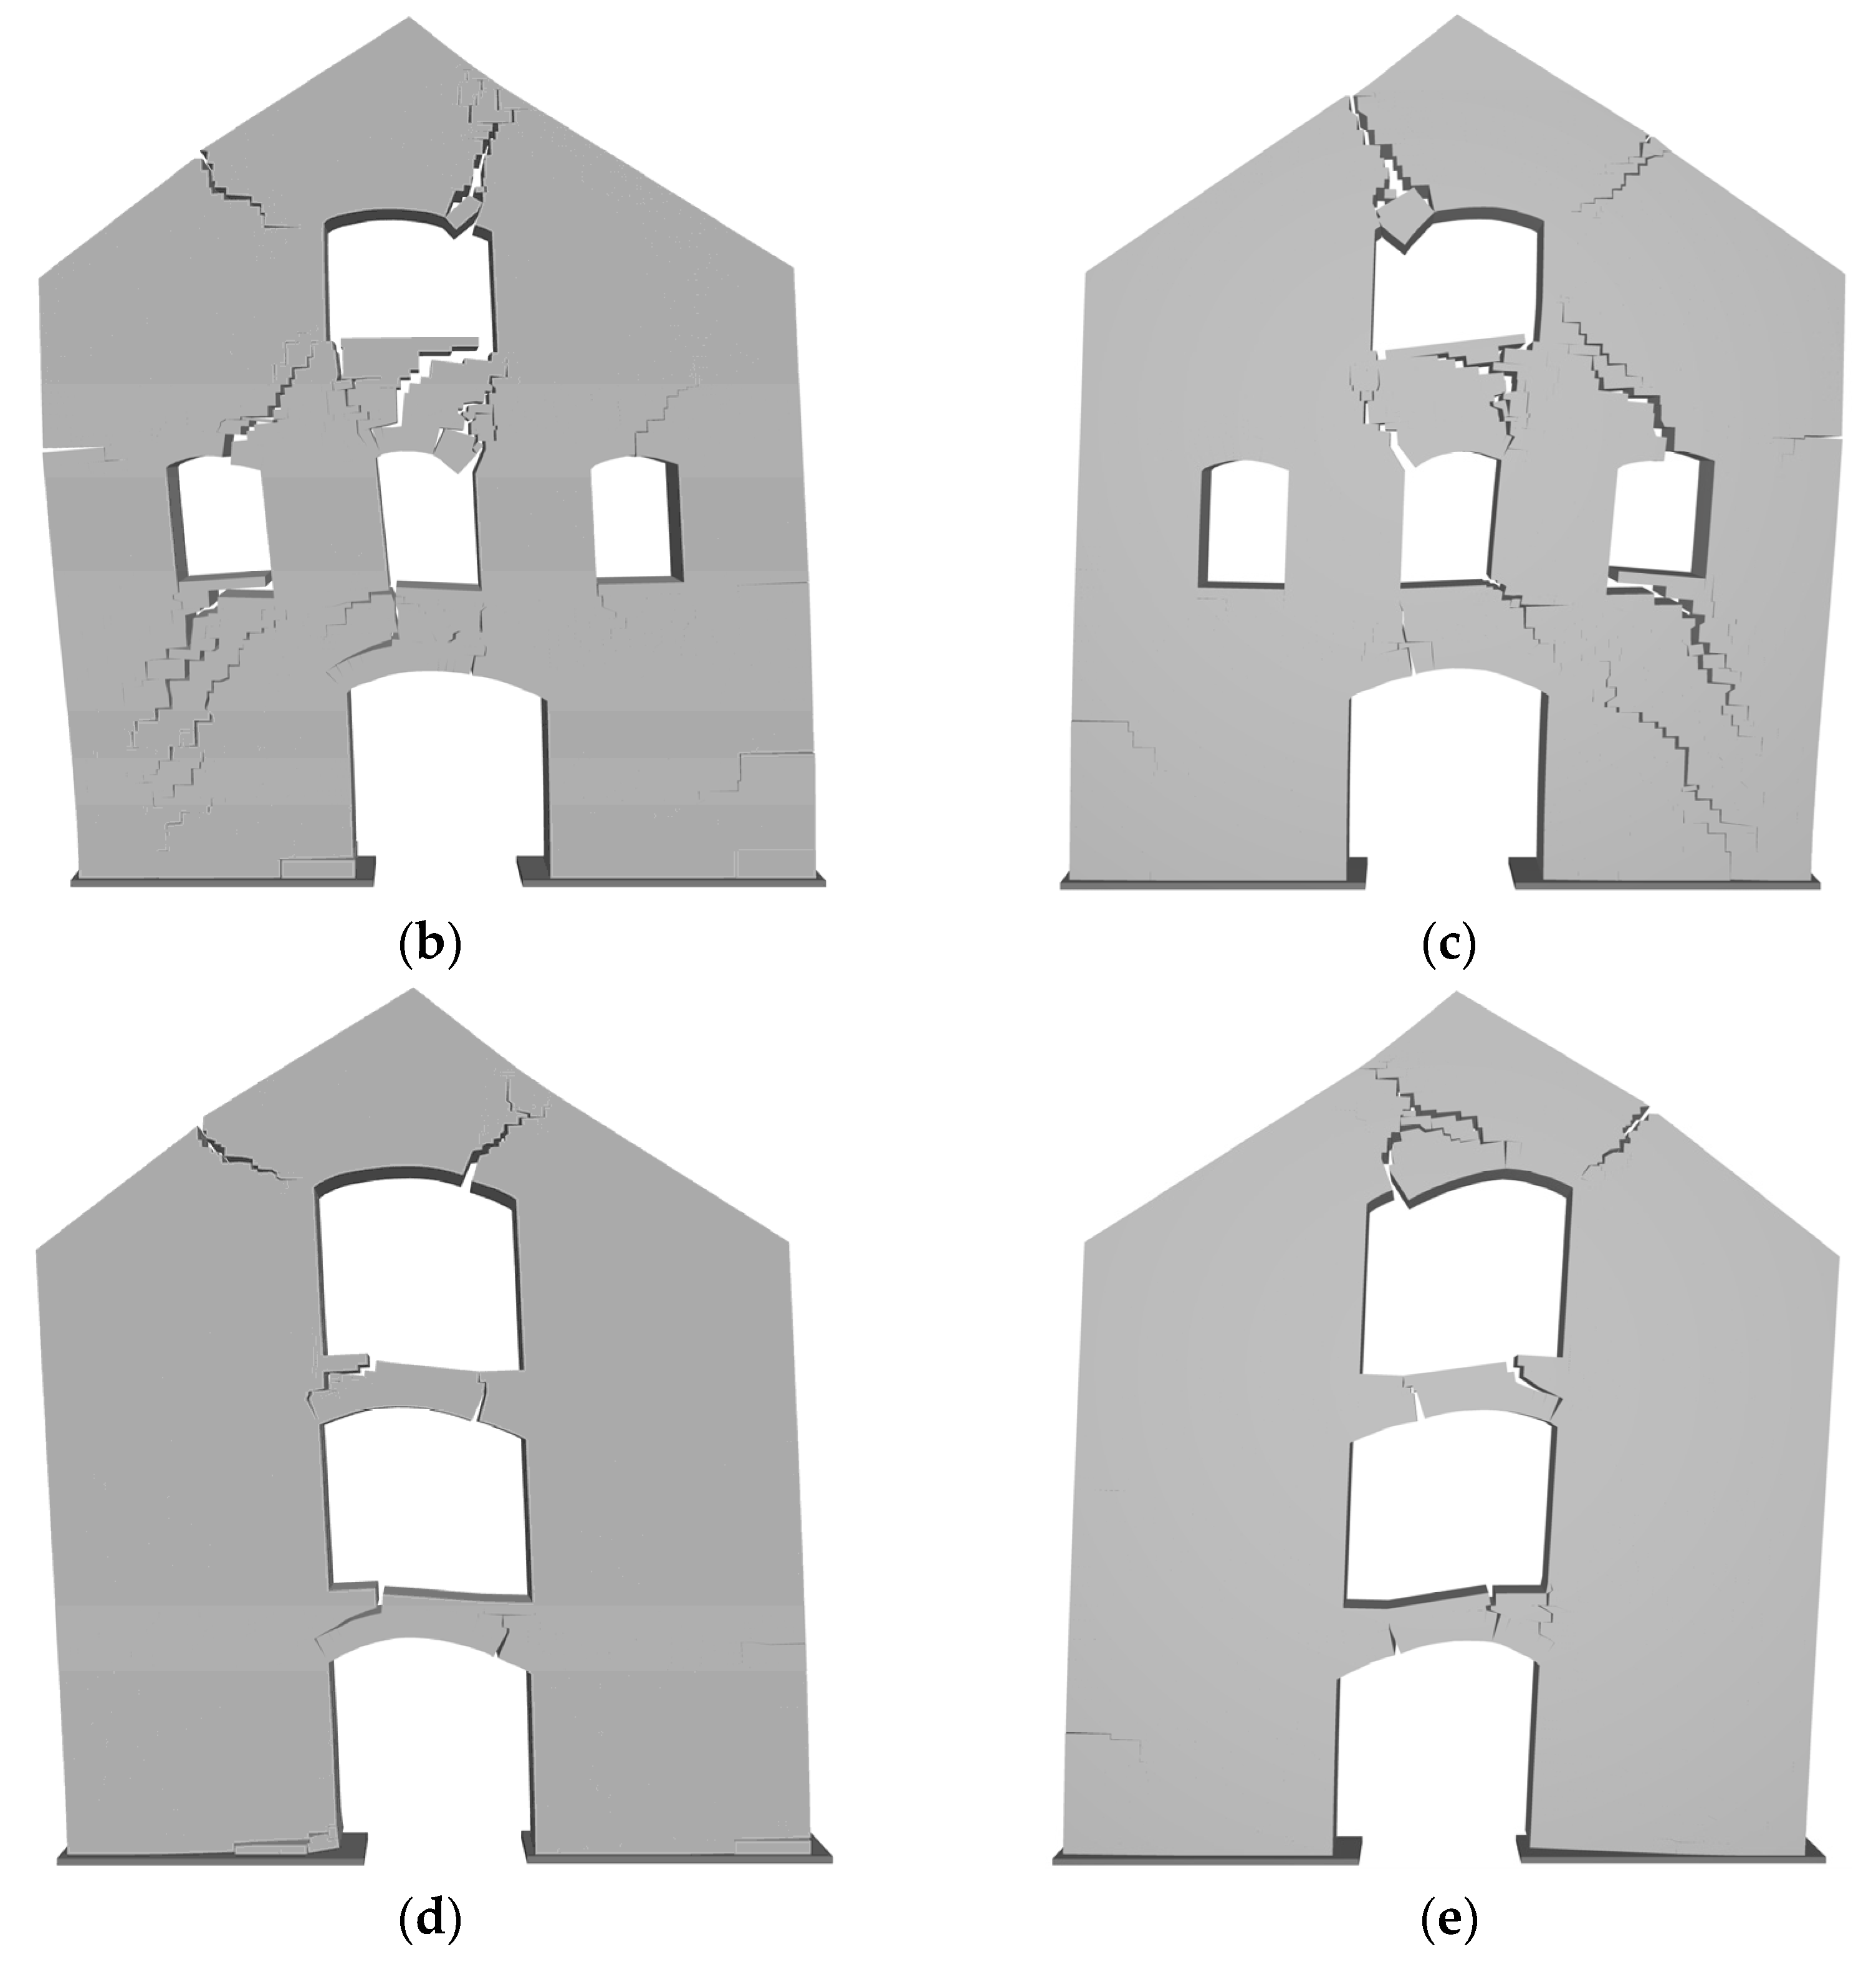
6.1. Discontinuum-Based Nonlinear Quasi-Static Analysis of the Bytown Building
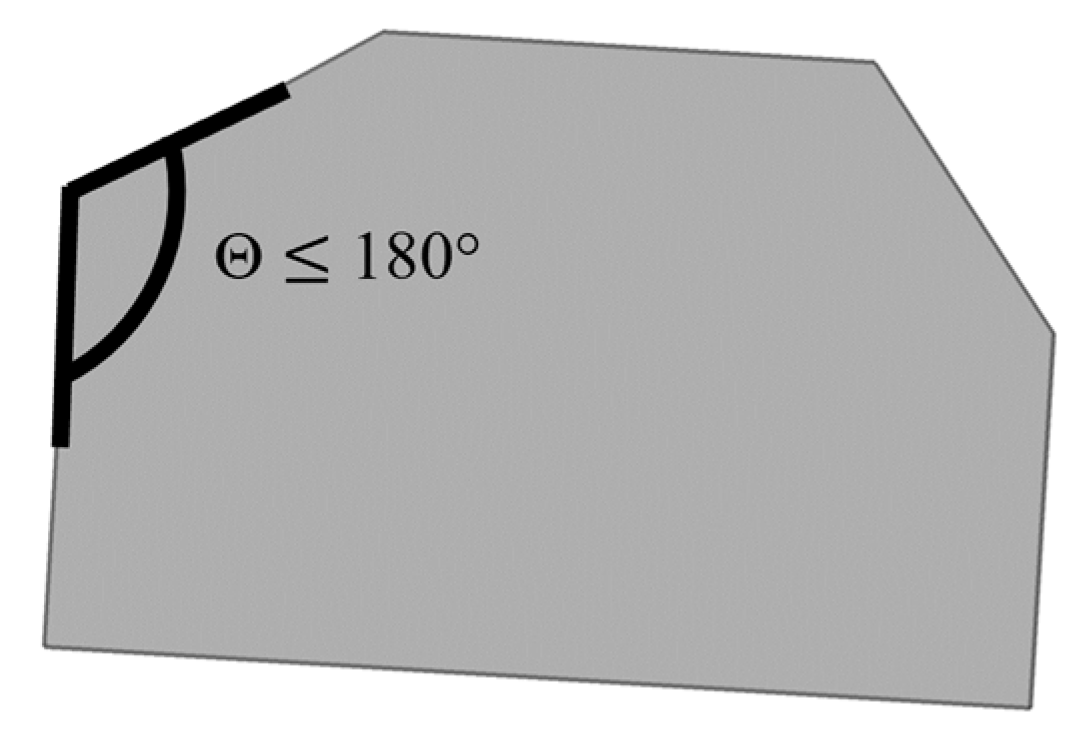
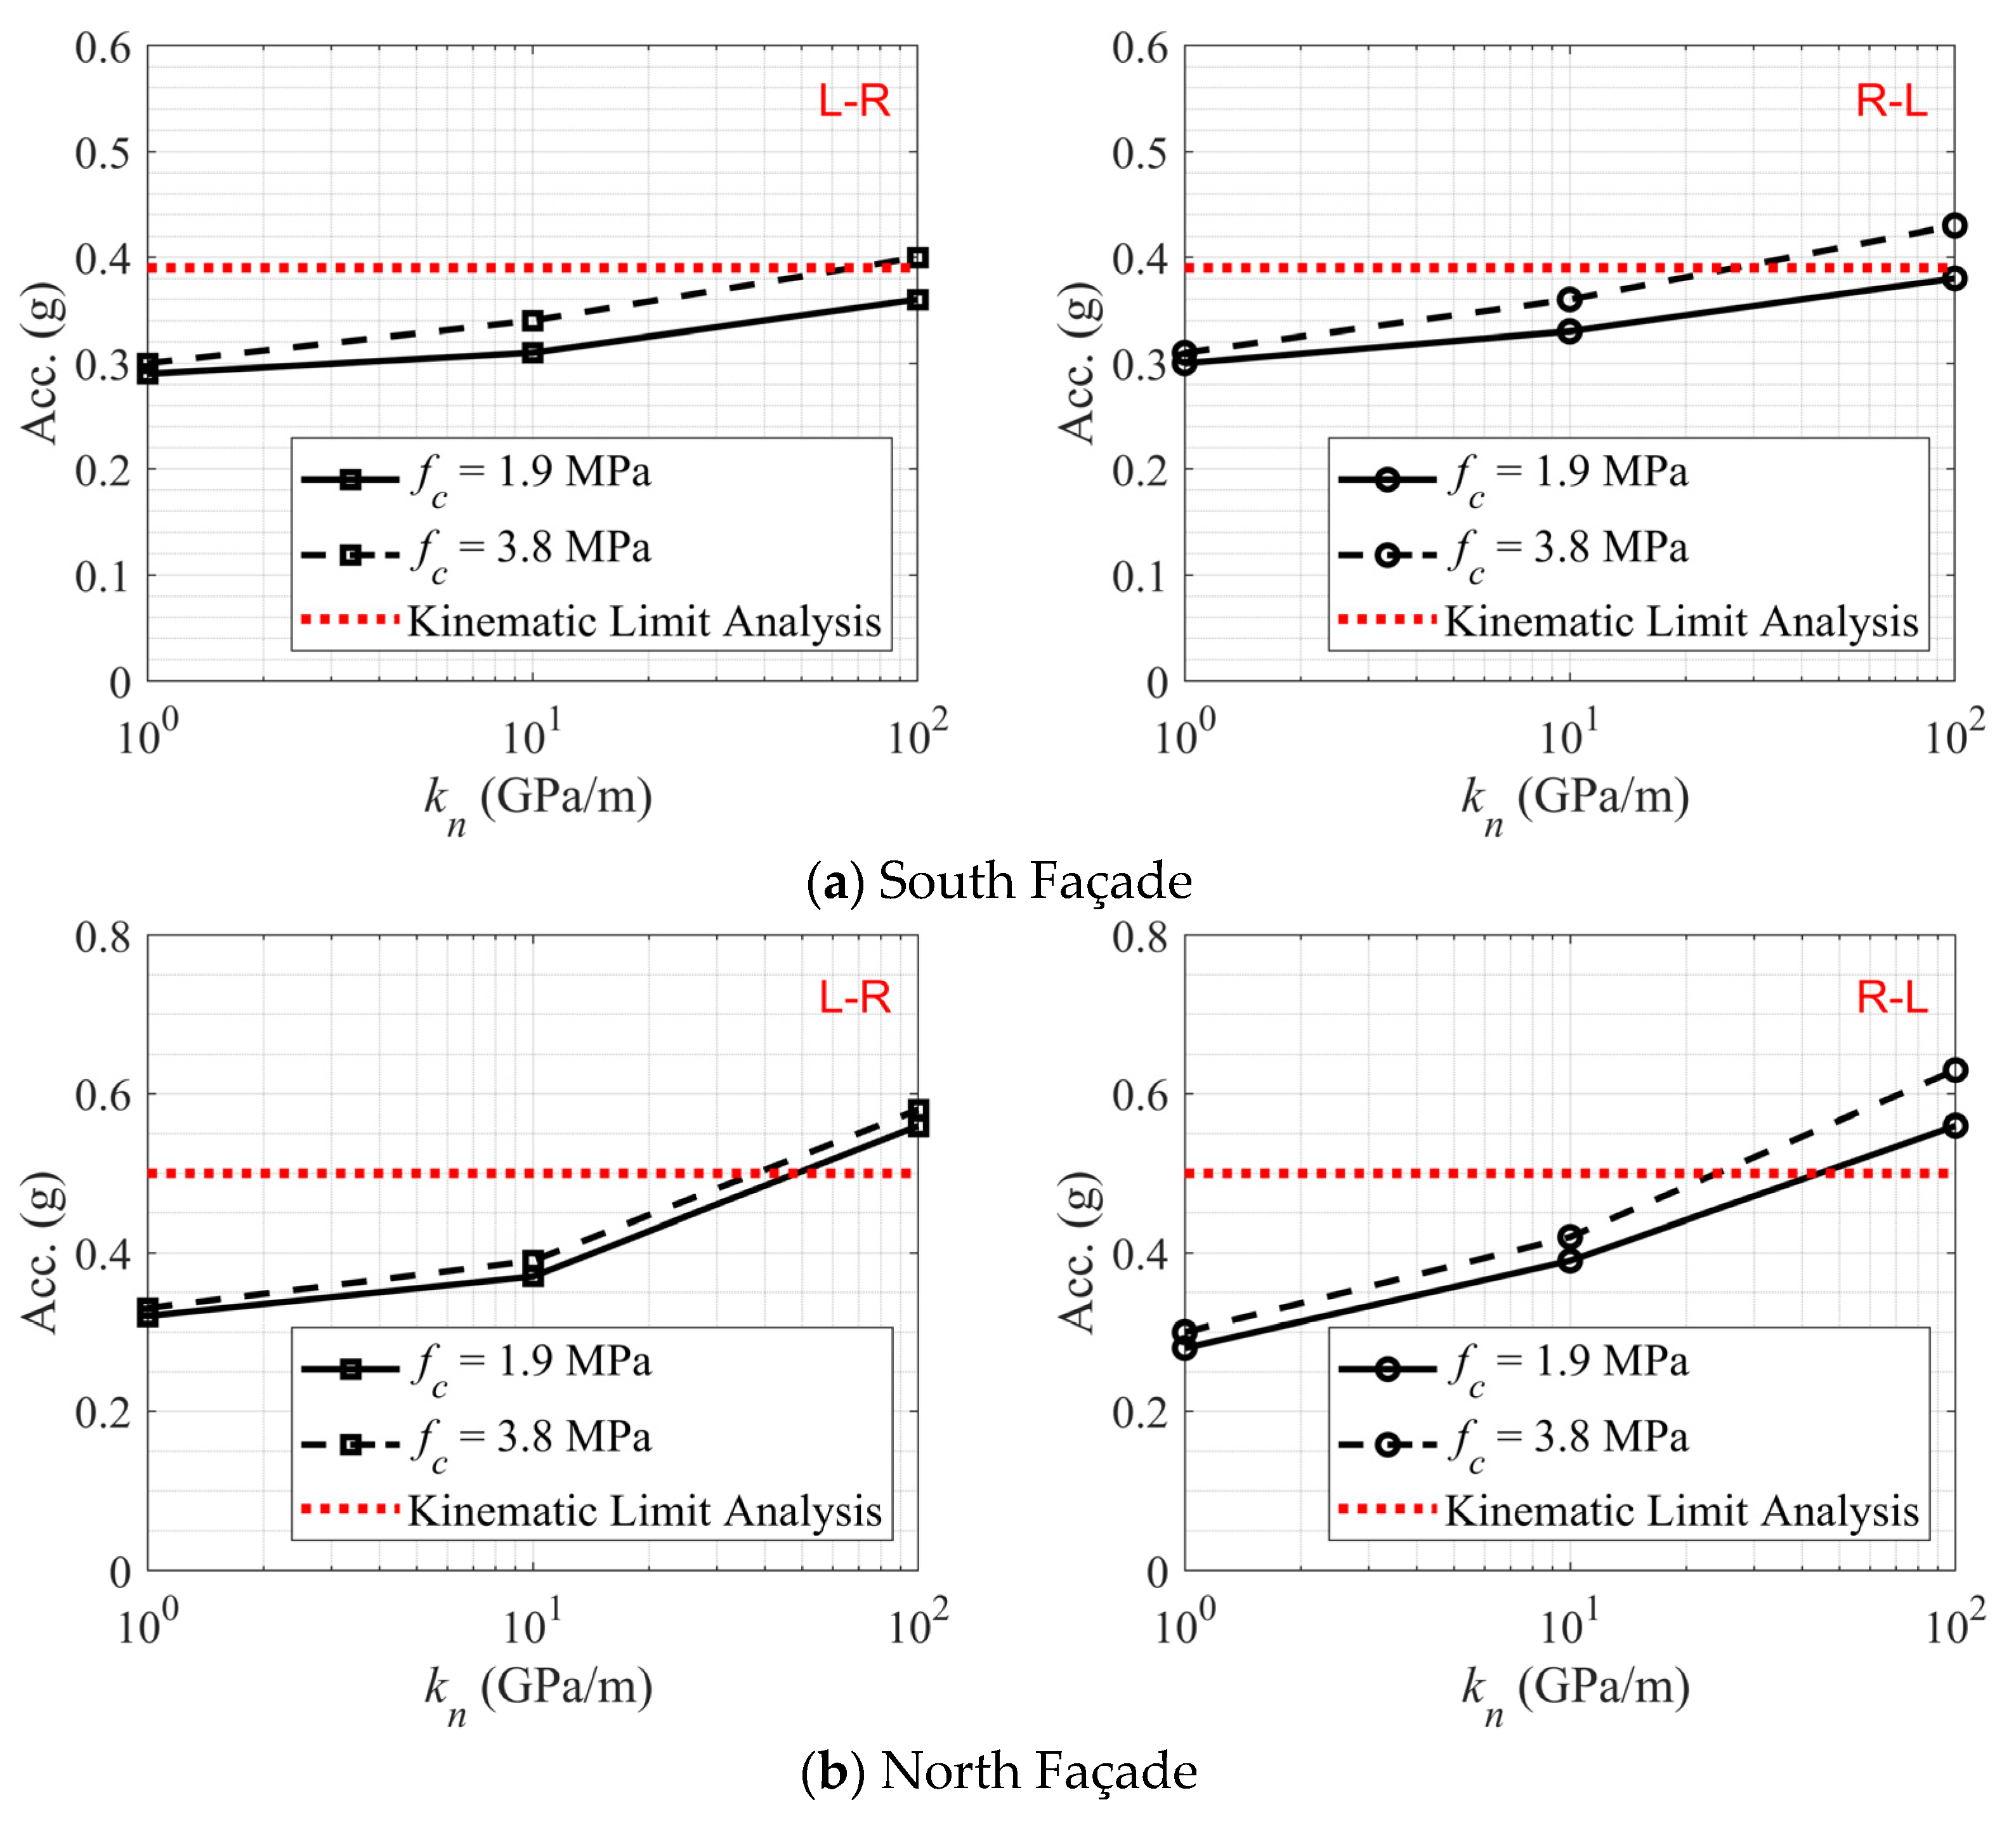
6.2. A Simplified Approach: Kinematic Limit Analysis
6.3. Parametric Analysis and Comparison of D-RBA vs. Kinematic Limit Analysis
7. Conclusions
Author Contributions
Funding
Institutional Review Board Statement
Informed Consent Statement
Data Availability Statement
Acknowledgments
Conflicts of Interest
References
- Roca, P.; Cervera, M.; Gariup, G.; Pela, L. Structural analysis of masonry historical constructions. Classical and advanced approaches. Arch. Comput. Methods Eng. 2010, 17, 299–325. [Google Scholar] [CrossRef] [Green Version]
- Lourenço, P.B.; Rots, J.G.; Blaauwendraad, J. Continuum model for masonry: Parameter estimation and validation. J. Struct. Eng. 1998, 124, 642–652. [Google Scholar] [CrossRef]
- Saloustros, S.; Cervera, M.; Pelà, L. Challenges, Tools and Applications of Tracking Algorithms in the Numerical Modelling of Cracks in Concrete and Masonry Structures. Arch. Comput. Methods Eng. 2019, 26, 961–1005. [Google Scholar] [CrossRef] [Green Version]
- Pelà, L.; Cervera, M.; Roca, P. Continuum damage model for orthotropic materials: Application to masonry. Comput. Methods Appl. Mech. Eng. 2011, 200, 917–930. [Google Scholar] [CrossRef]
- Greco, F.; Lourenço, P.B. Seismic assessment of large historic vernacular adobe buildings in the Andean Region of Peru. Learning from Casa Arones in cusco. J. Build. Eng. 2021, 40, 102341. [Google Scholar] [CrossRef]
- Karanikoloudis, G.; Lourenço, P.B. Structural assessment and seismic vulnerability of earthen historic structures. Application of sophisticated numerical and simple analytical models. Eng. Struct. 2018, 160, 488–509. [Google Scholar] [CrossRef] [Green Version]
- Funari, M.F.; Spadea, S.; Lonetti, P.; Fabbrocino, F.; Luciano, R. Visual programming for structural assessment of out-of-plane mechanisms in historic masonry structures. J. Build. Eng. 2020, 31, 101425. [Google Scholar] [CrossRef]
- Valente, M. Seismic vulnerability assessment and earthquake response of slender historical masonry bell towers in South-East Lombardia. Eng. Fail. Anal. 2021, 129, 105656. [Google Scholar] [CrossRef]
- Lourenço, P.B. Computations on historic masonry structures. Prog. Struct. Eng. Mater. 2002, 4, 301–319. [Google Scholar] [CrossRef]
- Lourenço, P.B.; Rots, J.G. Multisurface interface model for analysis of masonry structures. J. Eng. Mech. 1997, 123, 660–668. [Google Scholar] [CrossRef]
- Lemos, J.V. Discrete Element Modeling of Masonry Structures. Int. J. Archit. Herit. 2007, 1, 190–213. [Google Scholar] [CrossRef]
- Lemos, J.V. Discrete Element Modeling of the Seismic Behavior of Masonry Construction. Buildings 2019, 9, 43. [Google Scholar] [CrossRef] [Green Version]
- Mendes, N.; Zanotti, S.; Lemos, J.V. Seismic Performance of Historical Buildings Based on Discrete Element Method: An Adobe Church. J. Earthq. Eng. 2018, 24, 1270–1289. [Google Scholar] [CrossRef]
- Gonen, S.; Pulatsu, B.; Erdogmus, E.; Karaesmen, E.; Karaesmen, E. Quasi-Static Nonlinear Seismic Assessment of a Fourth Century, A.D. Roman Aqueduct in Istanbul, Turkey. Heritage 2021, 4, 401–421. [Google Scholar] [CrossRef]
- Pulatsu, B.; Gencer, F.; Erdogmus, E. Study of the effect of construction techniques on the seismic capacity of ancient dry-joint masonry towers through DEM. Eur. J. Environ. Civ. Eng. 2020, 26, 3913–3930. [Google Scholar] [CrossRef]
- Ferrante, A.; Loverdos, D.; Clementi, F.; Milani, G.; Formisano, A.; Lenci, S.; Sarhosis, V. Discontinuous approaches for nonlinear dynamic analyses of an ancient masonry tower. Eng. Struct. 2021, 230, 111626. [Google Scholar] [CrossRef]
- Simon, J.; Bagi, K. Discrete element analysis of the minimum thickness of oval masonry domes. Int. J. Archit. Herit. 2016, 10, 457–475. [Google Scholar] [CrossRef]
- Pulatsu, B.; Bretas, E.M.; Lourenço, P.B. Discrete element modeling of masonry structures: Validation and application. Earthquakes Struct. 2016, 11, 563–582. [Google Scholar] [CrossRef]
- Erdogmus, E.; Pulatsu, B.; Can, B.; Ozkan, K. Analysis of the Last Standing Arch of the Roman Aqueduct at Blaundos. In Proceedings of the 13th North American Masonry Conference, Salt Lake City, UT, USA, 16–19 June 2019; Dillion, P.B., Fonseca, F.S., Eds.; The Masonry Society: Salt Lake City, UT, USA, 2019; pp. 483–493. [Google Scholar]
- Loverdos, D.; Sarhosis, V.; Adamopoulos, E.; Drougkas, A. Automation in Construction An innovative image processing-based framework for the numerical modelling of cracked masonry structures. Autom. Constr. 2021, 125, 103633. [Google Scholar] [CrossRef]
- Barazzetti, L.; Banfi, F.; Brumana, R.; Gusmeroli, G.; Previtali, M.; Schiantarelli, G. Cloud-to-BIM-to-FEM: Structural simulation with accurate historic BIM from laser scans. Simul. Model. Pract. Theory 2015, 57, 71–87. [Google Scholar] [CrossRef]
- Cundall, P.A. A computer model for simulating progressive, large-scale movements in blocky rock systems. In Proceedings of the International Symposium on Rock Mechanics; Nancy, 1971; Volume 2, pp. 47–65. [Google Scholar]
- Cundall, P.A. Formulation of a Three-dimensional Disctinct Element Model—Part I. A Scheme to Detect and Represent Contacts in a System Composed of Many Polyhedral Blocks. Int. J. Rock Mech. Min. Sci. Geomech. 1988, 25, 107–116. [Google Scholar] [CrossRef]
- Hart, R.; Cundall, P.A.; Lemos, J.V. Formulation of a three-dimensional distinct element model—Part II. Mechanical calculations for motion. Int. J. Rock Mech. Min. Sci. Geomech. 1988, 25, 117–125. [Google Scholar] [CrossRef]
- Lemos, J.V. The Basis for Masonry Analysis with UDEC and 3DEC. In Computational Modeling of Masonry Structures Using the Discrete Element Method; Sarhosis, V., Bagi, K., Lemos, J.V., Milani, G., Eds.; IGI Global: Hershey, PA, USA, 2016; pp. 61–89. ISBN 9781522502319. [Google Scholar]
- Lemos, J.V. Contact representation in rigid block models of masonry. Int. J. Mason. Res. Innov. 2017, 2, 321. [Google Scholar] [CrossRef]
- Pulatsu, B.; Erdogmus, E.; Lourenço, P.B.; Quey, R. Simulation of uniaxial tensile behavior of quasi-brittle materials using softening contact models in DEM. Int. J. Fract. 2019, 217, 105–125. [Google Scholar] [CrossRef]
- Pulatsu, B.; Erdogmus, E.; Lourenço, P.B.; Lemos, J.V.; Hazzard, J. Discontinuum analysis of the fracture mechanism in masonry prisms and wallettes via discrete element method. Meccanica 2020, 55, 505–523. [Google Scholar] [CrossRef]
- Pulatsu, B.; Erdogmus, E.; Lourenço, P.B.; Lemos, J.V.; Tuncay, K. Simulation of the in-plane structural behavior of unreinforced masonry walls and buildings using DEM. Structures 2020, 27, 2274–2287. [Google Scholar] [CrossRef]
- Pulatsu, B.; Gonen, S.; Erdogmus, E.; Lourenço, P.B.; Lemos, J.V.; Prakash, R. In-plane structural performance of dry-joint stone masonry Walls: A spatial and non-spatial stochastic discontinuum analysis. Eng. Struct. 2021, 242, 112620. [Google Scholar] [CrossRef]
- Cundall, P.A.; Detournay, C. Dynamic relaxation applied to continuum and discontinuum numerical models in geomechanics. In Rock Mechanics and Engineering; CRC Press: Boca Raton, FL, USA, 2017; pp. 57–102. [Google Scholar]
- Itasca Consulting Group Inc. 3DEC Three Dimensional Distinct Element Code 2013, Minneapolis, United States.
- Vasconcelos, G.; Lourenço, P.B. In-Plane Experimental Behavior of Stone Masonry Walls under Cyclic Loading. J. Struct. Eng. 2009, 135, 1269–1277. [Google Scholar] [CrossRef]
- Rhino—Rhinoceros 3D, developed by Robert McNeil & Friends, Robert McNeel & Associates: Seattle, DC, USA.
- Vasconcelos, G.; Lourenço, P.B. Experimental characterization of stone masonry in shear and compression. Constr. Build. Mater. 2009, 23, 3337–3345. [Google Scholar] [CrossRef]
- Lourenço, P.B.; Ramos, L.F. Characterization of Cyclic Behavior of Dry Masonry Joints. J. Struct. Eng. 2004, 130, 779–786. [Google Scholar] [CrossRef]
- Senthivel, R.; Lourenço, P.B. Finite element modelling of deformation characteristics of historical stone masonry shear walls. Eng. Struct. 2009, 31, 1930–1943. [Google Scholar] [CrossRef] [Green Version]
- Galvez, F.; Sorrentino, L.; Dizhur, D.; Ingham, J.M. Using DEM to Investigate Boundary Conditions for Rocking URM Facades Subjected to Earthquake Motion. J. Struct. Eng. 2021, 147, 04021191. [Google Scholar] [CrossRef]
- Gobbin, F.; de Felice, G.; Lemos, J.V. Numerical procedures for the analysis of collapse mechanisms of masonry structures using discrete element modelling. Eng. Struct. 2021, 246, 113047. [Google Scholar] [CrossRef]
- De Felice, G. Out-of-plane seismic capacity of masonry depending on wall section morphology. Int. J. Archit. Herit. 2011, 5, 466–482. [Google Scholar] [CrossRef]
- Lourenço, P.B. Recent advances in masonry structures: Micromodelling and homogenisation, in: Multiscale Modeling in Solid Mechanics: Computational Approaches. In Multiscale Modeling in Solid Mechanics: Computational Approaches; World Scientific Publishing: Singapore, 2009; pp. 251–294. [Google Scholar]
- Jafari, S.; Rots, J.G.; Esposito, R. A correlation study to support material characterisation of typical Dutch masonry structures. J. Build. Eng. 2021, 45, 103450. [Google Scholar] [CrossRef]
- Heyman, J. The stone skeleton. Int. J. Solids Struct. 1966, 2, 249–279. [Google Scholar] [CrossRef]
- Iannuzzo, A.; Block, P.; Angelillo, M.; Gesualdo, A. A continuous energy-based numerical approach to predict fracture mechanisms in masonry structures: CDF method. Comput. Struct. 2021, 257, 106645. [Google Scholar] [CrossRef]
- Iannuzzo, A. Energy based fracture identification in masonry structures: The case study of the church of “pieta dei turchini”. J. Mech. Mater. Struct. 2019, 14, 683–702. [Google Scholar] [CrossRef]
- Huerta, S. The Analysis of Masonry Architecture: A Historical Approach. Archit. Sci. Rev. 2008, 51, 297–328. [Google Scholar] [CrossRef] [Green Version]
- Huerta, S. Galileo was wrong: The geometrical design of masonry arches. Nexus Netw. J. 2006, 8, 25–52. [Google Scholar] [CrossRef] [Green Version]
- Block, P.; DeJong, M.J.; Ochsendorf, J.A. As hangs the flexible line: Equilibrium of masonry arches. Nexus Netw. J. 2006, 8, 13–24. [Google Scholar] [CrossRef] [Green Version]
- Zessin, J.; Lau, W.; Ochsendorf, J.A. Equilibrium of cracked masonry domes. Proc. Inst. Civ. Eng.-Eng. Comput. Mech. 2010, 163, 135–145. [Google Scholar] [CrossRef]
- Lourenço, P.B.; Mendes, N.; Ramos, L.F.; Oliveira, D.V. Analysis of masonry structures without box behavior. Int. J. Archit. Herit. 2011, 5, 369–382. [Google Scholar] [CrossRef]
- Suter, G.T.; Song, X. Review of Historic Stone Masonry Properties. In Proceedings of the Seventh Canadian Masonry Symposium, Hamilton, ON, Canada, 5–7 June 1995; McMaster University: Hamilton, ON, Canada, 1995. [Google Scholar]
- García, D.; San-José, J.T.; Garmendia, L.; San-Mateos, R. Experimental study of traditional stone masonry under compressive load and comparison of results with design codes. Mater. Struct. Constr. 2012, 45, 995–1006. [Google Scholar] [CrossRef]
- Pinho, F.F.S.; Lúcio, V.J.G. Rubble Stone Masonry Walls in Portugal: Material Properties, Carbonation Depth and Mechanical Characterization. Int. J. Archit. Herit. 2017, 11, 685–702. [Google Scholar] [CrossRef]


| 6.1 | 10 | 100 | 9000 |
| 2000 | 0.1, 0.15, 1.9 | 35, 35 | 1.5, 15, 3035 |
| Difference | |||
|---|---|---|---|
| South Façade | 0.31 | 0.39 | 20 |
| North Façade | 0.36 | 0.50 | 28 |
Publisher’s Note: MDPI stays neutral with regard to jurisdictional claims in published maps and institutional affiliations. |
© 2022 by the authors. Licensee MDPI, Basel, Switzerland. This article is an open access article distributed under the terms and conditions of the Creative Commons Attribution (CC BY) license (https://creativecommons.org/licenses/by/4.0/).
Share and Cite
Hamp, E.; Gerber, R.; Pulatsu, B.; Quintero, M.S.; Erochko, J. Nonlinear Seismic Assessment of a Historic Rubble Masonry Building via Simplified and Advanced Computational Approaches. Buildings 2022, 12, 1130. https://doi.org/10.3390/buildings12081130
Hamp E, Gerber R, Pulatsu B, Quintero MS, Erochko J. Nonlinear Seismic Assessment of a Historic Rubble Masonry Building via Simplified and Advanced Computational Approaches. Buildings. 2022; 12(8):1130. https://doi.org/10.3390/buildings12081130
Chicago/Turabian StyleHamp, Elyse, Rachel Gerber, Bora Pulatsu, Mario Santana Quintero, and Jeffrey Erochko. 2022. "Nonlinear Seismic Assessment of a Historic Rubble Masonry Building via Simplified and Advanced Computational Approaches" Buildings 12, no. 8: 1130. https://doi.org/10.3390/buildings12081130