Article

Fresh and Hardened Properties of Concrete Reinforced with Basalt Macro-Fibers

1
Department of Civil and Environmental Engineering, College of Engineering, Al Ain Campus, United Arab Emirates University, Al Ain P.O. Box 15551, United Arab Emirates
2
Studies, Research and Development Department, Ministry of Energy and Infrastructure, Dubai P.O. Box 1828, United Arab Emirates
*
Author to whom correspondence should be addressed.
Buildings 2022, 12(8), 1136; https://doi.org/10.3390/buildings12081136
Submission received: 22 June 2022 / Revised: 21 July 2022 / Accepted: 29 July 2022 / Published: 1 August 2022
(This article belongs to the Section Building Materials, and Repair & Renovation)

Abstract

:
This study examines the fresh and hardened properties of normal- and high-strength concrete (NSC and HSC) reinforced with basalt macro-fibers (BMF) at a volume fraction (νf) of 0.5–1.5%. Workability tests were conducted on the fresh concrete to evaluate the slump, compacting factor, and vebe time. Mechanical tests were performed on the hardened concrete to examine the compressive strength, tensile properties, and flexural performance. Different durability characteristic tests were carried out to evaluate the water/chloride penetrability, bulk resistivity, and abrasion resistance of the hardened concrete. The addition of BMF reduced the concrete workability of both NSC and HSC at almost the same rate. A maximum slump reduction of 78%, on average, was recorded at νf of 1.5%. The compressive strength of the NSC slightly increased by 1–5% due to the addition BMF, whereas that of the HSC with BMF was, on average, 6% lower than that of their plain counterparts. The NSC with BMF exhibited significant improvements of 10–52% in the splitting tensile strength, 18–56% in the flexural strength, and 17–27% in the abrasion resistance. The enhancement caused by the addition of BMF was less pronounced for the HSC, where maximum respective improvements of 22, 25, and 4% were recorded. The NSC and HSC with BMF exhibited a similar reduction in the water absorption (max. of 12%), chloride penetrability (max. of 19%), and a comparable improvement in the bulk resistivity (max. of 21%), relative to those of their plain counterparts. The flexural test results along with an inverse analysis were employed to develop new tensile softening laws of concrete with different BMF volume fractions.

1. Introduction

Mechanical properties and durability characteristics of concrete can be enhanced by the incorporation of fibers in the concrete mixture [1,2,3]. The addition of fibers results, however, in reducing the concrete workability [4]. Previous references considered studying the effect of a variety of metallic and non-metallic fibers on the properties of concrete [5,6,7,8]. Although steel fibers have been used to improve the mechanical properties of concrete, yet they are prone to corrosion [9,10]. In contrast, non-metallic fibers do not corrode, and hence, they are suitable for concrete structures in a corrosive environment.
The influence of different non-metallic fibers on concrete properties has been reported in the literature [11,12,13,14,15,16,17,18,19]. Wang et al. [11] investigated the effect of chopped basalt fibers, with a length (l) of 32 mm, diameter (d) of 15 µm, and Young’s modulus (Ef) of 95–115 GPa, on concrete properties. The concrete slump reduced by 5–34% at basalt fibers (BF) volume fraction (νf) in a range of 0.04–0.11%. The reduction in concrete workability caused by the addition of BF was attributed to the larger surface area requiring more cement paste, which reduced the concrete workability. Katkhuda and Shatarat [12] studied the behavior of concrete reinforced with chopped BF (l = 18 mm, d = 16 µm, Ef = 89 GPa). The inclusion of BF filaments at νf of 0.1–1.5% decreased the slump by 9–34%. The reduction in slump value was ascribed to an absorption of moisture by BF and an increased friction between fibers and concrete during mixing.
Contradicting results have been reported in the literature regarding the effect of non-metallic fibers on the compressive strength of concrete. Katkhuda and Shatarat [12] reported that concrete mixtures with BF exhibited an insignificant improvement in the compressive strength relative to that of a benchmark specimen without fibers. The addition of nylon fibers (NF), with l = 19 mm, d = 23 µm, and Ef = 5.3 GPa, enhanced the compressive strength by 25–36% at νf of 0.06–0.12% [18]. Ali et al. [13] found that the addition of glass fibers (GF), with l = 6–18 mm, d = 14 µm, and Ef = 72 GPa, at νf of 0.25 to 0.75% increased the compressive strength by 10%. Noushini et al. [14] studied the behavior of concrete reinforced with polyvinyl alcohol (PVA) fibers (l = 6 mm, d = 14 µm, Ef = 41.7 GPa). An increase of 8–12% in the compressive strength was reported at νf of 0.125–0.25%. Further increase in PVA volume fraction resulted in an insignificant additional improvement in the compressive strength. The strength enhancement was attributed to an increase in the resistance to the development and propagation of microcracks due to the presence of PVA fibers. Arsalan [15] reported a minor improvement in the concrete compressive strength (up to 7%) by the addition of BF at νf of 0.02–0.11% (l = 24 mm, d = 13–20 µm, Ef = 88 GPa). Contrarily, the addition of 43-mm long basalt minibars at νf of 0.31–2.00% decreased the compressive strength by up to 45% [20]. Likewise, Wang et al. [11] reported that the addition of chopped-BF to concrete mixtures at νf of 0.04–0.11% reduced the compressive strength by 27–35%.
Generally, the addition of non-metallic fibers enhances the splitting tensile strength (fsp) of concrete. The inclusion of GF at νf of 0.25–0.75% enhanced fsp by 14–18% [13]. The increase in fsp was attributed to an enhancement in the cement matrix stiffness against tensile forces. Das et al. [21] reported up to 30% improvement in fsp due to the addition of polypropylene fibers (PPF) (l = 12 mm, d = 25–40 µm, Ef = 4 GPa) at νf of 0.5–0.75%. The enhancement in the flexural strength was ascribed to the bridging effect of the fibers that allowed the specimens to withstand additional tensile forces. Ayub et al. [16] reported a 16% improvement in fsp due to the addition of BF at νf of 3% (l = 25 mm, d = 18 µm, Ef = 93.1–110 GPa). Likewise, an enhancement in the range of 5–10% was recorded in fsp due to the addition of BF at νf of 0.02–0.11% [15]. In contrast, Wang et al. [11] reported a reduction in fsp of 22–32% when BF were added at νf of 0.04–0.11%.
Non-metallic fibers improve the flexural strength (i.e., modulus of rupture, fr) and the post-peak response of concrete. The inclusion of BF at νf of 1–3% enhanced the flexural strength of HSC by 20–49% [16]. Katkhuda and Shatarat [12] reported that the addition of BF at νf of 0.1–1.5% enhanced the flexural strength by 8–74%. Likewise, Jalasutram et al. [17] observed an improvement in the flexural strength of up to 75% by the addition of BF at νf of 0.5–2%. Basalt minibars enhanced the flexural strength and residual strength of concrete [20]. Contrarily, the flexural strength of concrete decreased by 29–40% when BF were added at νf of 0.04–0.11% [11].
The durability properties of concrete were insignificantly influenced by the addition of non-metallic fibers [18]. The addition of NF at νf of 0.06–0.12% enhanced the ultrasonic pulse velocity (UPV) value of concrete by 7–11% [18]. The improvement in UPV value was partially attributed to the bridging effect of NF, which restricted the development of microcracks in the cement matrix [18].
Finite element (FE) analysis is a powerful tool to predict the non-linear response of concrete elements. One of the key input parameters for FE modeling of fiber-reinforced concrete structural elements is the tensile softening law (i.e., tension function). The tensile softening law of fiber-reinforced concrete is determined directly by the uniaxial tensile test. However, due to the complication of the uniaxial tensile test, an alternative approach of inverse analysis has been proposed in the literature. This method requires testing of prismatic concrete specimens, setting up specific parameters for the tension function, and iterations until the difference between the predicted load-deflection response of tested prisms and that obtained from experimental tests becomes negligible [22,23,24,25]. To the best knowledge of the authors, no tensile softening laws capable of describing the post-cracking response of concrete reinforced with BMF are available in the literature, despite their importance as a key input parameter necessary for modeling and analysis of fiber-reinforced concrete. The conflicting information on the effect of fibers on the properties of concrete and the absence of a tensile softening law that can characterize the post-cracking response of concrete reinforced with BMF necessitate further investigations.

2. Research Significance

This research provides new knowledge on the fresh and hardened properties of NSC and HSC mixtures reinforced with different BMF volume fractions through a comprehensive experimental investigation. The interrelationships between the concrete grade, BMF volume fraction, and concrete properties were elucidated. The novelty of the work includes generation of new material characterization data and development of new tensile softening laws of concrete with different BMF volume fractions. Such data are necessary for practitioners and researchers to design and simulate the behavior of concrete structures reinforced with BMF.

3. Materials and Methods
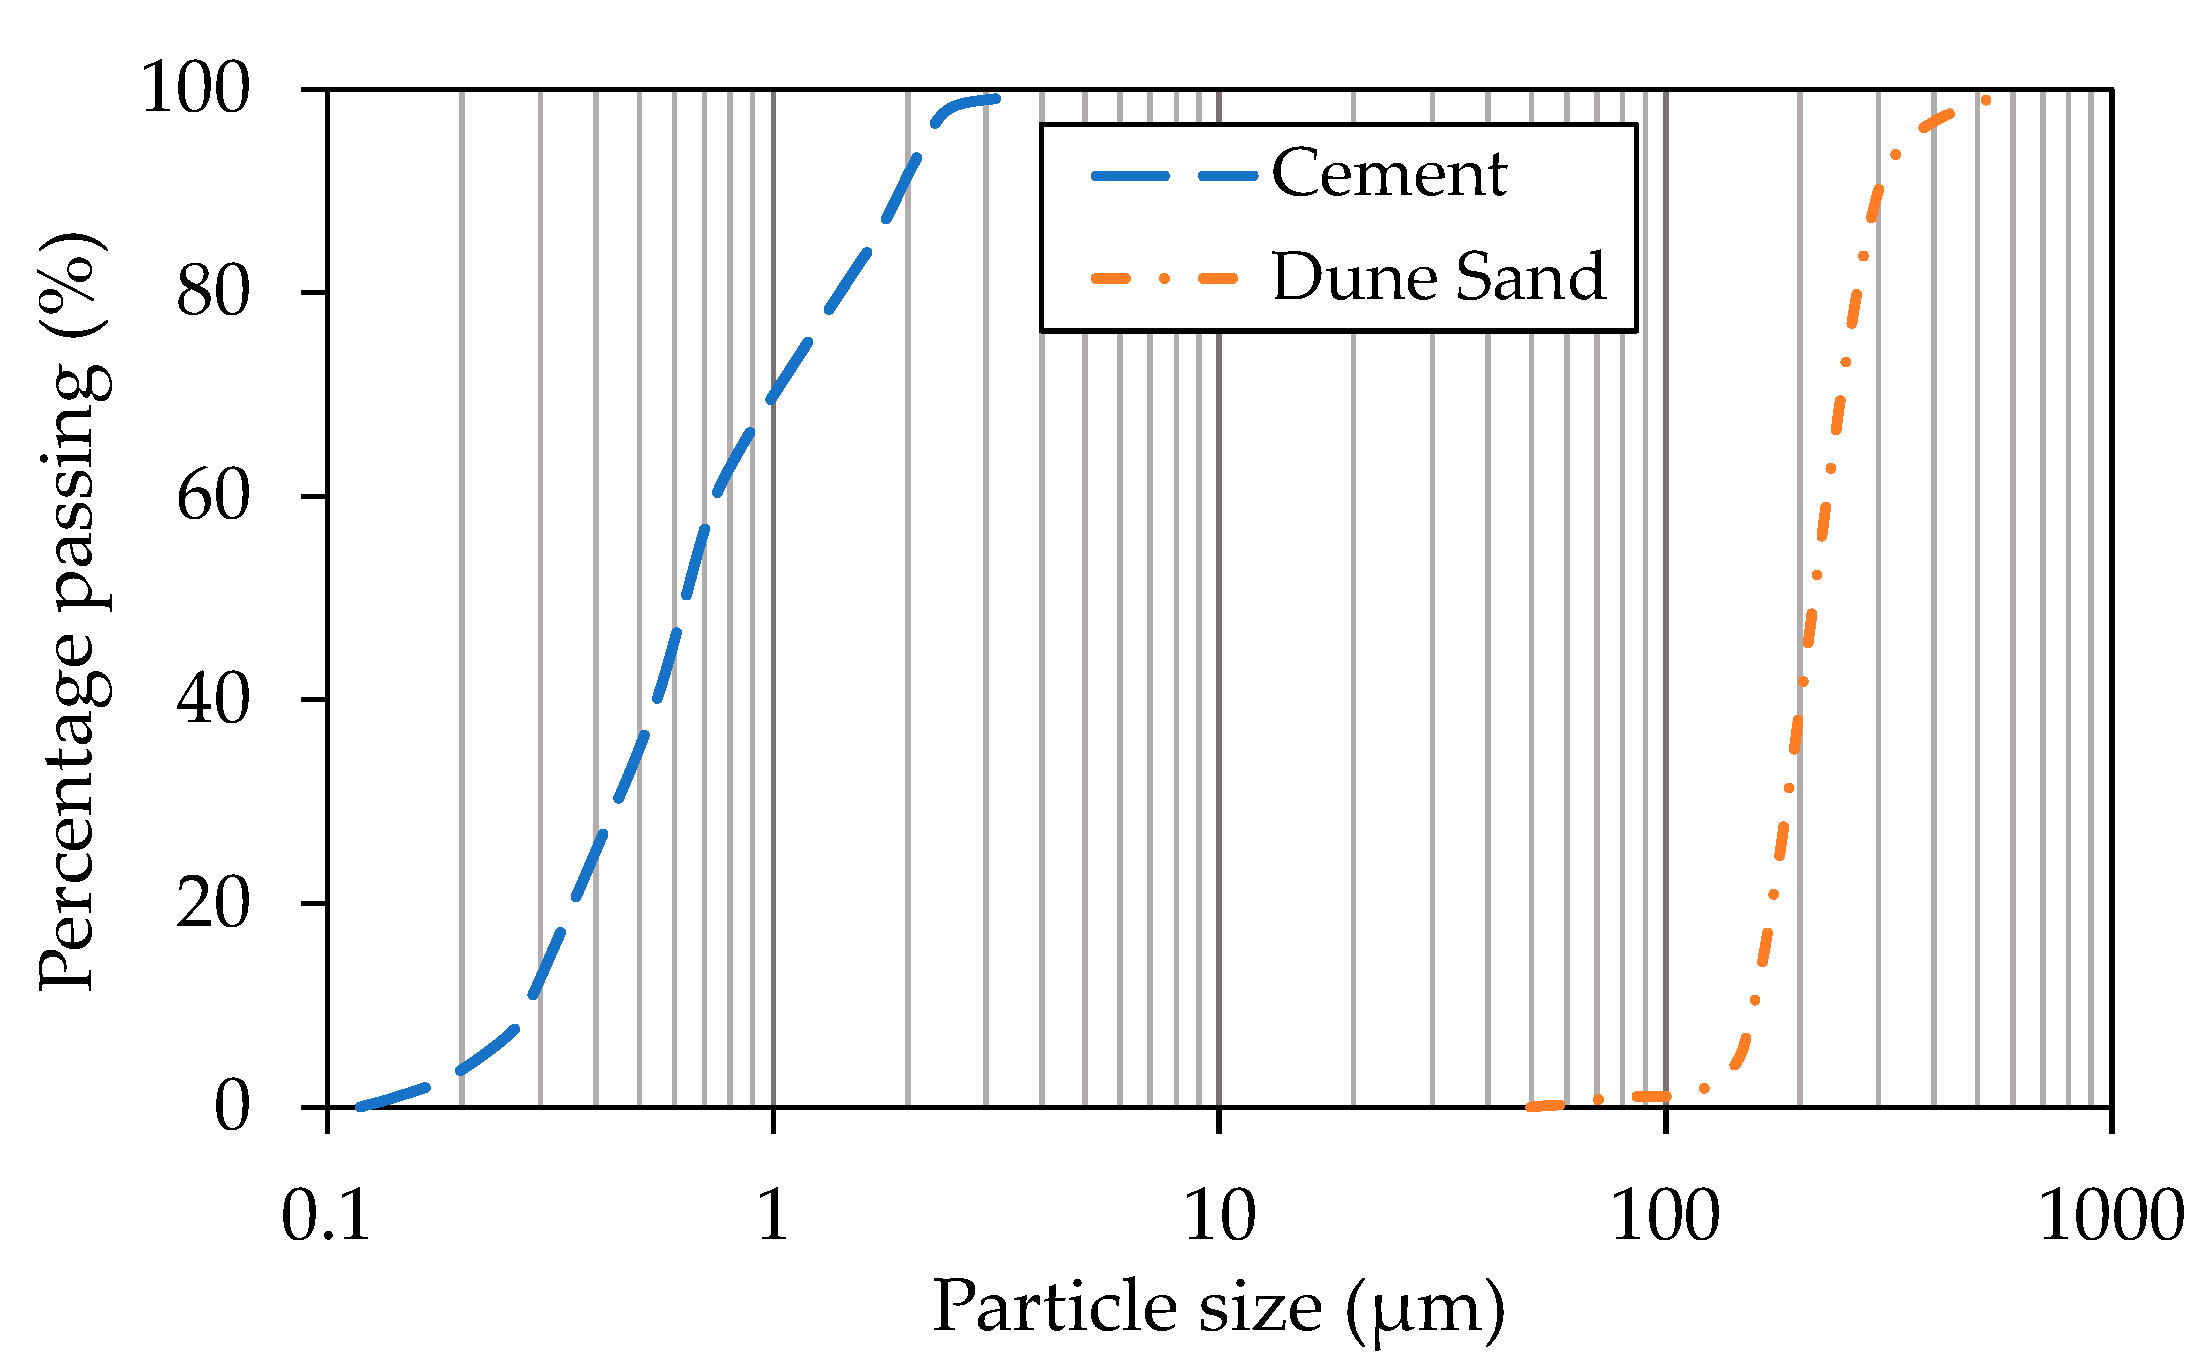
The test matrix is listed in Table 1. Eight concrete mixes were prepared and grouped into two categories based on the concrete grade (NSC with a target cube strength (fcu) of 40 MPa and HSC with a target fcu of 60 MPa). The test variables also included the BMF volume fraction (0.5, 1.0, and 1.5%). The properties of materials, mixture proportioning, sample preparation, and testing procedures are described in the following sections.

3.1. Materials

ASTM Type-I Ordinary Portland Cement (OPC) [26] obtained from Emirates Cement Factory, Al Ain, UAE, was used as the main binding material in the concrete mixes. Desert dune sand (DS), obtained from Al Ain Municipality, Al Ain, UAE, was used as sustainable fine aggregates. The particle size distribution curves of dune sand and OPC are demonstrated in Figure 1. Coarse aggregates (CA) were obtained in the form of crushed dolomitic limestone from Stevin Rock, Ras Al Khaimah, UAE, with a nominal maximum size (NMS) of 19 mm. A polycarboxylic ether polymer-based superplasticizer (SP), obtained from BASF, Abu Dhabi, UAE, was added to improve the workability of the concrete mixes. Basalt macro-fibers with a length of 43 mm and diameter of 0.72 mm, obtained ReforceTech AS, Røyken, Norway, were used in the concrete mixes. The physical appearance of BMF is shown in Figure 2. The properties of CA and DS are listed in Table 2. The physical properties of BMF are listed in Table 3.

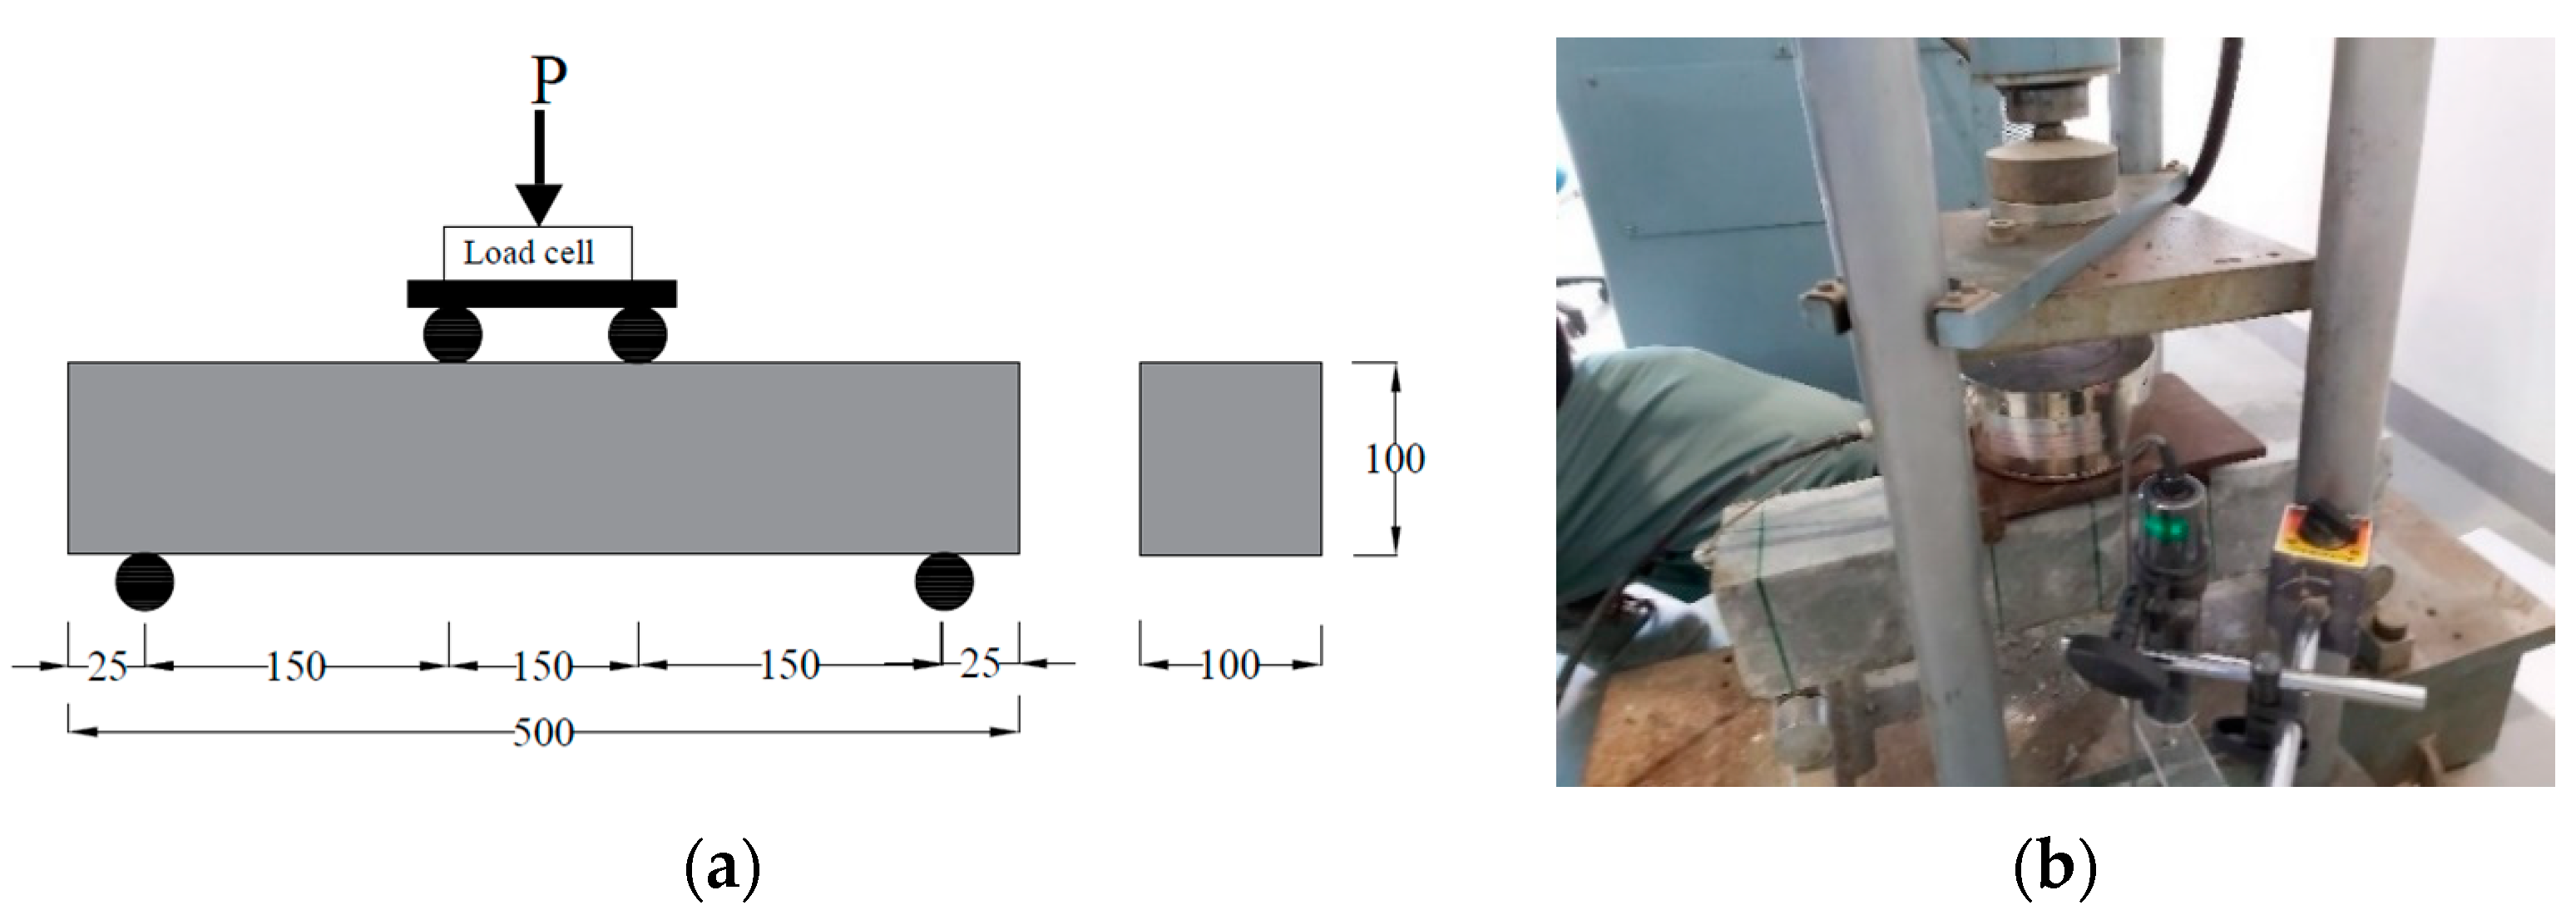
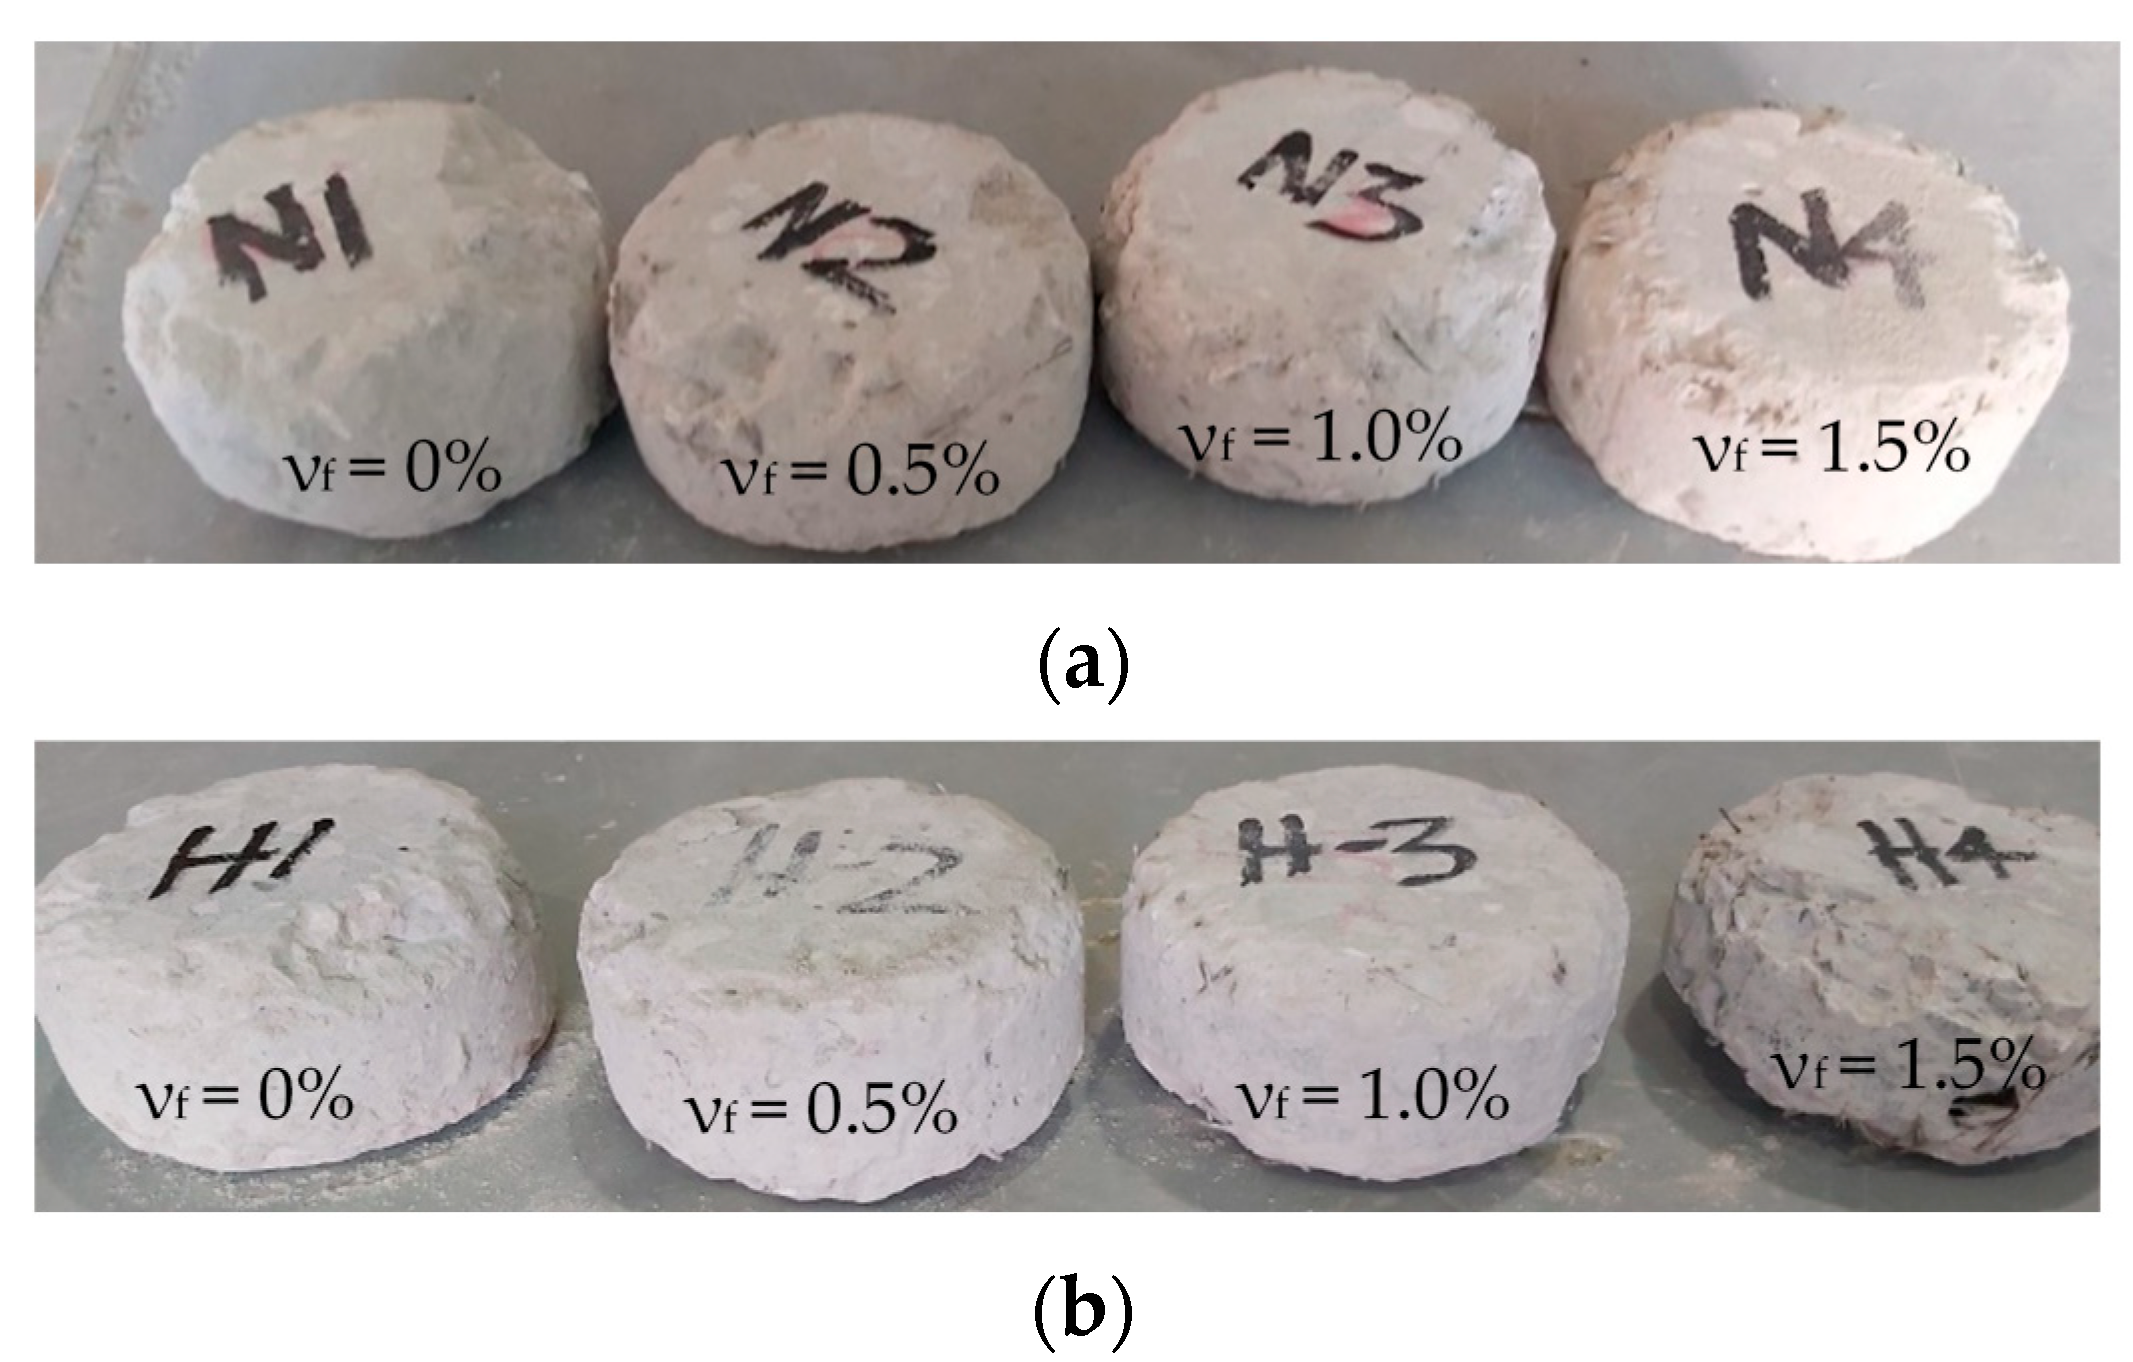
3.2. Mixture Proportioning and Testing Methods

The proportions of the concrete mixtures are listed in Table 4. Concrete mixes were labeled as x-BMFy, where x represents the concrete grade (NSC or HSC), BMF stands for basalt macro-fibers, and y shows the volume fraction of the BMF. For instance, NSC-MBF0.5 represents NSC reinforced with a BMF volume fraction of 0.5%. The constituents of dune sand, coarse aggregates, cement, water, and superplasticizer for the NSC were 659, 1080, 470, 230, and 0.47 kg/m3, respectively, while the respective values for the HSC were 513, 1079, 617, 216, and 0.92 kg/m3. The constituents of each concrete grade were kept the same while the BMF volume fraction was 0.5, 1.0, or 1.5%. The dosage of the superplasticizer was decided to achieve a slump in the range of 200–220 mm for the benchmark specimens, NSC-MBF0.0 and HSC-MBF0.0.
Dry components, including cement, dune sand, and saturated surface dry (SSD) coarse aggregates, were added in a mechanical revolving mixer and mixed for 3 min. Then, water was added to the mixer and mixed for an additional 3 min. The BMF were incorporated at the end to avoid their breakage and agglomeration. Fresh concrete samples were cast in up to five layers to facilitate proper compaction, as per ASTM C31 [33]. The specimens were placed on an electrical vibrating table and vibrated for about 5 s after each layer. The concrete specimens were covered with thick polyethylene-based plastic sheets and demolded after 24 h. Then, water curing of concrete specimens was carried out for 28 days.
Different experiments were performed to investigate the fresh, mechanical, and durability properties of the concrete mixtures. Table 5 summarizes the studied properties, testing standards, specimen type and size, and the number of replicates tested. One batch was produced for each concrete mixture, and hence, the workability tests were conducted once on the freshly-mixed concrete. The tests related to mechanical properties of the concrete, including the compressive, splitting, and flexural strengths had 3 to 5 replicate samples. One concrete cylinder from each mixture, tested in compression, was instrumented with two 60-mm long strain gauges aligned vertically at the mid-height to measure the concrete strains during testing necessary for the calculation of the concrete Young’s modulus. The durability tests were intended to estimate the resistance of the concrete to abrasion and diffusion of water/chlorides. Primary durability tests related to the resistance of the concrete to migration of water/chlorides included the water absorption and rapid chloride penetration test (RCTP). Supplementary tests related to the resistance of the concrete to the diffusion of water and uniformity of the concrete included the sorptivity, bulk resistivity, and ultrasonic pulse velocity (UPV). The primary durability tests related to the migration of water and chlorides through the concrete in addition to the abrasion resistance test included three replicate samples, whereas the supplementary tests were conducted on one sample only to optimize the number of tests. Figure 3 shows typical compression and splitting tensile strength tests in progress. Figure 4a shows a schematic of the flexural test setup, while Figure 4b shows a photograph of a flexural test in progress. Figure 5 shows typical durability tests in progress.

4. Results

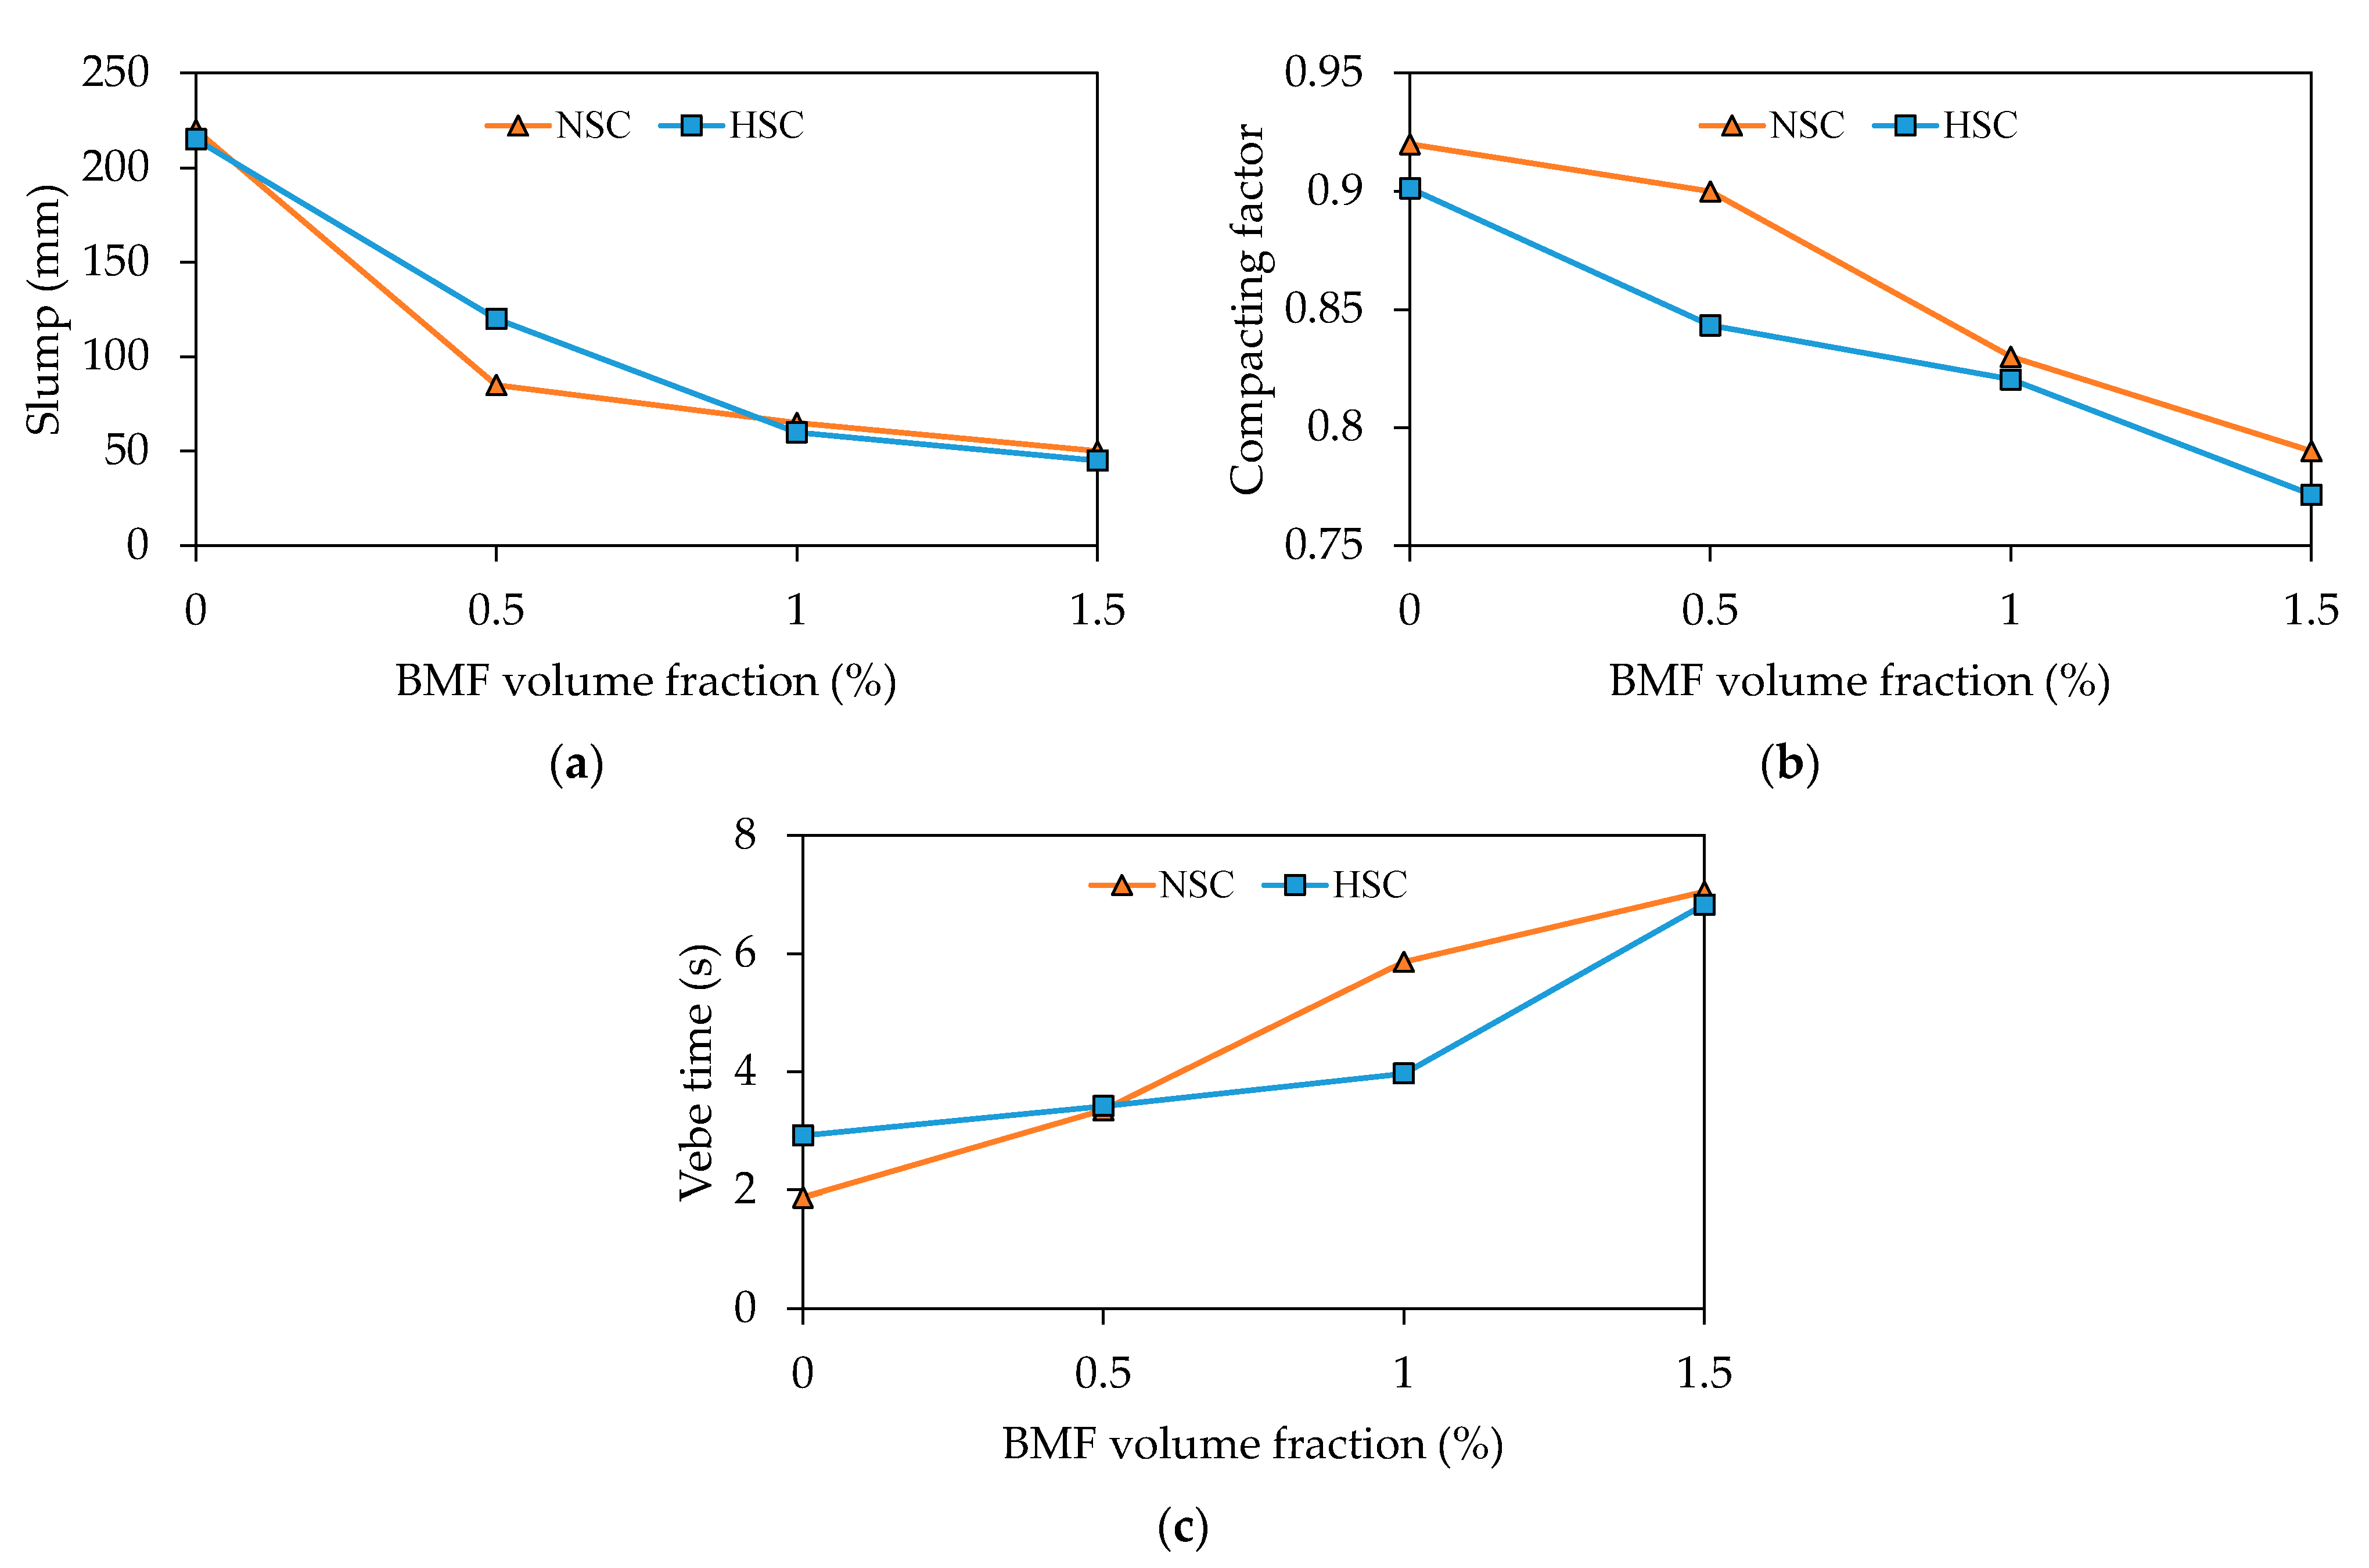
4.1. Fresh Properties

The workability of concrete was evaluated using the slump, compacting factor, and vebe tests. The concrete workability test results are listed in Table 6. The slump value decreased with an increase in the BMF volume fraction. When BMF were added to the concrete mix, the surface area required to be covered by the cementitious paste increased. Since the cement content was maintained for all mixes, the slump decreased. Figure 6a demonstrates the effect of BMF on the concrete slump. At νf of 0.5%, the slump of the NSC and HSC mixtures significantly reduced by 61 and 44%, respectively, relative to that of the corresponding benchmark concrete mix without fibers. Following this initial drop, the slump of the NSC continued to decrease but at a lower rate. The slump of the HSC decreased at the same rate up to νf of 1.0%, after which the slump decreased at a lower rate. At νf ≥ 1.0%, the slump values of the NSC and HSC mixtures were insignificantly different. At νf of 1.5%, the slump of the NSC and HSC was on average 78% lower than that of the benchmark specimens. Considering the slump test results, it can be concluded that the addition of BMF at νf of 1.5% dropped the workability category of both NSC and HSC from “High” to “Low” [48]. The reduction in slump by adding BMF can be approximated as a bilinear response, as evident from Figure 6a.
Figure 6b demonstrates the effect of BMF on the compacting factor. The compacting factor values of NSC and HSC benchmark specimens without BMF were 0.92 and 0.90, respectively. The compacting factor decreased almost linearly with an increase in the BMF volume fraction. At νf ≥ 1.0%, the compacting factor of the NSC and HSC mixtures was insignificantly different. Based on compacting factor test results, the addition of BMF at νf of 1.5%, decreased the concrete workability category from “Medium” to “Very low” [48].
The effect of BMF on the vebe time of fresh concrete mixes is shown in Figure 6c. The vebe time value of the benchmark NSC and HSC specimens without BMF were 1.88 and 2.92 s, respectively, indicating a “Plastic” consistency description [49]. The NSC had a lower value of vebe time than that of the HSC, indicating a more workable concrete. The vebe time of the NSC increased in a linear fashion with an increase in the BMF volume fraction. The HSC mixtures with BMF also exhibited an increase in the vebe time with an increase in the BMF volume fraction. The rate of increase in the vebe time of the HSC was, however, more significant when the BMF volume fraction increased from 1.0 to 1.5%. Eventually, at νf of 1.5%, the vebe time of the NSC and HSC mixtures was insignificantly different with an average value of 6.94 s, indicating a “Stiff” consistency description [49]. All workability test results verified the reduced workability of concrete due to the addition of BMF, regardless of the concrete grade. The slump and the compacting factor of both NSC and HSC decreased almost at the same rate. Similarly, the concrete grade had an insignificant effect on the rate of increase in the vebe time caused by the addition of BMF. These results indicate that concrete mixtures having a similar initial slump are anticipated to exhibit a similar degradation in workability due to the addition of BMF, irrespective of their initial compressive strength.

4.2. Mechanical Properties

4.2.1. Compressive Strength

The cube compressive strength results of concrete mixes tested at the age of 3, 7, and 28 days are demonstrated in Figure 7. The concrete mixtures, including those with BMF showed a similar strength development profile. At a curing age of 3 days, the benchmark NSC and HSC specimens without BMF achieved 67 and 68% of the 28-day compressive strength, respectively. The addition of BMF had no effect of on the 3-day compressive strength of both NSC and HSC specimens. At the age of 7 days, the NSC and HSC benchmark specimens achieved 72 and 78% of the 28-day compressive strength, respectively, whereas their counterpart specimens with BMF gained, on average, 79 and 84% of their 28-day compressive strength, respectively.
The measured 28-day cube strengths (fcu) of benchmark NSC and HSC specimens were 40.0 and 58.6 MPa, respectively. The addition of BMF insignificantly improved fcu of the NSC by 1–5%. However, an insignificant reduction in the cube compressive strength of 4%, on average, was noticed for the HSC reinforced with BMF. Photographs of typical concrete cube specimens after failure are shown in Figure 8. The majority of the plain NSC cube specimens exhibited concrete spalling at failure (Figure 8a). The plain HSC cube specimens failed catastrophically, rendering a failure pattern shape of a shortened hourglass (Figure 8b). The NSC and HSC cube specimens with BMF exhibited fine cracks during testing, and remained coherent without disintegration at failure as shown in Figure 8c,d, respectively. The 28-day cylinder compressive strengths (f’c) of the NSC and HSC are compared in Figure 9. The cylinder compressive strengths of the benchmark NSC and HSC specimens were 36.5 and 53.6 MPa, respectively. The addition of BMF insignificantly increased f’c of the NSC by up to 4% but tended to decrease that of the HSC by 7 to 10%. Values of f’c/fcu of different concrete mixtures are listed in Table 7. The ratio of f’c/fcu for the NSC and HSC benchmark specimens was constant at a value of 0.91. For the NSC and HSC with BMF, the values were in the ranges of 0.90 to 0.93 and 0.85 to 0.90, respectively.
The moduli of elasticity (Ec) of the NSC and HSC benchmark specimens were 35.6 and 41.9 GPa, respectively. The inclusion of BMF had an insignificant effect on the modulus of elasticity of the concrete, except for specimen HSC-BMF1.5 made of HSC with νf of 1.5%, where a reduced Young’s modulus was observed. The reduced values of f’c exhibited by the HSC with BMF and the reduction in Young’s modulus of HSC-BMF1.5 could be attributed to fiber clustering that may have promoted initiation of microcracks during testing and/or formation of a weak composite interface caused by an increased fiber-to-fiber interaction.

4.2.2. Splitting Tensile Strength

Results of the splitting tensile strength (fsp) of cylindrical concrete specimens tested at 28 days are listed in Table 7, whereas the corresponding strength gains exhibited by the specimens reinforced with BMF are depicted in Figure 10. Overall, an increase in fsp of NSC and HSC was observed with the addition of BMF. The splitting tensile strength gain caused by the addition of BMF was more significant for the NSC rather than the HSC, possibly because of the initial strong matrix of the HSC that left little room for an improvement. The NSC mixtures exhibited splitting tensile strength gains of 10, 24, and 52% at νf of 0.5, 1.0, and 1.5, respectively. Their HSC counterparts showed respective splitting tensile strength gains of 3, 10, and 22%. The gain in the splitting tensile strength of the NSC increased at a higher rate than that of their HSC counterparts, as shown in Figure 10. The increase in fsp was almost proportional to BMF volume fraction for both NSC and HSC. The correlation coefficients (i.e., R2 value) of the best-fit linear relationship between the strength gain and BMF volume fraction for the NSC and HSC were 0.97 and 0.98, respectively. Nevertheless, it should be noted that the rate of increase in fsp of the NSC tended to be more significant when νf exceeded 1.0%. This behavior was not noticed for the splitting tensile strength results of the HSC, where the strength gain increased at a constant rate up to νf of 1.5%. Photographs of typical specimens after the splitting tensile strength test are shown in Figure 11. The NSC and HSC benchmark specimens without BMF split into two halves at failure, whereas those reinforced with BMF remained intact. As such, the inclusion of BMF in the mix prevented the catastrophic sudden splitting mode of failure observed in the benchmark specimens without BMF.

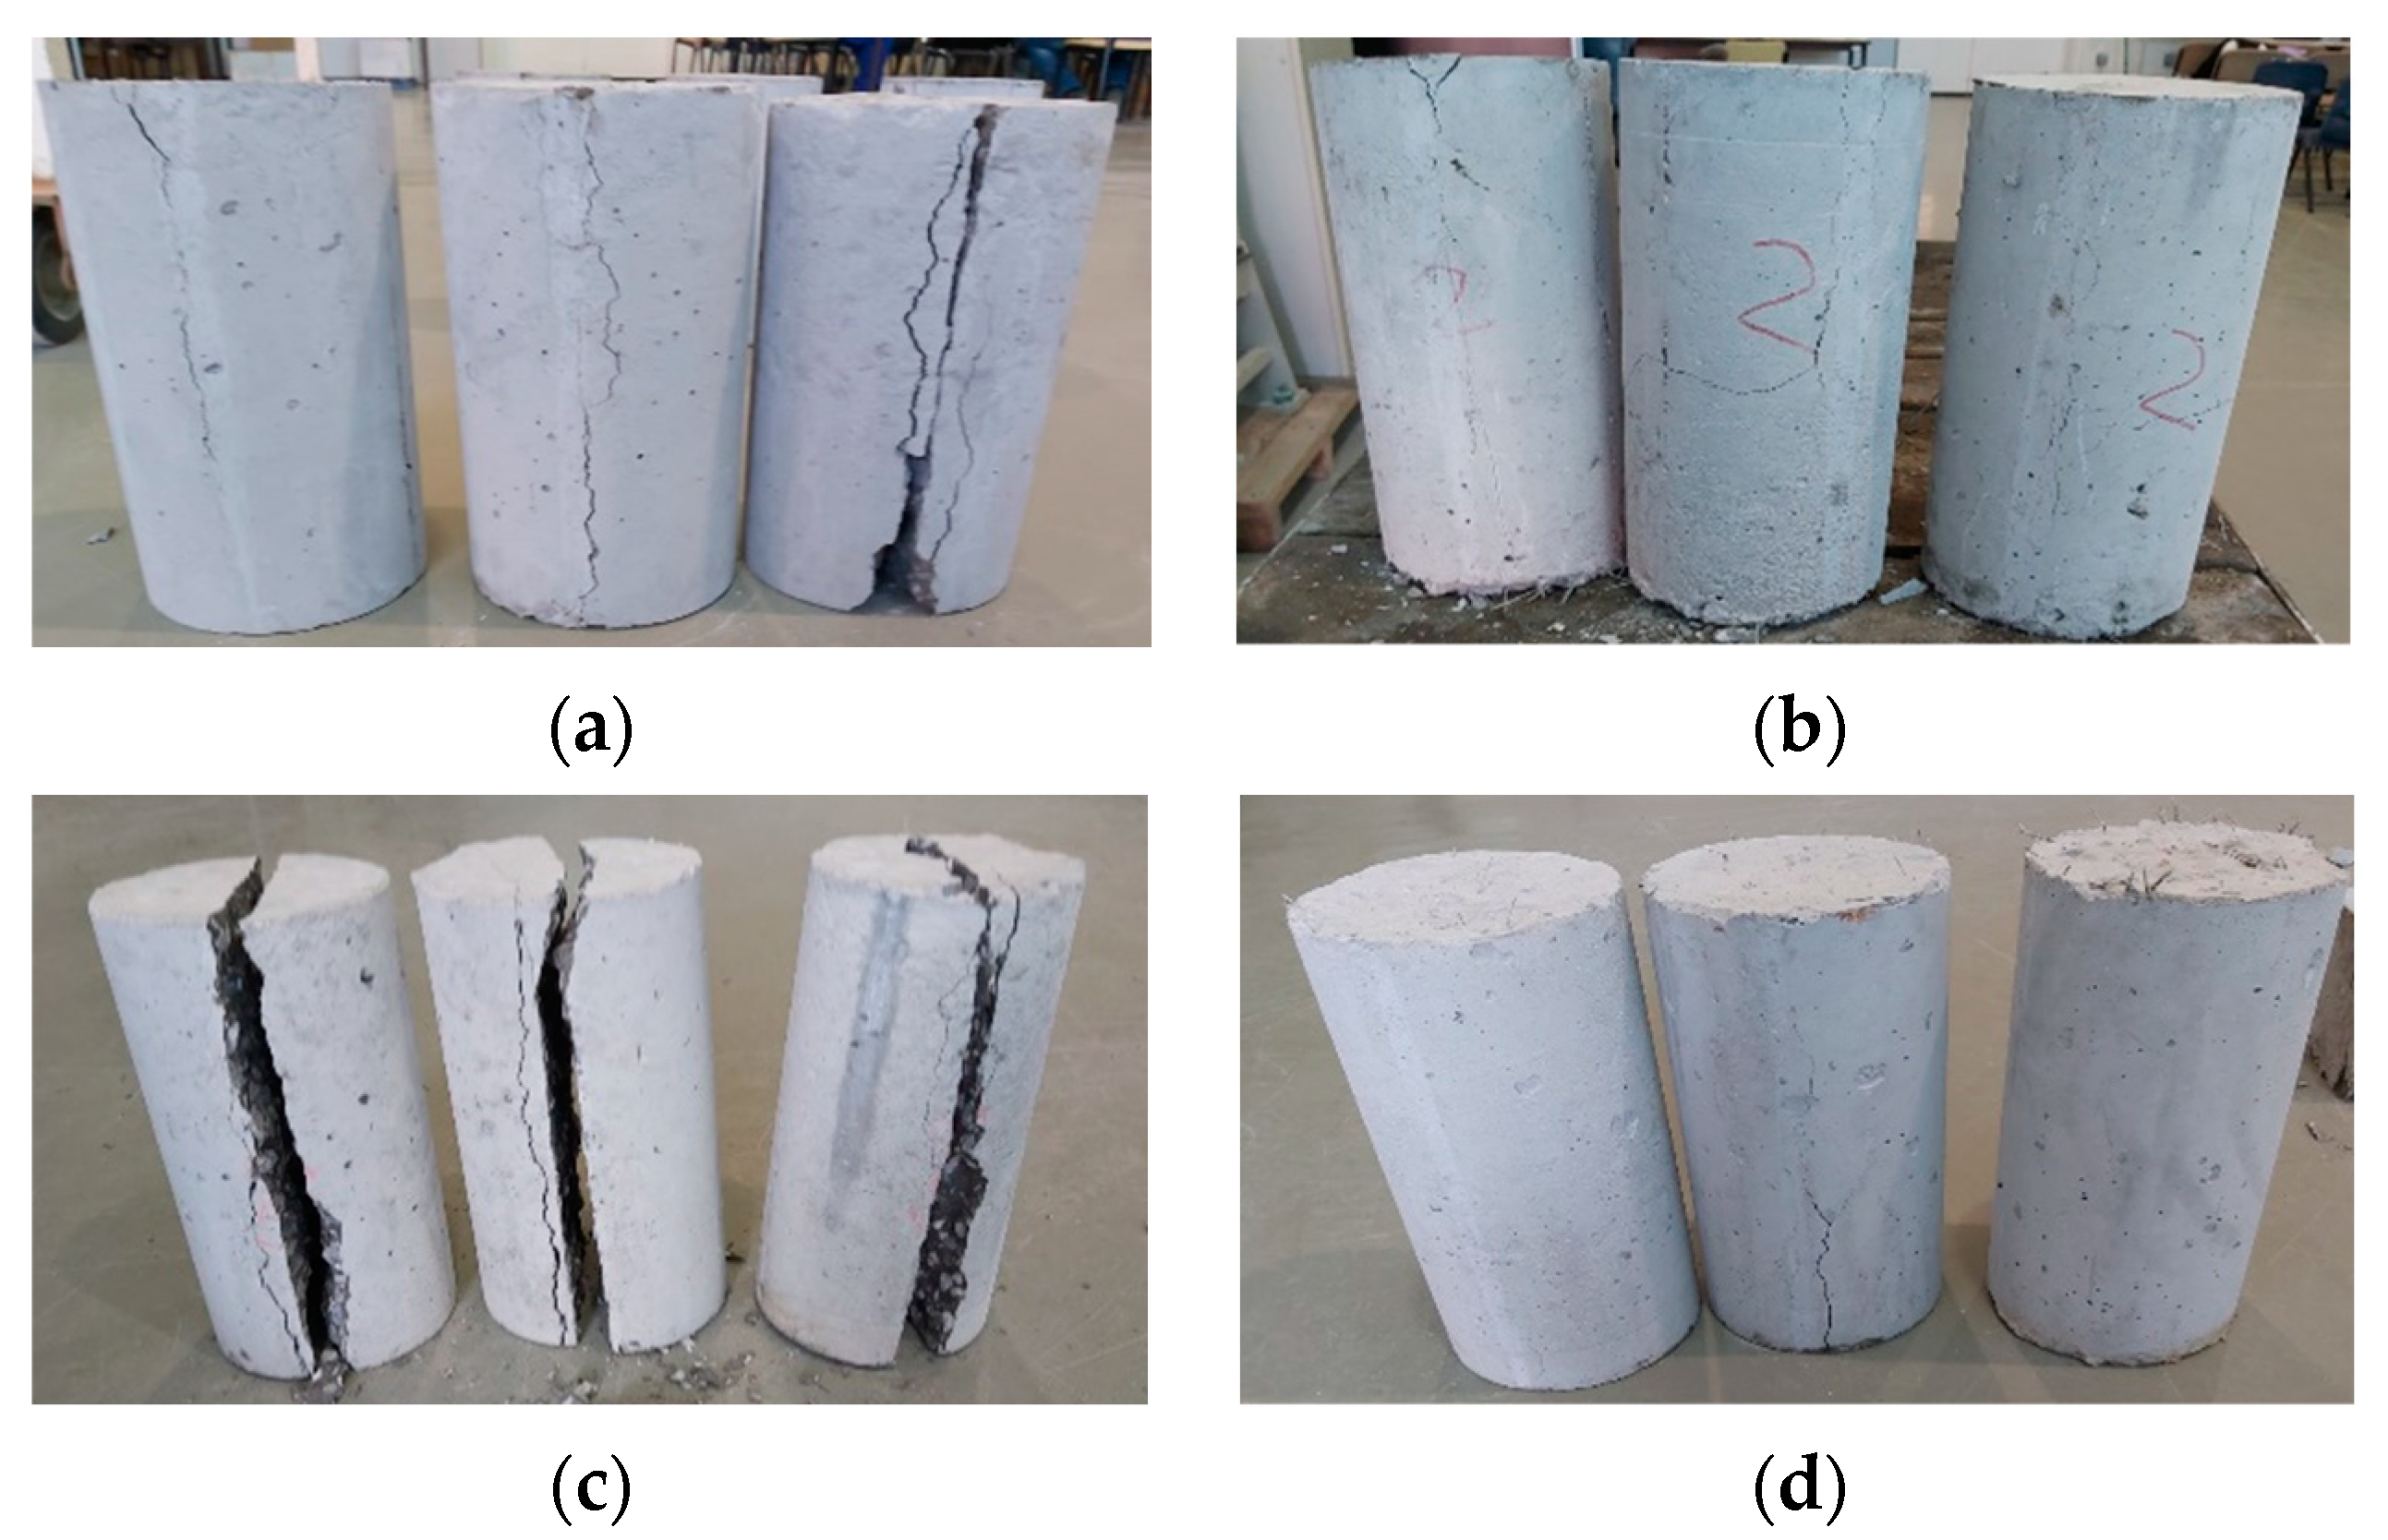
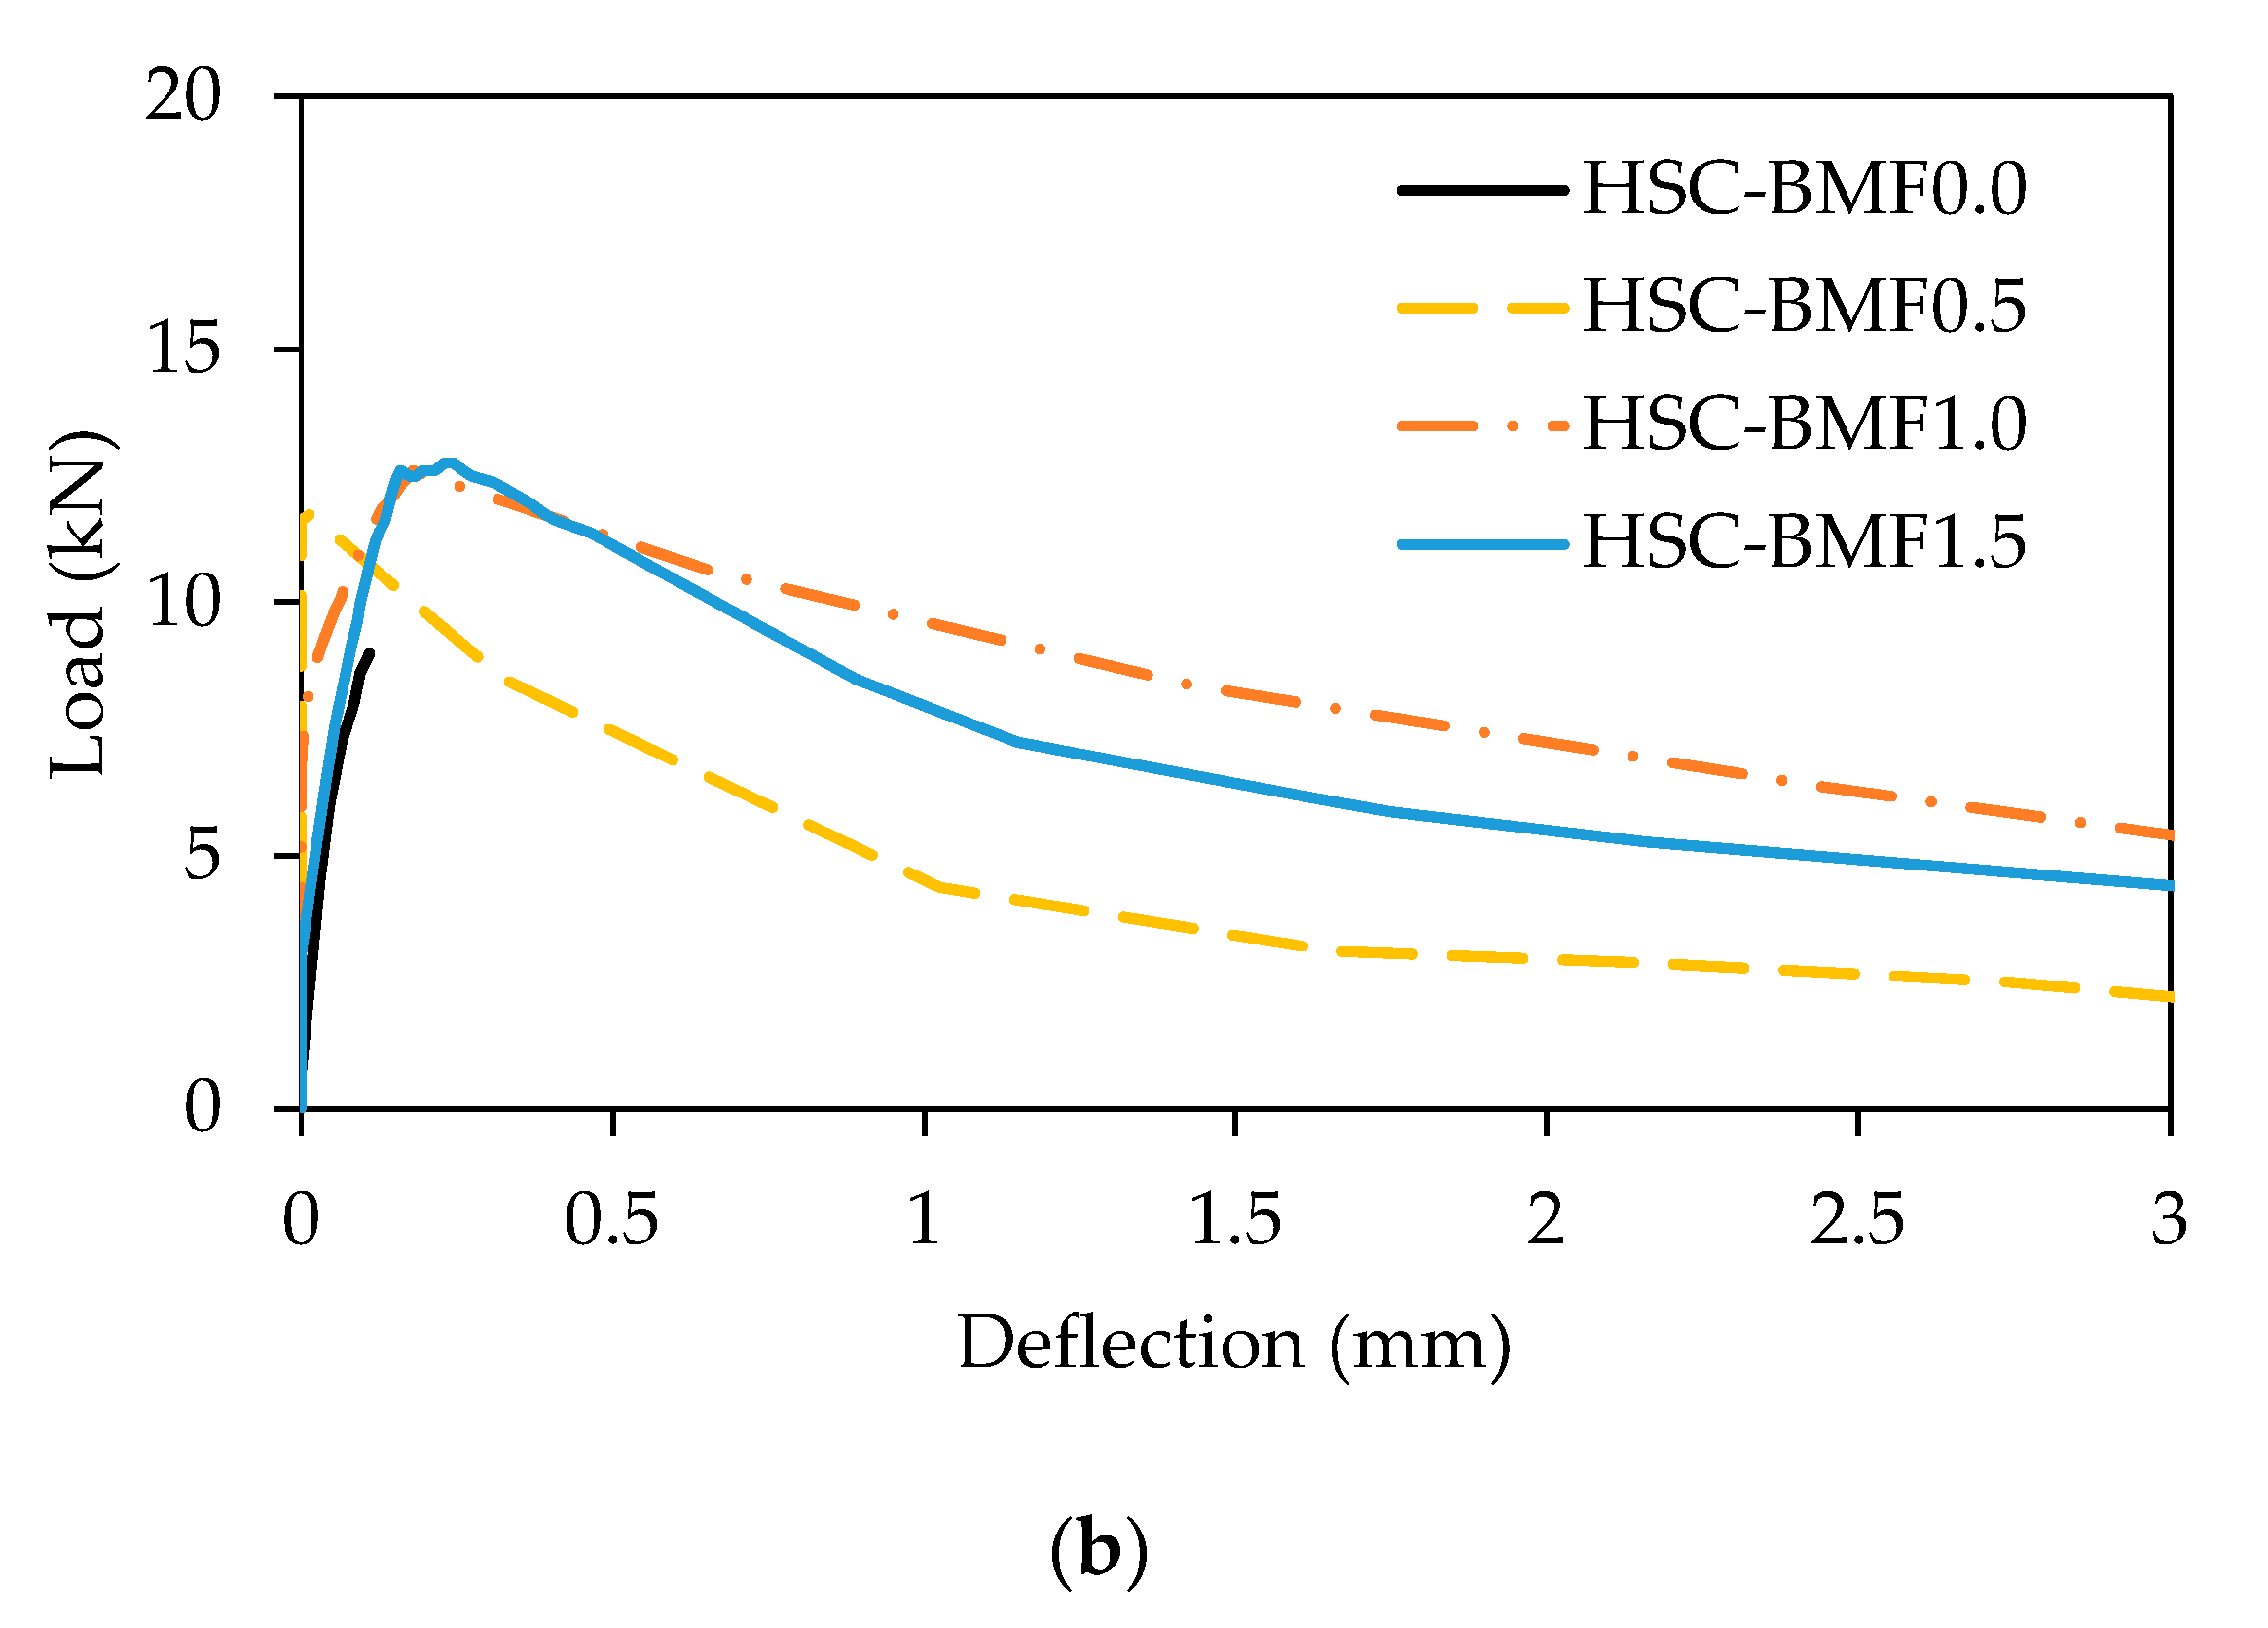
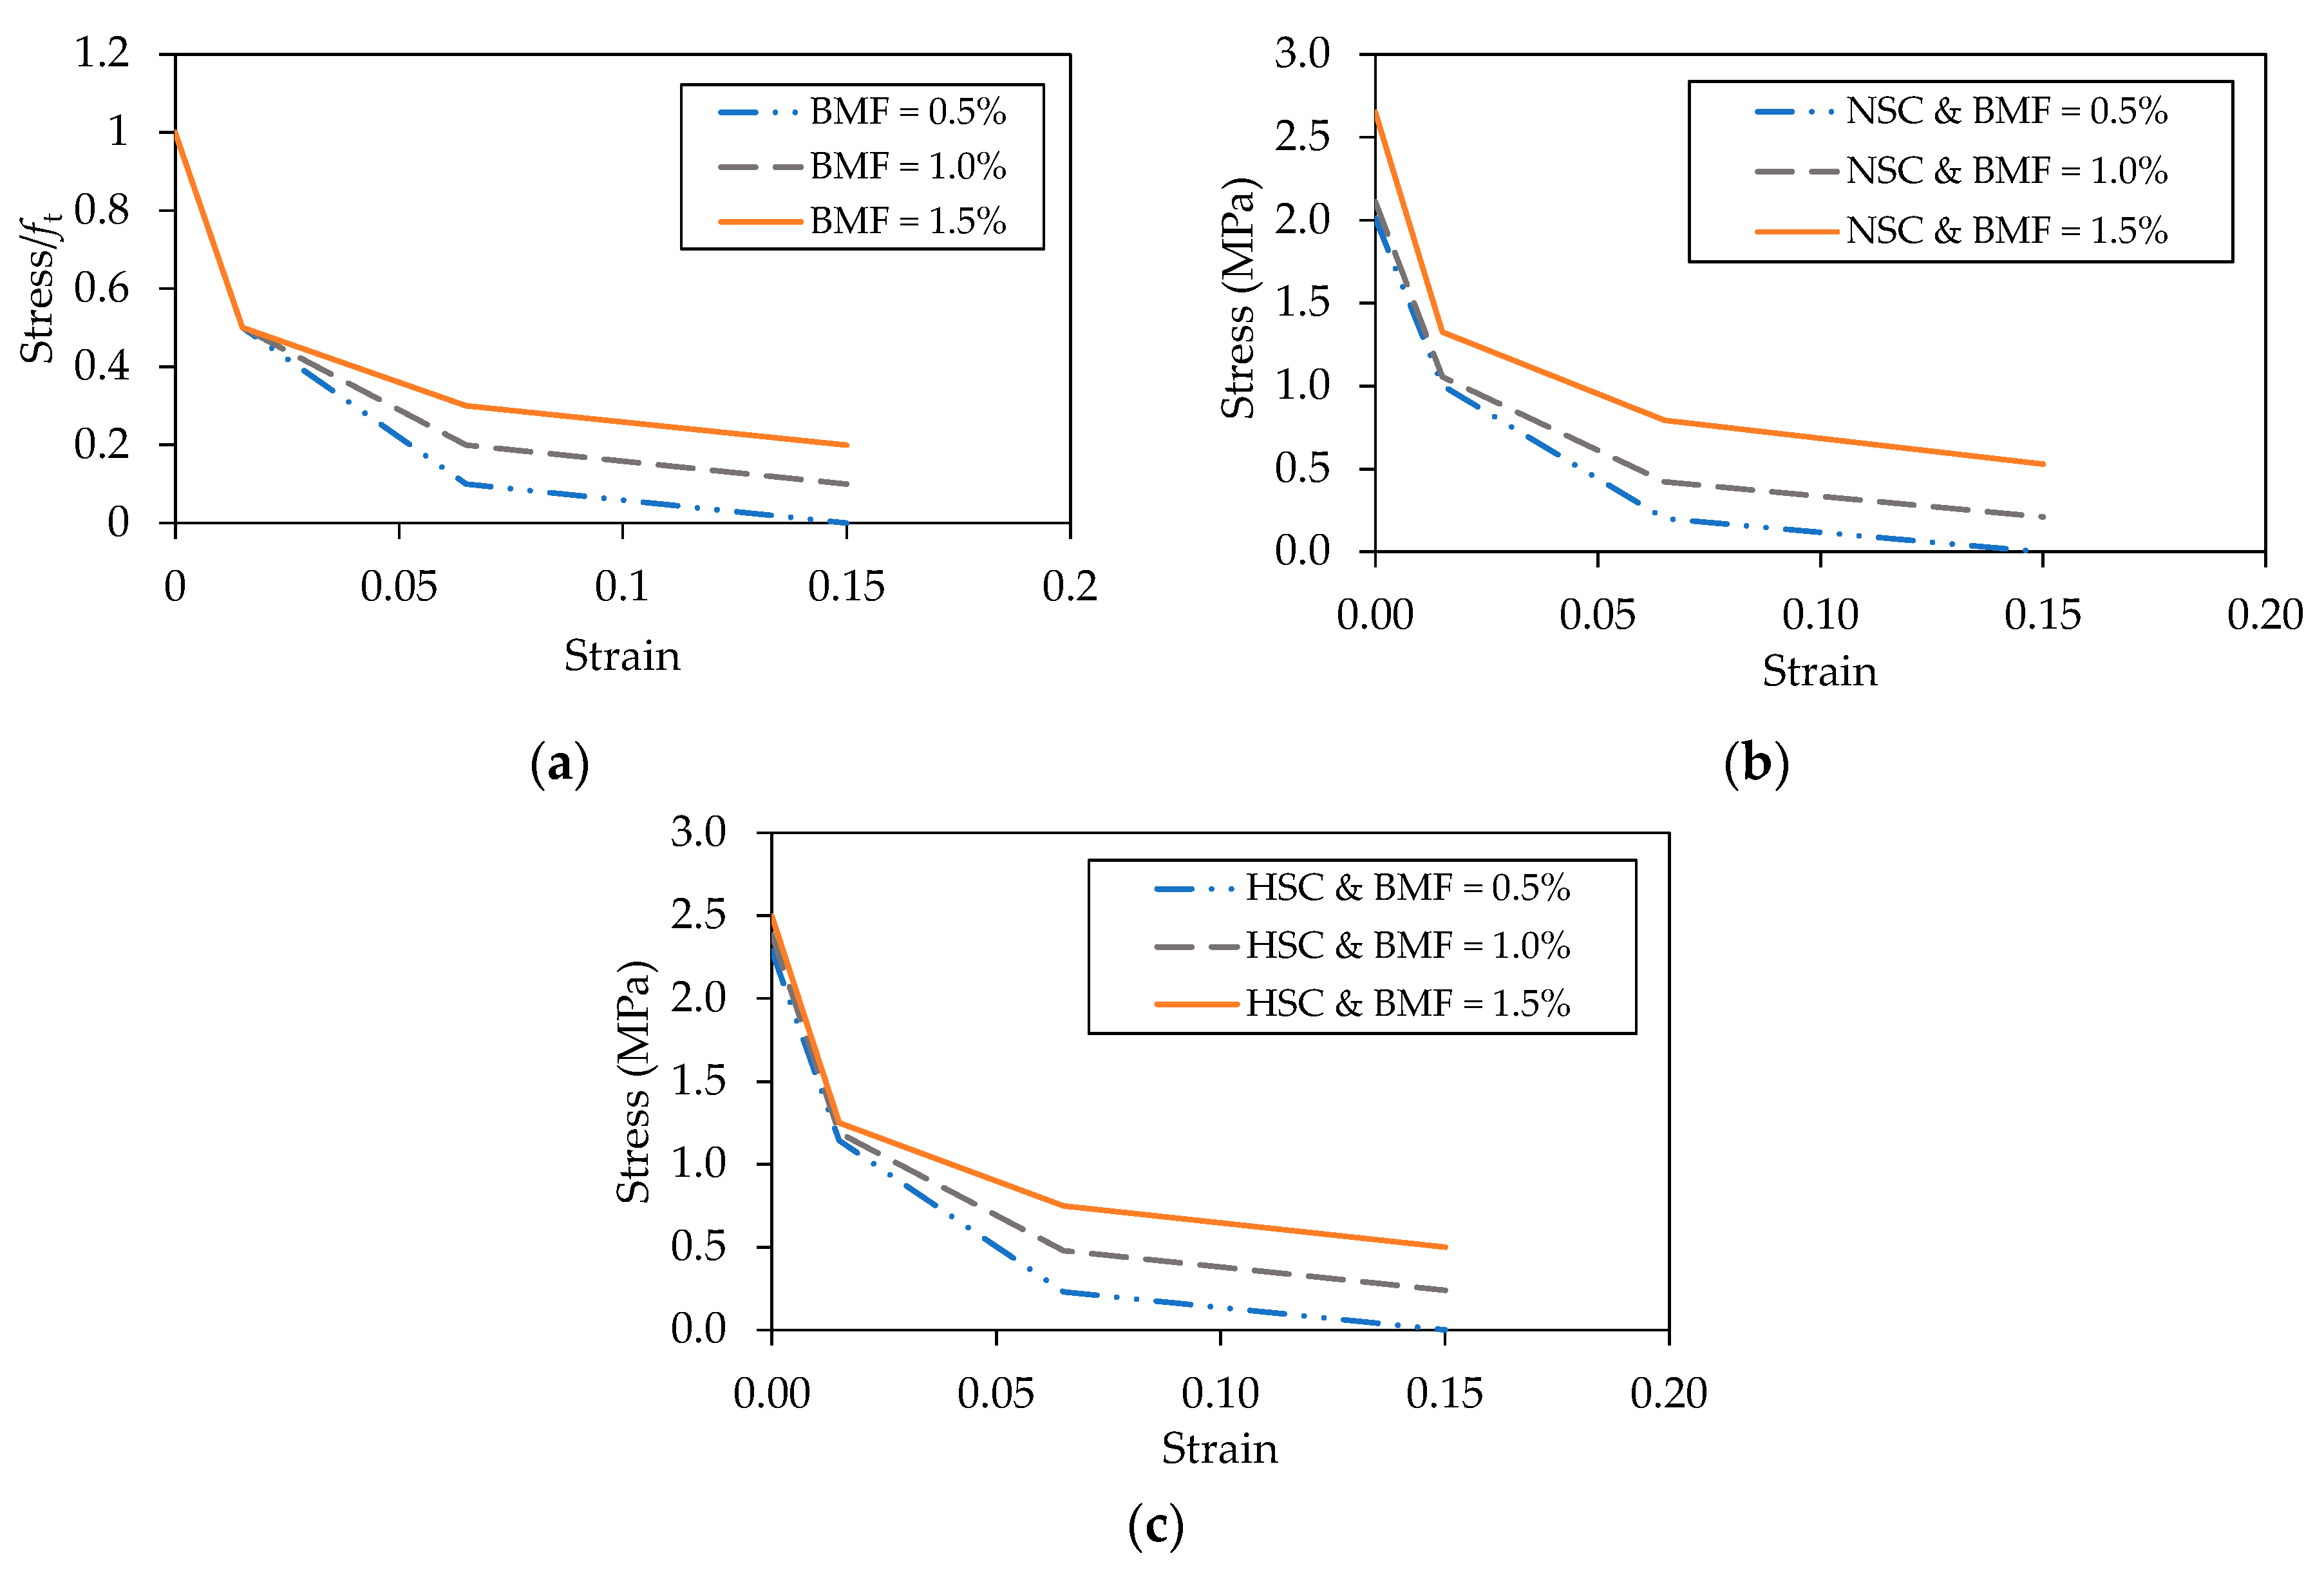
4.2.3. Flexural Performance

The flexural strengths (fr) of the NSC and HSC benchmark specimens without BMF were 3.82 and 4.50 MPa, respectively, as shown in Table 7. Although the splitting tensile strength of the NSC mixtures was, on average, 73% of that of the HSC, their flexural strength was, on average, 92% of that of the HSC. Similarly, the ratio of fsp/fr was, on average, 0.61 for the NSC and 0.77 for the HSC. These results indicated that the splitting tensile strength of the concrete was more sensitive to the concrete grade rather than the flexural strength, irrespective of the BMF volume fraction. The flexural strength gain is plotted against the BMF volume fraction in Figure 12. At νf of 0.5 and 1.0%, the flexural strength of the NSC improved by 18 and 24%, respectively. Their HSC counterparts showed respective flexural strength enhancements of 14 and 19%. At νf of 1.5%, the NSC exhibited a significant flexural strength gain of 56%, whereas its HSC counterpart experienced a flexural strength gain of 25%. The improvement in flexural strength caused by the addition of BMF can be approximated by a bi-linear relationship for NSC and a linear relationship for the HSC.
Detailed results of the four-point flexural test are listed in Table 8, whereas the load-deflection responses of representative NSC and HSC specimens tested under four-point loading are depicted in Figure 13. The symbol Pmax refers to the maximum load, whereas 𝛿p refers to the deflection at peak load. As per ASTM C1609 [41], f600D and f150D are the residual strengths corresponding to a deflection of L/600 (0.75 mm) and L/150 (3.0 mm), respectively, where D is the depth of the concrete prism (100 mm) and L is the span of the prism (450 mm). The symbol T150D represents the flexural toughness and refers to the area enclosed under the load-deflection response until the specimen reaches a deflection of L/150 (3 mm). The values of 𝛿p for NSC and HSC benchmark specimens without BMF were 0.05 and 0.11 mm, respectively. Considering the NSC, the values of 𝛿p at νf of 0.5, 1.0, and 1.5% were 0.05, 0.16, and 0.36 mm, respectively. Their HSC counterparts had 𝛿p values of 0.11, 0.13, and 0.38 mm, respectively. These results indicated that the addition of BMF at νf ≥ 1.0% increased the deflection at peak load relative to that of the benchmark specimens without fibers, whereas at the lower value of νf = 0.5%, the respective deflection was the same as that of the plain specimens. Generally, the deflection is expected to increase with an increase in the applied load. As such, the increased deflection at peak load observed for the specimens with the higher BMF volume fractions could be attributed to the increase in the value of their peak load.
The NSC and HSC benchmark specimens without BMF failed in a brittle manner at almost zero peak deflection, yielding null residual flexural strength and flexural toughness values. Contrarily, the specimens reinforced with BMF showed a post-peak tail, therefore, an improved ductility. At a deflection of L/600, the residual strengths (f600100) of the NSC, as a percent of peak strength (fr), were 63, 77, and 79% at νf of 0.5, 1.0, and 1.5% respectively. Their HSC counterparts exhibited respective values of 57, 69, and 83%. At a deflection of L/150, the residual strengths (f150100) of the NSC, as a percent of peak strength (fr), were 21, 35, and 62% at νf of 0.5, 1.0, and 1.5%, respectively. Their HSC counterparts showed respective values of 33, 42, and 48%. These results indicated that, regardless of the concrete grade, an increase in BMF volume fraction reduced the post-peak rate of degradation, thus, rendering an improved ductility. This behavior can be ascribed to the presence of BMF, which restricted the growth of the flexural crack, reduced the rate of increase in the flexural crack width, and thus, allowed the specimen to sustain additional deformations prior to complete failure.
Increasing the BMF volume fraction increased the flexural toughness of both NSC and HSC specimens. Values of the flexural toughness of the NSC specimens with νf of 1.0 and 1.5% were 38 and 136% higher than that of the specimen having νf of 0.5%. Their HSC counterparts exhibited respective increases of 42 and 73% in the flexural toughness. These results indicate that varying the concrete grade had no effect on the rate of increase in the flexural toughness at νf ≤ 1.0%. The increase in the flexural toughness was, however, more pronounced for the NSC rather than that of the HSC at the higher νf of 1.5%. Photographs of tested specimens after failure are shown in Figure 14. The NSC and HSC benchmark specimens without BMF failed catastrophically at the onset of initiation of the flexural crack, rendering full separation of the specimen into two halves. Most of the specimens reinforced with BMF did not split into two halves prior to failure. In contrast, this behavior did not happen for the specimens with BMF because of the bridging effect of the fibers. The presence of BMF improved the tension stiffening effect of the concrete and allowed for a gradual propagation of the flexural crack without a catastrophic mode of failure.

4.3. Durability Properties

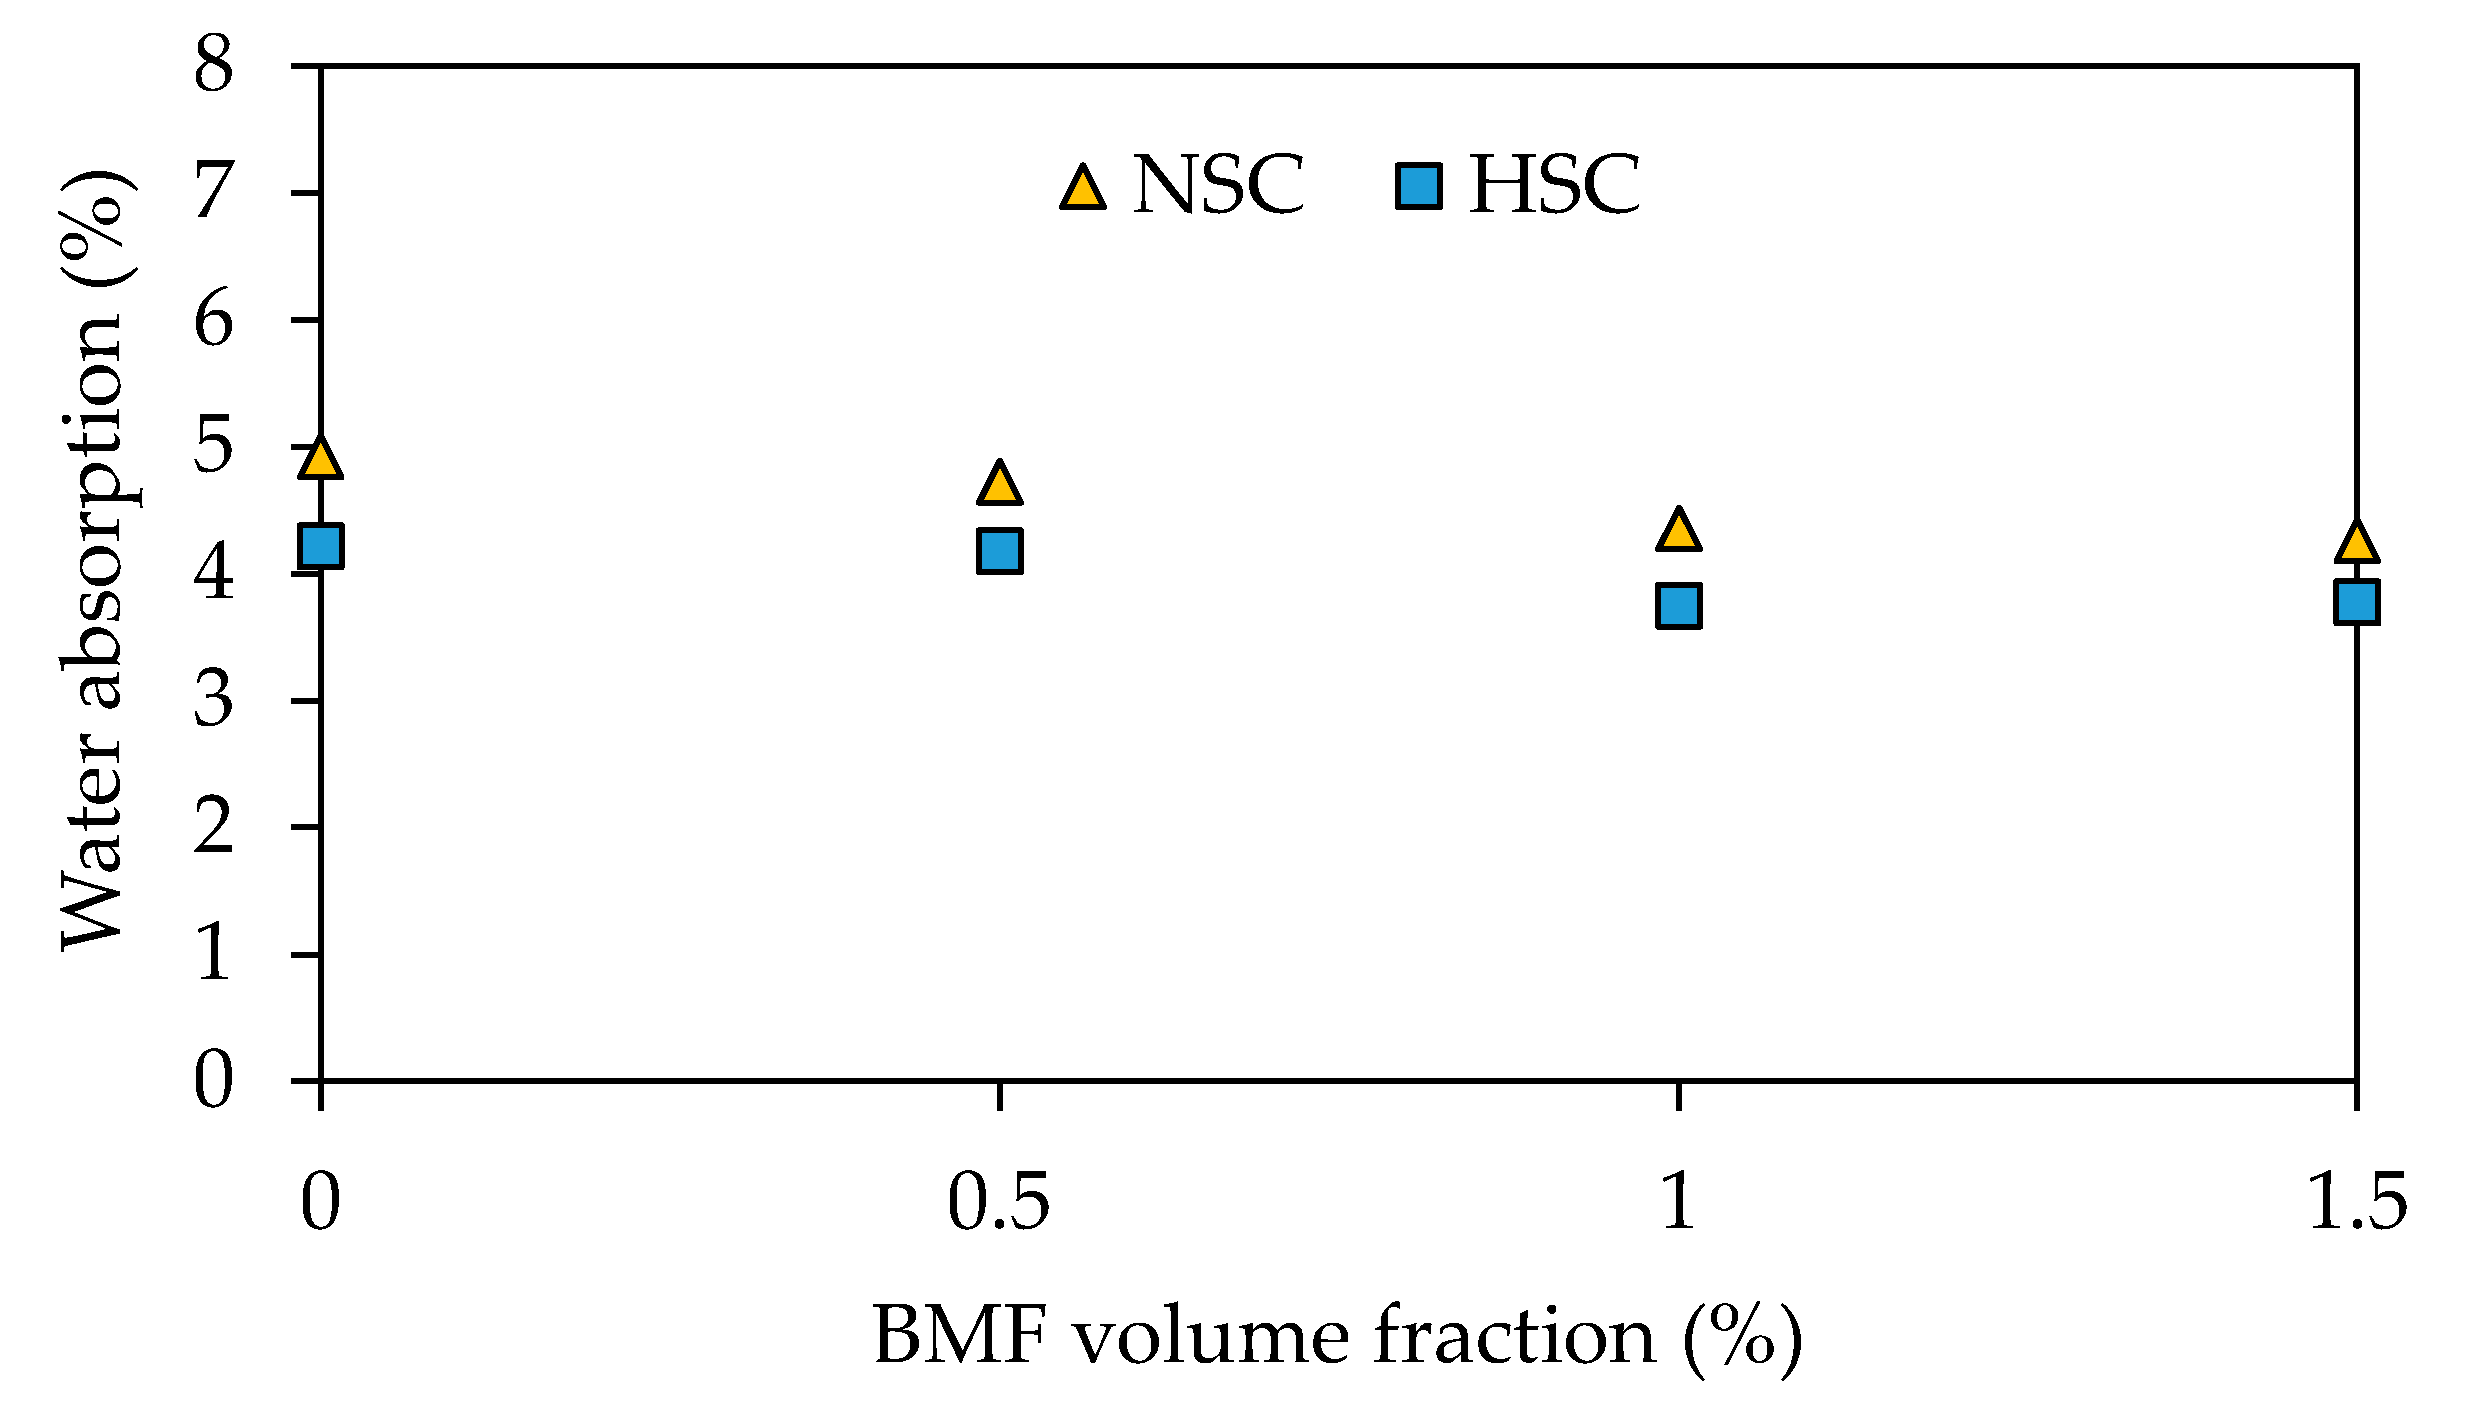
4.3.1. Water Absorption
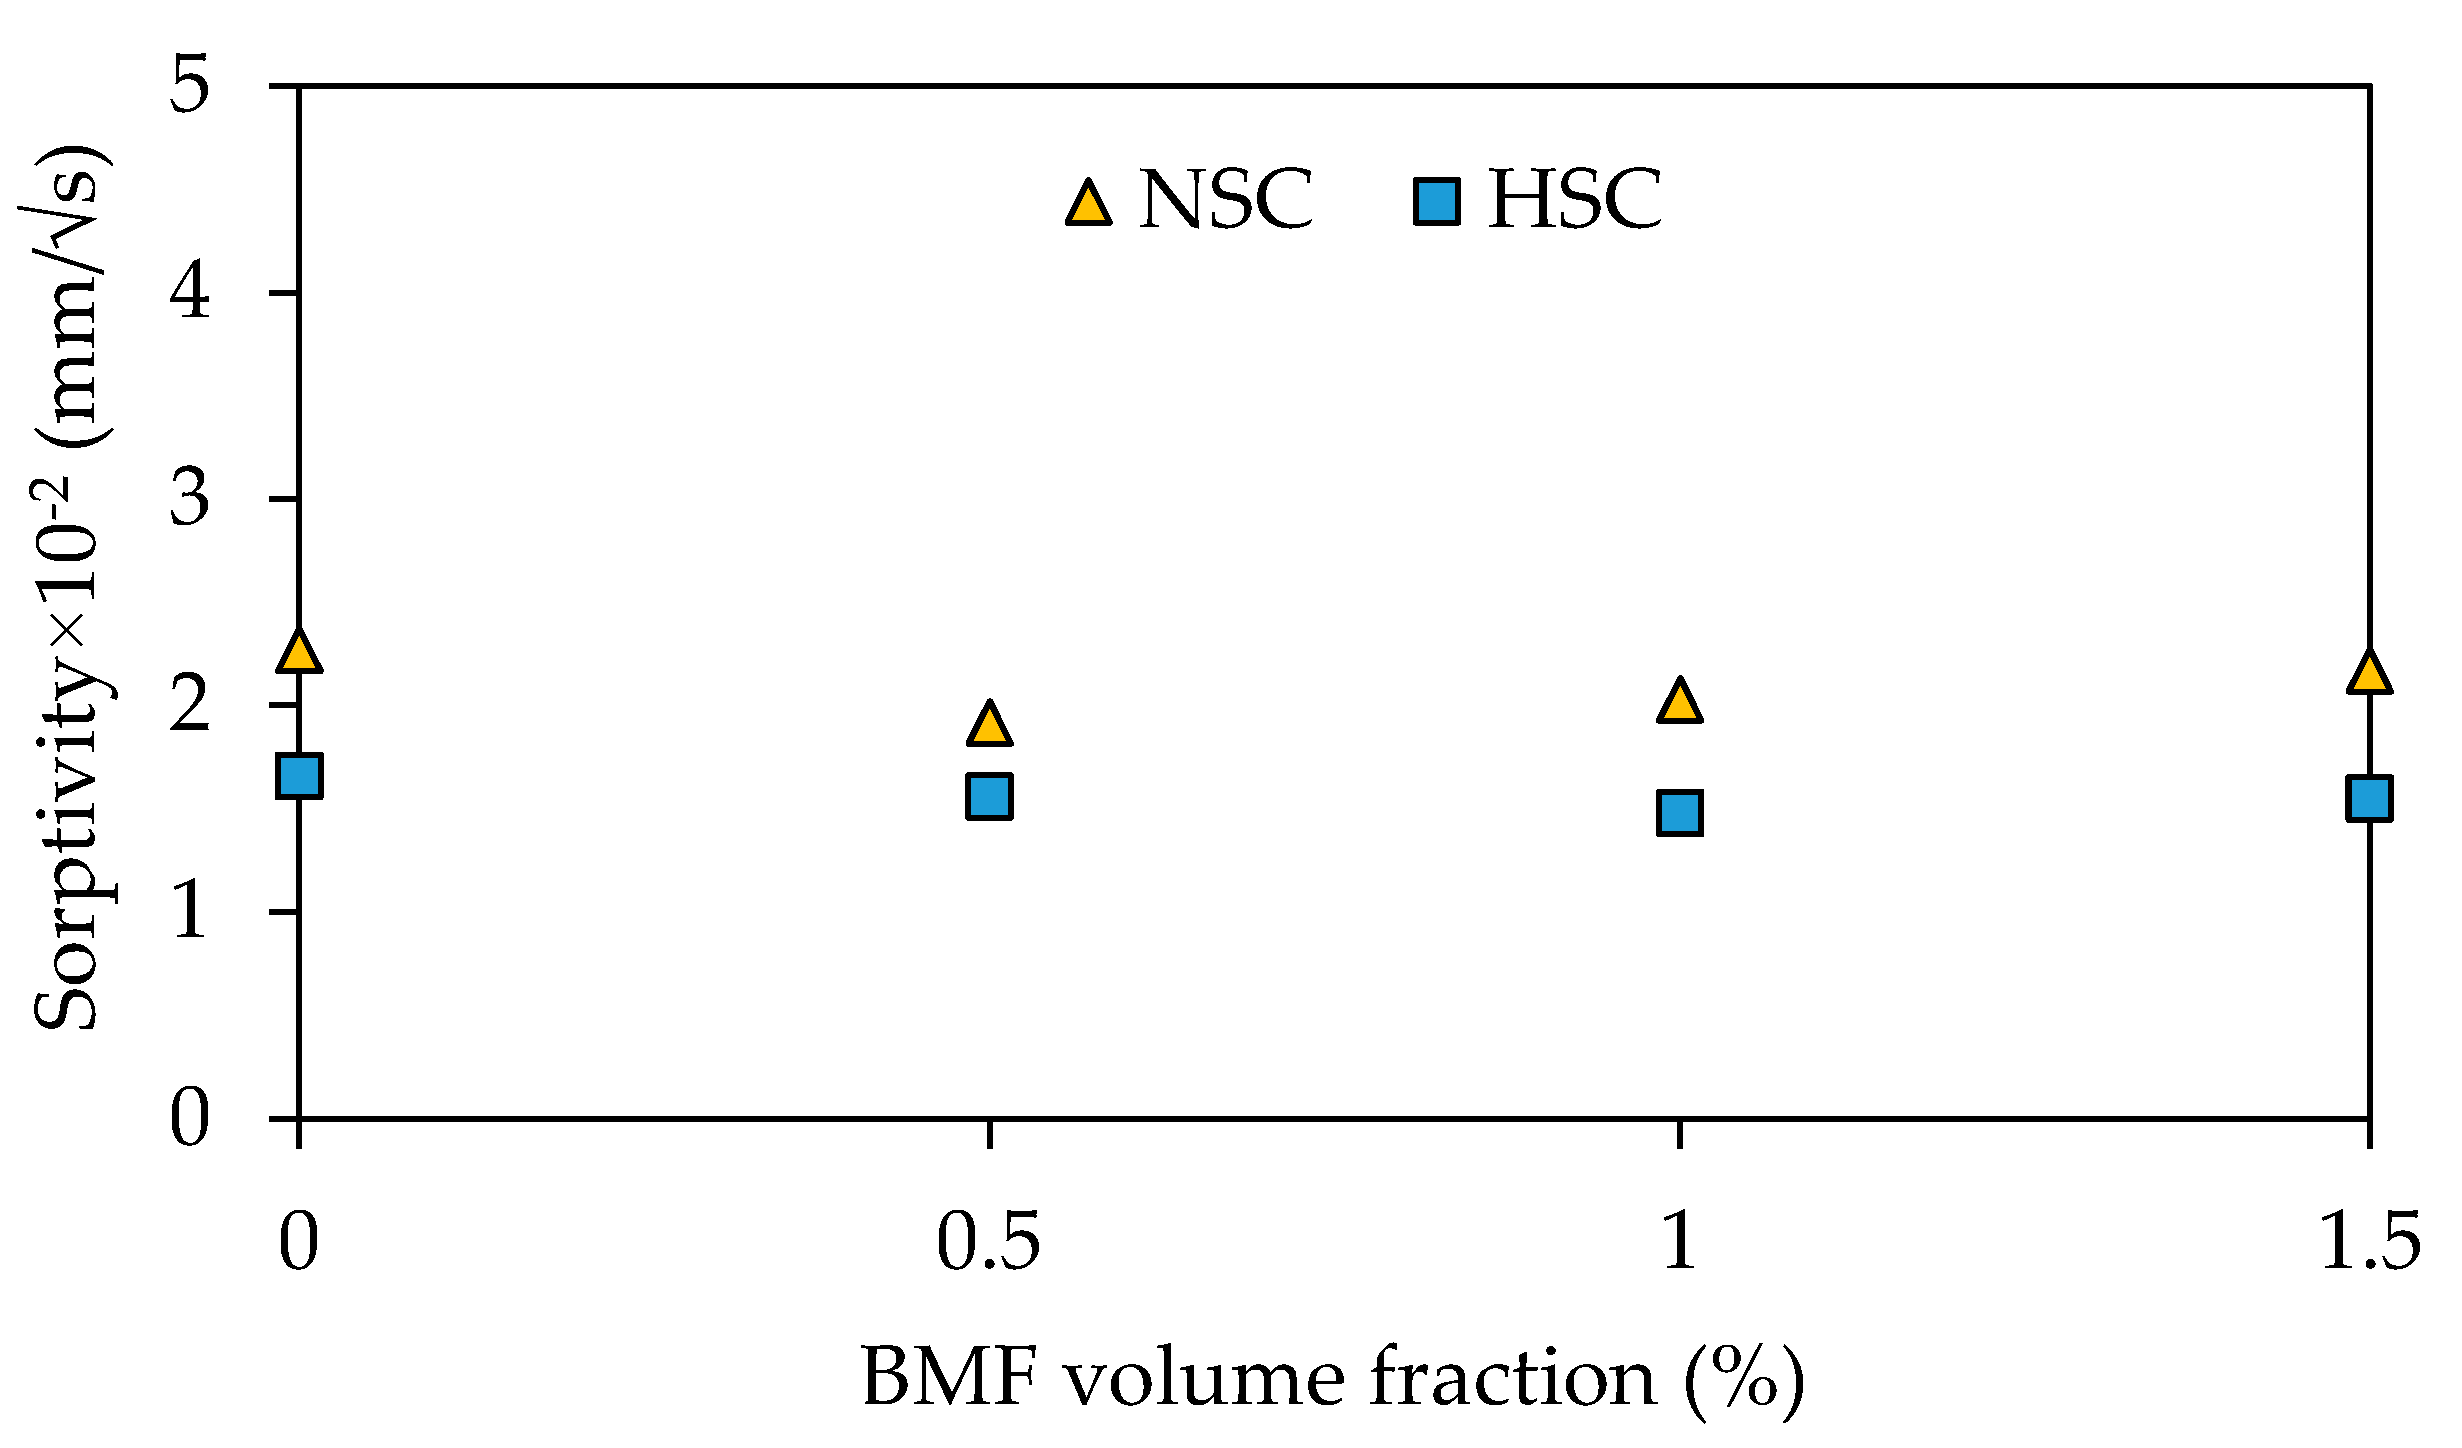
Results of the water absorption are depicted in Figure 15 and summarized in Table 9. The water absorption values of NSC and HSC benchmark specimens were 4.93 and 4.22%, respectively. The water absorption tended to decrease with an increase in the BMF volume fraction up to νf of 1.0%, where 12 and 11% reductions were recorded for both NSC and HSC mixtures. Further increase in the BMF volume fraction resulted in no or insignificant additional reduction in the water absorption. The presence of BMF may have blocked some routes inside the concrete thus slowing migration of water. The authors did not observe any difference in the physical appearance of the concrete samples with and without BMF after conducting the water absorption test.

4.3.2. Sorptivity

The sorptivity values of NSC and HSC specimens at different BMF volume fractions are depicted in Figure 16 and listed in Table 9. The sorptivity values of NSC and HSC benchmark specimens were 2.27 × 10⁻² and 1.66 × 10⁻² (mm/ s ), respectively. Similar to the trend of the water absorption test results, the sorptivity values decreased with an increase in the BMF volume fraction up to a certain limit, after which no further reduction in the sorptivity was recorded. A maximum sorptivity reduction of 15% was recorded for the NSC at νf of 0.5%, whereas the HSC exhibited a maximum sorptivity reduction of 11% at νf of 1.0%. Further increase in the BMF volume fraction did not result in an additional reduction in the sorptivity. It should be noted that sorptivity values of the concrete mixtures, particularly those reinforced with BMF, are intrinsically too small to provide conclusive results.

4.3.3. Abrasion Resistance

Table 10 provides values of the abrasion mass loss, bulk resistivity, and RCPT test results. The NSC and HSC benchmark specimens without BMF exhibited abrasion mass losses of 14.2 and 8.3%, respectively. Generally, the addition of BMF to concrete mixtures helped to maintain the structural integrity of the concrete due to an increase in stiffness of the cementitious matrix. The addition of BMF to the NSC mixtures significantly reduced the mass loss caused by abrasion, indicating an improved abrasion resistance. At νf of 0.5%, the mass loss of the NSC caused by abrasion reduced by 17%. The percent reduction in the mass loss due to the addition of BMF to NSC mixtures continued to increase almost linearly with an increase in the BMF volume fraction, as shown in Figure 17. At νf of 1.5%, a 27% reduction in the abrasion mass loss was recorded for the NSC. In contrast, the addition of BMF insignificantly reduced the abrasion mass loss of the HSC by a maximum of 4%. It seems that the cementitious matrix of the HSC was too strong to be affected by the addition of BMF. Photographs showing the appearance of typical specimens after the abrasion test are provided in Figure 18.

4.3.4. Bulk Resistivity

Results of the bulk resistivity test are listed in Table 10 and depicted in Figure 19. The bulk resistivity values of NSC and HSC benchmark specimens without BMF were 6.8 and 7.4 kΩ·cm, respectively. The bulk resistivity of both NSC and HSC increased almost linearly with an increase in the BMF volume fraction. Maximum improvements of 21 and 18% in the bulk resistivity were recorded at νf of 1.5% for the NSC and HSC, respectively. Despite the improvement in the bulk resistivity of the concrete reinforced with BMF, values of all mixtures corresponded to the “Low to Moderate Corrosion Protection” category [50].

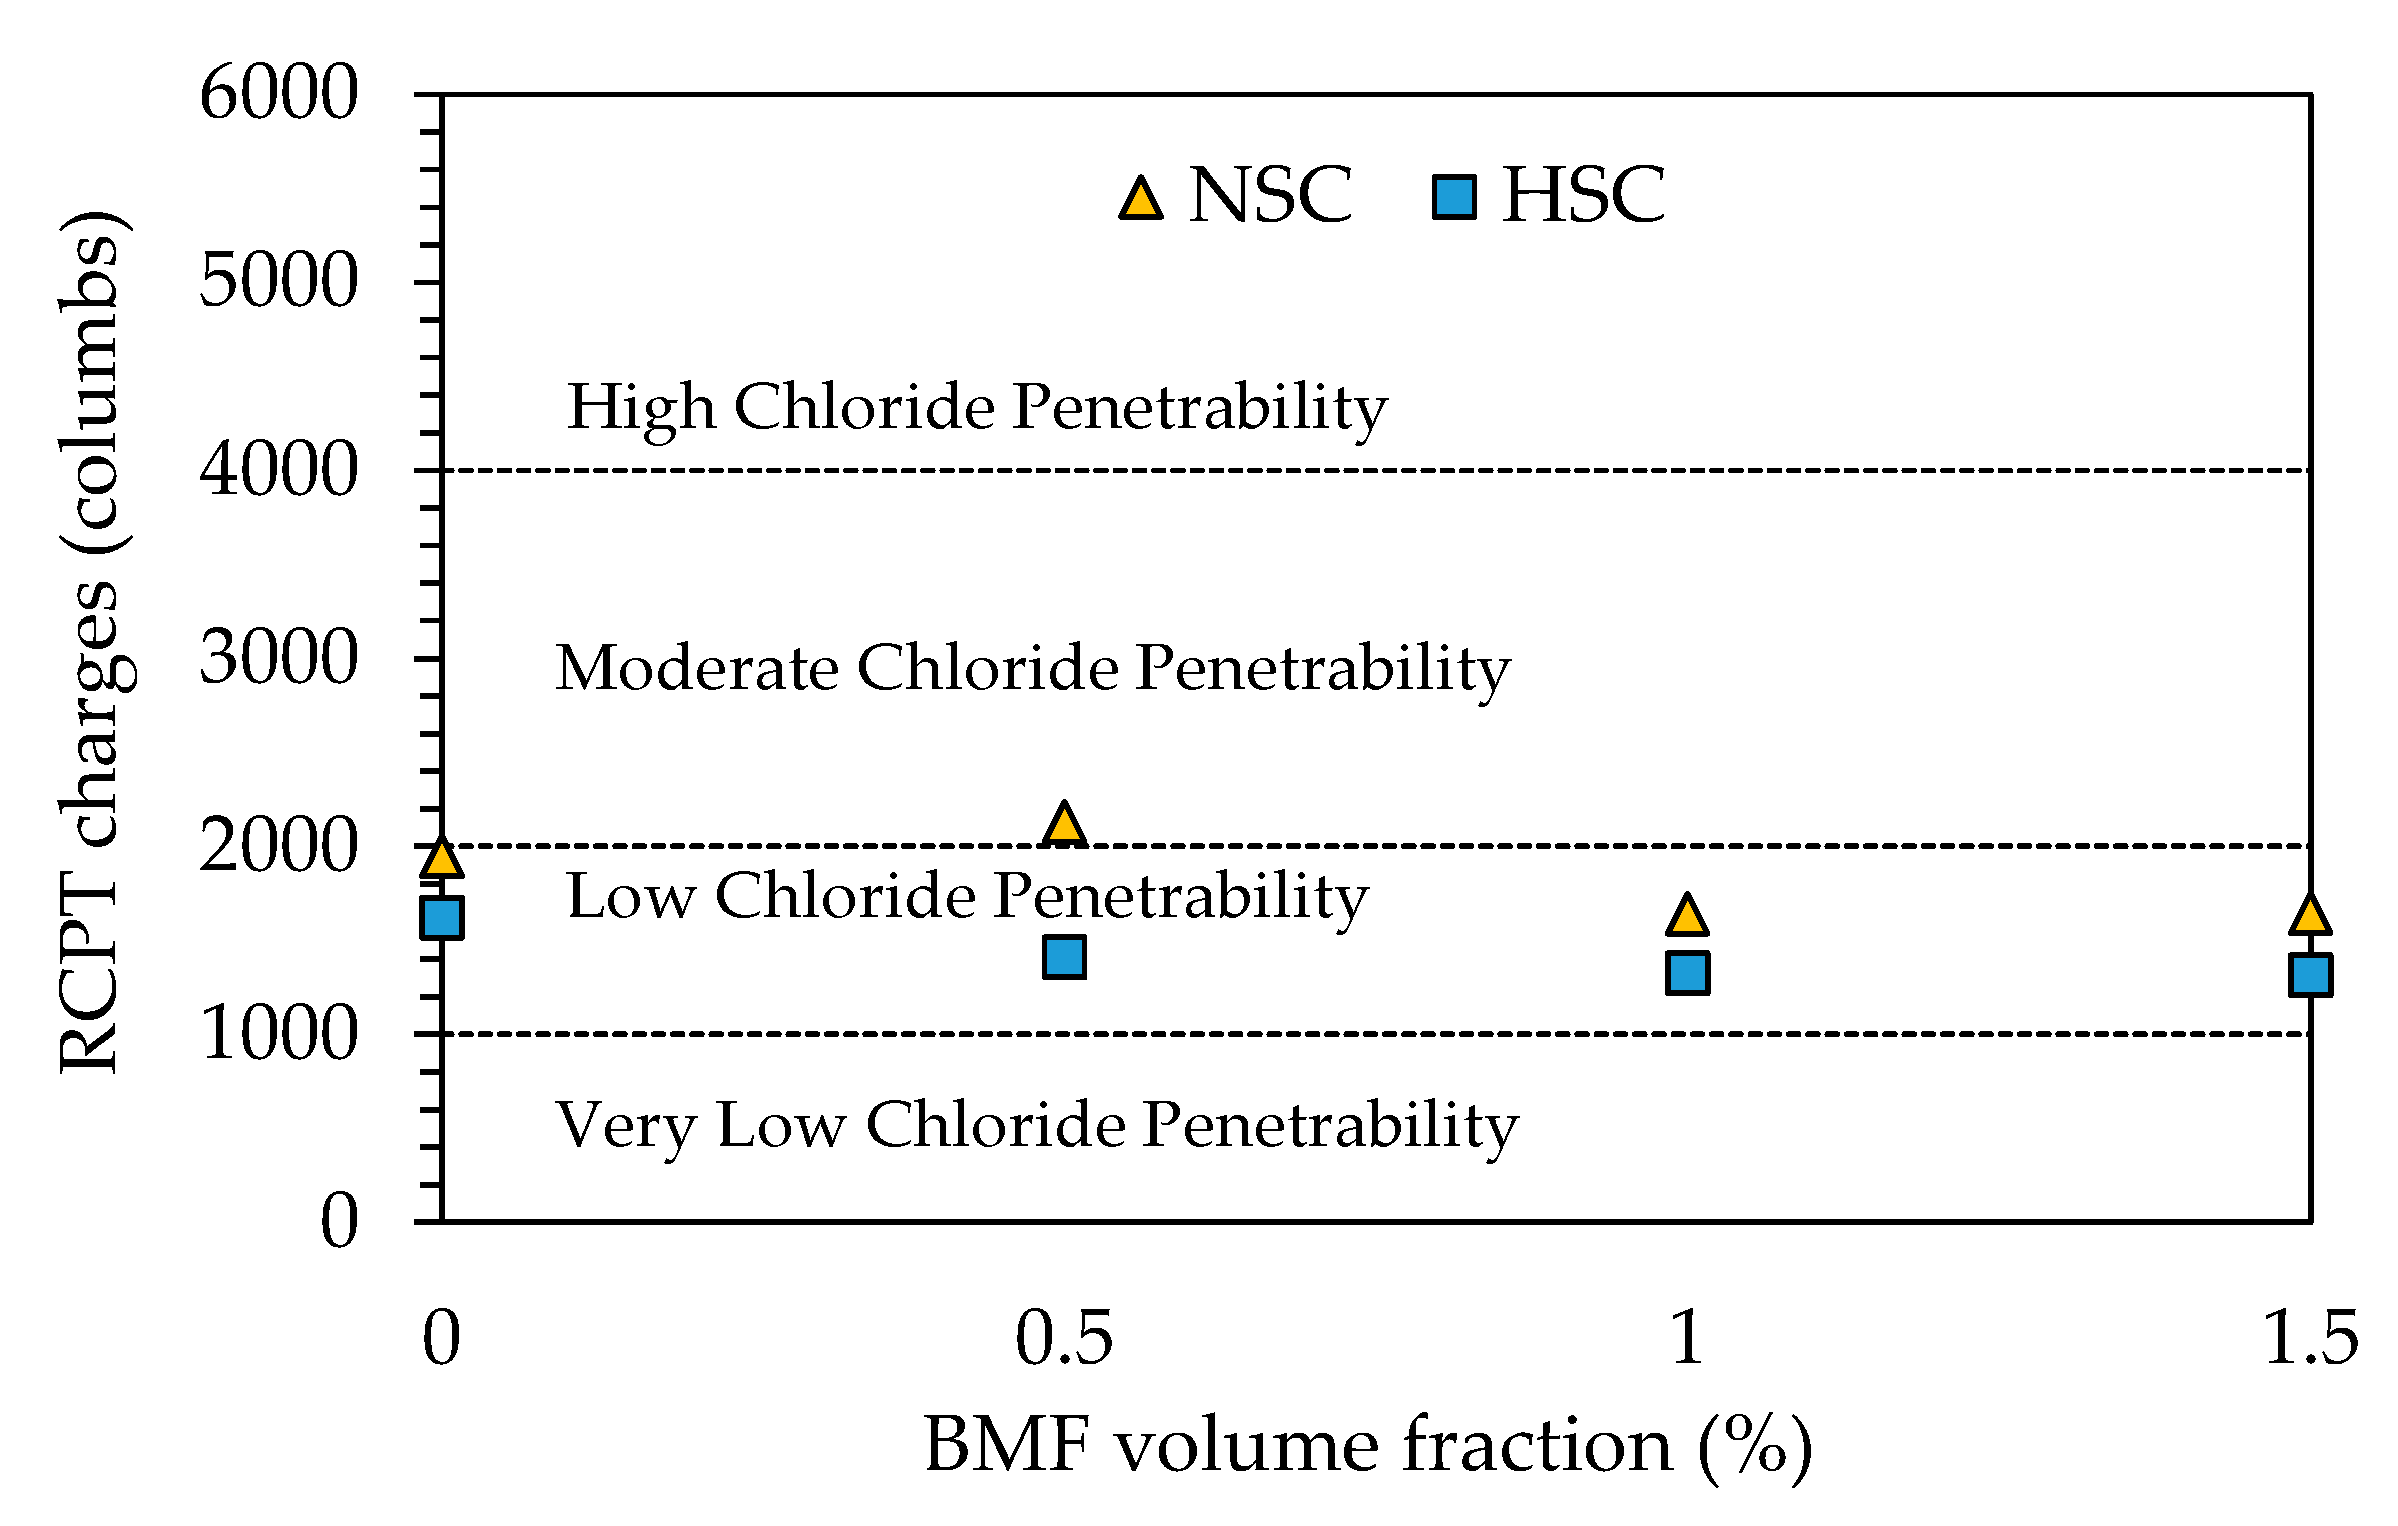
4.3.5. Rapid Chloride Penetration

Rapid chloride penetration (RCPT) test results are listed in Table 10 and depicted in Figure 20. The RCPT electrical charges passed through the NSC and HSC benchmark specimens were 1949 and 1621 coulombs (C), respectively. The addition of BMF tended to reduce RCPT electrical charges passed through the concrete, indicating an improved resistance to chloride penetration. The RCPT electrical charges decreased almost linearly with an increase in the BMF volume fraction up to νf of 1.0%, after which no or insignificant additional reduction in the RCPT charges was observed. There was one anomaly result reported for the NSC at νf of 0.5%, where no reduction in the RCPT charges was recorded. Maximum reductions of 16 and 19% in the RCPT electrical charges were recorded at νf of 1.0 and 1.5% for the NSC and HSC, respectively. Despite the improved resistance to chloride penetration of the concrete reinforced with BMF, RCPT electrical charges of all mixtures, corresponded to the “Low Chloride Penetrability” category, except that of NSC-BMF0.5, which indicated a “Moderate Chloride Penetrability” [46]. The reduced RCPT electrical charges passing through the concrete mixtures with BMF is consistent with their reduced water absorption test results. The improvement in the water-tightness and chloride penetration resistance could be due to blocking of some routes inside the concrete by the BMF, which might have reduced the rate of water and chloride migration through the concrete.

4.3.6. Ultrasonic Pulse Velocity

The ultrasonic pulse velocity tests can indirectly assess the quality of the concrete. A higher UPV value indicates a denser concrete, whereas a lower UPV value indicates a presence of voids in the concrete [48]. Figure 21 demonstrates the relationship between UPV value of the concrete and the BMF volume fractions. The UPV values for the NSC and HSC benchmark specimens were insignificantly different at values of 5149 and 5079 m/s, respectively, indicating an “Excellent Quality Concrete” [51]. The difference between the UPV values of the NSC and HSC benchmark specimens was only 1%, indicating no effect for varying the concrete grade considered in the current study on the concrete quality/uniformity. The addition of BMF had almost no effect on UPV values. This behavior can be ascribed to the initial excellent quality of the concrete, which did not leave room for an additional improvement. In other words, it seems that the NSC and HSC benchmark mixtures s were too dense to show an effect for the addition of BMF on the UPV values. The UPV values of all concrete mixtures were still in the “Excellent Quality Concrete” category.

5. Discussion

One of the drawbacks of using BMF observed in the current study was a reduction in concrete workability, regardless of the concrete grade. Such a reduction in workability was consistent with other findings reported by Jalasutram et al. [17], where the addition of BF at νf of 1.5% decreased the slump of NSC (f’c = 30 MPa) from 75 mm to zero. Likewise, Biradar et al. [8] recorded up to a 64% reduction in the slump of NSC (fcu = 44 MPa) due to the addition of BF at νf of 0.5%. Similarly, Elshazli et al. [4] reported a decrease of 8–25% in the slump of NSC (f’c = 47 MPa) due to the addition of BF at νf of 0.15–0.5%.
The compressive strength of the NSC with BMF tested in the current study exhibited a slight improvement of 1–5%. Likewise, Elshazli et al. [4] reported up to a 12% increase in the compressive strength of NSC (f’c = 47 MPa) due to the addition of BF at νf of 0.15–0.5%. Lee [18] also reported an improvement in the compressive strength of NSC (f’c = 37 MPa) in the range of 25–36% due to the addition of NF at νf of 0.06–0.12%. However, Branston et al. [20] noticed a significant reduction (up to 45%) in compressive strength of NSC (f’c = 38 MPa) due to the addition of 43-mm long basalt minibars at νf of 1%. Meyyappan and Carmichael [52] reported that the addition of BF at νf ≤ 1.5% improved the compressive strength of NSC (fcu = 32 MPa), whereas a compressive strength reduction of 16–34% was reported at νf values of 2–3%. The compressive strength of the HSC tested in the current study decreased by 6%, on average, due to the addition of BMF. Similarly, Kabay [53] reported 4–18% reductions in the compressive strength of HSC (f’c = 50 and 70 MPa), when BF were added at νf of 0.07–0.14% The reduction in the compressive strength was attributed to the bunching effect of the fibers and lack of bond between BF and the concrete constituents. Ayub et al. [16] reported, however, a minor improvement of up to 5% in the compressive strength of HSC (f’c = 74 MPa) due to the addition of BF at νf of 1–3%.
The splitting tensile strength of the NSC and HSC tested in the current study increased with an increase in the BMF volume fraction. This behavior is consistent with results reported by Katkhuda and Shatarat [12] for NSC (f’c = 23 MPa), where a gradual increase in fsp (up to 25%) was observed as the BF volume fraction varied between 0.1 and 1.5%. Although Arsalan [15] reported an improvement in fsp of NSC (f’c = 44 MPa) due to the addition of chopped-BF, the strength gain versus the BF volume fraction did not show a specific trend. The enhancements in fsp were 9, 7, 10, and 5% at BF volume fractions of 0.017, 0.024, 0.071, and 0.107%, respectively. Nevertheless, the presence of BF in the concrete restricted full separation of the tested specimens at failure, unlike the control specimens without fibers that split into two halves at failure. The prevention of full separation of the splitting tensile strength test specimens at failure due to the addition of fibers is consistent with observations of the current study. Jalasutram et al. [17] reported that the addition of BF to NSC (f’c = 30 MPa) at νf ≤ 1% improved fsp by up to 14%. Further increase in the BF volume fractions to 1.5 and 2% did not result in an additional improvement in fsp. Meyyappan and Carmichael [52] reported that the addition of BF to NSC (fcu = 32 MPa) at νf ≤ 1.5% enhanced fsp by 6–18%. Nevertheless, the addition of BF at higher νf values of 2–3% reduced fsp by 15–36%. Similarly, Wang et al. [11] reported 22–32% reductions in fsp of NSC (f’c = 33 MPa) due to the addition of BF at νf of 0.04–0.11%.
The improvement in the flexural strength exhibited by specimens of the current study due to the addition of BMF is consistent with findings reported by Branston et al. [20], where the addition of basalt minibars at νf of 1 and 2% increased the flexural strength of NSC (f’c = 38 MPa) by 52 and 128%, respectively. Likewise, the addition of chopped-BF at νf of 0.5–2% improved the flexural strength of NSC (f’c = 30 MPa) by 15–75% [17]. Arslan [15] noticed no specific trend in the relationship between the improvement in the flexural strength of NSC (f’c = 44 MPa) and the BF volume fraction, where flexural strength gains of 14, 12, 25, and 6% were recorded at BF volume fractions of 0.017, 0.024, 0.071, and 0.107%, respectively. Noushini et al. [14] reported that the addition of 12-mm PVA fibers enhanced the flexural strength of HSC (f’c = 60 MPa) by 20 and 11% at νf of 0.25 and 0.5%, respectively.
In the current study, the addition of BMF was effective in improving the bulk resistivity of NSC by 5–21% and HSC by 3–18%. The addition of the BMF had, however, no significant effect on the UPV values of both NSC and HSC. Lee [18] reported an increase of 7–11% in UPV values by the addition of NF at νf of 0.06–0.12%. Das et al. [21] noticed an insignificant reduction in UPV values of NSC (fcu = 37 MPa) with the addition of PPF. In the current study, the addition of BMF reduced the RCPT electrical charge passing through the NSC and HSC by 9–16 and 13–19%, respectively. Similarly, Lee [18] reported that the inclusion of NF at νf of 0.06–0.12% reduced the total charge passing through the concrete by up to 26%.
The concrete grade of the specimens tested in the current study influenced the performance of the mixtures with BMF. Results of the current study indicated that the addition of BMF insignificantly increased the compressive strength of the NSC by up to 5% but tended to decrease that of the HSC by up to 10%. The detrimental effect of the BF on the compressive strength of HSC mixtures (f’c = 50 and 70 MPa) reported by Kabay [53] was also dependent on the concrete grade. Mixtures with the initial compressive strength of 50 MPa exhibited 4–9% reductions in the compressive strength due to the addition of BF at νf of 0.07–0.14%. The strength reduction caused by the addition of BF was more significant (8–18%) for the mixtures with the initial strength of 70 MPa. The improvement in the tensile properties of the concrete mixtures of the current study caused by the addition of BMF was less pronounced for the HSC. This outcome is constant with that reported by Kabay [53], where flexural strength gains of 6–16% and 4–10% were reported for the concrete mixtures with f’c of 50 and 70 MPa, respectively. The water absorption of NSC and HSC specimens with BMF was insignificantly different, but slightly lower than that of the plain specimens (a maximum average reduction of 12% was record at νf of 1%). Similarly, Kabay [53] reported 4–7% reductions in the water absorption of concrete mixtures with BF at f’c of 50 MPa. Kabay [53] reported, however, no reduction in the water absorption of the BF-reinforced concrete mixtures at f’c of 70 MPa. The abrasion mass loss of the NSC tested in the current investigation decreased by up to 27% due to the addition of BMF, indicating an improvement in the abrasion resistance. The HSC with BMF exhibited, however, an insignificant improvement in the abrasion resistance, where only 4% reduction in the abrasion mass loss was recorded. These findings are consistent with those reported by Kabay [53], where the addition of BF reduced the abrasion mass loss of the concrete mixtures with f’c of 50 MPa by 18%, whereas those with f’c of 70 MPa exhibited a minor reduction in the abrasion mass loss of 4% due to the addition of fibers.

6. Development of Tension Function

6.1. Overview

The concrete mixtures reinforced with BMF exhibited improved tensile properties and post-cracking behavior than those of their plain counterparts. Development of a tensile softening law (i.e., tension function) that can reflect the improvement in the tensile strength and post-cracking behavior of the concrete caused by the addition of BMF is crucial for accurate analysis and design of structures made of such a concrete. The tension function of the concrete reinforced with BMF can be developed through an inverse numerical analysis of flexural data of the tested concrete prisms. This process necessitates establishment of a numerical FE model for the tested concrete prisms, implementation of an assumed tension function in the FE analysis, calibration, and iterations to validate the accuracy of the proposed tension function. Details of the numerical modeling, inverse analysis, tension function, and model’s validation are presented hereafter.

6.2. Numerical Simulation Model

Three-dimensional (3D) FE models of the prisms tested under four-point bending were developed using ATENA software [54]. Half of the concrete prism was modeled to obtain the advantage of the specimen symmetry and reduce the processing time. The concrete was modeled as 3D macro-elements with a mesh size of 15 mm. The effects of the addition of the BMF on the properties of the concrete were considered through the use of the characterization test results along with the tensile softening laws developed in the current study as input data in the numerical analysis. Support and load steel plates were used to avoid concentration of stresses at these locations. The support steel plate was restricted from movement in the transverse and vertical directions. The surface at the plane of symmetry was restricted from movement in the longitudinal direction through surface supports. Prescribed displacements were applied at the middle of the top steel plate. The corresponding load at the middle of the top steel plate and the midspan deflection were recorded using monitoring points. Figure 22a shows the geometry and boundary conditions of a typical FE model, whereas Figure 22b shows the locations of the monitoring points.

6.3. Tension Functions

ATENA software [54] is equipped with a concrete user-defined model, which can be used to define a specific tensile softening law of an unconventional concrete such as that reinforced with BMF. A trilinear tensile softening law was assumed for the concrete mixtures reinforced with BMF since different fibers may activate at different crack openings [22]. The first steeper branch of the post-cracking law was assumed constant for all concrete mixtures with BMF, irrespective of the fiber volume fraction. This assumption is consistent with that adopted previously by other researchers for concrete mixtures reinforced with steel fibers, since the first branch mainly simulates the bridging of the concrete matrix between early microcracks [22,55]. The slopes of following two branches were dependent on the fiber volume fraction to simulate possible activation of different fibers at different crack openings [22]. The inverse analysis started by assuming specific breaking points that characterized the trilinear tensile softening relationship employed in the FE model. The numerical load-deflection response of the prismatic concrete specimen was then obtained from the FE analysis and compared to that obtained from the experiment. Several iterations were performed using different breaking points until the difference between the numerical and experimental load-deflection curves was minimized. The tensile softening laws obtained from the inverse analysis at different BMF volume fractions are depicted in Figure 23a, noting that the y-axis represents the normalized tensile stress. The value of the uniaxial tensile strength, ft, was taken as 0.44fr [56]. The laws for the NSC and HSC considering the calculated uniaxial tensile stress, ft, based on measured values of fr are shown in Figure 23b,c, respectively. At the onset of cracking, the tensile stress drops linearly until the stress reaches a value that corresponds to 0.5ft. Following the first drop in stress, the tensile stress continued to decrease but at lower rates that were dependent on the fiber volume fraction. Figure 24 and Figure 25 show the experimental load-deflection response of the tested specimens along with that predicted numerically for the NSC and HSC, respectively. The experimental load-deflection response of some of the replicate specimens were not captured due to a glitch that occurred during testing. The load-deflection responses of the concrete prisms predicted numerically were, generally, in good agreement with those obtained from the experiments. A comparison between the experimental and numerical results is provided in Table 11. The predicted load capacity and flexural toughness were within 15 and 20% error bands, respectively, except for HSC-BMF0.5, which had a deviation of 30% in its predicted flexural toughness. The variation between the experimental and predicted results is on average 13.33% for the load capacity and 13.71% for the flexural toughness, indicating a good agreement, which verifies the validity of the tensile softening laws proposed in the current study.

7. Conclusions

The effect of the inclusion of BMF at different volume fractions on the fresh, mechanical, and durability characteristics of NSC and HSC was investigated. The primary benefit of using BMF in concrete mixtures was improving the tensile properties and impeding growth and propagation of cracks in the post-cracking stage. The impact of the addition of BMF on the UPV, water/chloride penetrability, and compressive strength was less evident. The reduced workability of the concrete having BMF is a drawback that has been verified in the current study. Future research should focus on studying the shear behavior of concrete beams reinforced with BMF. The viability of using BMF to improve the performance of concrete made with recycled concrete aggregates is another topic that warrants further research. Based on the test results, the following conclusions can be derived:
  • The addition of BMF reduced the concrete workability. Normal- and high-strength concrete mixtures having a similar initial slump exhibited a similar degradation in the workability due to the addition of BMF. At νf of 1.5%, the concrete workability category dropped from high/medium to low/very low.
  • The addition of BMF insignificantly improved the compressive strength of the NSC by 1–5%. However, average reductions in the cube and cylinder compressive strengths of 4 and 8%, respectively, were recorded for the HSC reinforced with BMF. The addition of BMF did not result in a noticeable change in the value of f’c/fcu nor the modulus of elasticity of the concrete.
  • The improvement in the tensile properties caused by the addition of BMF was more significant for the NSC rather than the HSC. Splitting tensile strength gains of 10, 24, and 52% were recorded for the NSC mixtures at νf of 0.5, 1.0, and 1.5, respectively. Their HSC counterparts exhibited respective splitting tensile strength gains of 3, 10, and 22%.
  • The addition of BMF to NSC at νf of 0.5 and 1.0% increased the flexural strength by 18 and 24%, respectively, whereas a significant strength gain of 56% was recorded at the higher νf of 1.5%. The flexural strength of the HSC was improved by the addition of BMF but to a lesser extent, where flexural strength gains of 14, 19, and 25% were recorded at νf of 0.5, 1.0, and 1.5%, respectively.
  • The increase in the flexural toughness due to increasing the BMF volume fraction from 0.5 to 1% was almost the same (approx. 39%) for the NSC and HSC mixtures. The NSC mixtures exhibited, however, a more pronounced improvement in the flexural toughness (136%) than that of the HSC (73%), when the BMF volume fraction increased from 0.5 to 1.5%.
  • The NSC and HSC with BMF exhibited a comparable reduction in the water absorption of up 12% relative to that of their plain counterparts. The addition of BMF did not change the level of corrosion protection nor the chloride penetrability category of both NSC and HSC mixtures, despite the slight improvement in the bulk resistivity (max. increase of 21%) and the slightly reduced RCPT electrical charges passed through the concrete (max. reduction of 19%). Similarly, the addition of BMF had almost no effect on UPV values of both NSC and HSC.
  • The NSC and HSC benchmark specimens exhibited abrasion mass losses of 14.2 and 8.3%, respectively. The addition of BMF to the NSC mixtures reduced the mass loss caused by abrasion by up to 27%. The HSC with BMF exhibited a minor reduction in the abrasion mass loss of up to 4% only.
  • New trilinear tensile softening laws that characterize the post-cracking behavior of NSC and HSC reinforced with different BMF volume fractions were established based on an inverse analysis of the flexural test data. A comparison between the load-deflection responses predicted numerically and those obtained from the experiments verified the validity of the tensile softening laws developed in the current study.

Author Contributions

Conceptualization, T.E.-M., H.E.-H. and S.S.; methodology, T.E.-M., H.E.-H. and S.S.; software, S.S. and T.E.-M., validation, S.S. and T.E.-M.; formal analysis, S.S., T.E.-M. and H.E.-H.; investigation, S.S., T.E.-M. and H.E.-H.; resources, T.E.-M. and H.E.-H.; data curation, S.S.; writing—original draft preparation, S.S.; writing—review and editing, T.E.-M., H.E.-H., B.E.-A., S.S. and M.A.; visualization, S.S.; supervision, T.E.-M., H.E.-H. and B.E.-A.; project administration, T.E.-M.; funding acquisition, T.E.-M. All authors have read and agreed to the published version of the manuscript.

Funding

This project is supported jointly by the Ministry of Energy and Infrastructure at UAE [grant number 21R083] and the Emirates Center for Mobility Research at the United Arab Emirates University (UAEU) [grant number 12N004].

Institutional Review Board Statement

Not applicable.

Informed Consent Statement

Not applicable.

Data Availability Statement

The data presented in this study are available on request from the corresponding author. The data are not publicly available due to privacy issues.

Conflicts of Interest

The authors declare no conflict of interest.

References

  1. Liu, J.; Jia, Y.; Wang, J. Experimental Study on Mechanical and Durability Properties of Glass and Polypropylene Fiber Reinforced Concrete. Fibers Polym. 2019, 20, 1900–1908. [Google Scholar] [CrossRef]
  2. Song, P.; Hwang, S.; Sheu, B. Strength Properties of Nylon- and Polypropylene-Fiber-Reinforced Concretes. Cem. Concr. Res. 2005, 35, 1546–1550. [Google Scholar] [CrossRef]
  3. Yao, Z.; Li, X.; Fu, C.; Xue, W. Mechanical Properties of Polypropylene Macrofiber-Reinforced Concrete. Adv. Mater. Sci. Eng. 2019, 2019, e7590214. [Google Scholar] [CrossRef]
  4. Elshazli, M.T.; Ramirez, K.; Ibrahim, A.; Badran, M. Mechanical, Durability and Corrosion Properties of Basalt Fiber Concrete. Fibers 2022, 10, 10. [Google Scholar] [CrossRef]
  5. Gao, J.; Sun, W.; Morino, K. Mechanical Properties of Steel Fiber-Reinforced, High-Strength, Lightweight Concrete. Cem. Concr. Compos. 1997, 19, 307–313. [Google Scholar] [CrossRef]
  6. Zheng, Y.; Wu, X.; He, G.; Shang, Q.; Xu, J.; Sun, Y. Mechanical Properties of Steel Fiber-Reinforced Concrete by Vibratory Mixing Technology. Adv. Mat. Sci. Eng. 2018, 2018, 9025715. [Google Scholar] [CrossRef]
  7. Abbass, W.; Khan, M.I.; Mourad, S. Evaluation of Mechanical Properties of Steel Fiber Reinforced Concrete with Different Strengths of Concrete. Constr. Build. Mater. 2018, 168, 556–569. [Google Scholar] [CrossRef]
  8. Biradar, S.V.; Dileep, M.S.; Gowri, D.T.V. Studies of Concrete Mechanical Properties with Basalt Fibers. IOP Conf. Ser. Mater. Sci. Eng. 2020, 1006, 012031. [Google Scholar] [CrossRef]
  9. Granju, J.-L.; Ullah Balouch, S. Corrosion of Steel Fibre Reinforced Concrete from the Cracks. Cem. Concr. Res. 2005, 35, 572–577. [Google Scholar] [CrossRef]
  10. Balouch, S.U.; Forth, J.P.; Granju, J.-L. Surface Corrosion of Steel Fibre Reinforced Concrete. Cem. Concr. Res. 2010, 40, 410–414. [Google Scholar] [CrossRef]
  11. Wang, Y.; Hughes, P.; Niu, H.; Fan, Y. A New Method to Improve the Properties of Recycled Aggregate Concrete: Composite Addition of Basalt Fiber and Nano-Silica. J. Clean. Prod. 2019, 236, 117602. [Google Scholar] [CrossRef]
  12. Katkhuda, H.; Shatarat, N. Improving the Mechanical Properties of Recycled Concrete Aggregate Using Chopped Basalt Fibers and Acid Treatment. Constr. Build. Mater. 2017, 140, 328–335. [Google Scholar] [CrossRef]
  13. Ali, B.; Qureshi, L.A.; Raza, A.; Nawaz, M.A.; Rehman, S.U.; Rashid, M.U. Influence of Glass Fibers on Mechanical Properties of Concrete with Recycled Coarse Aggregates. Civ. Eng. J. 2019, 5, 1007–1019. [Google Scholar] [CrossRef]
  14. Noushini, A.; Vessalas, K.; Samali, B. Static Mechanical Properties of Polyvinyl Alcohol Fibre Reinforced Concrete (PVA-FRC). Mag. Concr. Res. 2014, 66, 465–483. [Google Scholar] [CrossRef]
  15. Arslan, M.E. Effects of Basalt and Glass Chopped Fibers Addition on Fracture Energy and Mechanical Properties of Ordinary Concrete: CMOD Measurement. Constr. Build. Mater. 2016, 114, 383–391. [Google Scholar] [CrossRef]
  16. Ayub, T.; Shafiq, N.; Nuruddin, M.F. Effect of Chopped Basalt Fibers on the Mechanical Properties and Microstructure of High Performance Fiber Reinforced Concrete. Adv. Mater. Sci. Eng. 2014, 2014, 1–14. [Google Scholar] [CrossRef]
  17. Jalasutram, S.; Sahoo, D.R.; Matsagar, V. Experimental Investigation of the Mechanical Properties of Basalt Fiber-Reinforced Concrete. Struct. Concr. 2017, 18, 292–302. [Google Scholar] [CrossRef]
  18. Lee, S. Effect of Nylon Fiber Addition on the Performance of Recycled Aggregate Concrete. Appl. Sci. 2019, 9, 767. [Google Scholar] [CrossRef]
  19. Ali, B.; Qureshi, L.A. Influence of Glass Fibers on Mechanical and Durability Performance of Concrete with Recycled Aggregates. Constr. Build. Mater. 2019, 228, 116783. [Google Scholar] [CrossRef]
  20. Branston, J.; Das, S.; Kenno, S.Y.; Taylor, C. Mechanical Behaviour of Basalt Fibre Reinforced Concrete. Constr. Build. Mater. 2016, 124, 878–886. [Google Scholar] [CrossRef]
  21. Das, C.S.; Dey, T.; Dandapat, R.; Mukharjee, B.B.; Kumar, J. Performance Evaluation of Polypropylene Fibre Reinforced Recycled Aggregate Concrete. Constr. Build. Mater. 2018, 189, 649–659. [Google Scholar] [CrossRef]
  22. Sorelli, L.G.; Meda, A.; Plizzari, G.A. Bending and Uniaxial Tensile Tests on Concrete Reinforced with Hybrid Steel Fibers. J. Mater. Civ. Eng. 2005, 17, 519–527. [Google Scholar] [CrossRef]
  23. Yoo, D.-Y.; Kang, S.-T.; Yoon, Y.-S. Effect of Fiber Length and Placement Method on Flexural Behavior, Tension-Softening Curve, and Fiber Distribution Characteristics of UHPFRC. Constr. Build. Mater. 2014, 64, 67–81. [Google Scholar] [CrossRef]
  24. Amin, A.; Foster, S.J.; Muttoni, A. Evaluation of the Tensile Strength of SFRC as Derived from Inverse Analysis of Notched Bending Tests. In Proceedings of the 8th International Conference on Fracture Mechanics of Concrete and Concrete Structures, FraMCoS-8, Ciudad Real, Spain, 10–14 March 2013; University of Castilla-La Mancha: Ciudad Real, Spain, 2013; p. 9. [Google Scholar]
  25. Fédération Internationale du Béton. Fib Model Code for Concrete Structures; Ernst & Sohn: Lausanne, Switzerland, 2010. [Google Scholar]
  26. ASTM C150/C150M—19a; Standard Specification for Portland Cement. ASTM International: West Conshohocken, PA, USA, 2012.
  27. ASTM C127-15; Standard Test Method for Relative Density (Specific Gravity) and Absorption of Coarse Aggregate. ASTM International: West Conshohocken, PA, USA, 2015.
  28. ASTM C136/C136M-19; Test Method for Sieve Analysis of Fine and Coarse Aggregates. ASTM International: West Conshohocken, PA, USA, 2020.
  29. ASTM C88/C88M-18; Standard Test Method for Soundness of Aggregates by Use of Sodium Sulfate or Magnesium Sulfate. ASTM International: West Conshohocken, PA, USA, 2018.
  30. ASTM C131-06; Standard Test Method for Resistance to Degradation of Small-Size Coarse Aggregate by Abrasion and Impact in the Los Angeles Machine. ASTM International: West Conshohocken, PA, USA, 2006.
  31. ASTM C29/C29M-17a; Test Method for Bulk Density (Unit Weight) and Voids in Aggregate. ASTM International: West Conshohocken, PA, USA, 2017.
  32. ReforceTech AS, Røyken, Norway. Available online: https://reforcetech.com/ (accessed on 3 December 2020).
  33. ASTM C31/C31M; Standard Test Practice for Making and Curing Concrete Test Specimens in the Field—ELearning Course. ASTM International: West Conshohocken, PA, USA, 2010.
  34. ASTM C 143; Test Method for Slump of Hydraulic-Cement Concrete. ASTM International: West Conshohocken, PA, USA, 2012.
  35. BS EN 12350-4:2019; Testing Fresh Concrete. Degree of Compactability. British Standards: London, UK, 2019.
  36. BS EN 12350-3:2019; Testing Fresh Concrete. Vebe Test. British Standards: London, UK, 2019.
  37. BS EN 12390-3:2019; Testing Hardened Concrete. Compressive Strength of Test Specimens. British Standards: London, UK, 2019.
  38. ASTM C39; Test Method for Compressive Strength of Cylindrical Concrete Specimens. ASTM International: West Conshohocken, PA, USA, 2018.
  39. ASTM C469-02; Test Method for Static Modulus of Elasticity and Poissons Ratio of Concrete in Compression. ASTM International: West Conshohocken, PA, USA, 2014.
  40. ASTM C496/C496M-17; Test Method for Splitting Tensile Strength of Cylindrical Concrete Specimens. ASTM International: West Conshohocken, PA, USA, 2017.
  41. ASTM C1609/C1609M-19a; Test Method for Flexural Performance of Fiber-Reinforced Concrete (Using Beam With Third-Point Loading). ASTM International: West Conshohocken, PA, USA, 2010.
  42. ASTM C642-21; Standard Test Method for Density, Absorption, and Voids in Hardened Concrete. ASTM International: West Conshohocken, PA, USA, 2006.
  43. ASTM C1585-20; Standard Test Method for Measurement of Rate of Absorption of Water by Hydraulic-Cement Concretes. ASTM International: West Conshohocken, PA, USA, 2013.
  44. ASTM C1747/C1747M-13; Test Method for Determining Potential Resistance to Degradation of Pervious Concrete by Impact and Abrasion. ASTM International: West Conshohocken, PA, USA, 2013.
  45. ASTM C1760; Standard Test Method for Bulk Electrical Resistivity or Bulk Conductivity of Concrete. ASTM International: West Conshohocken, PA, USA, 2012.
  46. ASTM C1202-17; Standard Test Method for Electrical Indication of Concrete’s Ability to Resist Chloride Ion. ASTM International: West Conshohocken, PA, USA, 2017.
  47. ASTM C597; Standard Test Method for Pulse Velocity Through Concrete. ASTM International: West Conshohocken, PA, USA, 2016.
  48. Neville, A.M.; Brooks, J.J. Concrete Technology, 2nd ed.; Pearson: Essex, UK, 2010. [Google Scholar]
  49. ACI 211.3R-02 R09; Guide for Selecting Proportions for No-Slump Concrete. Americal Concrete Institute: Farmington Hills, MI, USA, 2009.
  50. ACI 222R 01. Protection of Metals in Concrete Against Corrosion. In ACI Manual for Concrete Practice; Americal Concrete Institute: Farmington Hills, MI, USA, 2008. [Google Scholar]
  51. Ratay, R.T. Structural Condition Assessment; Wiley: New Jersey, Canada, 2005. [Google Scholar]
  52. Meyyappan, P.L.; Jemimah Carmichael, M. Studies on Strength Properties of Basalt Fibre Reinforced Concrete. Mater. Today Proc. 2021, 43, 2105–2108. [Google Scholar] [CrossRef]
  53. Kabay, N. Abrasion Resistance and Fracture Energy of Concretes with Basalt Fiber. Constr. Build. Mater. 2014, 50, 95–101. [Google Scholar] [CrossRef]
  54. ATENA Computer Software, Cervenka Consulting s.r.o.: Prague, Czech Republic. Available online: https://www.cervenka.cz/products/atena/ (accessed on 21 June 2022).
  55. Kachouh, N.; El-Maaddawy, T.; El-Hassan, H.; El-Ariss, B. Numerical Modeling of Concrete Deep Beams Made with Recycled Aggregates and Steel Fibers. Buildings 2022, 12, 529. [Google Scholar] [CrossRef]
  56. Ashour, S.A.; Hasanain, G.S.; Wafa, F.F. Shear Behavior of High-Strength Fiber Reinforced Concrete Beams. Struct. J. 1992, 89, 176–184. [Google Scholar] [CrossRef]
Figure 1. Grain size analysis of cement and dune sand.
Buildings 12 01136 g001
Figure 2. Physical appearance of BMF.
Buildings 12 01136 g002
Figure 3. Typical mechanical tests in progress: (a) cube compression test; (b) cylinder compression test; (c) splitting tensile test.
Buildings 12 01136 g003
Figure 4. Four-point flexural test details: (a) a schematic diagram (dimensions are in mm); (b) a test in progress.
Buildings 12 01136 g004
Figure 5. Typical durability tests in progress: (a) bulk resistivity; (b) RCPT.
Buildings 12 01136 g005
Figure 6. Fresh concrete properties: (a) slump; (b) compacting factor; (c) vebe time.
Buildings 12 01136 g006
Figure 7. Development of cube compressive strength with time: (a) NSC; (b) HSC.
Buildings 12 01136 g007
Figure 8. Failure pattern of cube specimens tested in compression: (a) NSC-BMF0.0; (b) HSC-BMF0.0; (c) NSC-BMF0.5; (d) HSC-BMF0.5.
Buildings 12 01136 g008
Figure 9. Cylinder compressive strength (f’c) of NSC and HSC.
Buildings 12 01136 g009
Figure 10. Splitting tensile strength gain versus BMF volume fraction relationship.
Buildings 12 01136 g010
Figure 11. Failure mode of splitting tensile test specimens: (a) NSC-BMF0.0; (b) NSC-BMF0.5; (c) HSC-BMF0.0; (d) HSC-BMF0.5.
Buildings 12 01136 g011
Figure 12. Flexural strength gain versus BMF volume fraction relationship.
Buildings 12 01136 g012
Figure 13. Load-deflection response: (a) NSC; (b) HSC.
Buildings 12 01136 g013aBuildings 12 01136 g013b
Figure 14. Failure mode of NSC and HSC prismatic specimens: (a) NSC-BMF0.0; (b) NSC-BMF1.5; (c) HSC-BMF0.0; (d) HSC-BMF1.5.
Buildings 12 01136 g014aBuildings 12 01136 g014b
Figure 15. Water absorption versus BMF volume fraction relationship.
Buildings 12 01136 g015
Figure 16. Sorptivity versus BMF volume fraction relationship.
Buildings 12 01136 g016
Figure 17. Reduction in abrasion mass loss versus BMF volume fraction relationship.
Buildings 12 01136 g017
Figure 18. Appearance of specimens after the abrasion test: (a) NSC; (b) HSC.
Buildings 12 01136 g018
Figure 19. Bulk resistivity versus BMF volume fraction relationship.
Buildings 12 01136 g019
Figure 20. RCPT electrical charges versus BMF volume fraction relationship.
Buildings 12 01136 g020
Figure 21. Ultrasonic pulse velocity versus BMF volume fraction relationship.
Buildings 12 01136 g021
Figure 22. A typical FE model of a tested prismatic specimen: (a) geometry and boundary condition (dimensions are in mm); (b) monitoring points (dimensions are in mm).
Buildings 12 01136 g022
Figure 23. Tensile softening laws obtained from the inverse analysis: (a) normalized laws; (b) NSC; (c) HSC.
Buildings 12 01136 g023
Figure 24. Numerical versus experimental flexural response of NSC: (a) νf = 0.5%; (b) νf = 1.0%; (c) νf = 1.5%.
Buildings 12 01136 g024
Figure 25. Numerical versus experimental flexural response of HSC: (a) νf = 0.5%; (b) νf = 1.0%; (c) νf = 1.5%.
Buildings 12 01136 g025
Table 1. Test Matrix.
GroupMix IDBMF Volume Fraction
νf (%)
NSCNSC-BMF0.00.0
NSC-BMF0.50.5
NSC-BMF1.01.0
NSC-BMF1.51.5
HSCHSC-BMF0.00.0
HSC-BMF0.50.5
HSC-BMF1.01.0
HSC-BMF1.51.5
Table 2. Physical characteristics of coarse aggregates and dune sand.
PropertyUnitASTM StandardCADune Sand
Absorption%C127 [27]0.40-
Specific gravity-C127 [27]2.822.77
Fineness modulus-C136 [28]6.821.45
Surface areacm2/gC136 [28]2.49116.80
Soundness (MgSO4)%C88 [29]1.20-
Los Angeles abrasion%C131 [30]16.00-
Dry-rodded densitykg/m3C29 [31]1635.001663.00
Table 3. Physical and geometric characteristics of BMF data from [32].
PropertyValue
Length (mm)43.00
Diameter (mm)0.72
Length/diameter ratio60.00
Density (g/cm3)2.10
Elastic modulus (GPa)44.00
Tensile strength (MPa)900.00
ColorBlack
Table 4. Proportions of concrete mixtures.
GroupMix IDMass (kg/m3)
DSCACementWaterSPBMF
NSCNSC-BMF0.065910804702300.470.0
NSC-BMF0.565910804702300.4710.5
NSC-BMF1.065910804702300.4721
NSC-BMF1.565910804702300.4731.5
HSCHSC-BMF0.051310796172160.920.0
HSC-BMF0.551310796172160.9210.5
HSC-BMF1.051310796172160.9221
HSC-BMF1.551310796172160.9231.5
Table 5. Testing methods and specimen details.
CategoryPropertyTest StandardSpecimen TypeSpecimen
Dimension
No. of Replicates
FreshSlumpASTM C143 [34]--1
Compacting factorBS EN 12350-4:2019 [35]--1
Vebe timeBS EN 12350-3:2019 [36]--1
MechanicalCube compressive strengthBS EN 12390-3:2019 [37]Cube150 × 150 mm5
Cylinder compressive strengthASTM C39 [38]Cylinder150Φ × 300 mm5
Elastic modulusASTM C469 [39]Cylinder150Φ × 300 mm1
Splitting tensile strengthASTM C496 [40]Cylinder150Φ × 300 mm3
Flexural strengthASTM C1609 [41]Prism100 × 100 × 500 mm3
DurabilityWater absorptionASTM C642 [42]Disc100Φ × 50 mm3
SorptivityASTM C1585 [43]Disc100Φ × 50 mm1
Los Angeles abrasionASTM C 1747 [44]Disc100Φ × 50 mm3
Bulk resistivityASTM C1760 [45]Cylinder100Φ × 200 mm1
Rapid chloride penetrationASTM C1202 [46]Disc100Φ × 50 mm3
Ultrasonic pulse velocityASTM C597 [47]Cube150 × 150 mm1
Table 6. Workability test results of concrete mixtures.
GroupMix IDBMF (%)Slump (mm)Compacting FactorVebe Time (s)
NSCNSC-BMF0.00.02200.921.88
NSC-BMF 0.50.5850.903.35
NSC-BMF 1.01.0650.835.86
NSC-BMF 1.51.5500.797.05
HSCHSC-BMF 0.00.02150.902.92
HSC-BMF 0.50.51200.843.42
HSC-BMF 1.01.0600.823.97
HSC-BMF 1.51.5450.776.83
Table 7. Mechanical properties of concrete mixtures.
GroupMix IDBMF (%)fcu (MPa)f’c (MPa)f’c/fcuEc (GPa)fsp (MPa)fr (MPa)fsp/fr
NSCNSC-BMF0.00.040.0 (1.20)36.5 (1.73)0.9135.62.39 (0.17)3.82 (0.08)0.62
NSC-BMF0.50.540.5 (2.37)37.7 (1.69)0.9334.92.62 (0.19)4.52 (0.20)0.58
NSC-BMF1.01.042.1 (2.09)38.0 (0.68)0.9034.72.97 (0.15)4.75 (0.04)0.62
NSC-BMF1.51.541.3 (0.74)37.9 (1.58)0.9236.93.62 (0.04)5.96 (0.32)0.61
HSCHSC-BMF0.00.058.6 (0.81)53.6 (2.15)0.9141.93.62 (0.17)4.50 (0.60)0.80
HSC-BMF0.50.553.7 (0.58)48.3 (3.57)0.9040.73.73 (0.10)5.15 (0.14)0.73
HSC-BMF1.01.058.5 (0.92)49.9 (1.82)0.8542.03.99 (0.24)5.36 (1.02)0.74
HSC-BMF1.51.556.7 (0.96)49.5 (3.61)0.8736.64.43 (0.40)5.62 (0.16)0.79
Values between parentheses represent the standard deviation.
Table 8. Four-point flexural test results.
GroupMix IDPmax (kN)fr (MPa)𝛿p (mm)f600100 (MPa)f150100 (MPa)T150100 (J)
NSCNSC-BMF0.08.49 (0.18)3.82 (0.08)0.05 (0.00)---
NSC-BMF0.510.05 (0.44)4.52 (0.20)0.05 (0.00)2.87 (0.08)0.93 (0.30)14.07 (1.39)
NSC-BMF1.010.55 (0.08)4.75 (0.04)0.16 (0.01)3.64 (0.21)1.67 (0.03)19.38 (0.75)
NSC-BMF1.513.24 (0.71)5.96 (0.32)0.36 (0.06)5.73 (0.27)3.67 (0.41)33.15 (0.14)
HSCHSC-BMF0.09.99 (1.32)4.50 (0.60)0.11 (0.03)---
HSC-BMF0.511.45 (0.32)5.15 (0.14)0.11 (0.13)2.96 (0.34)0.95 (0.06)14.16 (0.40)
HSC-BMF1.011.90 (2.27)5.36 (1.02)0.13 (0.07)3.70 (1.45)1.57 (0.76)19.45 (7.71)
HSC-BMF1.512.49 (0.35)5.62 (0.16)0.38 (0.16)4.65 (1.96)2.23 (0.90)23.69 (3.26)
Values between parentheses represent the standard deviation.
Table 9. Water absorption and sorptivity test results.
GroupMixture IDBMF (%)Water Absorption (%)Sorptivity × 10−2 (mm/ s )
NSCNSC-BMF0.00.04.932.27
NSC-BMF0.50.54.731.92
NSC-BMF1.01.04.362.03
NSC-BMF1.51.54.272.17
HSCHSC-BMF0.00.04.221.66
HSC-BMF0.50.54.181.56
HSC-BMF1.01.03.751.48
HSC-BMF1.51.53.771.55
Table 10. Abrasion mass loss, bulk resistivity, and RCPT test results.
GroupMixture IDBMF (%)Abrasion Mass Loss (%)Bulk Resistivity (kΩ·cm)RCPT
(Columbus)
NSCNSC-BMF0.00.014.26.81949
NSC-BMF0.50.511.87.22134
NSC-BMF1.0111.27.61642
NSC-BMF1.51.510.48.21647
HSCHSC-MBF0.00.08.37.41621
HSC-MBF0.50.58.17.61413
HSC-MBF1.018.18.31327
HSC-MBF1.51.58.08.71314
Table 11. Comparison between experimental and numerical results.
Mixture IDLoad Capacity
(kN)
Toughness
(J)
Error 1
(%)
ExperimentalNumericalExperimentalNumericalLoad CapacityToughness
NSC-BMF0.510.0511.4714.0716.2214.1515.28
NSC-BMF1.010.5511.9019.3818.7612.823.19
NSC-BMF1.513.24 14.7233.1526.4211.1520.3
HSC-BMF0.511.45 13.1314.1618.4614.6630.39
HSC-BMF1.011.90 13.6419.4521.4214.6410.11
HSC-BMF1.512.49 14.0623.6924.4012.542.98
Average 13.3313.71
1   Error   ( % ) = | Experimental   -   Numerical | Experimental   ×   100 .
Publisher’s Note: MDPI stays neutral with regard to jurisdictional claims in published maps and institutional affiliations.

