Article

Estimating the Effect of Vibration Mixing Process on Air Pore Size Distributions in Concrete Using Digital Image Analysis

1
Key Laboratory of Highway Construction Technology and Equipment of Ministry of Education, School of Construction Machinery, Chang’an University, Xi’an 710064, China
2
Detong Intelligent Technology Co., Ltd., Xuchang 461000, China
*
Author to whom correspondence should be addressed.
Buildings 2022, 12(8), 1142; https://doi.org/10.3390/buildings12081142
Submission received: 7 June 2022 / Revised: 25 July 2022 / Accepted: 25 July 2022 / Published: 1 August 2022
(This article belongs to the Section Building Materials, and Repair & Renovation)

Abstract

:
Concrete is a typical porous material, in which the air voids entrained or entrapped during the mixing process have a significant impact on the material’s strength and durability. An automatic methodology based on digital image analysis was used to examine the influence of a novel mixing process with vibration on the entrapped air pore size and distribution of concrete in this paper. The volume of permeable spaces and porosity in hardened concrete are found to be greatly reduced when using the vibration mixing process compared to the reference concrete. Meanwhile, the quantity of air pores and their specific surface area are positively associated with the vibration acceleration, while the average equivalent pore diameter decreases. The findings of the analysis of variance (ANOVA) reveal that the population means for porosity, quantity, and pore size are significantly different when utilizing the vibration or non-vibration mixing processes. Furthermore, the pore size distribution curves show that the vibration mixing process significantly modified the pore structure by reducing the number of larger size pores and increasing the amount of small size pores. This may be attributed to a series of changes in the bubbles during the vibration mixing process. In addition, the findings of freeze-thaw resistance and water penetration resistance reveal that, owing to the vibration mixing process, the impermeability and durability of the concrete are significantly improved.

1. Introduction

Concrete is a multi-phase and heterogeneous material made up of several different components with numerous interfaces and internal defects. The major cause of the reduction in concrete strength and durability is thought to be the deleterious impacts of these interfaces and defects [1]. Many studies have been devoted to eliminating defects and improving the interface transition zone (ITZ) in order to improve concrete performance [2,3,4]. However, it appears that the complete elimination of the weak loops is impossible. Microcracks and pores are the first two defects when it comes to concrete flaws. Microcracks form during the hardening process as a result of the physical qualities of each component. Pores are generated by air and/or water occupying spaces or cavities. These irregular or regular geometrically shaped voids and pores are intricately distributed in the cement matrix to produce a complex three-dimensional network [5].
Pores are an unavoidable and necessary component of concrete, according to several studies [6,7]. On the one hand, the volume of cement hydration products is less than the total volume of cement and water before the hydration reaction. As a result, following condensation, a portion of pores will develop inside the concrete. On the other hand, for the consistency of concrete mixes, a larger amount of water is necessary, which is more than the amount of water that actually participates in the hydration reaction. Pores and cracks occur to give room for storing surplus water as well as for water supply routes for continuous cement hydration [8]. In addition, an air-entraining agent will be used to entrain a particular number of fine and unconnected air pores in the concrete to improve its freezing and thawing resistance [9,10].
In existing literature, pores in cementitious materials are generally commonly divided into different kinds based on their size. Pores are classified into three components by the International Union of Pure and Applied Chemistry (IUPAC): micropores (less than 2 nm in diameter); mesopores (between 2 nm and 50 nm in diameter); macropores (more than 50 nm in diameter) [7]. According to the Comite Euro-International du Beton (CEB), pores can be divided into macropores (radius greater than 10−5 m), capillary pores (radius between 10−8 and 10−5 m) and micropores (radius between 10−10 m and 10−8 m) [11]. Wu categorized the pores into four groups according to the influences of pores of different sizes on strength: harmless pores (diameter less than 20 nm); less harmful pores (diameter between 20 nm and 50 nm); harmful pores (diameter between 50 nm and 200 nm); and more harmful pores (diameter larger than 200 nm) [12,13].
The most scientific categorization is based on the pores’ origin and features. The pores are described as gel voids, capillary voids, entrained air voids and entrapped air voids [14]. Gel voids and capillary voids are formed during the hydration process and undergo change over time. Specifically, gel voids are the interlayer space in calcium silicate hydrate (C-S-H), and capillary voids represent the space not filled by the solid components of the hydrated cement paste. During the mixing process, a quantity of air is frequently trapped in the cement paste. The admixtures may be added to concrete to entrain tiny air voids on purpose. Air voids are generally spherical, unlike gel voids and capillary voids, which are irregular in shape and not easy to observe.
Pipilikaki and Beazi-Katsioti stated that pores with size above 10 μm are called air voids [15]. Some authors mentioned that air voids are larger than 50 μm in diameter [16,17]. Mehta and Monteiro concluded that entrapped air voids may be as large as 3 mm; entrained air voids usually range from 50 μm to 200 μm [14]. It is obtained from Schober that the diameter of the air voids ranges from 100 μm to 3 mm [18]. However, it has been agreed that the presence of air-entraining admixtures or entrapped air during the mixing process causes air pores.
The mixing process is the vital link in the production of concrete. The purpose of mixing is to make the three phases (aggregates, cement paste and air voids) uniformly distributed both in the macroscopic or microscopic structure in a short amount of time [19]. According to certain research studies, the traditional forced mixing method can make the coarse and fine aggregates disperse evenly, but the particles conglomeration of some cementitious materials is ubiquitous in the microstructure [20,21], causing insufficient cement hydration. In order to better improve the mixing quality and the micro-uniformity of concrete, Feng and his team have been devoted to the research of vibration mixing technology [22]. Vibration mixing is a new technology and process that improves the performance of building materials by strengthening the mixing process without changing the material. The novel technology makes the mixture subject to high-frequency vibration during the mixing process. The internal homogeneity of the mortar and microstructure of the concrete will be enhanced by efficiently transmitting vibration energy to the mixture [23,24].
Reviewing the previous literature, there are some interesting findings about the influence of vibration mixing on the air phase of concrete. Zhao et al. indicated that, as the vibration acceleration increases, the air content of fresh concrete first increases and then decreases, and there is a peak [25]. Xiong et al. pointed out that the vibration mixing process can be applied to consolidate the high-strength lightweight aggregate concrete and decrease the large air voids and micropore sizes [26]. Fu demonstrated that the appropriate vibration mixing method can make the air content of fresh concrete generally reach about 3.5%. Furthermore, the pore structure of concrete may be modified, resulting in increased concrete strength and durability [27].
The vibration mixing process is a novel technology and new method that can improve the microcosmic uniformity of concrete during the mixing process, so it has an impact on the structure of air voids [28,29]. Particularly during the vibration mixing process, the forced vibration of the aggregate will cause a variety of changes in air bubbles inside the concrete. The alteration in pore structure also has an effect on the macroscopic performance of concrete. However, the present research does have several issues. Firstly, the air content of fresh concrete can be increased by the vibration mixing process, but the specific mechanism is uncertain. Additionally, only one study has been conducted on the impact of the vibration mixing process on the porosity and pore structure of hardened concrete. The alteration of concrete pore structure under various vibration accelerations has not, however, been investigated. It is well accepted that pore structure factors, including size, distribution, shape and orientation, have a significant influence on concrete performance, and that air content or porosity is no longer the determining element. To the authors’ best knowledge, the research on the influence of the vibration mixing process with different vibration accelerations on air voids and their size distributions is novel and meaningful, and there are not many publications that have investigated the content. By studying the effect of vibration mixing on the pore structure of concrete, this paper aims to provide a method to optimize the pore structure of concrete by only changing the mixing process rather than adding admixtures, so as to improve the mechanical properties and durability of concrete.
There are numerous methods to analyze the porosity and pore structure of concrete. Mercury intrusion porosimetry (MIP) and nitrogen adsorption (NS) are the indirect measurement measuring techniques that can only be used to determine smaller pores (usually in the nano- to microscale) and open and interconnected pores [15,30,31,32,33]. However, these approaches entail the destruction of the samples and generate results from a small sample volume (about 1 cm3 in size). Direct approaches, such as optical microscope and scanning electron microscopy (SEM), allow for good observation of the shape, distribution and abundance of open and closed pores [34,35]. However, the sample size should not be too large and the observation area is affected by the magnification. More crucially, rather than precise quantitative analysis, these approaches focus on qualitative evaluation of materials. In recent years, X-ray computed tomography (XCT) has been utilized to perform non-destructive testing of concrete [36,37,38,39]. The sample size is not limited using this approach, and researchers may acquire a real three-dimensional distribution of pores, as predicted. However, the equipment is more advanced and requires professional operation. Therefore, the convenience and operability of detection are restricted, and the detection costs are quite high. This is not a good option for microscopic studies at microns or larger scales. EN 480-11 in Europe [40] and ASTM C457 in America [41] are the most used standards for determining air void properties in hardened concrete. In these, manual measurements are time-consuming, tedious and reliant on operator skills [42], hence automated methods, the most common of which is digital image processing, are preferred [43,44,45,46,47,48,49,50].
In this research, three different vibration accelerations were adopted during the mixing process. The concrete using the traditional forced mixing process is set as the reference group. The following are the particular objectives:
(1)
The effects of vibration vs. non-vibration mixing process on permeable voids in concrete are examined;
(2)
By using digital image analysis, the variations in pore characteristics (including porosity, quantity, size, and specific surface) between vibration and non-vibration mixing processes are studied;
(3)
The pore size distribution is examined to determine how the vibration mixing process affects the pore structure of concrete;
(4)
The impact of pore structure alterations on concrete’s impermeability and resistance to freeze-thaw is investigated.

2. Methodology

2.1. Materials

Limestone gravel with a size range of 4.75–19 mm was used as the coarse aggregate. The fine aggregates were class medium natural sand with a maximum particle size of 5 mm. The coarse aggregate and fine aggregate were purchased from Shaanxi Lishan stone company. The CONCH Portland cement (P.O 42.5) was used as binder. To avoid the impact on the pore structure, no admixtures were used in all mixtures. The 70 ± 10 mm slump of fresh concrete for a 0.46 w/c ratio was obtained. The design compressive strength of concrete was 30 MPa at 28 days of standard curing age. The composition of all concrete mixes is presented in Table 1.

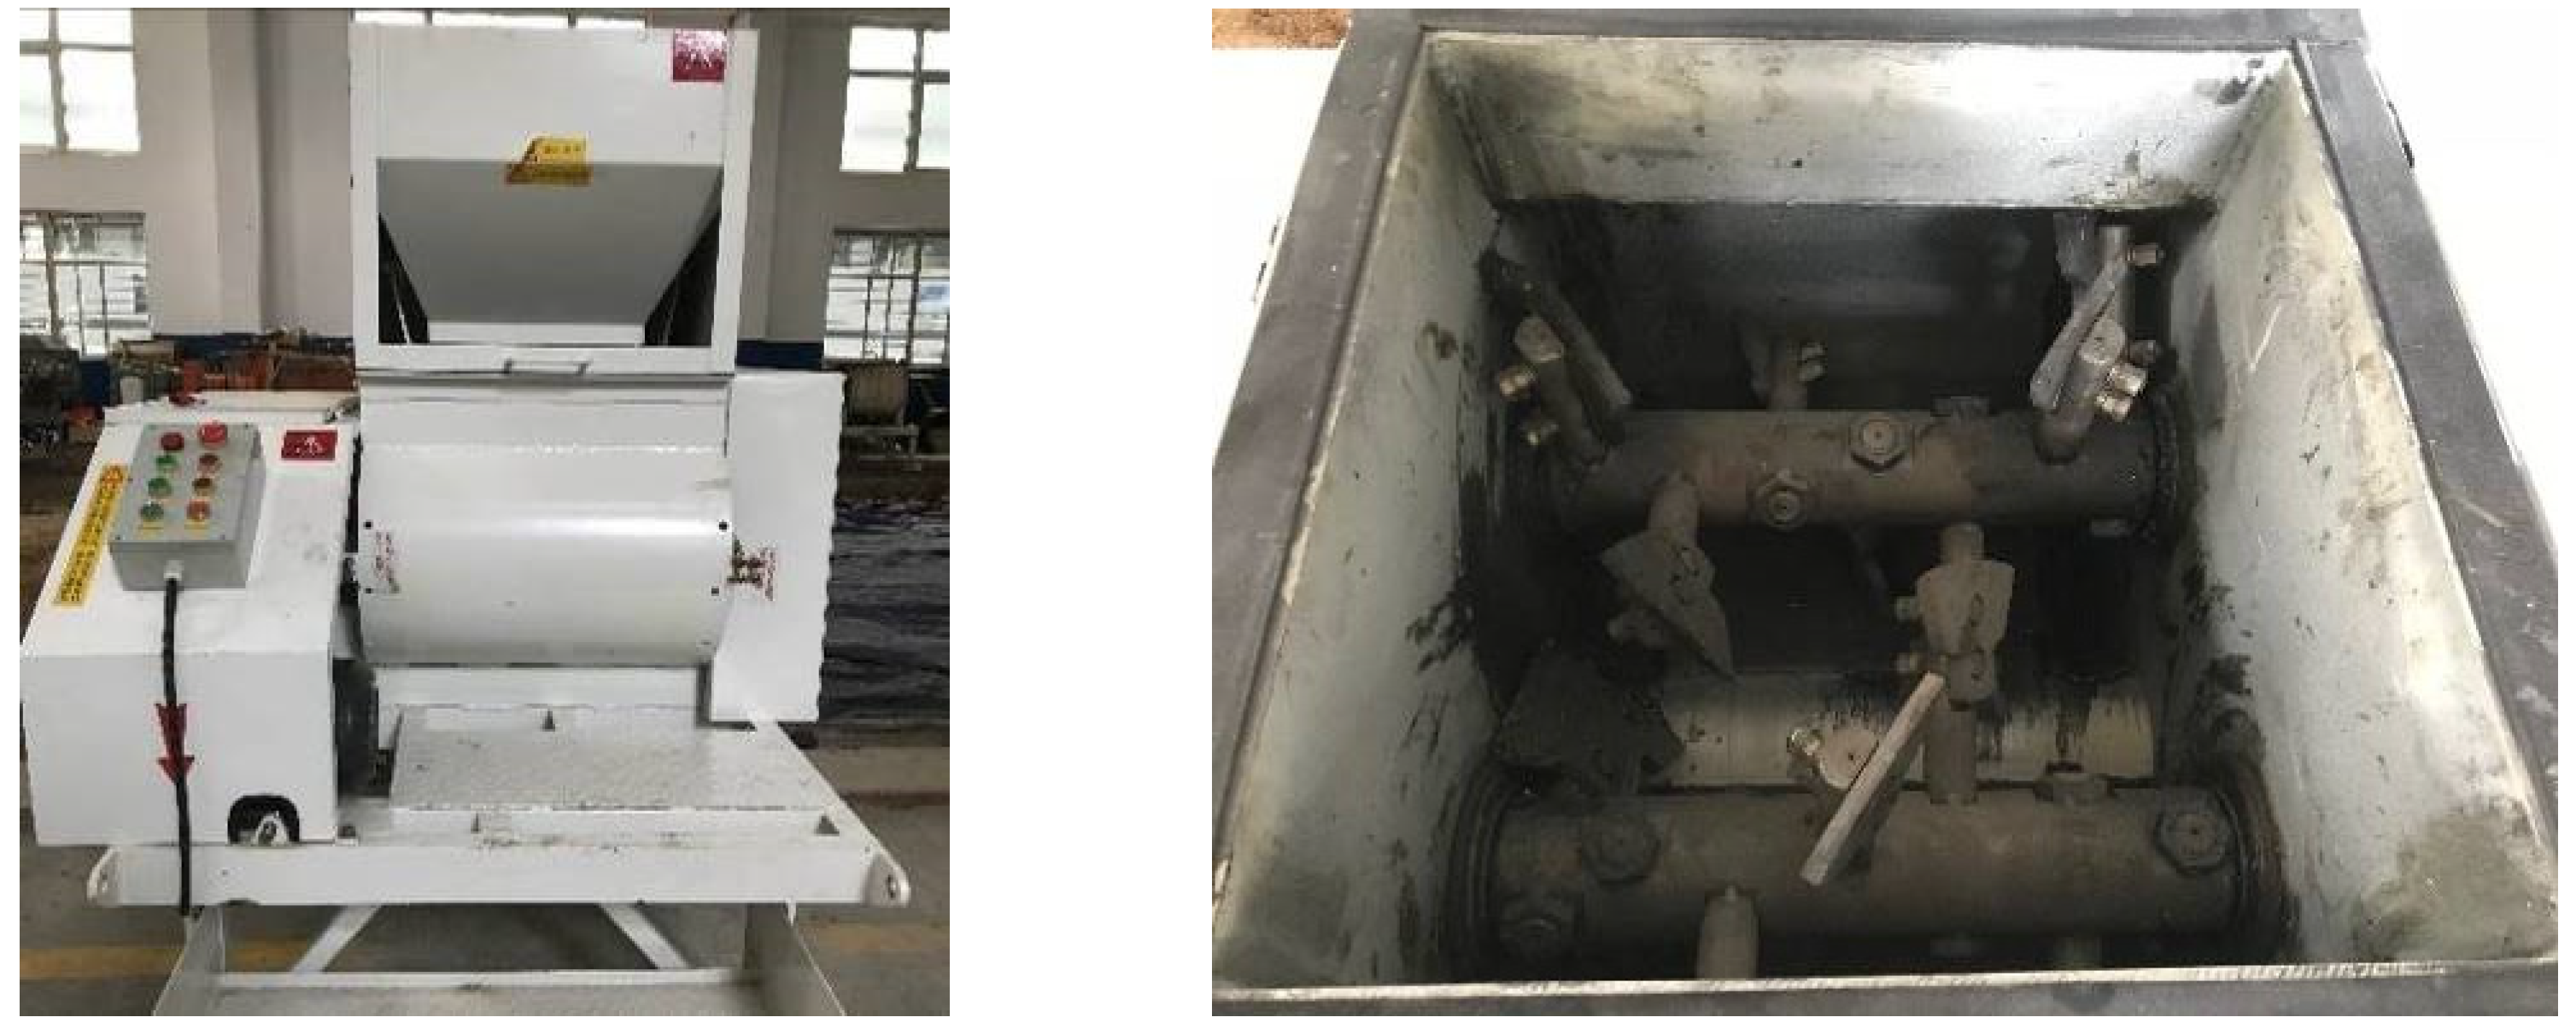
2.2. Vibration Mixing Process

A twin-shaft vibration mixer (Figure 1) was used in the experiment. It mainly consists of a mixing drive device and a vibration drive device. The mixing drive device forces the mixture to circulate in the mixer by rotating the mixing shaft, mixing arm, and mixing blade in the normal mode. In the vibration mode, the mixing drive device continues to work normally, but the vibration driving device at the other end will force the mixing shaft to rotate eccentrically at a high speed through the eccentric structure, causing periodic vibration. In a nutshell, the mixing shafts rotate in the normal mode, while they eccentrically rotate in the vibration mode to produce vibration, thereby realizing vibration mixing.
Due to the high-frequency vibration during the mixing process, the collisions, squeezing and rubbing movements of the components are strengthened, which destroys the initial hydrate film coating on the surface of cement particles and facilitates the change of the cement particles from agglomerated state to uniformly distributed state (Figure 2), resulting in better homogeneity of fresh mixture [51].
In the research, the vibration mixing process with different vibration acceleration (2 g, 3 g and 4 g) and non-vibration mixing process can be manually adjusted through the changeover switch.

2.3. Mixing Approach

The new mixing approach divides the mixing process into two parts: pre-mixing process and key mixing process. The pre-mixing process can provide time for coarse, fine aggregates and cement to mix evenly. Water will be added in the key mixing process. At the same process, the mixer’s vibration mode is manually set in accordance with the plan. The mixing procedure is shown in Figure 3.

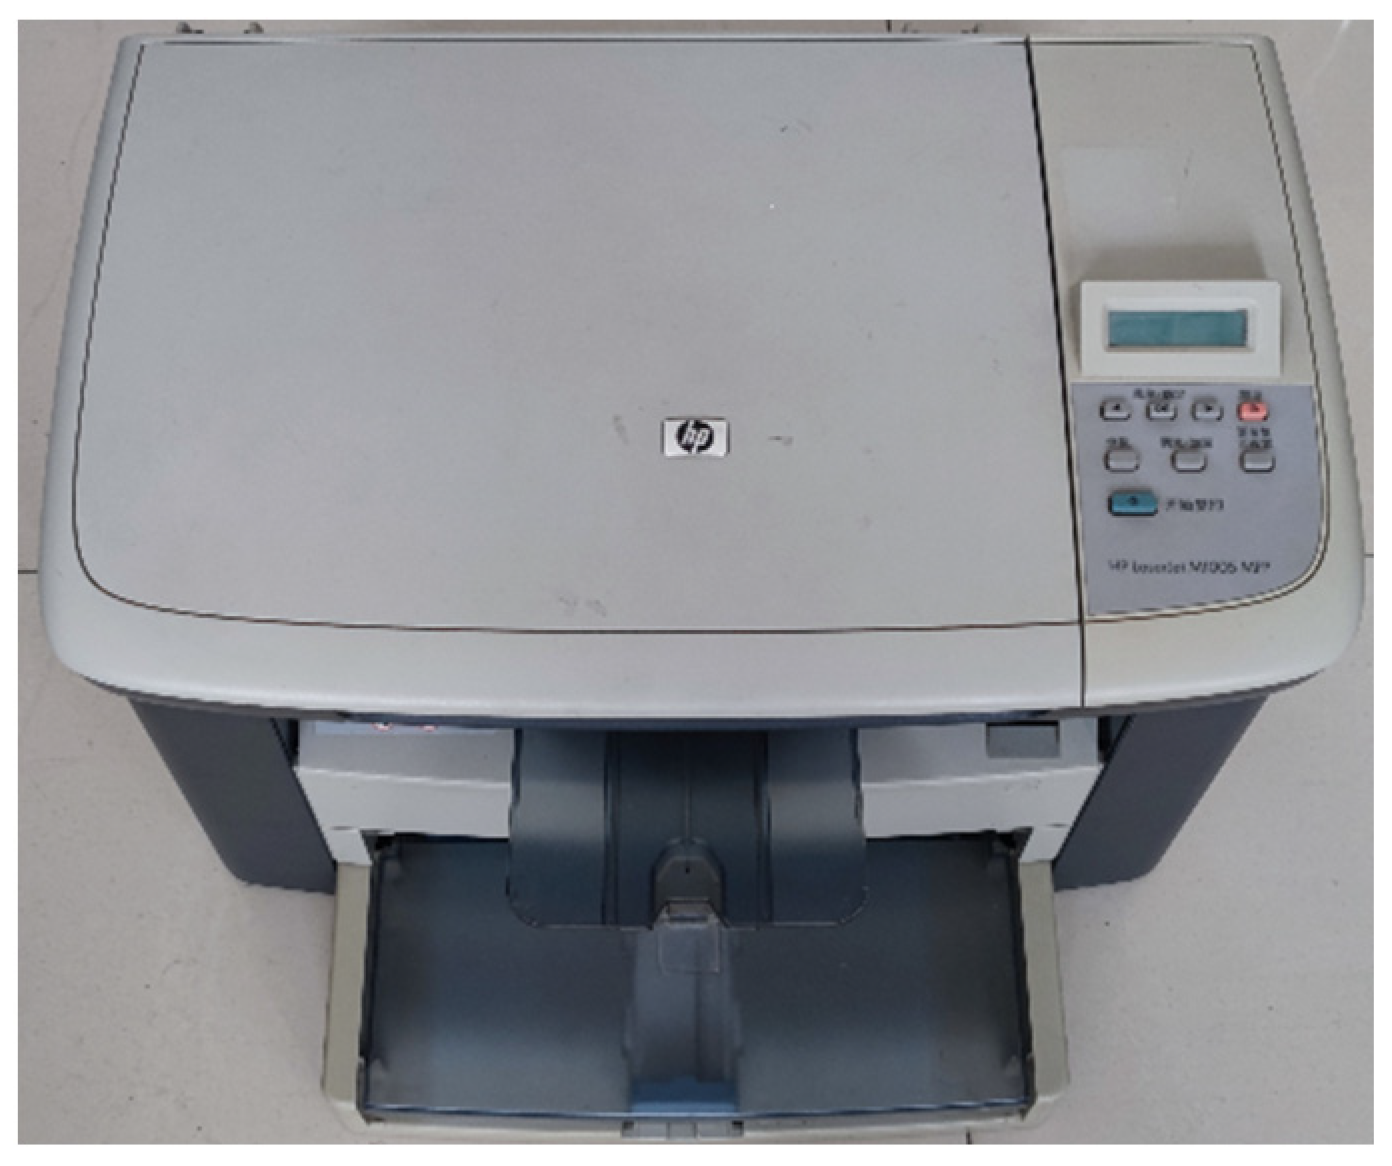
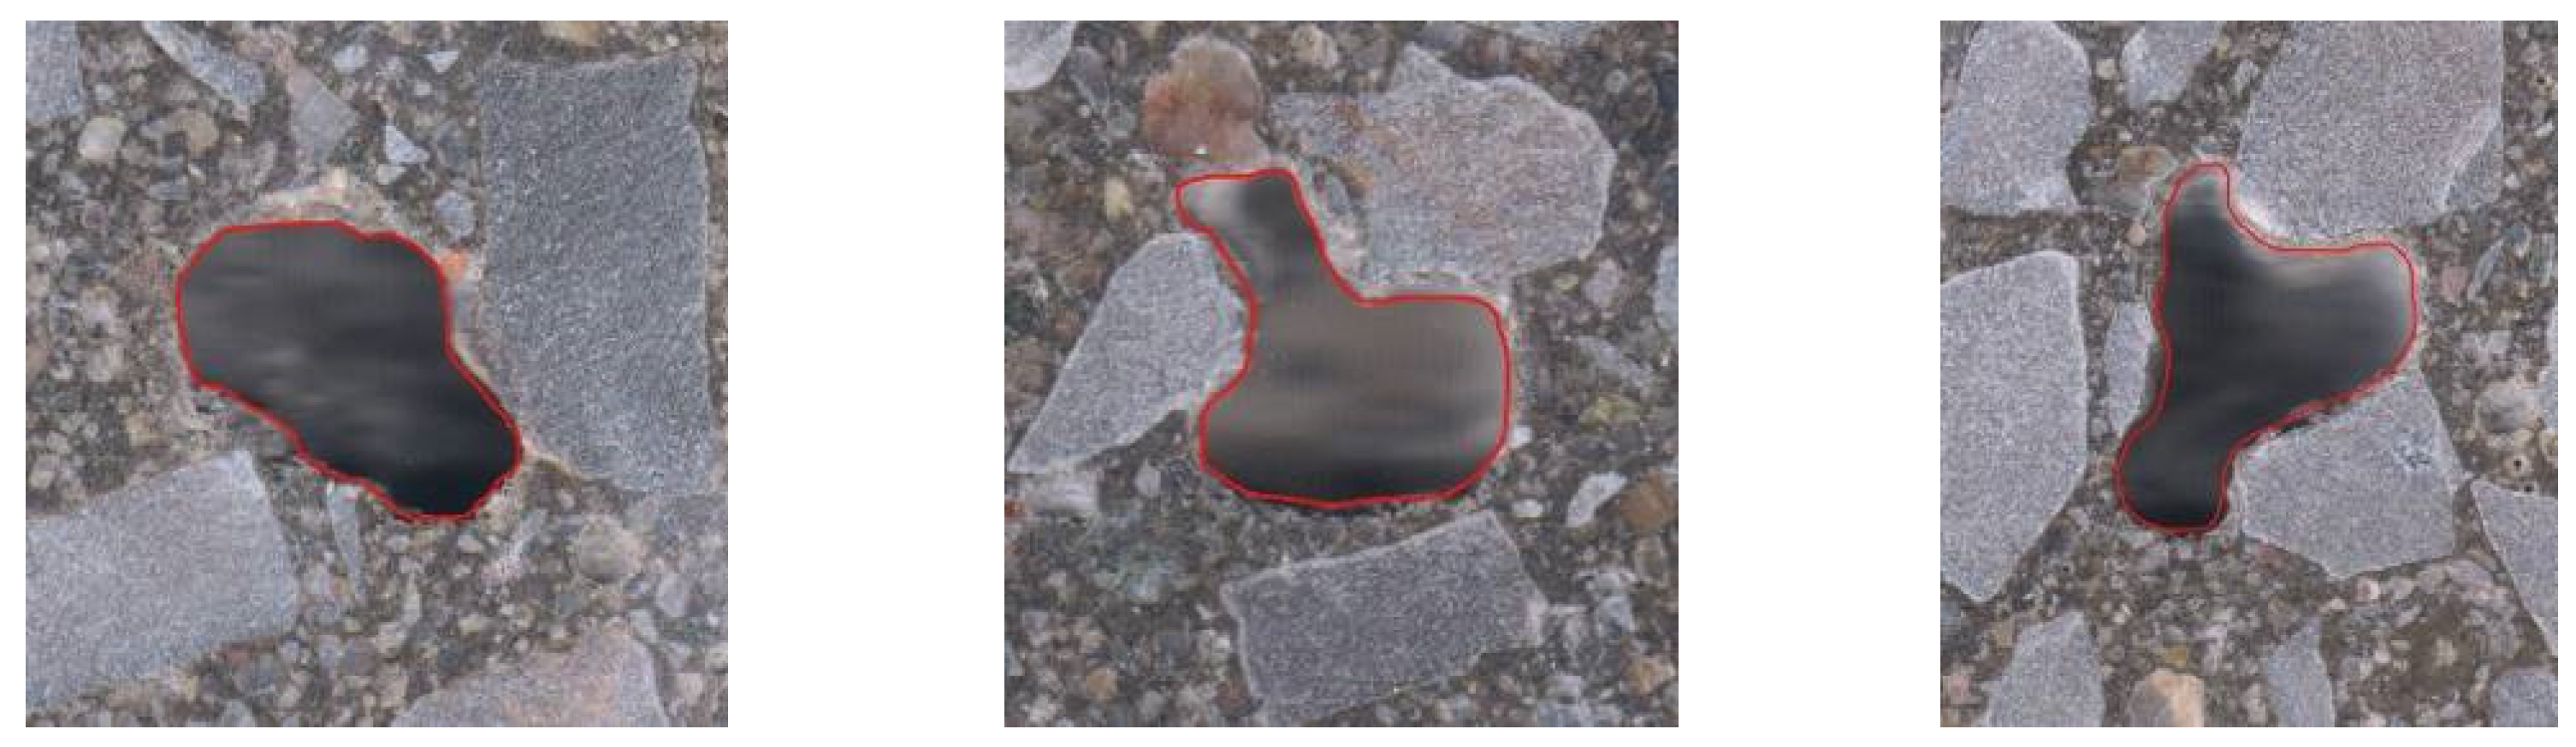
2.4. Digital Image Analysis

A novel methodology has been developed to quantify the air pores using digital image analysis. In this case, specimens with 150 mm diameter and 300 mm height were cut to obtain the circular cross-section at various heights. To obtain qualified samples, the first step (Step 1) is to cut the specimen along the direction perpendicular plane to the axis of the cylinder. After the 28 d curing age, five samples inside the specimens will be obtained from the top, middle and bottom of each cylinder, as illustrated in Figure 4.
After obtaining the cross-sections of the test samples, it is necessary to polish the surface in the second step (Step 2). The top surface of each sample was chosen for analysis in this study. Diamond polishing pads with granularities of 50#, 100#, 200#, 400#, 600#, 800# and 1000# were used to polish the surface. This step is crucial for obtaining accurate results later.
After cutting, polishing and cleaning, the third step (Step 3) is to prepare the surface. In order to extract the pores more accurately, it is vital to form a good contrast between the pore and other constituents. It was decided to use black ink to paint the background and fill the pores with zinc oxide (white). The fineness of zinc oxide (the particle size range: 1–100 nm) guarantees filling the pores and cavities of the surface. To ensure that zinc oxide penetrates all air voids, circular movements pressing with fingers should be performed. After filling, the surface can be cleaned and the excess white powder on the black background can be removed.
The fourth step (Step 4) is to collect cross-sectional images. The cross-sections of the samples were scanned using a flatbed scanner (Hewlett-Packard LaserJet M1005, Figure 5) with a resolution of 1200 dpi, and the target images with only black and white colors were obtained.
The final stage is the digital image analysis. A specific methodology has been developed to quantify air pore structure using digital image analysis. A self-written program has been created for this purpose. The process of digital image analysis specifically entails image binarization, edge detection, image filtering, image segmentation, morphological processing, feature marking and extraction, and finally the image containing only pore information is obtained (Step 5). The resolution of the image limits the minimum pore size, as is well known. In theory, the area of the smallest pore that can be detected is one pixel (21.2 × 21.2 μm2). As mentioned above, a consistent conclusion demonstrates that air pores entrained or entrapped during the mixing process are larger than 50 μm in diameter (the area is approximately 5 pixels.). Furthermore, the edge of the sample may be damaged during cutting, which will affect the accuracy of the results. Therefore, the research scope is limited to a circle with a diameter of 70 mm. The approach can be used to determine the porosity, size, quantity, specific surface area and size distribution of air pores, which can help to better analyze the characteristics of the pore system.

2.5. Test Procedure

In this study, the mixtures were poured into the 100 mm cube molds, 100 × 100 × 400 mm molds, the frustum of a cone molds (top diameter Φ175 mm, bottom diameter Φ185 mm, height 150 mm) and Φ150 × 300 mm cylinder molds. After demolding, the specimens were stored in a curing room with a temperature of 20 ± 2 °C and the RH of 95%. According to ASTM C642-13 [52], the volume of permeable voids in concrete was measured after 28 days of curing. Six 100 mm cube specimens were tested for each mixture, and the volume of permeable voids is the average value. For the digital image analysis, five different cross-sections of the cylinder were examined, and the average feature of five surfaces was used to determine pore characteristics for each mixture. The freeze-thaw resistance and penetration resistance were assessed using the rapid freezing and thawing method and the depth of water penetration method, respectively, according to standard GB/T 50082-2009 [53].

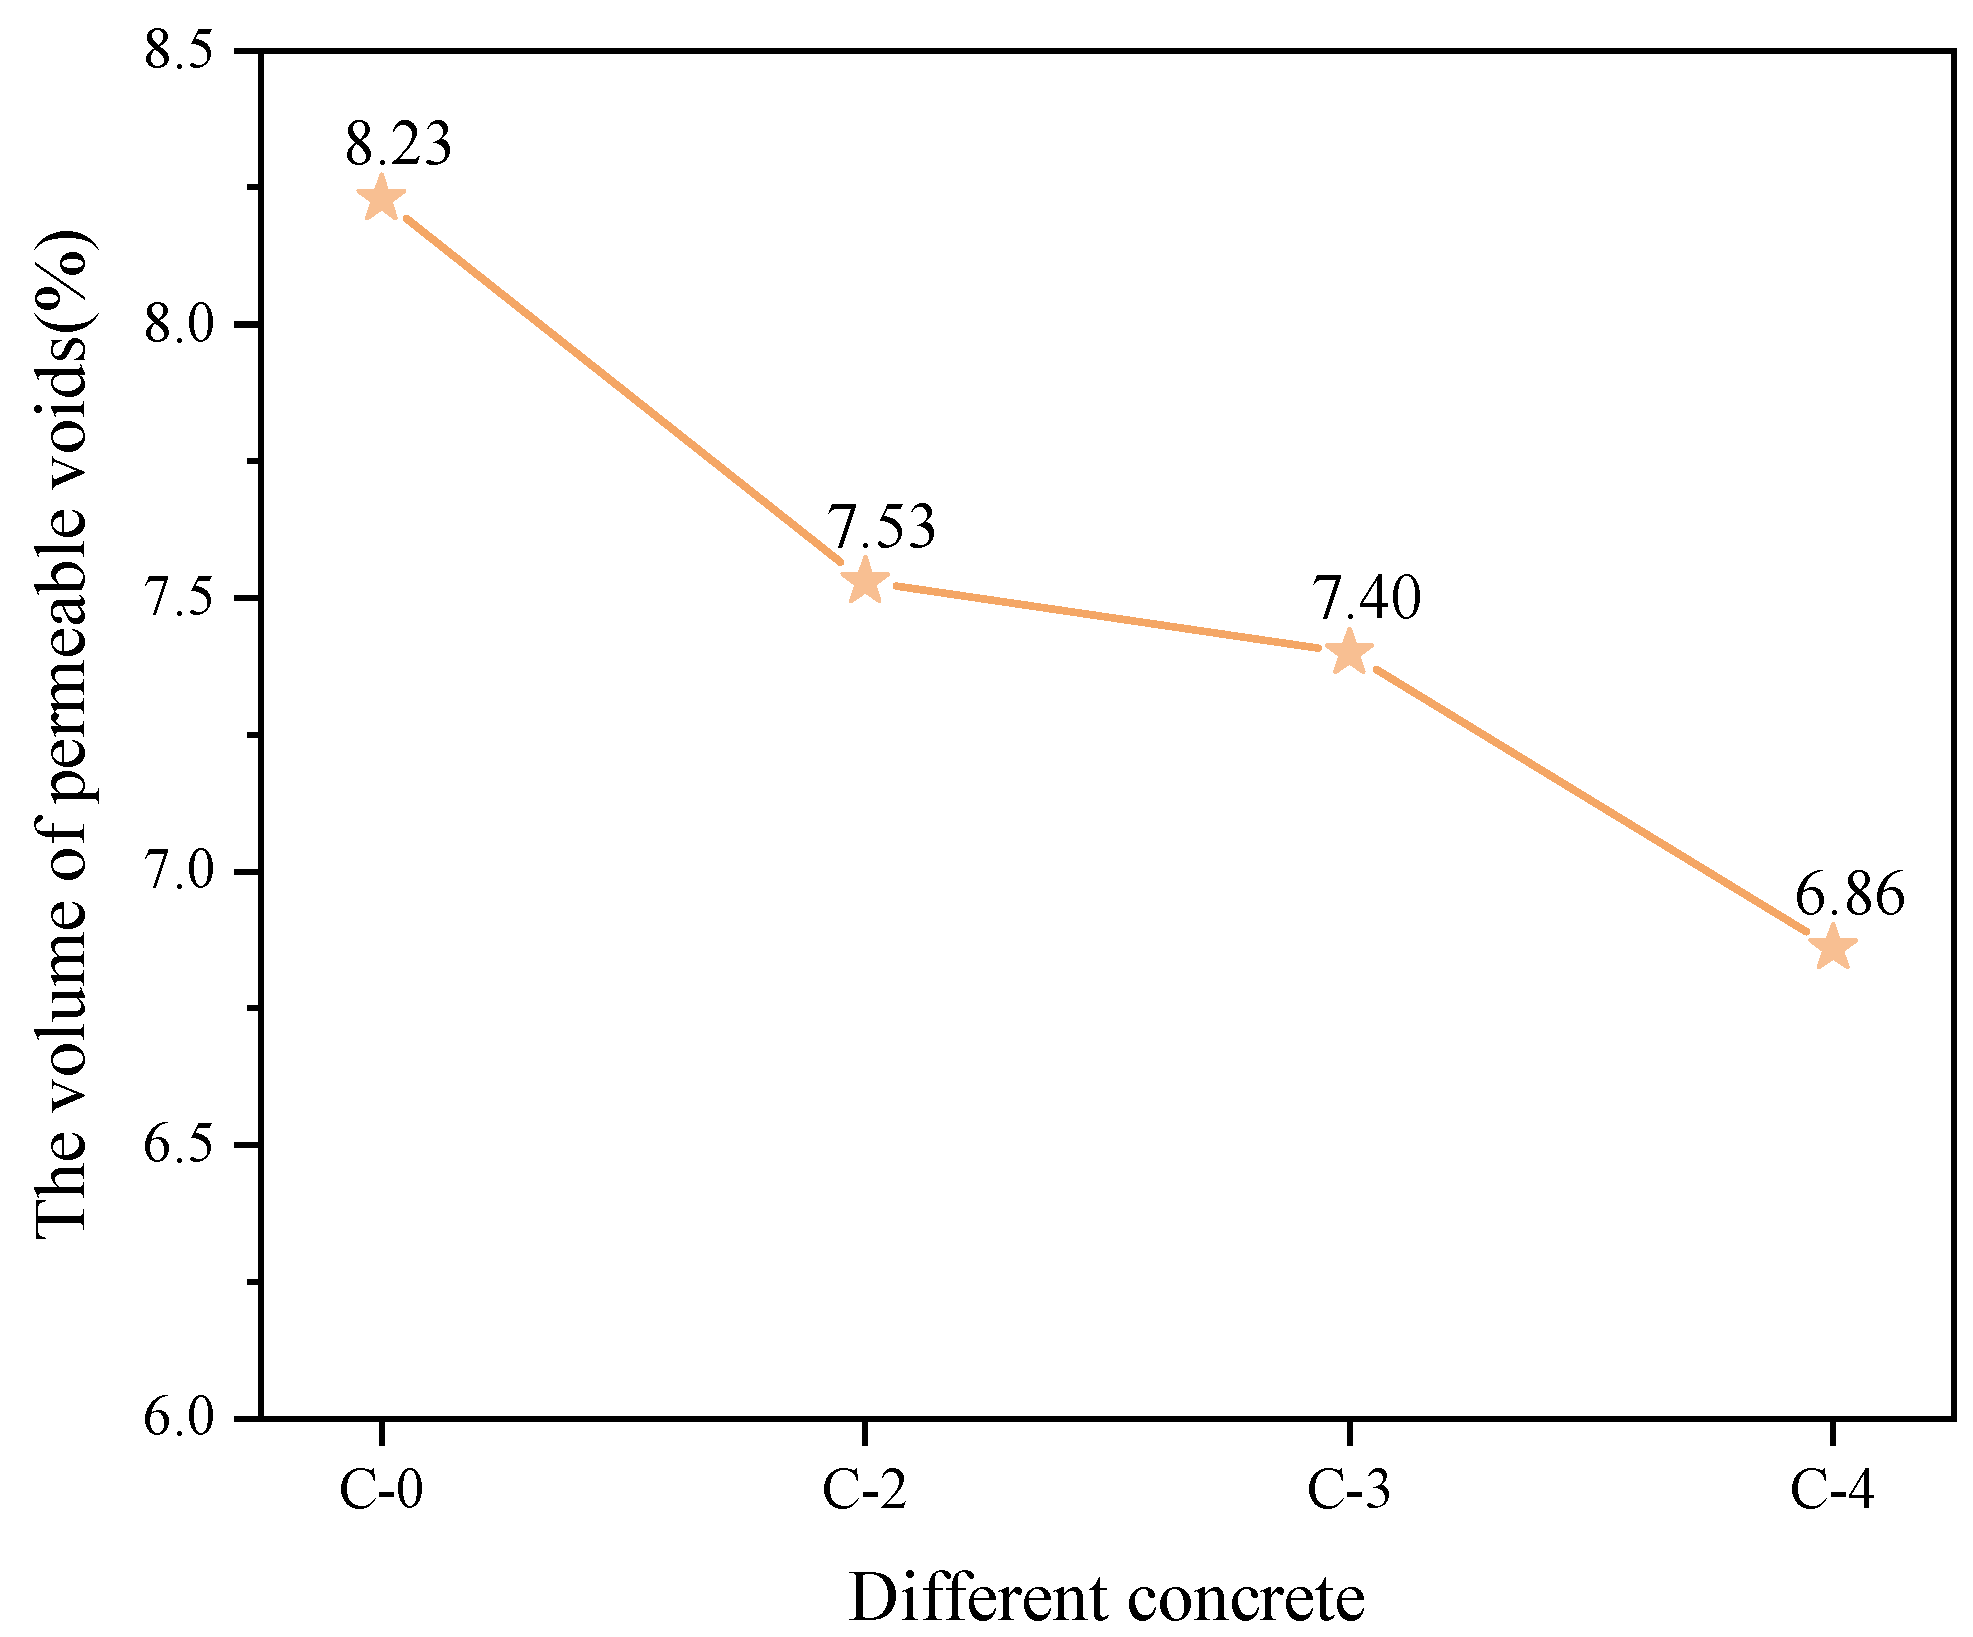
3. The Volume of Permeable Voids

Figure 6 depicts the result of permeable voids. Concrete using the non-vibration mixing process was marked by “C-0”, while concrete using the vibration mixing process with different vibration acceleration (2 g, 3 g and 4 g) was denoted by “C-2”, “C-3” and “C-4”, respectively. The permeable voids refer to the spaces occupied by interconnected capillary pores and entrapped air pores. These voids will influence the compactness and permeability of the concrete. It can be seen that the volume of permeable voids in hardened concrete decreases with the increase of vibration acceleration. Compared with C-0, the relative decrease values of C-2, C-3 and C-4 are 8.5%, 10.1% and 16.6%, respectively. The reasons are as follows. It has been proven that high-frequency vibration can reduce the “internal friction” of constituents and improve the fluidity of fresh mixture. As a result, the compactness of the concrete will increase, and the voids space will be reduced accordingly. Furthermore, Mehta stated that cement hydration can be viewed as a process during which the space originally occupied by cement and water is being replaced more and more by the space filled by hydration products [14]. The space not taken up by the cement or the hydration products consists of capillary pores. The agglomeration of cement particles can be destroyed by the vibration mixing process, resulting in more cement particles participating in the hydration reaction and, as a result, more hydration products are created. Therefore, the quantity of capillary pores in the concrete using the vibration mixing process will be reduced, making the connectivity of entrapped pores and capillary pores more difficult. In addition, an increase in permeable voids is associated with matrix shrinkage, which can lead to microcracking at the aggregate/mortar interface. However, according to Xiong’s research, the vibration mixing process can reduce the thickness of ITZ and form the impregnation zone [26]. A large amount of C-S-H gel can be observed in this region, and these hydration products form the ‘‘Interlock” between aggregate and cement matrix, which reduces the number of microcracks dramatically. This is another possible reason why using the vibration mixing process can reduce the volume of permeable voids in concrete.

4. Characterization of Air Pores Distribution

4.1. Porosity

In the digital image analysis, the area occupied by pores can be calculated by processing the binary images of specimens. As a result, the porosity of a specimen is approximately equal to the ratio of the pore area to the cross-sectional area. The value of porosity measured in the laboratory is presented in Table 2. It can be seen that the porosity of hardened concrete is inversely related to the vibration acceleration, which is consistent with the volume of permeable voids trend. C-0, in particular, has the highest porosity among all considered concrete, up to 1.8%. The porosity of C-2 has decreased by 15.0% relative to that of C-0. With further increase of the vibration acceleration, the porosity of C-3 and C-4 drops to 1.38% and 1.28%, respectively, which is much lower than the reference group using the non-vibration mixing process. The reduction in porosity can be attributed to an increase in compactness, as well as the fact that the vibration mixing process dramatically changes the air pore structure inside the concrete, which will be discussed later.

4.2. Quantity of Air Pores

The average air pores quantity of different mixtures is described in Table 2. The number of air pores differs significantly depending on whether the vibration mixing process is used. C-0 has the fewest average number of air pores. On the contrary, the quantity increases gradually as the vibration acceleration varies. The quantity of air pores in C-4 is the highest among all concrete studied, increasing by 63.1% compared to C-0. The rise in the quantity of air pores can be attributed to the vibration energy applied during the mixing process. The mixing arm and blade in a vibration mixer are also vibration devices, which can transmit vibration energy during the mixing process. Under the action of vibration, the mixing blade finds it easier to tear the fresh mixture and entrap air to generate bubbles, and the entrapped air bubbles are also refined into tiny bubbles, which is advantageous for these air bubbles to be firmly stored in the mortar to form air pores. Meanwhile, the vibration mixing process can improve the workability of mixtures, so it is easier to generate a very thin “liquid film” on the surface of fresh concrete after mixing, resulting in high resistance to the tiny bubbles overflow. These are some of the reasons why the quantity of air pores in hardened concrete using the vibration mixing process is larger than in reference concrete.

4.3. Size of Air Pores

During the mixing process, entrained air voids should ideally be spherical [13,14]. However, pores accidentally entrapped in concrete will generally not be regularly spherical (Figure 7), as air pores may be squeezed and deformed by surrounding aggregates and hydration products during the hardening process. To distinguish the size, the equivalent diameter of air pores was introduced, which is defined as the diameter of an equivalent circle with the same area as a single air pore.
The average values of the equivalent diameters are illustrated in Table 2. It is noted that the average air pores size of C-0 is much greater than that of other mixtures. There was a considerable reduction in pore size as vibration acceleration increased. The average equivalent diameter of the C-2 and C-3 decreased by 27.7 μm and 51.4 μm compared to the reference group. C-4 has the smallest average size (327.9 μm), which is 85.5 μm smaller than C-0. These findings indicate that pores with smaller diameter remain in the hardened concrete using the vibration mixing process, and the size of air pores further decreases with the variation of vibration acceleration. It is well known that the air pores in hardened concrete are the continuation of the bubbles entrapped during the mixing process, which is a dynamic process. Therefore, the reduction in pore size using the vibration mixing process is attributed not only to the ability of the mixing blades to directly refine the entrapped air bubbles, but is also related to the subsequent changes of the bubbles already encapsulated in the mortar [54]. Firstly, the bigger bubbles are unstable throughout the mixing process and tend to escape from the interior of the mixture. The locally aggregated air bubbles will also escape due to combining into huge bubbles during the mixing process. Using the vibration mixing process, high-frequency vibration can reduce the “internal friction” of constituents and improve the fluidity of the fresh mixture. As a result, it is beneficial for the sand and aggregates in the mixture to sink, thereby accelerating the escape of unstable bubbles (mechanism 2 in Figure 8). This might be one cause for the pore size decrease. Furthermore, most of the air bubbles entrapped during mixing are likely to remain in the concrete. Due to the balance of their own surface tension and external force, these bubbles will keep a certain shape in the concrete. When using the vibration mixing process, the vibrational energy is transferred to the bubbles, resulting in a fluctuating inertial force on the bubbles’ surface. When the inertial force exceeds the surface tension of the bubble, the bubble will break and split into several smaller bubbles (mechanism 1 in Figure 8). This effect may explain why the bubble size reduces, as well as why the number of bubbles inside concrete using the vibration mixing process increases. Furthermore, not all big, unstable air bubbles can escape the concrete during the mixing and hardening process. Bubbles may encounter or be surrounded by aggregates in the path of the overflow, preventing their movement. Internal defects are eventually formed due to its retention around the aggregates, as seen in Figure 7. However, during the vibration mixing process, the vibrational energy can be transferred to the mixture, including the aggregates, via the mixing shaft, the mixing arm and the mixing blade. The high-frequency vibration can make the aggregates resonate, and then the aggregates will act as a small vibration source to release energy to the surrounding bubbles. When the aggregates exert more force on the bubbles than the surface tension, the bubbles will distort, burst and split into several little bubbles. As a result, the number of tiny air bubbles in the concrete will grow even more (mechanism 3 in Figure 8), resulting in a large reduction in the average pore size.

4.4. Specific Surface Area of Air Pores

The specific surface area of a pore is the ratio of its surface area to its volume. Following the standardized procedure of ASTM C457 [41], the specific surface area is given as the product of four and the reciprocal of the average chord length. However, when digital image analysis is used to assess the pores system, this relationship is no longer applicable. Murotani [49] proposed that the specific surface area may be calculated directly from the images using the following Equation (1):
α = 6 π a ¯
where a ¯ is the mean area of air voids displayed on three cross-sections obtained by digital image analysis.
The specific surface area of air pores is positively correlated with the increase of vibration acceleration, as demonstrated in Table 2. The value of C-2 (8.57 mm1) is higher than C-0 (7.94 mm1), and the values of C-3 (9.26 mm1) and C-4 (9.80 mm1) are also significantly different from the reference group. A larger specific surface area means that the size of the pore is smaller. Therefore, this agrees with the findings in the results of pore size. The increase of the specific surface area with the vibration acceleration also indirectly proves that high-frequency vibration is favorable to the refining of pores during the mixing process, which ensures that air pores can remain stable in hardened concrete.

4.5. Analysis of Variance (ANOVA)

The ANOVA of the porosity, quantity and pore size was tested to ensure that the variation in concrete pore system is attributable to the different mixing process rather than experimental error. Table 3 shows that the p-values for several parameters were less than 0.05. This indicates that, using the vibration or non-vibration mixing process, the population means for the porosity, quantity or pore size are significantly different. Therefore, combined with the above analysis, it is feasible to conclude that the vibration mixing process can help the pore system in the concrete to develop towards low porosity, small pore size and large quantity.

4.6. Pore Size Distribution

The porosity, equivalent diameter or quantity are incapable of representing the pore structures in concrete, since they are only a global statistical factor. Pore size distribution, also known as pore gradation, refers to the number or proportion of pores of different sizes in a concrete pore system. It can directly reflect the variation of the pore system during different mixing processes. The results of pore size distribution are shown in Figure 9. The pore size distribution is separated into two parts: micrometer and millimeter, because the pore size ranges from micrometers to several millimeters. The size distribution of pores with an equivalent diameter between 50 μm and 1 mm is shown Figure 9a, while the size distribution of pores with an equivalent diameter greater than 1 mm is shown in Figure 9b. Figure 9a shows that, regardless of using the vibration or non-vibration mixing process, the pore structure for each concrete has a similar distribution with the variation of size, presenting an approximate lognormal distribution. This result is consistent with previous research [55,56]. All pore gradation curves have a major peak, which is mostly made up of pores with a diameter between 50 μm and 500 μm. Within this range, it can be found that the number of different pores in concrete using the vibration mixing process increases significantly. Especially in C-4, compared with the reference concrete, the number of pores in different diameter ranges (50–100 μm, 100–200 μm, 200–300 μm, 300–400 μm and 400–500 μm) relatively increased by 99.7%, 73.1%, 94.4%, 93.0% and 51.4%, respectively. In addition, most of the pores (80%) in C-2, C-3 and C-4 are in the range of 50–500 μm, 50–500 μm and 50–420 μm, respectively, whereas the range for C-0 is 50–600 μm. It can be seen that the majority of the pores in the concrete using the vibration mixing process are smaller in size. The mechanisms 1 and 3 of bubble change during the vibration mixing process in Figure 8 are responsible for these outcomes. Considering the diameter range of 500–1000 μm, there is no significant change in the number of different pores. However, as the total number of pores continues to increase from C-0 to C-4, the proportion of these pores decreases accordingly.
Figure 9b shows that all pore gradation curves have a smaller peak of pore diameters between 1 mm and 2 mm. It is obvious that C-0 has the largest number of pores in this range among all the concretes studied. The total number of these pores in the reference group is 70, but the values of C-2, C-3 and C-4 are 55, 56 and 51, respectively. It also shows that the total number of pores with an equivalent diameter greater than 1 mm decreases significantly with the increase of vibration acceleration. Pores with an equivalent diameter greater than 1 mm have adverse effects on the strength and durability of concrete. The reduction in the number of big air pores for C-2 to C-4, on the other hand, may be explained by the reduction of internal friction between concrete components and mechanism 2 and 3 (Figure 8) of high-frequency vibration on the bubbles change. In addition, the variation in the number of these pores is also a possible reason for the decrease of porosity and average equivalent diameter in concrete using the vibration mixing process.

5. Freeze-Thaw Resistance

Figure 10 shows the variation in the mass loss rate of all concrete studied. It is evident that the mass loss rate decreased slightly with the increasing number of freeze-thaw cycles, especially starting from 100 cycles. After 200 cycles, C-0 and C-2 have failed with a mass loss rate of 8.96% and 6.55%, respectively. The pictures of the specimen also show that C-0 has completely fractured, while the aggregate of C-2 is completely exposed, and obvious cracks appear. In contrast, the mass loss rate for both C-3 and C-4 was less than 5%. As can also be seen from the corresponding photographs, there is only a little surface spalling of specimens and no obvious cracks or damage. The difference in the weight of the concrete after freeze-thaw cycling was caused by changes in the air pore system. The pore size distribution curves reveal that the number of different pores in concrete using the vibration mixing process increases significantly, especially pores with a diameter between 50 μm and 500 μm. These pores do a good job of releasing the osmotic pressure created by the freezing of the capillary solution during the freezing process. Furthermore, the water pressure caused by the freezing of water in the large pores is also reduced at the source as the number of macropores decreases.

6. Water Penetration Resistance

The result of the depth of water penetration is depicted in Figure 11. It can be seen that the depth of water penetration decreases with the increase of vibration acceleration. This is consistent with the finding of permeable voids. The values of C-2, C-3 and C-4 are reduced by 3.4 cm, 5.4 cm and 6.8 cm compared to C-0, respectively. This indicates that, owing to the vibration mixing process, the majority of the pores are closed and evenly dispersed inside the concrete, and are not interconnected with capillary pores. Therefore, the existence of these pores will not only have no detrimental influence on the microstructure and ITZ of concrete, but will also have a beneficial impact on its impermeability and durability.

7. Discussion

Using digital image analysis, this article primarily estimates the impact of the vibration mixing process on the air pore size distributions in concrete. The findings demonstrate that the pore structure of concrete is affected differently by the vibration mixing process with various vibration accelerations. The porosity of the various vibration mixing processes dropped by 15%, 23.3% and 28.9%, respectively, as compared to C-0, and the permeable voids of C-2, C-3 and C-4 reduced by 8.5%, 10.1% and 16.6%, respectively. These findings are consistent with Feng’s study [22]. Fu explored how the vibration and non-vibration mixing processes affected the concrete’s pore size distribution and pore diameter by MIP [27]. The results demonstrate that the number of big pores in concrete definitely lowers when the vibration mixing process is used, whilst the number of tiny pores grows. Additionally, the average and median diameter of pores is reduced when using the vibration mixing process. This article indicates that the number of pores increases when using the vibration mixing process, and the pore size distribution curve primarily demonstrates the significant increase in the number of pores with diameters between 50 and 500 μm, while the number of pores larger than 500 μm, particularly the millimeter pores, decreases. These findings are in line with Fu’s research. When the vibration mixing process was utilized, the pores’ size as well as their number varied. According to the findings, using the vibration mixing process reduces concrete’s average pore diameter by 20.7% while increasing specific surface area by 23.4% compared to C-0, particularly when vibration acceleration is 4 g. The beneficial effects of the vibratory mixing process on pore structure are mostly due to the following variables. One advantage of using vibration during the mixing process is that it may reduce the cohesion and friction between materials, making the concrete more homogenous and dense, and also able to squeeze out larger bubbles. Additionally, the high-frequency vibration makes the aggregate resonate, which may hit and crush the nearby air bubbles and cause them to divide into more and smaller ones. The study by Zhao, Fu and Xiong does not address these results [25,26,27].
The freezing resistance and impermeability of concrete will both be impacted by the change in pore structure. According to the findings of the freeze-thaw cycle tests, using the vibration mixing process improves the freeze-thaw resistance of concrete more than the non-vibration mixing process. After 200 cycles of freezing and thawing, the mass loss rate is 4.3% and 3.1%, respectively; when the vibration acceleration is 3 g and 4 g, however, C-0 has cracked and the concrete structure has suffered catastrophic failure. The impermeability test findings demonstrated that adopting the vibration mixing process greatly reduced the impermeability height of concrete. The impermeability height of C-2, C-3 and C-4 fell by 39.5%, 62.8% and 79.1%, respectively, when the vibration mixing process was used. The improvement of freeze-thaw resistance and impermeability of concrete can be attributed to the fact that concrete using the vibration mixing process has more small-sized pores; these pores might be employed as a place to relieve the pressure created by the water freezing, reducing damage to the concrete structure. In addition, the independently closed air bubbles might block the capillary channel within the concrete and increase its resistance to permeability.
Adding an air-entraining agent during the mixing process is another way to increase the amount of pores in the concrete and enhance its resistance to frost, but it may result in a certain loss of strength. According to Fu’s research, concrete with added air-entraining agents had higher total porosity, average pore size and median pore size when compared to concrete made with vibratory mixing [27]. This has a negative impact on the performance of concrete. In contrast to concrete with air-entraining agents, the strength of concrete using the vibration mixing process is not always diminished since it may not only improve the pore structure but also produce an impregnation effect at the interface transition zone (according to Xiong’s results [26]). When the acceleration of vibration increases, these phenomena will become more visible. Therefore, the vibration mixing process can be a way to optimize the pore structure of concrete by only changing the mixing process rather than adding admixtures, so as to improve the mechanical properties and durability of concrete.

8. Conclusions

From the study of the effect of the vibration mixing process on air pore structure and size distributions in concrete, the following conclusions can be obtained.
(1)
The volume of permeable voids in hardened concrete decreases as vibration acceleration increases. The relative reduction values of C-2, C-3 and C-4 are 8.5%, 10.1% and 16.6%, respectively, as compared to the reference group. This indicates that the concrete produced by the vibration mixing process is denser and has fewer interior open pores.
(2)
The digital image analysis has been used to evaluate pore characteristics in hardened concrete. Using this approach, the detailed results show that the porosity of C-2, C-3 and C-4 is relatively reduced by 15.0%, 23.3% and 28.9% compared to the reference concrete. With an increase in vibration acceleration, the average equivalent diameter drops from 413.4 μm to 327.9 μm and the specific surface area rises from 7.94 mm−1 to 9.80 mm−1. The number of pores likewise increases with the alteration in vibration acceleration. The quantity grew to 1122 at 4 g of vibration acceleration, a relative increase of 63.1% compared with the reference group. The ANOVA of the porosity, quantity and pore size also shows that, using the vibration or non-vibration mixing process, the population means are significantly different at the 0.05 level.
(3)
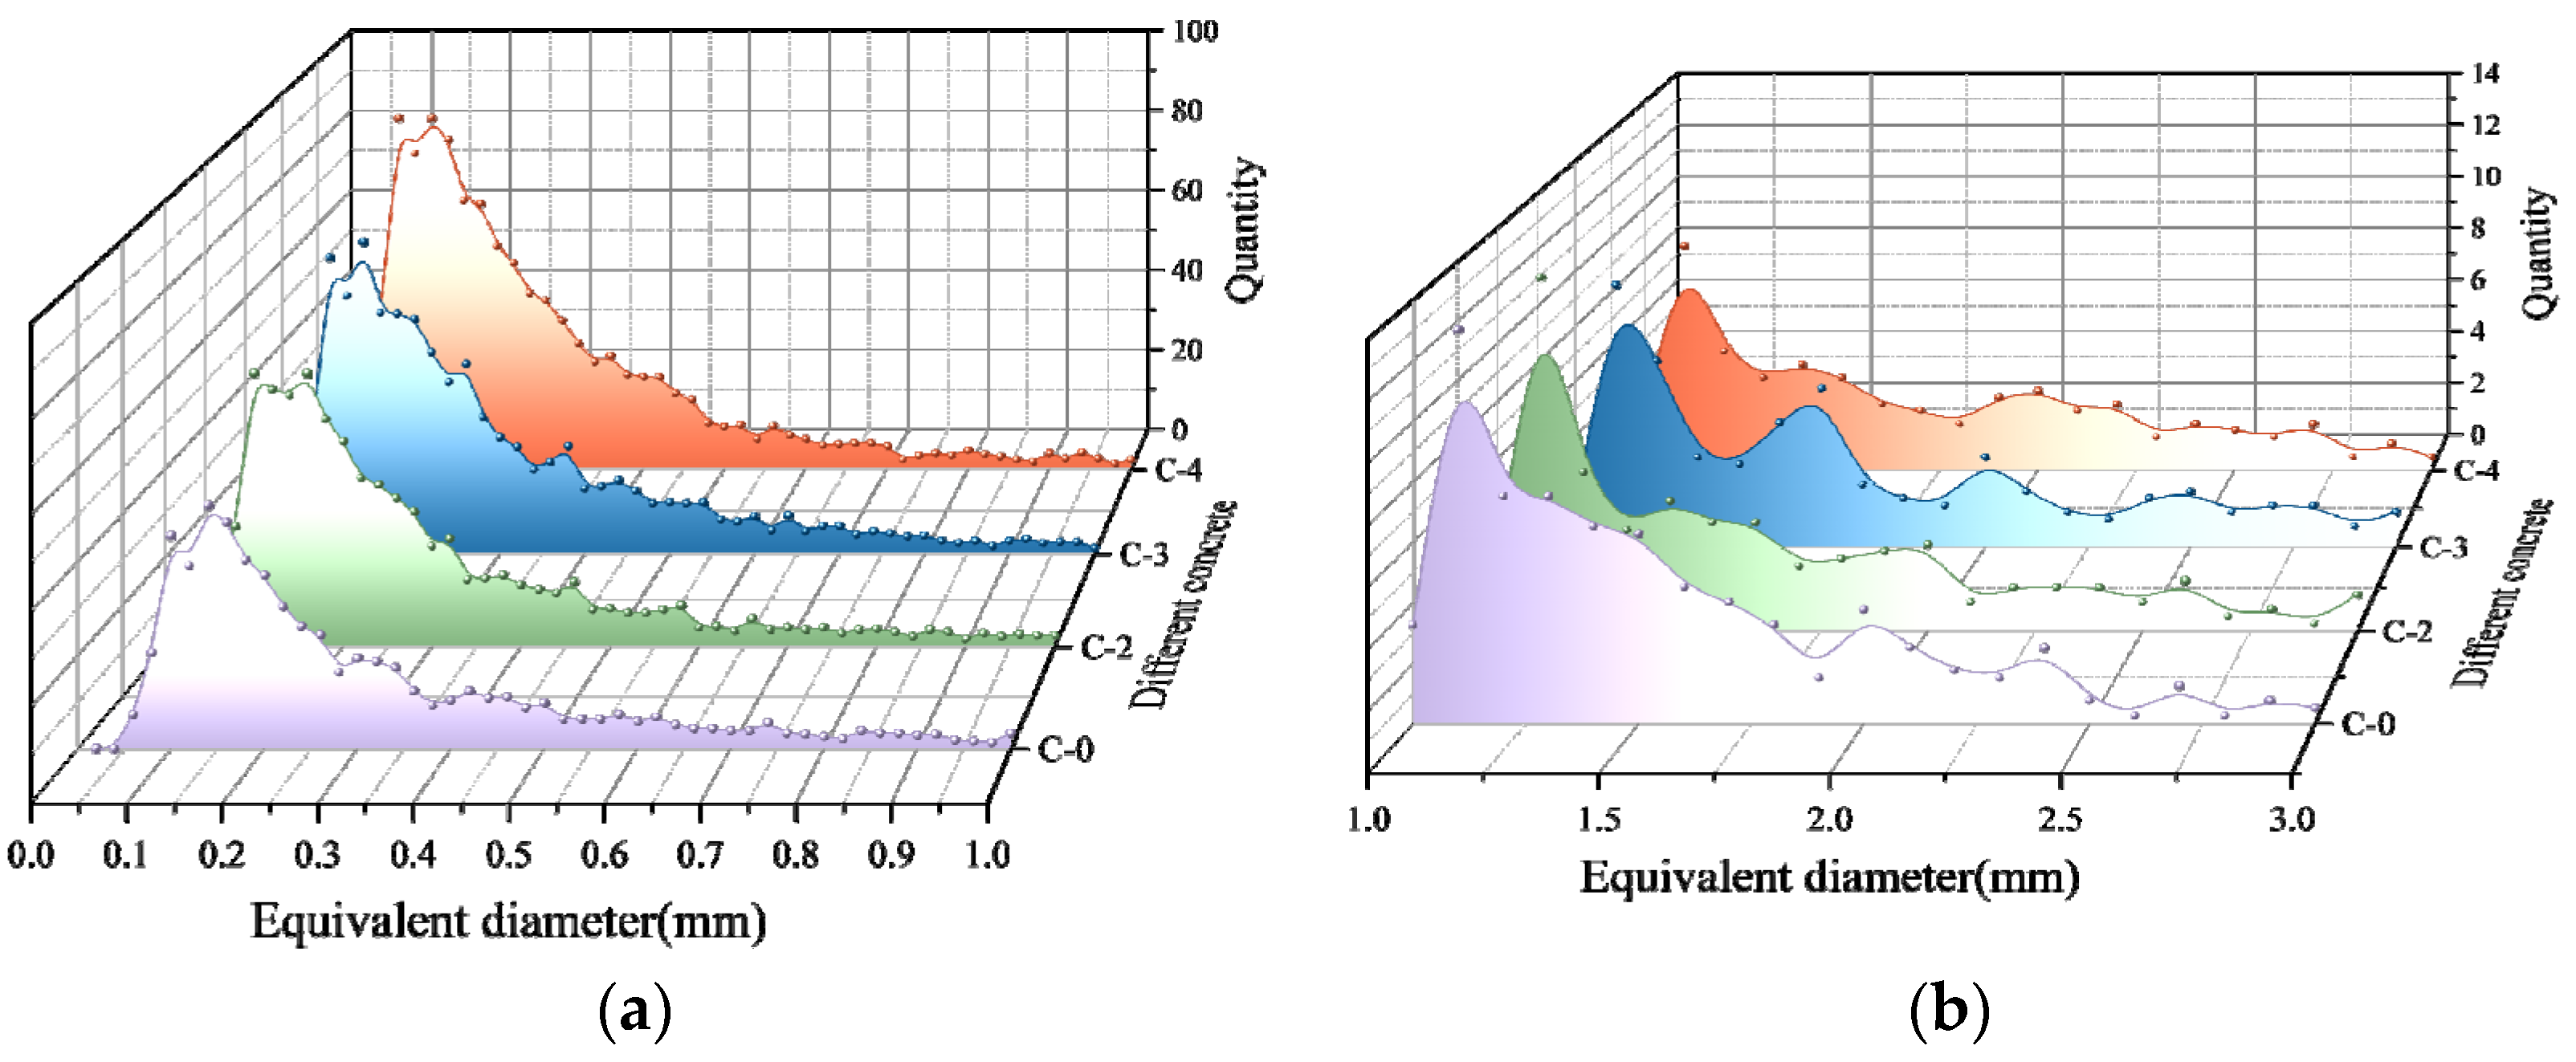
The pore gradation for each concrete is also investigated. All concrete has a bimodal pore size distribution, mainly composed of pores with an equivalent diameter between 50 μm and 500 μm, which is a main peak, and a smaller peak of pore diameters between around 1 mm and 2 mm. The pore gradation curves reveal that the vibration mixing process dramatically modified the pore structure by reducing the number of big pores and considerable increasing the amount of tiny pores.
(4)
The durability of all concrete has been studied. The findings indicate that, using the vibration mixing process, the positive change of the average size and number of pores improves the freezing-thawing resistance of concrete and the reduction of porosity, and the volume of permeable voids resulted in improved water permeability resistance of concrete.

Author Contributions

Conceptualization, F.Y. and Y.Y.; methodology, F.Y.; software, F.Y.; formal analysis, J.W.; investigation, X.W.; writing—original draft preparation, F.Y.; writing—review and editing, F.Y. and Y.Y.; supervision, Z.F. All authors have read and agreed to the published version of the manuscript.

Funding

This research received no external funding.

Institutional Review Board Statement

Not applicable.

Informed Consent Statement

Not applicable.

Data Availability Statement

Not applicable.

Acknowledgments

The authors gratefully acknowledge the support of the National Natural Science Foundation of China (No. 51208044) and the Natural Science Foundation of Shaanxi Province, China (No. 213025170173). All the authors of the following references are much appreciated.

Conflicts of Interest

The authors declare that they have no conflict of interest.

References

  1. Lo, T.Y.; Tang, W.; Cui, H. The effects of aggregate properties on lightweight concrete. Build. Environ. 2007, 42, 3025–3029. [Google Scholar] [CrossRef]
  2. Ke, Y.; Ortola, S.; Beaucour, A.-L.; Dumontet, H. Identification of microstructural characteristics in lightweight aggregate concretes by micromechanical modelling including the interfacial transition zone (ITZ). Cem. Concr. Res. 2010, 40, 1590–1600. [Google Scholar] [CrossRef]
  3. Djerbi, A. Effect of recycled coarse aggregate on the new interfacial transition zone concrete. Constr. Build. Mater. 2018, 190, 1023–1033. [Google Scholar] [CrossRef]
  4. Wu, K.; Shi, H.; Xu, L.; Ye, G.; De Schutter, G. Microstructural characterization of ITZ in blended cement concretes and its relation to transport properties. Cem. Concr. Res. 2015, 79, 243–256. [Google Scholar] [CrossRef]
  5. Powers, T.C.; Willis, T. The air requirement of frost resistant concrete. Highw. Res. Board Proc. 1949, 29, 184–211. [Google Scholar]
  6. Santos, A.R.; Veiga, M.D.R.; Silva, A.S.; de Brito, J.; Álvarez, J.I. Evolution of the microstructure of lime based mortars and influence on the mechanical behaviour: The role of the aggregates. Constr. Build. Mater. 2018, 187, 907–922. [Google Scholar] [CrossRef]
  7. Kang, S.-H.; Hong, S.-G.; Moon, J. The effect of superabsorbent polymer on various scale of pore structure in ultra-high performance concrete. Constr. Build. Mater. 2018, 172, 29–40. [Google Scholar] [CrossRef]
  8. Lian, H.; Shi, H. Clarification of a Hypothesis on ‘Centroplasm of Cement-based Composite’ Proposed by Wu Zhongwei. J. Chin. Ceram. Soc. 2020, 48, 167–176. [Google Scholar] [CrossRef]
  9. Du, L.; Folliard, K.J. Mechanisms of air entrainment in concrete. Cem. Concr. Res. 2005, 35, 1463–1471. [Google Scholar] [CrossRef]
  10. Shah, H.A.; Yuan, Q.; Zuo, S. Air entrainment in fresh concrete and its effects on hardened concrete—A review. Constr. Build. Mater. 2020, 274, 121835. [Google Scholar] [CrossRef]
  11. Comite Euro-International du Beton (CEB). Durable Concrete Structures Design Guide; Thomas Telford Services: London, UK, 1989. [Google Scholar]
  12. Wang, Y.; He, F.; Wang, J.; Wang, C.; Xiong, Z. Effects of calcium bicarbonate on the properties of ordinary Portland cement paste. Constr. Build. Mater. 2019, 225, 591–600. [Google Scholar] [CrossRef]
  13. Wu, Z.; Lian, H. High Performance Concrete, 1st ed.; China Railway Publishing House: Beijing, China, 1999. [Google Scholar]
  14. Mehta, P.K.; Monteiro, P. Concrete: Microstructure, Properties, and Materials; McGraw-Hill Education: NewYork, NY, USA, 2013. [Google Scholar]
  15. Pipilikaki, P.; Beazi-Katsioti, M. The assessment of porosity and pore size distribution of limestone Portland cement pastes. Constr. Build. Mater. 2009, 23, 1966–1970. [Google Scholar] [CrossRef]
  16. Alvarez, J.; Fernández, J.; Navarro-Blasco, I.; Duran, A.; Sirera, R. Microstructural consequences of nanosilica addition on aerial lime binding materials: Influence of different drying conditions. Mater. Charact. 2013, 80, 36–49. [Google Scholar] [CrossRef] [Green Version]
  17. Mindess, S.; Young, J.F. Concrete; Prentice Hall: Hoboken, NJ, USA, 2002. [Google Scholar]
  18. Schober, G. Porosity in autoclaved aerated concrete (AAC): A review on pore structure, types of porosity, measurement methods and effects of porosity on properties. In Proceedings of the 5th International Conference on Autoclaved Aerated Concrete, Bydgoscsz, Poland, 14–17 September 2011; Volume 39–43, pp. 351–359. [Google Scholar]
  19. Chang, P.-K.; Peng, Y.-N. Influence of mixing techniques on properties of high performance concrete. Cem. Concr. Res. 2001, 31, 87–95. [Google Scholar] [CrossRef]
  20. Beitzel, H.; Charonnat, Y. Assessment and classification of performance mixers. Mater. Struct. 2003, 36, 250–264. [Google Scholar] [CrossRef]
  21. Vandanjon, P.-O.; De Larrard, F.; Dehousse, B.; Villain, G.; Maillot, R.; Laplante, P. Homogenisation of concrete in a batch plant: The influence of mixing time and method on the introduction of mineral admixtures. Mag. Concr. Res. 2003, 55, 105–116. [Google Scholar] [CrossRef]
  22. Feng, Z.; Zhao, L.; Zhao, W.; Wang, W.; Yao, Y. Advanced Theory and Equipment of Production Concrete; China Communications Press: Beijing, China, 2016. [Google Scholar]
  23. Kovler, K.; Roussel, N. Properties of fresh and hardened concrete. Cem. Concr. Res. 2011, 41, 775–792. [Google Scholar] [CrossRef]
  24. Zhao, K.; Zhao, L.; Hou, J.; Zhang, X.; Feng, Z.; Yang, S. Effect of vibratory mixing on the slump, compressive strength, and density of concrete with the different mix proportions. J. Mater. Res. Technol. 2021, 15, 4208–4219. [Google Scholar] [CrossRef]
  25. Zhao, K.; Zhao, L.; Liu, S.; Hou, J. Effect of three-step mixing technology based on vibratory mixing on properties of high-strength concrete. IOP Conf. Series: Mater. Sci. Eng. 2019, 542, 12003. [Google Scholar] [CrossRef] [Green Version]
  26. Xiong, G.; Wang, C.; Zhou, S.; Jia, X.; Luo, W.; Liu, J.; Peng, X. Preparation of high strength lightweight aggregate concrete with the vibration mixing process. Constr. Build. Mater. 2019, 229, 116936. [Google Scholar] [CrossRef]
  27. Fu, C. Study on the Effect of Mixing Method on the air Content and Performance of Concrete. Ph.D. Thesis, Chang’an University, Xi’an, China, 2011. [CrossRef]
  28. Ke, G.; Ke, G.; Zhang, J.; Zhang, J.; Tian, B.; Tian, B.; Wang, J.; Wang, J. Characteristic analysis of concrete air entraining agents in different media. Cem. Concr. Res. 2020, 135, 106142. [Google Scholar] [CrossRef]
  29. Zhang, J.; Gao, X.; Yu, L. Improvement of viscosity-modifying agents on air-void system of vibrated concrete. Constr. Build. Mater. 2019, 239, 117843. [Google Scholar] [CrossRef]
  30. Chen, Y.; Al-Neshawy, F.; Punkki, J. Investigation on the effect of entrained air on pore structure in hardened concrete using MIP. Constr. Build. Mater. 2021, 292, 123441. [Google Scholar] [CrossRef]
  31. Hughes, D.C. Pore structure and permeability of hardened cement paste. Mag. Concr. Res. 1985, 37, 227–233. [Google Scholar] [CrossRef]
  32. Coletti, C.; Cultrone, G.; Maritan, L.; Mazzoli, C. Combined multi-analytical approach for study of pore system in bricks: How much porosity is there? Mater. Charact. 2016, 121, 82–92. [Google Scholar] [CrossRef]
  33. Moradian, M.; Hu, Q.; Aboustait, M.; Ley, M.T.; Hanan, J.C.; Xiao, X.; Scherer, G.W.; Zhang, Z. Direct observation of void evolution during cement hydration. Mater. Des. 2017, 136, 137–149. [Google Scholar] [CrossRef]
  34. Song, Y.; Zhou, J.-W.; Bian, Z.-N.; Dai, G.-Z. Pore Structure Characterization of Hardened Cement Paste by Multiple Methods. Adv. Mater. Sci. Eng. 2019, 2019, 1–18. [Google Scholar] [CrossRef] [Green Version]
  35. Lyu, K.; She, W.; Miao, C.; Chang, H.; Gu, Y. Quantitative characterization of pore morphology in hardened cement paste via SEM-BSE image analysis. Constr. Build. Mater. 2019, 202, 589–602. [Google Scholar] [CrossRef]
  36. Gao, L.; Ni, F.; Luo, H.; Charmot, S. Characterization of air voids in cold in-place recycling mixtures using X-ray computed tomography. Constr. Build. Mater. 2015, 84, 429–436. [Google Scholar] [CrossRef]
  37. Yun, T.S.; Kim, K.Y.; Choo, J.; Kang, D.H. Quantifying the distribution of paste-void spacing of hardened cement paste using X-ray computed tomography. Mater. Charact. 2012, 73, 137–143. [Google Scholar] [CrossRef]
  38. Zhao, Y.; Wang, X.; Jiang, J.; Zhou, L. Characterization of interconnectivity, size distribution and uniformity of air voids in porous asphalt concrete using X-ray CT scanning images. Constr. Build. Mater. 2019, 213, 182–193. [Google Scholar] [CrossRef]
  39. Tian, W.; Cheng, X.; Liu, Q.; Yu, C.; Gao, F.; Chi, Y. Meso-structure segmentation of concrete CT image based on mask and regional convolution neural network. Mater. Des. 2021, 208, 109919. [Google Scholar] [CrossRef]
  40. European Standard EN 480-11; Admixtures for Concrete, Mortar and Grout—Test Methods—Part 11: Determination of Air Void Characteristics in Hardened Concrete. European Committee for Standardization (CEN): Brussels, Belgium, 2005.
  41. ASTM C457/C457M-11; Standard Test Method for Microscopical Determination of Parameters of the Air-Void System in Hardened Concrete. ASTM International: West Conshohocken, PA, USA, 2011.
  42. Chung, S.-Y.; Sikora, P.; Rucinska, T.; Stephan, D.; Elrahman, M.A. Comparison of the pore size distributions of concretes with different air-entraining admixture dosages using 2D and 3D imaging approaches. Mater. Charact. 2020, 162, 110182. [Google Scholar] [CrossRef]
  43. Mayercsik, N.P.; Felice, R.; Ley, M.T.; Kurtis, K. A probabilistic technique for entrained air void analysis in hardened concrete. Cem. Concr. Res. 2014, 59, 16–23. [Google Scholar] [CrossRef]
  44. Molendowska, A.; Wawrzeńczyk, J.; Kowalczyk, H. Development of the Measuring Techniques for Estimating the Air Void System Parameters in Concrete Using 2D Analysis Method. Materials 2020, 13, 428. [Google Scholar] [CrossRef] [Green Version]
  45. Song, Y.; Shen, C.; Damiani, R.M.; Lange, D.A. Image-based restoration of the concrete void system using 2D-to-3D unfolding technique. Constr. Build. Mater. 2020, 270, 121476. [Google Scholar] [CrossRef]
  46. Özcan, F.; Koç, M.E. Influence of ground pumice on compressive strength and air content of both non-air and air entrained concrete in fresh and hardened state. Constr. Build. Mater. 2018, 187, 382–393. [Google Scholar] [CrossRef]
  47. Song, Y.; Zou, R.; Castaneda, D.I.; Riding, K.A.; Lange, D.A. Advances in Measuring Air-Void Parameters in Hardened Concrete Using a Flatbed Scanner. J. Test. Eval. 2017, 45, 1713–1725. [Google Scholar] [CrossRef]
  48. Fonseca, P.C.; Scherer, G.W. An image analysis procedure to quantify the air void system of mortar and concrete. Mater. Struct. 2014, 48, 3087–3098. [Google Scholar] [CrossRef] [Green Version]
  49. Murotani, T.; Igarashi, S.; Koto, H. Distribution analysis and modeling of air voids in concrete as spatial point processes. Cem. Concr. Res. 2018, 115, 124–132. [Google Scholar] [CrossRef]
  50. Thomas, C.; Setién, J.; Polanco, J.; de Brito, J.; Fiol, F. Micro- and macro-porosity of dry- and saturated-state recycled aggregate concrete. J. Clean. Prod. 2018, 211, 932–940. [Google Scholar] [CrossRef]
  51. Yao, Y.; Feng, Z.; Chen, S. Strength of concrete reinforced using double-blade mixer. Mag. Concr. Res. 2013, 65, 787–792. [Google Scholar] [CrossRef]
  52. ASTMC642-13; Standard Test Method for Density, Absorption, and Voids in Hardened Concrete. ASTM International: West Conshohocken, PA, USA, 2013.
  53. CNS, GB/T 50082-2009; Standard for Test Methods of Long-Term Performance and Durability of Ordinary Concrete. China National Standard: Beijing, China, 2009.
  54. Kurata, Y.; Ryosuke, S.; Tomoaki, K.; Takashi, K.; Muto, K.; Ito, Y. Disappearance of Air Bubbles in Concrete Structures (Theoretical Suggestions and Experimental Verification). J. IHI Technol. 2019, 59, 97–106. [Google Scholar]
  55. Shi, D.; Brown, P.W.; Kurtz, S. A Model for the Distribution of Pore Sizes in Cement Paste. MRS Online Proc. Library 1988, 137, 23–34. [Google Scholar] [CrossRef]
  56. Payton, E. Revisiting Sphere Unfolding Relationships for the Stereological Analysis of Segmented Digital Microstructure Images. J. Miner. Mater. Charact. Eng. 2012, 11, 221–242. [Google Scholar] [CrossRef]
Figure 1. The twin-shaft vibration mixer.
Buildings 12 01142 g001
Figure 2. Schematic diagram of the phenomenon of cement agglomeration destroyed by vibration mixing process.
Buildings 12 01142 g002
Figure 3. The detailed mixing procedure.
Buildings 12 01142 g003
Figure 4. Sequence of specimen preparation.
Buildings 12 01142 g004
Figure 5. The flatbed scanner used in the research.
Buildings 12 01142 g005
Figure 6. Results of the volume of permeable voids.
Buildings 12 01142 g006
Figure 7. The irregular cross-section of the air pores.
Buildings 12 01142 g007
Figure 8. Schematic diagram of the change of air bubbles during vibration mixing process.
Buildings 12 01142 g008
Figure 9. Pore size distribution analyzed by digital image analysis. (a) The equivalent diameter between 50 μm and 1 mm. (b) The equivalent diameter greater than 1 mm.
Buildings 12 01142 g009
Figure 10. The mass loss rate of concrete after freeze-thaw cycles.
Buildings 12 01142 g010
Figure 11. Evolution of the depth of water penetration.
Buildings 12 01142 g011
Table 1. Mix proportions of concrete (kg/m3).
w/c RatioCementWaterFine AggregateCoarse Aggregate
4.75–9.5 mm9.5–16 mm16–19 mm
0.46467215566460483207
Table 2. The main parameters of pore system in different concrete.
Porosity (%)MeanQuantityMeanSize (μm)MeanSpecific Surface Area (mm−1)Mean
C-012.351.80714688457.6413.47.417.94
21.94825389.68.22
31.33554419.17.87
41.65598425.37.67
51.75748375.28.51
C-211.821.53857817399.5385.78.598.57
21.67739406.67.53
31.49892368.29.22
41.40924376.88.90
51.26673377.48.59
C-311.541.381127954346.3362.010.079.26
21.381005352.09.19
31.61958384.18.86
41.20886364.08.97
51.19793363.79.23
C-411.341.2814011122302.2327.910.879.80
21.22975339.39.23
31.29882358.09.02
41.411284316.010.07
51.141067324.29.82
Table 3. The results of the ANOVA.
DFSum of SquaresMean SquareF Valuep Value
PorosityModel30.775260.258424.335360.0204
Error160.953720.05961
Total191.72898
QuantityModel3519,557.4173,185.88.055050.0017
Error16344,004.421,500.275
Total19863,561.8
SizeModel319,694.81756564.9391713.24821.32693 × 10−4
Error167928.552495.5345
Total1927,623.3695
Publisher’s Note: MDPI stays neutral with regard to jurisdictional claims in published maps and institutional affiliations.

