Article

Quantification of Vertical Irregularities for Earthquake Resistant Reinforced Concrete Buildings

by
Omar Nady
1,*,
Sameh Youssef Mahfouz
1 and
Salah El-Din Fahmy Taher
2
1
Construction and Building Engineering Department, Arab Academy for Science Technology and Maritime Transport, Smart Village, Cairo 12577, Egypt
2
Structural Engineering Department, College of Engineering, Tanta University, Tanta 31527, Egypt
*
Author to whom correspondence should be addressed.
Buildings 2022, 12(8), 1160; https://doi.org/10.3390/buildings12081160
Submission received: 23 June 2022 / Revised: 23 July 2022 / Accepted: 30 July 2022 / Published: 3 August 2022
(This article belongs to the Collection Structural Analysis for Earthquake-Resistant Design of Buildings)

Abstract

:
In modern urban construction, irregular buildings are increasingly constructed to fulfill architectural and functional requirements. However, these buildings revealed unfavorable seismic performance during the past earthquake records. When the seismic design codes deal with the issue of building irregularity, little attention is paid to the location of irregularity. In the current study, a detailed structural analysis was performed to investigate the effects of the location of mass, stiffness, setback, and combined irregularities on the structural seismic response of twelve irregular building models. Based on the dynamic properties of the building, an irregularity index is proposed to quantify the effects of the magnitude and location of various types of vertical irregularities. The proposed index was able to successfully quantify all types of vertical irregularities.

Graphical Abstract

1. Introduction

Earthquakes, as natural catastrophic events, are often associated with socio-economic impacts [1,2]. During the past earthquake records, irregular buildings showed bad seismic performance [3,4,5,6,7,8,9]. Most seismic design codes (IS 1893:2002, EC8 2004, UBC 97, NBCC 2005, IBC 2003, ASCE 2002, TEC 2007, ECP-201:2012) [10,11,12,13,14,15,16,17] recommend different limits for the building irregularities. However, these design codes quantify the irregularities in terms of magnitude, neglecting the influence of irregularity location.
Several researchers investigated the influence of the magnitudes and locations of vertical irregularities on the seismic response of the buildings [18,19,20,21,22,23,24]. Accordingly, they proposed indices to quantify the degree of vertical irregularities. The first efforts were made by Karavasilis et al. [18] to examine the effect of changes in setback configuration on the deformation demands (i.e., maximum roof displacement and maximum drift) of steel moment-resisting frames (MRF). They found that the geometrical configurations of setbacks influence the height-wise distribution of deformation demands. They also proposed two indices based on the building geometry to quantify the effect of setback irregularities. Roy and Mahato [19] modified the indices proposed by Karavasilis et al. [18] to make them valid for reinforced concrete (RC) stepped frames. Sarkar et al. [20] proposed an irregularity index based on the first mode participation factor to quantify the degree of vertical irregularity for stepped frames. Furthermore, they suggested an empirical equation to determine the fundamental time period of stepped frames as a function of the irregularity index. This equation was confirmed by the modal analysis of seventy-eight stepped frames. Varadharajan et al. [21] investigated the seismic response of short-period buildings with irregular setback frames. According to the study results, short-period structures showed higher reactions than long-period structures. Bhosale et al. [22] quantified the degree of vertical irregularity for RC stepped frames, setback frames, open ground story frames, and floating column frames. They proposed an index based on the effective modal mass and first mode participation factors. The first mode participation factor was considered an appropriate measure to quantify vertical irregularity for the investigated frames. Rathnasiri et al. [23] proposed an index to quantify the degree of vertical irregularity of RC buildings. The index was based on the modal base shear. The authors found that the index accurately assessed the degree of irregularity in stepped frames, floating column frames, and setback frames. Siva Naveen et al. [24] investigated the seismic response of RC frames with various types of vertical irregularities (i.e., mass, stiffness, and setback irregularities). They found that certain combinations of irregularities reduced the structural response compared to the regular structures subjected to seismic forces. The combination of stiffness and vertical geometric irregularities produced the highest displacement response.
Despite the efforts of the researchers to investigate the effects of the vertical irregularities on the structural response, little attention was paid to considering the irregularity location [25,26]. Moreover, few researchers considered the impact of mass, stiffness, and combined irregularities [24,26] and, accordingly, the quantification of the proposed indices was limited to setback irregularities only [18,19,20,21].
Thus, the main objective of the current study is to investigate the influence of the location of various vertical irregularities (i.e., mass, stiffness, setback, and combined irregularities) on the maximum structural response. The current study also aims to acquire an irregularity index to quantify various types of vertical irregularities depending on the structural dynamic features (i.e., mass and stiffness). To this end, twelve three-dimensional RC MRFs were analyzed using the finite element software program ETABS by applying linear static analysis (i.e., equivalent static load method) and linear dynamic analysis (i.e., response spectrum and time history methods).

2. Methodology

In the current study, seismic responses of various vertical irregular MRFs were obtained numerically using finite element software (ETABS), by applying the equivalent static load method (ESL), response spectrum method (RS), and the time history method (TH). These methods are summarized in the following sub-sections. The major input data are as follows: the seismic zone in Cairo city is classified as zone 3 in ECP-201 [17], and the shape of the spectrum is type (1). The structures are classified as residential structures with a significant factor = 1. The soil is classified as stiff soil with a soil class of C. The vertical loads are considered when the reduction factor R = 5 is used, and the frame structure resists the total base shear without using shear walls or bracings [27].

2.1. Equivalent Static Load (ESL) Method

The ESL method was utilized in the initial design stage to calculate the design internal forces of structural elements by applying linear elastic analysis of the structure. This method is applied to regular structures whose dynamic response is mainly affected by the fundamental vibration waves of the structure in each plane.

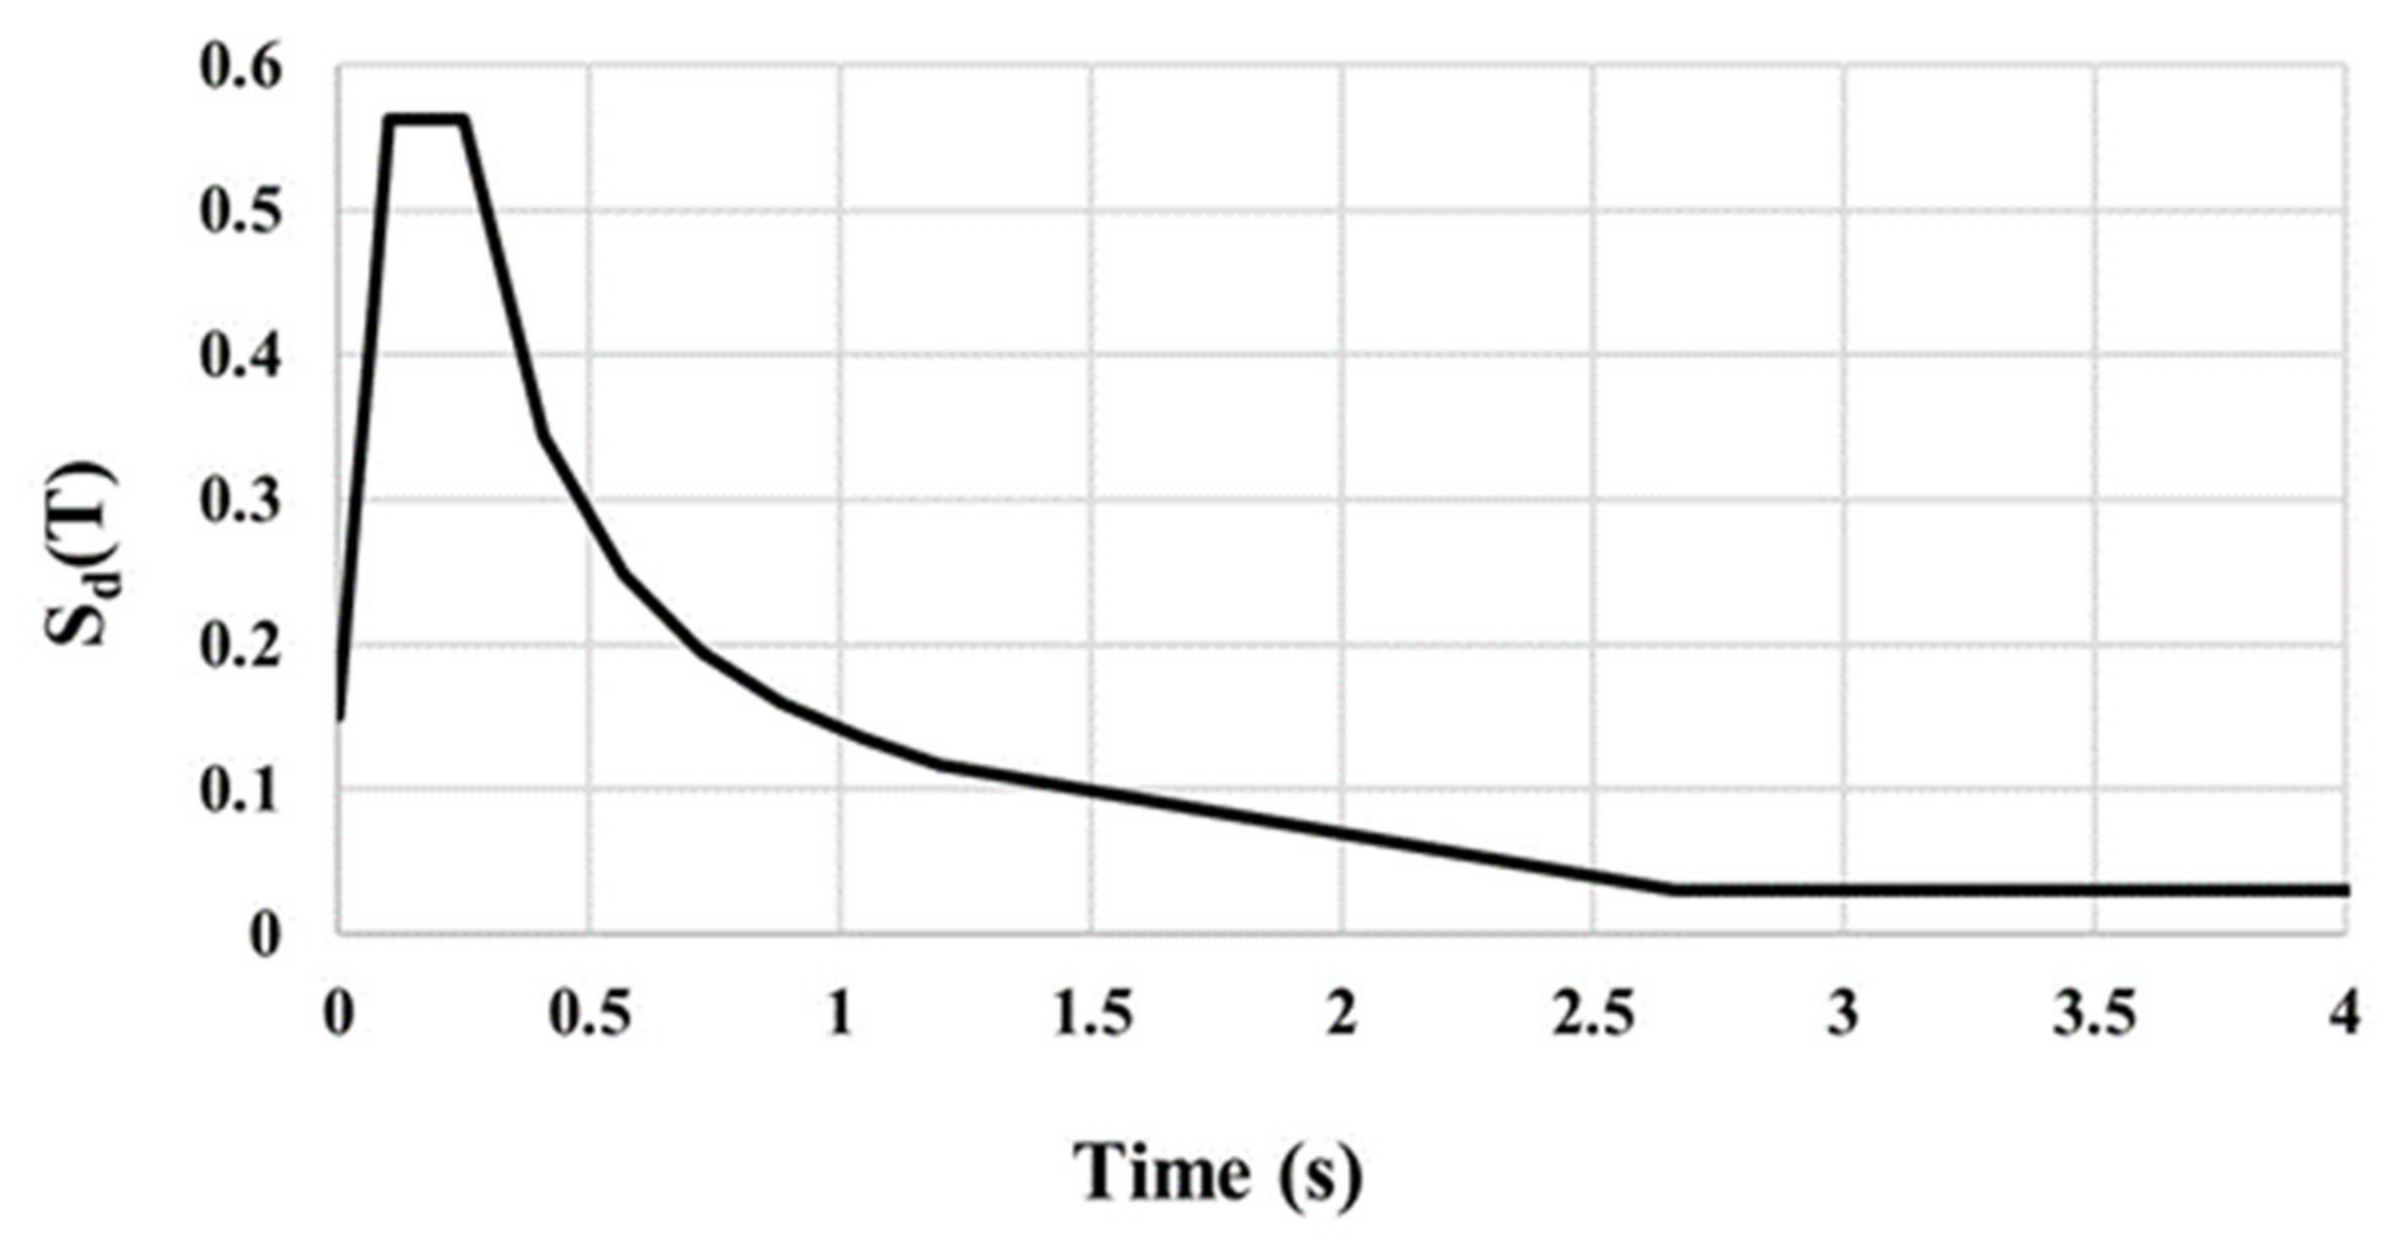
2.2. Response Spectrum (RS) Method

The RS method can be applied to regular and irregular structures. RS provides several vibration modes to capture at least 90% of the structure’s mass in each direction [28]. Figure 1 shows the elastic design RS curve applied in the current study. The elastic RS is modified by introducing a strength reduction factor R to indicate an inelastic response demand or an estimated damage level demand of the entire structure caused during the earthquake excitation [29].

2.3. Time History Analysis (TH) Method

The time-history method (TH) is by far the most comprehensive method for seismic analysis. The earthquake record in the form of acceleration time history is introduced at the base of the structure [30]. The structure’s response is calculated at each instant of the earthquake. Furthermore, this method is equivalent to getting 100% mass participation in each direction. The time history analysis method determines the responses of the structure using the numerical integration of the differential equation of motion:
k x t + c x . t + m x . . t = f t
where k , c , m represent the stiffness, viscosity, and mass matrices of the structure, respectively; x t , x . t , x . . t represent the displacement, velocity, and acceleration of the structure, respectively; f t are the external forces that occur at a given time [31]. Equation (1) is repeated until equilibrium is reached. The drawback of the TH method is that the results are limited to particularly studied earthquakes, so the results would be radically different if different earthquake records are used. Therefore, different time runs must be used to provide a more comprehensive view of the reaction. In the current study, the time-history analysis was performed using the direct-integration transient analysis technique to solve the equations of motion considering a time step of 0.005 s. To numerically integrate the equations, the Newmark technique is utilized. The default parameters Gamma = 0.50 and Beta = 0.25 are assumed for the analyses. A constant damping ratio of 0.05 has been used for the studied models.

Selecting and Scaling Ground Motion Records

Several recent studies have proposed various methods for selecting a collection of records based on the location’s seismological features [32,33,34,35,36,37]. The method described here scales the magnitude of ground motion data using a multiplication factor. Hence, the RS of the modified records matches the target spectrum specified in the ECP-201 design criteria. According to ECP-201, if three ground motion records are used, the findings should be the maximum value of the three ground motions. The code further specifies that if seven ground motions records are used, the findings should be the average of the seven ground motions. In the current research analysis, seven earthquake records were used, and these records were obtained from the pacific earthquake engineering research center (PEER 2012) [38] as follows: (a) Gulf of Aqaba earthquake in Hadera; (b) Gulf of Aqaba earthquake in Eilat; (c) El Centro earthquake in Imperial Valley; (d) N. Palm Springs earthquake in Morongo Valley Fire Station; (e) Morgan Hill earthquake in Gilroy Array #6; (f) Cape Mendocino earthquake in Cape Mendocino; (g) Northridge-01 earthquake in Rinaldi. The acceleration time histories of these records are illustrated in Table 1.

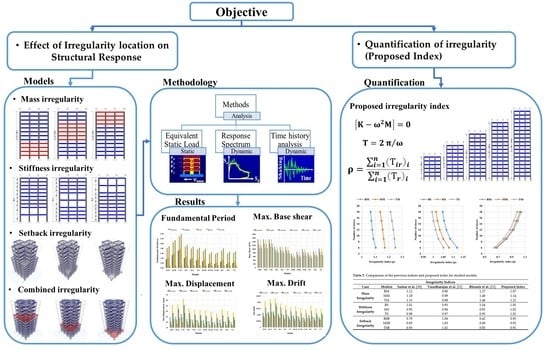
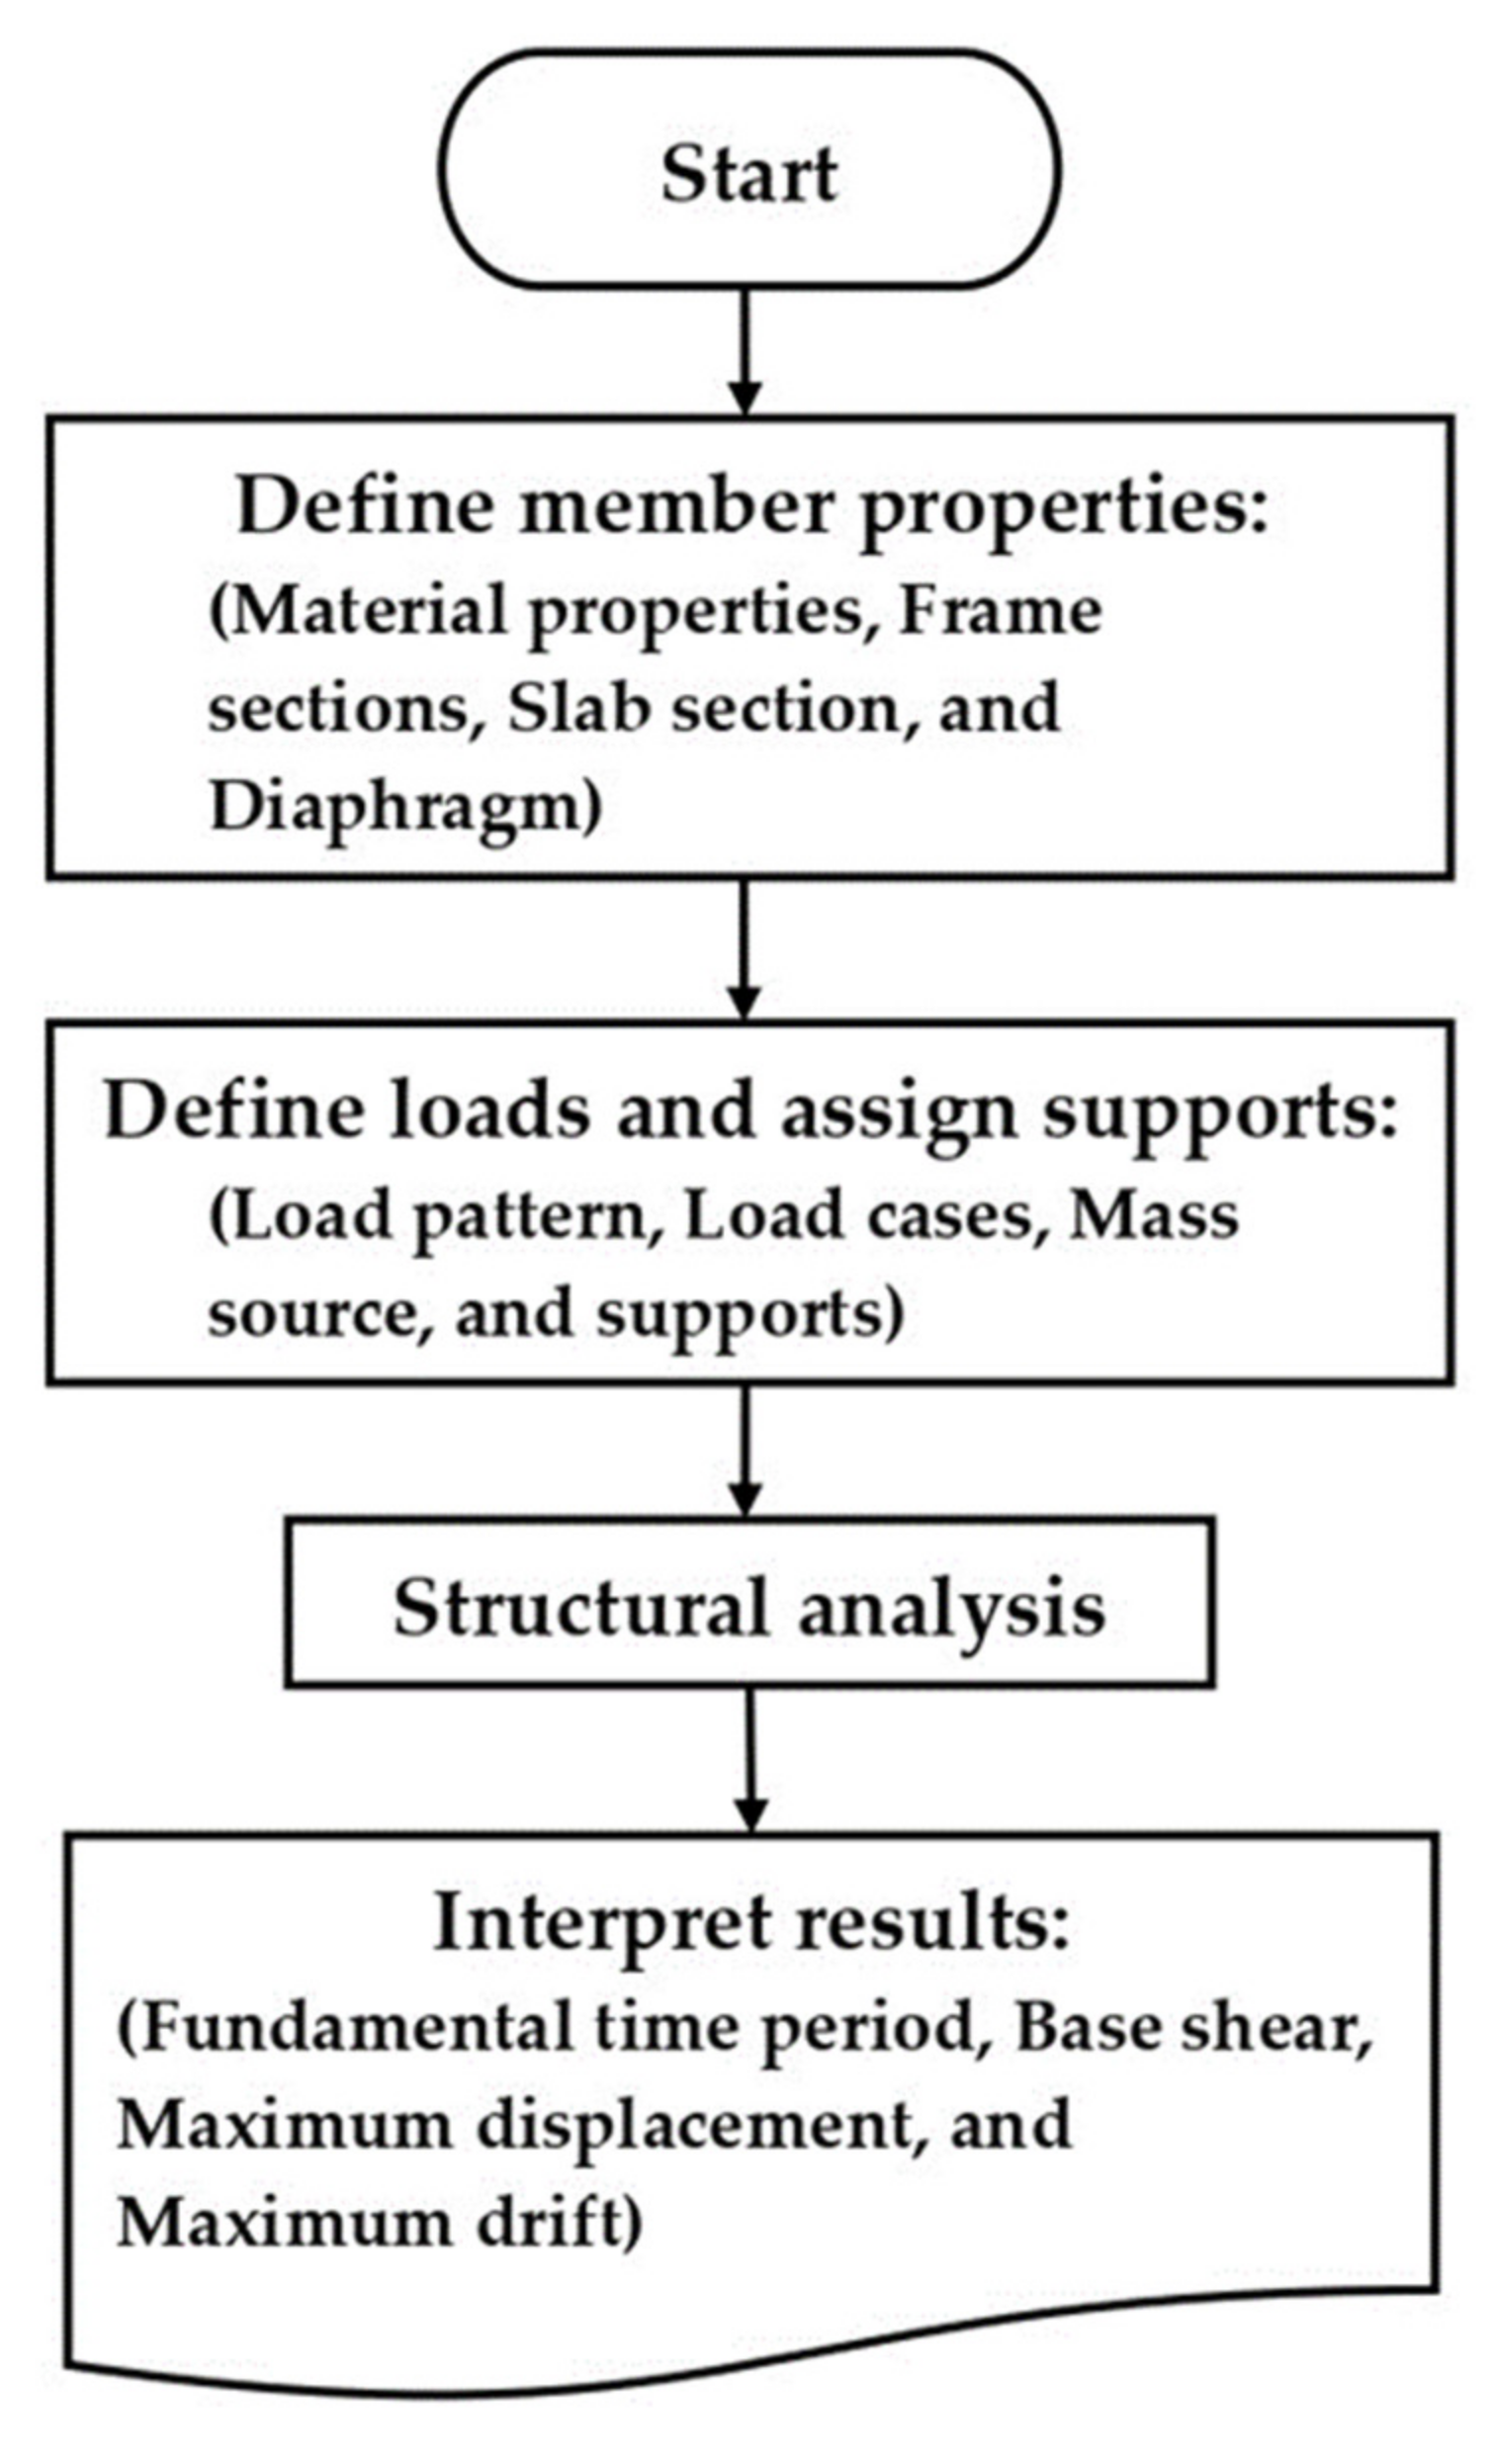
3. Finite Element Modeling

Three-dimensional structures were mathematically modeled and analyzed using the finite element software program ETABS [39]. These models adequately depicted the spatial distribution of the structure’s mass and stiffness to compute the dynamic response of the structure. The beams and columns were handled as frame elements with rigid joints. This model considers the flexural stiffness of the beam and beam-column joint dimensions, as well as the stiffness of the panel zone. This model also considers the distribution of shear forces, flexural moments, and axial forces. As a result, it could be able to determine the distribution of seismic design demands more accurately.
The slabs were modeled as shell elements with rigid floor diaphragms to distribute the loads uniformly to the columns. In-plane membrane stiffness and out-of-plane bending stiffness were considered [40]. Rigid foundations were assumed for the structures under consideration. Therefore, the soil-foundation interaction and foundation flexibility effects were ignored. The steps for structural modeling with ETABS are illustrated in the next Figure 2.

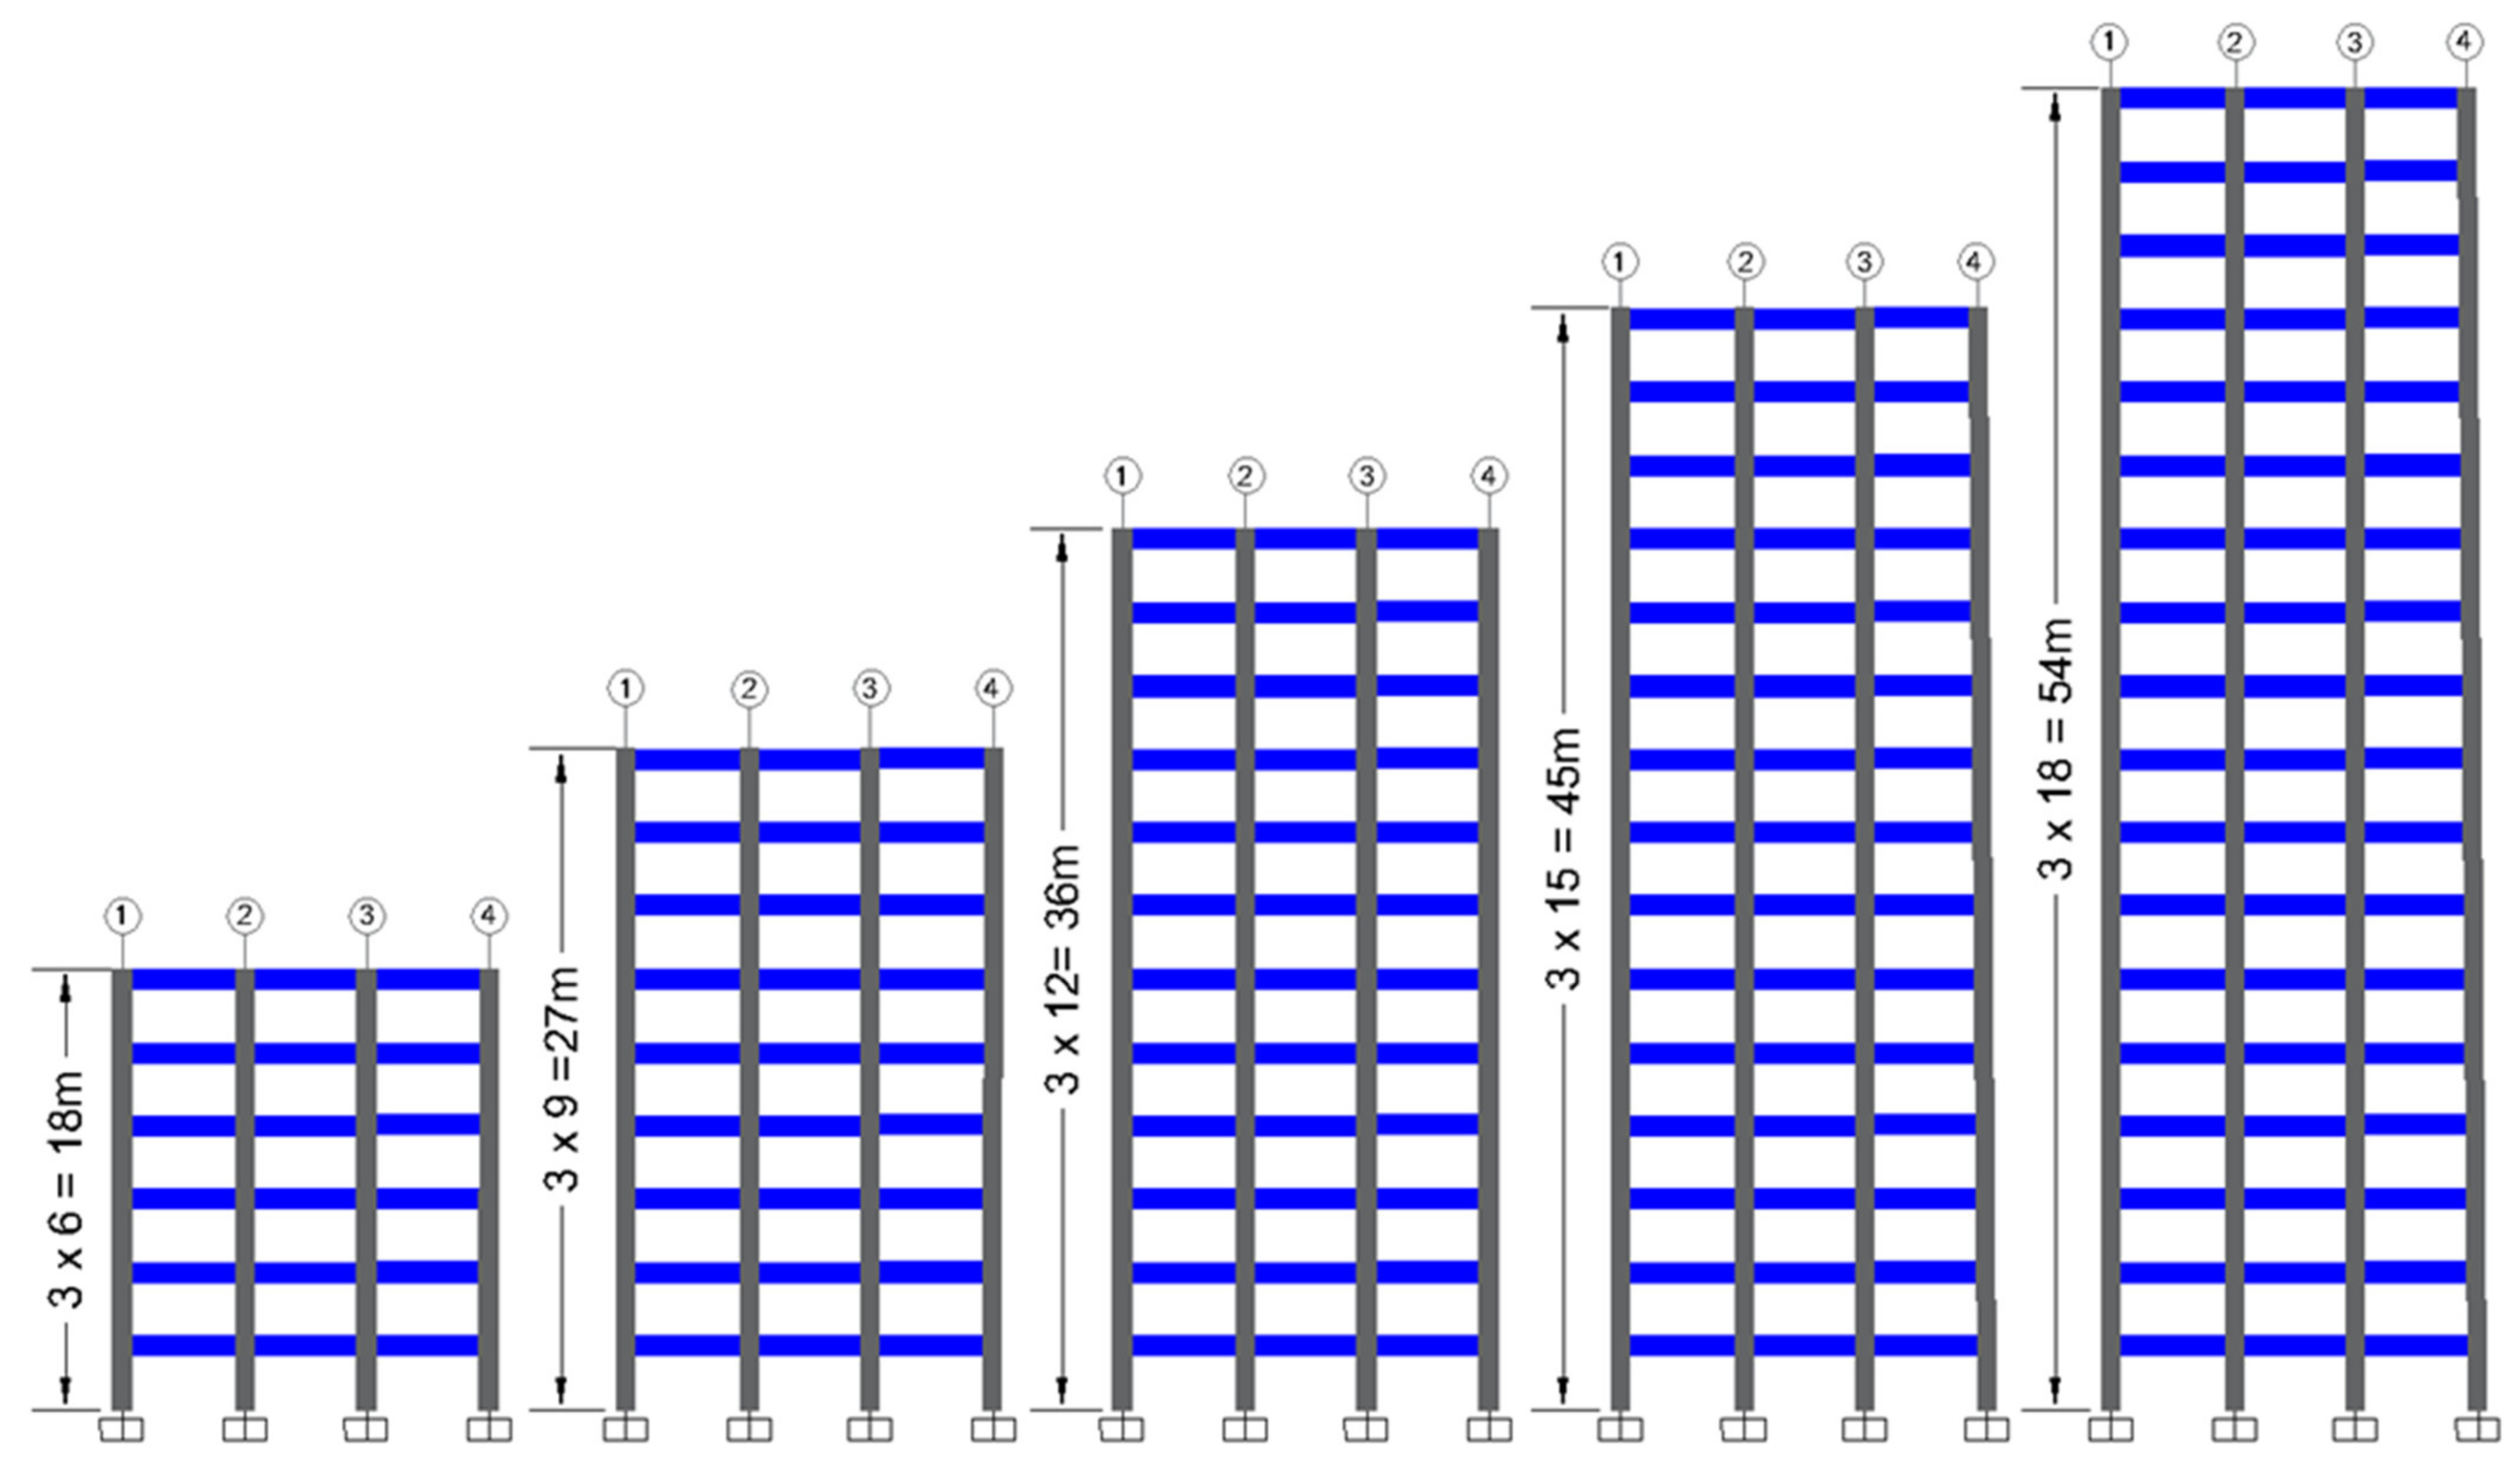
4. Description of Structural Models

Throughout the last two decades, medium-rise RC buildings have been widely used in Egypt’s construction environment. These buildings were constructed with different structural horizontal and vertical irregularities. In this research, simulated irregular MRF buildings with twelve stories were investigated. Various types of irregularities were considered. The layout of each building is bi-symmetric in the plan, with three equal bays. The bay width is 5 m, and the typical story height is 3 m. The beams are assumed to be on grid lines. The building’s structural elements were initially designed in accordance with ECP-201 to withstand the static forces. The cross-sections of columns, beams, and slabs are tabulated in Table 2. These elements were tested against seismic conditions using the Egyptian code for load and forces [17] to ensure that the ECP-201 requirements are achieved while taking earthquake loads into account. The characteristic strength of concrete f cu is 25 N/mm2, and the yield strength of high-grade steel f y is 360 N/mm2. The specific weight of concrete γ c is 25 kN/m3, and the concrete elasticity modulus E c is calculated as follows:
E c = ( 4400 f cu )   N / mm 2
The steel elastic modulus E s is 200 kN/mm2. The ratios of Poisson μ for concrete and steel are equal to 0.2 and 0.3, respectively. The assigned flooring cover load is 1.5 kN/m2, and the own weight of the building elements is automatically computed using ETABS. The live load is 2.5 kN/m2 as recommended by ECP-201.

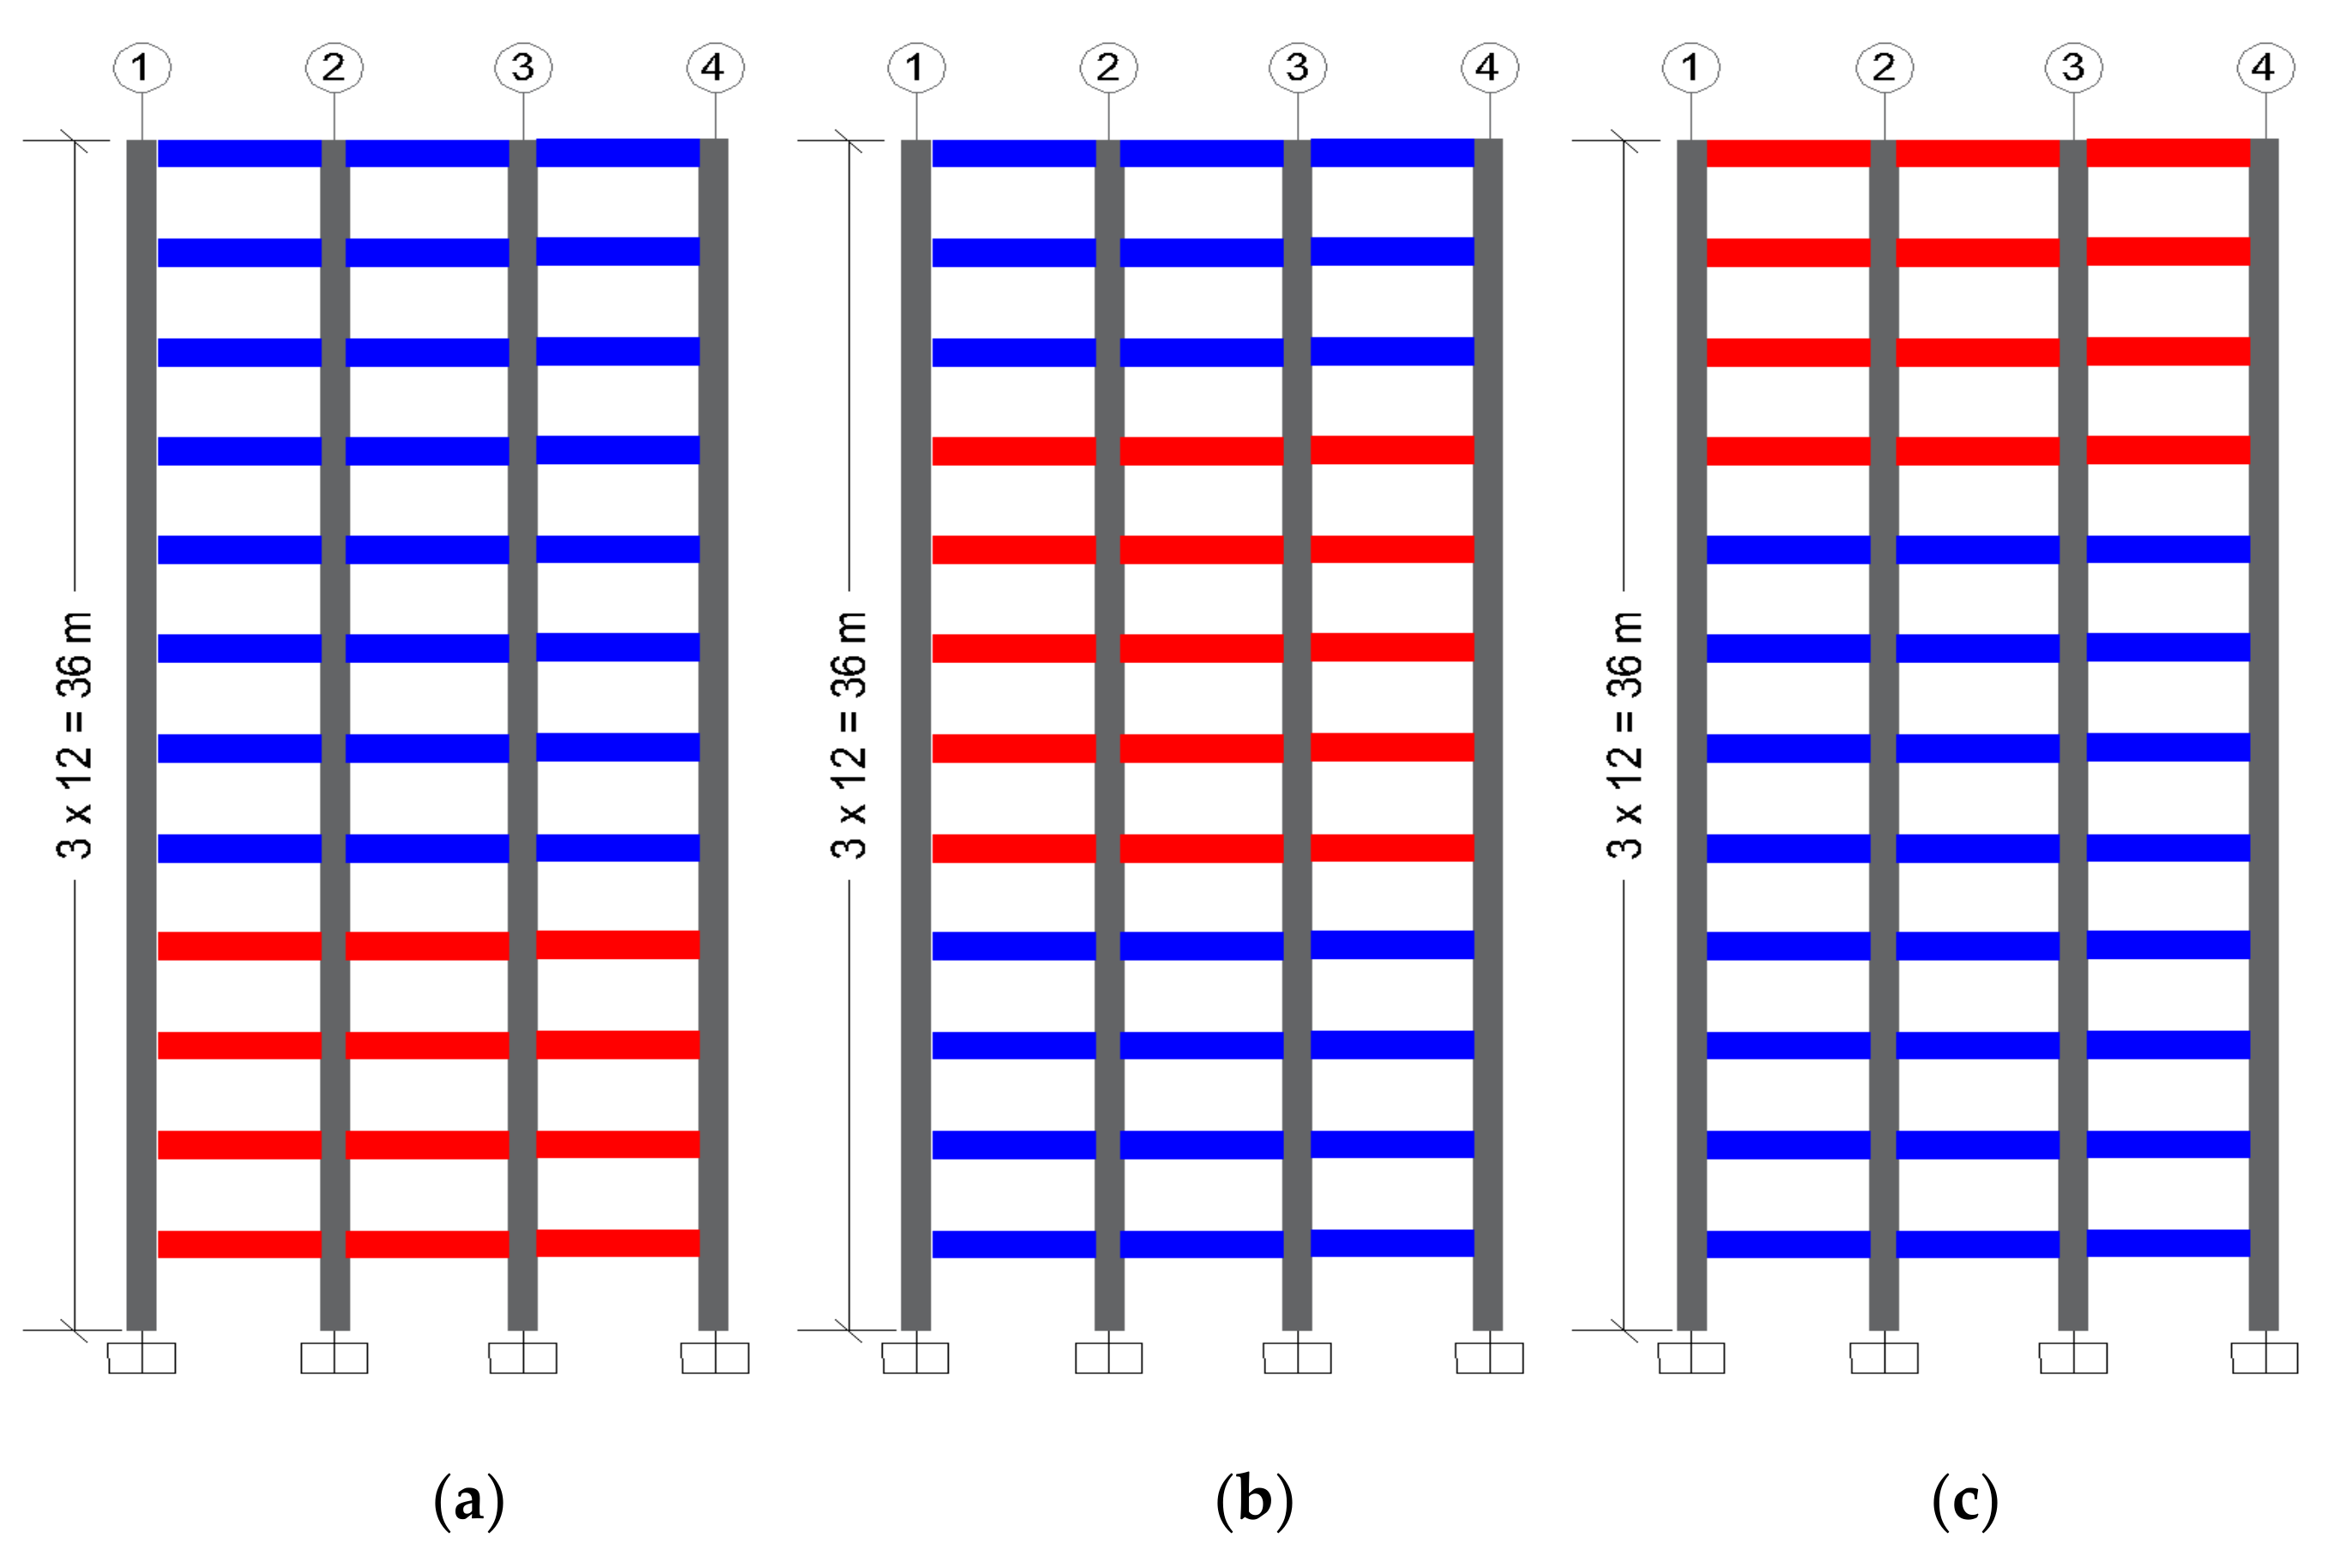
4.1. Models with Mass Irregularity

Three different locations of mass irregularities were considered for the same building: (a) bottom mass (BM) model (i.e., bottom one-third of the building with heavy mass); (b) middle mass (MM) model (i.e., middle one-third of the building with heavy mass); and (c) top mass (TM) model, (i.e., top one-third of the building with heavy mass). The descriptions of building models with mass irregularities are described in Table 2 and Figure 3.

4.2. Models with Stiffness Irregularity

Three different locations of stiffness irregularity were considered for the same building, where three model cases were investigated: (a) bottom stiffness (BS) model (i.e., bottom one-third of the building with stiffness irregularity); (b) middle stiffness (MS) model, (i.e., middle one-third of the building with stiffness irregularity); and (c) top stiffness (TS) model, (i.e., top one-third of the building with stiffness irregularity). The descriptions of building models with stiffness irregularities are described in Table 2 and Figure 4.

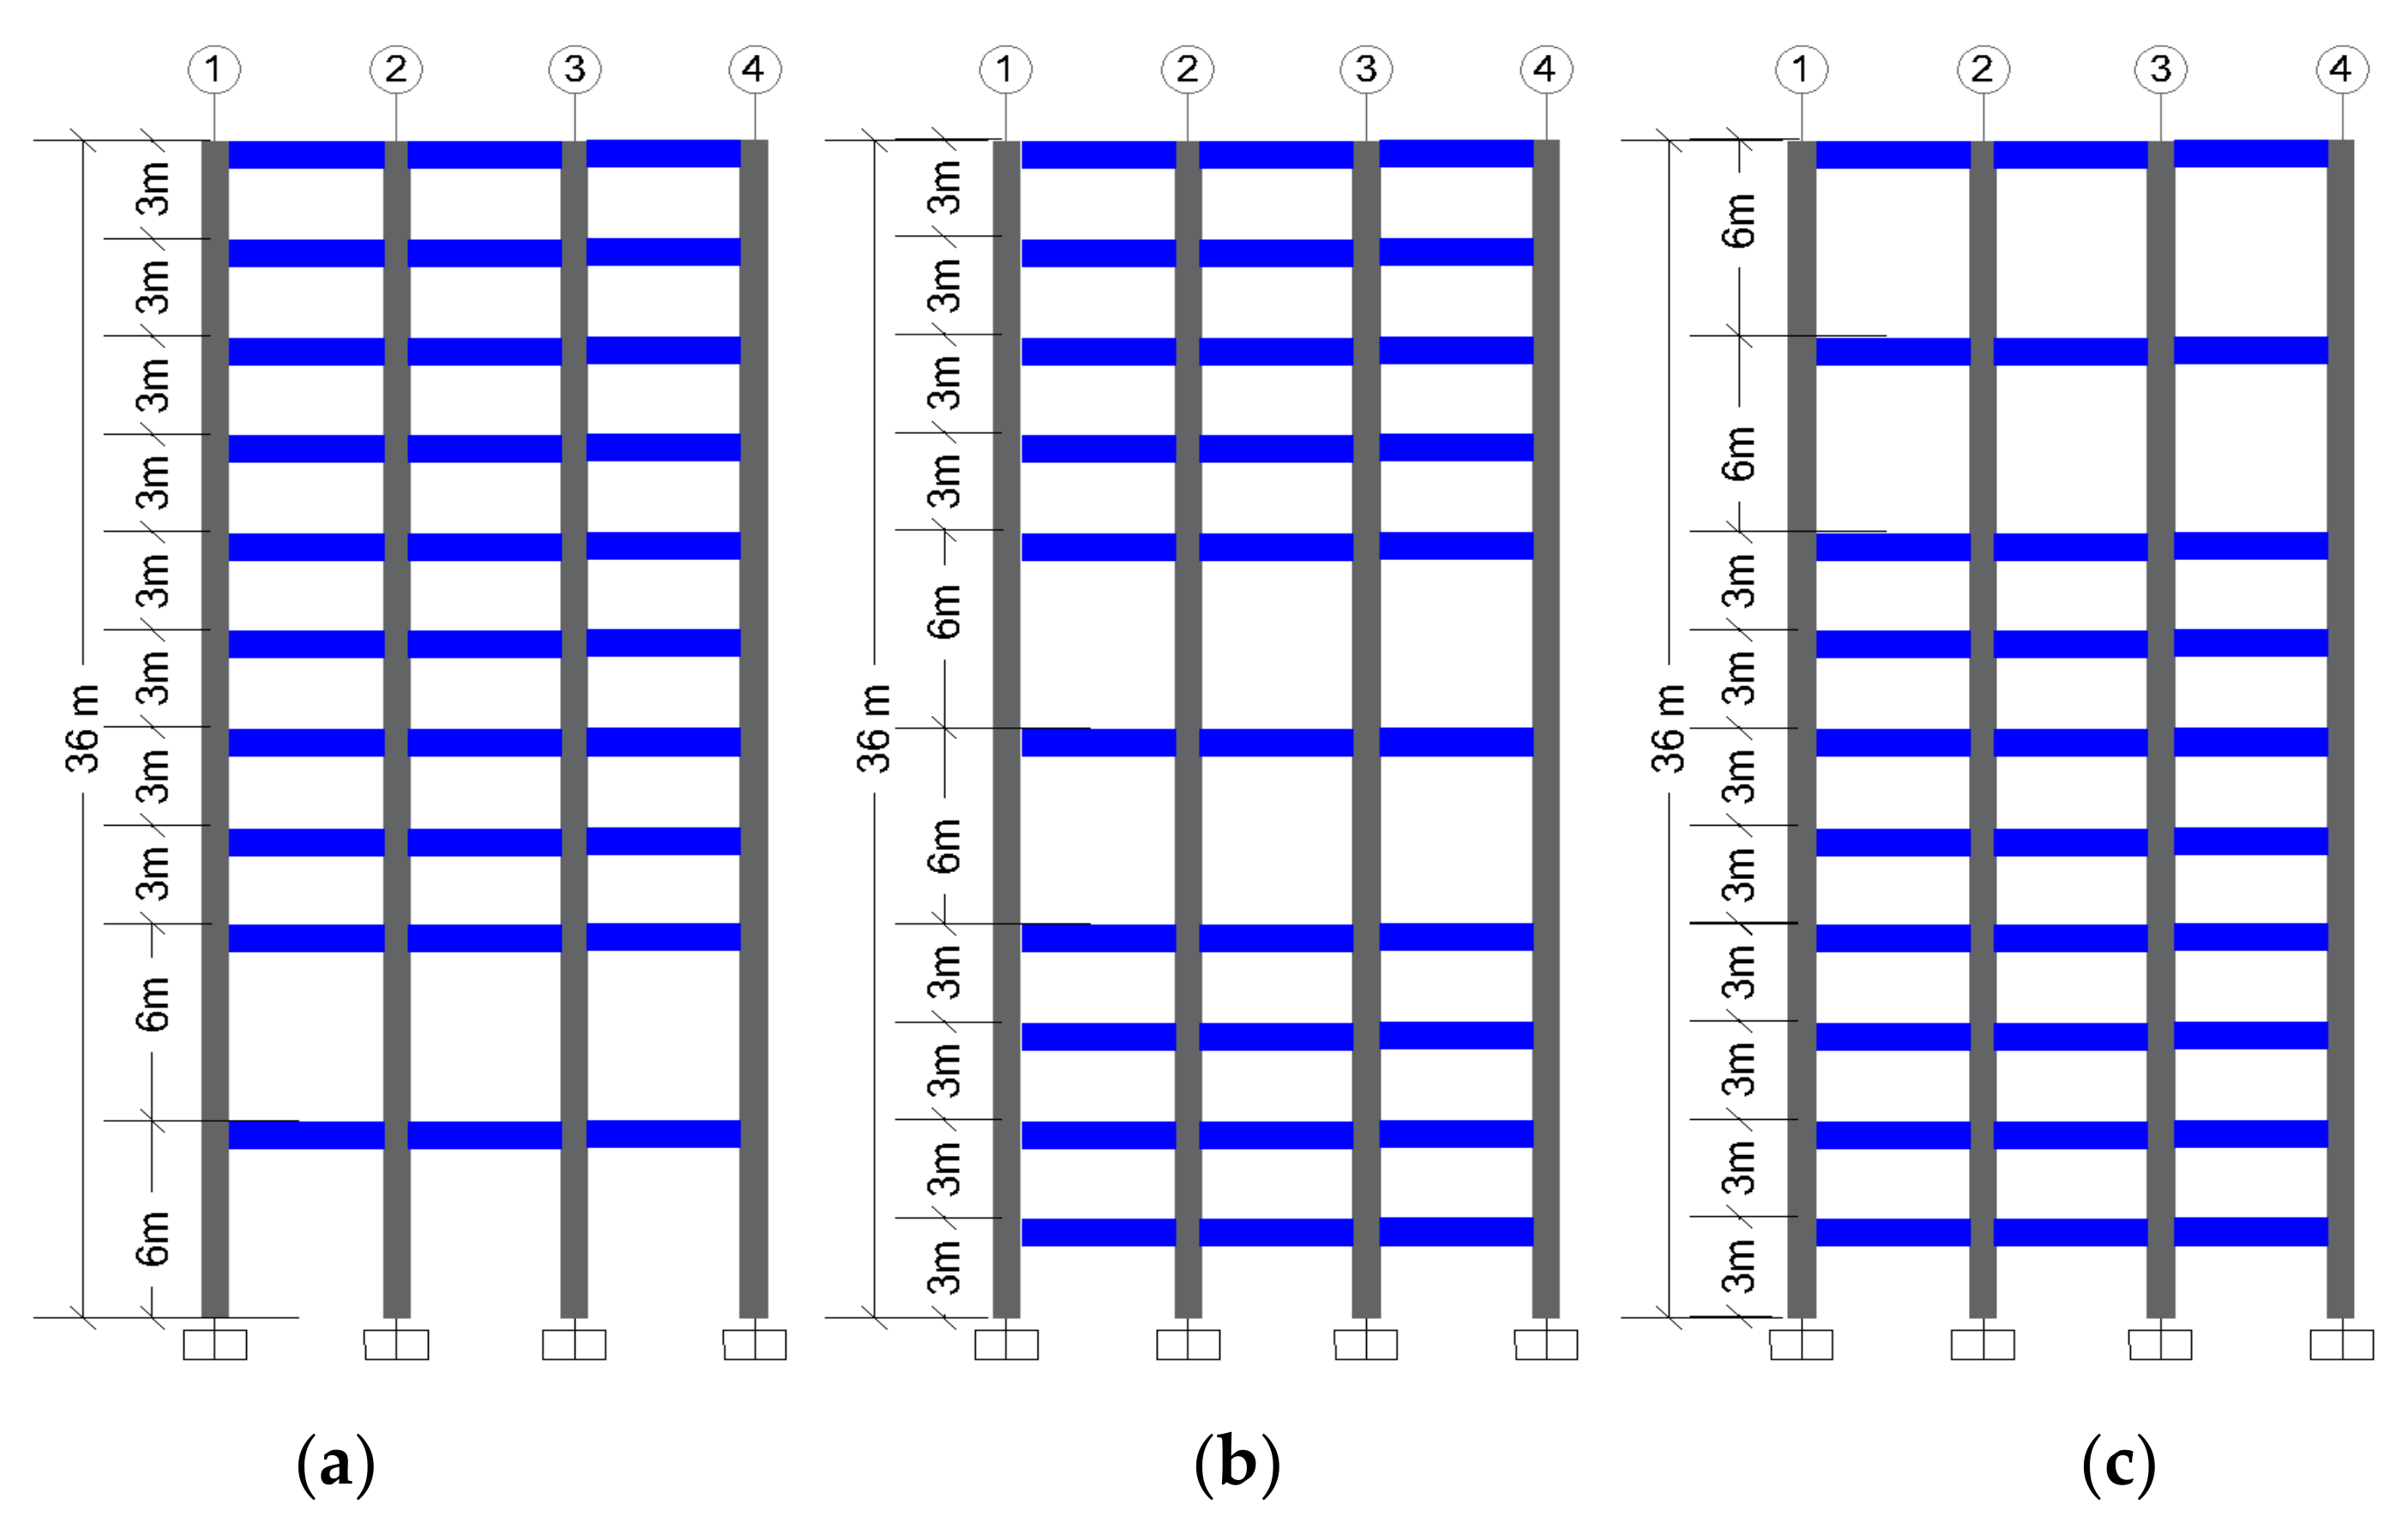
4.3. Models with Setback Irregularity

Three setback irregularity models were considered: (a) bottom setback (BSB) model, (i.e., bottom one-third of the building with setback irregularity); (b) middle setback (MSB) model (i.e., middle one-third of the building with setback irregularity); and (c) top setback (TSB) model, (i.e., top one-third of the building with setback irregularity). Table 2 and Figure 5 illustrate the details of building models with setback irregularity.

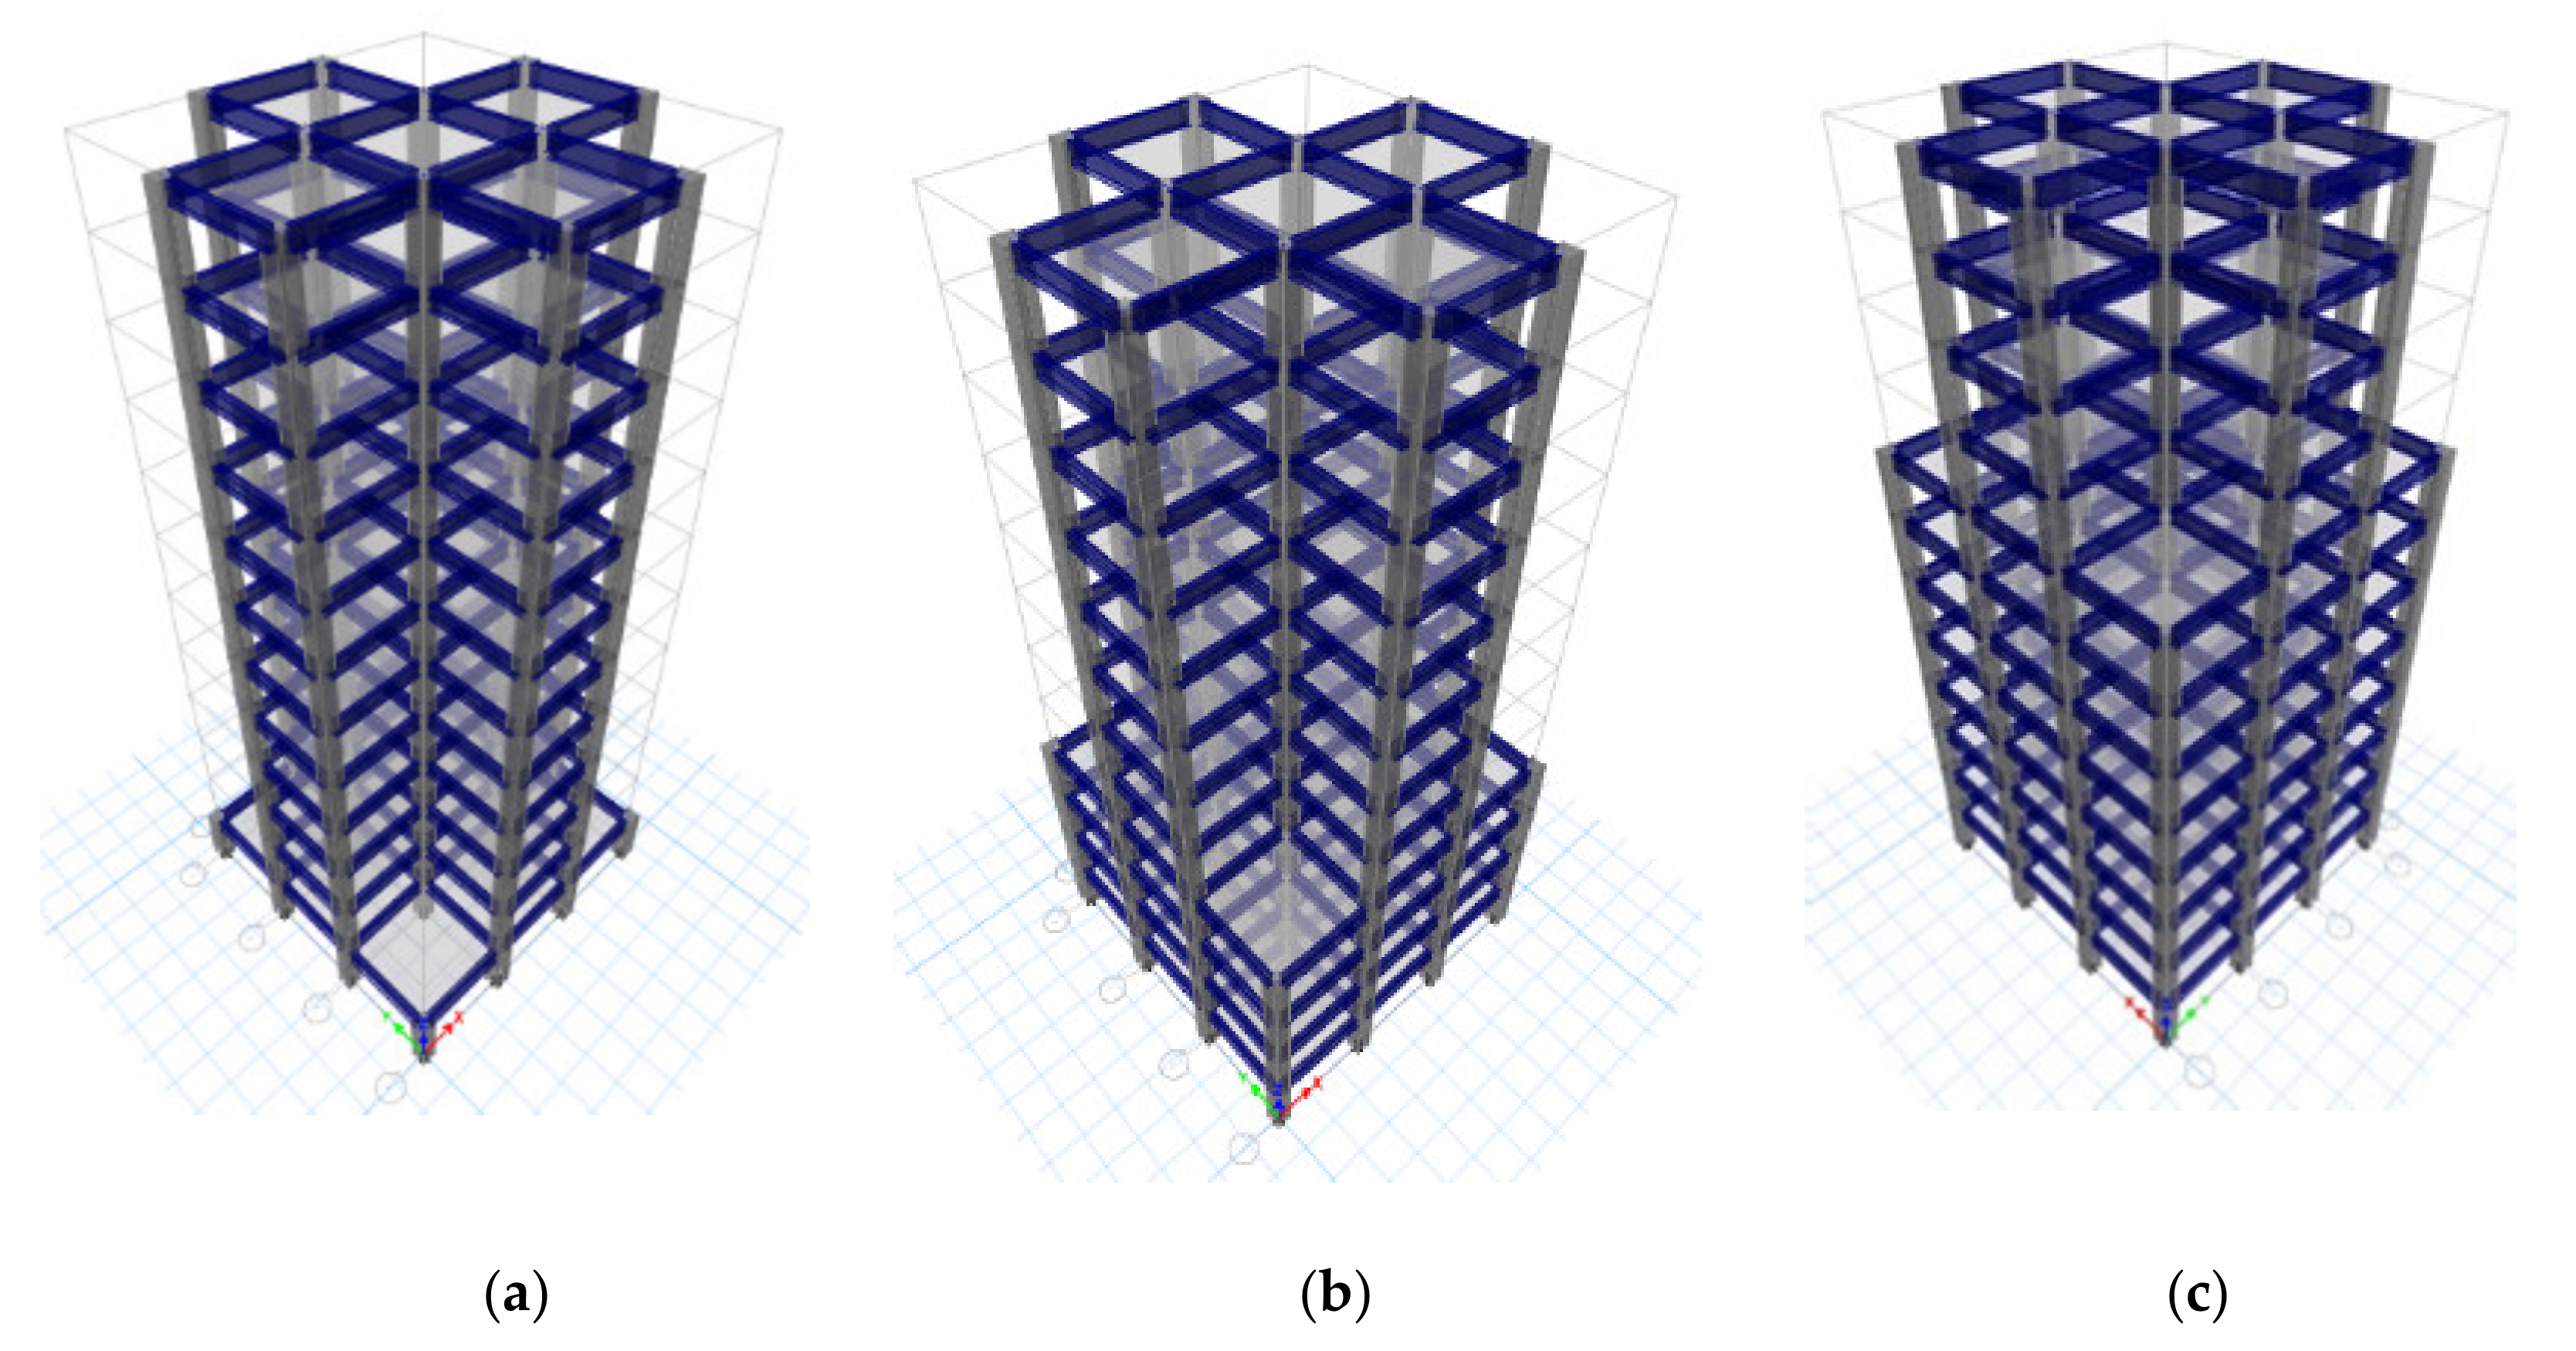
4.4. Models with Combined Irregularities

A transfer slab was considered to investigate the irregularity combination [41,42], where three typical plan views are employed (Figure 6). In the current study, three combined irregularities were investigated in terms of mass, stiffness, and setback. The first irregularity is the BC model, (i.e., the ceiling slab of the first floor is a transfer slab) as shown in Figure 7a. The second irregularity is the MC model, (i.e., the ceiling slab of the fourth story is a transfer slab) as shown in Figure 7b. The third irregularity is the TC model, (i.e., the ceiling slab of the eighth story is a transfer slab) as shown in Figure 7c. The thickness of the transfer slab is 0.6 m, and the height of the floor containing the transfer slab is 3.5 m. Table 2, Figure 6 and Figure 7 describe the details of building models with combined irregularities.

5. Preliminarily Numerical Study and Results

This section explains the effects of the location of mass, stiffness, setback, and combined irregularity on the seismic response of MRF. The seismic analysis procedures for the three analysis methods (i.e., ESL, RS, and TH) were performed as per ECP-201. The models illustrated in Table 2 were simulated using ETABS v.18, and the results were compared with those obtained utilizing the international codes of practice. Here, the seven earthquakes described in Section 2.3 were employed. The computed results were the fundamental time period, base shear, maximum roof displacement, and maximum drifts.

5.1. Fundamental Time Period for Different Structural Irregularity Models

Most international building codes (IS 1893:2002, EC8 2004, UBC 97, NBCC 2005, IBC 2003, ASCE 2002, TEC 2007, ECP-201:2012) [10,11,12,13,14,15,16,17] recommend CALCULATING the fundamental time period using the empirical Equation (3). ECP-201 and TEC also recommend calculating the fundamental time period using Rayleigh’s approach in Equation (4) as follows:
T 1 = C t H x
T ray = 2 π Σ   W i   U i 2 g   Σ   F i   U i
where H is the building height in meters; C t and x are factors that depend on the construction material and the structural system; W i is the design weight of the story i; U i reflects the horizontal displacement of the story i; g is the gravity acceleration; and F i is the horizontal force at story i. ECP-201 [17] stipulates that the time period calculated using Rayleigh’s approach equation (4) or the ETAbS shall not exceed the value of (1.2T1). In ECP-201, the effect of cracking is implemented by multiplying reduction factors to the second moment of area of the cross-sections of the structural elements. These reduction factors are 0.7, 0.5, 0.25, and 0.35 for columns, beams, slabs, and shear walls, respectively.
In the current study, the fundamental time periods for various irregular buildings described in Table 2, were calculated utilizing the empirical Equation (3), Rayleigh’s Approach Equation (4), and ETABS taking into account the presence of cracking. The results are depicted in Figure 8, where the symbols TRay-Ic and TRay-Ig represent the fundamental time period with cracking and without cracking effects, respectively. Similarly, the symbols TETABS-Ic and TETAB-Ig are used to define the fundamental time period with cracking and without cracking effects, respectively.
It can be observed that the empirical equation adopted by most seismic design codes (Equation (3)) does not consider the location of irregularity (i.e., it depends on the building height only). Although the Rayleigh approach adopted by ECP [17] and TEC [16] considers the structural mass and stiffness, the calculated time periods were higher than those obtained using ETABS for all the studied models as shown in Figure 8.
It can also be noted that the location of the irregularity considerably affects the value of the fundamental time period. Moreover, the values of the fundamental time period with cracking effect increased by about 5% more than those without cracking effect in all cases of the different locations of structural irregularity.
Furthermore, the building models with mass irregularity at top stories have higher values of the fundamental period. In contrast, the opposite trend is noticed in stiffness and setback irregularity. The fundamental time period decreased marginally from the BSB model to the TSB model with setback irregularity as a result of the significant reduction of floor area in the entire model (i.e., reduction in mass and stiffness). In the case of the combined irregularity, the building model BC has the most extensive fundamental time period value. The building model MC had the smallest fundamental time period value.

5.2. Base Shear for Different Structural Irregularity Models

For each irregular building described in Table 2, the base shear force (Fb) was calculated utilizing the ESL, RS, and TH methods, considering the presence of cracking. The results are depicted in Figure 9, where the symbols Fb-Ic and Fb-Ig represent the base shear force with cracking effects and without cracking effects, respectively. From Figure 9, the following findings can be drawn:
  • The base shear calculated using the ESL method is not affected by the location of mass, stiffness, or setback irregularity. However, the location of the irregularity has an obvious effect on the base shear forces estimated from the RS and TH methods.
  • The base shear calculated using the ESL method is based only on the building’s weight, while the base shear calculated from the RS method depends on the structure’s weight and stiffness. The base shear calculated using the TH method relies on the fundamental time period, the seismic spectrum, and the rigidity of the building.
  • The base shear force computed using TH is smaller than that calculated using ESL or RS methods. Therefore, the base shear force calculated using either ESL or RS is conservative, and the designed cross-sections are uneconomic.
  • The base shear force is maximum in the building model with mass irregularity at the top stories (TM), while it is minimum for the building model with mass irregularity at its bottom stories (BM).
  • The base shear force of the building with stiffness irregularity at the bottom floors (BS) is greater than the base shear force of the building with stiffness irregularity at the middle or top stories (MS and TS).
  • In the case of setback irregularity, the building model with setback irregularity at the top stories (TSB) has shown maximum values of base shear force when compared to MSB and TSB models.
  • In the building model with combined irregularities on the eighth story (TC), the base shear force is much more than the base shear of the building model with combined irregularities on the first story (BC). This is due to the increase in the building’s mass and decrease in the setbacks on the building’s stories.
  • When taking into account the cracking effect for the cases of structural irregularities, the base shear forces decrease about 1% to 6% more than those computed when neglecting the cracking effect.
Figure 9. Base shear force for different locations of structural irregularity.
Buildings 12 01160 g009

5.3. Maximum Displacements and Maximum Drift for Different Structural Irregularity Models

For the same buildings described in Table 2, the analysis methods (ESL, RS, and TH) were employed to investigate the effect of irregularities on the maximum displacement (Ds) and maximum drift (Dr). The values of Ds and Dr for all studied cases are shown in Figure 10 and Figure 11, respectively. From these figures, the following findings can be drawn:
  • For mass irregularity at the top stories, as in the (TM) model, the maximum displacement and maximum drift were more than those computed for other models. This means that mass irregularity was vital at the top stories.
  • When the stiffness and setback irregularities existed in the bottom stories (BS and BSB) models, the values of displacement and drift were the maximum.
  • The maximum values of displacement and drift were achieved in the building model with combined irregularity in the eighth story (TC) model. The minimum values of displacement and drift were achieved in the building model with combined irregularity in the first story (BC).
  • In all the cases of irregularities, the maximum displacement and maximum drift calculated using the ESL were higher than those computed utilizing the RS and TH methods.
  • For the three-time history records, the maximum displacement and maximum drift computed from the TH were smaller than those calculated utilizing the ESL and RS.
  • When taking into account the cracking effect, the maximum displacements increased by about 75% more than those computed when neglecting the cracking effect. Similarly, the maximum drifts increased by about 85% more than those computed when neglecting the cracking effect.
Figure 10. Maximum roof displacement for different irregularity models.
Buildings 12 01160 g010
Figure 11. Maximum inter-story drift for different irregularity models.
Buildings 12 01160 g011

6. Quantification of Irregularity

From the results of the previous preliminary study in Section 5, it can be clearly mentioned that the location of irregularity has a great effect on the response of the structure (i.e., fundamental time period, base shear, maximum displacement and maximum drift). Therefore, in the following subsections, the authors proposed an irregularity index that depends on the dynamic characteristics (i.e., mass and stiffness), to measure the irregularity in terms of magnitude and location. For different irregular structures, the proposed irregularity index was applied, and the results were compared with those calculated utilizing the developed indices in the existing literature. The authors’ assumptions are (a) the building height ranges between 18 m and 54 m; (b) the bay width is 5 m; (c) a stiff soil is considered; (d) the structural system is ductile MRF; (e) the mass irregularity limit is 200%; (f) the stiffness irregularity limit is 50%; and (g) the setback irregularity limit is 44%.

6.1. Proposed Irregularity Index

The fundamental time period is a dynamic characteristic that can be adopted to quantify vertical irregularities. The time period and natural frequency can be determined by Eigen-value analysis using Equations (5) and (6). The proposed irregularity index can be calculated using Equation (7).
K ω 2 M = 0
T = 2 π / ω
ρ = i = 1 n T i r i i = 1 n T r i
where K is the structure’s stiffness matrix; M is the structure’s mass matrix; T i r i and T r i are the modal time periods for irregular and regular buildings, respectively. The proposed index was tested for irregular MRF structures with different heights (18 m, 27 m, 36 m, 45 m, and 54 m) as shown in Figure 12. Table 3 presents the dimensions of the structural elements. Firstly, the building structural elements were designed considering the static loads using ECP-203 [43]. Secondly, the seismic conditions were checked utilizing ECP-201 to ensure that the structural elements satisfy the design code provisions regarding earthquakes.
Table 4 indicates the location and the magnitude of irregularity for different irregular building models. The magnitude of irregularity is assumed to be as follows: (a) mass increased by about 200% with different irregularity locations (BM, MM, and TM); (b) stiffness decreased about 50% with various irregularity locations (BS, MS, and TS); (c) setback percentage was 44.4% with various irregularity locations (BSB, MSB, and TSB). After calculating the proposed irregularity index for different irregular models mentioned in Table 4, the relationship between the number of stories and the proposed irregularity index is depicted as shown in Figure 13. It can be observed that:
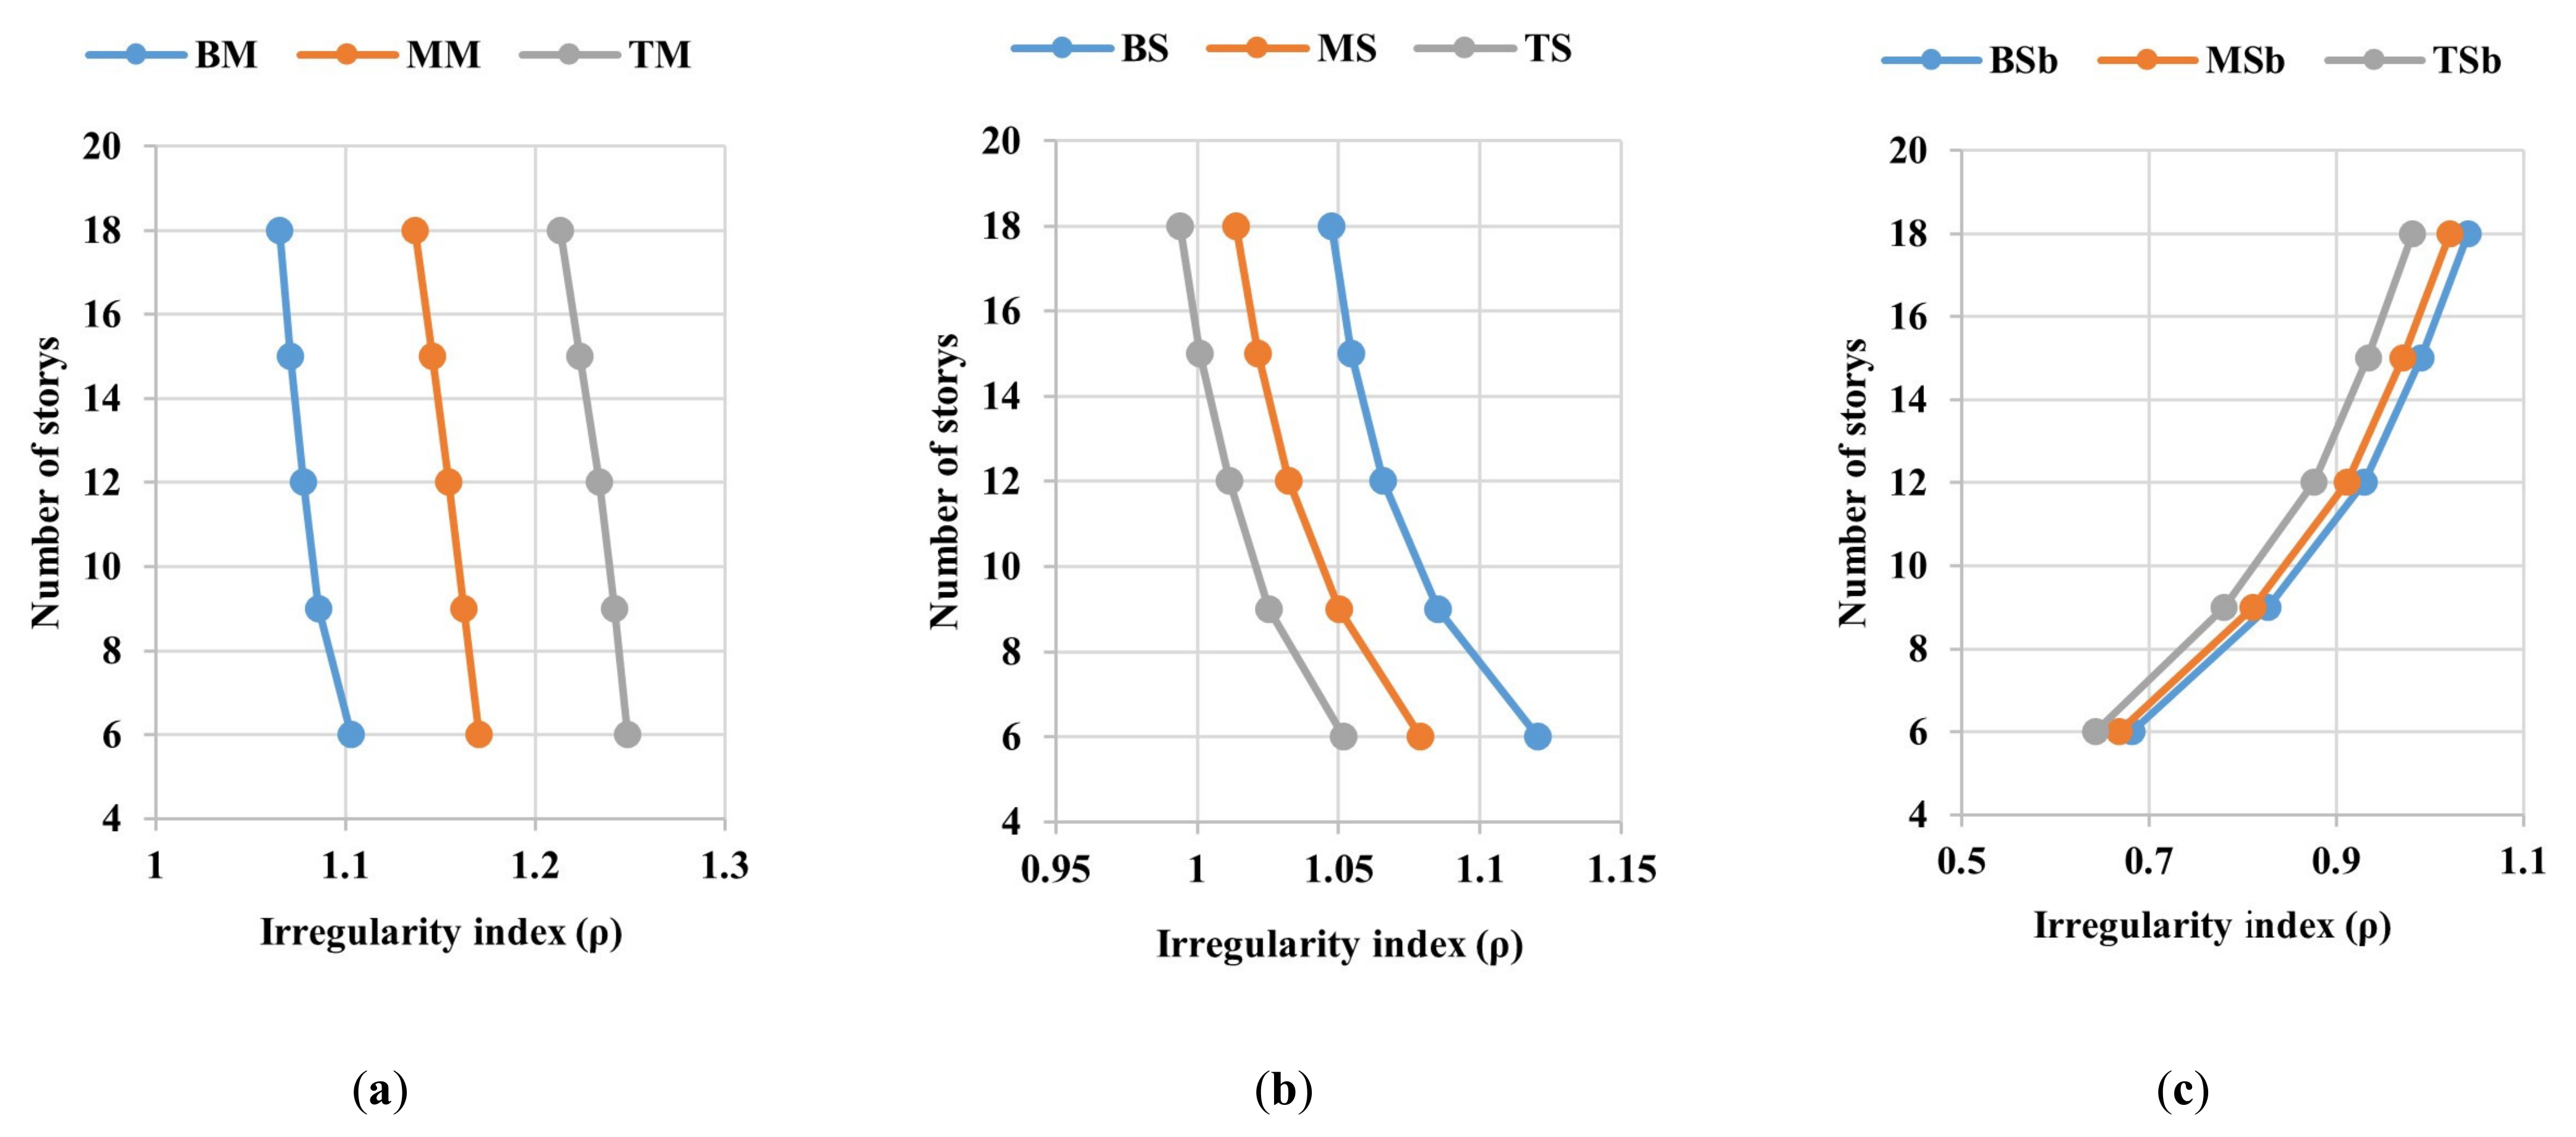
  • In the case of mass irregularity, the proposed irregularity index decreases as the number of stories increases. For models having the same number of stories, the proposed irregularity index was minimum when the mass irregularity persisted in the bottom stories, while it was maximum when the mass irregularity persisted in the top stories.
  • In the case of stiffness irregularity, the proposed irregularity index decreases as the number of stories increases. For models having the same number of stories, the proposed irregularity index was minimum when the stiffness irregularity persisted in the top stories, while it was maximum when the stiffness irregularity persisted in the bottom stories.
  • In the case of setback irregularity, the proposed irregularity index increases as the number of stories increases. For models having the same number of stories, the proposed irregularity index was minimum when the setback irregularity persisted in the top stories, while it was maximum when the setback irregularity persisted in the bottom stories.
Table 3. Dimensions of structural elements.
Properties of Structural Members
6-story buildingstory number1,23,45,6
column (cm)50 × 5040 × 4040 × 40
beam (cm)25 × 7025 × 6025 × 50
slab (cm)151515
9-story buildingstory number1–34–67–9
column (cm)60 × 6050 × 5040 × 40
beam (cm)25 × 7025 × 6025 × 50
slab (cm)151515
12-story buildingstory number1–45–89–12
column (cm)70 × 7060 × 6050 × 50
beam (cm)25 × 7025 × 6025 × 50
slab (cm)151515
15-story buildingstory number1–56–1011–15
column (cm)80 × 8070 × 7060 × 60
beam (cm)25 × 7025 × 6025 × 50
slab (cm)151515
18-story buildingstory number1–67–1213–18
column (cm)90 × 9080 × 8070 × 70
beam (cm)25 × 7025 × 6025 × 50
slab (cm)151515
Table 4. Description of different irregularity models.
ModelsLocation
of
Irregularity
Mass
Irregularity
Models
Magnitude
of
Irregularity
Stiffness
Irregularity
Models
Magnitude
of
Irregularity
Setback
Irregularity
Models
Magnitude
of
Irregularity
6-story 1,2BM200%BS50%BSB44%
3,4MMMSMSB
5,6TMTSTSB
9-story 1–3BMBSBSB
4–6MMMSMSB
7–9TMTSTSB
12-story 1–4BMBSBSB
5–8MMMSMSB
9–12TMTSTSB
15-story 1–5BMBSBSB
6–10MMMSMSB
11–15TMTSTSB
18-story1–6BMBSBSB
7–12MMMSMSB
13–18TMTSTSB
Figure 12. Building models with different heights.
Buildings 12 01160 g012
Figure 13. Relationship between the number of stories and the proposed irregularity index: (a) mass irregularity; (b) stiffness irregularity; (c) setback irregularity.
Buildings 12 01160 g013

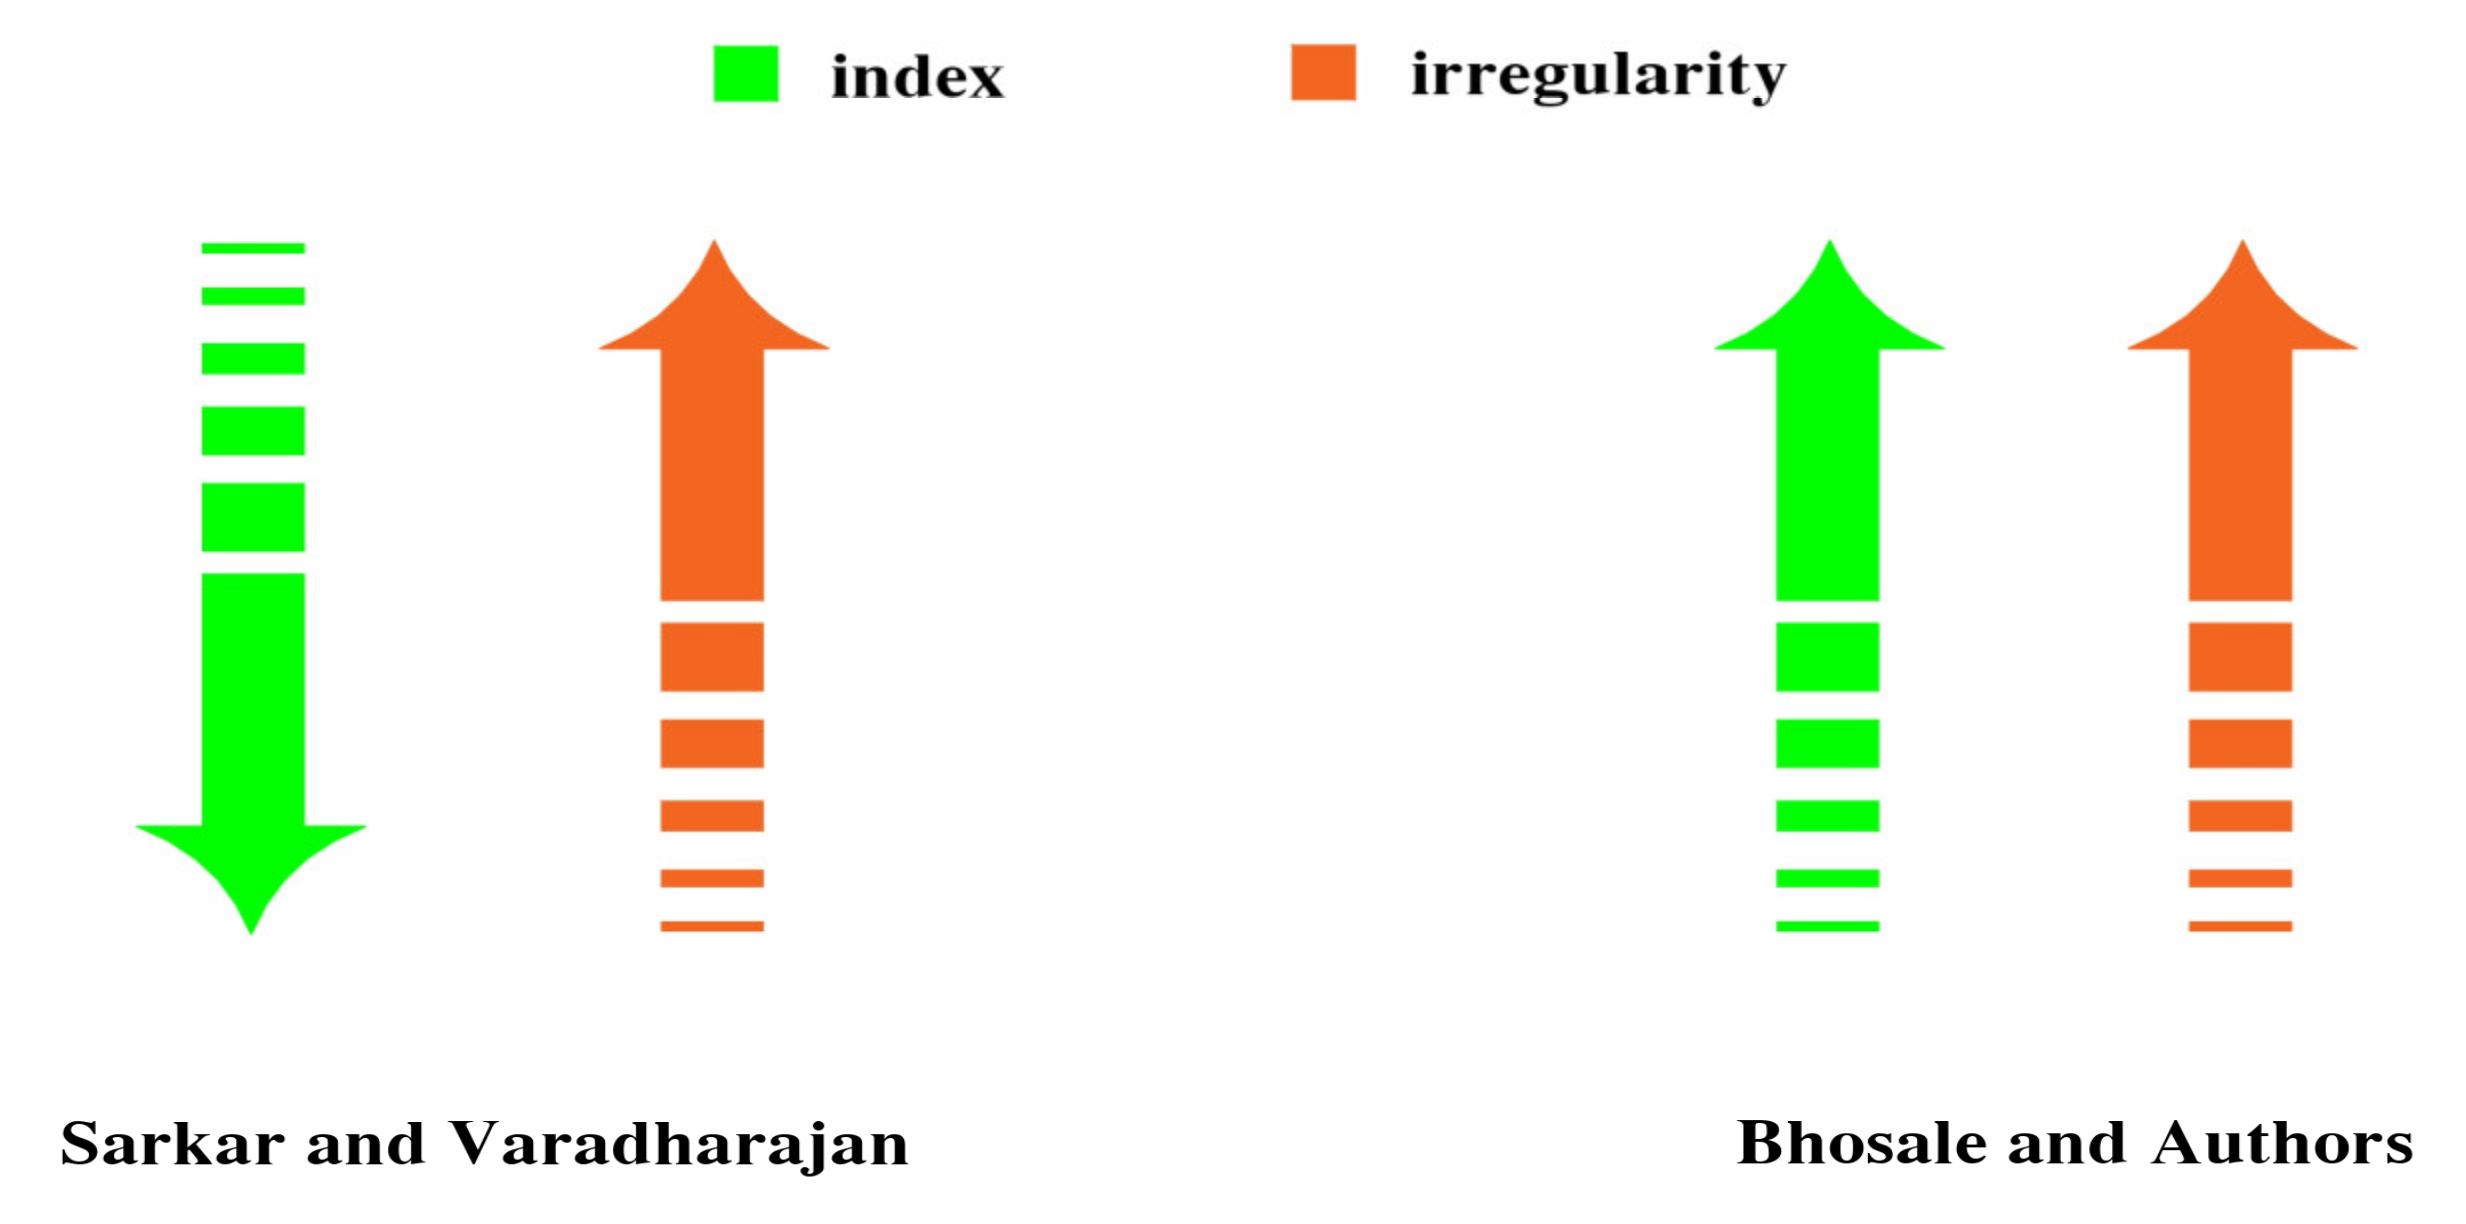
6.2. Comparison of Proposed Index and Previous Indices

To demonstrate the proposed irregularity index ρ validity, it is worth comparing the results of the proposed index with those calculated utilizing the indices proposed by Sarkar et al. [20], Varadharajan et al. [21], and Bhosale et al. [22]. The models described in Table 4 were utilized in this comparison. The indices proposed by Kara Vasilis et al. [18] and Roy and Mahato [19] were not considered because they are based on geometric properties only.
The graphical representation of the irregularity index concept for each author is given in Figure 14. In the indices proposed by Sarkar et al. [20] and Varadharajan et al. [21], the lower index means higher building irregularity. On the contrary, the lower index means lower building irregularity for the indices proposed by Bhosale et al. [22] and the authors.
The results of the comparison are given in Table 5. Bearing in mind the aforementioned concept, the findings can be summarized as follows:
  • In the case of mass irregularity models (BM, MM, TM), the index proposed by Sarkar et al. [20] was not able to well quantify the mass irregularity because the index for the MM model was greater than that of the TM model, and this contradicts the conventional understanding. In the meantime, the indices proposed by Varadharajan et al. [21], Bhosale et al. [22], and the authors effectively quantified the degree of mass irregularity.
  • In the case of stiffness irregularity models (BS, MS, TS), the indices proposed by Sarkar et al. [20] and Bhosale et al. [22] were not able to well evaluate the stiffness irregularity because the degree of irregularity for the MS model was less than that of the BS model. On the contrary, the indices proposed by Varadharajan et al. [21] and the authors well quantified the stiffness irregularity since the degree of irregularity of the BS model was greater than those of the MS and TS models.
  • In the case of setback irregularity models (BSB, MSB, TSB), the indices proposed by Varadharajan et al. [21] and Bhosale et al. [22] were not able to quantify the setback irregularity, because the degree of setback irregularity of the BSB was lower than that of TSB. The indices proposed by Sarkar et al. [20] and the authors well quantified the setback irregularity well since the degree of irregularity of BSB models was higher than that of MSB and TSB models.
Table 5. Comparison of the previous indices and proposed index for studied models.
Irregularity Indices
CaseModelsSarkar et al. [20]Varadharajan et al. [21] Bhosale et al. [22]Proposed Index
Mass
Irregularity
BM1.120.901.271.07
MM1.180.891.401.14
TM1.150.881.461.22
Stiffness
Irregularity
BS1.010.951.041.05
MS0.950.960.911.02
TS0.980.970.951.01
Setback
Irregularity
BSB0.791.060.620.95
MSB0.831.030.690.92
TSB0.931.020.850.91
It can be concluded that the proposed index ρ can quantify all aspects of the irregularities and may be favored above existing techniques for successfully capturing irregularities.

7. Conclusions and Scope for Future Works

In the current study, RC building models with various types, magnitudes, locations of mass, stiffness, setback, and combined irregularities were analyzed. Firstly, several analysis approaches were used to evaluate irregular building models. Secondly, a factor named irregularity index was recommended to quantify the magnitude and location of different irregularities, depending on the building’s dynamic characteristics. The main conclusions are outlined as follows:
  • The location of the irregularity has a considerable influence on the structural seismic response. Therefore, to accurately quantify the irregularity, both the magnitude and location of the irregularity must be included.
  • The comparison between the proposed index and the indices of the previous studies demonstrated the ability of the proposed index to quantify all types of irregularities considered in the current study.
The current study clarified the effect of different types of vertical irregularities on the structural seismic response. The effects of horizontal irregularities could be included in future work. The proposed index is limited to moment-resisting frame (MRF) buildings. Thus, the proposed index could be adjusted to include the effects of the dual systems (i.e., MRF and shear walls). Simple equations could be suggested to estimate the seismic response demands such as maximum displacement and maximum drift for irregular buildings in terms of the proposed index based on the regression analysis.

Author Contributions

Conceptualization, S.E.-D.F.T., S.Y.M. and O.N.; methodology, S.E.-D.F.T., S.Y.M. and O.N.; validation, O.N.; formal analysis, O.N.; writing—original draft preparation, S.Y.M. and O.N.; writing—review and editing, S.Y.M. and O.N.; visualization, O.N.; supervision, S.E.-D.F.T. and S.Y.M.; project administration, S.Y.M. All authors have read and agreed to the published version of the manuscript.

Funding

This research received no external funding.

Institutional Review Board Statement

Not applicable.

Informed Consent Statement

Not applicable.

Data Availability Statement

The FE data used to support the research results are available on request.

Acknowledgments

The authors would like to acknowledge the encouragement and support of Eng. Mohammed Rady Ewis Deif.

Conflicts of Interest

The authors declare no conflict of interest.

References

  1. Brunesi, E.; Peloso, S.; Pinho, R.; Nascimbene, R. Cyclic testing and analysis of a full-scale cast-in-place reinforced concrete wall-slab-wall structure. Bull. Earthq. Eng. 2018, 16, 4761–4796. [Google Scholar] [CrossRef]
  2. Blasi, G.; Perrone, D.; Aiello, M.A.; Pecce, M.R. Seismic performance assessment of piping systems in bare and infilled RC buildings. Soil Dyn. Earthq. Eng. 2021, 149, 106897. [Google Scholar] [CrossRef]
  3. Dogangn, A. Performance of reinforced concrete buildings during the May 1, 2003 Bingöl Earthquake in Turkey. Eng. Struct. 2004, 26, 841–856. [Google Scholar] [CrossRef]
  4. Kirac, N.; Dogan, M.; Ozbasaran, H. Failure of weak-storey during earthquakes. Eng. Fail. Anal. 2011, 18, 572–581. [Google Scholar] [CrossRef]
  5. Fraser, S.; Raby, A.; Pomonis, A.; Goda, K.; Chian, S.C.; Macabuag, J.; Offord, M.; Saito, K.; Sammonds, P. Tsunami damage to coastal defences and buildings in the March 11th 2011 Mw9.0 Great East Japan earthquake and tsunami. Bull. Earthq. Eng. 2013, 11, 205–239. [Google Scholar] [CrossRef]
  6. Westenenk, B.; de la Llera, J.C.; Jünemann, R.; Hube, M.A.; Besa, J.J.; Lüders, C.; Inaudi, J.A.; Riddell, R.; Jordán, R. Analysis and interpretation of the seismic response of RC buildings in Concepción during the February 27, 2010, Chile earthquake. Bull. Earthq. Eng. 2013, 11, 69–91. [Google Scholar] [CrossRef]
  7. Asıkoğlu, A.; Vasconcelos, G.; Lourenço, P. Overview on the nonlinear static procedures and performance-based approach on modern unreinforced masonry buildings with structural irregularity. Buildings 2021, 11, 147. [Google Scholar] [CrossRef]
  8. Ruggieri, S.; Uva, G. Accounting for the spatial variability of seismic motion in the pushover analysis of regular and irregular rc buildings in the new italian building code. Buildings 2020, 10, 177. [Google Scholar] [CrossRef]
  9. Ruggieri, S.; Fiore, A.; Uva, G. A New Approach to Predict the Fundamental Period of Vibration for Newly- designed Reinforced Concrete Buildings. J. Earthq. Eng. 2021. [Google Scholar] [CrossRef]
  10. IS1893-2002; Bureau of Indian Standards–Indian Standard Criteria for Earthquake Resistant Design of Structures Part 1: General Provisions and Buildings. Bureau of Indian Standards: New Delhi, India, 2002.
  11. EC8. Eurocode 8: Design of Structures for Earthquake Resistance—Part 1: General Rules, Seismic Actions and Rules for Buildings; The European Union Per Regulation 305/2011, Directive 98/34/EC, Directive 2004/18/EC; European Committee for Standardization (CEN): Brussels, Belgium, 2011; Volume 1, p. 2005. [Google Scholar]
  12. UBC. 1997 Uniform Building Code; International Conference Building Officials: Whittier, CA, USA, 1997; Volume 2. [Google Scholar]
  13. NBBC. National Building Code of Canada 2005; National Research Council of Canada: Ottawa, ON, Canada, 2006; Volume 1. [Google Scholar]
  14. IBC. 2003 International Building Code® First Printing: December 2002 ISBN # 1-892395-56-8 (Soft); International Code Council (ICC): Washington, DC, USA, 2003. [Google Scholar]
  15. ASCE. American Society of Civil Elilgineers SEI/ASCE 7-02 Second Edition Minimum Design Loads for Buildings and Other Structures, 2nd ed.; American Society of Civil Engineers: Reston, VA, USA, 2013; Volume 552. [Google Scholar]
  16. TEC. Turkish Earthquake Code; Ministry of Interior, Disaster and Emergency Management Authority: Ankara, Turkey, 2007. [Google Scholar]
  17. ECP-Egyptian Code of Practice—201. Egyptian Code of Practice No-201 for Design Loads for Construction Works; Research Center for Housing and Construction, Ministry of Housing, Utilities and Urban Planning: Cairo, Egypt, 2012. [Google Scholar]
  18. Karavasilis, T.L.; Bazeos, N.; Beskos, D.E. Seismic response of plane steel MRF with setbacks: Estimation of inelastic deformation demands. J. Construct. Steel Res. 2008, 64, 644–654. [Google Scholar] [CrossRef]
  19. Roy, R.; Mahato, S. Equivalent lateral force method for buildings with setback: Adequacy in elastic range. Earthq. Struct 2013, 4, 685–710. [Google Scholar] [CrossRef]
  20. Sarkar, P.; Prasad, M.; Menon, D. Vertical geometric irregularity in stepped building frames. Eng. Struct. 2010, 32, 2175–2182. [Google Scholar] [CrossRef]
  21. Varadharajan, S.; Sehgal, V.; Saini, B. Determination of inelastic seismic demands of RC moment resisting setback frames. Arch. Civ. Mech. Eng. 2013, 13, 370–393. [Google Scholar] [CrossRef]
  22. Bhosale, A.; Davis, R.; Sarkar, P. Vertical Irregularity of Buildings : Regularity Index versus Seismic Risk. ASCE-ASME J. Risk Uncertain. Eng. Syst. Part A Civ. Eng. 2017, 3, 04017001. [Google Scholar] [CrossRef]
  23. Rathnasiri, H.; Jayasinghe, J.; Bandara, C. Development of Irregularity Index Based on Dynamic Characteristics to Quantify the Vertical Geometric Irregularities. Engineer 2020, 53, 41. [Google Scholar] [CrossRef]
  24. Naveen, S.; Abraham, N.; Kumari, A. Analysis of irregular structures under earthquake loads. Procedia Struct. Integr. 2019, 14, 806–819. [Google Scholar] [CrossRef]
  25. Sadashiva, V.K.; Macrae, G.A.; Deam, B.L.; Fenwick, R. Determination of Acceptable Structural Irregularity Limits for the Use of Simplified Seismic Design Methods. In Proceedings of the New Zealand Society of Earthquake Engineering (NZSEE) Conference, Wairakei, New Zealand, 11–13 April 2008. [Google Scholar]
  26. Varadharajan, S.; Sehgal, V.K.; Saini, B. Review of different structural irregularities in buildings. J. Struct. Eng. 2012, 39, 393–418. [Google Scholar]
  27. Abdel-Raheem, K.; Abdel Raheem, S.; Soghair, H.; Ahmed, M. Evaluation of Seismic Performance of Multistory Buildings Designed According To Egyptian Code. JES J. Eng. Sci. 2010, 38, 381–402. [Google Scholar] [CrossRef]
  28. Kunnath, S.; Kalkan, E. Evaluation of Seismic Deformation Demands Using Non-Linear Procedures in Multistory Steel and Concrete Moment Frames. ISET J. Earthq. Technol. 2004, 41, 159–181. [Google Scholar]
  29. Thuat, D. Van Strength reduction factor demands for building structures under different seismic levels. Struct. Des. Tall Spec. Build. 2012, 24, 421–439. [Google Scholar] [CrossRef]
  30. Boore, D. Simulation of ground motion using the stochastic method. Pure Appl. Geophys. 2003, 160, 635–676. [Google Scholar] [CrossRef] [Green Version]
  31. Sobrado, V.; Yaranga, R.; Orihuela, J. Analysis of seismic bidirectionality on response of reinforced concrete structures with irregularities of l-shaped plan and soft story. IOP Conf. Ser. Mater. Sci. Eng. 2020, 910, 012001. [Google Scholar] [CrossRef]
  32. Najafi, L.; Tehranizadeh, M. Ground motion selection and scaling in practice. Period. Polytech. Civ. Eng. 2015, 59, 233–248. [Google Scholar] [CrossRef] [Green Version]
  33. Vera, C.; Mcverry, G.; Ingham, J. Ground motion records for time-history analysis of URM buildings in New Zealand—The North Island. In Proceedings of the NZSEE Annual Technical Conference, Wairakei, New Zealand, 11–13 April 2008; pp. 1–8. [Google Scholar]
  34. Dhakal, R.; Singh, S.; Mander, J. Effectiveness of earthquake selection and scaling method in New Zealand. Bull. N. Z. Soc. Earthq. Eng. 2007, 40, 160–171. [Google Scholar] [CrossRef] [Green Version]
  35. Iervolino, I.; Cornell, C. Record selection for nonlinear seismic analysis of structures. Earthq. Spectra 2005, 21, 685–713. [Google Scholar] [CrossRef] [Green Version]
  36. Bommer, J.; Acevedo, A. The use of real earthquake accelerograms as input to dynamic analysis. J. Earthq. Eng. 2004, 8, 43–91. [Google Scholar] [CrossRef]
  37. Baker, J.; Cornell, C. Spectral shape, epsilon and record selection. Earthq. Eng. Struct. Dyn. 2006, 35, 1077–1095. [Google Scholar] [CrossRef]
  38. UC Berkeley, Pacific Earthquake Engineering Research Center. PEER Strong Ground Motion Databases. Available online: https://peer.berkeley.edu/peer-strong-ground-motion-databases (accessed on 25 June 2021).
  39. Computers and Structures Inc. ETABS: Integrated Software for Structural Analysis and Design; Computers and Structures Inc.: Berkeley, CA, USA, 2018; Available online: https://www.csiamerica.com/products/etabs (accessed on 20 June 2019).
  40. Abdel Raheem, S.; Abdel Zaher, A.; Taha, A. Finite element modeling assumptions impact on seismic response demands of MRF-buildings. Earthq. Eng. Eng. Vib. 2018, 17, 821–834. [Google Scholar] [CrossRef]
  41. Osman, A.; Abdel Azim, M. Analysis and Behavior of High-rise Buildings with Transfer Plate System. In Proceedings of the 13th Arab Structural Engineering Conference, Blida, Algeria, 12–15 December 2015. [Google Scholar]
  42. Abdelbasset, Y.; Sayed-Ahmed, E.; Mourad, S. High-rise buildings with transfer floors: Drift calculations. In Proceedings of the 37th IABSE Symposium Report. International Association for Bridge and Structural Engineering, Madrid, Spain, 3–5 September 2014; pp. 637–644. [Google Scholar] [CrossRef]
  43. ECP-Egyptian Code of Practice—203. Egyptian Code of Practice No-203 for Design and Construction of Concrete Structures; Research Center for Housing and Construction, Ministry of Housing, Utilities and Urban Planning: Cairo, Egypt, 2018. [Google Scholar]
Figure 1. Elastic-design response spectrum.
Buildings 12 01160 g001
Figure 2. Flowchart of the modeling procedures using ETABS.
Buildings 12 01160 g002
Figure 3. Building models with mass irregularity: (a) bottom mass (BM); (b) middle mass (MM); (c) top mass (TM).
Buildings 12 01160 g003
Figure 4. Building models with stiffness irregularity: (a) bottom stiffness (BS); (b) middle stiffness (MS); (c) top stiffness (TS).
Buildings 12 01160 g004
Figure 5. 3D-models with setback irregularity: (a) Top Setback (TSB); (b) Middle Setback (MSB); (c) Bottom Setback (BSB).
Buildings 12 01160 g005
Figure 6. Plan views of the combined irregularity models: (a) regular slab; (b) transfer slab; (c) slab with setback.
Buildings 12 01160 g006
Figure 7. Combined irregularity models (a) slab at the first story (BC); (b) slab at the fourth story (MC); (c) slab at the eighth story (TC).
Buildings 12 01160 g007
Figure 8. Determination of fundamental time period using three methods adopted in ECP-201.
Buildings 12 01160 g008
Figure 14. The relation between the index and irregularity of the building.
Buildings 12 01160 g014
Table 1. Characteristics of time history acceleration records used in the analysis. (PGA: peak ground acceleration; PGV: peak. ground velocity; PGD: peak ground displacement).
LevelPGA(g)Earthquake NameYearStation NameInput WaveEarthquake MagnitudeScale FactorPGV
(cm/s)
PGD
(cm)
Low0.0125Gulf of Aqaba1995HaderaHAD-NS7.2062.10.65
0.0805Gulf of Aqaba1995EilatEIL-NS7.201.310.64.39
Moderate0.2107El Centro 1940Imperial ValleyELC-NS6.950.4630.223.91
0.3332N. Palm Springs1986Morongo Valley Fire StationMVH0456.060.52048.78901.5499
0.4061Morgan Hill1984Gilroy Array #6G060006.190.99914.17501.6034
High0.7388Cape Mendocino1992Cape MendocinoCPM0007.010.18358.074057.8340
0.9582Northridge-011994Rinaldi RRS2286.690.13942.18803.7191
Table 2. Description of irregularities and cross-sectional dimensions for the investigated models.
SymbolModelLocation of
Irregularity
Magnitude of
Irregularity
Story
Numbers
Column Size (cm)Beam Size (cm)Slab Thickness (cm)
BMBottom mass irregularity1–4200%1–470 × 97025 × 7015
5–860 × 6025 × 60
9–1250 × 5025 × 50
MMMiddle mass irregularity5–81–470 × 7025 × 70
5–860 × 6025 × 60
9–1250 × 5025 × 50
TMTop mass
irregularity
9–121–470 × 7025 × 70
5–860 × 6025 × 60
9–1250 × 5025 × 50
BSBottom
stiffness
irregularity
1–450%1–470 × 7025 × 7015
5–860 × 6025 × 60
9–1250 × 5025 × 50
MSMiddle
stiffness
irregularity
5–81–470 × 7025 × 70
5–860 × 6025 × 60
9–1250 × 5025 × 50
TSTop
stiffness
irregularity
9–121–470 × 7025 × 70
5–860 × 6025 × 60
9–1250 × 5025 × 50
BSBBottom
setback
irregularity
2–1244.4%150 × 5025 × 7015
2–1240 × 4025 × 50
MSBMiddle
setback
irregularity
5–121–450 × 5025 × 70
5–1240 × 4025 × 50
TSBTop
setback
irregularity
9–121–470 × 7025 × 70
5–860 × 6025 × 60
9–1250 × 5025 × 50
BCBottom
combined
irregularity
1mass (400%)
stiffness (47%)
setback (44.4%)
170 × 70-60
2-470 × 7025 × 7015
5–860 × 6025 × 6015
9–1250 × 5025 × 5015
MCMiddle
combined
irregularity
41–370 × 7025 × 7015
470 × 70-60
5–860 × 6025 × 6015
9–1250 × 5025 × 5015
TCTop
combined
irregularity
81–770 × 7025 × 7015
870 × 70-60
9–1260 × 6025 × 5015
Publisher’s Note: MDPI stays neutral with regard to jurisdictional claims in published maps and institutional affiliations.

